Article

Preparation and Properties of Al-SiC Composite Coatings from AlCl3-LiAlH4-Benzene-THF System

1
School of Mechanical Engineering, Shenyang University, Shenyang 110044, China
2
Key Laboratory of Research and Application of Multiple Hard Films of Liaoning Province, Shenyang University, Shenyang 110044, China
*
Author to whom correspondence should be addressed.
Coatings 2025, 15(10), 1159; https://doi.org/10.3390/coatings15101159
Submission received: 4 September 2025 / Revised: 26 September 2025 / Accepted: 30 September 2025 / Published: 4 October 2025
(This article belongs to the Section Ceramic Coatings and Engineering Technology)

Abstract

Al-SiC composite coatings were successfully fabricated through the process of electrodeposition utilizing an AlCl3-LiAlH4-benzene-THF system. This method allows for the incorporation of silicon carbide (SiC) particles into the aluminum matrix, enhancing the coating’s properties. The study examined various factors that influence the coating characteristics, including current density, temperature, and the quantity of SiC particles added to the formula. The findings revealed that these parameters significantly affect the resulting surface morphology, corrosion resistance, and hardness of the Al-SiC composite coatings. Specifically, the analysis demonstrated that the Al-SiC composite coating produced optimal surface morphology, which is crucial for its performance and durability in various applications. when the current density is 50 mA/cm2, the bath temperature is at 30 °C, and the addition amount of SiC particles is optimized to 40 g/L. Combined with electrochemical experimental data, the corrosion resistance of the composite coating prepared under this condition was significantly improved. The results of scanning electron microscopy showed that the surface of the composite coating prepared under this process parameter was uniform and dense, without obvious holes and cracks, and the SiC particles were uniformly distributed in the coating with high density. Through the hardness test of composite coatings with different SiC particle contents, it was found that in the research interval, when the SiC particle content was less than 3 wt%, the hardness of the coating changed relatively slowly. As the amount of SiC particles surpassed 4 wt%, there was a notable increase in hardness. At a SiC concentration of 5%, the coating exhibited a hardness level of 152.1 HV.

1. Introduction

Aluminum-based composite coatings have irreplaceable application value in high-end fields such as aerospace, lightweight automobile and electronic packaging due to their light weight, excellent thermal conductivity and corrosion resistance. However, the low hardness of pure aluminum coating makes it prone to abrasive wear under high load friction conditions, such as the early failure of automobile moving parts (bearings, gears), which seriously restricts the engineering application [1,2,3,4,5]. To this end, researchers have prepared a variety of Al-based composites by introducing reinforcing phases to break through performance bottlenecks [6,7,8,9,10].
Currently, the techniques for preparing aluminum matrix composites predominantly involve methods such as severe plastic deformation, casting, mechanical alloying, and surface deposition [11,12,13,14,15,16]. Surface preparation of aluminum-based alloy materials primarily utilizes magnetron sputtering and spray forming techniques [17,18]. Zheng et al. [19] employed Nd-YAG pulsed laser technology to apply a coating of Al+SiC powder onto the AZ91D magnesium alloy surface. The resulting composite coating consisted of SiC and the β-Mg17Al12 phase. The combination of laser cladding with a magnesium alloy matrix exhibits excellent adhesion properties. Furthermore, the hardness of the cladding coating surpasses that of the substrate and rises as the SiC content within the cladding increases. The wear resistance of the AZ91D magnesium alloy was significantly enhanced by the composite coating containing in situ synthesized Mg17Al12 phase and SiC particles, as demonstrated by the sliding wear test. In the process of cold spraying, Chunjie Huang et al. [20] kept the feeding rate of Al powder constant, and used two powder feeding lines to gradually increase the feeding rate of SiC powder, so as to realize the direct preparation of gradient composites. Studies have shown that the use of two powder feed lines in cold spraying can serve as a viable additive manufacturing technique for depositing Al-SiCP composites. In the field of surface deposition technology, nano-aluminum-based alloys can be fabricated through surface deposition methods to achieve uniform compositional distribution. Among these methods, magnetron sputtering and spray forming share a common limitation—they are constrained by the geometry of the substrate. Furthermore, the magnetron sputtering technique faces challenges in large-scale production due to its high equipment costs. In contrast, the electrodeposition method offers notable advantages, including lower production costs and the ability to achieve uniform coating on substrates with complex geometries. Therefore, it has emerged as an effective approach for fabricating aluminum-based alloys.
Since the standard electrode potential of aluminum is extremely negative (−1.66 V), it will spontaneously react with water to form hydrogen in aqueous solution. Direct electrodeposition is not possible in aqueous solution. The mixed solvent composed of benzene (non-polar) and THF (weakly polar) can completely avoid the interference of water. Benzene can provide an inert environment, reduce the polarity of the solvent and inhibit the hydrolysis of Al3+. THF and AlCl3 form a stable [AlCl3·THF] complex, which improves the solubility of aluminum ions and enhances the conductivity of the plating solution. In addition, LiAlH4 has dual functions of reduction and complexation. It not only acts as a strong reducing agent to provide H for reducing Al3+ to the metallic state but also reacts with AlCl3 to form active aluminum hydrides (such as AlH3), reducing the deposition overpotential and thus promoting the formation of a dense aluminum layer. Although the electrodeposition method has the advantages of cost and substrate compatibility, under the AlCl3-LiAlH4-benzene-THF system, the regulation rules of key process parameters (current density, temperature, and SiC addition amount) of Al-SiC composite coatings on core properties are unclear, making it difficult to support the preparation of high-performance coatings. This study explores the correlation between process parameters and coating performance and determines the optimal parameters, providing synthetic data and theoretical basis. It can also break through the technical collaboration difficulties, offer solutions for the large-scale application of coatings on key components in high-end fields, and promote their transition from the laboratory to industrial practical use.
This study focuses on the preparation of Al-SiC composite coatings through an electrodeposition method utilizing an AlCl3-LiAlH4-benzene-THF system. We investigated how current density, temperature, and the incorporation of SiC particles influenced the surface morphology, corrosion resistance, and hardness of the Al-SiC composite coatings, ultimately identifying the optimal process parameters based on our research findings.

2. Preparation and Characterization

The drugs were moved to an inert atmosphere operating box filled with high purity argon. Table 1 shows the process parameters for preparing coatings. In an inert environment, 4.0 g of anhydrous aluminum chloride and 0.28 g of lithium aluminum hydride were weighed. In the ventilation cupboard, the beaker was placed on the magnetic stirrer. In the ice bath environment, 20 mL of benzene and 5 mL of tetrahydrofuran were slowly dripped, and stirred at 300–500 rpm for 2.5 h. The aluminum and copper sheets were polished by # 1000 and # 2000 sandpaper, washed with deionized water, washed with 10% hydrochloric acid for 1–2 min, washed again with deionized water, dried and vacuum dried. The anode consisted of an aluminum sheet, while a copper sheet served as the cathode during the electrodeposition process for a duration of 45 min. Scanning electron microscopy (SEM, Hitachi, Tokyo, Japan) was utilized to observe the morphology of the coating. The phase structure of the coating was evaluated by X-ray diffractometer (XRD, D8 Advance). The corrosion performance was analyzed by Tafel polarization curves and electrochemical impedance spectroscopy. Electrochemical experiments were performed with a three-electrode setup utilizing an IVIUM electrochemical workstation (Ivium Technologies, Eindhoven, Netherlands). The configuration included the working electrode (WE, Pt), a counter electrode (CE, Pt sheet), and a reference electrode (RE, calomel electrode), each connected through their designated leads. The corrosion test is conducted in a 3.5% sodium chloride solution. During the Vickers measurement, a 40× objective lens was selected to ensure sufficient magnification and clarity. The experimental indenter load was set at 25 gf, the holding time was set at 15 s, and the shooting brightness value was set at 240. These settings were all to ensure the stable formation of indentations and clear images for accurate measurement. Meanwhile, multi-area indentation testing was conducted on the composite coating. For a single sample, no less than 5 equidistant test sites were set, and the average value was finally taken as the hardness value to reduce measurement errors. The hardness was measured using the Vickers 402 MVD micro-hardness tester (Shanghai Zhu Jin Analytical Instrument Co., Ltd., Shanghai, China). The following are the process parameters for the preparation of the coatings.

3. Results and Discussion

3.1. Morphological Analysis

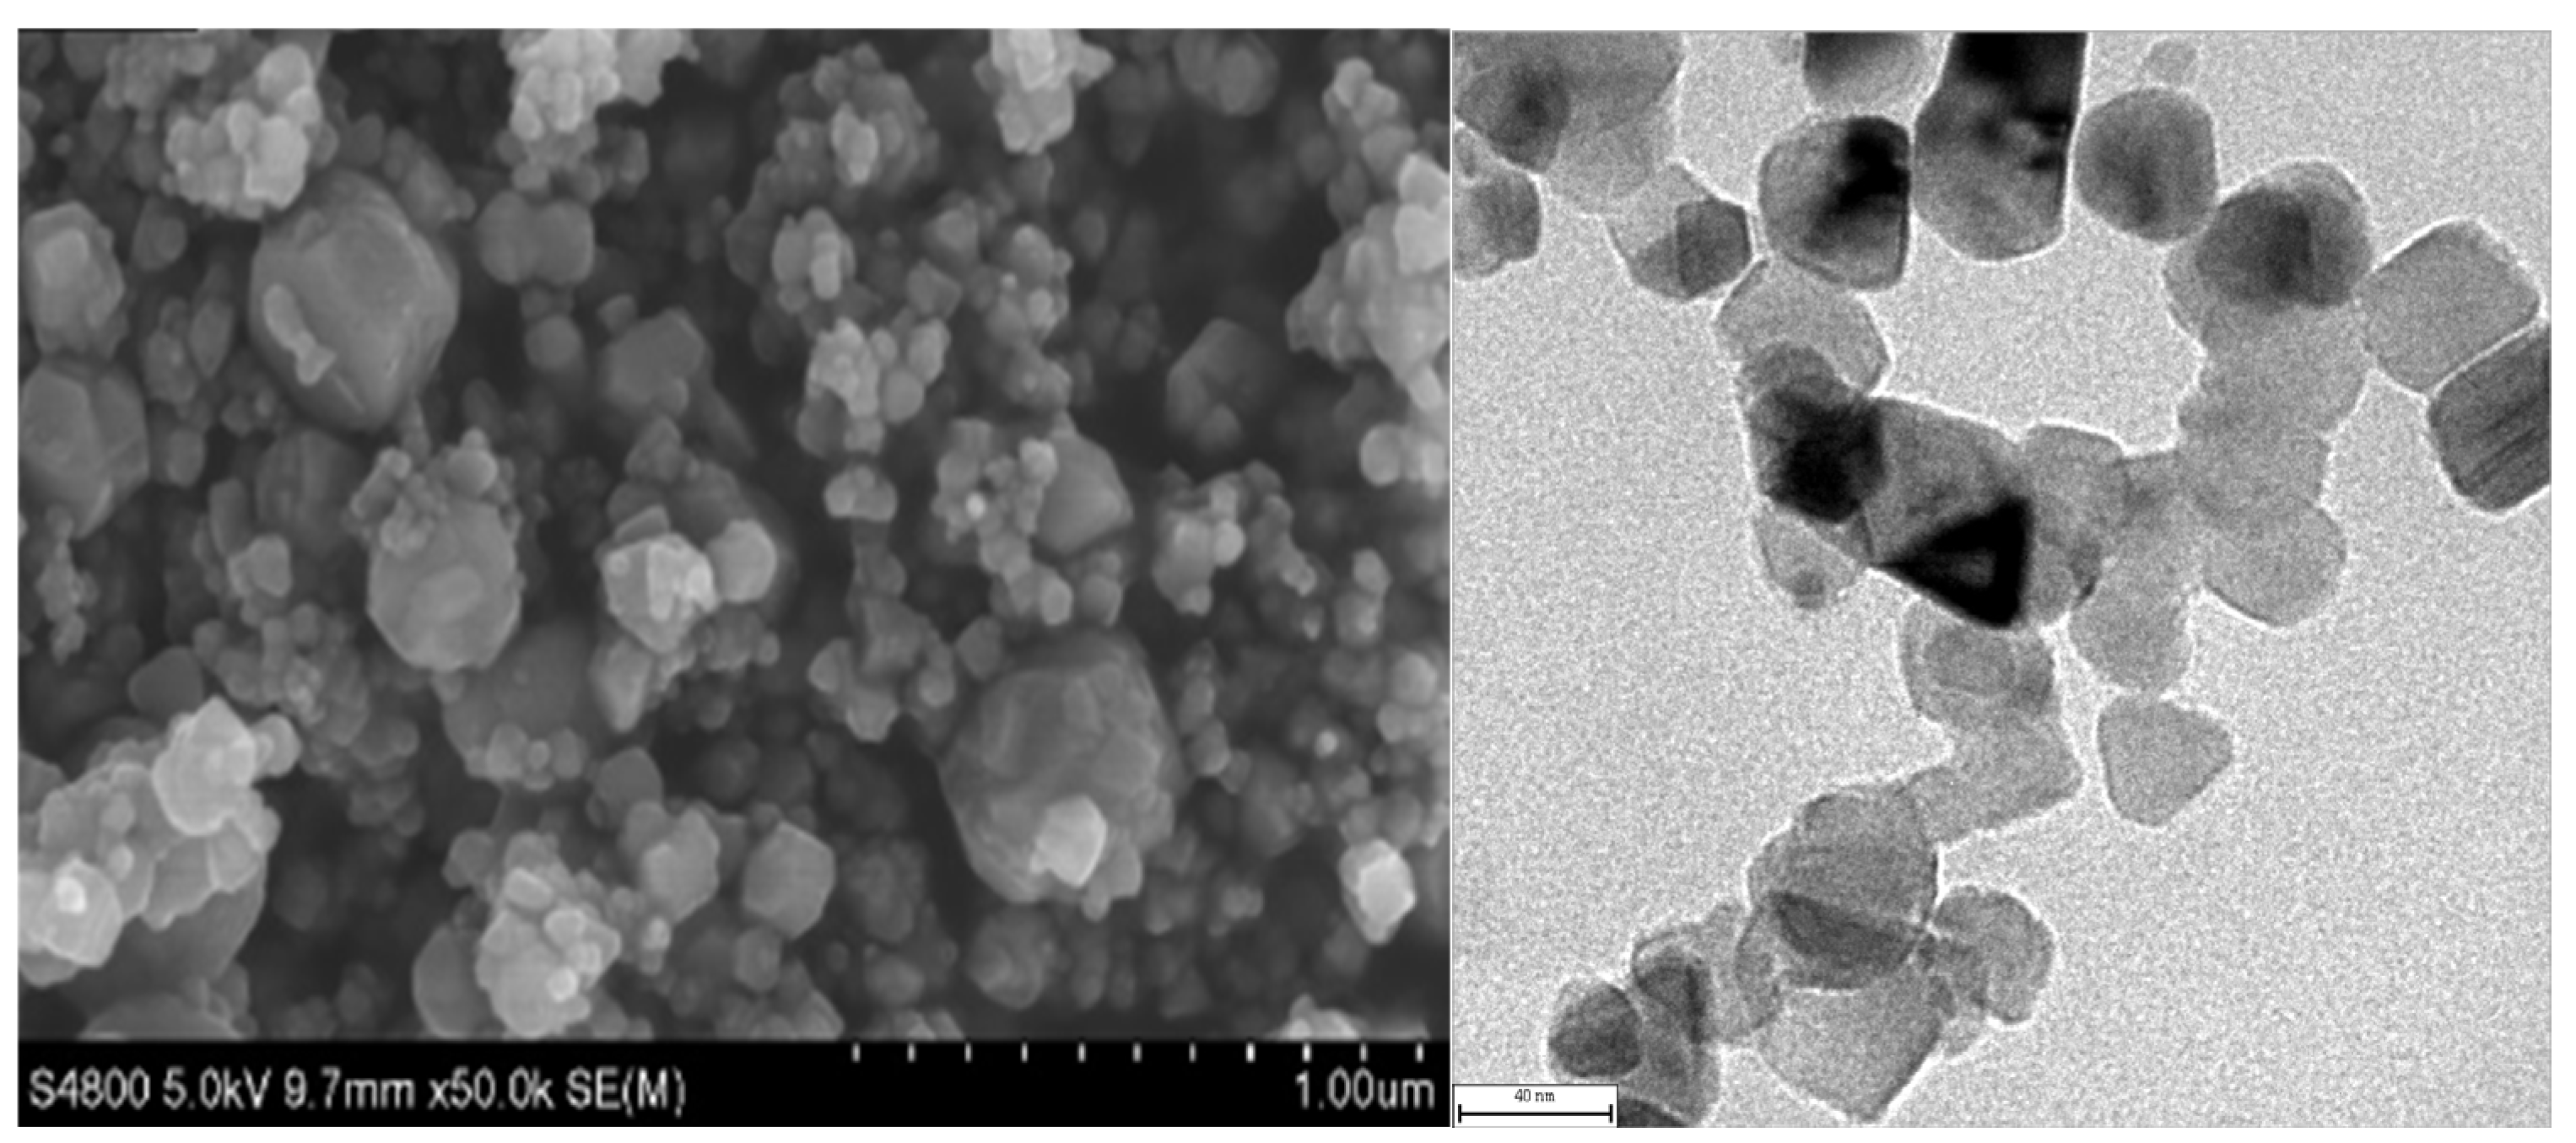
Figure 1 shows the surface morphology of SiC particles. The type of SiC we employed is 3C type. The particle size of SiC is 40 nm. This SEM image indicates that the SiC particles present a typical polycrystalline structure, with a rough surface and micron-level concave and convex features. It has rich steps and pores, and this morphology is related to the crystal growth and particle aggregation mode during high-temperature synthesis. The particle size distribution is continuous and dispersed, with no single particle size dominating. Some fine particles adhere to large particles, presenting a multi-scale composite characteristic. This is due to the uneven nucleation growth during synthesis or the combined effect of subsequent particle fragmentation and agglomeration.
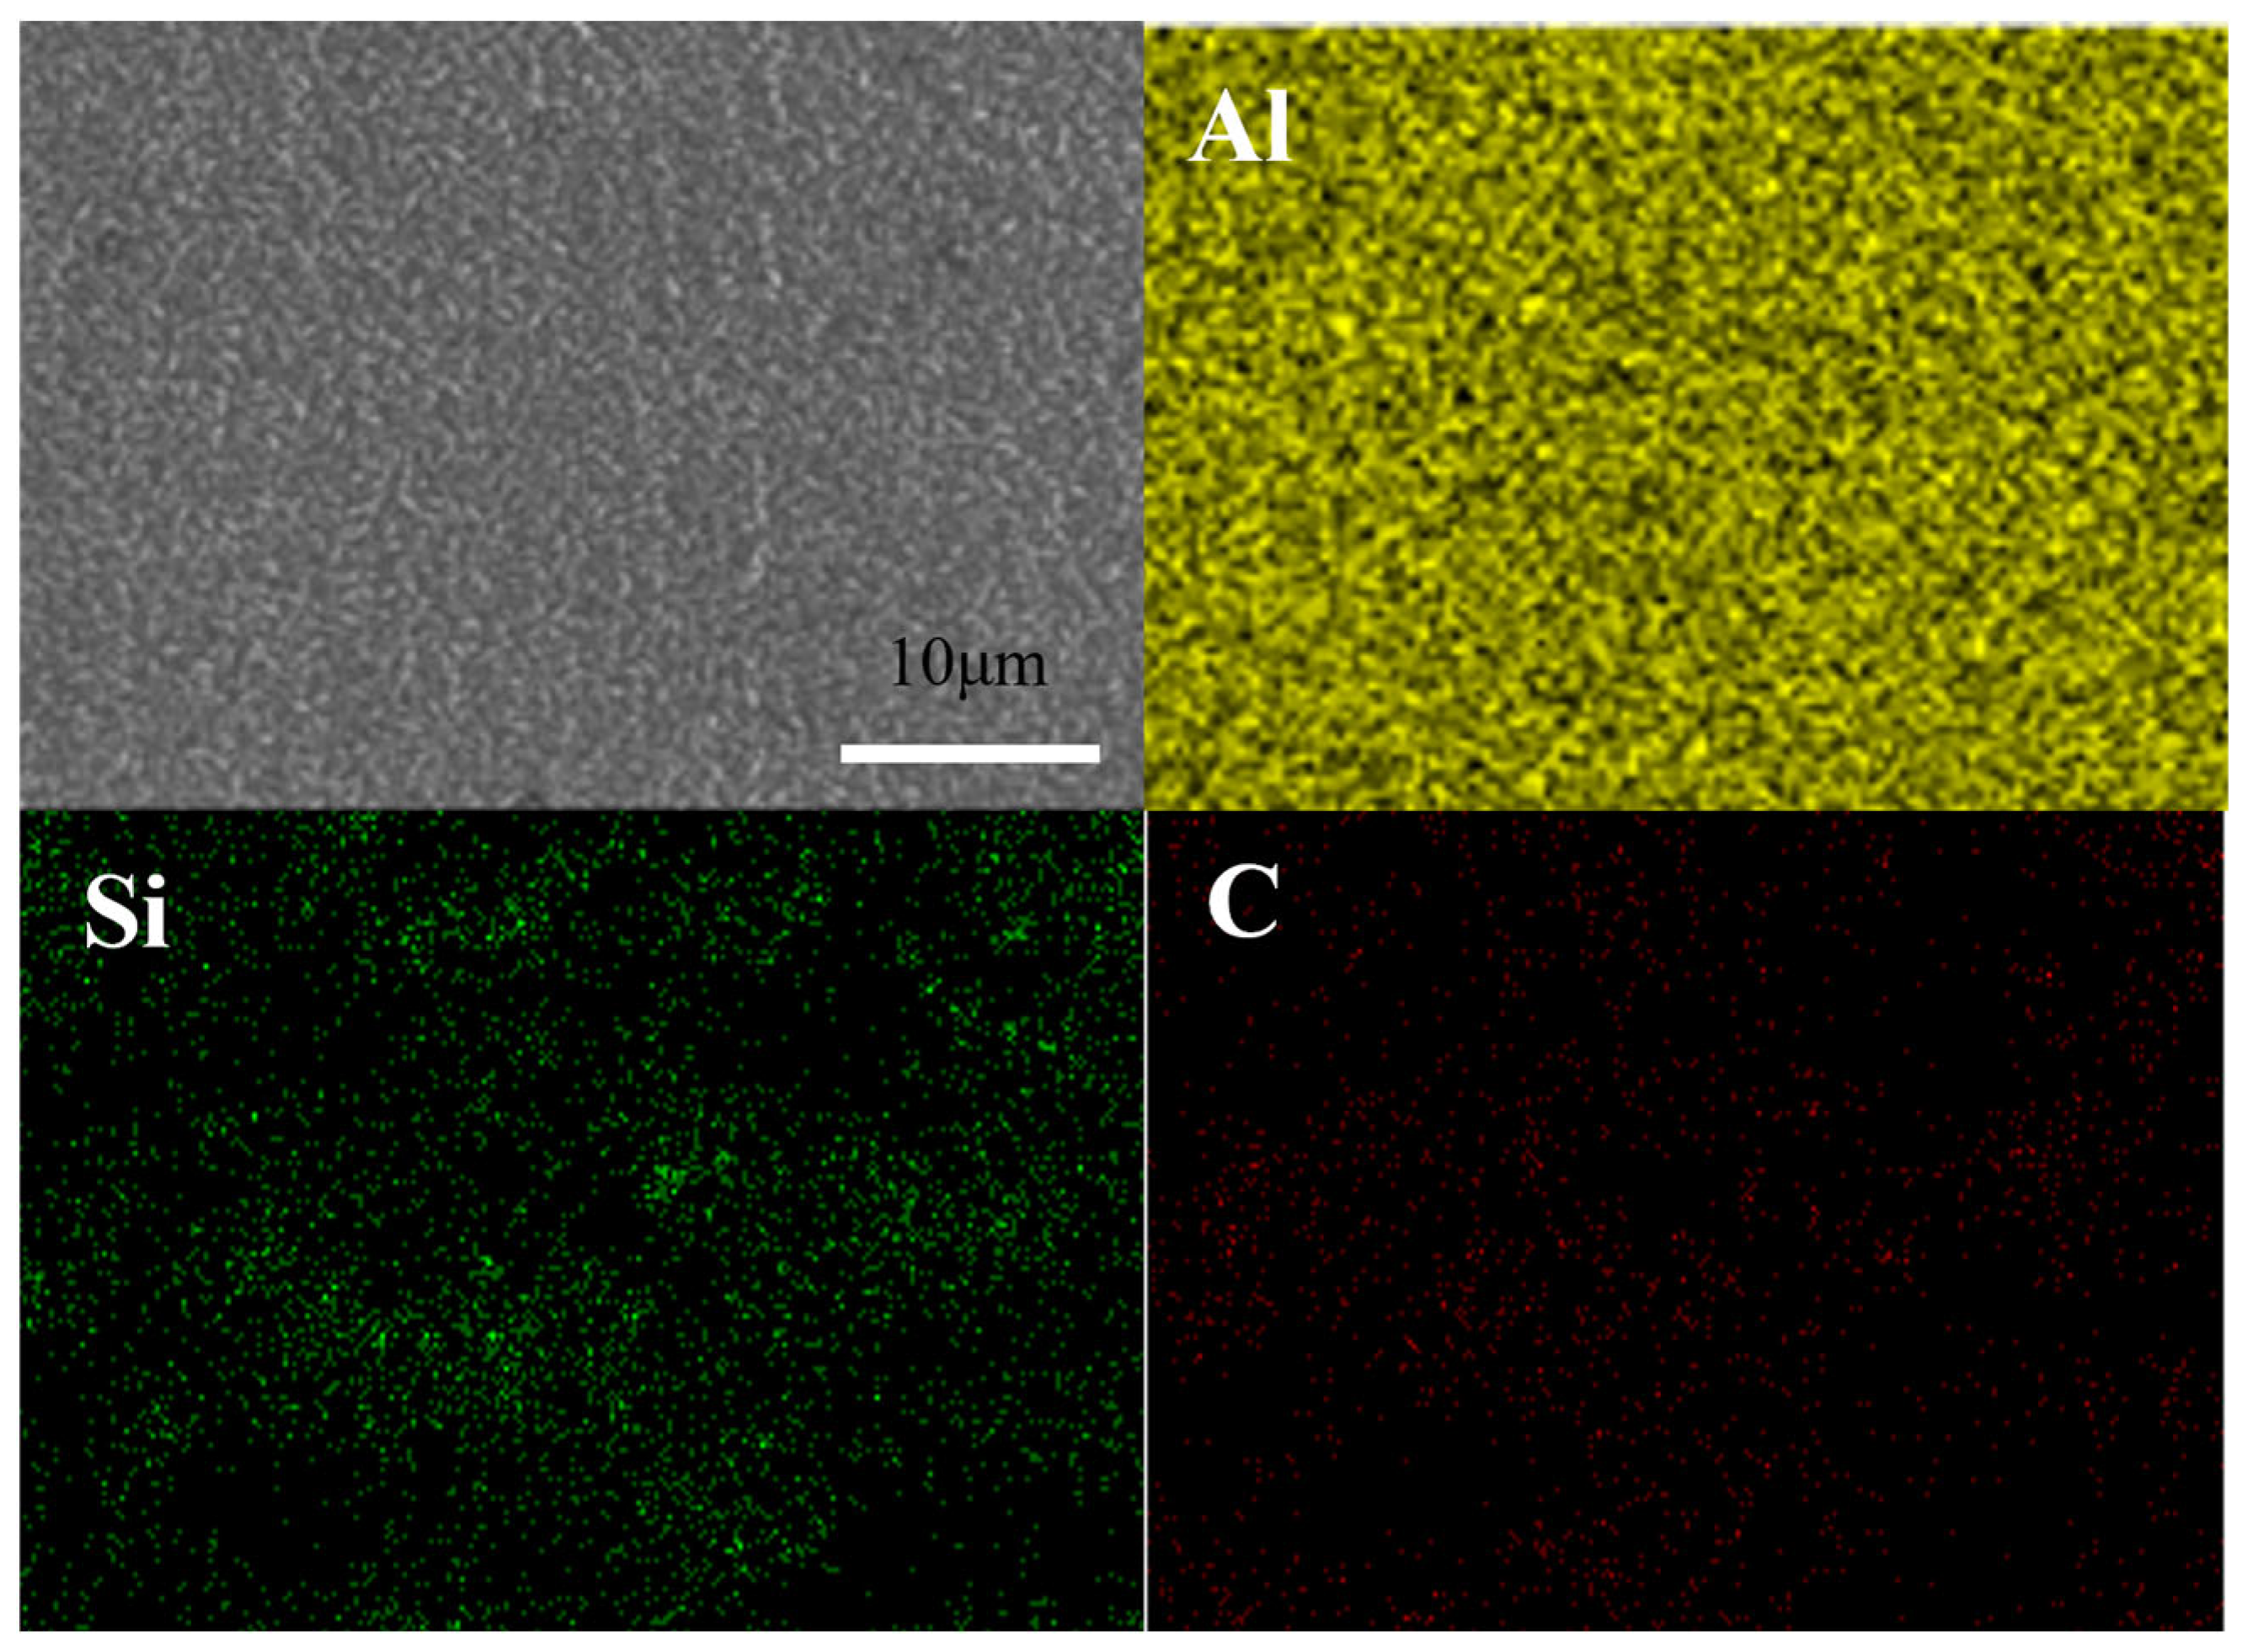
Composite coatings of Al-SiC were produced using direct current electrodeposition within an organic system comprising AlCl3, LiAlH4, benzene, and THF. The quantities used were as follows: 4 g of AlCl3, 0.28 g of LiAlH4, 20 mL of benzene, and 5 mL of THF. The concentration of SiC particles was 40 g/L, the current density was 50 mA/cm2, and the Al-SiC composite coating was electrodeposited for 45 min at 30 °C. The surface topography and elemental distribution scanning images of the obtained Al-SiC composite coating at 500 times magnification are shown in Figure 2, and the EDS analysis results are presented in Table 2. It can be seen from the SEM image that the surface morphology of the coating is relatively smooth and dense at this time. The element distribution surface scanned image reveals a relatively even distribution of Al, Si, and C elements.
Table 2 presents the results of the EDS energy spectrum analysis for the Al-SiC composite coating. The findings indicate that 5.24% of the coating is composed of silicon. Furthermore, it is noticeable that oxygen is also present in the coating. This could be attributed to the increased reactivity of aluminum in the newly formed coating, making it susceptible to reacting with atmospheric oxygen and resulting in the formation of oxides.

3.2. XRD Detection

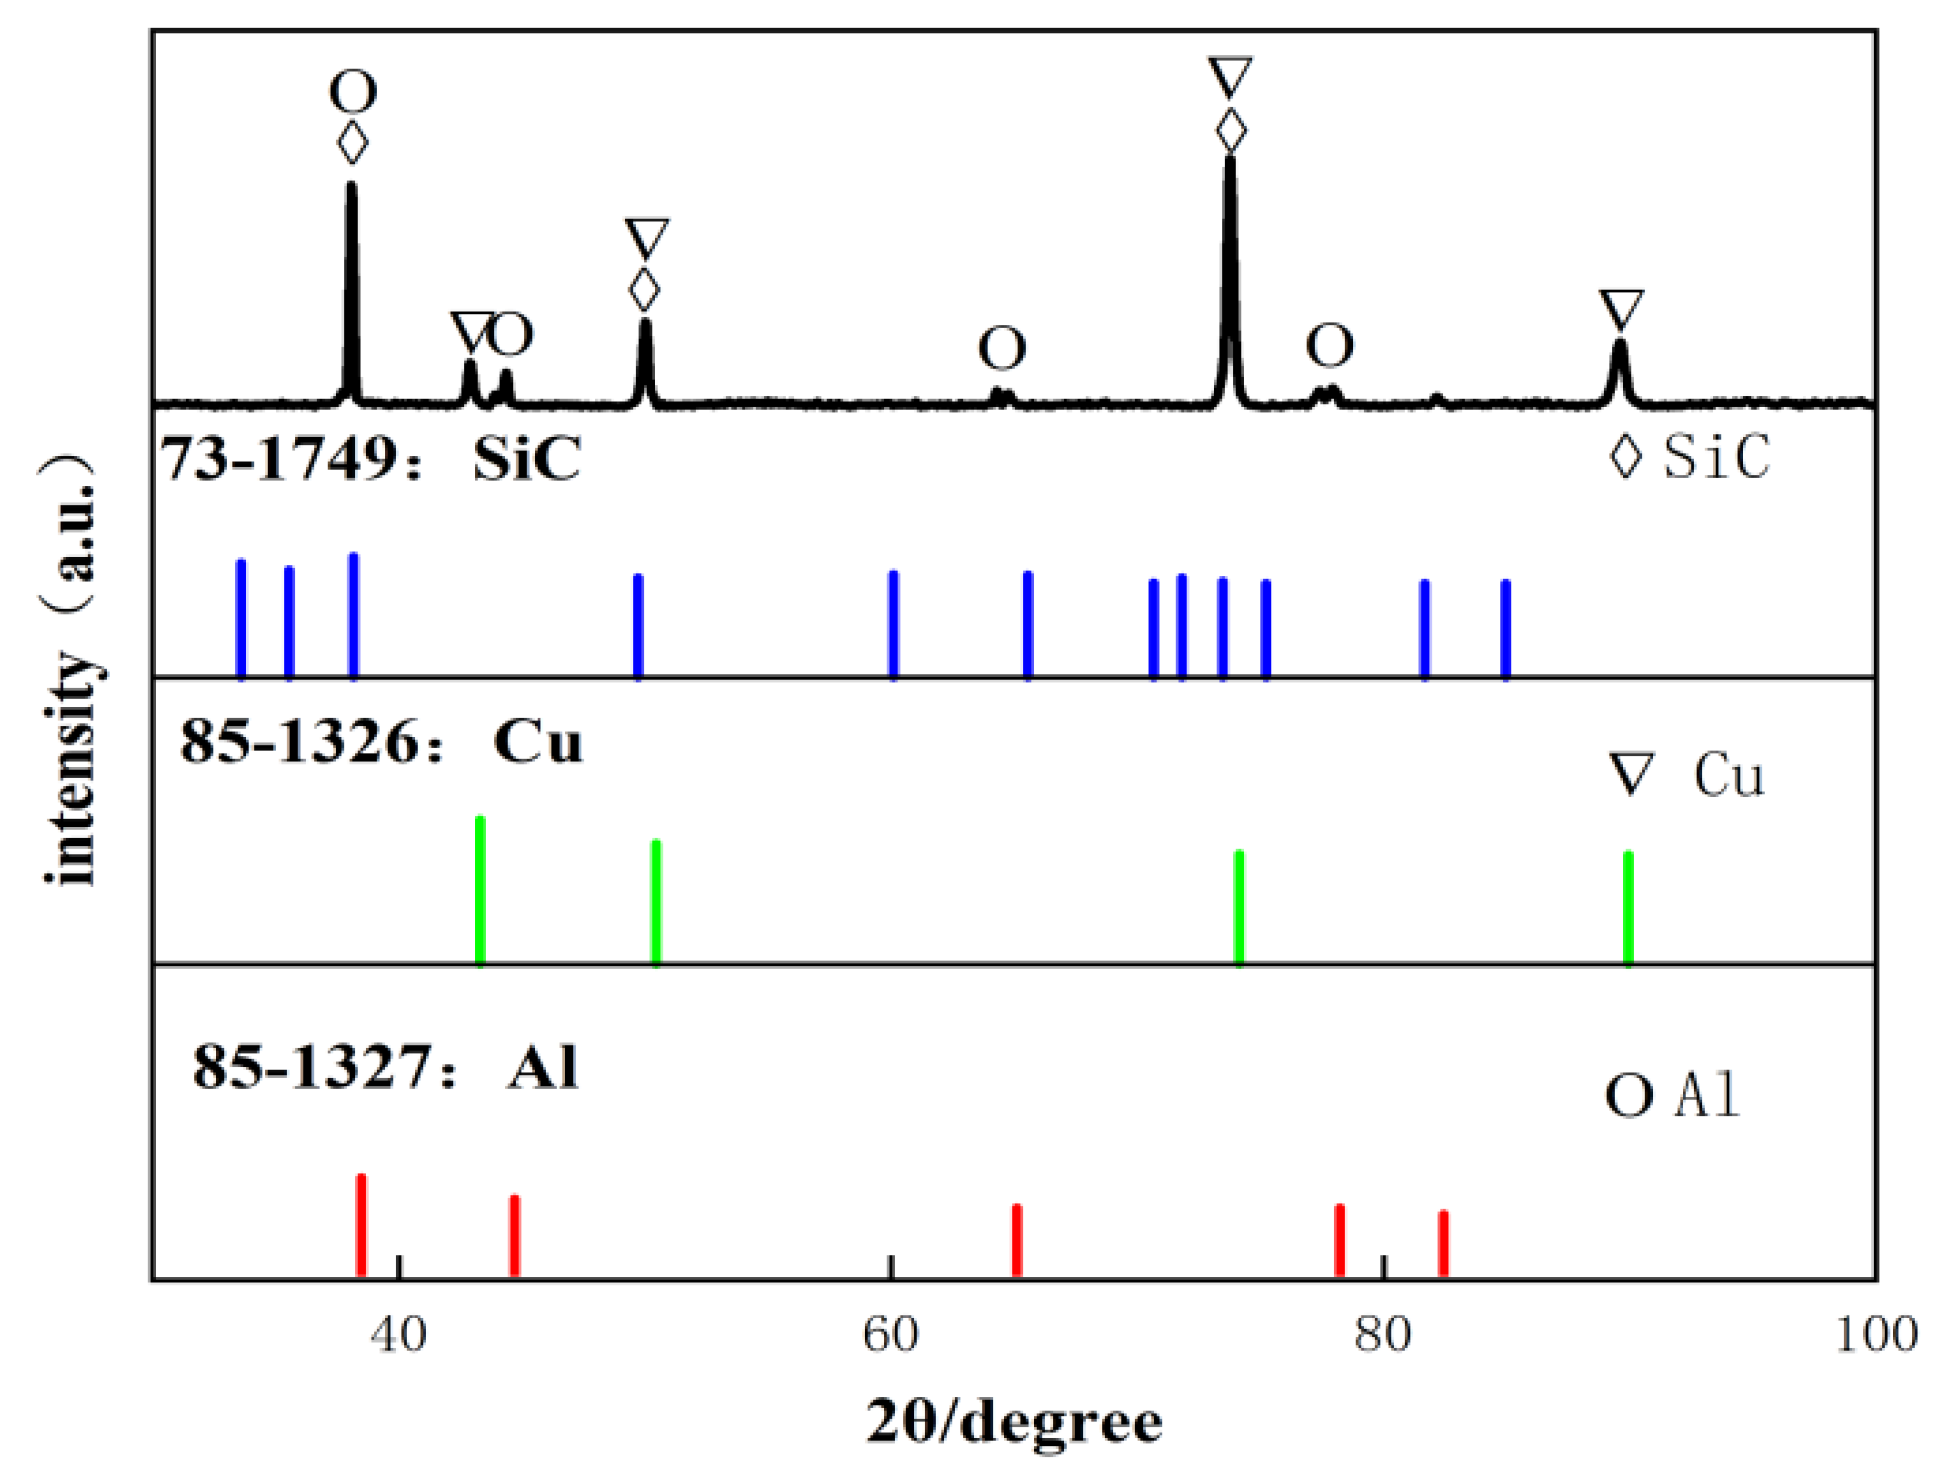
The XRD pattern of the Al-SiC composite coating is illustrated in Figure 3. A comparison of the diffraction peaks from this composite coating with the standard peaks provided by the Joint Committee on Powder Diffraction Standards (JCPDS) reveals the XRD patterns associated with the Al-SiC composite coating. The spectral measurement range for 2θ spans from 20° to 100°, displaying eight relatively distinct diffraction peaks in the image. The diffracted peaks corresponding to Al (85–1327) and SiC (73–1749) are prominently visible, confirming that both Al and SiC phases have been effectively incorporated into the composite coating. Additionally, because the coating is applied onto a copper substrate, X-rays can penetrate it, thereby capturing the substrate’s signal, which allows for the detection of the diffraction peak for Cu (85–1326). The absence of significant impurity peaks in the spectrum suggests that the coating maintains a high level of purity.

3.3. The Influence of Current Density on Al-SiC Composite Coatings

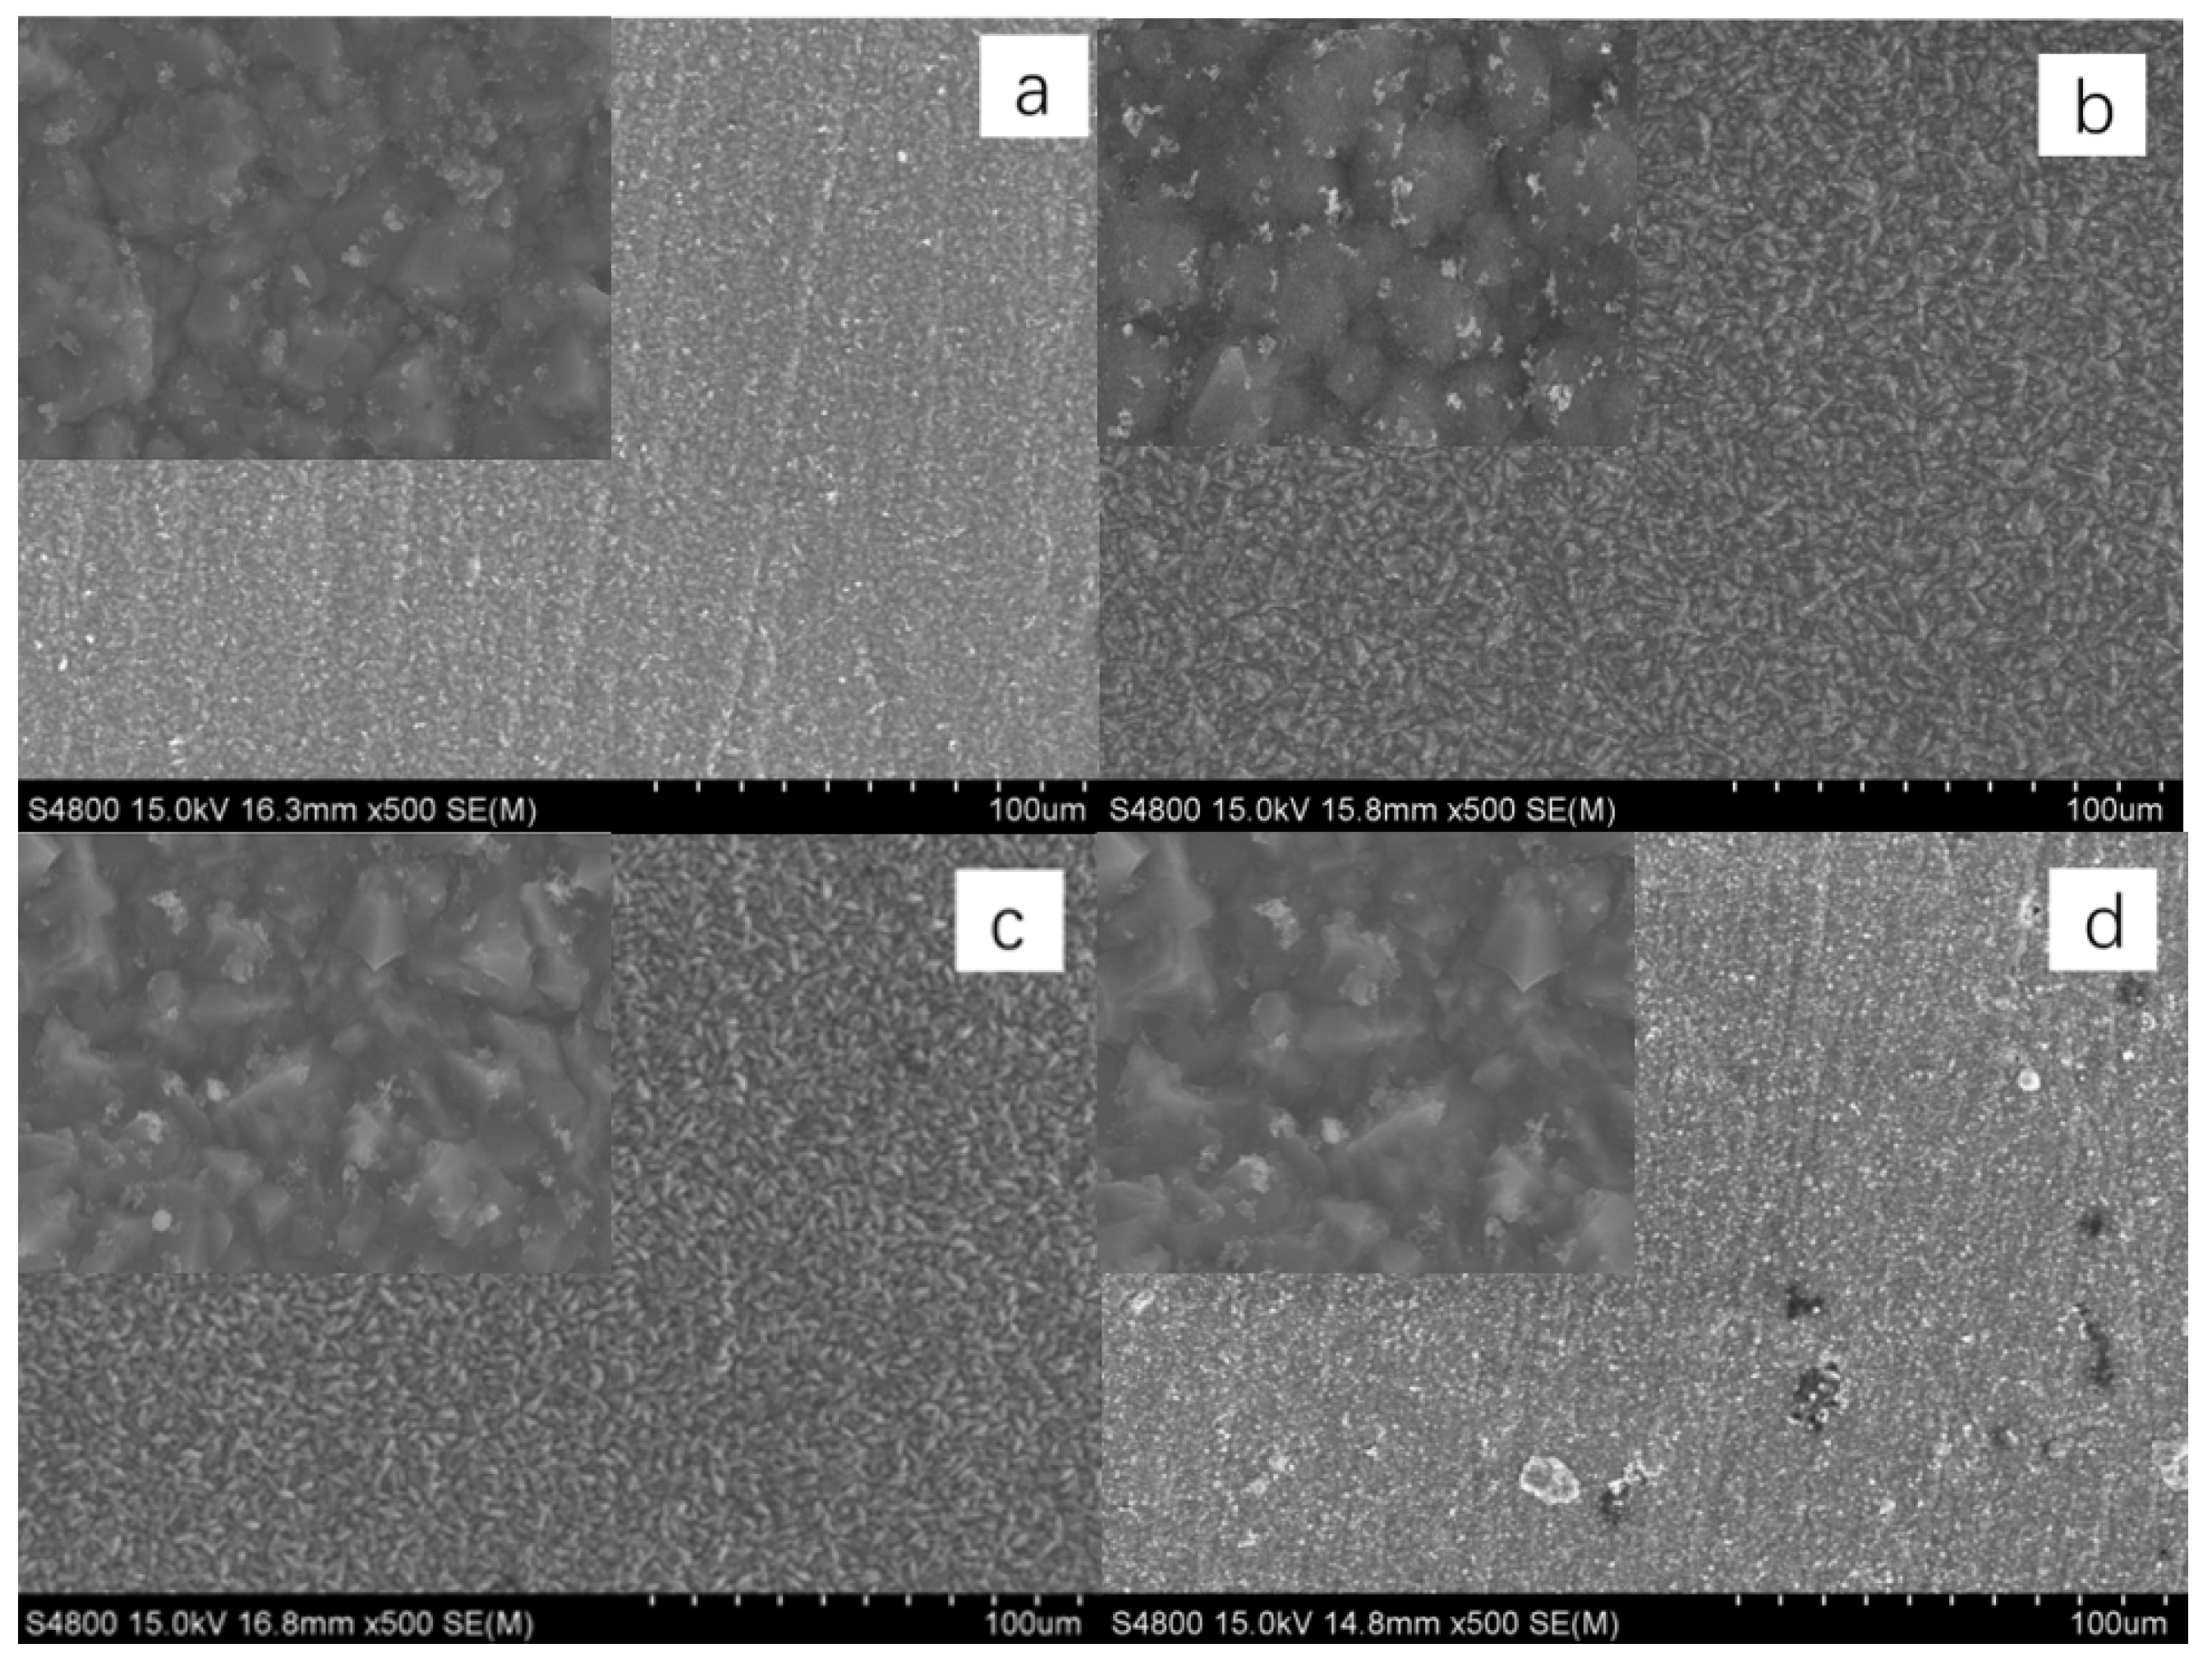
This research investigates the influence of various current densities—specifically 10 mA/cm2, 30 mA/cm2, 50 mA/cm2, and 70 mA/cm2—on the surface morphology of Al-SiC composite coatings, while maintaining a consistent ultrasonic dispersion duration of 30 min, a temperature of 30 °C, and a SiC addition concentration of 40 g/L. The SEM images illustrating the Al-SiC composite coatings across these different current densities are presented in Figure 4. As depicted in Figure 4, at a current density of 10 mA/cm2, the silicon content measures 0.98 wt%. Under these conditions, the coating surface reveals observable cracks and micro-pores, with a comparatively low concentration of SiC. Additionally, some SiC particles are seen to be unevenly scattered throughout the coating. When the current density increases to 30 mA/cm2, the silicon content rises to 1.78 wt%. Currently, the amount of SiC present in the coating shows a slight increase, and the degree of dispersion improves; however, the total SiC content remains relatively low, resulting in inadequate flatness of the coating. At a current density of 50 mA/cm2, the Si content peaks at 5.24 wt%. During this period, the dispersion degree of SiC particles is optimal, leading to a surface that is relatively uniform and dense, making the surface morphology of the coating highly preferable. When the current density achieves 70 mA/cm2, the silicon (Si) content is measured at 2.81 wt%, showing a notable decrease. Additionally, significant agglomeration is observed on the coating’s surface. At this current density, the coating exhibits numerous holes and defects on its surface, indicating the serious consequences of excessive current density. Overall, the Si content in the coating tends to rise with an increase in current density. Nevertheless, once the current density surpasses 50 mA/cm2, there is a marked decline in particle content accompanied by a corresponding deterioration in surface morphology. During the process of electrodeposition, a rise in current density enhances the electric field strength, accelerating the substrate metal’s deposition rate and facilitating the entry of more silicon carbide (SiC) particles into the coating. However, at a current density of 70 mA/cm2, the deposition rate of metal cations becomes markedly higher than that of the co-deposition of reinforcing phase particles due to the high current density. This disparity in dynamics results in a downward trend in the reinforcement content of SiC within the coating. After comprehensive consideration, a current density of 50 mA/cm2 was selected for the next experiment.

3.4. The Influence of Bath Temperature on Al-SiC Composite Coatings

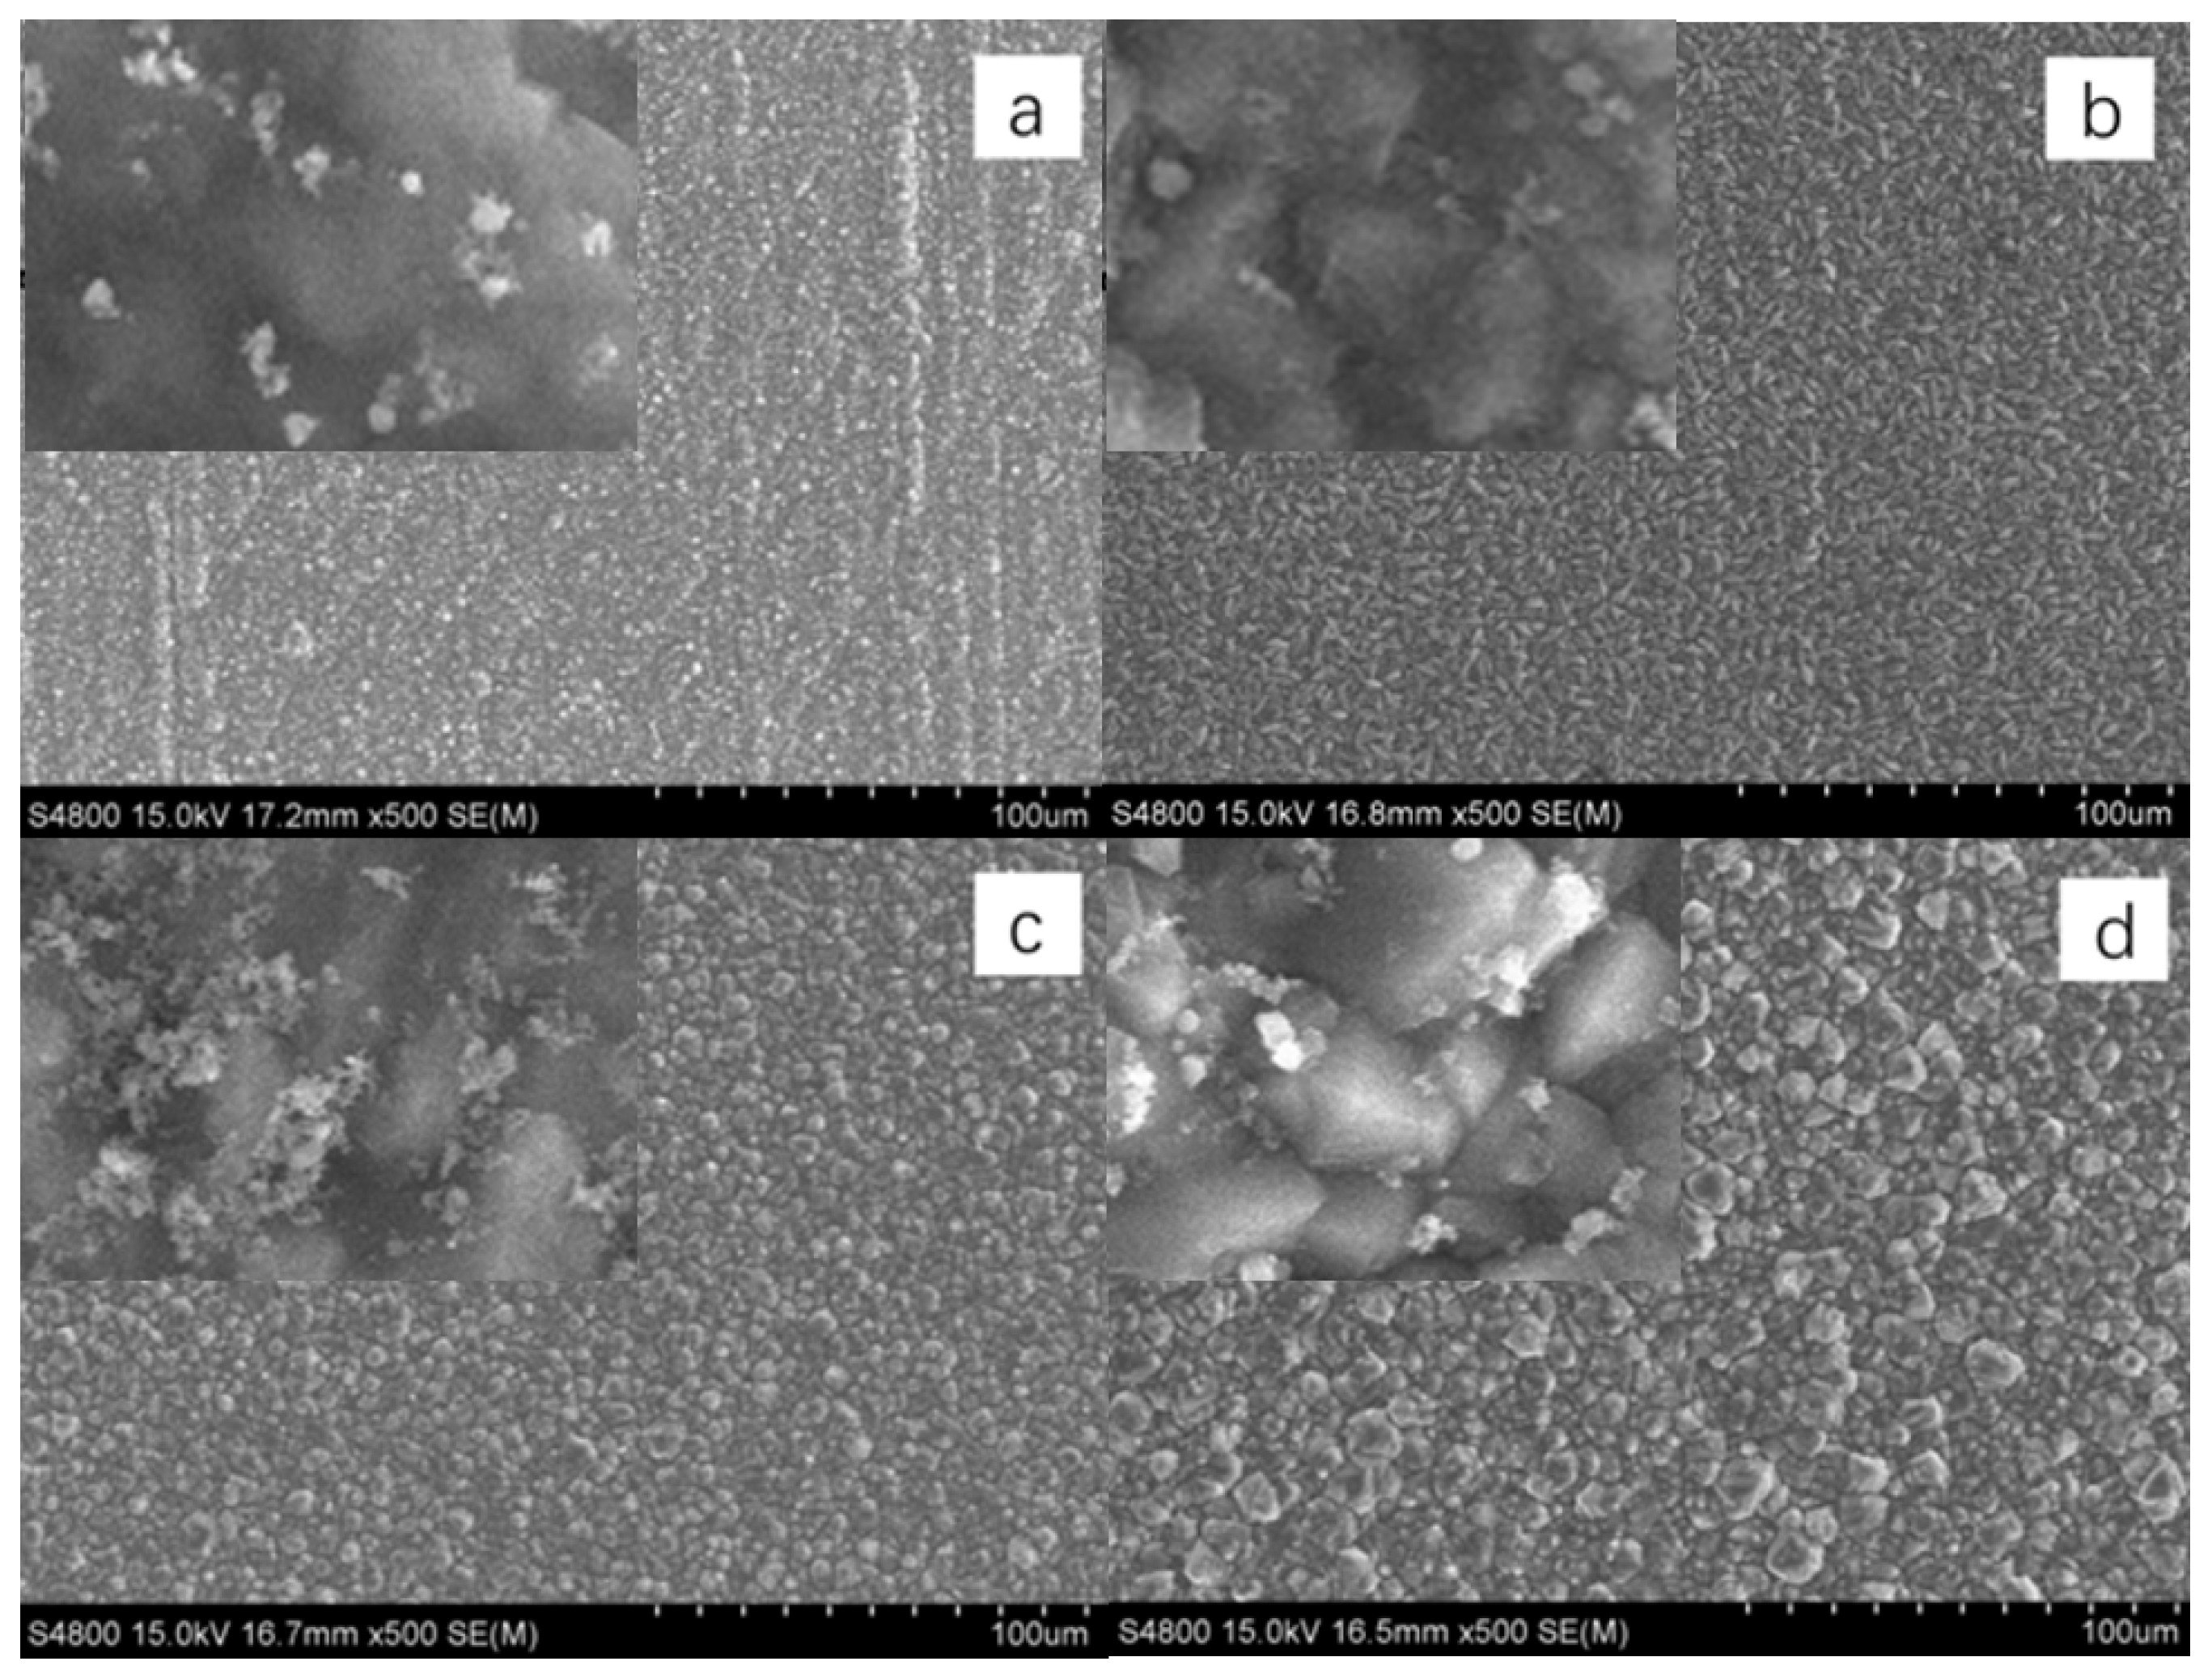
Figure 5 illustrates the surface morphology of the Al-SiC composite coating under varying temperature conditions. As indicated in Figure 5, at a temperature of 20 °C, the silicon content is measured at 8.55 wt%. At this specific temperature, the SiC content within the coating is notably high, resulting in an uneven coating surface. Upon magnifying the coating surface by 5000 times, distinct holes are apparent, and there is observable agglomeration of SiC particles on the surface. When the temperature increases to 30 °C, the silicon content drops to 5.24 wt%, leading to a slight reduction in the deposition of SiC; however, the overall dispersion remains effective, with refined grains and a smooth, dense coating surface. At a temperature of 40 °C, the silicon content further decreases to 4.90 wt%. At this stage, local agglomeration of SiC particles starts to manifest on the coating’s surface, with increased particle spacing and the formation of micro-pore defects at the grain boundaries of the substrate. Finally, at 50 °C, the silicon content is reduced to 3.89 wt%, accompanied by a decrease in SiC content and notable phase separation; the matrix grains become coarser, significantly compromising the coating’s surface flatness. From the analysis above, it is evident that temperature plays a crucial role in influencing both the particle content and the surface morphology of the coating. From the perspective of surface morphology, the content of SiC particles is relatively high at 20 °C, which may be due to insufficient thermal motion causing agglomeration. There are protrusions and holes on the coating surface, which will greatly affect the performance of the coating. However, when the temperature exceeds the thermodynamic stability window of the plating solution system, irreversible thermal decomposition reactions will occur within the system, leading to an increase in the activation energy threshold on the surface of SiC particles. This thermodynamic imbalance not only inhibits the chemical adsorption process of SiC particles on the coating surface, causing a decrease in their deposition rate, but also affects the growth rate of matrix grains, forming a distinct coarse-grained structure, which will have a certain impact on the performance of the coating. Based on the above comprehensive analysis, the conditions of a current density of 50 mA/cm2 and a temperature of 30 °C were selected for the next experiment.

3.5. Influence of SiC Particle Concentration on the Morphology and Composition of Al-SiC Composite Coatings

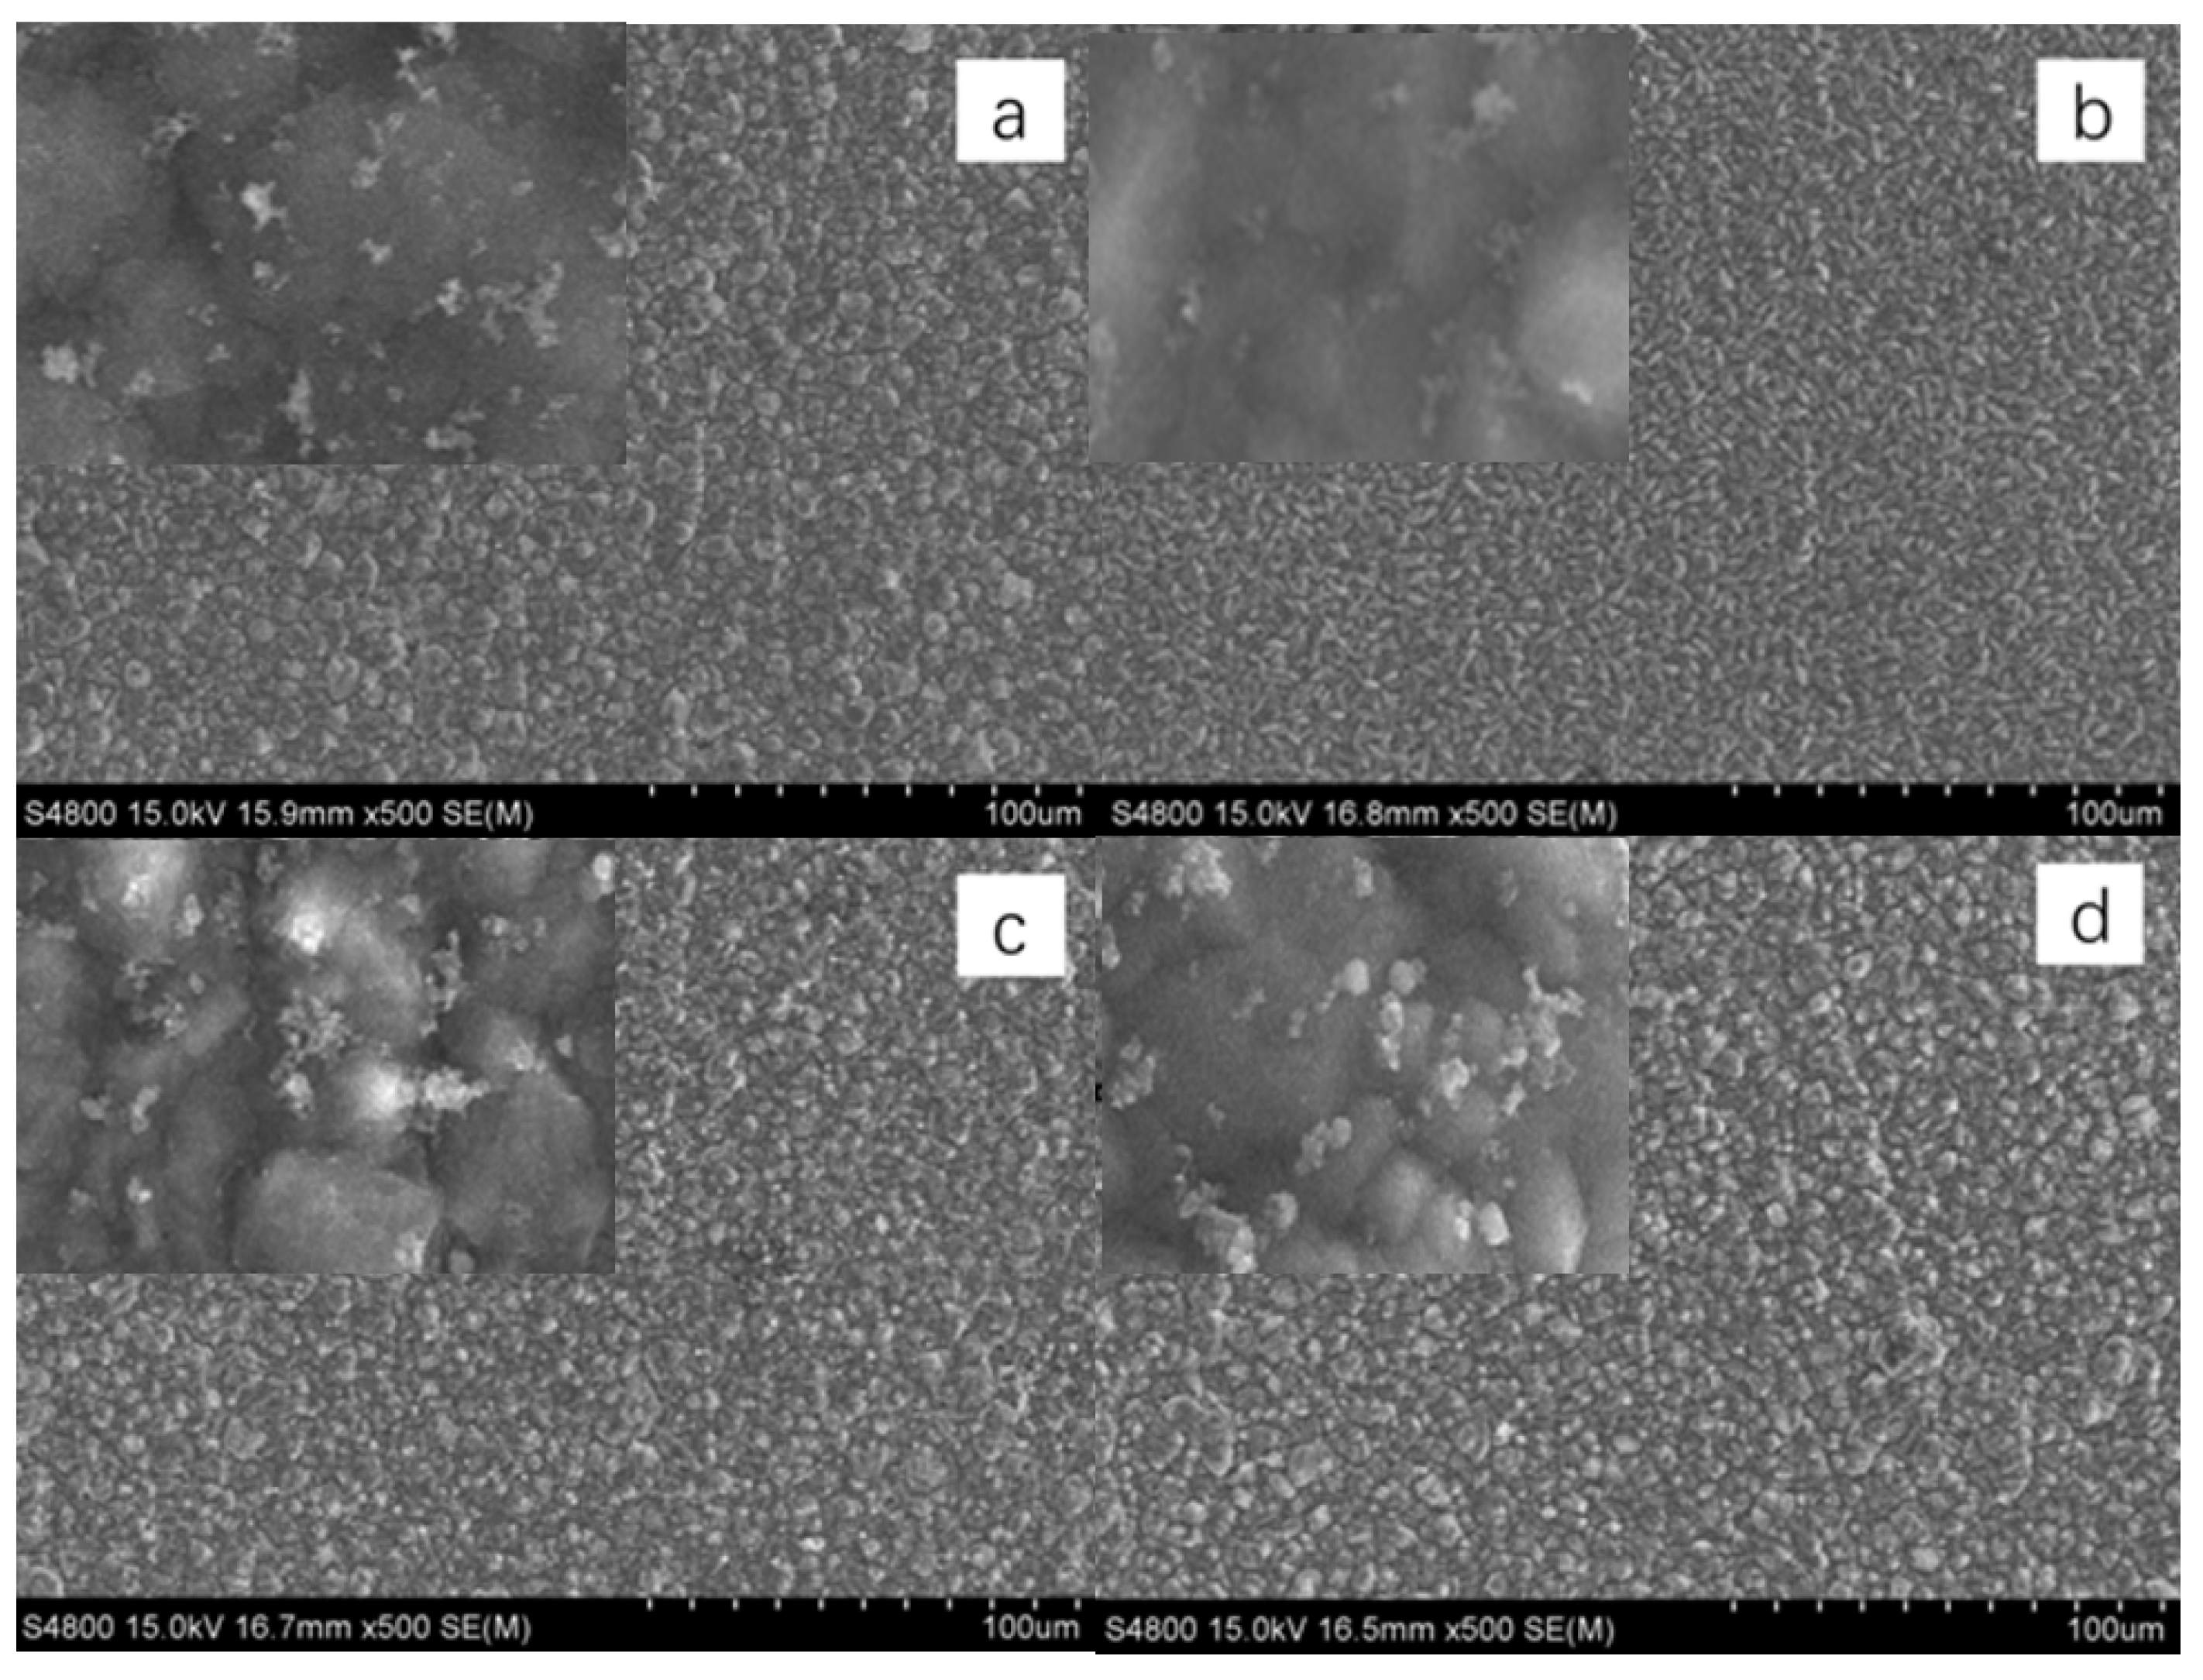
The amount of second-phase particles added plays a crucial role in influencing the surface morphology of the composite coating. In Figure 6, the surface morphology of the Al-SiC composite coating is depicted under varying SiC addition levels. As indicated in Figure 6, with a SiC concentration of 20 g/L, the Si content in the coating reaches 4.61 wt%. At this concentration, the SiC particles exhibit a relatively dispersed distribution across the coating surface, although some areas show signs of agglomeration, while the overall matrix grains are quite coarse. When the SiC concentration increases to 40 g/L, the Si content rises to 5.24 wt%. This slight increase in SiC results in refined matrix grains, leading to a more uniform and denser coating surface. At concentrations of 60 g/L and 80 g/L, the Si content is 6.71 wt% and 6.25 wt%, respectively. Although the SiC particle content continues to rise, the agglomeration on the coating surface becomes more pronounced, resulting in coarsened matrix grains and a deterioration in the surface morphology of the coating.
According to the analysis presented above, it is evident that the quantity of particles within the coating progressively rises as the amount of second-phase particles added increases, peaking at 60 g/L. When the amount of SiC added is low, there are limited nucleation sites, resulting in a less noticeable refinement effect on the coating. The matrix particles of the coating are relatively large, but overall, the surface morphology of the coating is relatively smooth. When the addition amount of SiC particles is increased to 40 g/L, due to the increase in the particle addition amount, the nucleation sites increase, the matrix grains are significantly refined, the coating surface is much flatter, and the dispersion degree of SiC particles is further improved. When the quantity of SiC particles added surpasses 60 g/L, the excessive amount leads to scattering of additional particles across the surface of the coating, resulting in the formation of agglomerates. According to the adsorption dynamic model, the quantity of SiC adsorbed per unit area at this stage exceeds the capacity limit of the base metal, which causes a substantial number of excess particles to cluster on the coating’s surface. While the increase in SiC particle content in the plating solution enhances the overall particle concentration within the coating, it adversely affects the coating’s surface morphology and performance, without contributing to grain refinement. Considering all factors, the ideal surface morphology of the coating occurs at a current density of 50 mA/cm2, a temperature of 30 °C, and a SiC addition of 40 g/L within the research parameters.

3.6. Corrosion Resistance Performance Research

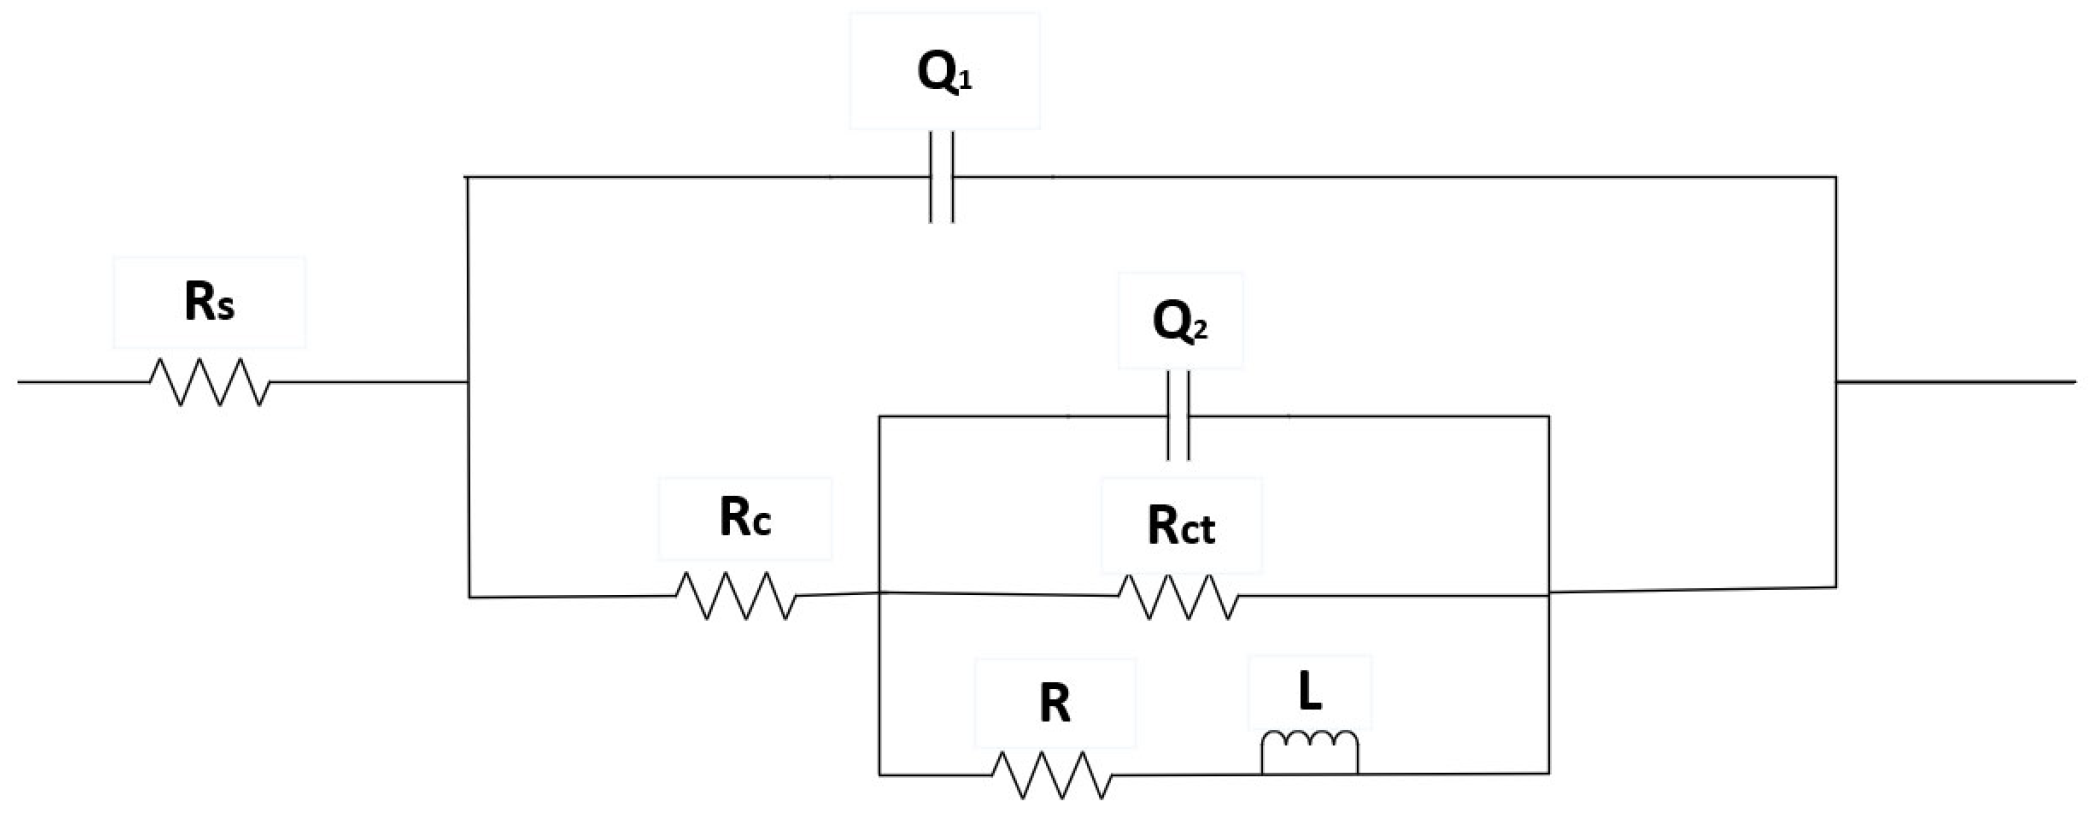
Utilizing the electrochemical impedance spectroscopy (EIS) analytical technique, the equivalent circuit model illustrated in Figure 7 has been developed. This model includes solution resistance (Rs), coating resistance (Rc), charge transfer resistance (Rct), and double layer constant phase angle elements Q1 and Q2, while R and L denote the inductance.
During the electrochemical corrosion process of the Al-SiC composite coating prepared in the AlCl3-LiAlH4-benzene-THF system, corrosion initially commences at the microscopic defects (pores, micro-cracks) of the coating and the interface between the Al matrix and SiC. Aggressive ions such as Cl preferentially attack these areas, and the micro-galvanic coupling at the interface due to thermal stress generated during the preparation process becomes the sensitive point for corrosion initiation. Subsequently, the pitting corrosion enters the development and expansion stage. Cl adsorbs at the defects or interfaces and destroys the passive film on the surface of the Al matrix, triggering local anodic dissolution to form pitting nuclei. The occluded cell effect inside the corrosion pits leads to a decrease in the pH value and an increase in the Cl concentration within the pits, accelerating the dissolution of the metal inside the pits and promoting the deep-seated development of the pits. As the corrosion progresses, the corrosion mechanism gradually evolves from a mechanism mainly dominated by the charge transfer process in the initial stage to a mixed mechanism jointly controlled by charge transfer and the diffusion of corrosion products within the pits.

3.6.1. The Influence of Current Density on Corrosion Resistance Performance

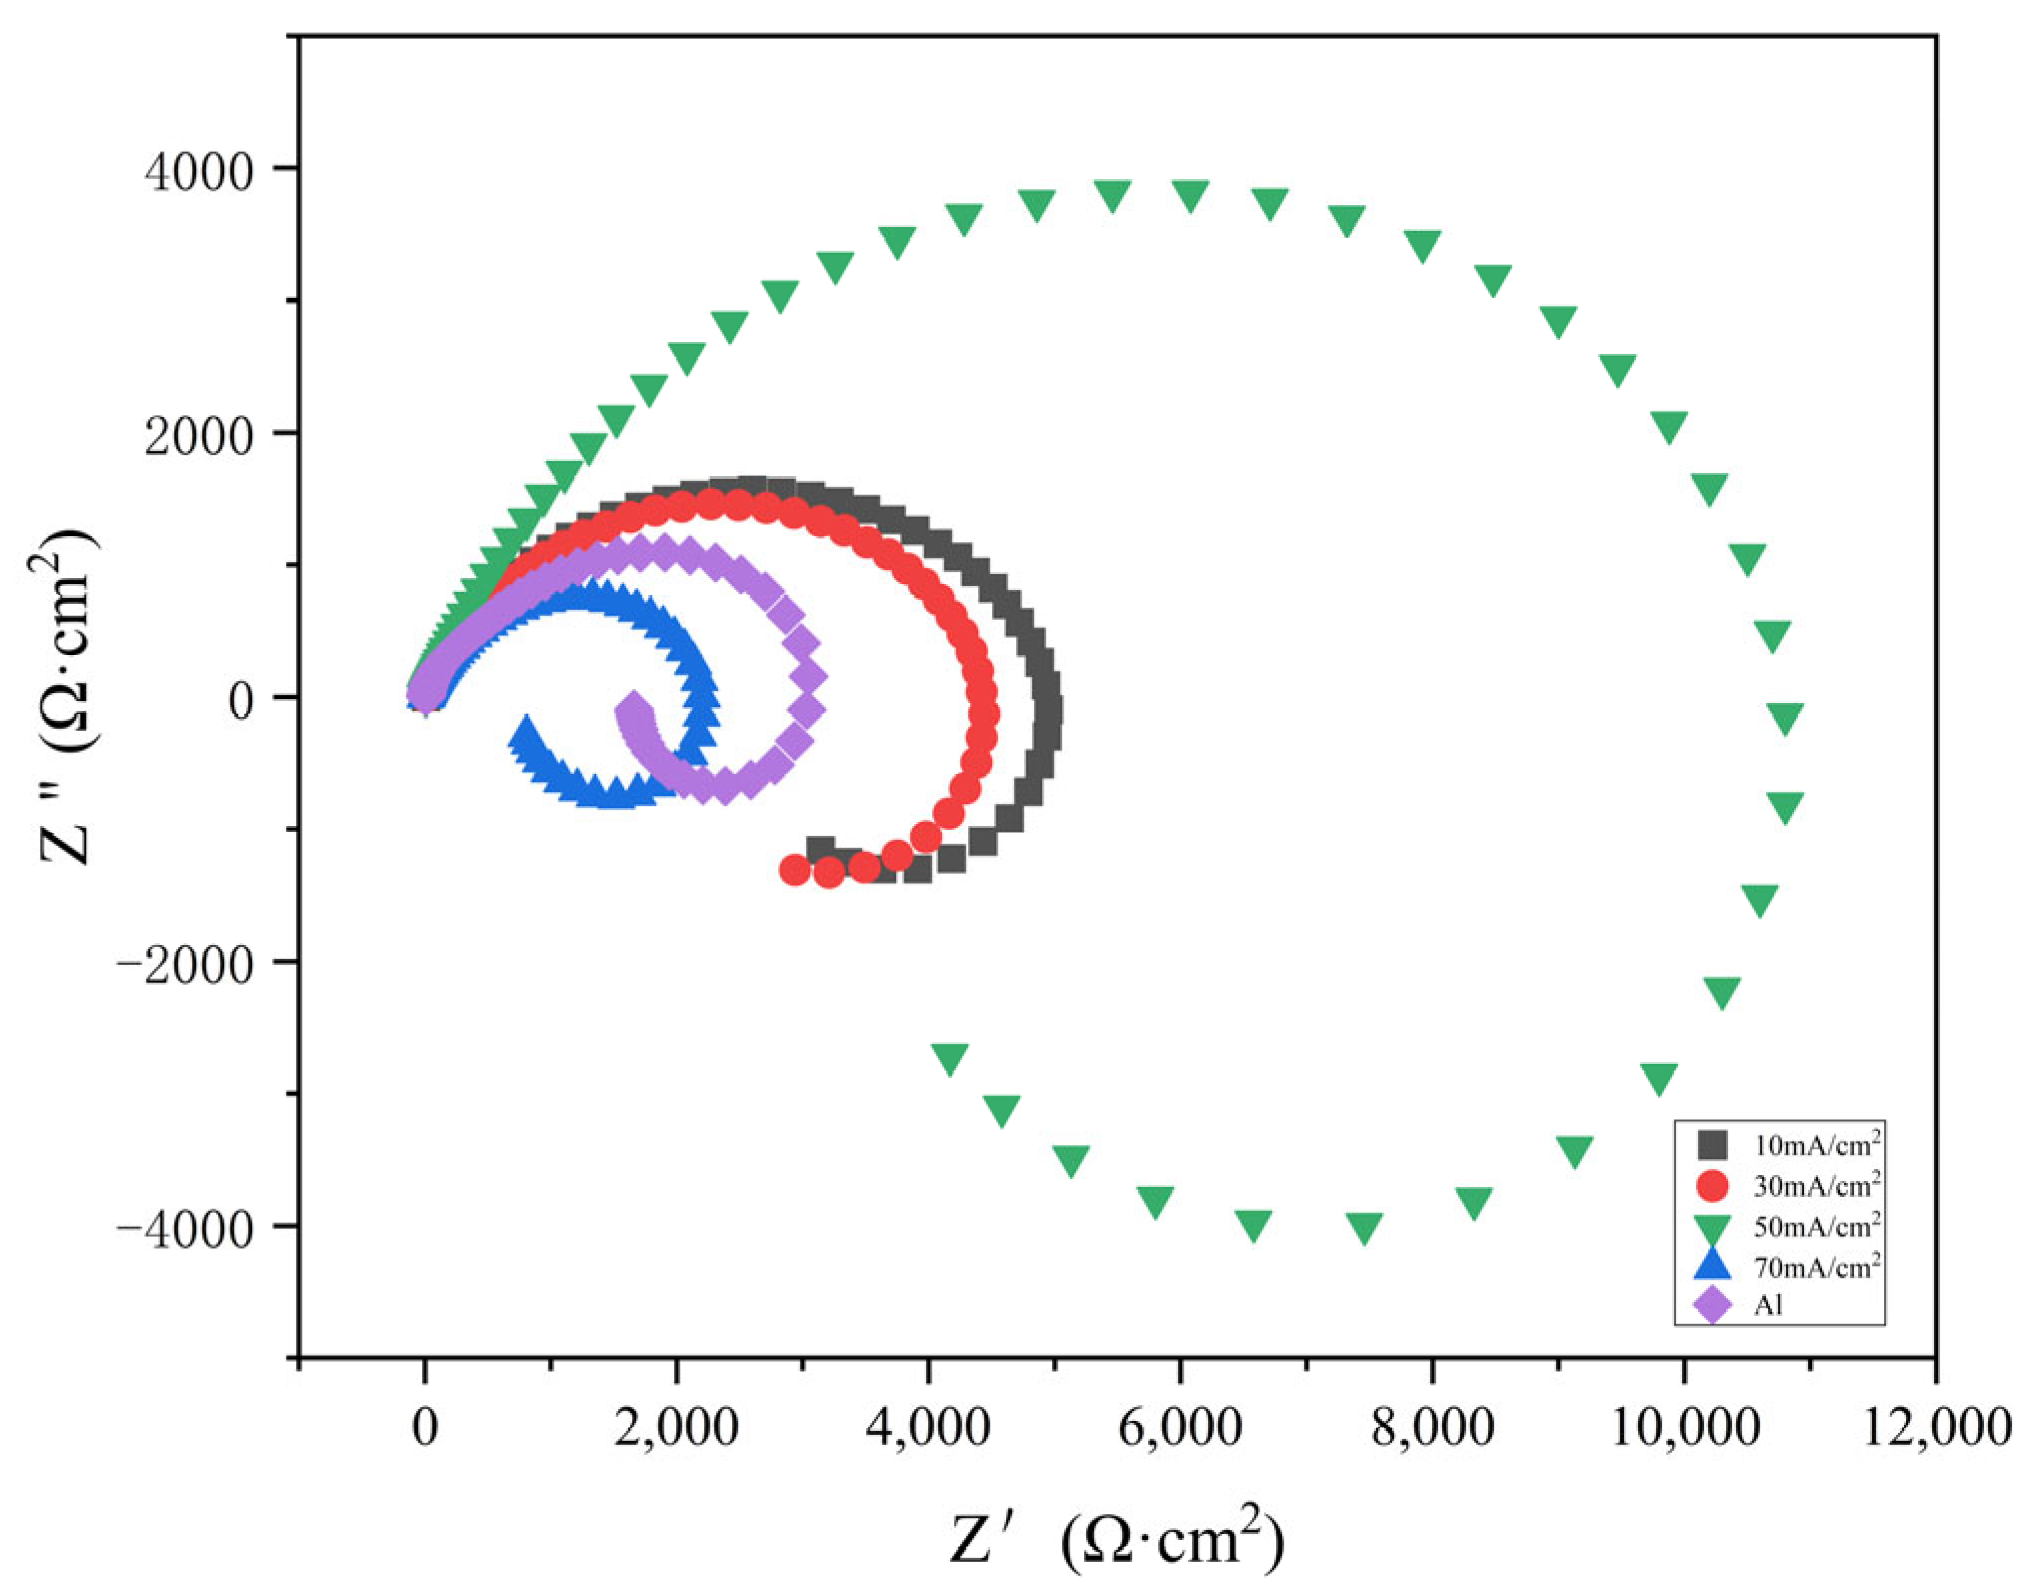
The impedance spectra of Al-SiC composite coatings under different process parameters were explored, and the optimal process parameters were preliminarily determined through fitting analysis. Impedance can to some extent reflect the corrosion resistance of materials. All the tests in this paper were conducted using a 3.5% sodium chloride solution. In the course of this experiment, the Nyquist diagrams for both the composite coating and the pure aluminum coating, assessed at various current densities, were analyzed using equivalent circuits via the ZView software. An equivalent circuit model for the composite, which incorporated solution resistance, charge transfer resistance, constant phase angle components of the double layer, and inductive reactance, was developed. The geometric dimensions of the capacitive reactance arc in the high-frequency region are positively correlated with the corrosion resistance performance. It can be clearly seen from the figure that there is an inductive ring and a capacitive ring. Nyquist diagrams of different current densities show that the loops vary significantly.
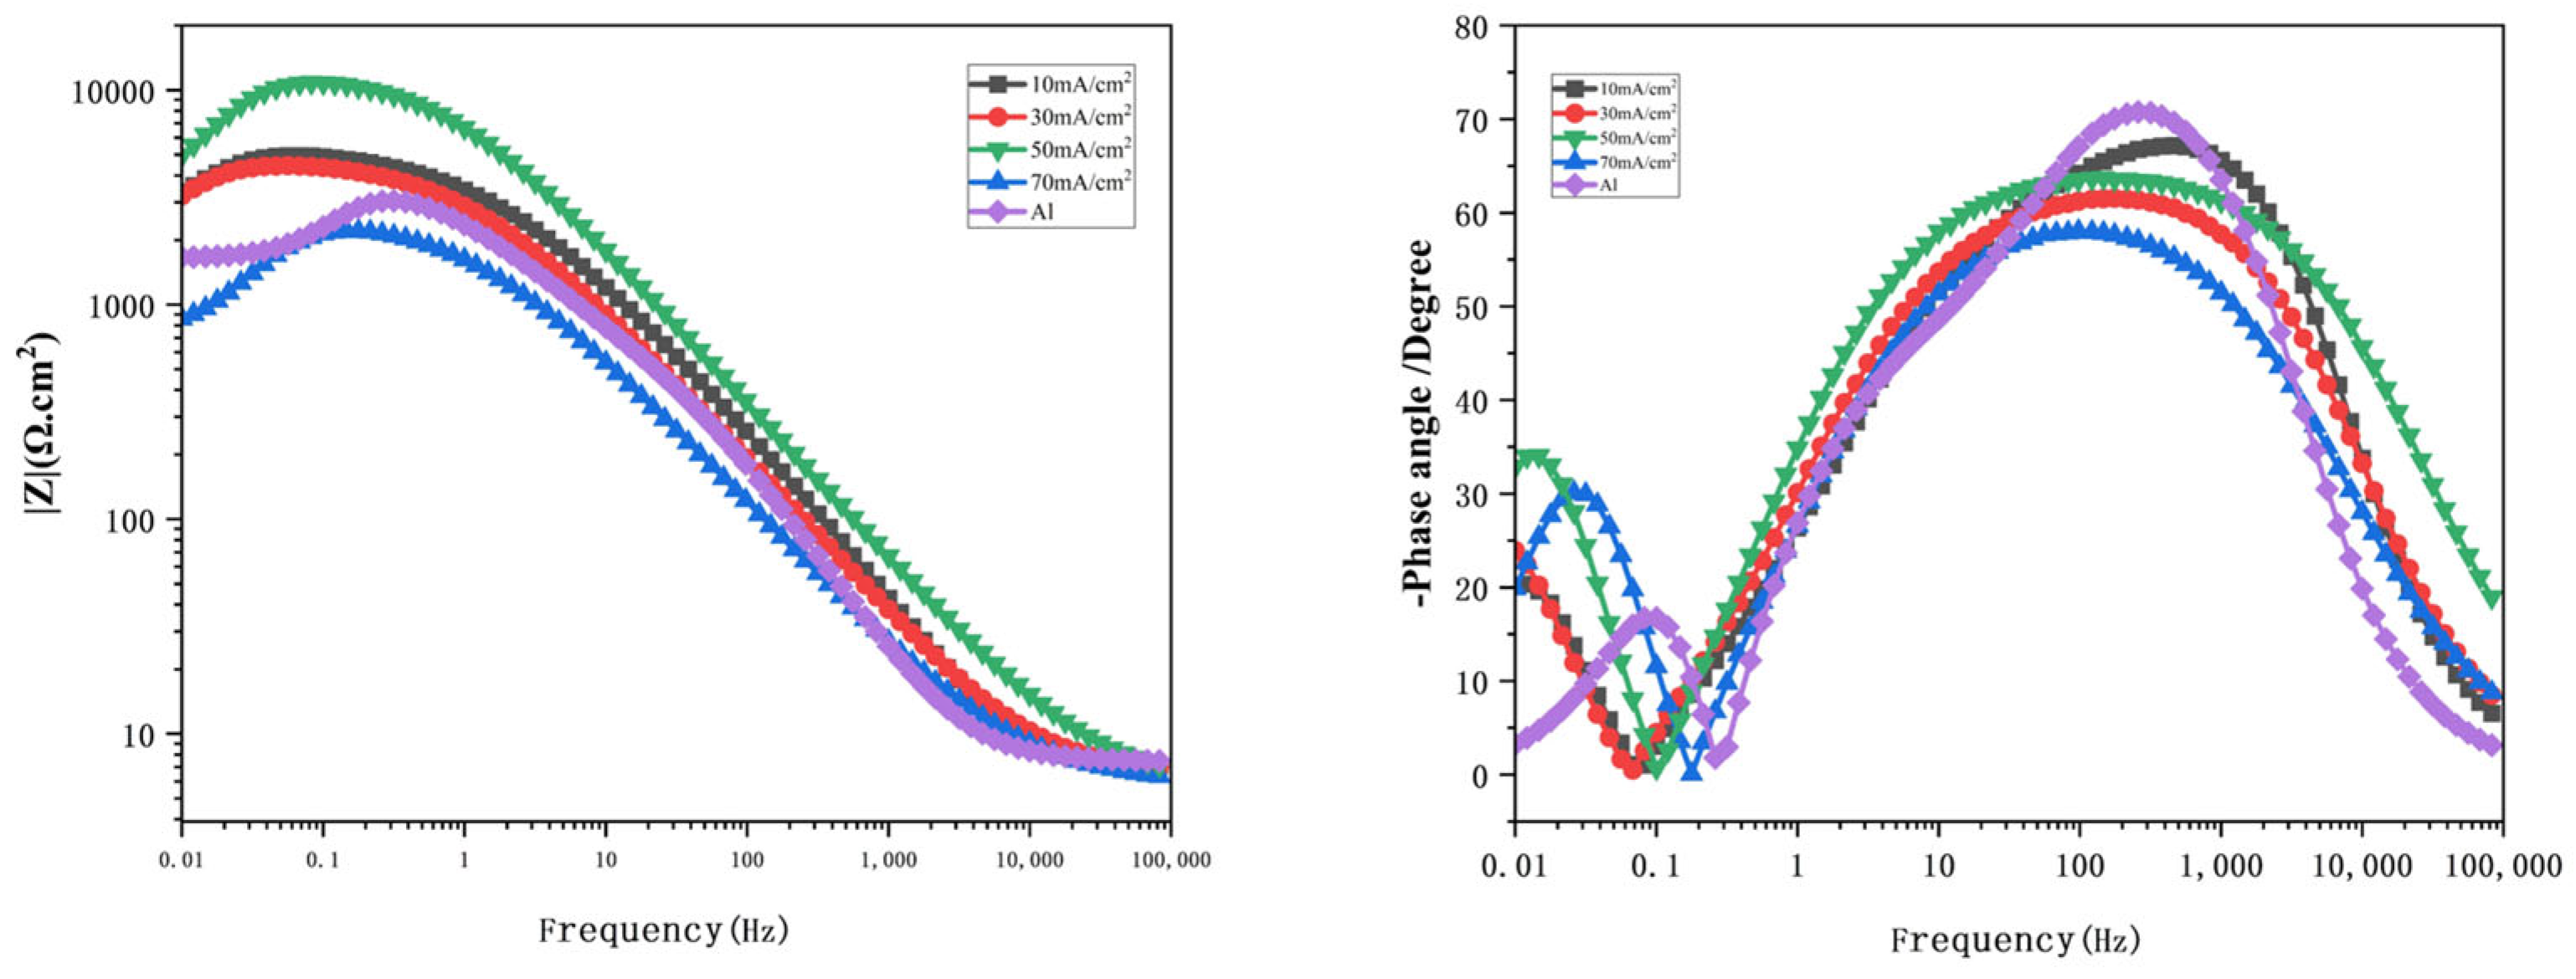
Figure 8 illustrates the Nyquist plots for the Al-SiC composite coating across various current densities. Meanwhile, Figure 9 presents the Bode diagrams of the Al-SiC composite coating at differing current densities. Nyquist diagrams of different current densities show that the loops vary significantly. Among them, when the current density is 50 mA/cm2, the arc of the high-frequency capacitor loop of the Al-SiC composite coating is the largest, indicating that its corrosion resistance is relatively good. Upon reaching a current density of 70 mA/cm2, there is a notable decrease in the corrosion resistance of the coating, falling below that of the pure aluminum coating as illustrated in the figure. This decline occurs because a high current density can adversely affect the surface morphology of the coating, enabling corrosive agents to infiltrate the inner structure of the coating. The corrosion of pure aluminum coatings often begins with the attack of Cl toxic ions on surface defects or weaknesses, and is prone to develop into pitting corrosion. In the Al-SiC composite coating, uniformly dispersed SiC nanoparticles/micro-particles play a key role: Firstly, they act as physical barriers, hindering the diffusion of corrosive media and the propagation of corrosion cracks. Second, it refines the aluminum particles to help form a denser and more stable Al2O3 passivation film. The third is to fill the pores and reduce the density of coating defects. These effects work together to significantly delay the occurrence and development of pitting.
Based on the equivalent circuit diagram related to the Al-SiC coating presented in Figure 7, the fitting data are summarized in Table 3 and Table 4. The Rs values for each coating are relatively low and show minimal variation, suggesting that the solution resistance remains largely consistent across coatings with varying process parameters, and that the tested medium conditions are fairly similar. At a current density of 50 mA/cm2, the charge transfer resistance (Rct) attains its highest value of 11,880 Ω·cm2, signifying that charge transfer poses the greatest challenge. It indicates that charge transfer is the most difficult, and there is a barrier on the surface of the film layer that inhibits charge transfer, which means that the corrosion resistance of the coating is relatively good. The resistance to corrosion exhibited by composite coatings depends on their composition and density. The proportion of particles within the coating influences its corrosion resistance. As the current density ranges from 10 mA/cm2 to 50 mA/cm2, the content of SiC rises, the surface matrix grains on the coating diminish, the density improves, and the distribution of SiC becomes increasingly uniform. Consequently, the corrosion resistance of the coating is enhanced. Nevertheless, when the current density escalates to 70 mA/cm2, the higher current density results in a poorer surface flatness compared to the outcomes observed at 50 mA/cm2. Furthermore, there is a significant reduction in SiC content and the formation of large agglomerations, which ultimately results in a decline in the corrosion resistance of the coating at 70 mA/cm2.
In order to thoroughly investigate how process parameters affect the corrosion resistance of Al-SiC composite coatings, this research conducted a systematic analysis of the electrochemical behavior of samples immersed in a 3.5 wt% NaCl solution, employing the potentiodynamic polarization test method. The potentiodynamic polarization curve serves primarily to evaluate the self-corrosion potential, self-corrosion current density, and the passivation characteristics of the samples. The self-corrosion potential indicates the thermodynamic stability of the material within the solution, while the self-corrosion current density provides insights into the kinetic aspects of the corrosion rate. Furthermore, the passivation behavior reveals whether the material develops a protective passivation film and assesses its stability. This polarization curve is divided into two main sections: the cathodic region and the anodic region. In the cathodic area, reduction reactions take place. As the potential decreases, the driving force for the reduction reaction rises, leading to a surge in cathodic current density and a faster reaction rate. Conversely, in the anodic region, oxidation reactions occur. As the potential increases, the current density progressively elevates, resulting in a higher corrosion rate and observable active dissolution behavior.
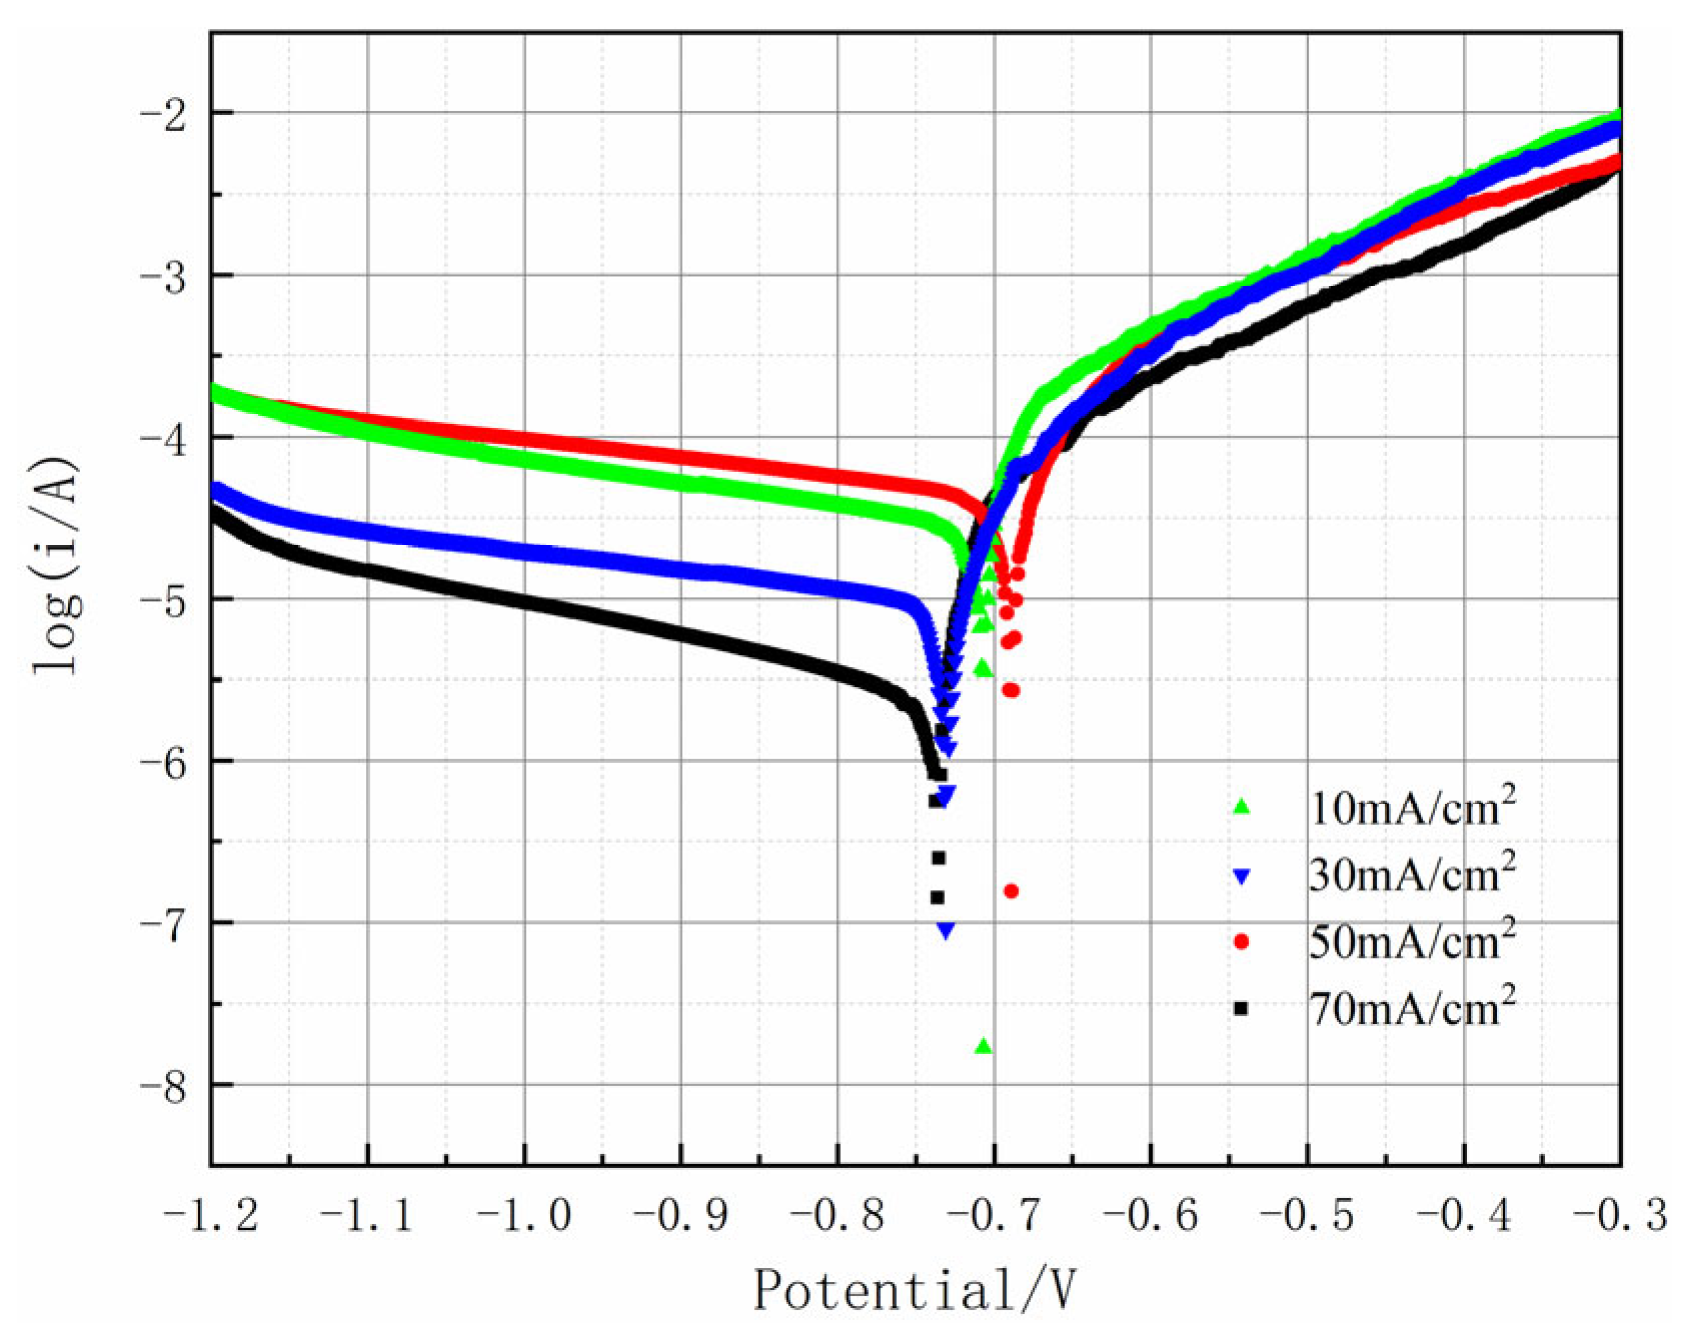
This study analyzed its electrochemical behavior in 3.5 wt% NaCl solution through potentiodynamic polarization testing (Figure 10 and Table 5). The results show that with the increase in current density, the corrosion resistance of the coating first enhances and then weakens. 50 mA/cm2 is the critical value. At this time, the corrosion potential is −0.692 V, the corrosion current density is the lowest (4.762 × 10⁻⁶ A/cm2), and the corrosion resistance is the preferable. Under this condition, the acceleration of electrochemical reaction kinetics promotes the effective adsorption and co-deposition of SiC particles, increasing the nucleation points of the coating and making the structure denser. The densification and particle synergy inhibit the penetration of corrosive media (the self-corrosion current density is as low as 1.2 × 10⁻⁷ A/cm2), and when the current density exceeds the critical value, the deposition rate of aluminum ions far exceeds that of SiC. This leads to the appearance of micro-pores and cracks in the coating, and a decline in protective performance.

3.6.2. The Influence of Temperature on Corrosion Resistance Performance

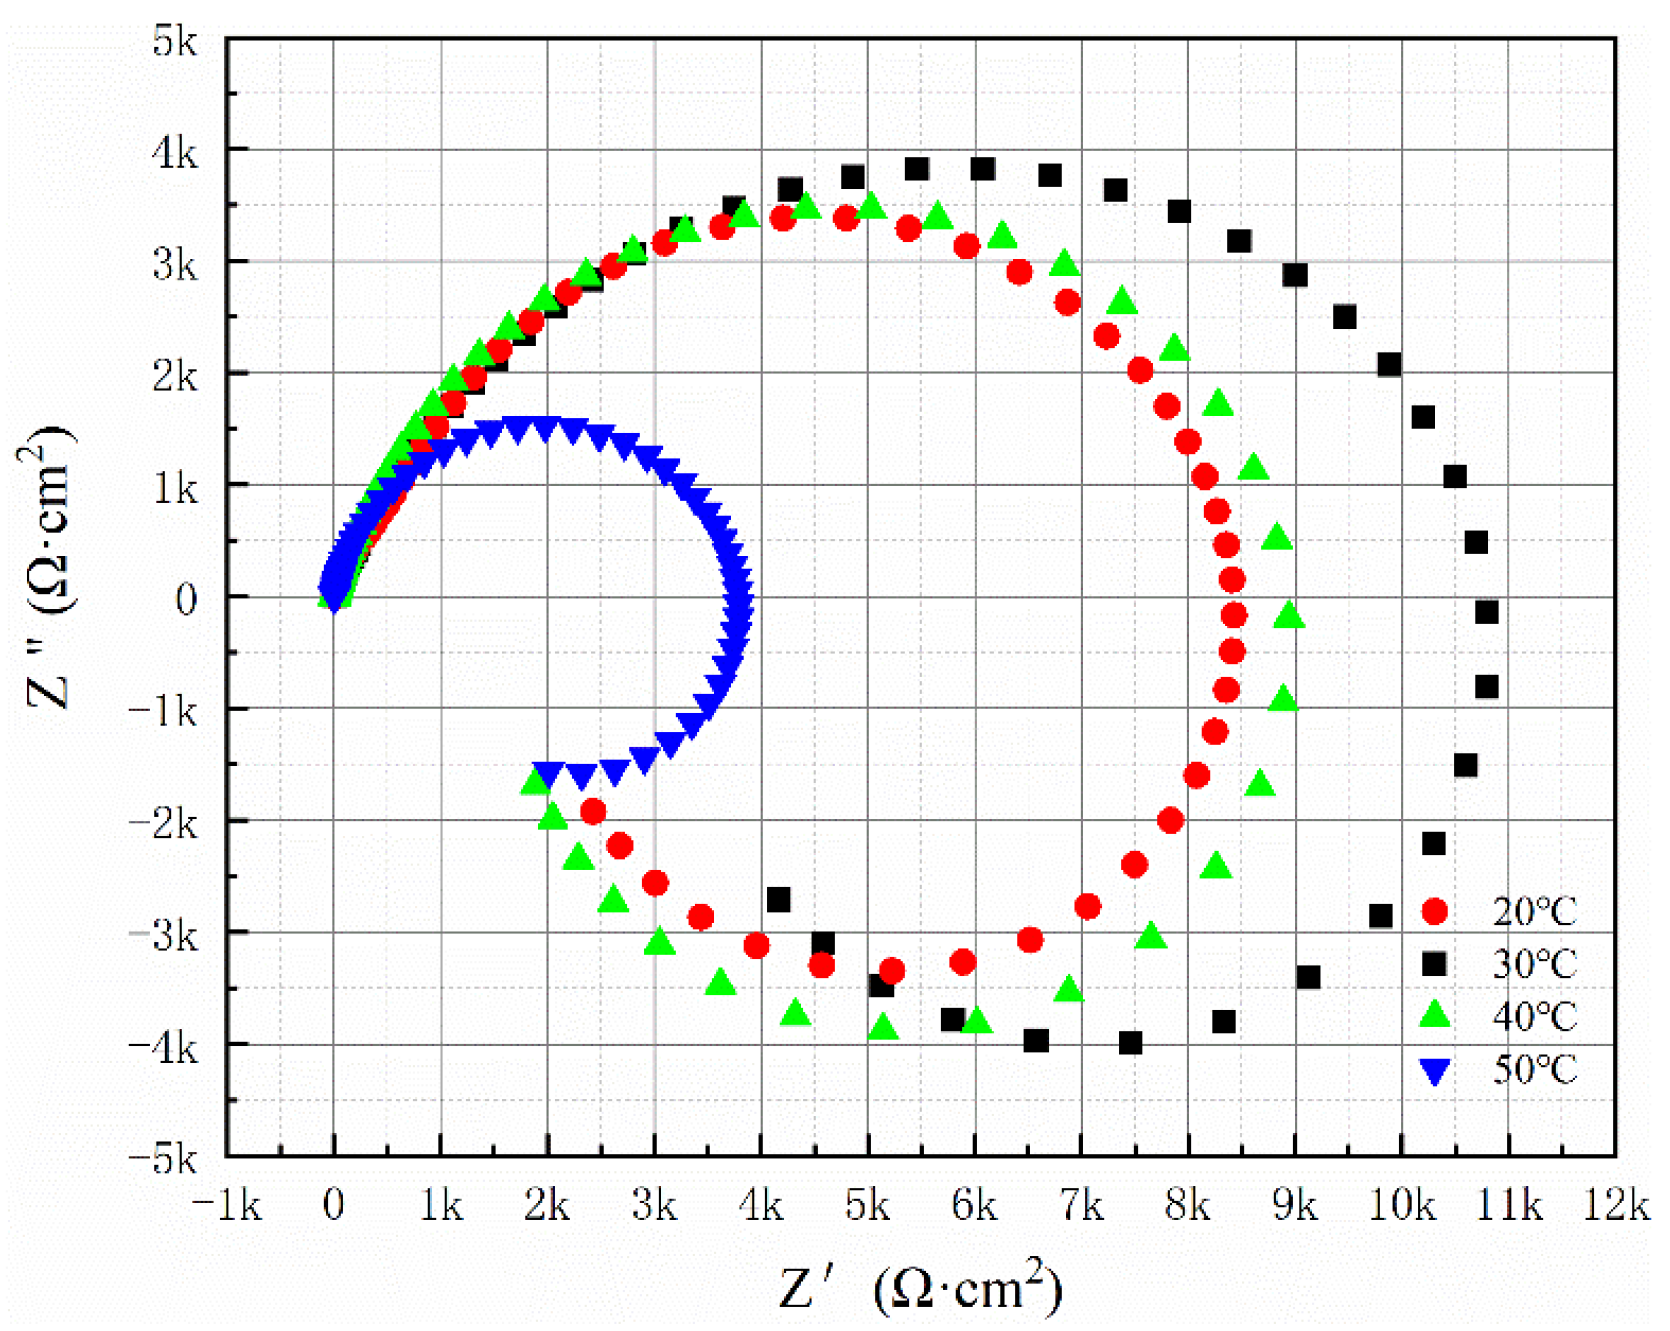
The Nyquist spectrum illustrated in Figure 11 reveals that with an increase in temperature from 20 °C to 50 °C, the radius of the capacitive reactance arc initially grows before subsequently decreasing. The maximum arc occurs at a temperature of 30 °C. According to Table 6, the Rct value reaches its peak at this temperature. Figure 12 presents the Bode diagrams for the Al-SiC composite coating across varying temperatures. The overall findings from the experiments indicate that the Al-SiC composite coating produced at 30 °C exhibits the best corrosion resistance.
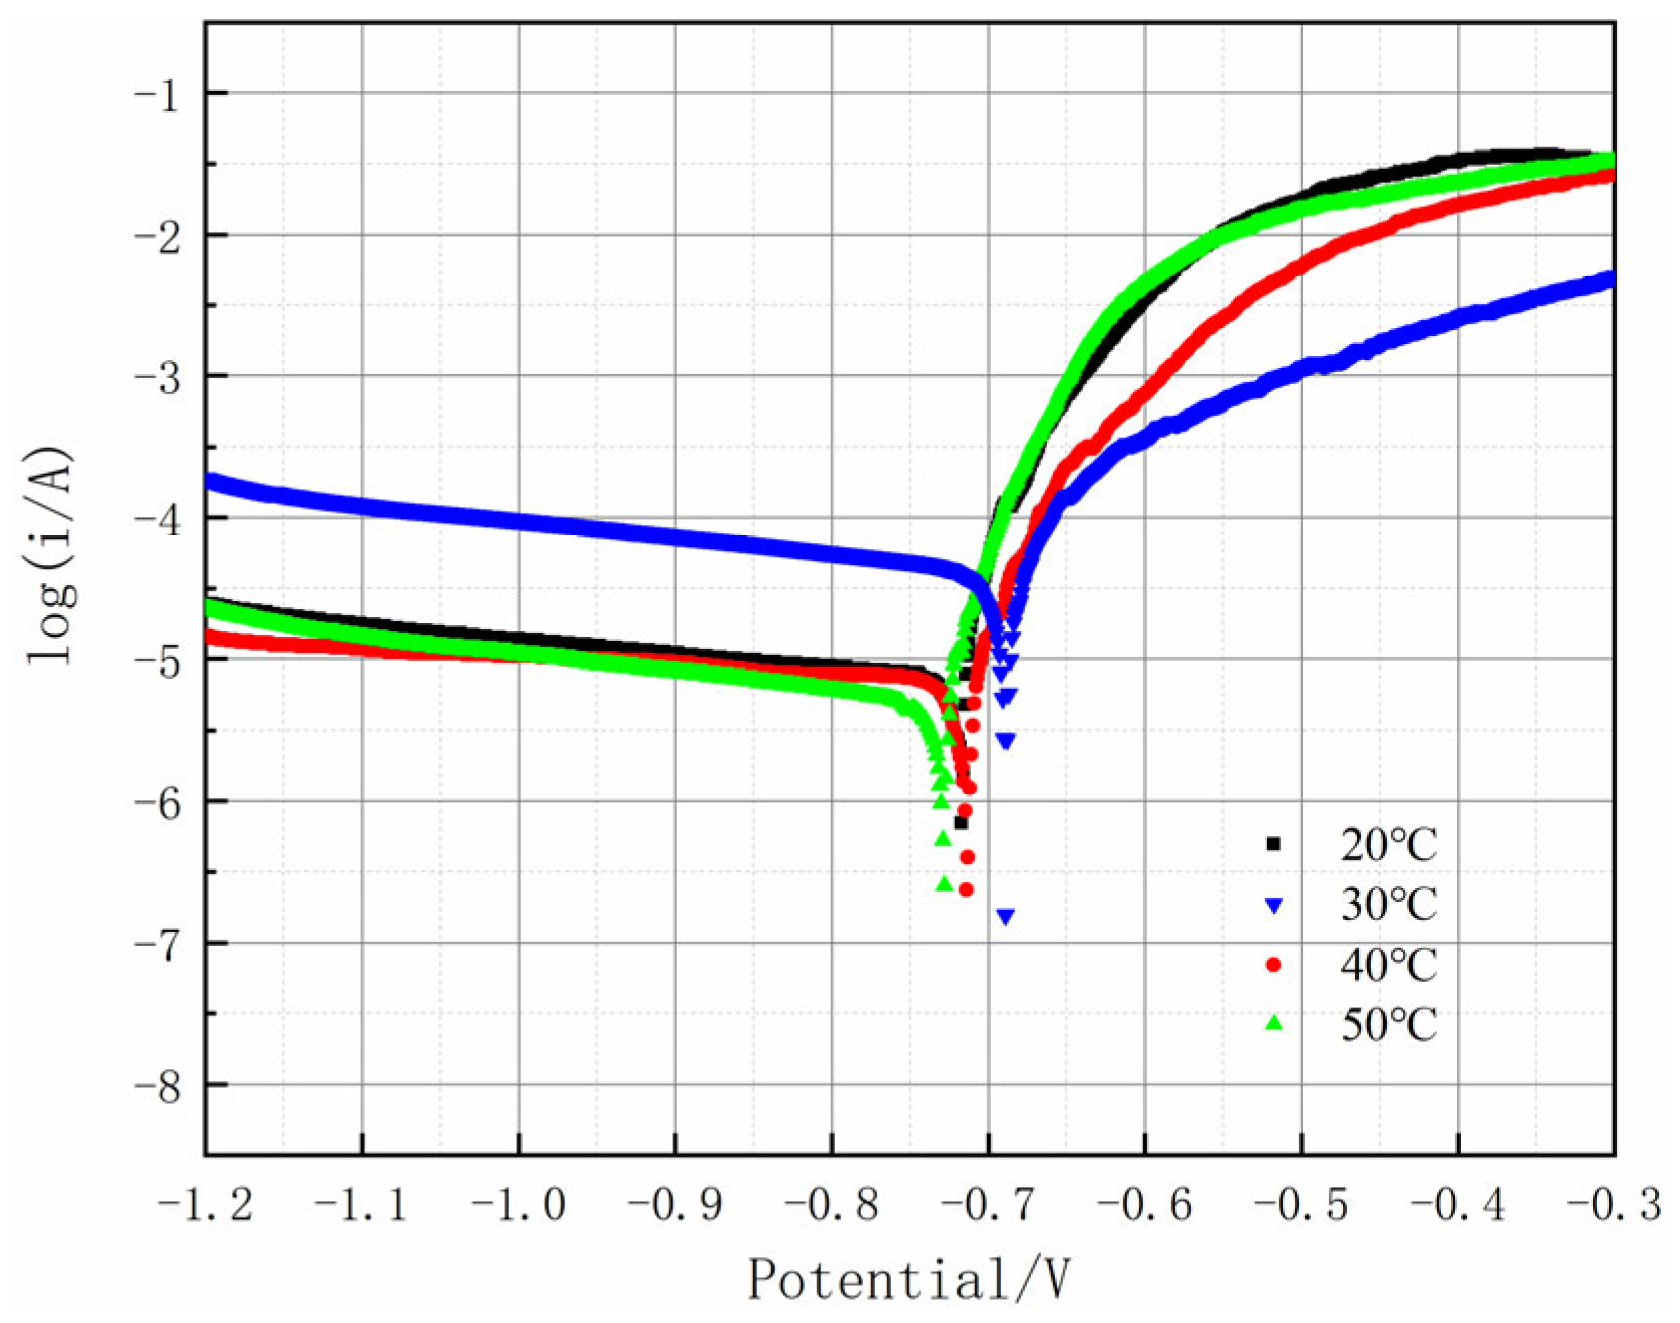
Figure 13 shows the potentiodynamic polarization curves of the Al-SiC composite coating at different temperatures. Table 7 shows the Tafel extrapolation fitting parameters for the corresponding Al-SiC composite coating. It can be concluded from Figure 13 and Table 7 that at 20 °C, the corrosion potential of the Al-SiC composite coating is relatively negative, approximately −0.717 V, and the corrosion current density is relatively high, reaching approximately 1.969 × 10⁻⁵ mA/cm2. This indicates that the corrosion activity of the coating is strong at this temperature. When the temperature rises to 30 °C, the corrosion potential shifts positively to approximately −0.692 V, and the corrosion current density drops significantly to about 4.762 × 10⁻⁶ mA/cm2. At this temperature, the density of current in the passivation region is notably minimal, suggesting that a fairly stable passivation layer has developed on the surface, effectively preventing the corrosion process. At A temperature of 50 °C, the corrosion potential (Ecorr) shifts negatively to approximately −0.728 V, and the corrosion current density rebounds to about 4.66 × 10⁻⁵ A/cm2. The protective performance of the passivation film has declined, thereby intensifying the corrosion. Therefore, the Al-SiC composite coating prepared under the conditions of a current density of 50 mA/cm2 and a plating solution temperature of 30 °C has the preferable corrosion resistance.
A suitable rise in temperature will promote the migration rate of ions within the plating solution, facilitating a higher quantity of SiC in the coating. Concurrently, this elevation in temperature will improve the dispersion of SiC particles, which is advantageous for diminishing the occurrence of cracks and defects in the coating. Furthermore, it will enhance the coating’s density, limit the infiltration of corrosive agents, lower the corrosion current density, and advance the corrosion potential. This has notably improved the corrosion resistance of the composite coating. Nevertheless, if the temperature escalates to 40 °C or 50 °C, the excessively high temperature may impair the adhesion of particles within the coating. Consequently, some particles may detach during the deposition process, resulting in a decreased particle content in the coating.
Therefore, the Al-SiC composite coating prepared under the conditions of a current density of 50 mA/cm2 and a plating solution temperature of 30 °C has good corrosion resistance.

3.6.3. The Influence of SiC Addition on Corrosion Resistance Performance

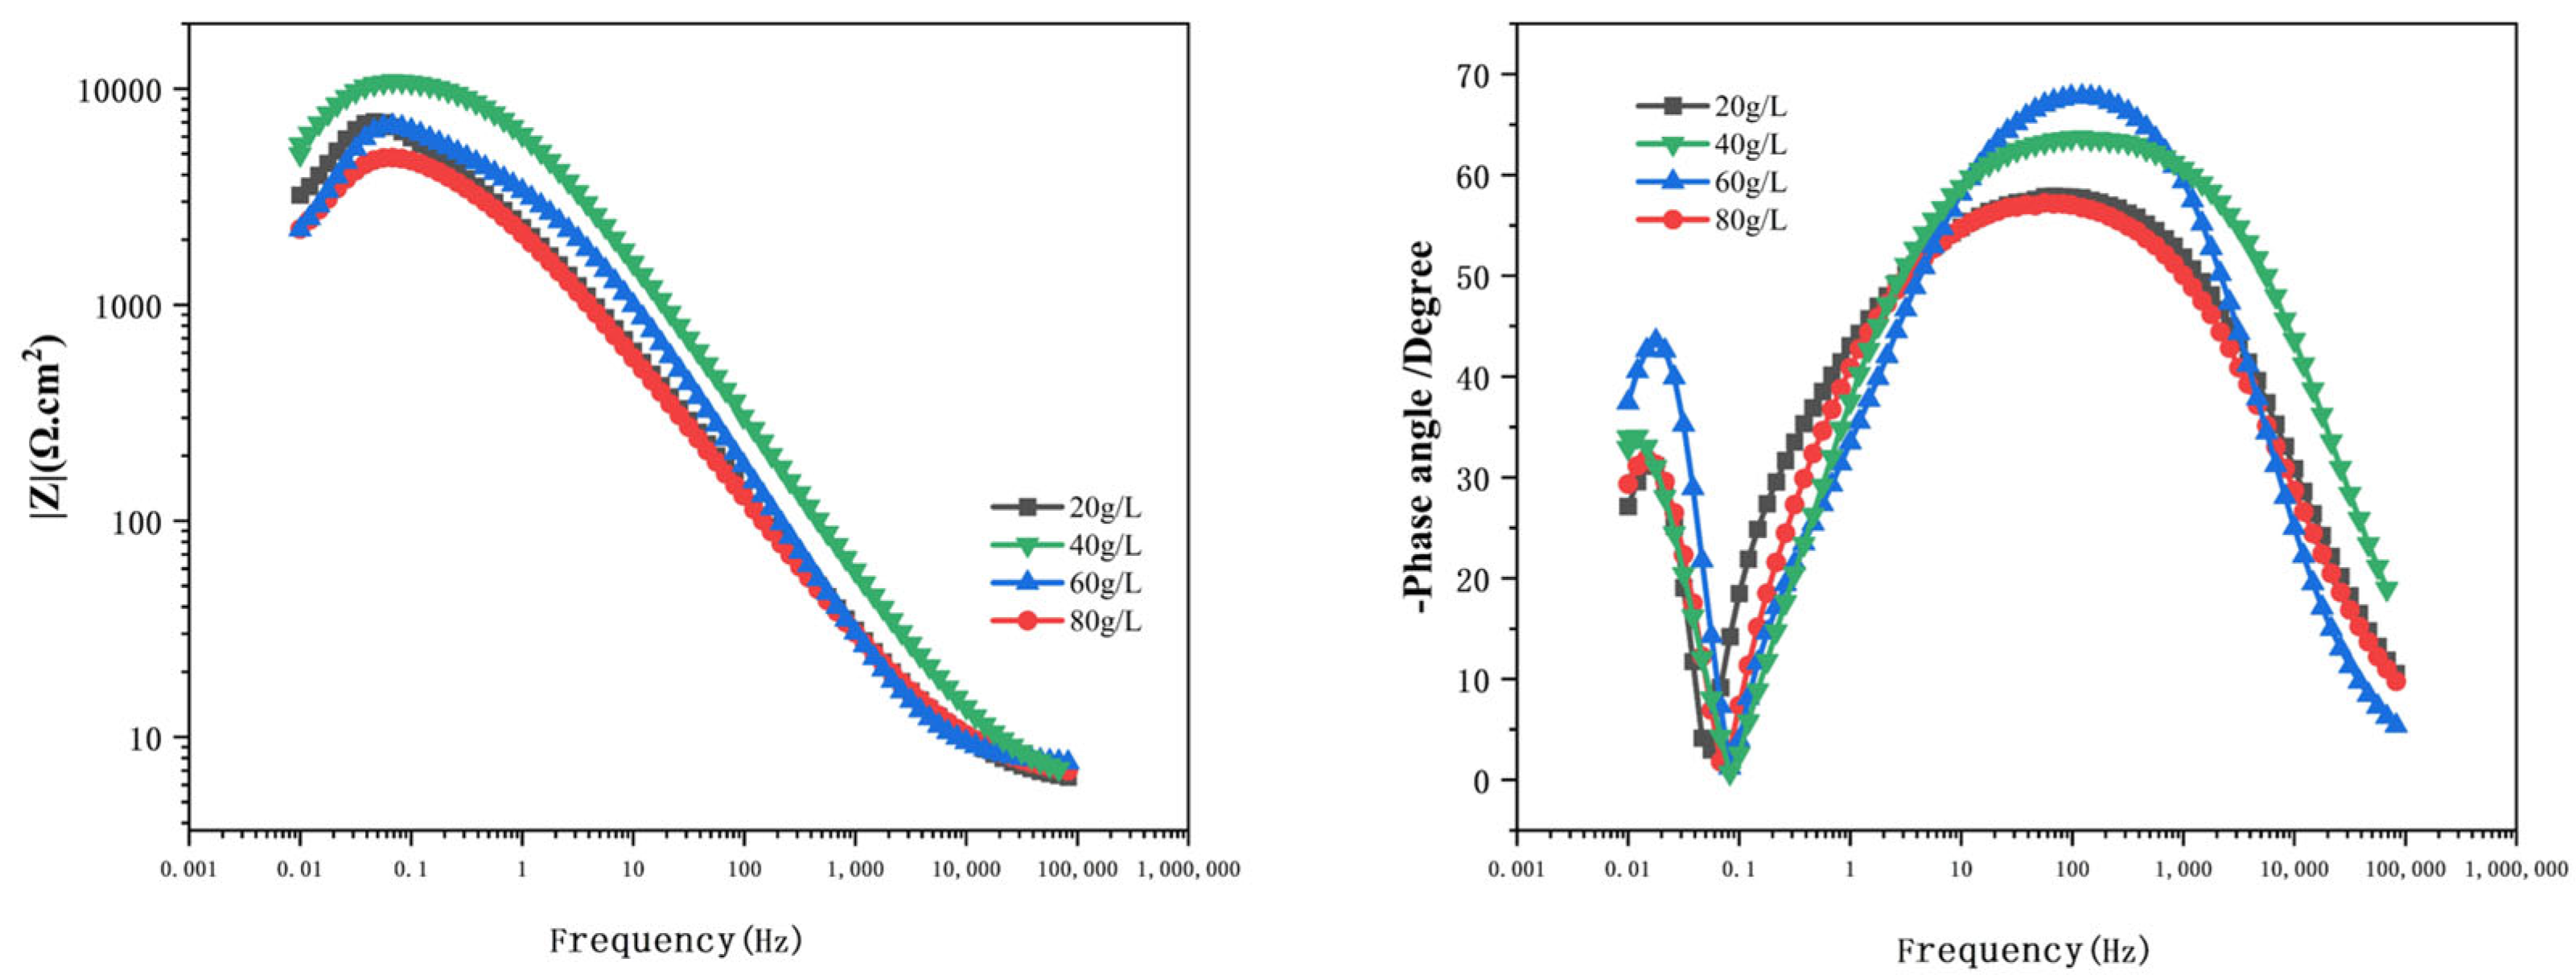
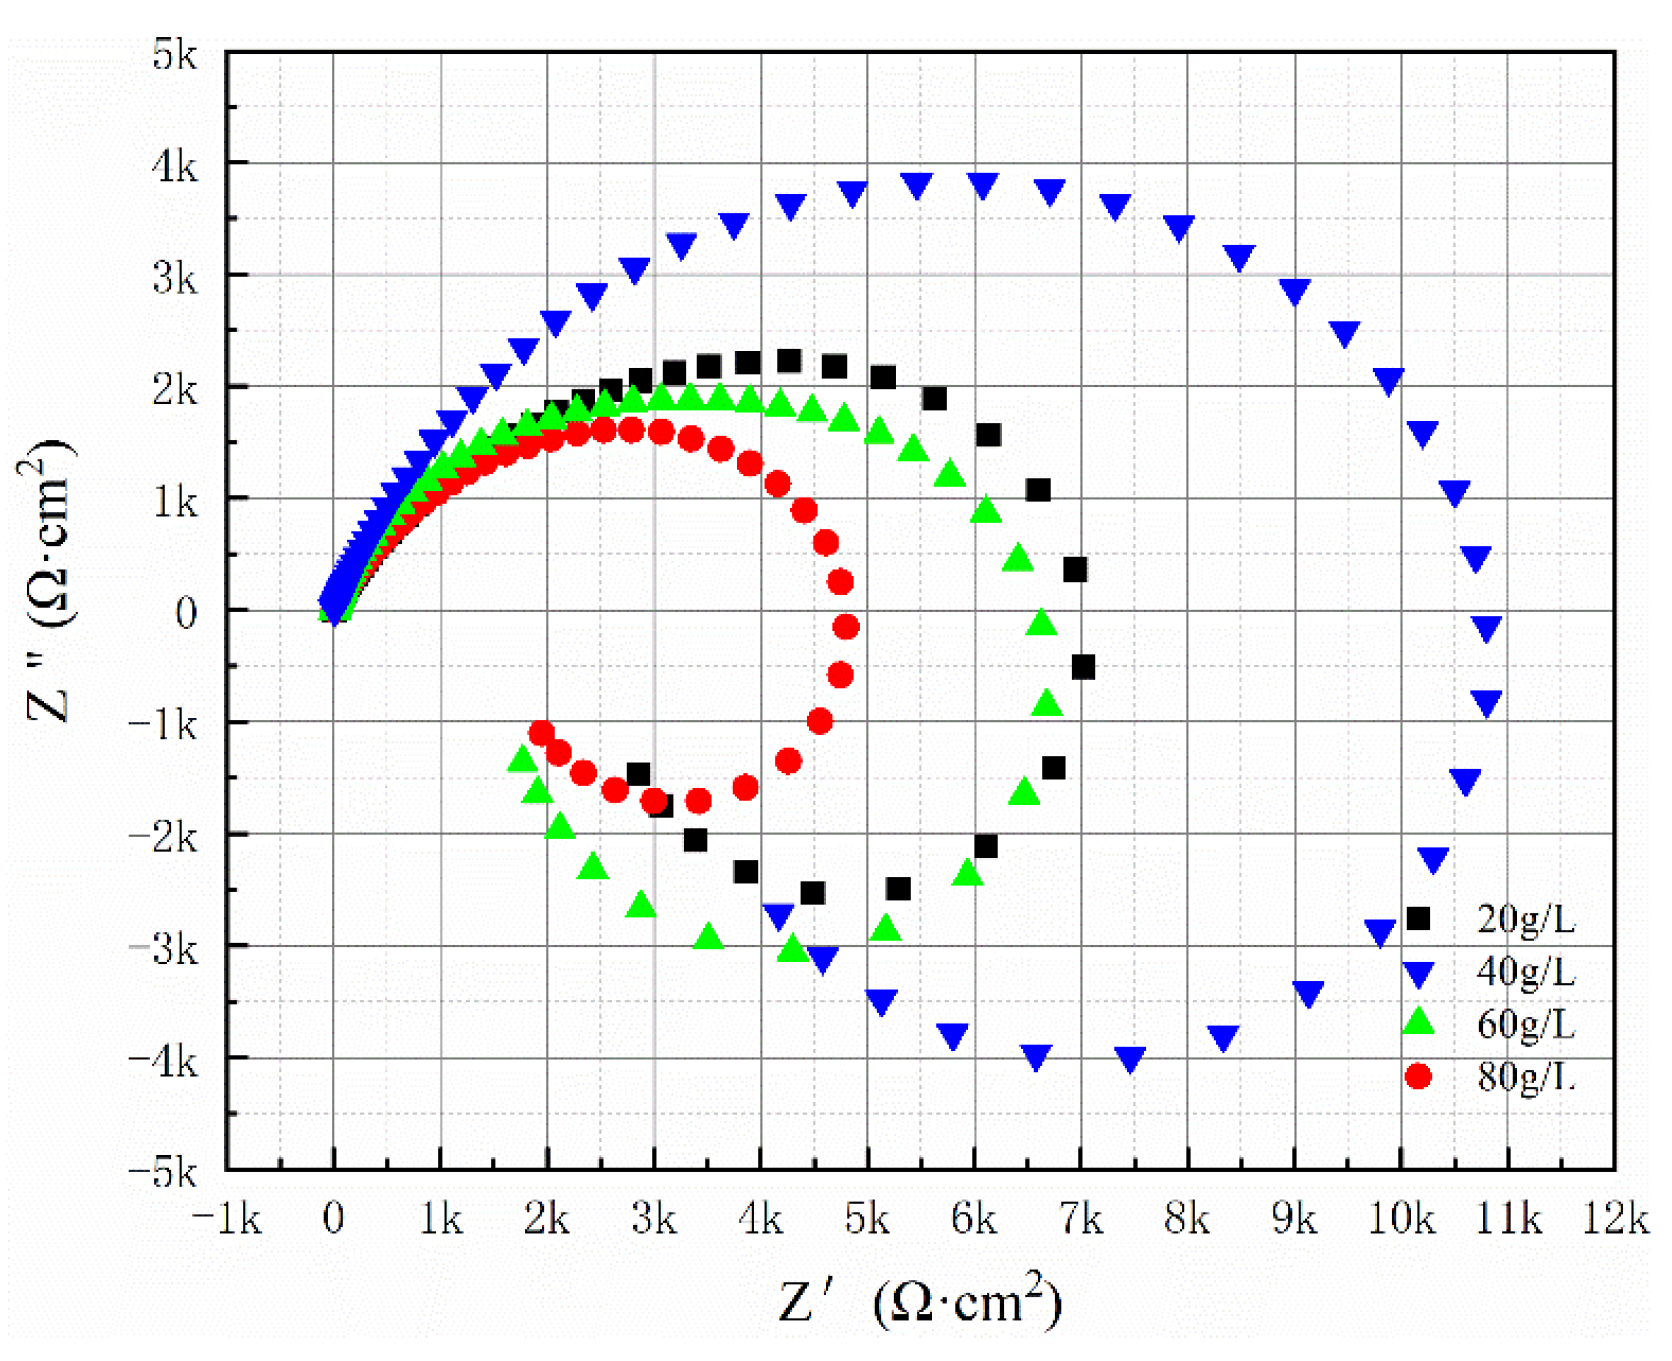
The Nyquist spectrum presented in Figure 14 demonstrates that increasing the SiC concentration from 20 g/L to 80 g/L initially leads to an expansion of the capacitive reactance arc, followed by a reduction. The maximum capacitance arc is observed when the SiC concentration reaches 40 g/L. Table 8 displays the equivalent circuit fitting data for the composite coating at various SiC concentrations. Additionally, Figure 15 illustrates the Bode plots for the Al-SiC composite coating with different SiC amounts. At 40 g/L of SiC, the Rct value attains its peak. The comprehensive experimental results show that the Al-SiC composite coating obtained under the process condition of 40 g/L has good corrosion resistance.
Figure 16 and Table 9 show: When the corrosion potential exceeded −0.4 V, the coatings with different SiC concentrations all showed typical passivation characteristics. The anodic dissolution rate decreased significantly with the forward migration of the potential, indicating that a stable protective film was formed on the surface. When the SiC concentration increased from 20 g/L to 40 g/L, the corrosion potential shifted forward to the peak of −0.692 V. The corrosion current density was reduced to the minimum of 4.762 × 10⁻⁶ mA/cm2, and the coating density was the preferable. Interfacial corrosion was effectively suppressed. As the concentration of SiC surpassed 40 g/L, a noticeable shift in the corrosion potential occurred in the negative direction, accompanied by a significant rise in the corrosion current density with the increase in concentration. This suggests that when the quantity of SiC particles added exceeds a specific threshold, it could compromise the coating’s integrity, thus hastening the localized corrosion process. Increasing the amount of SiC added to the coating can effectively enhance its resistance to corrosion. This enhancement occurs because a higher concentration of SiC promotes the formation of more nucleation sites within the coating, aiding in the development of a denser and more complete composite layer. As the concentration of SiC particles grows from 20 g/L to 40 g/L, there is an increase in SiC content within the coating, leading to better dispersion, uniform distribution of particles across the surface, smaller matrix grains, a more compact arrangement, and an overall denser structure. Consequently, the coating exhibits improved corrosion resistance. However, at SiC concentrations of 60 g/L and 80 g/L, the substrate’s load-bearing capacity becomes constrained. Although the SiC content in the coating shows a slight increase, it is not substantial. At these higher concentrations, SiC tends to agglomerate and become embedded on the coating’s surface, ultimately compromising the corrosion resistance of the composite coating.
3.7. Hardness of Al-SiC Composite Coatings

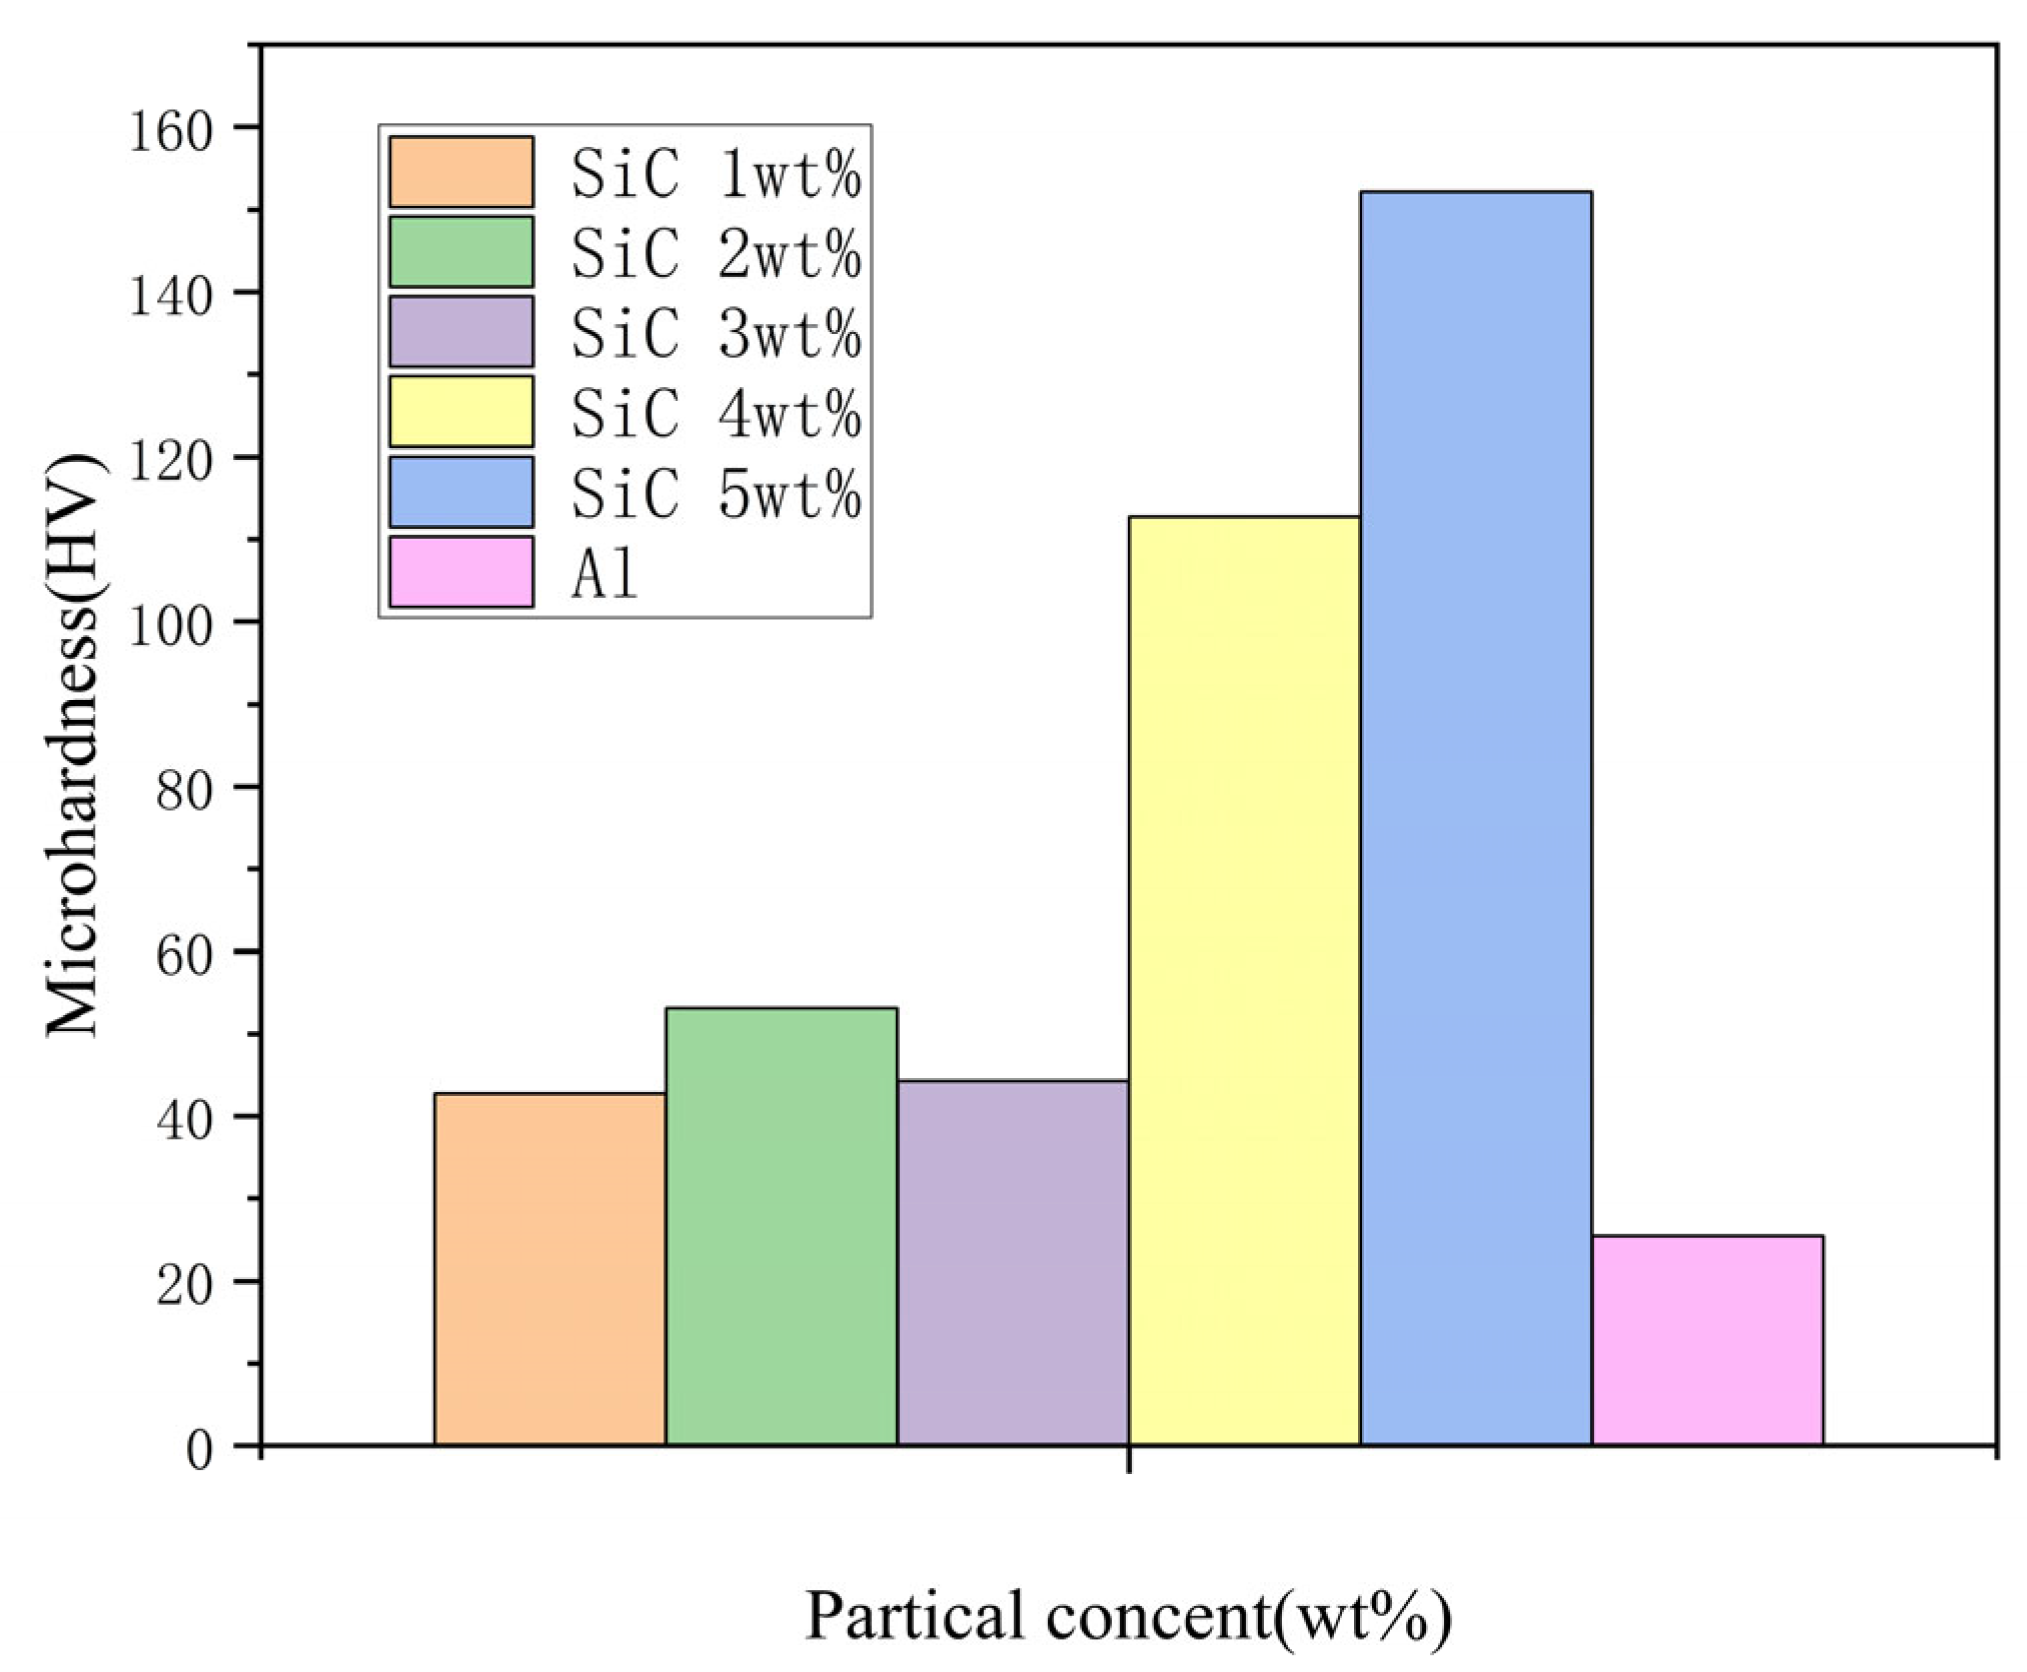
Figure 17 illustrates the comparative hardness of the composite coating. The diagram reveals that the hardness of the pure aluminum coating is recorded at 25.49 HV. As the SiC content increases to 1 wt%, the coating’s hardness rises to 42.19 HV, peaking at 152.1 HV with 5 wt% SiC. This indicates that incorporating SiC particles leads to a noticeable enhancement in the hardness of the composite coating compared to the pure aluminum variant. When the SiC content exceeds 3 wt%, a substantial increase in hardness is observed. Specifically, at 5 wt% SiC, the coating exhibits a hardness approximately six times greater than that of the pure aluminum coating, which lacks SiC particles. This enhancement is attributable to the strong reinforcing effect of SiC particles in the composite coating, and as the concentration of these particles increases, the benefits of fine grain strengthening become increasingly pronounced.
4. Conclusions

By constructing the optimization system of electrodeposition process parameters, the surface morphology and performance changes in Al-SiC composite coatings prepared in organic solvent system were systematically investigated. The experimental results are as follows.
  • In this study, the ideal process parameters are determined to be as follows: a current density of 50 mA/cm2, a plating solution temperature of 30 °C, and SiC particle addition of 40 g/L. When these parameters are applied, the surface of the resulting composite coating is consistent and compact, free of holes or cracks, with SiC particles distributed uniformly and densely throughout the coating. The morphology of the composite coating surface is optimal. According to the comprehensive findings from electrochemical analyses, the corrosion resistance of the Al-SiC composite coating created under these optimal conditions exhibits a significant enhancement.
  • Investigations into the hardness characteristics of composite coatings containing varying amounts of SiC particles reveal that, within the examined range, the hardness remains relatively stable when the SiC content is below 3 wt%. Conversely, a notable increase in hardness occurs when the SiC particle concentration exceeds 4 wt%. Specifically, at a SiC content of 5%, the coating hardness can reach up to 152.1 HV.

Author Contributions

Supervision, H.K.; Data curation, Investigation, Writing—original draft, L.Q.; Investigation, writing—original draft preparation, J.W. All authors have read and agreed to the published version of the manuscript.

Funding

The authors would like to acknowledge the Applied Basic Research Program of Liaoning Provincial Department of Science and Technology of China (Grant Number: 2025JH2/101300035).

Institutional Review Board Statement

Not applicable.

Informed Consent Statement

Not applicable.

Data Availability Statement

All data that support the findings of this study are included within the article.

Conflicts of Interest

The authors declare no conflicts of interest.

References

  1. Abuhasel, K.A.; Ibrahim, M.F.; Elgallad, E.M.; Samuel, F.H. On the impact toughness of Al–Si cast alloys. Mater. Des. 2016, 91, 388–397. [Google Scholar] [CrossRef]
  2. Chang, S.Y.; Tsao, L.C.; Li, T.Y.; Chuang, T.H. Joining 6061 aluminum alloy with Al–Si–Cu filler metals. J. Alloys Compd. 2009, 488, 174–180. [Google Scholar] [CrossRef]
  3. Kan, H.M.; Wang, W.X.; Kong, L.M.; Wu, J. Preparation of aluminum-tin alloy by electrodeposition in low-temperature molten salt system. J. Cent. South Univ. 2024, 31, 783–795. [Google Scholar] [CrossRef]
  4. Rosales, I.; Gonzalez-Rodriguez, G.; Gama, J.L.; Guardian, R. Bismuth effect on the mechanical properties of antifriction Al-Sn alloys. Mater. Sci. Appl. 2014, 5, 330–337. [Google Scholar] [CrossRef]
  5. Sethuram, D.; Koppad, P.G.; Shetty, H.; Alipour, M.; Kord, S. Characterization of graphene reinforced Al-Sn nanocomposite produced by mechanical alloying and vacuum hot pressing. Mater. Today Proc. 2018, 5, 24505–24514. [Google Scholar] [CrossRef]
  6. Zhao, W.; Liu, N.; Rong, J.; Lei, E.; Zhao, D. Nanoporous surface modifications through dealloying of Al–Ti alloy. Adv. Eng. Mater. 2017, 19, 1600866. [Google Scholar] [CrossRef]
  7. Nair, A.; Bizoń, W.; Skoczypiec, S.; M, U. Experimental investigations on electro erosion milling of Al-SiC metal-matrix composite. Mater. Manuf. Process. 2024, 39, 480–493. [Google Scholar] [CrossRef]
  8. Habba, M.I.; Barakat, W.S.; Elnekhaily, S.A.; Hamid, F.S. Microstructure and tribological behavior of Al–TiC composite strips fabricated by a Multi-Step densification method. Sci. Rep. 2024, 14, 20767. [Google Scholar] [CrossRef] [PubMed]
  9. Kim, M.; Perez-Andrade, L.; Brewer, L.N.; Kubacki, G.W. Structure and deposition characteristics of cold-sprayed AA5083 and Al-Mg binary alloys using gas-atomized Al-Mg powders. J. Therm. Spray Technol. 2023, 32, 2729–2746. [Google Scholar] [CrossRef]
  10. Jung, J.-G.; Cho, Y.-H.; Kim, S.-D.; Kim, S.-B.; Lee, S.-H.; Song, K.; Euh, K.; Lee, J.-M. Mechanism of ultrasound-induced microstructure modification in Al–Zr alloys. Acta Mater. 2020, 199, 73–84. [Google Scholar] [CrossRef]
  11. Song, Z.; Niu, R.; Cui, X.; Bobruk, E.V.; Murashkin, M.Y.; Enikeev, N.A.; Gu, J.; Song, M.; Bhatia, V.; Ringer, S.P.; et al. Mechanism of room-temperature superplasticity in ultrafine-grained Al–Zn alloys. Acta Mater. 2023, 246, 118671. [Google Scholar] [CrossRef]
  12. Qin, J.; Gao, T.; Ma, X.; Wang, J.; Liu, X. Different evolution behaviors of NAl4 and PAl4 clusters in liquid Al-N and Al-P alloys. Comput. Mater. Sci. 2021, 196, 110534. [Google Scholar] [CrossRef]
  13. Ozdemir, F.U.R.K.A.N.; Witharamage, C.S.; Christudasjustus, J.; Darwish, A.A.; Okuyucu, H.A.S.A.N.; Gupta, R.K. Corrosion behavior of a bulk nanocrystalline Al-Fe alloy. Corros. Sci. 2022, 209, 110727. [Google Scholar] [CrossRef]
  14. Chiu, P.H.; Nesterenko, V.F. Processing and mechanical properties of novel Al-W composites with ordered mesostructure. J. Compos. Mater. 2016, 50, 4015–4022. [Google Scholar] [CrossRef]
  15. Rusin, N.M.; Ivanov, K.V. Features of plastic flow of powder Al-40Sn alloy during extrusion. Russ. J. Non-Ferr. Met. 2011, 52, 504–510. [Google Scholar] [CrossRef]
  16. Rusin, N.M.; Skorentsev, A.L.; Kolubaev, E.A. Effect of equal channel angular pressing on mechanical and tribological properties of sintered Al-Sn composites. J. Mater. Eng. Perform. 2020, 29, 1955–1963. [Google Scholar] [CrossRef]
  17. Guo, Q.; Jiang, B.; Li, J.; Wu, B. Effects of substrate bias voltage on morphologies and properties of Al-20Sn coating deposited by non-equilibrium magnetron sputtering. Spec. Cast. Nonferrous Alloys 2011, 31, 308–310. [Google Scholar]
  18. Liu, Y.; Liu, X.; Chen, X.; Yang, S.; Wang, C. Hydrogen generation from hydrolysis of activated Al-Bi, Al-Sn powders prepared by gas atomization method. Int. J. Hydrogen Energy 2017, 42, 10943–10951. [Google Scholar] [CrossRef]
  19. Zheng, B.J.; Chen, X.M.; Lian, J.S. Microstructure and wear property of laser cladding Al+SiC powders on AZ91D magnesium alloy. Opt. Lasers Eng. 2010, 48, 526–532. [Google Scholar] [CrossRef]
  20. Huang, C.; List, A.; Wiehler, L.; Schulze, M.; Gärtner, F.; Klassen, T. Cold spray deposition of graded Al-SiC composites. Addit. Manuf. 2022, 59, 103116. [Google Scholar] [CrossRef]
Figure 1. Surface topography diagram of SiC particles.
Coatings 15 01159 g001
Figure 2. Surface topography map and element distribution area scan map of Al-SiC composite coating under 500 times magnification.
Coatings 15 01159 g002
Figure 3. XRD pattern of Al-SiC composite coating.
Coatings 15 01159 g003
Figure 4. SEM images spectra of Al-SiC composite coatings at different current densities. (a) 10 mA/cm2; (b) 30 mA/cm2; (c) 50 mA/cm2; (d) 70 mA/cm2.
Coatings 15 01159 g004
Figure 5. SEM images spectra of Al-SiC composite coatings at different temperatures. (a) 20 °C; (b) 30 °C; (c) 40 °C; (d) 50 °C.
Coatings 15 01159 g005
Figure 6. SEM images spectra of Al-SiC composite coatings with different SiC addition amounts. (a) 20 g/L; (b) 40 g/L; (c) 60 g/L; (d) 80 g/L.
Coatings 15 01159 g006
Figure 7. Equivalent Circuit Diagram.
Coatings 15 01159 g007
Figure 8. Nyquist diagrams of Al-SiC composite coatings at different current densities.
Coatings 15 01159 g008
Figure 9. Bode plots of Al-SiC composite coatings at different current densities.
Coatings 15 01159 g009
Figure 10. Tafel polarization curves of Al-SiC composite coating at different current densities.
Coatings 15 01159 g010
Figure 11. Nyquist plots of Al-SiC composite coating at different temperatures.
Coatings 15 01159 g011
Figure 12. Bode diagrams of Al-SiC composite coatings at different temperatures.
Coatings 15 01159 g012
Figure 13. Tafel polarization curves of Al-SiC composite coating at different temperatures.
Coatings 15 01159 g013
Figure 14. Nyquist plots of Al-SiC composite coatings with different SiC addition amounts.
Coatings 15 01159 g014
Figure 15. Bode plots of Al-SiC composite coatings under different SiC addition amounts.
Coatings 15 01159 g015
Figure 16. Tafel polarization curves of Al-SiC composite coatings with different SiC particle addition amounts.
Coatings 15 01159 g016
Figure 17. Hardness comparison of Al-SiC coatings with different particle contents.
Coatings 15 01159 g017
Table 1. Process parameters for preparing coatings.
Electrolyte ComponentsConcentration
AlCl380 g/L
LiAlH40.28 g
C6H620 mL
C4H8O5 mL
SiC20 g/L. 40 g/L. 60 g/L. 80 g/L
Deposition parametersAmount
Temperature (°C)20 30 40 50
Current density (A/dm2)1 3 5 7
Magnetic agitation rate (rpm)350
Deposition time (minute)45
Bath volume (mL)50
Table 2. EDS analysis of Al-SiC composite coatings.
ElementWeight%Atomic%
C K15.0328.26
O K1.411.99
Al K78.3165.54
Si K5.244.21
Total 100.00100.00
Table 3. Fitting Parameters of Equivalent Circuit Diagram of Al-SiC Composite Coating.
(mA/cm2)RsQ1RcQ2RctRL
(Ω·cm2)(μF·cm−2)n(Ω·cm2)(μF·cm−2)n(Ω·cm2)(Ω·cm2)
106.950.930.902.454.340.7552103804
306.670.090.880.015.400.7047473808
505.712.4910.2910.00.87118804341
706.012.720.745.832.810.7330652835
Table 4. Fitting Parameters of the Equivalent Circuit Diagram of Pure Aluminum Coating.
CoatingRsQ1RcQ2RctRL
(Ω·cm2)(μF·cm−2)n(Ω·cm2)(μF·cm−2)n(Ω·cm2)(Ω·cm2)
Pure Al7.431.450.916.748.210.6745991433
Table 5. Tafel Extrapolation Fitting Parameters of Al-SiC Composite Coatings.
mA/cm2Icorr (A/cm2)Ecorr (V)
101.574 × 10⁻⁵−0.731
302.843 × 10⁻⁵−0.707
504.762 × 10⁻⁶−0.689
708.706 × 10⁻⁵−0.736
Table 6. Fitting Parameters of Equivalent Circuit Diagram of Al-SiC Composite Coating.
Temperature (°C)RsQ1RcQ2RctRL
(Ω·cm2)(μF·cm−2)n(Ω·cm2)(μF·cm−2)n(Ω·cm2)(Ω·cm2)
207.990.480.881.560.610.887036269.8
305.712.4910.2910.00.8711,8804341
406.721.450.8821.521.520.6796621488
507.870.0315.453.220.863865815.3
Table 7. Tafel extrapolation fitting parameters of Al-SiC composite coating.
Temperature (°C)Icorr (A/cm2)Ecorr (V)
201.969 × 10⁻⁵−0.717
304.762 × 10⁻⁶−0.692
401.303 × 10⁻⁵−0.714
504.655 × 10⁻⁵−0.728
Table 8. Fitting parameters of equivalent circuit diagram of Al-SiC composite coating.
SiC(g/L)RsQ1RcQ2RctRL
(Ω·cm2)(μF·cm−2)n(Ω·cm2)(μF·cm−2)n(Ω·cm2)(Ω·cm2)
205.768.810.6924620.610.887036269.8
405.712.4910.2910.00.8711,8804341
606.221.010.68148614860.6796621488
807.382.880.82151515150.863865815.5
Table 9. Tafel extrapolation fitting parameters of Al-SiC composite coatings.
SiC (g/L)Icorr (A/cm2)Ecorr (V)Ecorr (V)
202.004 × 10⁻⁵−0.724−0.717
404.762 × 10⁻⁶−0.692−0.692
601.495 × 10⁻⁵−0.740−0.714
808.637 × 10⁻⁶−0.748−0.728
Disclaimer/Publisher’s Note: The statements, opinions and data contained in all publications are solely those of the individual author(s) and contributor(s) and not of MDPI and/or the editor(s). MDPI and/or the editor(s) disclaim responsibility for any injury to people or property resulting from any ideas, methods, instructions or products referred to in the content.