Article

Pavement Performance and Mechanism of Asphalt Mixtures Reinforced with Different Diameters of Basalt Fibers for the Surface Layer

1
College of Civil Engineering and Transportation, Yangzhou University, Yangzhou 225127, China
2
Department of Civil and Environmental Engineering, University of Waterloo, Waterloo, ON N2L 3G1, Canada
3
Department of Civil Engineering, University of Ottawa, Ottawa, ON K1N 6N5, Canada
4
College of Wuxi South Ocean Vocation and Technology, Wuxi 214081, China
*
Author to whom correspondence should be addressed.
Coatings 2025, 15(10), 1153; https://doi.org/10.3390/coatings15101153
Submission received: 5 September 2025 / Revised: 22 September 2025 / Accepted: 23 September 2025 / Published: 3 October 2025

Abstract

The diameter of basalt fiber influences the reinforcement of basalt fiber asphalt mixtures. However, the performance evaluation and mechanistic analysis of asphalt mixtures reinforced with varying fiber diameters have been insufficiently studied. AC-13 asphalt mixtures were designed and prepared with four different fiber diameters 7 μm, 16 μm, 25 μm, and an equal-mass mixture of these. The reinforcement mechanisms were analyzed using the equal cross-section theory. Results indicate that the incorporation of 7 μm and mixed-diameter basalt fibers significantly enhances the pavement performance of the asphalt mixtures compared to the control group without fibers. Additionally, it is shown by triaxial shear tests that the cohesion of the asphalt mixtures with the aforementioned two diameters of basalt fibers is strengthened by 61.5% and 55.5%, respectively. The dynamic modulus values in the high-frequency range are found to be positively correlated with fiber diameters. Since the fiber mass content and modulus were held constant, a decrease in diameter was observed to lead to an increase in fiber quantity. This is manifested by a multiple-fold increase in the total transformed cross-section (TTCR) index for 7 μm fiber asphalt mixtures, as described by the equal cross-section theory. It is concluded that the performance improvement of the asphalt mixtures can be further enhanced under the same fiber content and cost conditions by optimizing diameter parameters.

1. Introduction

Basalt fiber (BF) is produced by drawing molten basalt rock at 1500℃ through a platinum–rhodium wire-drawing plate to form continuous fiber bundles. It exhibits greater stability compared to lignin fiber and polyester fiber [1] with increasing temperature. Basalt fiber effectively enhances both the high and low temperature performance [2] of asphalt mixtures, improves the fatigue resistance of various asphalt mixtures [3,4], and contributes to the overall integrity of the asphalt mixture [5]. Additionally, basalt fiber can withstand and transmit stress, restrain crack propagation, and improve the crack resistance of the mixture [6,7]. The incorporation of basalt fiber increases the asphalt–aggregate ratio, decreases density, and reduces air voids within the mixture [8]. At the microscopic level, the adhesion properties of the basalt fiber and the asphalt interface are stable [9]. It is suitable for heavy traffic applications [10], and is widely used as a reinforcing material in pavement construction.
It has become a consensus that the incorporation of basalt fiber in asphalt mixtures can enhance their performance and mechanical properties. He et al. prepared a hybrid fiber asphalt mixture using micron-scale calcium sulfate whiskers (CSW) and millimeter-scale basalt fibers (BFs). The experimental results demonstrated that utilizing BFs of disparate scales as a reinforcing material could enhance the performance of asphalt mixtures, and the BF-modified asphalt mixture was found to perform excellently in transferring and dispersing stress, exhibiting superior low-temperature toughness [11]. The reinforcing effect of basalt fiber on the asphalt mixtures is influenced by several factors. Performance tests have been developed to assess the impact of fiber content, characteristic parameters [12,13,14], and fiber length on the mechanical properties of the asphalt mixtures, with these methodologies becoming increasingly refined [15,16]. The content of basalt fiber significantly affects air voids, voids in mineral aggregates, and voids filled with asphalt, while the length of the basalt fiber is more closely associated with Marshall stability [17,18]. Xu et al. investigated the synergistic effects and mechanistic influences of basalt fiber characteristic parameters on asphalt mortar. They determined that the optimal fiber parameters are a length of 6 mm and a diameter of 7 μm. This fiber configuration maximizes the performance enhancement of the asphalt mixtures across all temperature domains, exhibiting the most superior effects in improving high-temperature deformation resistance, medium-temperature fatigue resistance, and low-temperature crack resistance [19]. In the study of the mechanical properties of fiber-reinforced asphalt mixtures, both domestic and international researchers utilize the Asphalt Concrete Cracking Device (ACCD) to investigate the cracking resistance of these mixtures [20,21]. They employ the disc tensile test to examine the low temperature cracking characteristics of fiber reinforced asphalt mixture [22], as well as the semi-circular bending (SCB). In situ direct tension (ISDT) tests allow researchers to investigate the increasing trends in the fracture energy and fracture toughness of fiber-reinforced asphalt mixtures [23,24]. Additionally, the indirect tensile cracking test is employed to assess the crack resistance of these mixtures [25,26], while variations in load application time and frequency are also explored [20,21]. Researchers have developed a comprehensive array of characterization methods, and the ongoing enhancement of numerical simulation techniques has significantly advanced the performance research of asphalt mixtures [27,28,29]. For instance, Huang et al. developed master curves of viscoelastic parameters for asphalt mixtures to analyze the differences between the master curves of relaxation modulus and creep compliance [30].
At present, there are few reports on the mechanical response characteristics of fiber-reinforced asphalt mixtures. The mechanical models of fiber-reinforced matrices primarily include slippage theory, the equal cross-section theory, and the mixture probabilistic model [31,32]. In slippage theory, the fiber and the matrix resist relative slip at the interface through bonding actions, thereby resisting external loads or deformations [33]. The equal cross-section theory is widely employed in the mechanical analysis of reinforced concrete structures. In this model, the fiber cross-sectional area is considered equivalent to the matrix cross-sectional area [34,35], in accordance with the modulus equivalence principle. It is assumed that all fibers are distributed perpendicular to the vertical section within the unit. The equivalent new section’s moment of inertia is used to replace the matrix’s moment of inertia, which lacks fibers, in order to characterize the fiber–matrix composite’s ability to resist external loads. The mixture probabilistic model categorizes the system into viscoelastic and elastic models based on the mechanical properties of the matrix materials across different temperature ranges. The viscosity of fiber composite asphalt is influenced by the fiber volume fraction, fiber aspect ratio, and bonding state at the interface between the fiber and the matrix [36,37]. These three models quantitatively illustrate the synergistic effects of fiber–matrix composites with varying characteristics, providing valuable insights and references for research on the synergistic mechanisms of fiber asphalt mixtures. This underscores the importance of investigating the synergistic mechanisms of fiber asphalt mixtures.
The aim of this study is to examine the influence of basalt fiber diameters on the performance of asphalt mixture in a systematic manner, which can provide valuable experimental support for the optimal design of fiber-reinforced asphalt mixtures. Compared with existing studies, this research systematically examines the influence of basalt fiber diameter on the mechanical response of fiber-reinforced asphalt mixtures through experimental testing and theoretical analysis based on the equal cross-section theory. The correlation between fiber diameter and mixture performance is further analyzed, providing theoretical support for advancing multiphase system design theory in fiber-reinforced asphalt mixtures.

2. Materials and Methods

2.1. Raw Materials

2.1.1. Asphalt Binder

SBS-modified asphalt, the most commonly used binder for the surface layers of asphalt pavement in China, was selected as the binder in this study. The properties of the asphalt binder are shown in Table 1.

2.1.2. Aggregates and Fillers

Basalt aggregates with gradations ranging from 4.75 to 16 mm, as well as limestone aggregates with gradations of 2.36 to 13.2 mm, 1.18 to 4.75 mm, and 0.075 to 2.36 mm, were utilized as aggregates in the asphalt mixture. Additionally, fine limestone was adding as mineral powder. All aggregates and mineral powders were procured from Zhenjiang Gaozi Limestone Co. Ltd. (Jiangsu, China). The properties are shown in Table 2 and Table 3.

2.1.3. Basalt Fiber

Chopped basalt fibers are produced by Jiangsu Tianlong Basalt Continuous Fiber Co., Ltd. (Jiangsu, China). The diameters were 25 μm, 16 μm, and 7 μm. The properties of the basalt fibers are presented in Table 4, which were tested according to the Chinese standard JT/T 533-2020. To investigate the influence of different diameters of basalt fibers on the asphalt mixture performance, fibers with diameters of 25 μm, 16 μm, and 7 μm, as well as a mixed diameter (in a mass ratio of 1:1:1 of the aforementioned fibers), were utilized in the asphalt mixtures.

2.1.4. Mixture Gradation

The AC13 mixture gradation was designed according to the Chinese standard JTG F40-2004, and the gradation curve is presented in Figure 1.

2.2. Test Methods

2.2.1. Rutting Test

A rutting test was conducted in accordance with the Chinese standard JTG F40-2004. The dimensions of the specimens were 300 mm × 300 mm × 50 mm. The test was performed at a temperature of 60 °C, with a wheel pressure of 0.7 MPa. The relationship between the rut deformation depth produced by the asphalt pavement and the number of wheel pressure cycles was analyzed. The high temperature performance of the asphalt mixture was evaluated using the dynamic stability, which can be calculated by Equation (1):
D S = t 2 t 1 × N d 2 d 1 × C 1 × C 2
where DS is the dynamic stability of the asphalt mixture, cycles/mm; t1 is the time of the test, 45 min; t2 is the time of the test, 60 min; d1 is the deformation depth at t1, mm; d2 is the deformation depth at t2, mm; C1 is the correction coefficient of the testing machine, typically 1.0; C2 is the correction coefficient of the testing machine, typically 1.0; N is the number of wheel pressure reciprocations, 42 times/min.

2.2.2. Low Temperature Beam Bending Test

A low temperature beam bending test was conducted in accordance with the Chinese standard JTG E20-2011. The dimensions of the prismatic beam were 250 mm × 30 mm × 35 mm. The ambient temperature was maintained at −10 °C, and the loading head was operated at a pressing rate of 50 mm/min. The bending tensile strength RB, the maximum bending tensile strain at the bottom of the beam εB, and the bending stiffness modulus SB can be calculated by Equations (2)–(4):
R B = 3 L P B 2 b h 2
ε B = 6 h d L 2
S B = R B ε B
where b is the width of the specimen mid-span section, mm; h is the height of the section, mm; L is the span of the specimen, mm; PB is the maximum load at failure, N; d is the specimen’s mid-span deflection at failure, mm.

2.2.3. Immersion Marshall Test

An immersion Marshall test was conducted in accordance with the Chinese standard JTG E20-2011. The immersion residual stability MS0 calculated by Equation (5) was chosen as the parameter to assess the moisture resistance of the mixture, as follows:
M S 0 = M S 1 M S × 100
where MS0 is the immersion residual stability of specimen, %; MS is the Marshall stability, kN; MS1 is the stability of the specimen kept in water for 48 h, kN.

2.2.4. IDEAL Cracking Test

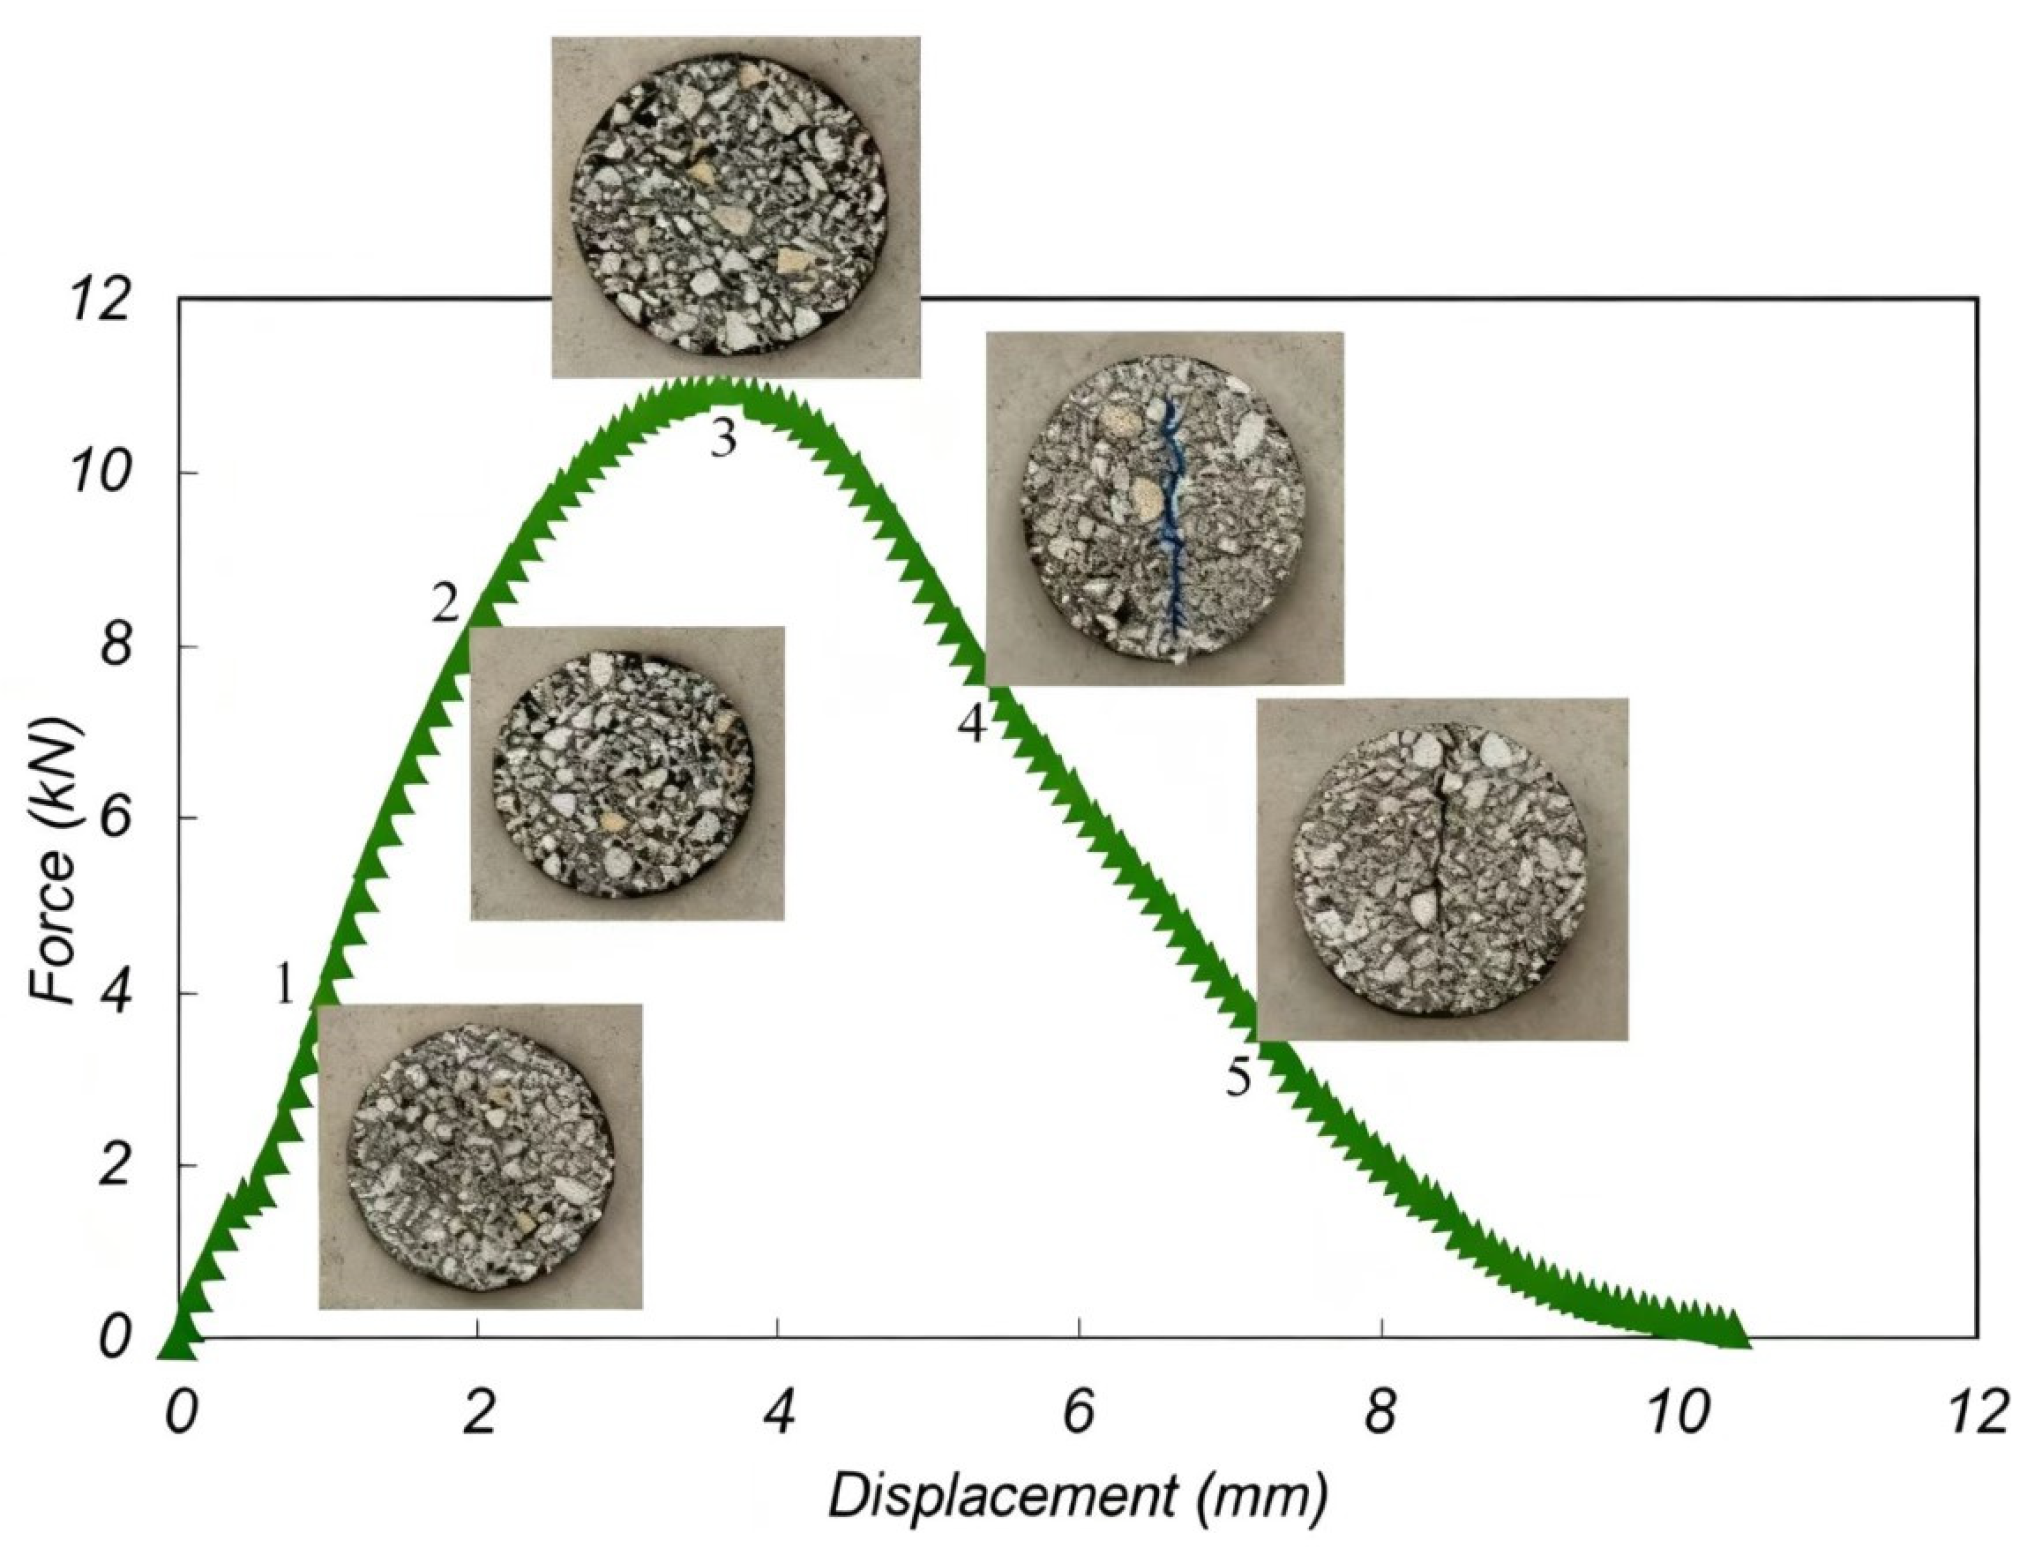
The IDEAL-CT test is analogous to the conventional indirect tensile strength test, performed at ambient temperature utilizing cylindrical specimens with a loading rate of 50 mm/min (select the splitting test fixture). The dimensions of the specimens were 150 mm in diameter, 62 mm in height, and exhibited a void fraction of 7 ± 0.5%. The test was conducted at a temperature of 25 °C. The assessment methodology involved calculating the cracking parameter CTindex from the load-displacement curve (as shown in Figure 2 [38]).
The index can be calculated by Equations (6)–(8), for a 62-mm thick test specimen (Equations (6) and (7)) and for a non-62-mm thick test specimen (Equation (8)):
C T I ndex = G f m 75 × ( l 75 D )
m 75 = ( p 85 p 65 ) ( l 85 l 65 )
C T I ndex = t 62 × ( G f m 75 ) × ( l 75 D )
where CTindex is the index of the cracking test; t is the thickness of the specimen, mm; D is the diameter of the specimen, mm; Gf is the fracture energy, J/m2; |m75| is the absolute value of the slope at 75% post-peak; l75 is the displacement corresponding to 75% post-peak, mm.
The IDEAL-RT test is analogous to the IDT test, with the primary distinction being the utilization of a shear fixture in place of the IDT fixture. A constant axial displacement rate of 50 mm/min was applied to the diameter plane of the cylindrical specimen. The dimensions of the specimen employed in the test were 150 mm in diameter, 62 mm in height, and a void fraction of 7 ± 0.5%. The test must be completed within 2 minutes after the specimen was taken out of the thermal insulation environment. The test was conducted at a temperature of 50 °C and a loading rate of 50 mm/min. The rutting index of the asphalt mixture, denoted as RTindex, can be calculated by Equation (9):
R T index = 6.618   × 1 0 5 × 0.356 × P m a x t × w
where t is the thickness of specimen, mm; w is the width of upper load strip, 0.0191 m.

2.2.5. Triaxial Shear Test

A triaxial shear test was conducted utilizing the UTM-25 loading device in conjunction with a supporting triaxial chamber. The dimensions of the specimen employed for this test were 100 mm in diameter and 150 mm in height. In accordance with the intermediate traffic load specifications outlined in the Chinese standard, the confining pressures applied were 0 kPa, 138 kPa, and 276 kPa, with a test temperature 60 °C. The specimen was sealed within a vacuum chamber using a rubber membrane, and rubber rings were affixed at both ends to ensure airtightness. The specimen was kept at an elevated temperature in an incubator for a duration of 6 hours before being transferred to the triaxial chamber, which was subsequently placed within the UTM-25 environmental box for thermal insulation. Loading commenced once the temperature within the triaxial chamber, as measured by an infrared detector, reached the predetermined set point. The loading rate for the test specimen was established at 7.5 mm/min, and the changes in the load-displacement curve were monitored. The loading process was terminated upon the occurrence of peak load, followed by a subsequent decline in stress.

2.2.6. Dynamic Creep Test

The dynamic creep test employed a cylindrical specimen with a diameter of 100 mm and a height of 150 mm. The test was conducted at a temperature of 60 °C, with a load level set at 700 kPa, and a loading cycle duration of 1 second. The specimen was deemed to be invalid upon reaching either 100,000 microstrains or 10,000 loading cycles. Prior to the test, the BFAM specimen was maintained at 60 °C for a duration of 4 hours, while the temperature of the UTM-25 tester was simultaneously elevated to 60 °C. The formulas for the three-stage model are defined in Equations (10)–(12) for the compaction stage (Equation (10)), for the stable stage (Equation (11)), and for the destruction stage (Equation (12)):
ε p = a N b , N < N ps
ε p = ε p s + c ( N N p s ) , N p s N N s t
ε p = ε st + d ( e f ( N N s t ) 1 ) , N > N s t
where εp is the cumulative microstrain; a, b, c, d are the fitting coefficients; N is the load time; Nps is the time of critical repeated load action in the first and second stages; Nst is the time of critical repeated load action in the third and fourth stages; εps is the cumulative microstrain at the beginning of the second stage; εst is the cumulative microstrain at the end of the second stage.

2.2.7. Dynamic Modulus Test

The dynamic modulus test utilized cylindrical specimens with a diameter of 100 mm and a height of 150 mm. The testing was conducted using the UTM-25 testing system. In this experiment, six loading frequencies were selected: 25 Hz, 10 Hz, 5 Hz, 1 Hz, 0.5 Hz, and 0.1 Hz. The temperature range for the test was established from −10 °C to 50 °C, with five distinct temperature conditions tested at 15 °C intervals. The testing procedure was conducted in a systematic order, progressing from high frequency to low frequency and from low temperature to high temperature.
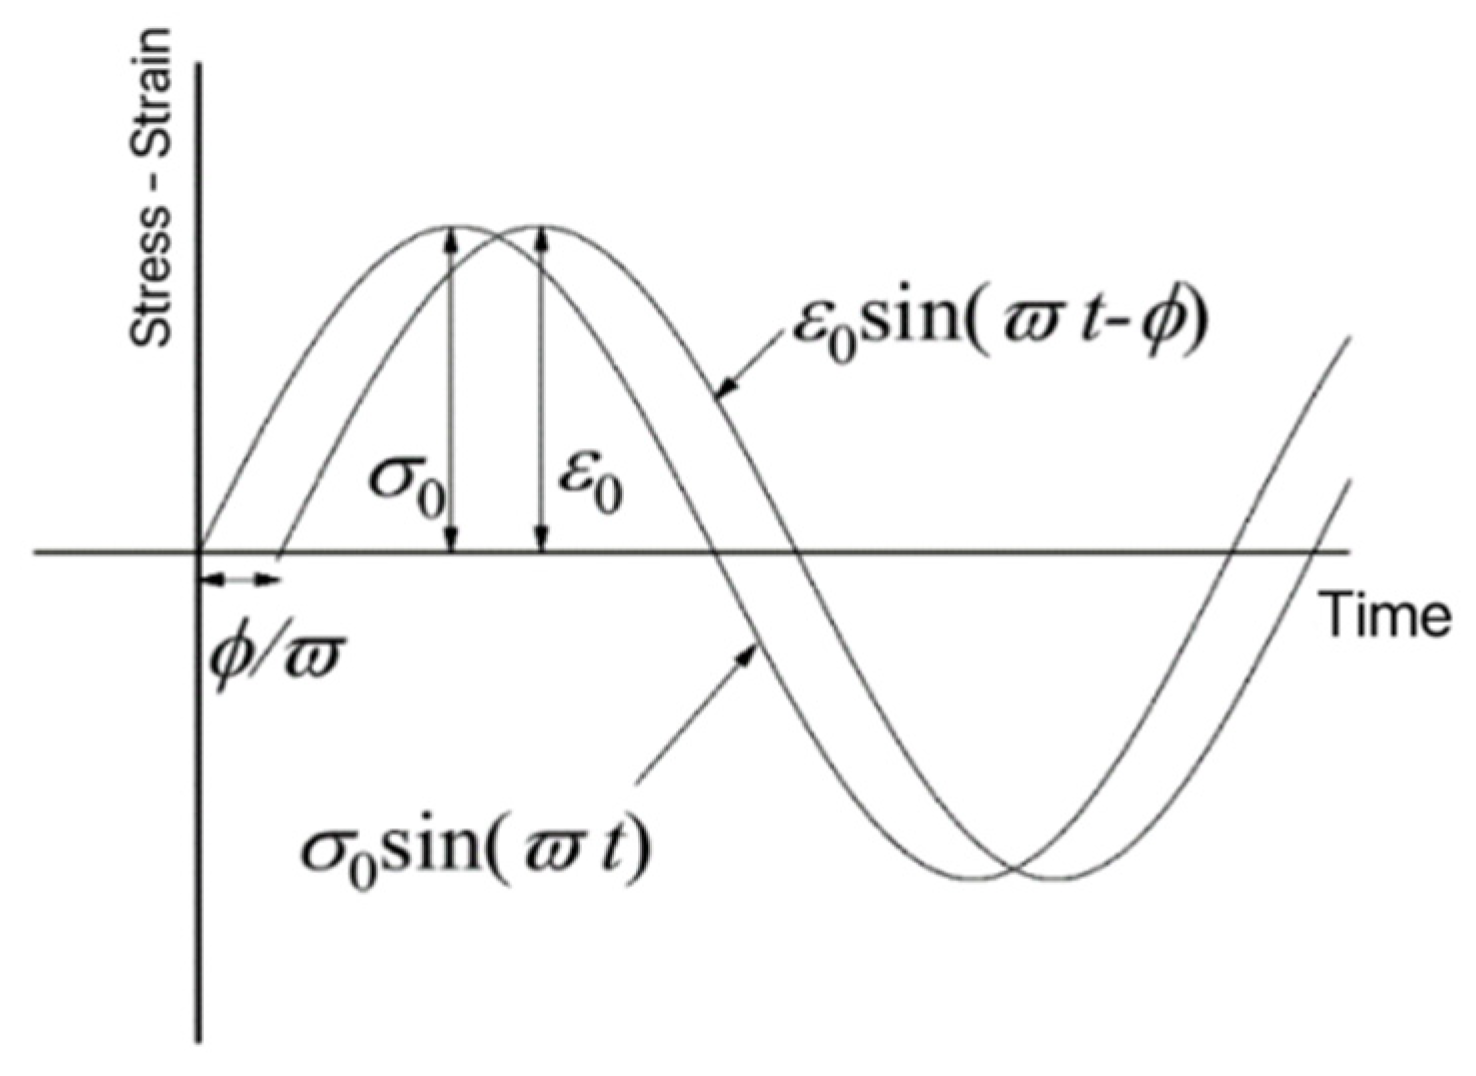
The composite modulus E* is commonly employed to characterize the viscoelastic strength of asphalt mixtures. It is defined as the ratio of the amplitude of applied sinusoidal stress σ = σ 0 sin ω t and feedback strain ε = ε 0 sin ω t φ where time and load are represented by angular velocities ω, as illustrated in Figure 3. The real part of E corresponds to the storage modulus, while the imaginary part E represents the loss modulus. The dynamic modulus encompasses both components, reflecting the material’s capacity to resist deformation under varying frequency loads. They are calculated by Equations (13)–(15).
E * = σ ε = σ 0 sin ω t ε 0 sin ω t φ
E * = E + i E
E * = E 2 + E 2 = σ 0 ε 0
where σ0 is the maximum stress; ε0 is the maximum strain, φ is the phase angle; ω is the angular velocity; t is the time of the test, s.

3. Results and Discussion

3.1. Optimum Asphalt–Aggregate Ratio

As shown in Table 5, the Marshall test determined the optimal asphalt–aggregate ratio for the basalt fiber asphalt mixture (BFAM) with 0.3% total fiber content and 6 mm fiber length. The optimal ratios for the BFAM with varying fiber diameters are ranked as follows: 7 μm > mixed diameter = 16 μm > 25 μm > no fiber. This trend shows that smaller fiber diameters result in higher asphalt–aggregate ratios in the BFAM, as finer basalt fibers (BFs) exhibit superior asphalt adsorption. At a constant mass, the smaller fiber diameters increase the number of fibers, expanding the total contact area with asphalt, thereby increasing the optimal asphalt–aggregate ratio. As the Marshall test results of the BFAM show in Table 6, the BFAM performance complies with the requirements of the Chinese standard.

3.2. Effect of Basalt Fiber on the Performance of Asphalt Mixture

3.2.1. High Temperature Deformation Resistance

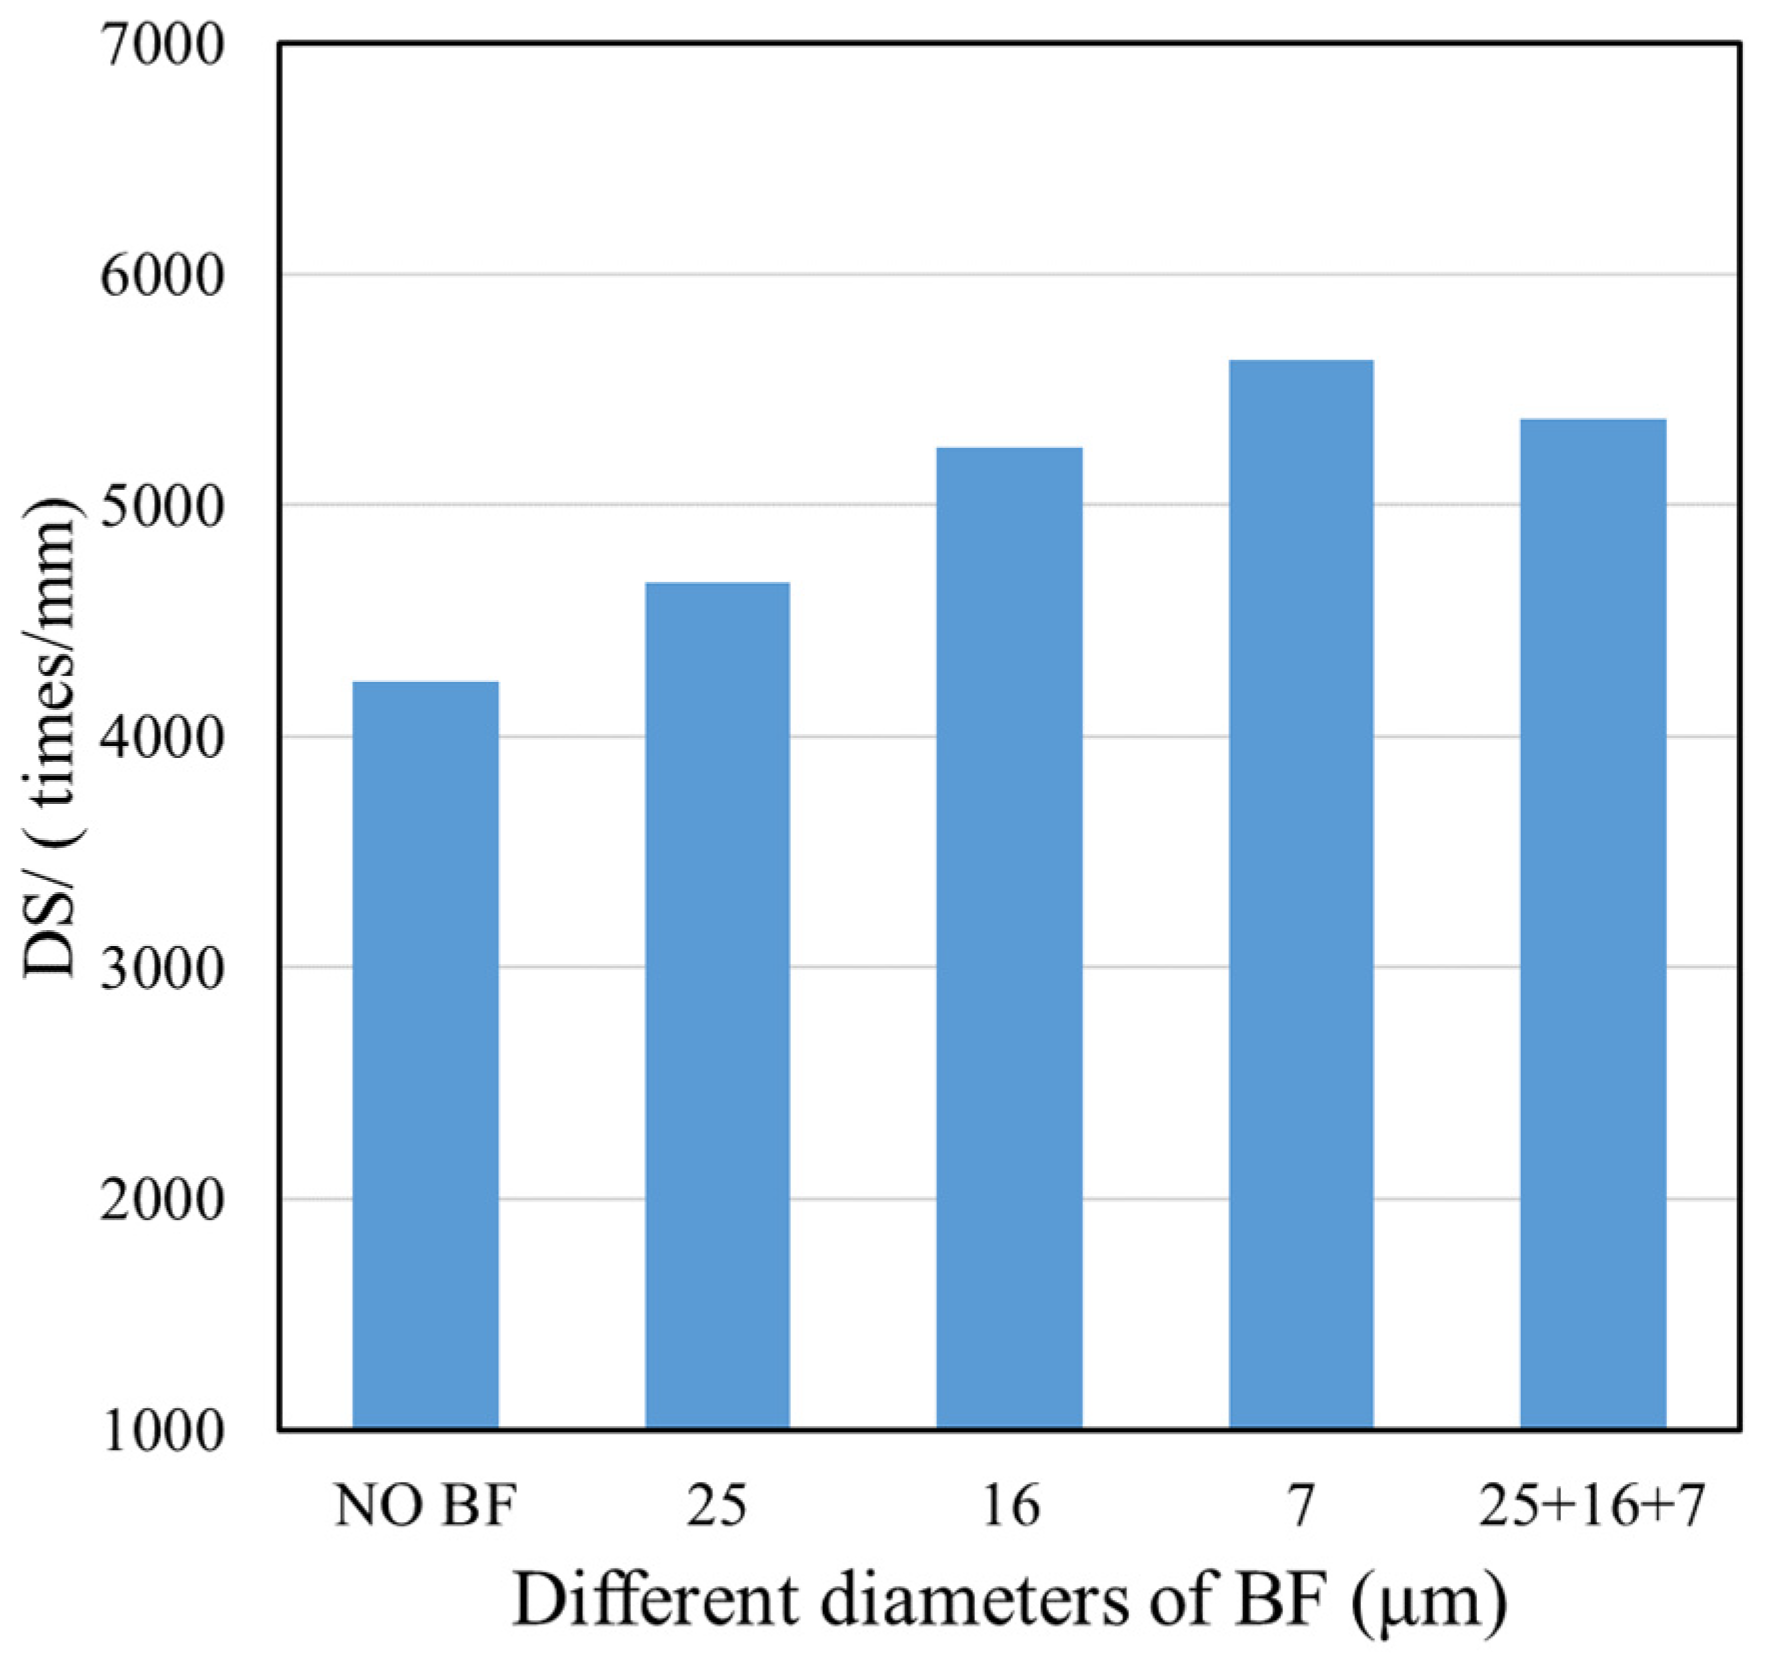
The results from rutting test are illustrated in Figure 4. The dynamic stability of the BFAM, with 25 μm, 16 μm, 7 μm, and a mixed diameter fiber increased by 10.1%, 23.8%, 32.7%, and 26.7%, respectively, compared to the asphalt mixture without fiber. This suggests that the inclusion of BFs serves the dual function of reinforcement and buffering, effectively preventing the separation of asphalt binder and aggregate due to oil bleeding at elevated temperature, thereby preventing the formation of cracks and enhancing the high temperature performance of the asphalt mixture. Furthermore, the reinforcement effect of the BFs on the asphalt mixture varies with the fiber diameter. Specifically, a smaller fiber diameter correlates with a better improvement in dynamic stability. This phenomenon can be attributed to the influence of fiber diameter on its contact area with asphalt, which can affect the asphalt–aggregate ratio. The cohesion of asphalt is paramount at a high temperature, and the 7 μm diameter BF exhibits the largest contact area with asphalt, leading to significant alterations in cohesion and dispersion within the mixture. Consequently, 7 μm diameter BF presents the best reinforcement effect on the high temperature performance of the mixture. By contrast, the high temperature performance of the BFAM with fiber diameters of 16 μm, 25 μm, and a mixed diameter shows minor improvements compared to the asphalt mixture without fiber.

3.2.2. Low Temperature Crack Resistance

The results of low-temperature beam bending test are shown in Figure 5. As illustrated in Figure 5a,b, the bending tensile strength and maximum bending tensile strain of the BFAM present significant enhancements after the incorporation of the BFs. Compared to the asphalt mixture without fiber, the maximum bending tensile strain of the BFAM with fiber diameters of 25 μm, 16 μm, 7 μm, and a mixed diameter increased by 6.7%, 12.6%, 21.5%, and 16.4%, respectively. It means that a 7 μm BF has superior mechanism, and it occupies a larger total contact area within the BFAM matrix, which effectively relieves stress concentration.
Figure 5c indicates that the bending stiffness modulus decreases as the fiber diameter decreases, and the mixed diameter fiber presents the best effect. This suggests that the incorporation of BFs contributes to the flexibility of the asphalt mixture, thereby serving a toughening function to enhance the low temperature cracking resistance of the BFAM. The BF interlaces within the asphalt mixture and bonds with the asphalt, facilitating this toughening effect. Furthermore, the overall deformation resulting from the external loads counteracts displacement, thereby inhibiting crack propagation and effectively improving the low temperature crack resistance of the asphalt mixture.

3.2.3. Water Stability

The results of the immersion Marshall test are presented in Table 7, which indicates that the Marshall stability of the asphalt mixture exhibits an increasing trend after adding the basalt fiber, increasing from 14.7%, 26.8%, 37.7%, and 32.2% to 14.5%, 28.1%, 40.5%, and 33.9%, respectively. Notably, the 7 μm diameter asphalt mixture presents the most effective enhancement, with an improvement in immersion residual stability of nearly 2%. This illustrates that the diameter of the basalt fiber effectively influences the water stability of the asphalt mixture.

3.3. Mechanical Property Analysis

3.3.1. Anti-Cracking Performance

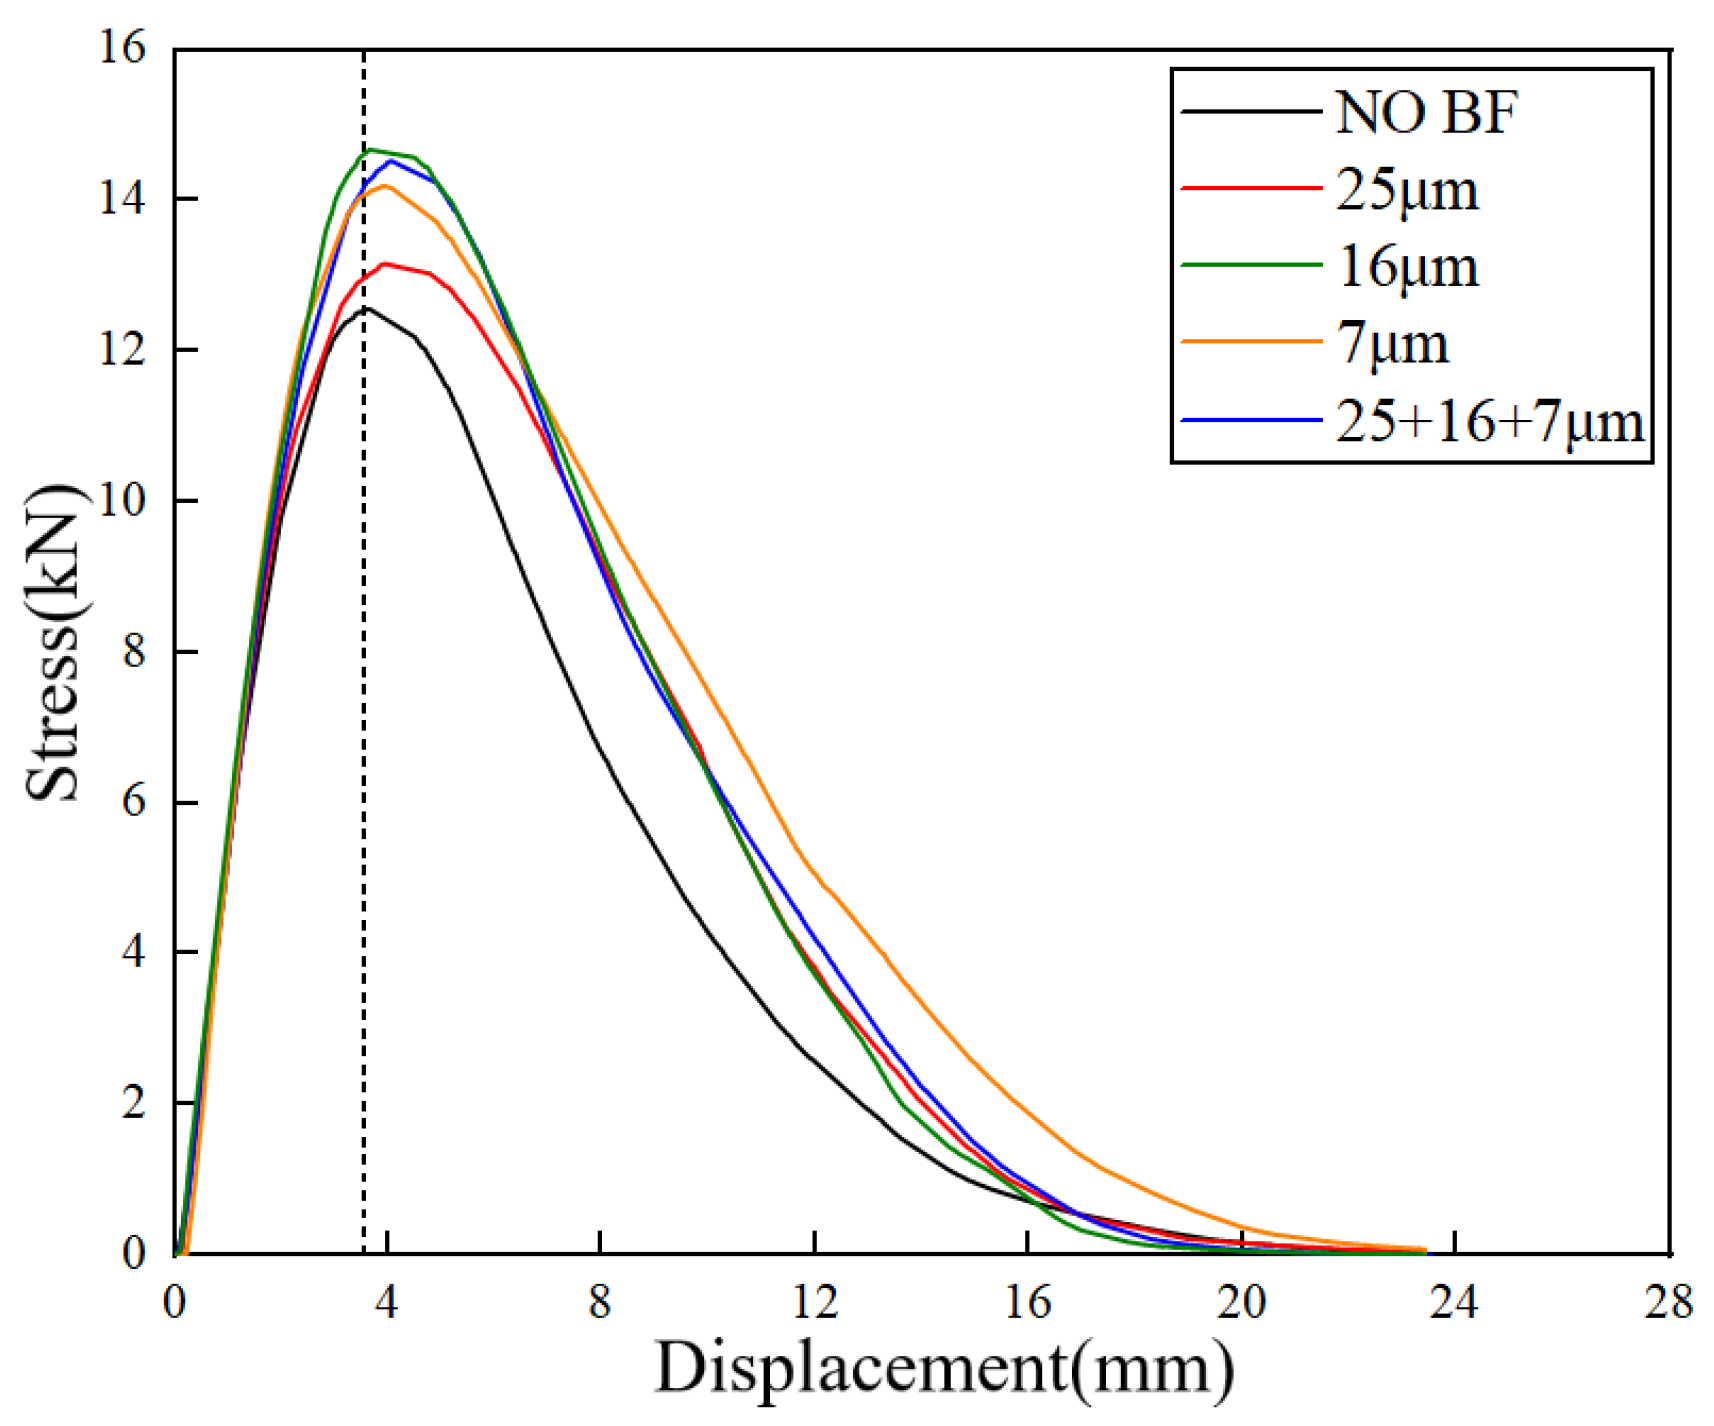
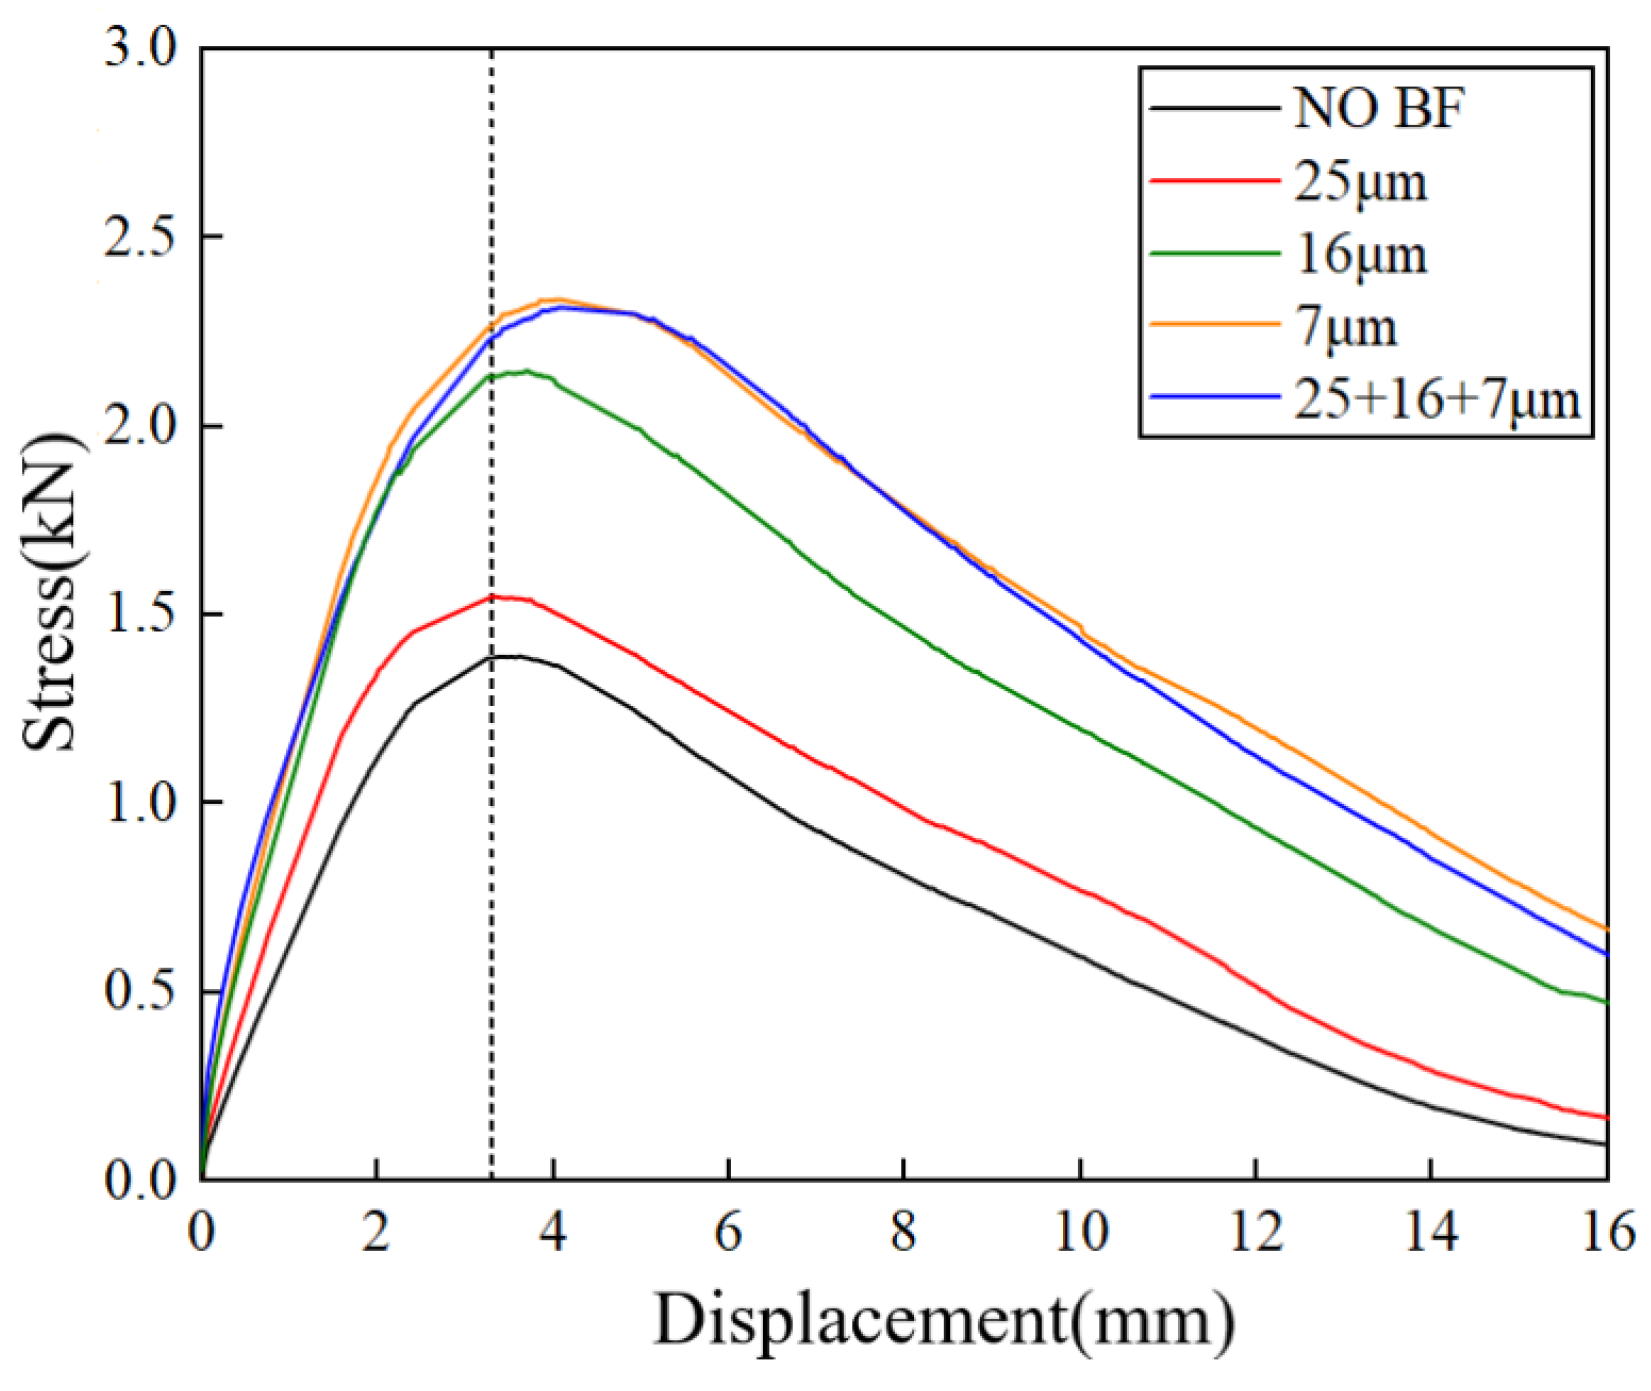
The stress-displacement curves of the IDEAL-CT test are illustrated in Figure 6. It is clear that the peak force of the asphalt mixture exhibits an increasing trend with the incorporation of fiber, suggesting an enhancement in the overall strength of the asphalt mixture. Compared to the effects of the 25 μm BF with other fibers with varying diameters, particularly the 16 μm BF, a more effective increase in the peak force is observed. Furthermore, the overall strength of the asphalt mixture with fibers of mixed diameter also demonstrates a rapid increase, indicating an enhanced capacity to withstand greater stress.
It can be observed from Figure 6 that the maximum displacement is 16 mm. It is evident that the asphalt mixture without fiber not only achieves maximum displacement at an earlier stage but presents the most substantial reduction in stress, suggesting a poor resistance to deformation, particularly pronounced during the crack development phase. By contrast, the incorporation of BFs enhances the maximum displacement and bolsters the mixture’s resistance to deformation. Among all types of fibers, the 7 μm BF demonstrates the most effective influence on maximum displacement, while fibers with diameters of 25 μm and 16 μm, as well as those with a mixed diameter present similar effects. This finding suggests that the 7 μm BF exhibit a superior crack resistance and reinforcement capabilities during the crack development stage. From the perspective of maximum displacement, the 7 μm BF has the most pronounced impact on the deformation resistance of the mixture.
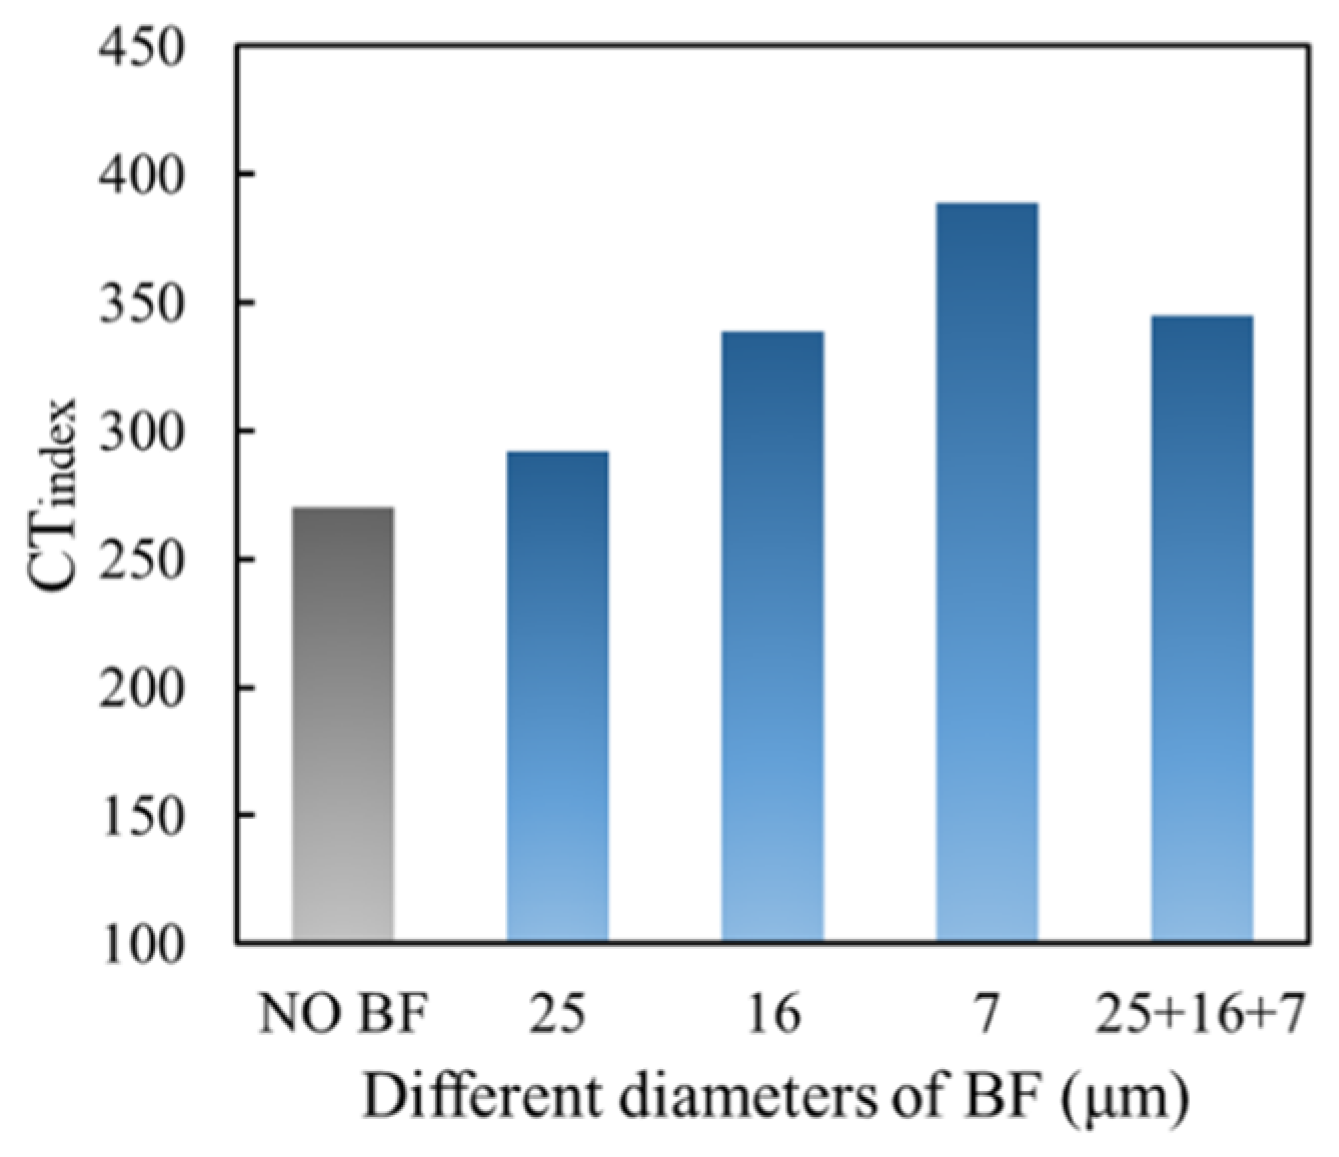
The relationship between the CTindex and the fiber diameter is shown in Figure 7. Figure 7 illustrates that the CTindex value increases as the diameter of the BF decreases, peaking at 7 μm, which represents a 44.1% enhancement compared to the mixture without fiber. The CTindex value of the BFAM with fiber diameters of 25 μm, 16 μm, and a mixed diameter increased by 8.2%, 25.5%, and 27.8%, respectively. During the complete cracking phase of the asphalt mixture, the energy required throughout the cracking process, as well as the mixture’s resistance to cracking, are characterized by the fracture energy Gf and the cracking index CTindex. It is evident that the incorporation of a 7 μm BF significantly enhances the mixture’s resistance to cracking.
In conclusion, BF demonstrates a notable toughening effect during the initiation and progression phases of crack formation within the asphalt mixture. The network of interwoven fibers effectively mitigates the formation and advancement of cracks, thereby effectively improving the overall crack resistance of the asphalt mixture.
The results of the IDEAL-RT test are presented in Figure 8. From the stress-displacement curves of the IDEAL-RT test, it is evident that the slopes of the stress-displacement curves containing 16 μm, 7 μm, and mixed diameter fibers are closely aligned during the crack initiation phase. These three curves exhibit steeper slopes compared to the mixture containing 25 μm fibers and the mixture without fiber. This observation suggests that the former mixtures necessitate greater stress and energy absorption to achieve equivalent displacement. This finding contrasts with the results from the IDEAL-CT test conducted at 25 °C, indicating that elevated temperatures facilitate the differentiation and assessment of fiber effects during the cracking phase of the asphalt mixtures.
From the standpoint of peak stress, the incorporation of fiber into the asphalt mixture results in an increase in peak stress. The mixture containing 7 μm and a mixed diameter of fibers exhibits the most effective lifting capability, followed by the 16 μm and 25 μm fibers. A lower peak force correlates with a softer overall mixture, suggesting that fibers with a smaller diameter are more effective in mitigating cracking in high temperature environments. In comparison to the mixtures without fibers, the overall enhancement of the incorporation of BFs is within 2 kN, which is less pronounced than the effects noted at 25 °C. Despite effective variations in peak stress related to cracking at different temperatures, the peak stress consistently occurs at approximately 4 mm of displacement. This indicates that the addition of fibers at 50 °C does not substantially postpone the onset of cracking. The stress-displacement curves for the BFAM with varying fiber diameters do not intersect, and the decline in stress is very slow during the crack propagation phase, suggesting that BFs of different diameters can effectively and consistently impede the further propagation of cracks under elevated temperatures.
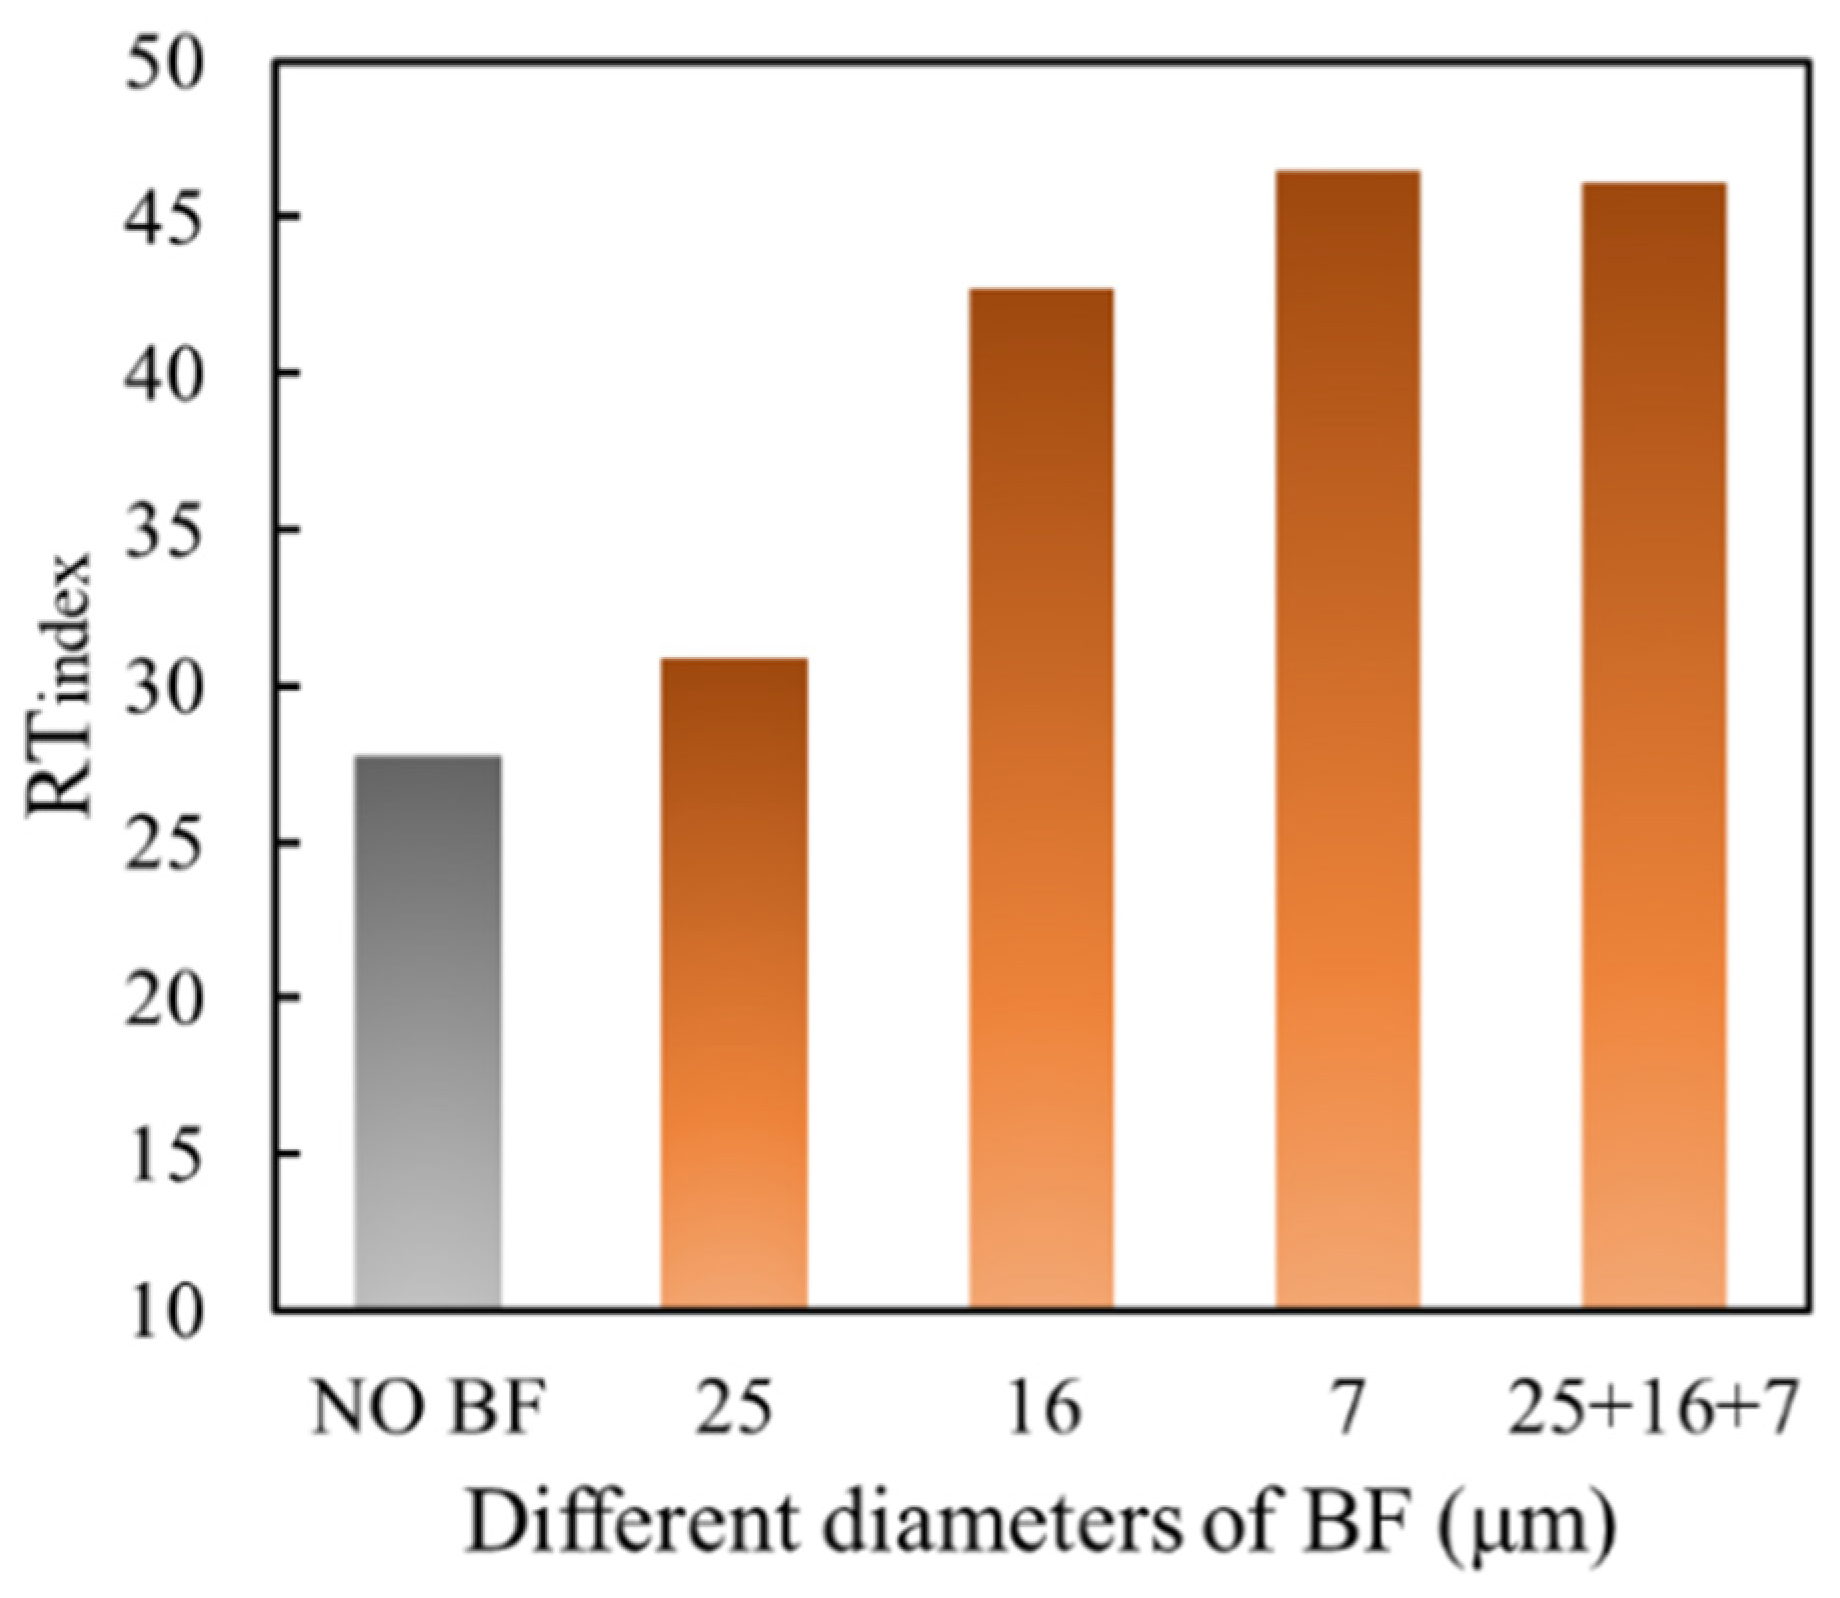
The relationship between the RTindex and fiber diameter is presented in Figure 9. It is observed that the RTindex value notably increases as the diameter of the BFs decreases, particularly at 16 μm, where a significant upward trend is evident, culminating in a peak value at 7 μm. When compared to the asphalt mixture without fiber, the incorporation of fibers with diameters of 25 μm, 16 μm, 7 μm, and a mixed diameter resulted in increases in the RTindex values of 11.5%, 55.5%, 67.8%, and 66.3%, respectively. This suggests that the BF with a diameter of 7 μm is particularly effective in mitigating cracking within the mixture. Furthermore, the conclusions drawn from the rutting test of the BFAM align with those obtained from the IDEAL-RT test, indicating that the IDEAL-RT test serves a similar function in quality control as the rutting test.

3.3.2. Shear Resistance

The results of the triaxial shear test are presented in Figure 10. As illustrated in Figure 10a, the incorporation of BFs of varying diameters has effectively enhanced the cohesion of the asphalt mixture. Specifically, the cohesion of the BFAM with a BF diameter of 25 μm, 16 μm, 7 μm, and a mixed diameter increased by 39.4%, 51.5%, 61.5%, and 55.5%, respectively, when compared to the mixture without fiber.
As illustrated in Figure 10b, the incorporation of BFs resulted in a modest enhancement of the internal friction angle of the asphalt mixture, with an increase not exceeding 3°. Theoretically, the function of asphalt within the mixture transitions from that of a binder to a lubricant when the asphalt–aggregate ratio surpasses 5.0%, leading to a reduction in the internal friction angle. In this study, the internal friction angle exhibited negligible variation within the BFAM. This observation suggests that BF has the capacity to absorb asphalt, and the concomitant formation of a network structure facilitates the conversion of a greater quantity of free asphalt into structural asphalt. Notably, the asphalt mixture containing 7 μm fibers utilizes the highest volume of the asphalt, yet it demonstrates the least increase in the internal friction angle. This indicates that the combination formed by the 7 μm BF and structural asphalt effectively mitigates the occurrence of relative slip within the mixture.

3.3.3. Creep Performance

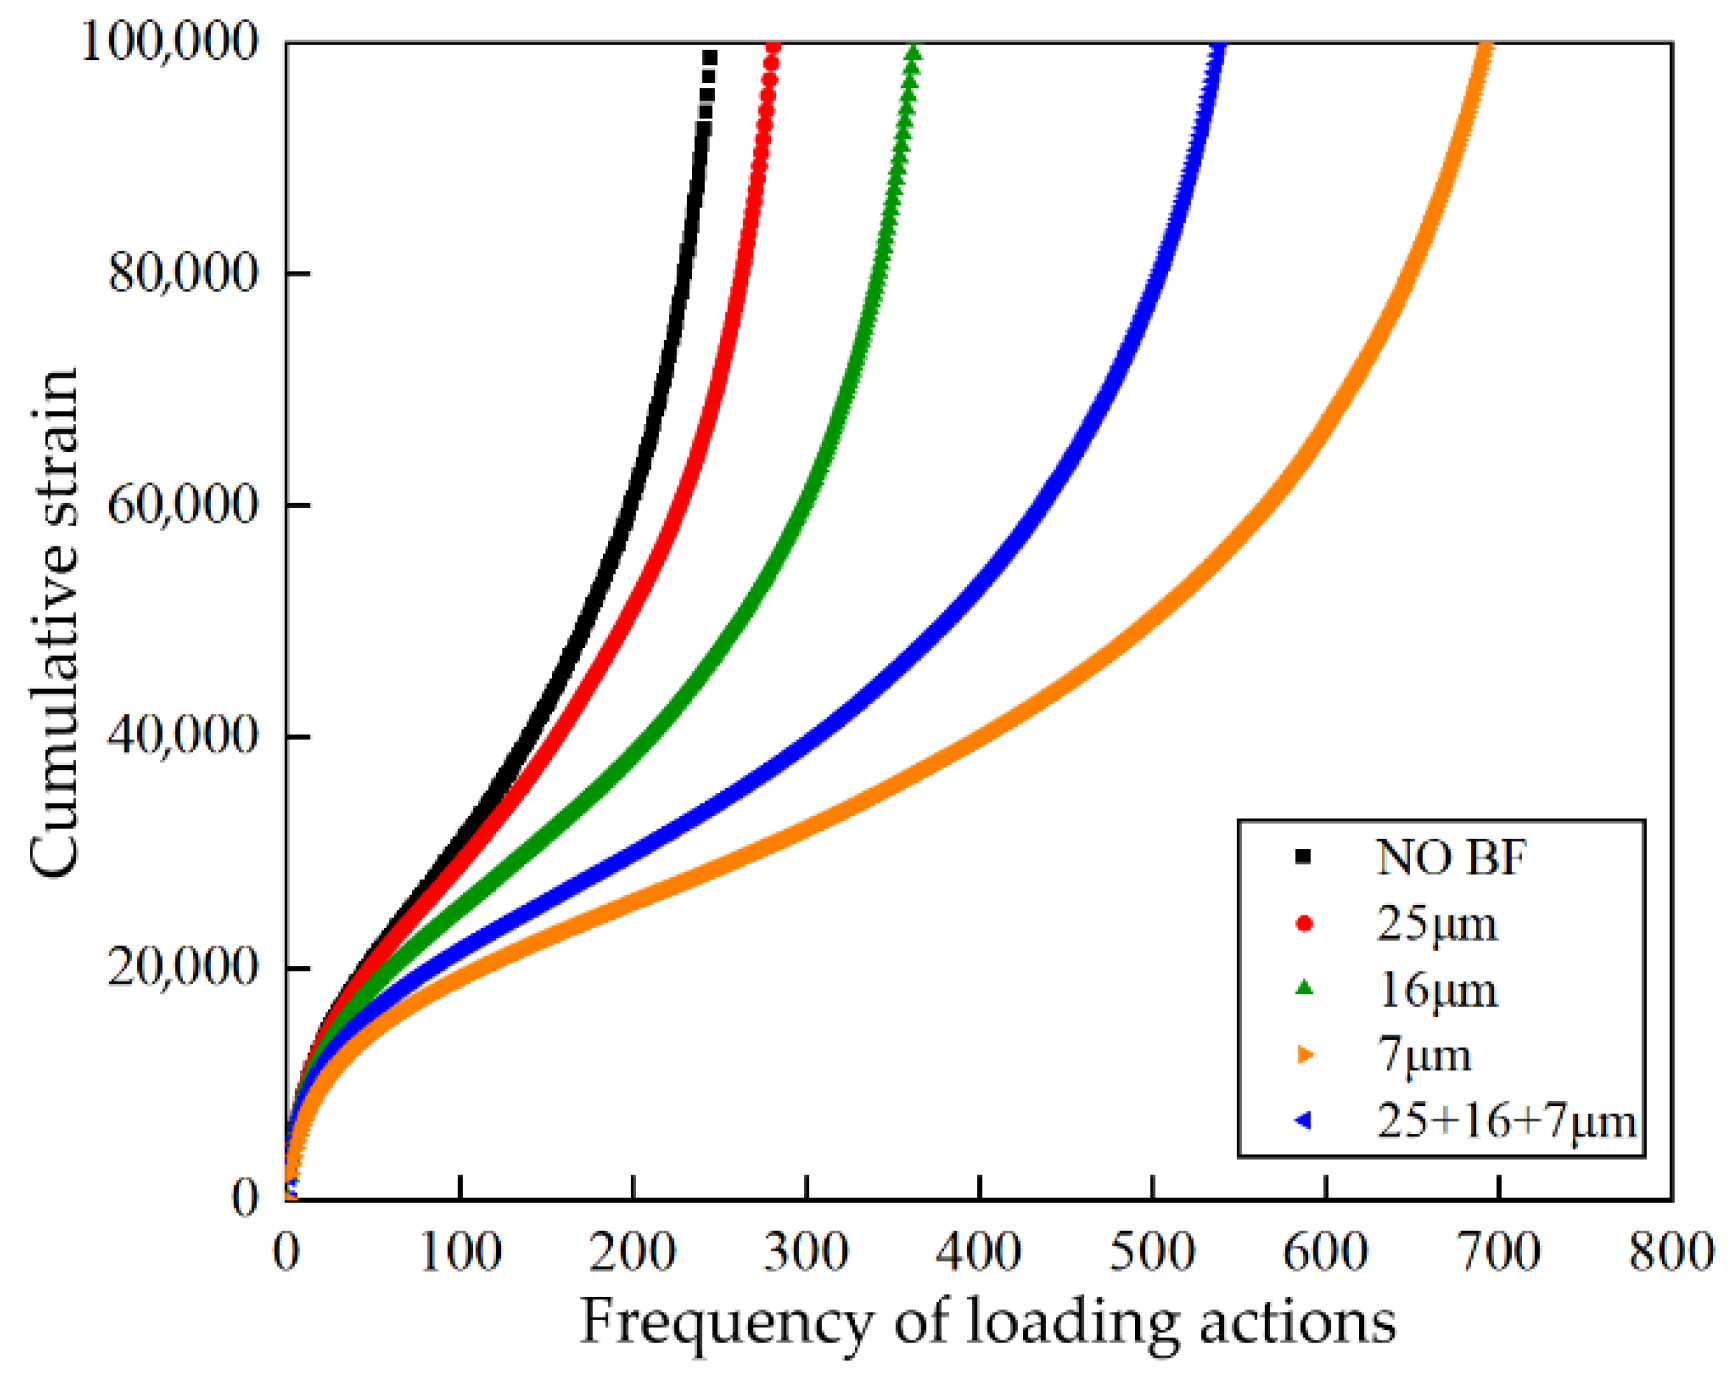
The results of the dynamic creep test are shown in Figure 11 and Table 8. In comparison to the asphalt mixtures without fiber, the incorporation of BFs effectively diminishes the creep rate while increasing the rheological times compared with the control group. This suggests that the interlacing of fibers enhances the deformation resistance of the asphalt mixture. Notably, the addition of BFs of varying diameters results in a decrease in the creep rate of the asphalt mixture as the fiber diameter diminishes, concurrently leading to an increase in the Fn. Specifically, when fibers with a diameter of 7 μm are utilized, the creep rate attains a minimum value of 64, while the rheological number reaches a maximum of 349, indicating optimal high temperature deformation resistance at this juncture. Furthermore, when BFs of a mixed diameter are blended, the creep rate and Fn of the asphalt mixture fall within the range of 16 μm to 7 μm, with corresponding values of 87 and 301, respectively. This observation suggests that the high temperature deformation resistance in the asphalt mixture enhances as the diameter of the BFs decreases. The superior performance of the 7 μm BF can be attributed to its high strength and modulus, which facilitate uniform dispersion within the asphalt mixture. These fibers effectively augment the viscosity of the asphalt at elevated temperatures, thereby mitigating flow deformation and enhancing the mixture’s resistance to deformation. Additionally, when BFs of a mixed diameter are incorporated, the proportion of 7 μm fibers diminishes, which results in the formation of a more intricate spatial fiber network that can absorb more asphalt, thereby improving the dynamic mechanical properties of the asphalt mixture.

3.3.4. Viscoelastic Property

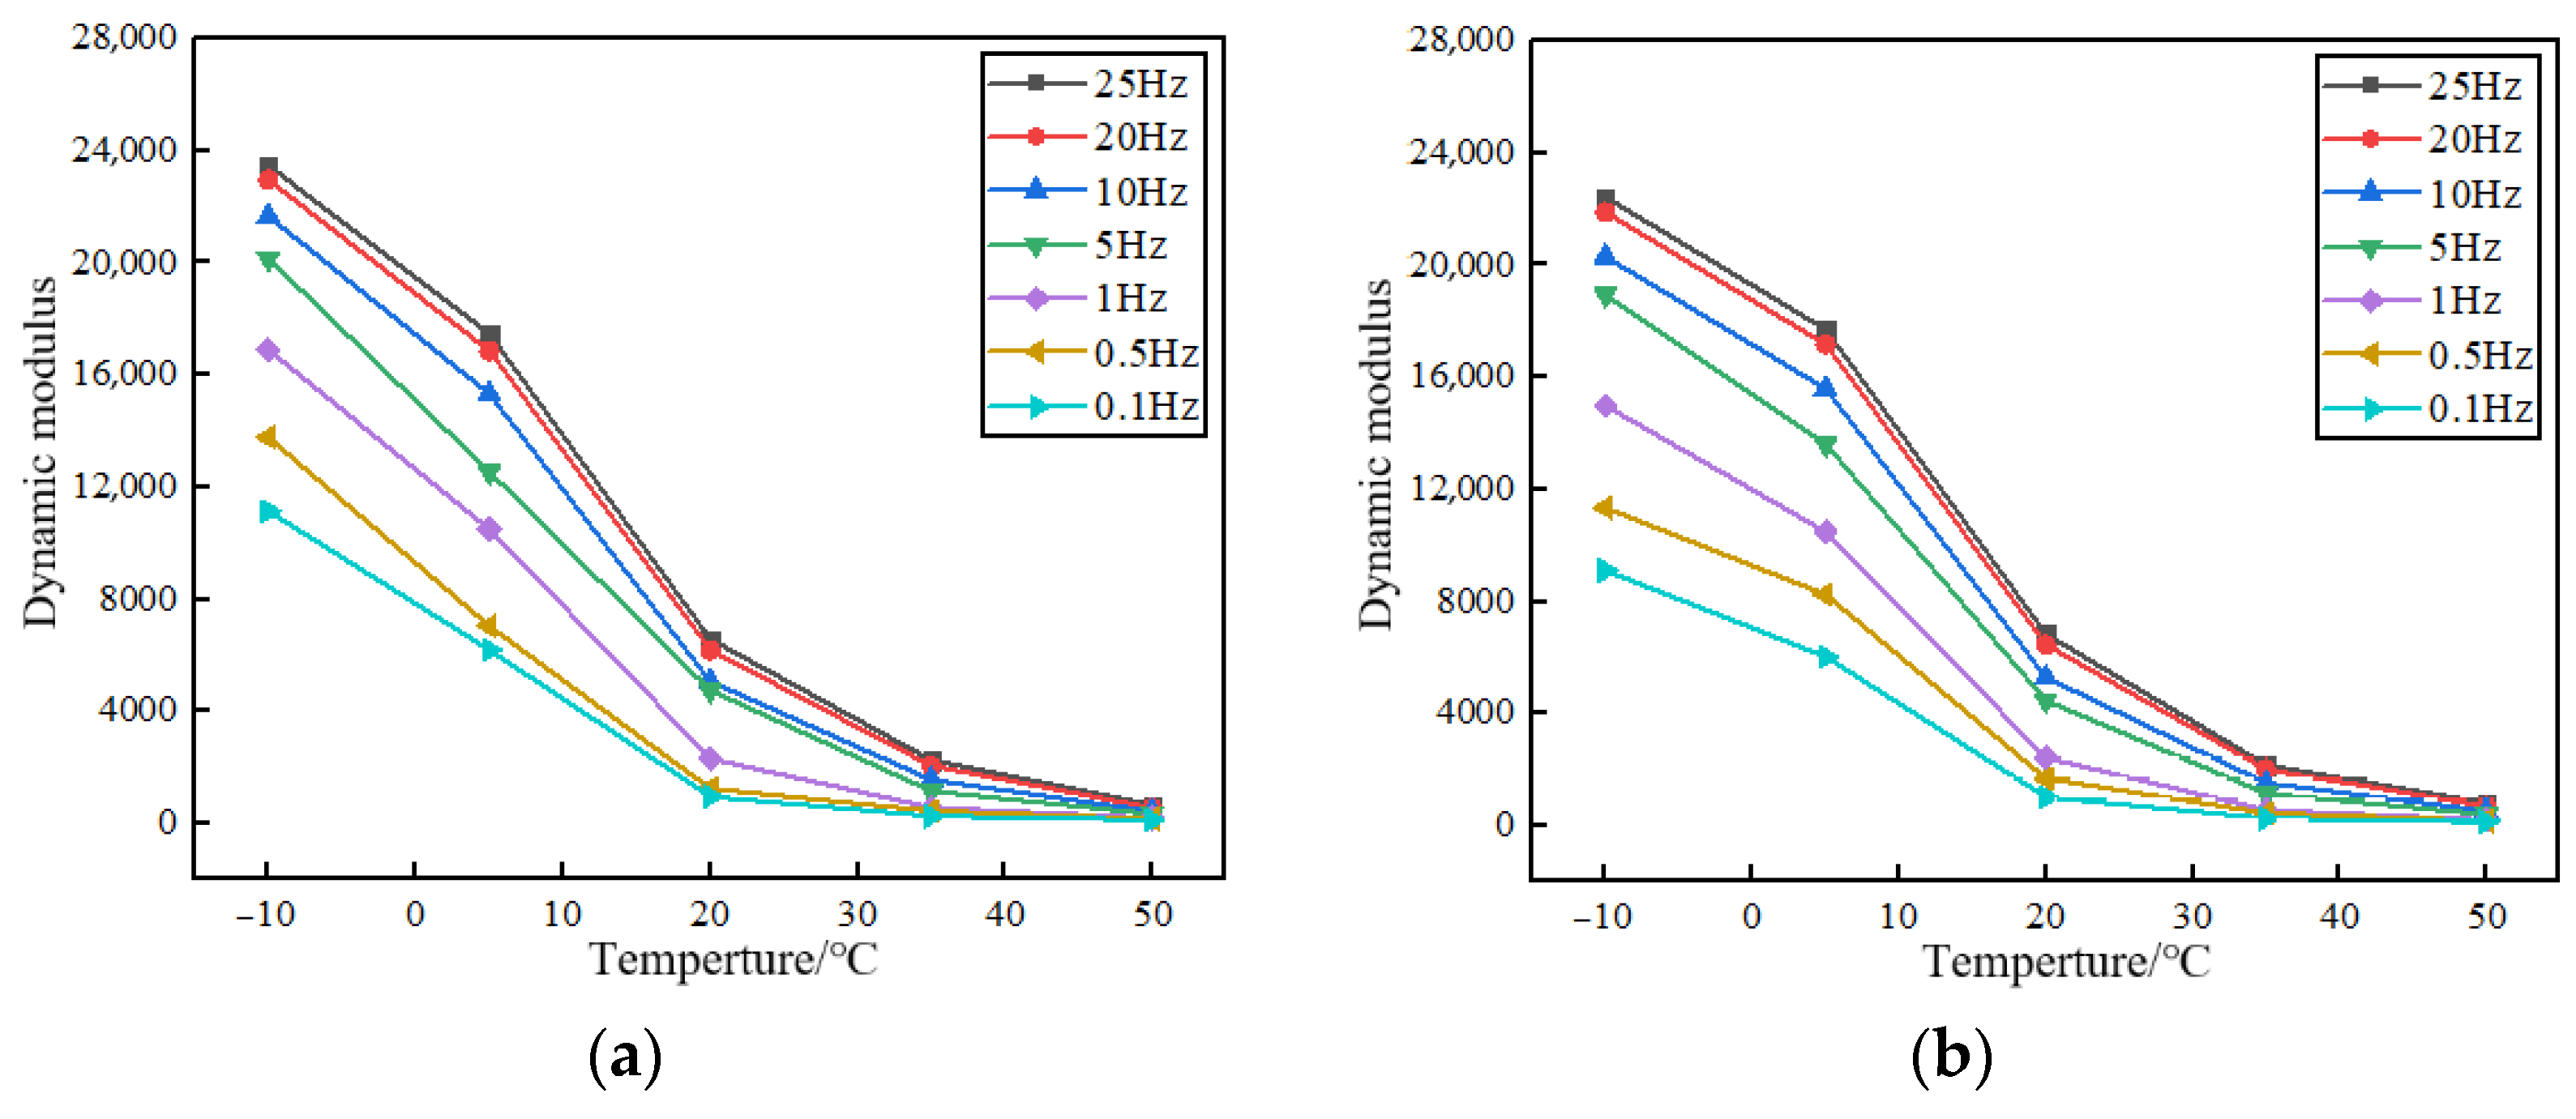
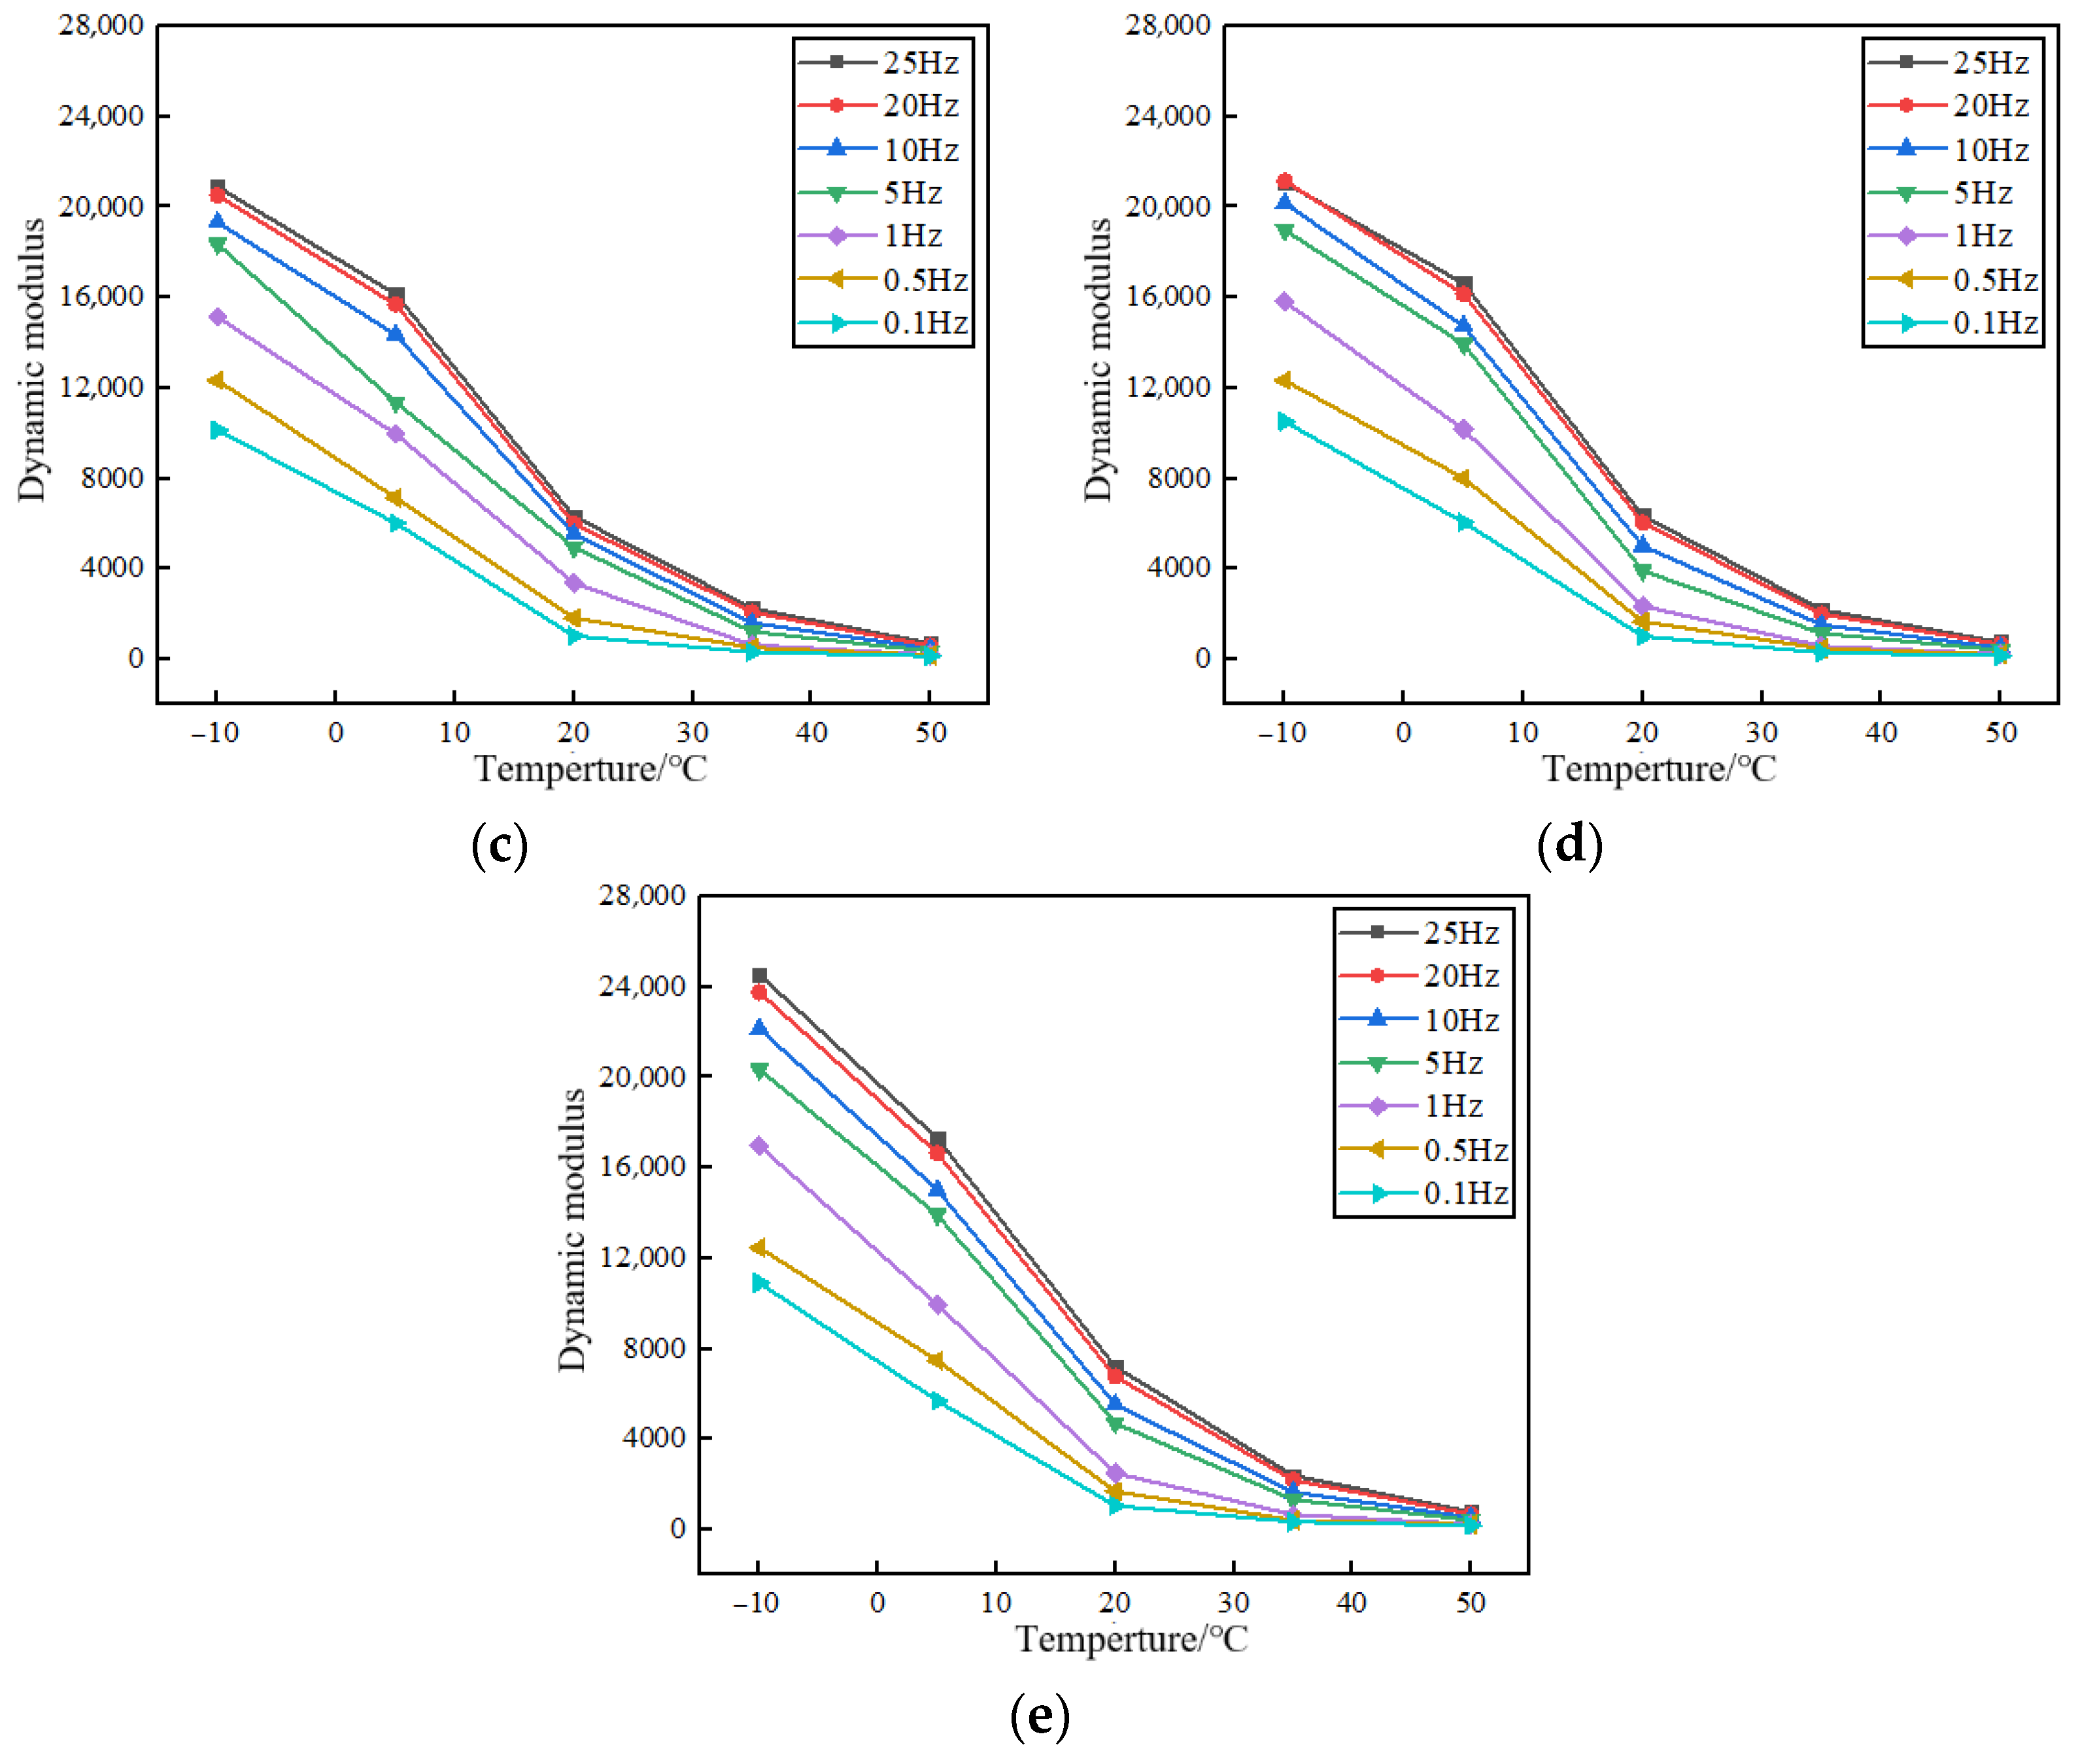
The dynamic modulus curves of different BFAMs across various temperatures and frequencies are shown in Figure 12. From Figure 12a–e, it is clear that the dynamic modulus of all types of the asphalt mixtures decreases with a reduction in temperature across all frequencies. Notably, there is a rapid decline in the dynamic modulus observed between −10 °C and 20 °C, while the rate of decline becomes more moderate between 20 °C and 50 °C. At 50 °C, the dynamic modulus values at frequencies of 1 Hz, 0.5 Hz, and 0.1 Hz converge to nearly identical levels. Under the conditions of 50 °C and 10 Hz, the dynamic modulus of the BFAM with fiber diameters of 25 μm, 16 μm, 7 μm, and a mixed diameter increased by 29.1 MPa, 77.4 MPa, 94.2 MPa, and 99.7 MPa, respectively. Under other loading frequencies, the dynamic modulus of the BFAM also increase by various degrees. The explanation could be that the BF undertakes part of the internal stress of the asphalt mixture, and relieves the stress concentration at the crack tip, which has improved the mechanical state and flexibility of the asphalt mixture.
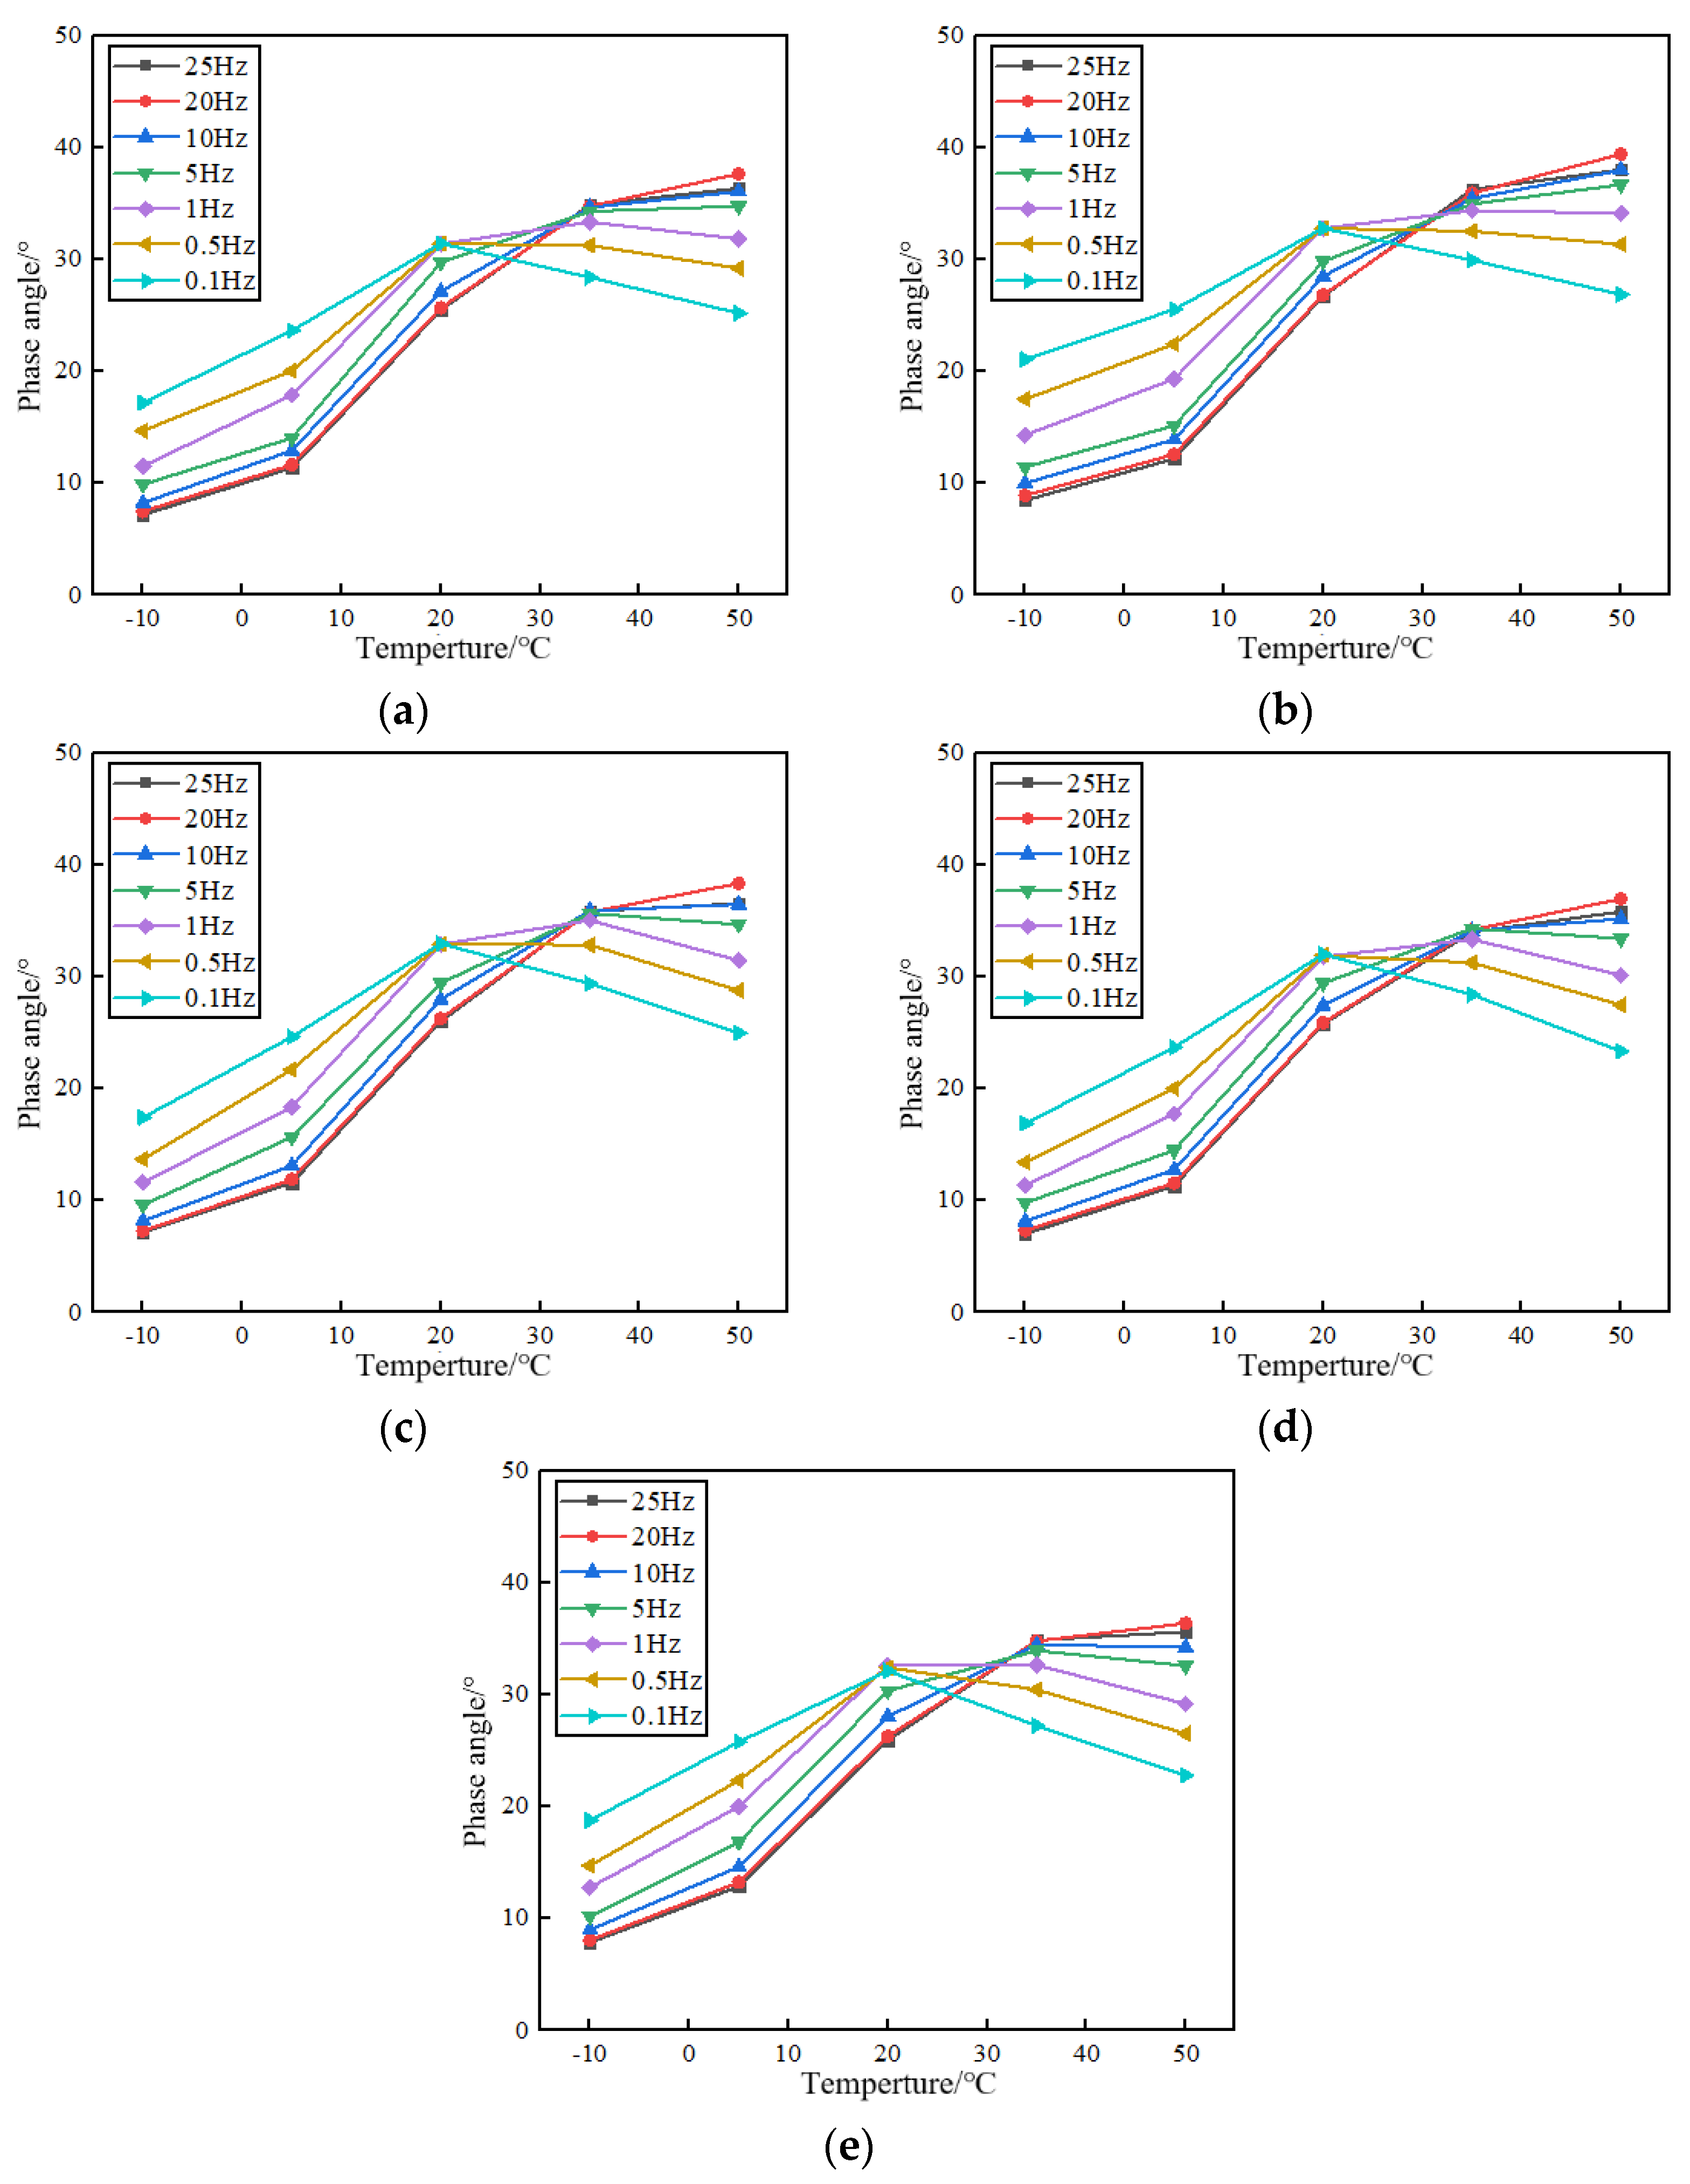
The phase angle curves of different BFAMs across various temperatures and frequencies are shown in Figure 13. As illustrated in Figure 13a–e, temperature emerges as the primary factor influencing the dynamic modulus of the materials. An increase in temperature causes an enhancement of the viscous characteristics of the asphalt mixtures, while concurrently diminishing their elastic properties. Consequently, at elevated temperatures, the dynamic modulus across various frequencies is reduced, and the differences in results between adjacent temperatures become less pronounced, although uniform comparisons remain challenging. Conversely, at lower temperatures, the elastic properties are more pronounced, leading to a significant increase in the dynamic modulus. Thus, it can be concluded that the dynamic modulus is predominantly governed by elastic properties. This assertion is further supported by subsequent observations. In terms of the phase angle’s response to frequency, the trend is comparatively less distinct. Specifically, when the temperature exceeds 40 °C, the phase angle exhibits an increasing trend with rising frequency; conversely, when the temperature is below 40 °C, the phase angle demonstrates a decreasing trend.
The master curves of the dynamic modulus presented in Figure 14 are organized according to the dates of five sections of the BFAM with varying fiber diameters at 10 Hz. The behavior of the dynamic modulus master curve in the low-frequency range serves as a basis for evaluating and analyzing the high temperature performance, while the behavior in the high-frequency range is pertinent for assessing the low-temperature performance. Consequently, it is preferable for the dynamic modulus to exhibit lower values at high frequencies and higher values at low frequencies. The dynamic modulus of the five master curves corresponding to mixtures containing BFs is markedly lower than that of the mixture without fiber at high frequencies. Among these, the mixture with a fiber diameter of 7 μm demonstrates the most favorable properties, followed by a mixed diameter, 16 μm, 25 μm, and the asphalt mixtures without fiber. The test outcomes align closely with the results from the rutting test, suggesting that BF effectively enhances the high temperature performance.
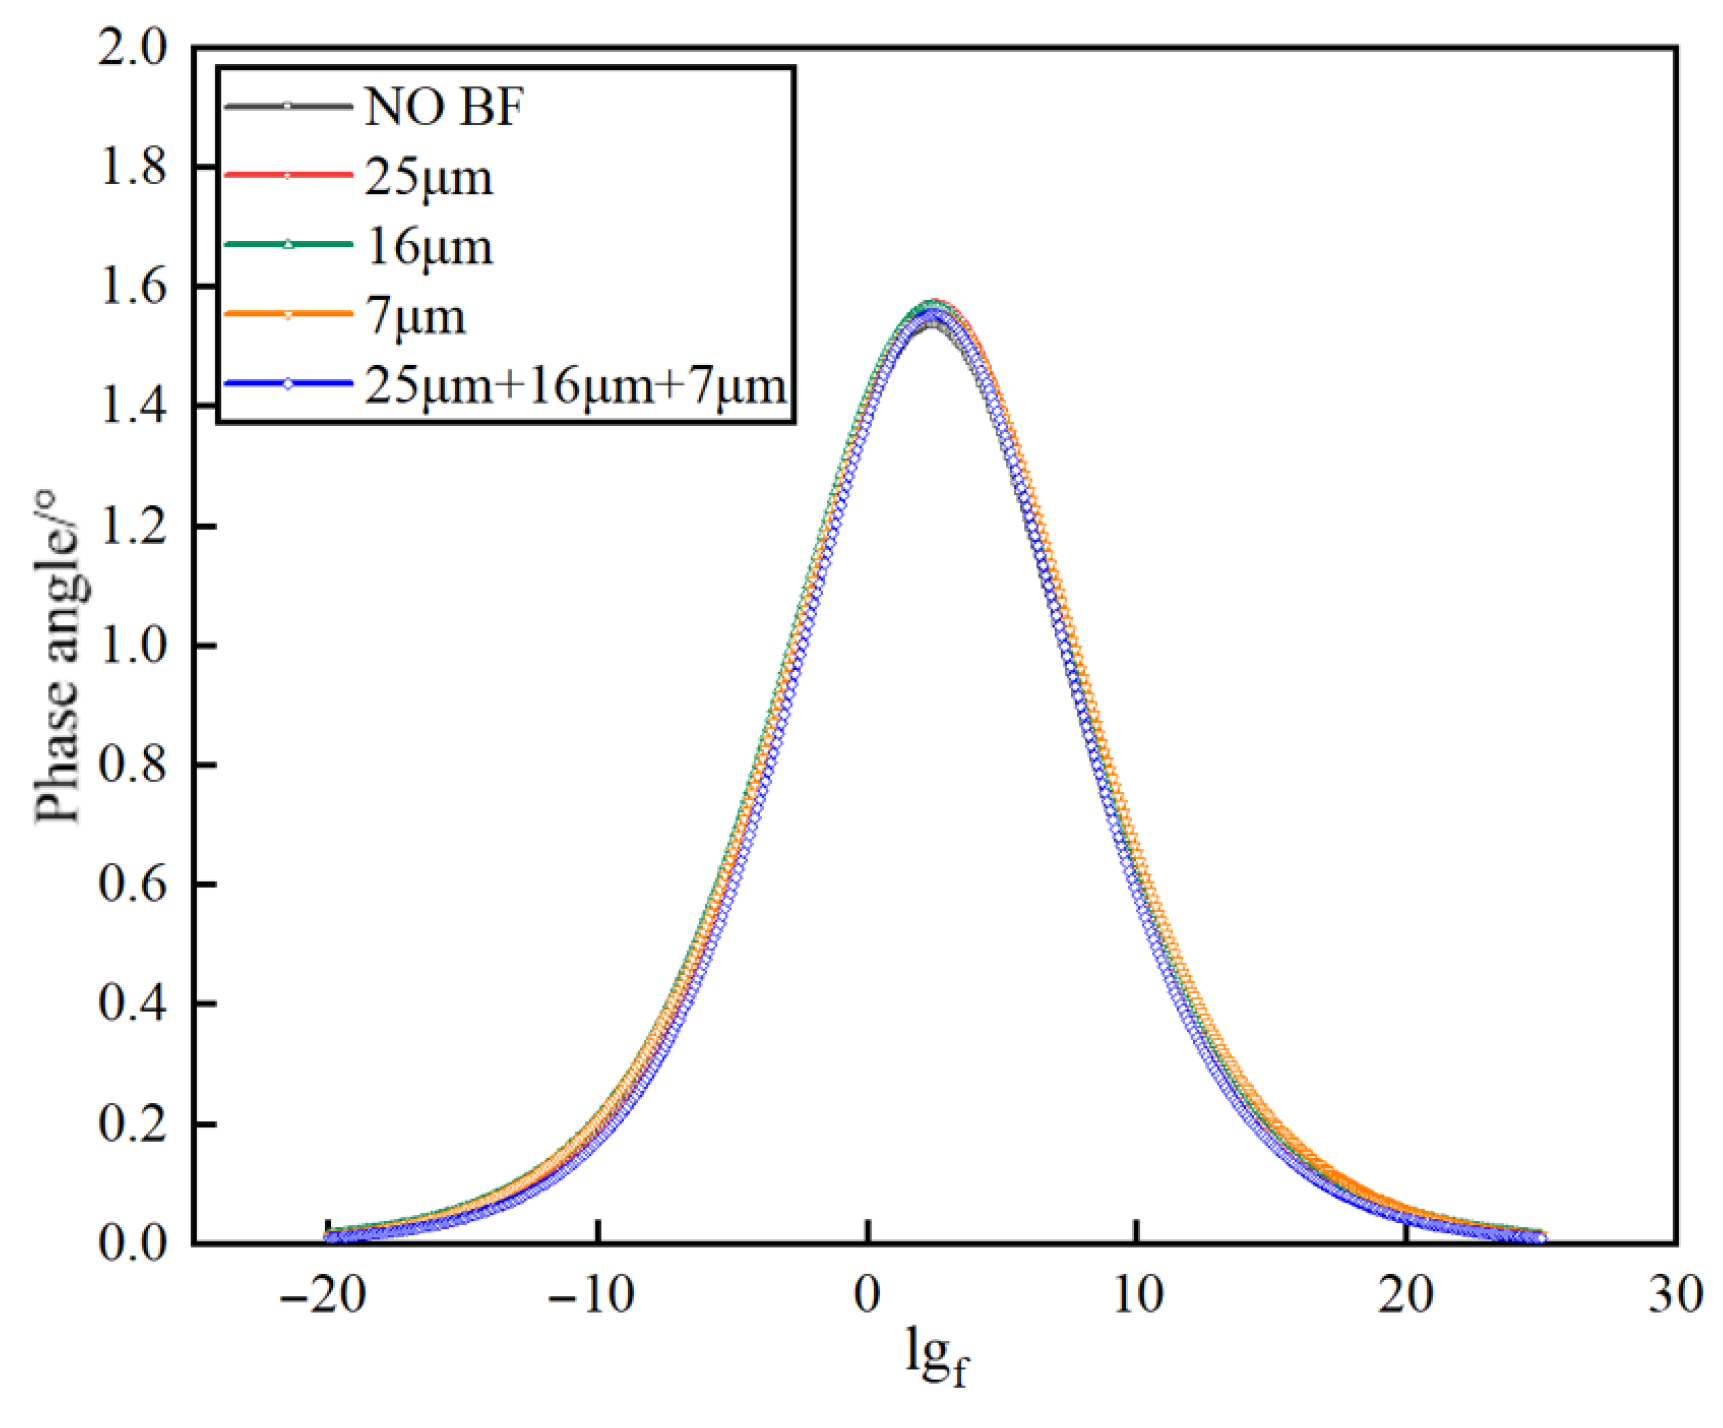
The main curves of the phase angle are presented in Figure 15, which demonstrates that variations in temperature and frequency exert distinct effects on the phase angle. The phase angle is an indicator of the internal relationship between the elastic and viscous properties of materials during compression. Additionally, it is a measure of the rutting resistance of the asphalt mixtures. As temperature increases, the viscous characteristics of the material become more pronounced, leading to greater energy dissipation and an increase in the phase angle. However, temperature is not the sole determinant of the phase angle. This parameter not only encapsulates the viscoelastic properties of materials but also illustrates the phase relationship between stress and strain during loading. A larger phase angle signifies a more pronounced lag of strain relative to stress. As depicted in Figure 15, the master curve equation for the phase angle is characterized by a convex shape, where the phase angle initially rises to a maximum value before subsequently decreasing with increasing frequency.

3.4. Mechanism Analysis Using the Equal Cross-Section Theory

3.4.1. Equal Cross-Section Theory

The equal cross-section theory [33] follows the hypothesis that all fibers are oriented parallel to the primary longitudinal axis of the BFAM and are organized in a square matrix configuration of nf × nf. Each fiber possesses a circular cross-section, with uniform length and quality across all fibers. The cross-sectional dimensions of the cube are established at 100 mm × 100 mm, in alignment with the parameters of the Marshall test. The fibers are specified to have a length of 12 mm, as this dimension is utilized in the experimental segment of the current study. The total mass of the asphalt mixture utilized in the Marshall test is 1200 g.
Within this theory, a significant new parameter, referred to as the total transformed cross-section (TTCR), is introduced. This parameter pertains to various lines and can be computed by Equation (16):
T T C R = n f × T C R = E f E A C × n f 2 × s f = E f E A C × S f
where nf is the number of fibers in each row or column of the cube; TCR is the area of asphalt concrete converted by the cross-sectional area of all fibers in each row, cm2; Ef and EAC are the Young’s modulus of fiber and asphalt concrete, respectively, MPa; sf is the cross-sectional area of a single fiber, cm2; Sf is the total cross-sectional area of all transverse fibers in the set cube, cm2.
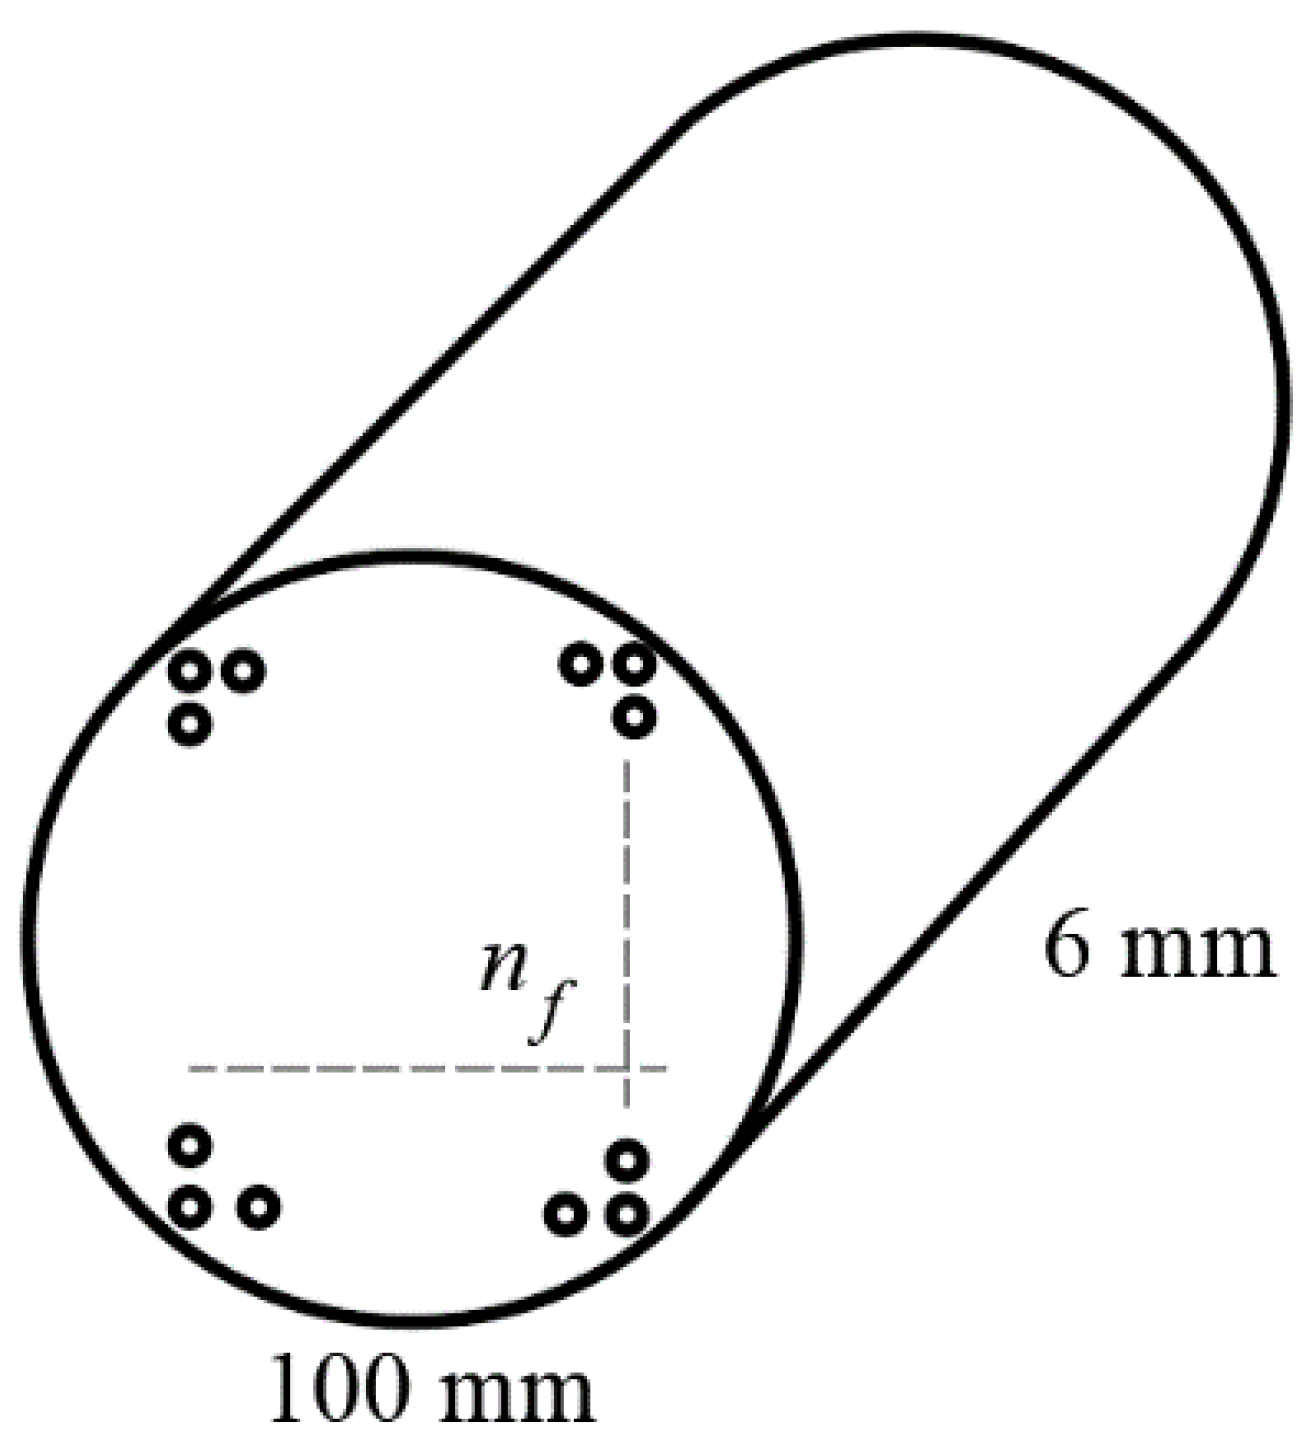
The dynamic modulus specimen utilized in this research is a cylindrical structure with a diameter of 100 mm and a height of 150 mm. It is posited that the BFAM slicing unit is similarly cylindrical, possessing a diameter of 100 mm and a height of 6 mm, as illustrated in Figure 16.
Furthermore, the following assumption is necessary: all fibers within the mixture are oriented parallel to the primary longitudinal axis of the asphalt matrix. all fibers are oriented parallel to the primary longitudinal axis of the unit cylinder composed of the BFAM, and they are arranged in a circular configuration. The cross-sectional shape of all fibers is circular, and each fiber possesses identical length and mass.
Based on this configuration, the total weight of the asphalt mixture is determined to be 113.96 g. In this investigation, a frequency of 10 Hz has been selected to replicate typical driving loads. Utilizing the aforementioned algorithm, the values of TCR and TTCR for the BFs of varying diameters have been computed, as presented in Table 9.

3.4.2. Relationship Between the TTCR of the BFs and the Performance and Mechanism of the Asphalt Mixture

The comparison between the TTCR values and the performance of the asphalt mixture are presented in Table 10 to investigate the correlation between the diameter of the BFs and the performance of the asphalt mixture. It can be seen from Table 10 that the TTCR values are ranked as follows: 7 μm > mixed diameter > 16 μm > 25 μm, since the total volume of fibers remains constant at a given dosage. Consequently, shorter fibers result in a greater number of fibers, thereby increasing the cross-sectional area engaged in the replacement according to the equal cross-section theory. According to this theory, a higher TTCR value correlates with an increased moment of inertia contributed to by the fibers. This suggests that fibers characterized by elevated TTCR values enhance the matrix’s capacity to withstand external loads, thereby improving the overall performance of the matrix.
This finding suggests that the fiber with a diameter of 7 μm presents the best reinforcement effect on the asphalt mixture. This result is consistent with the performance test results of asphalt mortar and asphalt mixture under conditions of elevated, moderate, and low temperatures. Based on the equal cross-section theory, the selection of fibers for use in the BFAM should prioritize the Young’s modulus of the fiber, which pertains to the type of fiber, followed by the consideration of specific fiber characteristics, particularly the diameter. It will help to improve the performance of the asphalt mixture when the Young’s modulus of fiber is relatively high and the diameter of the fiber is relatively small.
The alteration of fiber diameter significantly influences the high temperature stability of asphalt mixtures, while exerting a lesser effect on water stability. This phenomenon can be attributed to the TTCR value, which primarily reflects the characteristics associated with fiber diameter and quantity, both of which are functional variables of the BFs. When the fiber diameter is smaller, the number of fibers increases under the same dosage, and the fibers are wound with each other to form a denser fiber frame, thus adsorbing more structural asphalt, making the asphalt mixture performance better. When the BFAM is subjected to external load, the fiber–asphalt blend can fully absorb external energy by its own synergistic deformation, thereby preventing the relative displacement between fiber and asphalt, asphalt and aggregate, and aggregate and aggregate. This phenomenon plays a certain role in delaying or even preventing the damage of the BFAM. This effect is more pronounced under high temperature conditions.

4. Conclusions

This investigation examined the impact of fiber diameter on the performance characteristics of the asphalt mixture, including high temperature performance, anti-cracking performance, and water stability performance. The mechanical properties of the BFAM with different diameters were measured based on the ideal cracking test, the triaxial shear test, the dynamic creep test, and the dynamic modulus test. Furthermore, the reinforcement mechanism of fiber diameter on the mixture was explored based on the equal cross-section theory. The following conclusions can be drawn.
(1)
Adding BFs can effectively improve the performance of the asphalt mixture, and the fiber diameter is a significant factor. The five types of BFs with different diameters present different reinforcing effects on the mixture performance, from excellent to poor, which are in the following order: 7 μm, mixed diameter, 16 μm, and 25 μm, indicating that smaller diameter BFs exhibit more remarkable improvements in asphalt mixture performance.
(2)
BFs with a diameter of 7 μm demonstrate the best improvement in mixture performance. The dynamic stability of the asphalt mixture containing 7 μm BF increased by 32.7%, the maximum bending tensile strain improved by 21.5%, the increase in the percentage of the Marshall stability improved from 37.7% to 40.5%, the CTindex improved by 44.1%, the RTindex improved by 67.8%, the cohesion improved by 61.5%, the creep rate attained a range of 64 to 349, and the dynamic modulus rose by 99.7 MPa (50 °C, 10 Hz), respectively.
(3)
The performance of a mixed diameter BFAM is better than 16 µm, and slightly worse than 7 μm, indicates that a mixed diameter BF (7 μm: 16 μm: 25 μm = 1:1:1) has an excellent reinforcing effect on the mixture performance.
(4)
The TTCR of fibers with different diameters are ranked from high to low as follows: 7 μm, mixed diameter, 16 μm, and 25 μm, which shows that the 7 μm BF presents the best reinforcement effect for the mixture, which is consistent with the performance test results of the asphalt mixture. According to the results of the equal cross-section theory, it will help to improve the performance of the asphalt mixture when the Young’s modulus of the fiber is relatively high and the diameter of the fiber is relatively small.
(5)
According to the equal cross-section theory, when the fiber diameter is smaller, the number of fibers increases under the same dosage, and the fibers are wound with each other to form a denser fiber frame, thus adsorbing more structural asphalt, making the asphalt mixture performance better. When the BFAM is subjected to external load, the fiber–asphalt blend can fully absorb external energy by its own synergistic deformation, thereby preventing the relative displacement between fiber and asphalt, asphalt and aggregate, and aggregate and aggregate. This phenomenon plays a certain role in delaying or even preventing the damage of the BFAM. This effect is more pronounced under high temperature conditions.
This study has certain limitations, including discrepancies between laboratory conditions and field practices, as well as incomplete coverage of fiber parameter combinations. In the future, the performance examination can be investigated in field validation tests. Consideration may be given to producing fiber products with fibers of different diameters mixed together during the production process for engineering applications.

Author Contributions

Conceptualization, C.K. and Z.C.; methodology, C.K.; software, J.S. and S.X.; validation, C.K. and A.K.; formal analysis, C.K., J.S., and S.X.; investigation, C.K. and Z.C.; resources, C.K.; data curation, C.K., J.S., and S.X.; writing—original draft preparation, C.K. and S.X.; writing—review and editing, C.K., D.W., and A.K.; visualization, D.W.; supervision, A.K.; project administration, C.K. and A.K.; funding acquisition, C.K. All authors have read and agreed to the published version of the manuscript.

Funding

This research was funded by the National Natural Science Foundation of China, grant number 52478476; China Scholarship Council, grant number 202408320219; Natural Science Foundation for Youths of Jiangsu Province, grant number BK20190913; Yangzhou University High-level Talent Support Program and the Qing Lan Project of Jiangsu Province.

Data Availability Statement

The original contributions presented in this study are included in the article. Further inquiries can be directed to the corresponding author.

Conflicts of Interest

The authors declare no conflicts of interest.

Nomenclature

To enhance the clarity and readability of the manuscript, this section defines all abbreviations and symbols used in the text, equations, and tables.
AbbreviationFull Name
ACCDAsphalt Concrete Cracking Device
BFBasalt Fiber
BFAMBasalt Fiber Asphalt Mixture
CTindexCracking Index
DSDynamic Stability
E*Composite Dynamic Modulus
E’Storage Modulus
E’’Loss Modulus
GfFracture Energy
IDEAL-CTIDEAL Cracking Test
IDEAL-RTIDEAL Rutting Test
IDTIndirect Tensile Test
ISDTIn Situ Direct Tension Test
MSMarshall Stability
MS0Immersion Residual Stability
PBMaximum Failure Load
RTindexRutting Index
RTFOTRolling Thin Film Oven Test
SBBending Stiffness Modulus
SCBSemi-Circular Bending Test
SBSStyrene–Butadiene–Styrene Block Copolymer
TCRTransformed Cross-Sectional Area
TTCRTotal Transformed Cross-Section
VFAAsphalt Saturation
VMAMineral Aggregate Gap Rate
VVVoid Ratio
SymbolDescription
a, b, c, d, fFitting coefficients 
bWidth of the specimen mid-span section
C1, C2Correction coefficients of the rutting test machine
dMid-span deflection of the specimen at failure
d1, d2Deformation depths of the specimen at t1 and t2
DDiameter of cylindrical specimens
EfYoung’s modulus of basalt fiber
EACYoung’s modulus of asphalt concrete
fLoading frequency
FnRheological times 
hHeight of the specimen section
l75Displacement of the specimen corresponding to 75% post-peak load
LSpan of the prismatic beam specimen
|m75|Absolute value of the slope of the load-displacement curve at 75% post-peak load
nfNumber of fibers per row/column in the cube unit 
NNumber of wheel pressure reciprocations (rutting test); load cycles (dynamic creep test)
NpsCritical load cycles at the transition from compaction stage to stable stage (creep)
NstCritical load cycles at the transition from stable stage to destruction stage (creep)
PmaxMaximum load applied to the specimen
σSinusoidal applied stress
σ0Maximum amplitude of sinusoidal stress
εSinusoidal feedback strain
ε0Maximum amplitude of sinusoidal strain
εBMaximum bending tensile strain at the bottom of the beam
εpCumulative microstrain of the specimen
εpsCumulative microstrain at the start of the stable creep stage
εstCumulative microstrain at the end of the stable creep stage
ΦPhase angle 
sfCross-sectional area of a single basalt fiber
SfTotal cross-sectional area of all transverse fibers in the cube unit
tTest time (dynamic modulus test); specimen thickness (IDEAL-CT/RT tests)
t1, t2Test times (45 min and 60 min, respectively) in the rutting test
wWidth of the upper load strip in the IDEAL-RT test
ωAngular velocity of sinusoidal loading
UnitApplicable Equations/Sections
DimensionlessEquations (10)–(12)
mmEquation (2)
DimensionlessEquation (1)
mmEquation (3)
mmEquation (1)
mmEquations (6), (8), and (9)
MPaEquation (16)
MPaEquation (16)
HzEquations (13)–(15); Figure 14
CyclesTable 8
mmEquations (2) and (3)
mmEquations (6) and (8)
mmEquations (2) and (3)
kN/mmEquations (6)–(8)
DimensionlessEquation (16)
Cycles/min (rutting); Cycles (creep)Equation (1); Equations (10)–(12) (creep)
CyclesEquations (10) and (11) (dynamic creep test)
CyclesEquations (11) and (12) (dynamic creep test)
kNEquation (9)
MPaEquations (13)–(15)
MPaEquations (13)–(15) (dynamic modulus test)
μεEquations (13)–(15) (dynamic modulus test)
μεEquation (3) (low-temperature beam bending test)
μεEquations (10)–(12) (dynamic creep test)
μεEquations (11) and (12) (dynamic creep test)
μεEquations (11) and (12
Degree (°)Equations (13)–(15); Figure 13
Mm2Equation (16)
mm2Equation (16)
s (dynamic modulus); mm (IDEAL tests)Equations (6), (8), and (9); Equations (13)–(15)
minEquation (1)
mEquation (9)
rad/sEquations (13)–(15)

References

  1. Sun, X.; Wang, H.; Liu, S. Research on road performance of fiber-reinforced semi-flexible pavement materials. J. China Foreign Highway 2024, 45, 106–117. [Google Scholar] [CrossRef]
  2. Xu, T.; Gu, X.; Ni, F. Test and performance study of basalt fiber reinforced asphalt concrete. J. Transp. Eng. Inf. 2011, 69, 115–121. [Google Scholar]
  3. Xiao, P.; Wu, B.; Xu, Y.; Jiang, D. Experimental study on road performance of SMA using different fibers. J. China Foreign Highway 2014, 34, 302–306. [Google Scholar]
  4. Wu, Z.; Jiang, D.; Lv, Y.; Xiao, P.; Ding, Z.; Yu, H. Toughness research and mechanism analysis of basalt fiber asphalt mixture. J. Nanjing Univ. Sci. Technol. 2015, 39, 500–505. [Google Scholar]
  5. Wu, S.; Haji, A.; Adkins, I. State of art review on the incorporation of fibres in asphalt pavements. Road Mater. Pavement Des. 2022, 24, 1559–1594. [Google Scholar] [CrossRef]
  6. Zhang, X. Study on neutral energy of basalt fiber in pavement application. Highway Traffic Sci. Technol. (Appl. Technol. Ed.) 2015, 11, 113–115. [Google Scholar]
  7. Yan, J.; Wang, G.; Zheng, J. Study on pavement performance of basalt fiber asphalt concrete under different pavement environment. J. Phys. Conf. Ser. 2020, 1654, 012119. [Google Scholar] [CrossRef]
  8. Dai, J.J.; Jia, X.D. Fatigue performance of high-modulus basalt fiber reinforced asphalt mixture. J. Appl. Sci. Eng. 2022, 26, 1187–1193. [Google Scholar]
  9. Yang, C.; Liu, L.; Liu, Z.; Huang, Y.; Yu, S.; Fu, Y. Study on the mechanism of bond strength generation and debonding failure between basalt fiber and asphalt based on molecular dynamics. Case Stud. Constr. Mater. 2023, 19, e02493. [Google Scholar] [CrossRef]
  10. Zahedi, M.; Zarei, M. Studying the simultaneous effect of black Nanocarbon and Polyester fibers with high stability on mechanical properties of asphalt mixture. Turk. Online. J. Des. Art Commun. 2016, 4, 188–195. [Google Scholar]
  11. He, Y.; Zhang, J.; Zhao, X.; Wang, M.; Xiong, K.; Hu, Q. Study on design optimization, road performance verification and preparation process selection of hybrid fiber reinforced asphalt mixture composite. Constr. Build. Mater. 2024, 448, 138245. [Google Scholar] [CrossRef]
  12. Long, A.X.; Sun, X.J.; Yu, Z.P.; Zhang, B.; Zhang, G.; Huang, P.; Wang, J. Experimental study and mechanism analysis on the basic mechanical properties of hydraulic basalt fiber asphalt concrete. Mater. Struct. 2018, 55, 161. [Google Scholar] [CrossRef]
  13. Liu, X. Research on road performance of basalt fiber asphalt mixture. J. China Foreign Highway 2018, 38, 252–255. [Google Scholar]
  14. Hu, Z.; Zhou, Z. Experimental study on pavement performance of fiber asphalt mortar and asphalt mixture. Highway Eng. 2014, 39, 124–127. [Google Scholar]
  15. Andronov, S.; Vasiliev, Y.; Kotlyarsky, E.; Kokodeeva, N.; Kochetkov, A. Impact Study of Basalt and Polyacrylonitrile Fibers on Performance Characteristics of Asphalt Concrete. Adv. Intell. Syst. Comput. 2021, 1258, 473–485. [Google Scholar]
  16. Zhang, X.Y.; Liu, J.X. Viscoelastic creep properties and mesostructure modeling of basalt fiber-reinforced asphalt concrete. Constr. Build. Mater. 2020, 259, 119680. [Google Scholar] [CrossRef]
  17. Wang, W.; Cheng, Y.; Tan, G. Design optimization of SBS-modified asphalt mixture reinforced with eco-friendly basalt fiber based on response surface methodology. Materials 2018, 11, 1311. [Google Scholar] [CrossRef]
  18. Hui, Y.; Men, G.; Xiao, P.; Tang, Q.; Han, F.; Kang, A.; Wu, Z. Recent advances in basalt fiber reinforced asphalt mixture for pavement applications. Materials 2022, 15, 6826. [Google Scholar] [CrossRef]
  19. Xu, J.; Liu, M.; Kang, A.; Wu, Z.; Kou, C.; Zhang, Y.; Xiao, P. Effect of fiber characteristic parameters on the synergistic action and mechanism of basalt fiber asphalt mortar. Constr. Build. Mater. 2024, 438, 137234. [Google Scholar] [CrossRef]
  20. Zhao, Y.; Tan, Y.; Yu, X. Study on stress dependence of mechanical properties of asphalt mixture. J. Huazhong Univ. Sci. Technol. 2010, 38, 124–127. [Google Scholar]
  21. Liu, J.; Wang, B.; Yang, W.; Ping, J.; Zhuang, C. Study on the influence of specimen type and loading mode on dynamic modulus of asphalt mixture. Highway 2021, 66, 255–260. [Google Scholar]
  22. Jiang, Y.; Zhang, Y. Factors influencing the shear strength of asphalt mixture. Highway Transp. Sci. Technol. 2012, 29, 9–14. [Google Scholar]
  23. Wang, W.; Yang, L.; Cui, H.; Wu, F.; Cheng, Y.; Liang, C. Freeze-thaw damage mechanism analysis of SBS asphalt mixture containing basalt fiber and lignocellulosic fiber based on microscopic void characteristics. Polymers 2023, 15, 3887. [Google Scholar] [CrossRef]
  24. Li, Q.; Li, G.; Wang, H. Influence of stress mode on dynamic modulus of asphalt mixture. J. Build. Mater. 2014, 17, 816–822. [Google Scholar]
  25. Xue, Y.; Li, P.; Gao, P.; Yang, L.; Shen, M. Comparative analysis of master curve method of dynamic modulus of asphalt mixture. J. Guangxi Univ. (Nat. Sci. Ed.) 2020, 45, 1–9. [Google Scholar]
  26. Wu, B.; Pei, Z.; Xiao, P.; Lou, K.; Wu, X. Influence of fiber-asphalt interface property on crack resistance of asphalt mixture. Case Stud. Constr. Mater. 2022, 17, 01703. [Google Scholar] [CrossRef]
  27. Liu, Z.; Huang, Y.; Wang, X.; Li, S.; Liu, J. Analysis of the influence of strain level on dynamic modulus and viscoelasticity of asphalt mixture. J. China Foreign Highway 2017, 37, 188–192. [Google Scholar]
  28. Li, B.; Zhou, Y.; Kang, A. Research on fracture behavior of fiber-asphalt mixtures using digital image correlation technology. Materials 2023, 16, 6825. [Google Scholar] [CrossRef]
  29. Phung, B.N.; Le, T.; Nguyen, T.A.; Ly, H.B. Advancing basalt fiber asphalt concrete design: A novel approach using gradient boosting and metaheuristic algorithms. Case Stud. Constr. Mater. 2023, 19, 02528. [Google Scholar] [CrossRef]
  30. Huang, Q.; Kang, X.; Chen, P. Characterization of viscoelastic behavior of basalt fiber asphalt mixtures based on discrete and continuous spectrum models. PLoS ONE 2024, 19, 0296087. [Google Scholar] [CrossRef] [PubMed]
  31. Lin, C.; Kanstad, T.; Jacobsen, S.; Ji, G. Bonding property between fiber and cementitious matrix: A critical review. Constr. Build. Mater. 2023, 378, 131169. [Google Scholar] [CrossRef]
  32. Barbhuiya, S.; Das, B.B.; Kanavaris, F. A review of fracture propagation in concrete: Fundamentals, experimental techniques, modelling and applications. Mag. Concr. Res. 2023, 76, 482–514. [Google Scholar] [CrossRef]
  33. Hejazi, S.M.; Abtahi, S.M.; Sheikhzadeh, M.; Semnani, D. Introducing two simple models for predicting fiber-reinforced asphalt concrete behavior during longitudinal loads. J. Appl. Polym. Sci. 2008, 109, 2872–2881. [Google Scholar] [CrossRef]
  34. Qin, X.; Shen, A.; Guo, Y.; Li, Z.; Lv, Z. Characterization of asphalt mastics reinforced with basalt fibers. Constr. Build. Mater. 2018, 159, 508–516. [Google Scholar] [CrossRef]
  35. Abiola, O.S.; Kupolati, W.K.; Sadiku, E.R.; Ndambuki, J.M. Utilization of natural fiber as modifier in bituminous mixes: A review. Constr. Build. Mater. 2014, 54, 305–312. [Google Scholar] [CrossRef]
  36. Oda, S.; Fernandes, J.L.; Ildefonso, J.S. Analysis of use of natural fibers and asphalt rubber binder in discontinuous asphalt mixtures. Constr. Build. Mater. 2012, 26, 13–20. [Google Scholar] [CrossRef]
  37. Xie, T.; Wang, L. Optimization of Carbon Fiber Length and Content for Asphalt Mastics Based on Rheological Measurements. J. Mater. Civ. Eng. 2023, 35, 04023461. [Google Scholar] [CrossRef]
  38. Zhou, F.J.; Im, S.; Sun, L.J. Development of an IDEAL cracking test for asphalt mix design and QC/QA. Road Mater. Pavement Des. 2017, 18, 405–427. [Google Scholar] [CrossRef]
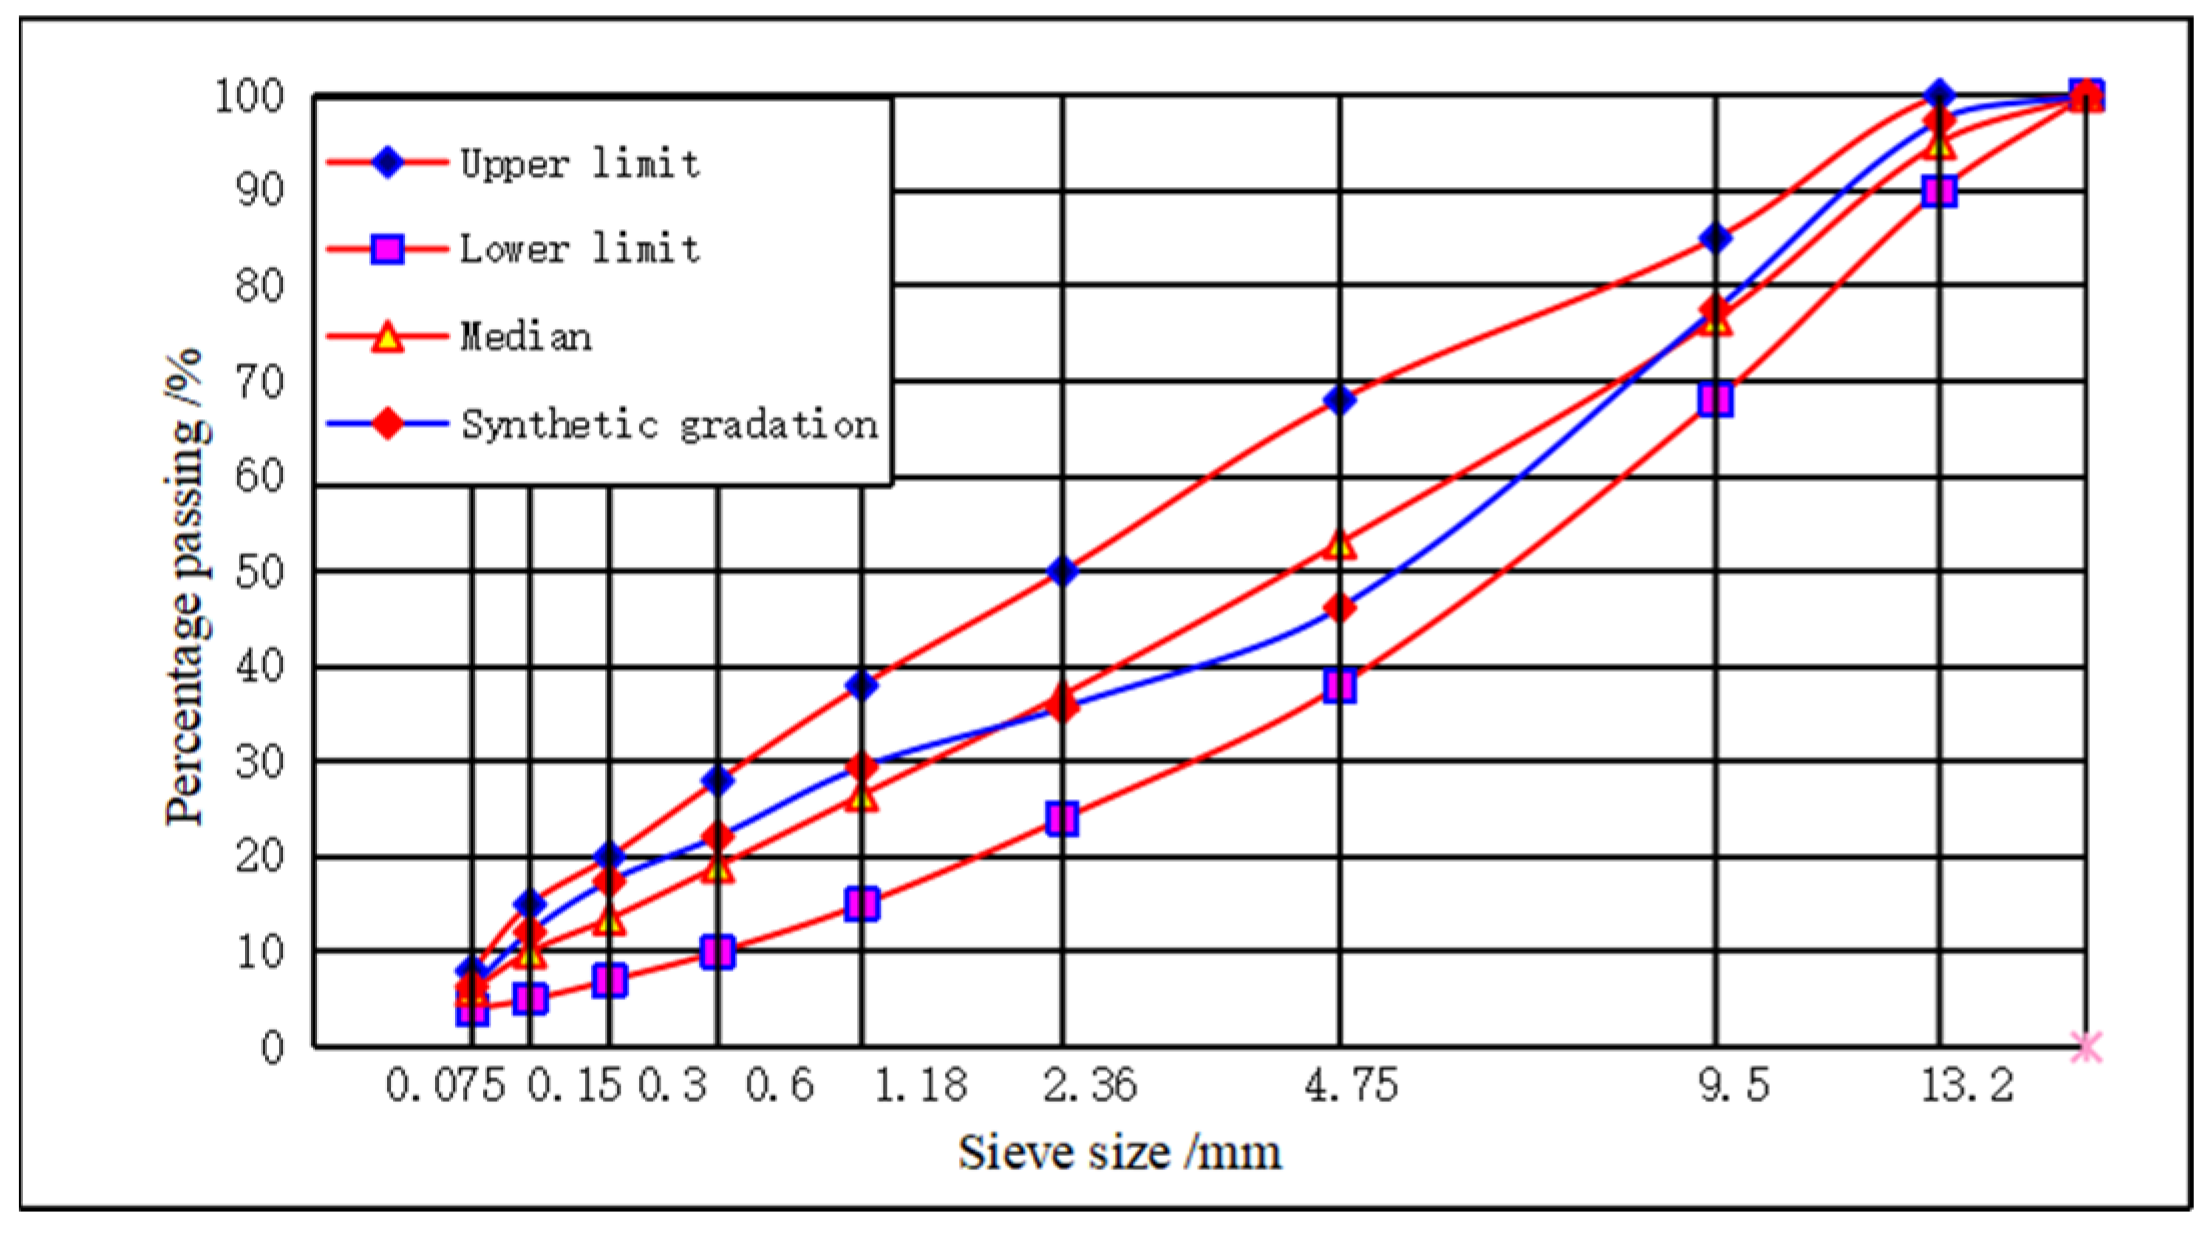
Figure 1. The gradation curve of AC13.
Coatings 15 01153 g001
Figure 2. Schematic diagram of each cracking point on the stress-displacement curve.
Coatings 15 01153 g002
Figure 3. Schematic diagram of composite modulus.
Coatings 15 01153 g003
Figure 4. Rutting test results.
Coatings 15 01153 g004
Figure 5. Low temperature crack resistance test results: (a) bending tensile strength; (b) maximum bending tensile strain; (c) bending stiffness modulus.
Coatings 15 01153 g005
Figure 6. Stress-displacement curves of the IDEAL-CT test.
Coatings 15 01153 g006
Figure 7. Relationship between CTindex and fiber diameter.
Coatings 15 01153 g007
Figure 8. Stress-displacement curves of the IDEAL-RT test.
Coatings 15 01153 g008
Figure 9. Relationship between the RTindex and fiber diameter.
Coatings 15 01153 g009
Figure 10. Shear resistance test results: (a) cohesive force; (b) internal friction angle.
Coatings 15 01153 g010
Figure 11. Relation between dynamic creep cumulative strain and load action times.
Coatings 15 01153 g011
Figure 12. Dynamic modulus curves of different BFAMs: (a) with 25 μm BF; (b) with 16 μm BF; (c) with 7 μm BF; (d) Internal friction angle; (e) control group.
Coatings 15 01153 g012aCoatings 15 01153 g012b
Figure 13. Phase angle curves of different BFAMs: (a) with 25 μm BF; (b) with 16 μm BF; (c) with 7 μm BF; (d) Internal friction angle; (e) control group.
Coatings 15 01153 g013
Figure 14. Master curves of dynamic modulus.
Coatings 15 01153 g014
Figure 15. Main curves of phase angle.
Coatings 15 01153 g015
Figure 16. Assumed unit of constant section.
Coatings 15 01153 g016
Table 1. Properties of SBS-modified asphalt.
Test ItemsTest ResultMethodSpecification Requirements
Penetration (25 °C), 0.1 mm71T060460~80
Softening point, °C86T0606≮55
Ductility (5 cm/min, 5 °C), cm48T0605≮30
Penetration index0.5T0604−0.4~1.0
Softening point difference, °C1.4T0661≯2.5
Elastic recovery (25 °C), %76T0662≮65
Residue after RTFOTMass change, %−0.08±1.0T0610
Penetration, %86≮60T0604
Residual ductility (15 °C), cm37≮20T0605
Table 2. Properties of aggregates.
AggregatesApparent Relative DensityGross Volume Relative Density
Basalt aggregates4.75–16 mm2.9102.855
Limestone aggregates2.36–13.2 mm2.9112.835
1.18–4.75 mm2.902/
0.075–2.36 mm2.596/
Table 3. Properties of filler powders.
Test ItemsTest ResultsRequirementsTest Methods
Moisture content/%0.3≤1Dying method
Relative density2.654≥2.5Chinese standard T0352
Hydrophilic coefficient0.63<1Chinese standard T0353
Particle size range <0.6 mm100100Chinese standard T0351
<0.15 mm92.690~100
<0.075 mm79.275~100
Table 4. Properties of chopped basalt fibers.
Test ItemsSpecification RequirementsTest Results
25 μm16 μm7 μm
Density, g·cm−3≥2.6002.712.712.71
Breaking strength, MPa≥1000194023183200
Elongation at break, %2.0–3.02.672.682.71
Elastic modulus, GPa≥80101101101
Retention rate of breaking strength, %≥85939291
Water absorption, %≤0.20.110.120.13
Table 5. Optimum asphalt–aggregate ratio of the BFAM.
NumberBasalt Fiber
Diameter, μm
Fiber Content, %Optimum Asphalt–
Aggregate Ratio, %
1control group/4.9
2250.35.0
3160.35.1
470.35.2
5mixed diameter0.35.1
Table 6. Marshall test results of the BFAM.
Oil Stone
Ratio/%
Gross Bulk Density/g cm−3Void Ratio VV/%Mineral
Aggregate Gap Rate VMA/%
Asphalt
Saturation VFA/%
Stability/kNFlow Value/mm
4.92.4144.214.370.810.744.68
5.02.4024.514.769.39.714.48
5.12.3974.614.969.29.634.89
5.22.4163.714.274.310.194.24
5.12.4004.514.669.410.024.95
Specification
requirements
/3~6≥13.065~75≥8.0≥4.0
Table 7. Immersion Marshall test results.
Fiber Diameter, μmMarshall Stability/kNImmersion Marshall Stability/kNSoaking Residual Stability/%
control group10.029.0790.52
25 11.4310.3990.90
1612.7111.6291.42
713.8012.7492.32
mixed diameter13.2512.1591.70
Table 8. Dynamic creep test results.
Type of MixturePhase II ModelR2Creep RateRheological Times Fn
control groupy = 198x + 10,2450.999198139
25 μmy = 183x + 10,7250.997183158
16 μmy = 132x + 12,4230.995132228
7 μmy = 64x + 12,6440.99864349
mixed diametery = 87x + 12,8300.99787301
Table 9. Calculation Results of Fiber Diameter and Total Transformation Section TTCR.
Fiber Diameter/μmsf/mm2nfEf/MPaEAC/MPaTCR/mm2TTCR/mm2
254.91 × 10−6394101,25030760.06425.311
162.01 × 10−6963101,25040030.04947.177
73.85 × 10−75031101,25045340.043217.609
mixed diameter2.44 × 10−6792101,25031740.06248.944
Table 10. Comparison between the TTCR values and the performance of the asphalt mixture.
Test NameEvaluating IndicatorFiber Diameter
25167Mixed Diameter
Rutting testDynamic stability DS, times, mm4666.75250.35625.85373.7
Low temperature beam bendingMaximum bending tensile strain, εB3001344737273670
Immersed MarshallSoaking residual stability, %90.9091.4292.3291.70
IDEAL-CTCTindex291.8338.7388.7344.7
Triaxial shearCohesion c, kPa292.0317.2338.1325.7
Dynamic creepRheological times Fn158228349301
Disclaimer/Publisher’s Note: The statements, opinions and data contained in all publications are solely those of the individual author(s) and contributor(s) and not of MDPI and/or the editor(s). MDPI and/or the editor(s) disclaim responsibility for any injury to people or property resulting from any ideas, methods, instructions or products referred to in the content.