Abstract
Antimony (Sb) is a key material in high-capacity potassium and sodium batteries, particularly in the fabrication of Sb–carbon composites. In this work, nanoscale Sb powder was synthesized directly from SbCl3, using Al powder as a reducing agent. The reduction process was carried out by gradually adding Al powder to an SbCl3—acetone solution under continuous cooling and stirring, owing to the highly exothermic nature of the reaction. Acetone was found to be an effective solvent, enabling the formation of Sb nanoparticles with an average particle size of 50 nm and a crystallite size of 25 nm. The purity of the produced powder was nearly 100%, as confirmed via SEM/EDS and XRD analyses. XRD patterns of both commercial and synthesized Sb powders displayed identical and ideal Sb reflections, while FTIR spectra further confirmed their structural similarity. Sintering studies revealed relative densities of 99% for pellets prepared from both commercial and synthesized powders. SEM/EDS examinations of the raw powders and sintered pellets provided complementary microstructural and compositional insights. Overall, this study demonstrates the feasibility of producing high-purity nanoscale Sb powder through a simple, single-step redox process that is both cost-effective and efficient.
1. Introduction
Nanomaterials possess unique properties that are utilized in a wide range of advanced technologies. Materials are typically classified as nanomaterials when their particle sizes fall within the 1–100 nm range, as shown in a comprehensive review by Sune et al. (2024) [1]. Recently, nanoscale antimony (Sb) powders have attracted significant attention due to their chemical and physical properties, along with their diverse applications in energy storage, thermoelectric, optoelectronics, and catalysis [2,3,4,5,6]. Generally, the limitations of commercially available nanoscale powder include challenges in controlling the morphology, particle size distribution, and purity of the starting materials; the need for capping agents; and high synthesis costs associated with the employed methods. The types of nanoparticles and their production routes, including physical, chemical, and biological methods, have been extensively reported [2]. In practice, nanoscale materials exhibit extraordinary electrical, magnetic, mechanical, and optical characteristics, as well as composite-related properties, which are fundamentally different from those of their bulk counterparts [7,8]. The particle size distribution, morphology, and purity of the resulting nano-powders strongly depend on the synthesis route, which greatly influences the properties of the final material [7,9,10,11,12,13]. Sb nanoscale powder can be produced via a mechanical milling process starting from bulk gray powder of 100 mesh (~150 µm as a mean) using any available milling machine [11]. The challenges of using this route are avoiding oxidation, as the process must be carried out in inert gases or solutions; the particle size and shape of the obtained particles; and the purity of the Sb nano-powder, which depends on the purity of the raw Sb large particles and contamination during the milling stage.
The use of Sb in nanoscale form for the development of potassium-ion batteries has been reviewed by Gao et al. [14], who summarized the research on Sb and its alloys as promising anode materials for high-capacity batteries. Sb has also been incorporated into Sb–graphitic carbon and Sb–red phosphorus composites to manufacture anodes for sodium-ion batteries [15,16]. These approaches aim to overcome the large volumetric expansion (~390%) observed when pure Sb is used as an anode in sodium-ion batteries.
Various methods have been employed to synthesize nanoscale Sb. For instance, commercial antimony oxide (Sb2O3) has been used as an Sb3+ source with sodium borohydride (NaBH4) as the reducing agent [17]. A solvothermal method using a Teflon-lined autoclave at ~200 °C has also been reported to produce Sb nanotubes from SbCl3 and Zn powders [18]. In this method, SbCl3 was dissolved in toluene and a stoichiometric amount of Zn powder was added, followed by heating at the desired temperature for 10 h.
Despite these efforts, there remains a pressing need for safe, environmentally friendly, efficient, low-cost, and straightforward synthesis methods for Sb nanoparticles. The redox reaction between antimony trichloride (SbCl3) and pure, reactive aluminum (Al) powder represents a promising, cost-effective, and reliable route for producing nanoscale, high-purity Sb powder [19,20]. In previous studies, mixtures of SbCl3 and Al powder were heated in a Teflon-lined autoclave at 80–100 °C for ~6 h, yielding nanoscale Sb powder after successive washing with distilled water and ethanol, followed by drying. To minimize oxidation during synthesis, SbCl3 has also been dissolved in various organic solvents such as acetone, toluene, and cyclohexane [21,22].
The synthesis of nanoscale Sb powder through SbCl3-Al reactions still requires further research, particularly regarding powder sintering and evaluation of its microscopic properties. Building on this context, the present research aims to synthesize nanoscale Sb powder in a single-step process by reacting SbCl3 with Al powder. This study comprehensive characterized commercial Sb powder (Com-Sb), produced Sb powder (Pro-Sb), and sintered pellets using multiple techniques, including X-ray diffraction (XRD), Fourier-transform infrared spectroscopy (FTIR), scanning electron microscopy (SEM) with energy-dispersive spectroscopy (EDS), thermogravimetric analysis (TGA), differential thermogravimetric analysis (DTG), and reflectance (R%) measurements.
2. Materials and Methods
Antimony trichloride (SbCl3) powder of 99.99% purity (E. MERCK, Darmstadt, Germany), commercial Sb powder (Com-Sb, 100 mesh, 98.5% purity, with trace impurities: As < 0.05%, Fe < 0.1%, Pb < 0.5% (Grainland Chemical Company, Deeside, UK), and aluminum (Al) powder of 99.5% purity with trace elements (Fe < 0.17%, Cu < 0.0015%, Si < 0.1313%, Mn < 0.0023%, Zn < 0.0053%, Mg < 0.0016% (Loba Chemie, PVT Ltd., Mumbai, India) were used as starting materials. All materials were used as received, without further purification. Additional laboratory supplies included distilled water, high-purity acetone (99.9%), stainless steel micro-sieves (38 µm), and standard laboratory glassware.
3. Experimental Workflow
The experimental workflow consisted of the following steps, and Figure 1 presents the experimental workflow for the synthesis, characterization, and sintering of Sb powders.
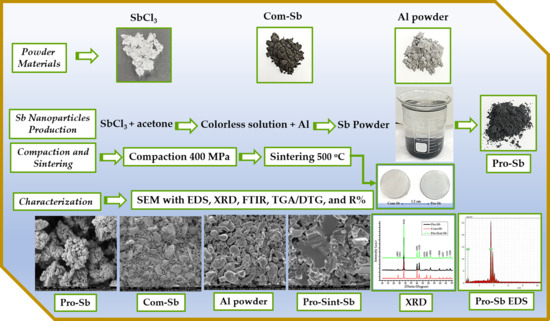
Figure 1.
Experimental workflow for the synthesis, characterization, and sintering of Sb powders.
- Production of nanoscale Sb powder via a single-step process using Al powder as a reducing agent.
- Characterization of Al powder, commercial Sb (Com-Sb), and produced Sb (Pro-Sb) using SEM, XRD, FTIR, TGA, and reflectance (R%) analyses as appropriate. The Al and Com-Sb powders were first sieved using a 38 µm stainless steel micro-sieve to obtain finer particle sizes for subsequent use. The sieving of each powder was essential to prepare a fine Al powder that would react quickly with the SbCl3 solution, as the surface area is inversely proportional to the particle size. As for Com-Sb, the fine powder is good for XRD, FTIR, compaction, and sintering.
- Compaction and sintering of both Com-Sb and Pro-Sb powders.
- Microstructural and compositional analysis of sintered samples using SEM/EDS and XRD.
Measurement of reflectance (R%) for compacted and sintered pellets of Com-Sb and Pro-Sb.
3.1. Production of Sb Nanoscale Powder
SbCl3 was first dissolved in acetone, and the required stoichiometric amount of Al was added according to the following reaction equation:
The reduction of SbCl3 with Al powder in an acetone medium is a redox reaction and serves as the basis for synthesizing nanoscale Sb particles. Based on the molar masses of SbCl3 and Al, approximately 22.8 g of SbCl3 reacts with 2.7 g of Al to yield ~12 g of Sb powder in a single step. The sieved Al powder was initially washed with a 2% diluted solution of 37% HCl to remove the passive aluminum oxide (Al2O3) layer. This pretreatment step was essential to activate the powder surface and facilitate its direct reaction with SbCl3, thereby yielding pure Sb. Also, this process disrupts the native hydrated oxide/hydroxide film and exposes fresh aluminum. The intention is activation rather than complete dissolution of crystalline alumina. Vigorous hydrogen bubbling was observed during etching, and the powder was immediately rinsed, dried, and transferred into acetone to limit re-passivation. The dissolution of Al metal in acid is strongly favorable (2Al + 6H+ → 2Al3+ + 3H2 with ΔG° = −960 kJ for 2 moles of Al at 298 K), whereas dissolution of bulk alumina in HCl is not thermodynamically favored. The efficacy of the brief HCl step therefore stems from chloride-induced pitting and thinning of the hydrated passive film, rather than the whole dissolution of Al2O3. The balanced reaction equation is:
Stoichiometric quantities were weighed using a four-digit microbalance (Model SEJ-205, Taipei, Taiwan). The water-insoluble SbCl3 was dissolved in 100 mL of acetone, and Al powder was gradually added under continuous ice-bath cooling to control the highly exothermic reaction. Antimony trichloride reacts with aluminum to form antimony metal and aluminum chloride. Based on tabulated enthalpies of formation, the standard reaction enthalpy corresponds to a heat release of about 325 kJ/mole (ΔH = −325 kJ/mol) at room temperature. This substantial heat release justifies using an ice bath and adding aluminum gradually. Ultrasonic agitation (JAC Ultrasonic 1002, Jeio-Tech Co. Ltd., Seoul, Republic of Korea) was applied to minimize agglomeration. The reaction temperature was monitored with a digital thermometer (JR-1, −50–300 °C, Wuqiang Zeda Instrument Co., Ltd., Hengshui, China) and maintained between 5 and 10 °C. The process yielded a black precipitate. The precipitated powder was washed three times with hot distilled water (~70 °C) to promote settling and remove soluble byproducts. A subsequent wash with 5% HCl (37%) dissolved any unreacted Al according to the following reaction:
Finally, the Pro-Sb powder was rinsed with acetone, dried overnight under a fume hood, and then heat-treated under vacuum at 80 °C for 1 h in a vacuum oven (JEIO TECH, OV-11, Seoul, Republic of Korea) to ensure it was completely dried. Figure 2 shows the photographs of the precipitated powder during the washing stage and a sample of dried Pro-Sb powder.
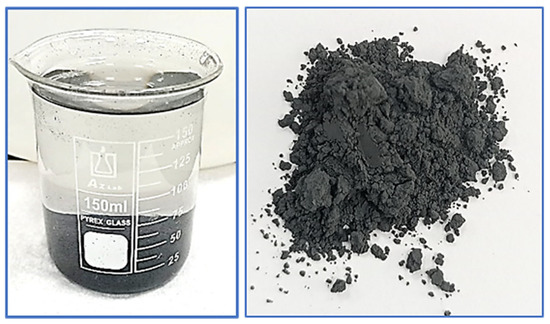
Figure 2.
Photographs of Sb powder: precipitated during the washing stage (left) and dried Pro-Sb powder (right).
3.2. Sintering of Sb Powder
Com-Sb and Pro-Sb powders were compacted at 400 MPa using a stainless-steel die (1.2 cm diameter) with a CARVER pressing system (Model 4350.L, CARVER Inc., Wabash, IN, USA). Sintering was performed in an alumina tube furnace (Protherm PTF 12/50/450, Protherm Inc., Ankara, Turkey) at 500 °C for 4 h under ~10−3 Torr vacuum. This temperature corresponds to ~0.8 of Sb’s melting point (~630 °C). The heating rate was ~8 °C/min, and furnace cooling occurred overnight at ~2.5 °C/min. This is referred to as the first-run sintering.
For further comparison, the first-run Pro-Sb pellet was milled in a ceramic mortar to obtain Pro-Sint-Sb powder, which was re-compacted and sintered under the same conditions (second-run). Cross-sectional fractured surfaces of sintered pellets were examined via SEM/EDS. Green and sintered densities were determined from pellet mass and volume. The density of each sample was determined by measuring its mass with a four-decimal microbalance (TMT 322001, Taipei, Taiwan) and its volume with a digital caliper (Total, TMT 322001, Guangzhou, China), and then calculating the density as the ratio of mass to volume. Details of the sintering factors influencing product quality are discussed elsewhere [23].
3.3. Characterizations
The raw Al, Com-Sb, and Pro-Sb powders and fractured sintered pellets were examined using SEM (Inspect F50, FEI Company, Eindhoven, The Netherlands) for microstructural analysis. EDS was used for compositional analysis. Samples were mounted on 1.2 cm stubs with carbon adhesive and imaged without conductive coating, as Sb is metallic.
XRD analysis was conducted on a Malvern Panalytical diffractometer (Malvern Panalytical, Almelo, The Netherlands) using Cu Kα1 radiation (λ = 1.5406 Å), 2θ range 10–70°, and a scanning speed of 0.02°/s. The Scherrer equation [24] was applied to calculate the crystallite diameters:
where D is the mean crystallite size (nm), K the shape factor (0.94 for spherical particles), λ the wavelength (nm), β the FWHM in radians, and θ the Bragg angle (radians). Data analysis was performed with HighScore Plus software (version 5.2).
FTIR spectra (ThermoFisher NEXUS EPS-87, Waltham, MA, USA) were obtained in the 400–4000 cm−1 range. Reflectance (R%) of compacted and sintered pellets was measured using a Filmtek 3000 system (Scientific Computing International, Carlsbad, CA, USA) in the wavelength range of 240–840 nm. All surfaces were prepared under identical conditions, using 3000-grade emery paper for grinding, followed by polishing with 3 µm diamond paste. Thermal analysis was evaluated using TGA/DTG (STA-409 PC, NETZSCH-Gerätebau GmbH, Selb, Germany) from room temperature to 800 °C in an air/oxygen atmosphere.
4. Results and Discussion
4.1. XRD and FT-IR Characterization
The XRD patterns of Com-Sb, Pro-Sb, and Pro-Sint-Sb (Figure 3) exhibit a series of sharp, well-defined peaks, confirming the high crystallinity of the samples. The most intense peak is observed at ~28° 2θ, characteristic of the rhombohedral phase of elemental Sb. The scan was conducted over a 2θ range of 10–70°, which is standard for powder diffraction analysis. All diffraction peaks and their corresponding planes were indexed according to the JCPDS card No. 35-0732. The indexing in the figure is similar to published articles [6,9]. The phase and lattice constants are in good agreement with the literature in this field [10,18].
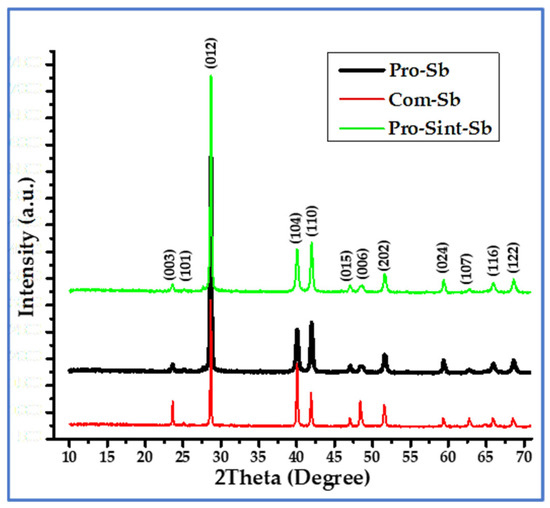
Figure 3.
XRD patterns of Com-Sb (red), Pro-Sb (black), and Pro-Sint-Sb (green), with peak indexing according to JCPDS card No. 35-0732.
TXRD analysis revealed that the diffraction patterns of the produced and sintered Sb powders closely matched those of the commercial sample, confirming the effectiveness of the adopted synthesis route in obtaining nanoscale Sb powder. This result also highlights the suitability of Al metal as a reliable reducing agent for SbCl3, yielding high-purity Sb nanoparticles with potential for various applications. The produced samples displayed all the major peaks characteristic of pure antimony, demonstrating excellent agreement with the commercial reference. Using the Scherrer equation (Equation (4)), the crystallite mean diameter (D) of Pro-Sb powder was estimated to be ~25.3 nm, based on the peaks at 2θ = 28.78°, 40.10°, 41.99°, 51.68°, 59.47°, and 68.66°. For Pro-Sint-Sb powder, D was ~33.5 nm, calculated from the peaks at 2θ = 28.72°, 40.12°, 41.97°, 51.63°, 59.43°, and 68.59°. The calculations were performed using Cu Kα radiation (λ = 0.15406 nm) with a shape factor (K) of 0.94. Key calculated and measured parameters from the XRD data are summarized in Table 1.

Table 1.
Crystallite mean diameter and key measured and calculated parameters of Pro-Sb and Pro-Sint-Sb powders.
The results in Table 1 show that the calculated lattice constants before and after sintering are nearly identical. However, the mean crystallite diameter increased after sintering compared to the as-produced nano-powder, which can be attributed to grain growth driven by thermal energy during the sintering process. A minor antimony oxide (Sb2O3) phase (~1%) was also detected in the Pro-Sint-Sb sample, likely due to insufficient vacuum during sintering. To maintain the purity of the produced powder, sintering should ideally be performed under a higher vacuum, on the order of 10−6 Torr or better. Despite this slight oxidation, the calculated densities of both samples remained nearly the same, as the amount of Sb2O3 formed was negligible. The slight decrease in the density of the sintered samples can be attributed to a small increase in volume, as evidenced by the corresponding rise in lattice constant values shown in Table 1.
The FTIR spectra of Com-Sb and Pro-Sb powders are presented in Figure 4. The peaks of both samples are closely aligned, further confirming the effectiveness of the synthesis route in producing high-purity Sb powder. The spectra display characteristic IR modes of antimony oxide in the fingerprint region between 500 and 1750 cm−1. In addition, distinct OH-related bands were observed at ~3185 cm−1, corresponding to the Sb(OH)6 stretching mode, and at ~3441 cm−1, associated with O-H stretching. These features indicate the tendency of the samples to retain and capture with atmospheric moisture [25,26]. This apparent inconsistency arises because FTIR is highly surface-sensitive and can readily detect hydroxyl and oxide groups on nanoparticle surfaces, whereas EDX is bulk-sensitive and less effective in detecting light elements such as oxygen in near-surface regions.
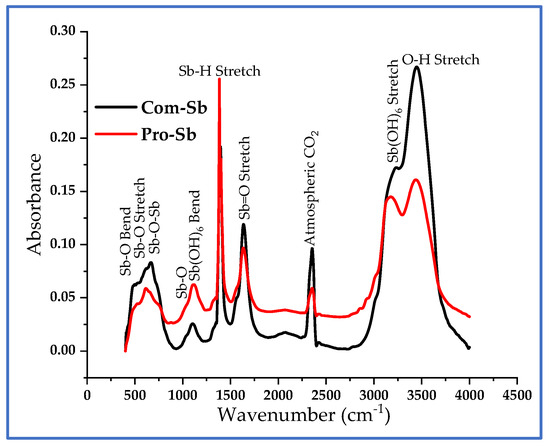
Figure 4.
FTIR spectra of Com-Sb and Pro-Sb powders, showing characteristic IR modes of Sb oxide in the fingerprint region (500–1750 cm−1) and OH-related bands at ~3185 and ~3441 cm−1.
4.2. SEM Investigation of Com-Sb, Al, Pro-Sb Powders, and XRD of Pro-Sb
Figure 5 shows the SEM/EDS analysis of both the purchased Com-Sb and Al powders. The chemical analysis of Com-Sb powder revealed a small amount of oxygen attributable to the powder production process, whereas the carbon element was due to the use of the double-adhesive carbon tape during sample preparation for SEM examination (Figure 5b). The corresponding EDS spectrum of Al powder verified its high chemical purity (Figure 5d). The SEM images show that the particle sizes of both powders are ≤40 µm, consistent with sieving through a 38 µm mesh.
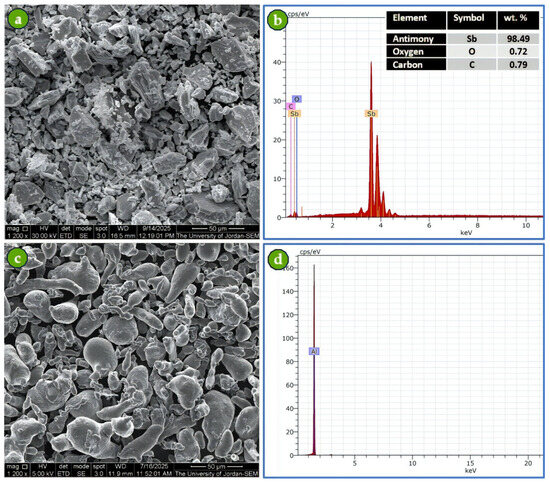
Figure 5.
SEM images and EDS spectra of Com-Sb and Al powders: (a) SEM image of Com-Sb powder at 1200× magnification, (b) EDS spectrum of Com-Sb with chemical analysis inserted table, (c) SEM image of Al powder at 1200× magnification, and (d) EDS spectrum of Al.
SEM analysis of Pro-Sb powder revealed predominantly spherical particles with an aggregated morphology (Figure 6a,b). The accompanying XRD pattern and EDS spectrum (Figure 6c,d) further confirmed the high purity of the produced powder. The EDS spectrum shows only Sb peaks along with carbon, the latter originating from the double-sided carbon tape used to mount the Sb powder for SEM examination. The SEM scale bars indicate particle sizes of approximately 50 nm.
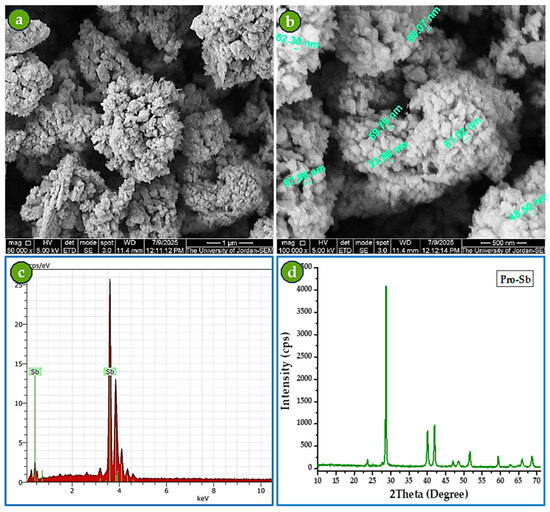
Figure 6.
Characterization of Pro-Sb powder: (a) SEM image at 50,000× magnification, (b) SEM image at 100,000× magnification, (c) EDS spectrum, and (d) XRD diffractogram.
4.3. Green and Sintered Densities
The compacted pellets of Com-Sb and Pro-Sb powders are shown in Figure 7. Both pellets exhibit nearly identical color, suggesting that the produced nanoscale Sb powder is comparable in purity to the commercial sample, as further confirmed via XRD and EDS analyses presented later. Table 2 summarizes the green and sintered densities of both powders, together with their relative densities and sintering conditions. Relative density was calculated as the ratio of the measured sintered density to the theoretical density of Sb (6.69 g/cm3), multiplied by 100. The results highlight the significance of the second-run sintering of Pro-Sb, which led to an increase in sintered density, bringing it very close to that of commercial Sb. This demonstrates that sintering is a critical step in preparing Sb powder for practical applications, such as anodes in high-capacity batteries and other advanced technologies.
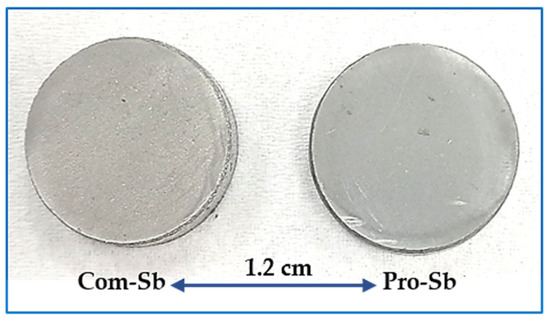
Figure 7.
Compacted pellets of Com-Sb and Pro-Sb powders, showing nearly identical appearance, indicative of comparable purity.

Table 2.
Green and sintered densities, relative densities, and sintering conditions of Com-Sb and Pro-Sb powders.
4.4. Microstructure of Sintered Samples
Figure 8 presents the microstructures of Com-Sb and Pro-Sb samples sintered at 500 °C for 4 h under vacuum. The sintering conditions were effective, as the fine particles diffused to form larger grains, confirming the success of the process. However, distinct differences were observed between the two powders: Com-Sb exhibited relatively large grains with sharp boundaries, whereas Pro-Sb showed rhombohedral ultra-fine grains ranging from 0.2 to 1.0 µm. The microstructure of the sintered Pro-Sb also contained a significant number of closed voids, formed as neighboring nanoparticles coalesced into larger grains during sintering. These voids account for the lower sintered density of first-run Pro-Sb compared to that of Com-Sb (Table 2).
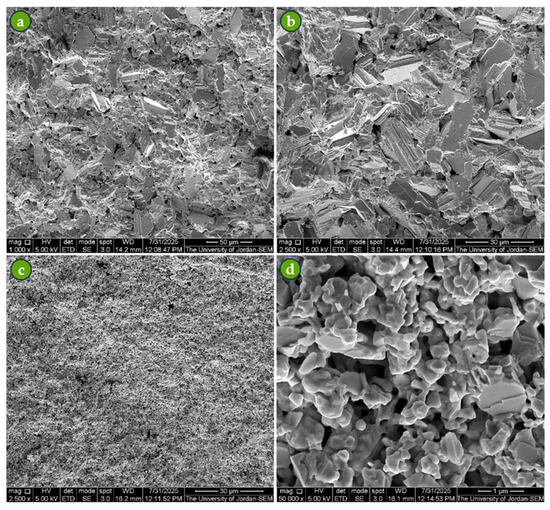
Figure 8.
SEM micrographs of sintered samples at 500 °C for 4 h under vacuum: (a,b) Com-Sb showing large grains with sharp boundaries at 1000× and 2500× magnifications, and (c,d) Pro-Sb showing rhombohedral ultra-fine grains (0.2–1.0 µm) with noticeable voids at 2500× and 25,000× magnifications.
The microstructure of Pro-Sb after the second-run sintering was comparable to that of the first-run, but with noticeably larger grains and reduced voids (Figure 9). Both runs were carried out under identical sintering conditions. This refinement in microstructure explains the higher sintered density achieved for Pro-Sint-Sb during the second run (Table 2). These findings emphasize that sintering plays a critical role in tailoring the properties of Sb powders to meet specific application requirements.
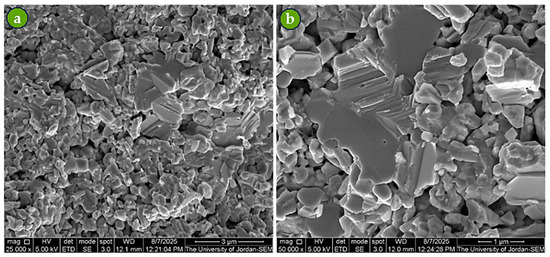
Figure 9.
SEM micrographs of Pro-Sint-Sb after second-run sintering under the same conditions: (a) fractured surface at 25,000× magnification and (b) fractured surface at 50,000× magnification.
SEM analysis of the sintered Pro-Sint-Sb powder showed that, even after sintering, the EDS spectrum corresponded exclusively to Sb, with no detectable impurities (Figure 10). This outcome reflects the effectiveness of the sintering process carried out under relatively good vacuum conditions.
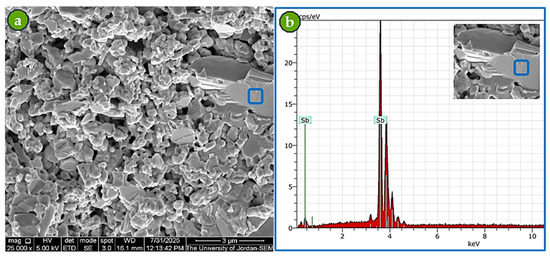
Figure 10.
Characterization of Pro-Sint-Sb after sintering: (a) SEM image of the fractured surface at 25,000× magnification, and (b) EDS spectrum of the blue square confirming Sb-only composition within EDS detection limits.
4.5. TGA and DTG Curves
Figure 11 presents the TGA and DTG curves of Com-Sb (red) and Pro-Sb (green) powders, measured from room temperature to 800 °C at a heating rate of 20 °C/min in air. The results reveal distinct thermal behaviors between the two samples. Com-Sb exhibited higher thermal stability, with a greater final residue (~94.1%) compared to Pro-Sb (~85.3%) and a slightly delayed onset of decomposition (~625 °C vs. ~613 °C). In contrast, the DTG profile of Pro-Sb showed sharper and more intense peaks, including a dominant decomposition event at ~671 °C, indicating rapid and well-defined degradation steps.
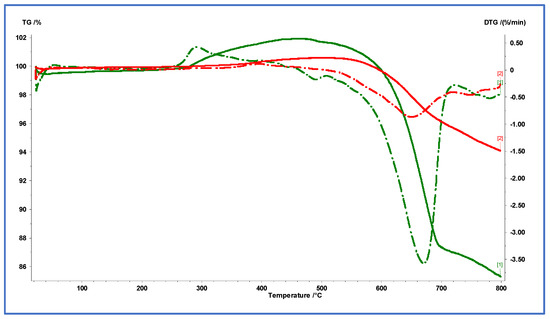
Figure 11.
TGA and DTG curves of Com-Sb (red) and Pro-Sb (green) powders in air, recorded from room temperature to 800 °C at a heating rate of 20 °C/min. The solid lines represent the TGA curves while the dashed lines are for the DTG curves.
In contrast, Com-Sb exhibited broader and more gradual DTG transitions, indicative of a more stable, multi-step thermal decomposition. These features are consistent with patterns reported in the literature for antimony-containing nanoparticles and related oxide systems that display characteristic oxidative transitions and thermal stability profiles [27,28]. Although the Kissinger method is commonly applied to estimate activation energies from DTG peak shifts, it was not applicable here because only a single heating rate was used, making the regression analysis mathematically invalid. For more accurate kinetic modeling, future studies should employ multi-rate TGA measurements to allow reliable activation energy determinations using Kissinger or isoconversional methods [29,30,31]. The oxidation of Pro-Sb was observed to begin at ~250 °C, whereas Com-Sb oxidation started at ~300 °C. This difference is likely attributed to the nanoscale particle size of Pro-Sb compared to the microscale size of Com-Sb. These differences reflect surface-controlled oxidation in Pro-Sb (higher surface area/defects and porosity), lowering the main thermal event by approximately 25 °C and increasing mass gain (~10%) via more complete formation of oxides rather than phase differences.
The mass increase exceeding 100% observed in the TGA of Sb-based samples is primarily attributed to oxidative processes in air. With increasing temperature, elemental Sb oxidizes to higher oxides such as antimony trioxide (Sb2O3) and, to a greater extent, antimony pentoxide (Sb2O5). Because these oxides possess greater molecular weights than elemental Sb, their formation results in a measurable mass gain. This phenomenon is well documented in thermal studies of Sb and related compounds, where progressive oxidation during heating leads to apparent weight increases. The magnitude of this gain depends on temperature, oxidation kinetics, and sample surface area. Minor contributions from instrumental baseline drift or buoyancy effects may occur; however, the dominant cause is the genuine chemical transformation of Sb into its oxidized forms, explaining the mass values surpassing 100% during the early to mid-stages of the thermal profile.
4.6. Percent Refractivity % of Compacted and Sintered Com-Sb and Pro-Sb Samples
Figure 12 shows the R% profiles of four equally polished samples, including both compacted and sintered pellets. Since all surfaces were prepared under identical conditions, the compacted Pro-Sb sample exhibited a higher R% due to its smoother surface, which results from its nanostructured morphology. In contrast, Com-Sb displayed a lower R%, reflecting its comparatively rougher microstructure. The R% values of the sintered samples were close to one another and positioned between those of the compacted pellets, indicating that the sintered surfaces responded similarly to incident light owing to their comparable microstructural features.
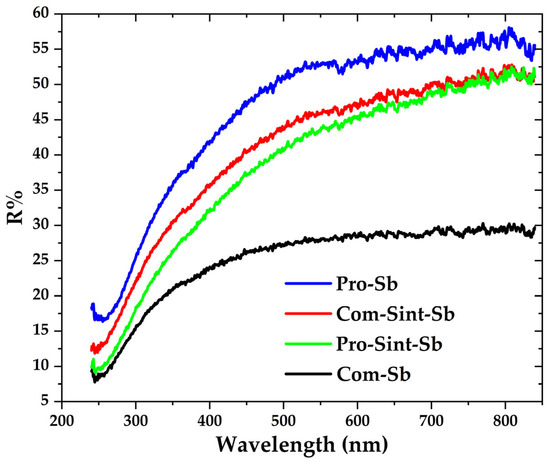
Figure 12.
Percent reflectance (R%) profiles of compacted and sintered Com-Sb and Pro-Sb pellets, measured after identical surface preparation (3000-grade emery paper followed by 3 µm diamond paste polishing).
The figure also shows that percent reflectance (R%) generally increases with wavelength. The lower R% values observed in the ultraviolet region can be attributed to the higher absorption of pure Sb metal. Because this is a highly surface-sensitive measurement, great care must be taken to ensure consistent sample preparation and strictly controlled testing conditions across all specimens.
5. Conclusions
This study demonstrates a novel single-step approach for synthesizing nanoscale, high-purity Sb powder by directly reducing SbCl3 with Al powder in acetone. The produced nanoparticles exhibited an average particle size of 50 nm and a crystallite size of 25 nm. Their purity was confirmed via SEM/EDS and XRD analyses, while FTIR further verified structural similarity to commercial Sb powders. Sintering studies revealed relative densities of up to 99% for pellets prepared from both commercial and synthesized powders, supported by SEM/EDS examinations of their microstructures. The simplicity, efficiency, and cost-effectiveness of this method make it a promising route for producing Sb nanoparticles with excellent sintering behavior and potential applications in advanced energy storage and related technologies.
Author Contributions
Conceptualization, E.A.; methodology, B.L., A.N.A.-M. and I.S.M.; validation, B.L.; formal analysis, A.N.A.-M. and I.S.M.; data curation, B.L. and I.S.M.; writing—original draft, E.A. and I.S.M.; writing—review and editing, E.A., B.L., A.N.A.-M. and I.S.M.; visualization, I.S.M.; supervision, E.A. All authors have read and agreed to the published version of the manuscript.
Funding
This research received no external funding.
Institutional Review Board Statement
Not applicable.
Informed Consent Statement
Not applicable.
Data Availability Statement
The original contributions presented in the study are included in the article; further inquiries can be directed to the corresponding author.
Acknowledgments
The authors gratefully acknowledge the University of Jordan for providing research facilities.
Conflicts of Interest
The authors declare no conflicts of interest.
References
- Sune, P.R.; Jumde, K.S.; Hatwar, P.R.; Bakal, R.L.; More, S.D.; Korde, A.V. Nanoparticles: Classification, types and applications: A comprehensive review. GSC Biol. Pharm. Sci. 2024, 29, 190–197. [Google Scholar] [CrossRef]
- Salem, S.S.; Hammad, E.N.; Mohamed, A.A.; El-Dougdoug, W. A comprehensive review of nanomaterials: Types, synthesis, characterization, and applications. Biointerface Res. Appl. Chem. 2023, 13, 41. [Google Scholar] [CrossRef]
- Balan, L.; Dailly, A.; Schneider, R.; Billaud, D.; Willmann, P.; Olivier-Fourcade, J.; Jumas, J.C. Synthesis of nanoscale antimony particles. Hyperfine Interact. 2005, 165, 101–106. [Google Scholar] [CrossRef]
- Liu, Y.; Liu, P.; Gu, Y.; Fan, Z.; Song, S. Preparation and performance of nanoscale antimony tin oxide aqueous slurry with high water dispersion stability. J. Dispers. Sci. Technol. 2024, 1–13. [Google Scholar] [CrossRef]
- Moolayadukkam, S.; Bopaiah, K.A.; Parakkandy, P.K.; Thomas, S. Antimony (Sb)-based anodes for lithium–ion batteries: Recent advances. Condens. Matter 2022, 7, 27. [Google Scholar] [CrossRef]
- Wang, Z.; Zeng, F.; Zhang, D.; Shen, Y.; Wang, S.; Cheng, Y.; Li, C.; Wang, L. Antimony nanoparticles encapsulated in self-supported organic carbon with a polymer network for high-performance lithium-ion battery anodes. Nanomaterials 2022, 12, 2322. [Google Scholar] [CrossRef]
- Ali, M. Applications of nanotechnology and nanoproduction techniques. Open Eng. 2024, 14, 20240063. [Google Scholar] [CrossRef]
- Balaji, D.; Kumar, P.S.; Bhuvaneshwari, V.; Rajeshkumar, L.; Singh, M.K.; Sanjay, M.R.; Siengchin, S. Effect of nanoparticle addition on thermal behavior of natural fiber–reinforced composites: A review. Heliyon 2025, 11, e41192. [Google Scholar] [CrossRef] [PubMed]
- Mntungwa, N.; Khan, M.D.; Mlowe, S.; Revaprasadu, N. A simple route to alkylamine capped antimony nanoparticles. Mater. Lett. 2015, 145, 239–242. [Google Scholar] [CrossRef]
- Kou, J.; Wang, Y.; Liu, X.; Zhang, X.; Chen, G.; Xu, X.; Bao, J.; Yang, K.; Yuwen, L. Continuous preparation of antimony nanocrystals with near-infrared photothermal property by pulsed laser ablation in liquids. Sci. Rep. 2020, 10, 15095. [Google Scholar] [CrossRef]
- Thirumal, V.; Yuvakkumar, R.; Kumar, P.S.; Saravanakumar, B.; Ravi, G.; Shobana, M.; Velauthapillai, D. Preparation and characterization of antimony nanoparticles for hydrogen evolution activities. Fuel 2022, 325, 124908. [Google Scholar] [CrossRef]
- Ulusoy, U. A review of particle shape effects on material properties for various engineering applications: From macro to nanoscale. Minerals 2023, 13, 91. [Google Scholar] [CrossRef]
- Benrabah, B.; Bouaza, A.; Hamzaoui, S.; Dehbi, A. Sol–gel preparation and characterization of antimony-doped tin oxide (ATO) powders and thin films. Eur. Phys. J. Appl. Phys. 2009, 48, 30301. [Google Scholar] [CrossRef]
- Gao, H.; Guo, X.; Wang, S.; Zhang, F.; Liu, H.; Wang, G. Antimony-based nanomaterials for high-performance potassium-ion batteries. EcoMat 2020, 2, e12027. [Google Scholar] [CrossRef]
- Wang, Y.; Wang, Q.; Wu, J.; Geng, Y.; Zhang, J.; Ai, G.; Mao, W. Design of antimony nanocomposite for high areal capacity sodium battery anodes. J. Alloys Compd. 2022, 914, 165336. [Google Scholar] [CrossRef]
- Walter, M.; Erni, R.; Kovalenko, M.V. Inexpensive antimony nanocrystals and their composites with red phosphorus as high-performance anode materials for Na-ion batteries. Sci. Rep. 2015, 5, 8418. [Google Scholar] [CrossRef]
- Zhu, Y.; Shao, J.; Jiang, Y.; Zhang, K.; Shi, Q.; Qu, Q.; Zheng, H. Sb nanocrystallites derived from industrial antimony white as promising alloying-type anodes for Na-ion batteries. J. Alloys Compd. 2022, 926, 166808. [Google Scholar] [CrossRef]
- Li, R.; Wang, X.; Wang, X.; Zhang, H.; Pan, J.; Tang, J.; Fang, D.; Ma, X.; Li, Y.; Yao, B.; et al. Synthesis of antimony nanotubes via facile template-free solvothermal reactions. Nanoscale Res. Lett. 2016, 11, 486. [Google Scholar] [CrossRef] [PubMed][Green Version]
- Yi, Z.; Lin, N.; Zhang, W.; Wang, W.; Zhu, Y.; Qian, Y. Preparation of Sb nanoparticles in molten salt and their potassium storage performance and mechanism. Nanoscale 2018, 10, 13236–13241. [Google Scholar] [CrossRef] [PubMed]
- Nazir, A.; Le, H.T.T.; Nguyen, A.; Kim, J.; Park, C. Conductive metal–organic framework mediated Sb nanoparticles as high-capacity anodes for rechargeable potassium-ion batteries. Chem. Eng. J. 2022, 450, 138408. [Google Scholar] [CrossRef]
- Nair, M.; Peña, Y.; Campos, J.; Garcia, V.M.; Nair, P.K. Chemically deposited Sb2S3 and Sb2S3–CuS thin films. J. Electrochem. Soc. 1998, 145, 2113–2120. [Google Scholar] [CrossRef]
- Amutha, E.; Rajaduraipandian, S.; Sivakavinesan, M.; Annadurai, G. Hydrothermal synthesis and characterization of the antimony–tin oxide nanomaterial and its application as a high-performance asymmetric supercapacitor, photocatalyst, and antibacterial agent. Nanoscale Adv. 2023, 5, 255–267. [Google Scholar] [CrossRef] [PubMed]
- Al-Saqarat, B.S.; Al-Mobydeen, A.; Al-Dalahmeh, Y.; Al-Masri, A.N.; Altwaiq, A.M.; Hamadneh, I.; Abu-Afifeh, Q.; Zoubi, M.M.; Esaifan, M.; Moosa, I.S.; et al. Study of galena ore powder sintering and its microstructure. Metals 2024, 14, 439. [Google Scholar] [CrossRef]
- Al-Mobydeen, A.; AlShamaileh, E.; Lahlouh, B.; Al-Qderat, M.; Al-Masri, A.N.; Mahmoud, W.; Hamadneh, I.; Esaifan, M.; Moosa, I.S. Synthesis of ZnS nanopowders and fabrication of ZnS thin films via electron-beam evaporation: Structural and optical characterization. Coatings 2025, 15, 796. [Google Scholar] [CrossRef]
- Kaviyarasu, K.; Sajan, D.; Devarajan, P.A. A rapid and versatile method for solvothermal synthesis of Sb2O3 nanocrystals under mild conditions. Appl. Nanosci. 2013, 3, 529–533. [Google Scholar] [CrossRef]
- Trivedi, M.K.; Tallapragada, R.M.; Branton, A.; Nayak, G.; Latiyal, O.; Jana, S. The Potential Impact of Biofield Energy Treatment on the Atomic and Physical Properties of Antimony Tin Oxide Nanopowder. Am. J. Opt. Photonics 2015, 3, 123–128. [Google Scholar] [CrossRef]
- Zhang, J.; Gao, L. Synthesis of antimony-doped tin oxide (ATO) nanoparticles by the nitrate-citrate combustion method. Mater. Res. Bull. 2004, 39, 2249–2255. [Google Scholar] [CrossRef]
- Frommelius, A.; Wirth, K.G.; Ohlerth, T.; Siebenkotten, D.; Wintersteller, S.; Abouserie, A.; Du, H.; Mayer, J.; Yarema, M.; Taubner, T.; et al. 3D Confinement Stabilizes the Metastable Amorphous State of Antimony Nanoparticles-A New Material for Miniaturized Phase Change Memories? Small 2024, 20, 2402257. [Google Scholar] [CrossRef] [PubMed]
- Vyazovkin, S.; Burnham, A.K.; Favergeon, L.; Koga, N.; Moukhina, E.; Pérez-Maqueda, L.A.; Sbirrazzuoli, N. ICTAC Kinetics Committee recommendations for analysis of multi-step kinetics. Thermochim. Acta 2020, 689, 178597. [Google Scholar] [CrossRef]
- Vyazovkin, S. Isoconversional methods: The many uses of variable activation energy. Thermochim. Acta 2024, 733, 179701. [Google Scholar] [CrossRef]
- Muravyev, N.V.; Vyazovkin, S. The Status of Pyrolysis Kinetics Studies by Thermal Analysis: Quality Is Not as Good as It Should and Can Readily Be. Thermo 2022, 2, 435–452. [Google Scholar] [CrossRef]
Disclaimer/Publisher’s Note: The statements, opinions and data contained in all publications are solely those of the individual author(s) and contributor(s) and not of MDPI and/or the editor(s). MDPI and/or the editor(s) disclaim responsibility for any injury to people or property resulting from any ideas, methods, instructions or products referred to in the content. |
© 2025 by the authors. Licensee MDPI, Basel, Switzerland. This article is an open access article distributed under the terms and conditions of the Creative Commons Attribution (CC BY) license (https://creativecommons.org/licenses/by/4.0/).