Article

Optimizing FDM Printing Parameters via Orthogonal Experiments and Neural Networks for Enhanced Dimensional Accuracy and Efficiency

1
School of Physics and Mechatronic Engineering, Guizhou Minzu University, Guiyang 550025, China
2
Guiyang Xianfeng Machine Tool Co., Ltd., Guiyang 550601, China
3
School of Mechanical Engineering, Guizhou University, Guiyang 550025, China
*
Author to whom correspondence should be addressed.
Coatings 2025, 15(10), 1117; https://doi.org/10.3390/coatings15101117
Submission received: 19 August 2025 / Revised: 18 September 2025 / Accepted: 23 September 2025 / Published: 24 September 2025

Abstract

Optimizing printing parameters is crucial for enhancing the efficiency, surface quality, and dimensional accuracy of Fused Deposition Modeling (FDM) processes. A review of numerous publications reveals that most scholars analyze factors such as nozzle diameter and printing speed, while few investigate the impact of layer thickness, infill density, and shell layer count on print quality. Therefore, this study employed 3D slicing software to process the three-dimensional model and design printing process parameters. It systematically investigated the effects of layer thickness, infill density, and number of shells on printing time and geometric accuracy, quantifying the evaluation through volumetric error. Using an ABS connecting rod model, optimal parameters were determined within the defined range through orthogonal experimental design and signal-to-noise ratio (S/N) analysis. Subsequently, a backpropagation (BP) neural network was constructed to establish a predictive model for process optimization. Results indicate that parameter selection significantly impacts print duration and surface quality. Validation confirmed that the combination of 0.1 mm layer thickness, 40% infill density, and 5-layer shell configuration achieves the highest dimensional accuracy (minimum volumetric error and S/N value). Under this configuration, the volumetric error rate was 3.062%, with an S/N value of −9.719. Compared to other parameter combinations, this setup significantly reduced volumetric error, enhanced surface texture, and improved overall print precision. Statistical analysis indicates that the BP neural network model achieves a Mean Absolute Percentage Error (MAPE) of no more than 5.41% for volume error rate prediction and a MAPE of 5.58% for signal-to-noise ratio prediction. This validates the model’s high-precision predictive capability, with the established prediction model providing effective data support for FDM parameter optimization.

1. Introduction

3D printing technology, as a transformative frontier technology, demonstrates unparalleled and significant advantages across multiple dimensions. Serving as a highly efficient productivity engine, it substantially enhances manufacturing efficiency. Simultaneously, functioning as an astute cost-control mechanism, it significantly reduces manufacturing costs, thereby injecting robust and sustained momentum into the transformation and upgrading of the mechanical manufacturing industry. Extensive research has been conducted both domestically and internationally on improving the efficiency of 3D printing and the surface quality of printed models.
Silveira et al. [1] investigated the application of micro-screw nozzle extrusion technology in desktop fused deposition modeling (FDM) 3D printers. Zhou et al. [2] proposed a printing path trajectory planning algorithm unifying geometric and material distance fields for the representation and fabrication of functionally graded objects. Xiao et al. [3] developed an automatic printing path generation scheme, pixelating path information during slicing and prioritizing the printing of adjacent pixels sharing the same material composition as the preceding one.
Mei et al. [4] evaluated the forming quality of printed cement-based material lines and layers under various process parameters, using layer height, nozzle travel speed, material extrusion flow rate, and overlap width as primary variables. Quantitative indices of line width variance and maximum height difference were proposed. Siwei Lu et al. [5] demonstrated that extrusion temperature, speed, and nozzle diameter significantly influence melt extrusion pressure, providing crucial theoretical foundations and practical guidance for enhancing the performance of screw-extruded 3D printed parts. Jiang et al. [6] focused on three process parameters—layer thickness, exposure time, and power density—employing Response Surface Methodology (RSM) to explore their effects on dimensional accuracy and tensile strength of DLP 3D printed dental models.
Kechagias et al. [7] conducted a comprehensive review and investigation into the influence of material and structural parameters, including filament material properties, deposited strand geometry, infill rate, infill pattern design type and orientation, and part orientation, on the porosity and mechanical loading of 3D printed components. Kaustubh Dwivedi et al. [8] utilized compression testing to analyze the impact of factors such as layer height, infill pattern, cell size, and infill density, specifically highlighting the influence of these parameters on compressive strength and specific energy absorption (SEA). Ye et al. [9] examined the effects of various process parameters on the tensile and flexural properties of CCFR-PLA/TPU composites, additionally analyzing the relationship between process parameters and the formation of matrix-fiber and PLA-TPU interfaces. Mishra et al. [10] investigated the influence of various processing factors on the mechanical properties, including tensile strength, flexural strength, and hardness, of wood-polylactic acid (Wood-PLA) composites. Kechagias et al. [11] studied six control parameters—infill density (ID), raster deposition angle (RDA), nozzle temperature (NT), print speed (PS), layer thickness (LT), and bed temperature (BT)—demonstrating their significant impact on the mechanical response of 3D printed PLA parts.
Sherif et al. [12] indicated that layer thickness and build orientation significantly affected surface roughness, with the stair-stepping effect playing a key role, while the influence of infill percentage and raster angle was negligible. Zhang et al. [13] adopted an orthogonal experimental design to explore the synergistic effects of process parameters such as printing temperature, printing speed, and platform temperature, demonstrating that combining optimized parameters with auxiliary infrared heating enables the stable, high-quality fabrication of 3D printed CCF/PEEK composites. Gupta et al. [14] utilized Analysis of Variance (ANOVA) to determine parameter contributions, performing numerical analysis via Finite Element Method (FEM) and characteristic curve method, validated using the maximum principal stress failure theory. Hartomacioğlu et al. [15] investigated a specialized geometric braiding technique using two different materials via Taguchi design and an L9 fractional factorial experiment. Haque et al. [16] evaluated the mechanical properties of five materials, varying four key process parameters, and employed ANOVA to determine the statistical significance of parameter effects on mechanical properties, providing insights for optimizing material-process combinations in advanced FDM applications. Towaiq et al. [17] proposed a Preference Selection Index (PSI)—Multi-Criteria Decision-Making (MCDM) model, demonstrated using a ZORTRAX M300 plus plastic 3D printer. Tran et al. [18] employed a novel machine learning approach combining ANOVA models with a stacked method integrating linear regression, random forest, and gradient boosting techniques. Özdoğan et al. [19] investigated the effects of infill ratio, layer thickness, nozzle temperature, and raster angle on the flexural strength of PLA material through microstructural analysis, revealing significant variations in maximum flexural stress and elastic modulus values with changes in these parameters. Vemuri et al. [20] utilized contour plots and superimposed plots as visualization tools to interpret parameter effects and identify optimal performance regions. Ashok et al. [21] evaluated the impact of process parameters on the mechanical properties of 3D printed textile yarns using three distinct materials: polyethylene terephthalate glycol (PETG), nylon, and thermoplastic polyurethane (TPU). Kidie et al. [22] printed samples with planar and curved geometries using polylactic acid (PLA) on an open-source FDM printer. An L9 orthogonal array and Taguchi Grey Relational Grade (GRG) design were employed, with Grey Relational Analysis (GRA) used to evaluate optimal 3D process parameters. Mengesha et al. [23] determined the combined impact of Fused Filament Fabrication (FFF) process parameters on the mechanical properties of 3D printed PLA products, focusing on tensile strength with a high R2 value (97.29%). Nyiranzeyimana et al. [24] utilized Taguchi experimental design within Digimat Additive Manufacturing software to study the effects of print temperature, layer thickness, and print speed on residual stresses. Mikail et al. [25] produced filaments for FDM 3D printing via extrusion, examining the influence of extruder temperature, raster angle, layer thickness parameters, and print defects in parts made with an FDM 3D printer. Monticeli et al. [26] presented predictions for the flexural strength, modulus, and strain of high-performance 3D printable CF/epoxy composites, analyzing data predictions using Artificial Neural Networks (ANN), ANOVA, and Response Surface Methodology (RSM).
Abas et al. [27] focused on optimizing mechanical properties or surface quality, while insufficient attention was paid to the systematic prediction and optimization of geometric accuracy, particularly volumetric error. This paper systematically investigates three typical process factors—layer thickness, infill density, and shell count—through orthogonal experiments and signal-to-noise ratio analysis, thereby filling a research gap in this field. Morvayová et al. [28] employed Taguchi and grey relational analysis (GRA) for multi-objective optimization of FDM parameters but did not integrate machine learning for predictive modeling. Gao et al. [29] compared Taguchi and response surface methodology (RSM) in mechanical property optimization, revealing limitations of statistical approaches. This study proposes a hybrid strategy of “Design of Experiments (DOE) + Data-Driven Predictive Modeling”: the former is used for factor screening and robustness analysis, while the latter achieves high-precision prediction of volumetric error and signal-to-noise ratio through a BP neural network, thereby complementing the strengths of statistical methods and artificial intelligence.
Within the realm of 3D printing technologies, Fused Deposition Modeling (FDM) is highly representative. It has revolutionized traditional manufacturing paradigms by enabling rapid prototyping and customized production. However, akin to the challenges faced by any emerging technology during its development, FDM technology also encounters several difficulties. The stair-stepping effect results in insufficiently smooth print surfaces, dimensional errors compromise product accuracy, and inefficient parameter selection further constrains productivity enhancement. This study adopts an alternative approach, employing the scientific methodology of orthogonal experimental design combined with signal-to-noise ratio analysis to systematically optimize printing parameters. This research is expected to partially address this gap in the literature, potentially paving new pathways for the further advancement of FDM technology.

2. Experimental Principles and Methods

2.1. Model Forming Principle

Printing a 3D model first requires obtaining the cross-sectional contours. By utilizing a layering algorithm for layering, a complex three-dimensional model is converted into a planar two-dimensional layered structure. The layering height for each layer is determined, and the cross-sectional contours are calculated based on the layering height.
STL models store 3D data using a method of assembling discrete triangular faces. This algorithm obtains the cross-sectional contour of a specific layer by performing geometric intersection operations between planes and triangular faces, thereby reducing the 3D model to a 2D cross-sectional contour. This method is applicable to 3D printing layering processes, medical image reconstruction, and other application scenarios. Three-dimensional printing converts three-dimensional manufacturing into a two-dimensional layering process through Z-axis discrete layering. When the model surface has curved features, a fixed layer thickness causes step-like transitions between adjacent printed layers, as shown in Figure 1.
Geometric deviations between the theoretical contour and the printed contour occur in curved surface regions (shaded areas in the figure). Let the layer height be h. As shown in Figure 2 [30], the projected area Si of a single triangular face generated in the kth layer can be simplified to a triangular calculation. Equation (1) is derived based on geometric relationships:
S i = h 2 2 t a n β i ,
The volume error formula for the kth layer is given by Equation (2):
V k i = 1 n L i S i = 1 n L i h 2 2 t a n β ,
In the formula, n represents the number of triangular faces in the current layer. Therefore, the formula for the total volume error caused by the staircase effect in STL models is shown in Equation (3):
V m = 1 m V k m = 1 m i = 1 n L i h m 2 2 t a n β i ,
In the equation, m is the number of layers obtained after slicing the STL model.
Let the volume error rate be η, and the actual volume and printed volume between the current two layers be VZ and VP, respectively. According to Equation (4), the volume error rate between the two layer heights can be calculated. The core of this calculation lies in obtaining the theoretical model volume and actual molding error value of the corresponding area.
η = | V z V p | V z = Δ V V z ,
The smaller the volume error rate, i.e., the closer it is to 0, the better the consistency between the printed part and the design model in terms of volume, and the higher the process accuracy. In the following, this volume error rate is used as one of the research objects for studying the surface quality of the printed model.

2.2. Experimental Methods and Procedures

In this study, the physical manufacturing of the 3D model was completed using a Bambu Lab A1 mini 3D printer (Shenzhen Tuozhu Technology Co., Ltd. in Shenzhen, China). ABS material was used for printing, and the setting of printing process parameters had a decisive impact on the final product’s molding quality. The specific process parameters that affected molding quality mainly included layer thickness, filling density, and shell layer. In addition to layer thickness, infill ratio, and shell layer count, factors such as printing temperature and infill angle also have a significant impact on model quality. This study focuses on the optimization analysis of the above three parameters, with specific level settings shown in Table 1.
When the layer thickness varies between 0.1 mm and 0.4 mm, a decrease in layer thickness leads to an increase in the number of layers and a denser distribution of layer sheets, which typically helps improve the surface quality of the molded part. However, printing experiments have shown that smaller layer thicknesses significantly increase printing time: when the layer thickness is 0.1 mm, printing takes 63 min; when the layer thickness is increased to 0.3 mm, printing time is reduced to 30 min, a significant reduction of approximately 50%, and printing efficiency is significantly improved.
Increasing fill density leads to a higher material deposition volume inside the model. As fill density increases from 10% to 40%, printing time correspondingly increases from 28 min to 33 min.
For the number of shell layers, increasing the number of layers thickens the outer contour shell, which helps improve the surface quality of the model and enhance the protective effect on the internal structure. However, since additional contour paths need to be deposited, the printing time increases accordingly: when the number of contour layers increases from 1 to 4, the printing time rises from 28 min to 33 min.

2.3. Analysis of the Impact of Printing Process Parameters on the Quality of Printed Models

2.3.1. Orthogonal Experimental Design

In the field of quality engineering and optimization design, signal-to-noise ratio (S/N Ratio) characteristics are primarily categorized into three types: desired large characteristics, desired target characteristics, and desired small characteristics. Among these, desired small characteristics refer to quality characteristics where the response values (such as error, defect count, noise intensity, etc.) are intended to be minimized. In contrast, desired large characteristics require maximizing response values (such as intensity or efficiency), while desired target characteristics aim to have response values (such as dimensional tolerances) approach specific target values [31].
The characteristic formula is shown in Equation (5):
S / N = 10 l g 1 n × i = 1 n 1 x i 2 ,
In the equation, n is the number of experimental repetitions; xi is the result of the i-th experiment.
The visual characteristic formula is shown in Equation (6):
S / N = 10 l g 1 n × i = 1 n x i x 0 2 ,
In the equation, n is the number of experimental repetitions; xi is the result of the i-th experiment; x0 is the target value.
The small characteristic formula is shown in Equation (7):
S / N = 10 l g 1 n × i = 1 n x i 2
The optimization objective of this chapter is the volume error rate of the printed model. Since we want the volume error rate to be as small as possible, we choose the “desire for smallness” characteristic for evaluation.
From the perspective of optimizing experimental resources, a full factorial experimental design is not feasible in terms of material consumption and time cost due to the need to exhaust all factor level combinations. In contrast, orthogonal experimental design can effectively solve this problem by scientifically selecting representative experimental combinations, significantly reducing the required number of experiments while ensuring data accuracy.
Based on the principle of orthogonal experimental design, this chapter determines the three printing process parameters described in the previous chapter as research variables, with four levels set for each variable. The specific parameter combinations and corresponding level values are detailed in Table 2.
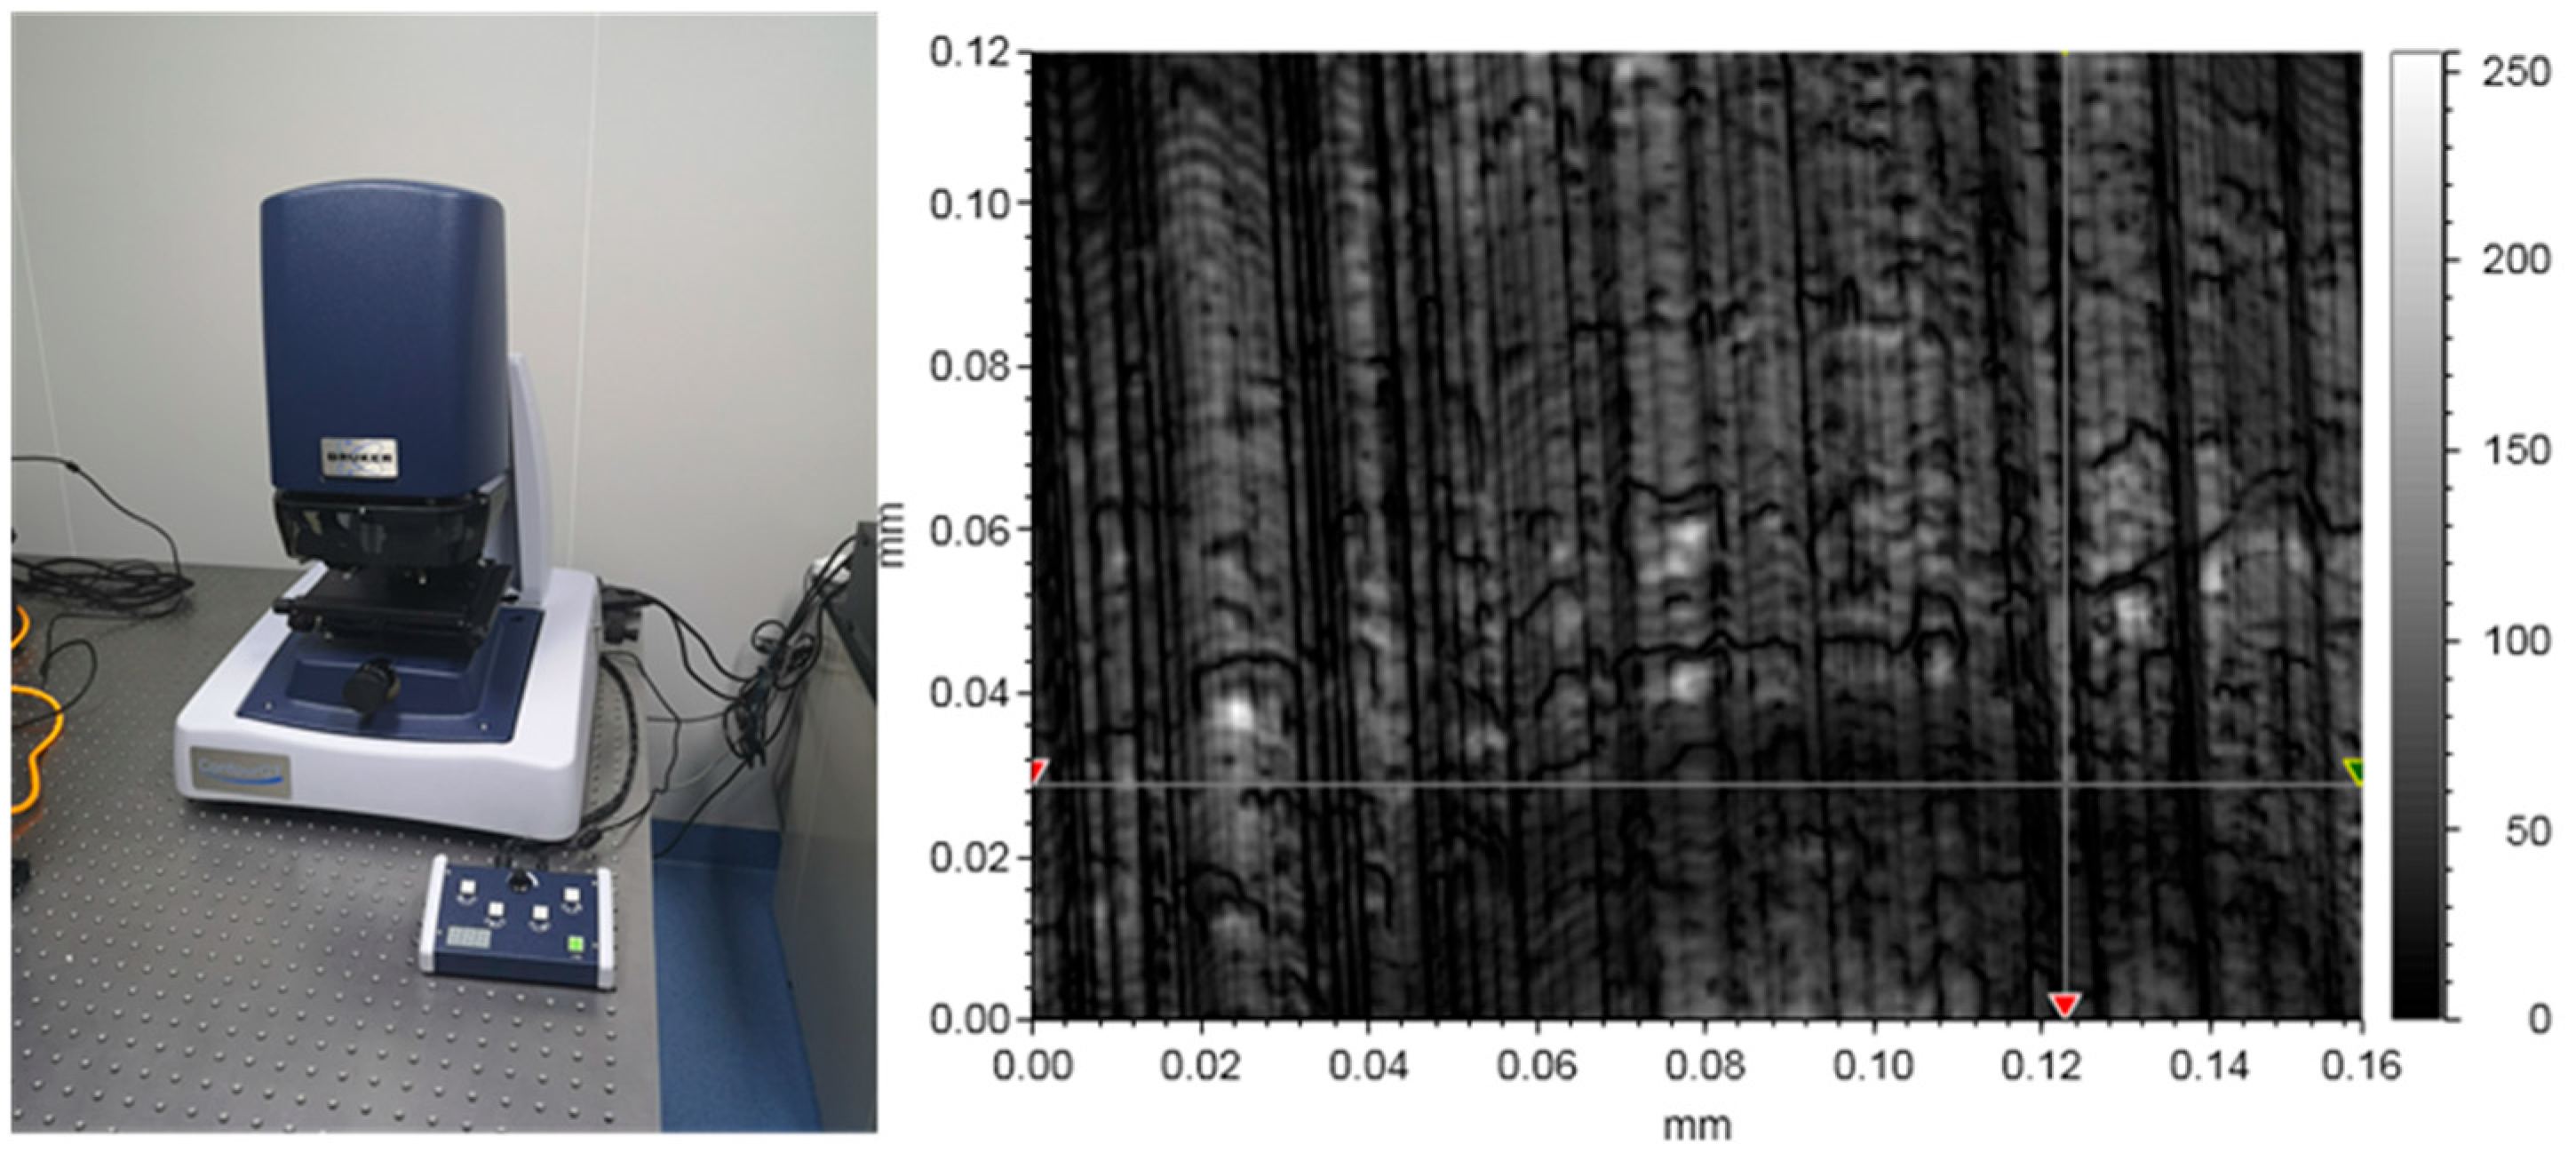
This study selected three controllable parameters as variables while fixing the remaining parameters: nozzle diameter of 0.4 mm, nozzle temperature of 240 °C, printing speed of 30 mm/s, linear infill pattern, and a single outer ring. In the orthogonal experiment, the volume error rate of the printed model served as the evaluation metric. All measurements in this study were performed using a Bruker ContourGT 3D optical profilometer (The German Brueck Group, Bremen, Germany). Measurements were conducted under ambient conditions, with laboratory temperature maintained at 20 ± 1 °C and humidity at 50 ± 5% RH (Relative Humidity). The instrument underwent rigorous calibration prior to use to ensure high precision in both PSI and VSI measurement modes. The Bruker ContourGT 3D Optical Profiler is shown in Figure 3.
Each sample underwent repeated measurements at three distinct positions along the X, Y, and Z axes, with each measurement repeated three times to assess repeatability. The volumetric error rate was calculated using Formula (3) by comparing the measured volume to the designed model volume. To minimize the impact of interference factors on experimental precision, duplicate samples were prepared for each set of process parameters, and each sample underwent three repeated measurements.
The volume error rate data represents the average of three repeated measurements for each duplicate sample, accompanied by standard deviation. This characterizes measurement variability, comprehensively ensuring data reliability and accuracy. The experimental data was substituted into Formula (7) to calculate the required small feature signal-to-noise ratio. The estimated combined standard uncertainty is Uc = 0.321, and the estimated expanded uncertainty (k = 2) is U = 0.642. The experimental volume error rate data and signal-to-noise ratio values are shown in Table 3 below.

2.3.2. Determining Optimal Printing Process Parameters Using the Extreme Difference Method

Based on the results of the signal-to-noise ratio response table analysis, the order of importance of each process parameter’s impact on the volume error rate can be determined. By combining signal-to-noise ratio analysis with range analysis, the level with the highest signal-to-noise ratio value for each factor is selected, and the optimal parameter combination determined in this way is shown in the table below.
Based on the signal-to-noise ratio values in Table 3, a signal-to-noise ratio response table for the volume error rate is plotted, as shown in Table 4.
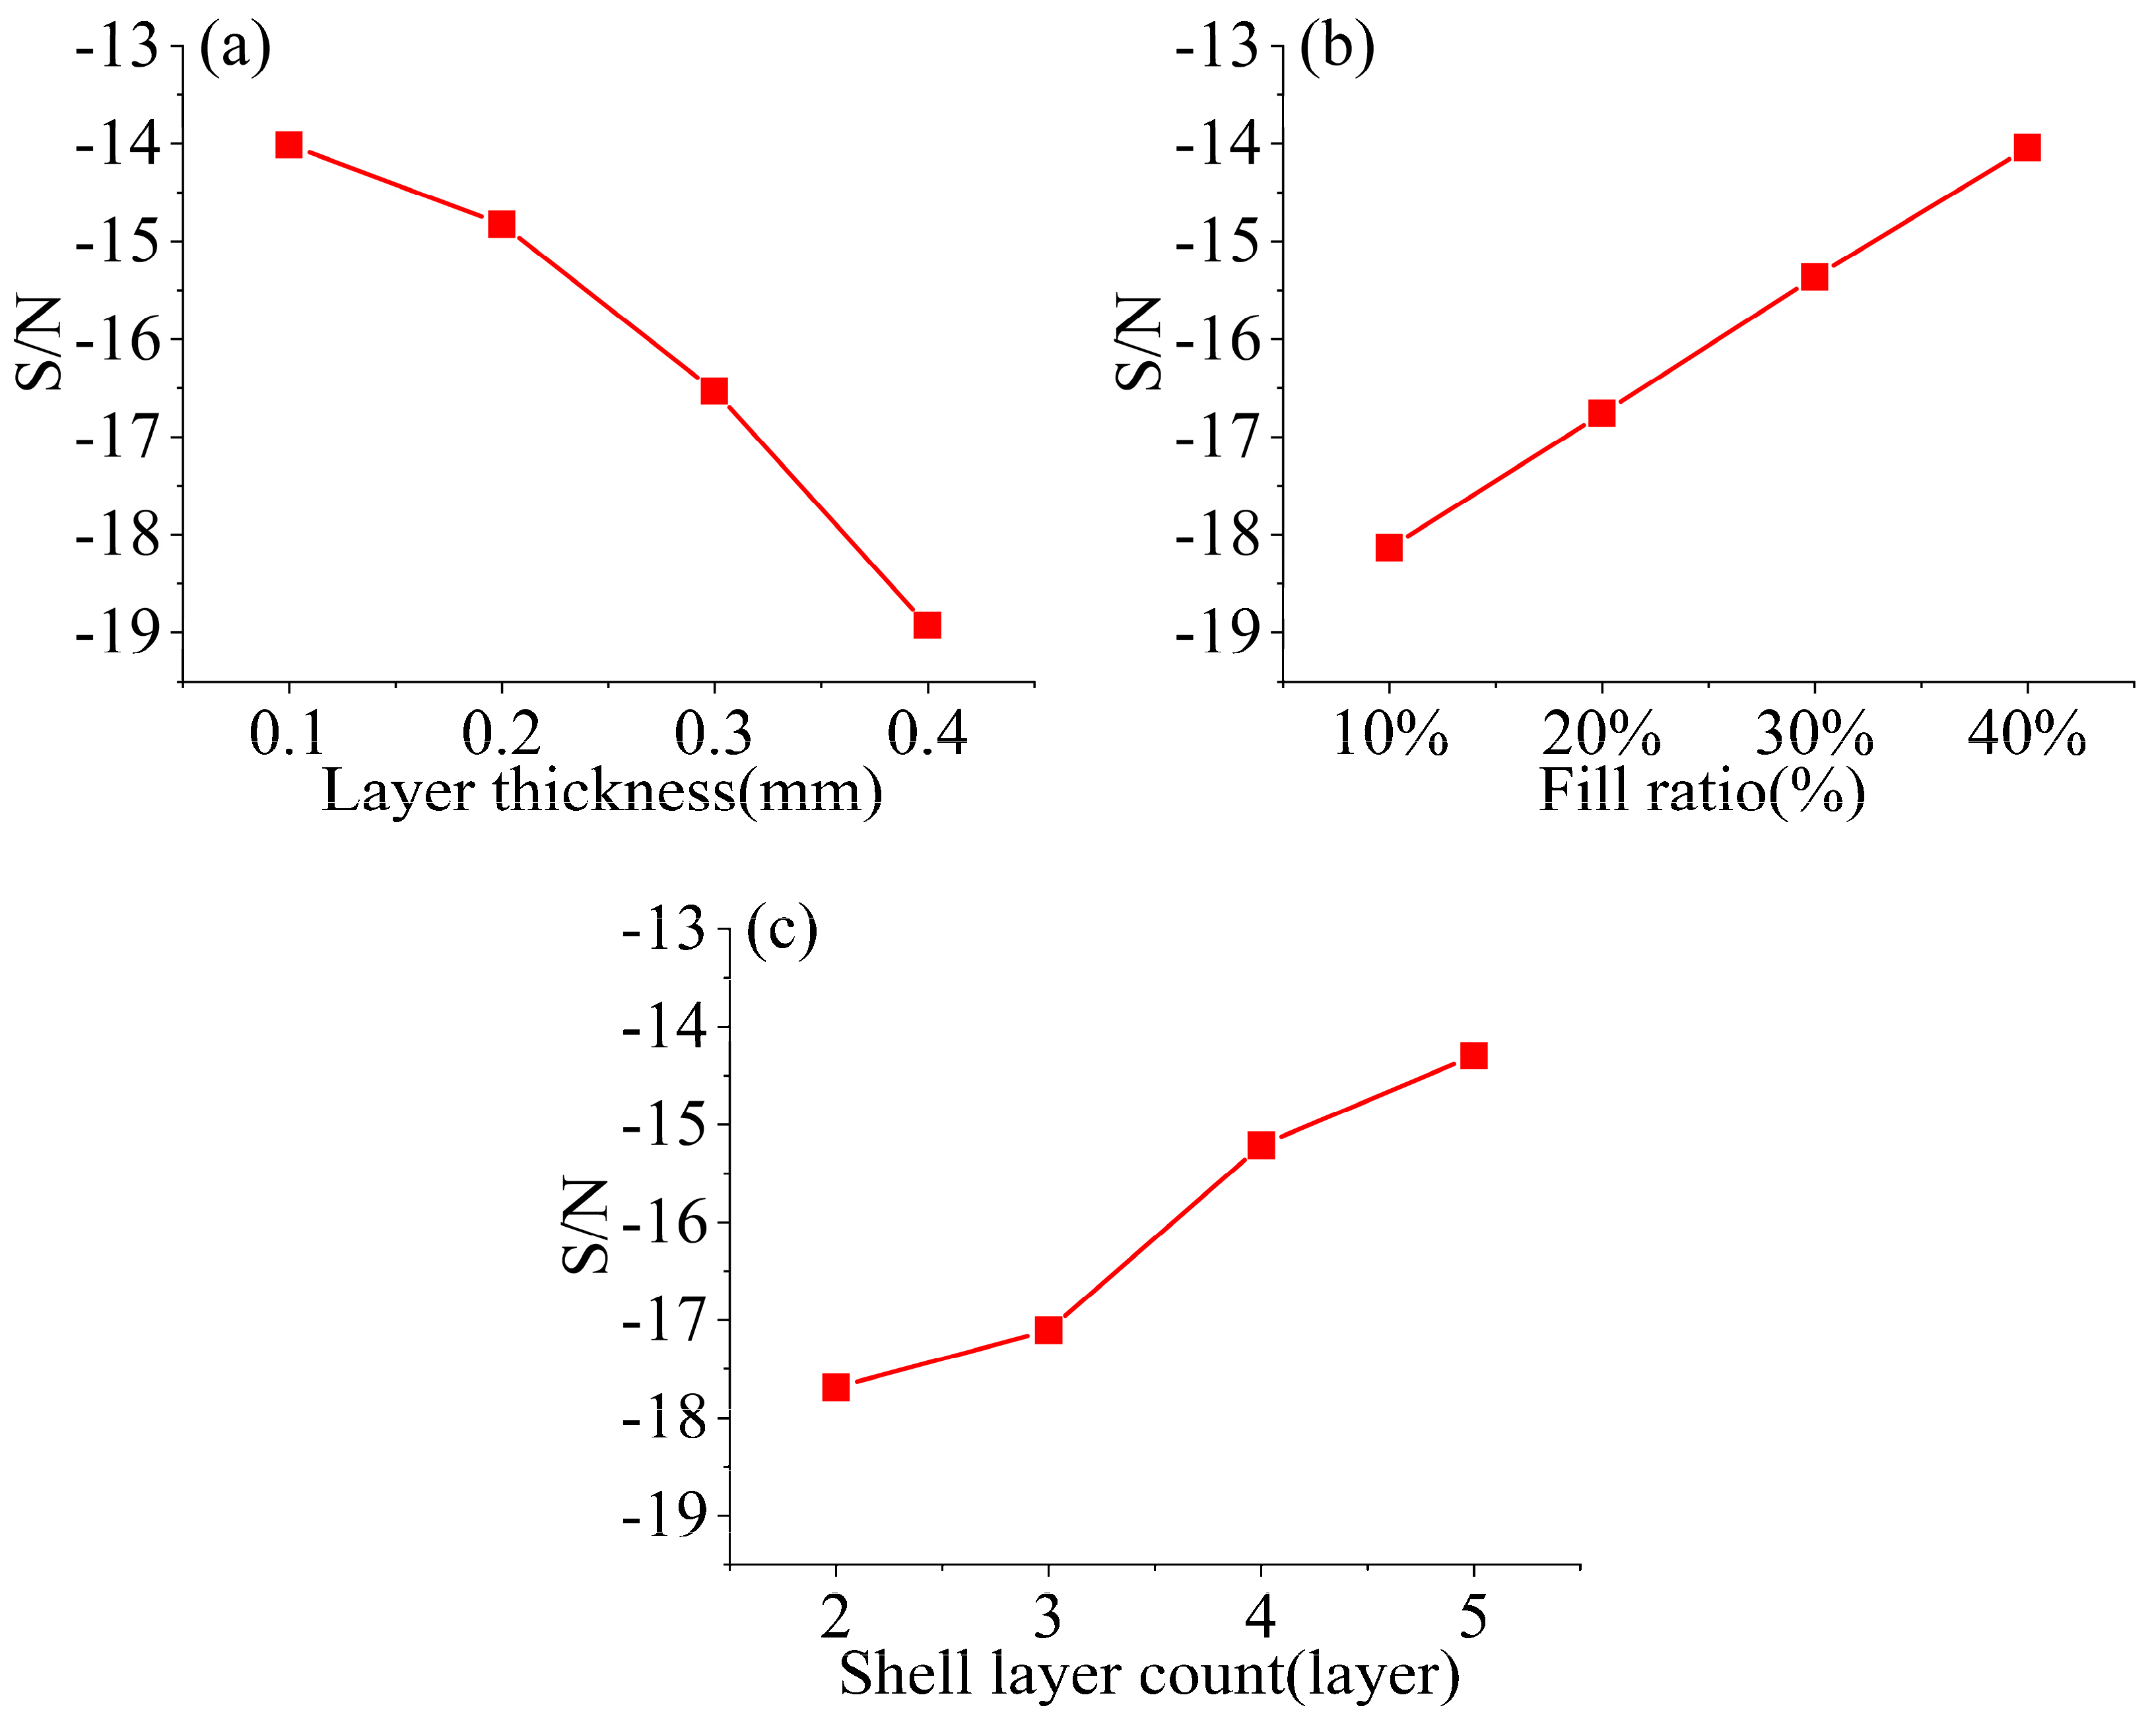
Based on Table 4, plot the main effect diagram of the signal-to-noise ratio of the warping amount of the test piece, as shown in Figure 4:
The experimental results indicate that the optimal process parameter combination for the test specimens is: layer thickness of 0.1 mm, fill ratio of 40%, and 5 outer shell layers. The test specimen printed using this parameter combination had a measured volume error rate of 3.062%, significantly lower than other experimental groups, validating the reliability of the parameter optimization scheme. According to the main effect diagram analysis, layer thickness had the most significant impact on the test specimen’s volume error rate, followed by fill ratio, with the number of outer layers having the least impact.

3. Analysis of Factors Affecting Printed Model Quality and Physical Comparison of Different Parameters

3.1. Building a BP Neural Network

In order to establish a prediction model for the quality of printed models, which will facilitate timely adjustments to process parameters in subsequent studies, this study constructed a BP neural network prediction model based on experimental data. The training process of the BP neural network can be summarized as an iterative optimization cycle that includes forward propagation and backward propagation.
This study constructs a single hidden layer BP neural network prediction model. The network structure consists of an input layer, a hidden layer, and an output layer. Based on the analysis in the preceding section, the input layer is set to three neurons, corresponding to layer thickness, filling density, and contour layer number, respectively.
The output layer is set to 2 neurons, which output the volume error rate and signal-to-noise ratio, respectively. The number of neurons in the hidden layer is initially set based on an empirical formula, and a constant term is appropriately added for adjustment and optimization when the prediction error (the absolute difference between the actual value and the predicted value) is unsatisfactory. After multiple training and validation iterations, it was found that when the number of hidden layer neurons is 10, the model achieves the smallest prediction error and optimal structure. Therefore, the final established network structure is 3-10-2, with its topological structure shown in Figure 5.
The training of the predictive model employs the Levenberg–Marquardt (LM) algorithm. This algorithm is a widely used optimization method in fields such as parameter estimation, curve fitting, and machine learning, specifically designed to solve nonlinear least-squares problems. The core advantage of the LM algorithm lies in its integration of the strengths of two classical optimization strategies, achieving an effective balance between convergence speed and numerical stability. It serves as an efficient tool for solving nonlinear optimization problems and can be directly invoked via the MATLAB toolbox (MATLAB 2021) [32].
The dataset used in training the BP neural network was randomly partitioned into a training set (70%), validation set (15%), and test set (15%), as shown in Figure 4. After 8 iterations, the model’s mean absolute error (MAE) converged to the target accuracy (3.8501 × 10⁻⁶). At this point, the prediction results corresponding to the network parameters met the predefined error requirements, indicating that the backpropagation neural network training was complete. Note that the target accuracy in Figure 6 reached the 10−6 magnitude, necessitating a smaller scale on the vertical axis to accurately represent the precision values.

3.2. BP Neural Network Prediction Verification

To validate the model’s generalization ability, follow-up model validation work is required: prediction validation experiments are conducted using process parameter combinations that were not involved in training. The deviation between the model’s predicted values and the actual measured values is compared, and the prediction accuracy is quantified and evaluated using the mean absolute percentage error (MAPE). If the MAPE value meets the pre-set accuracy standards, it can be confirmed that the BP network model has engineering application value.
In this study, new printing parameter combinations were selected for model prototyping, with the results of each group of experiments detailed in Table 5.
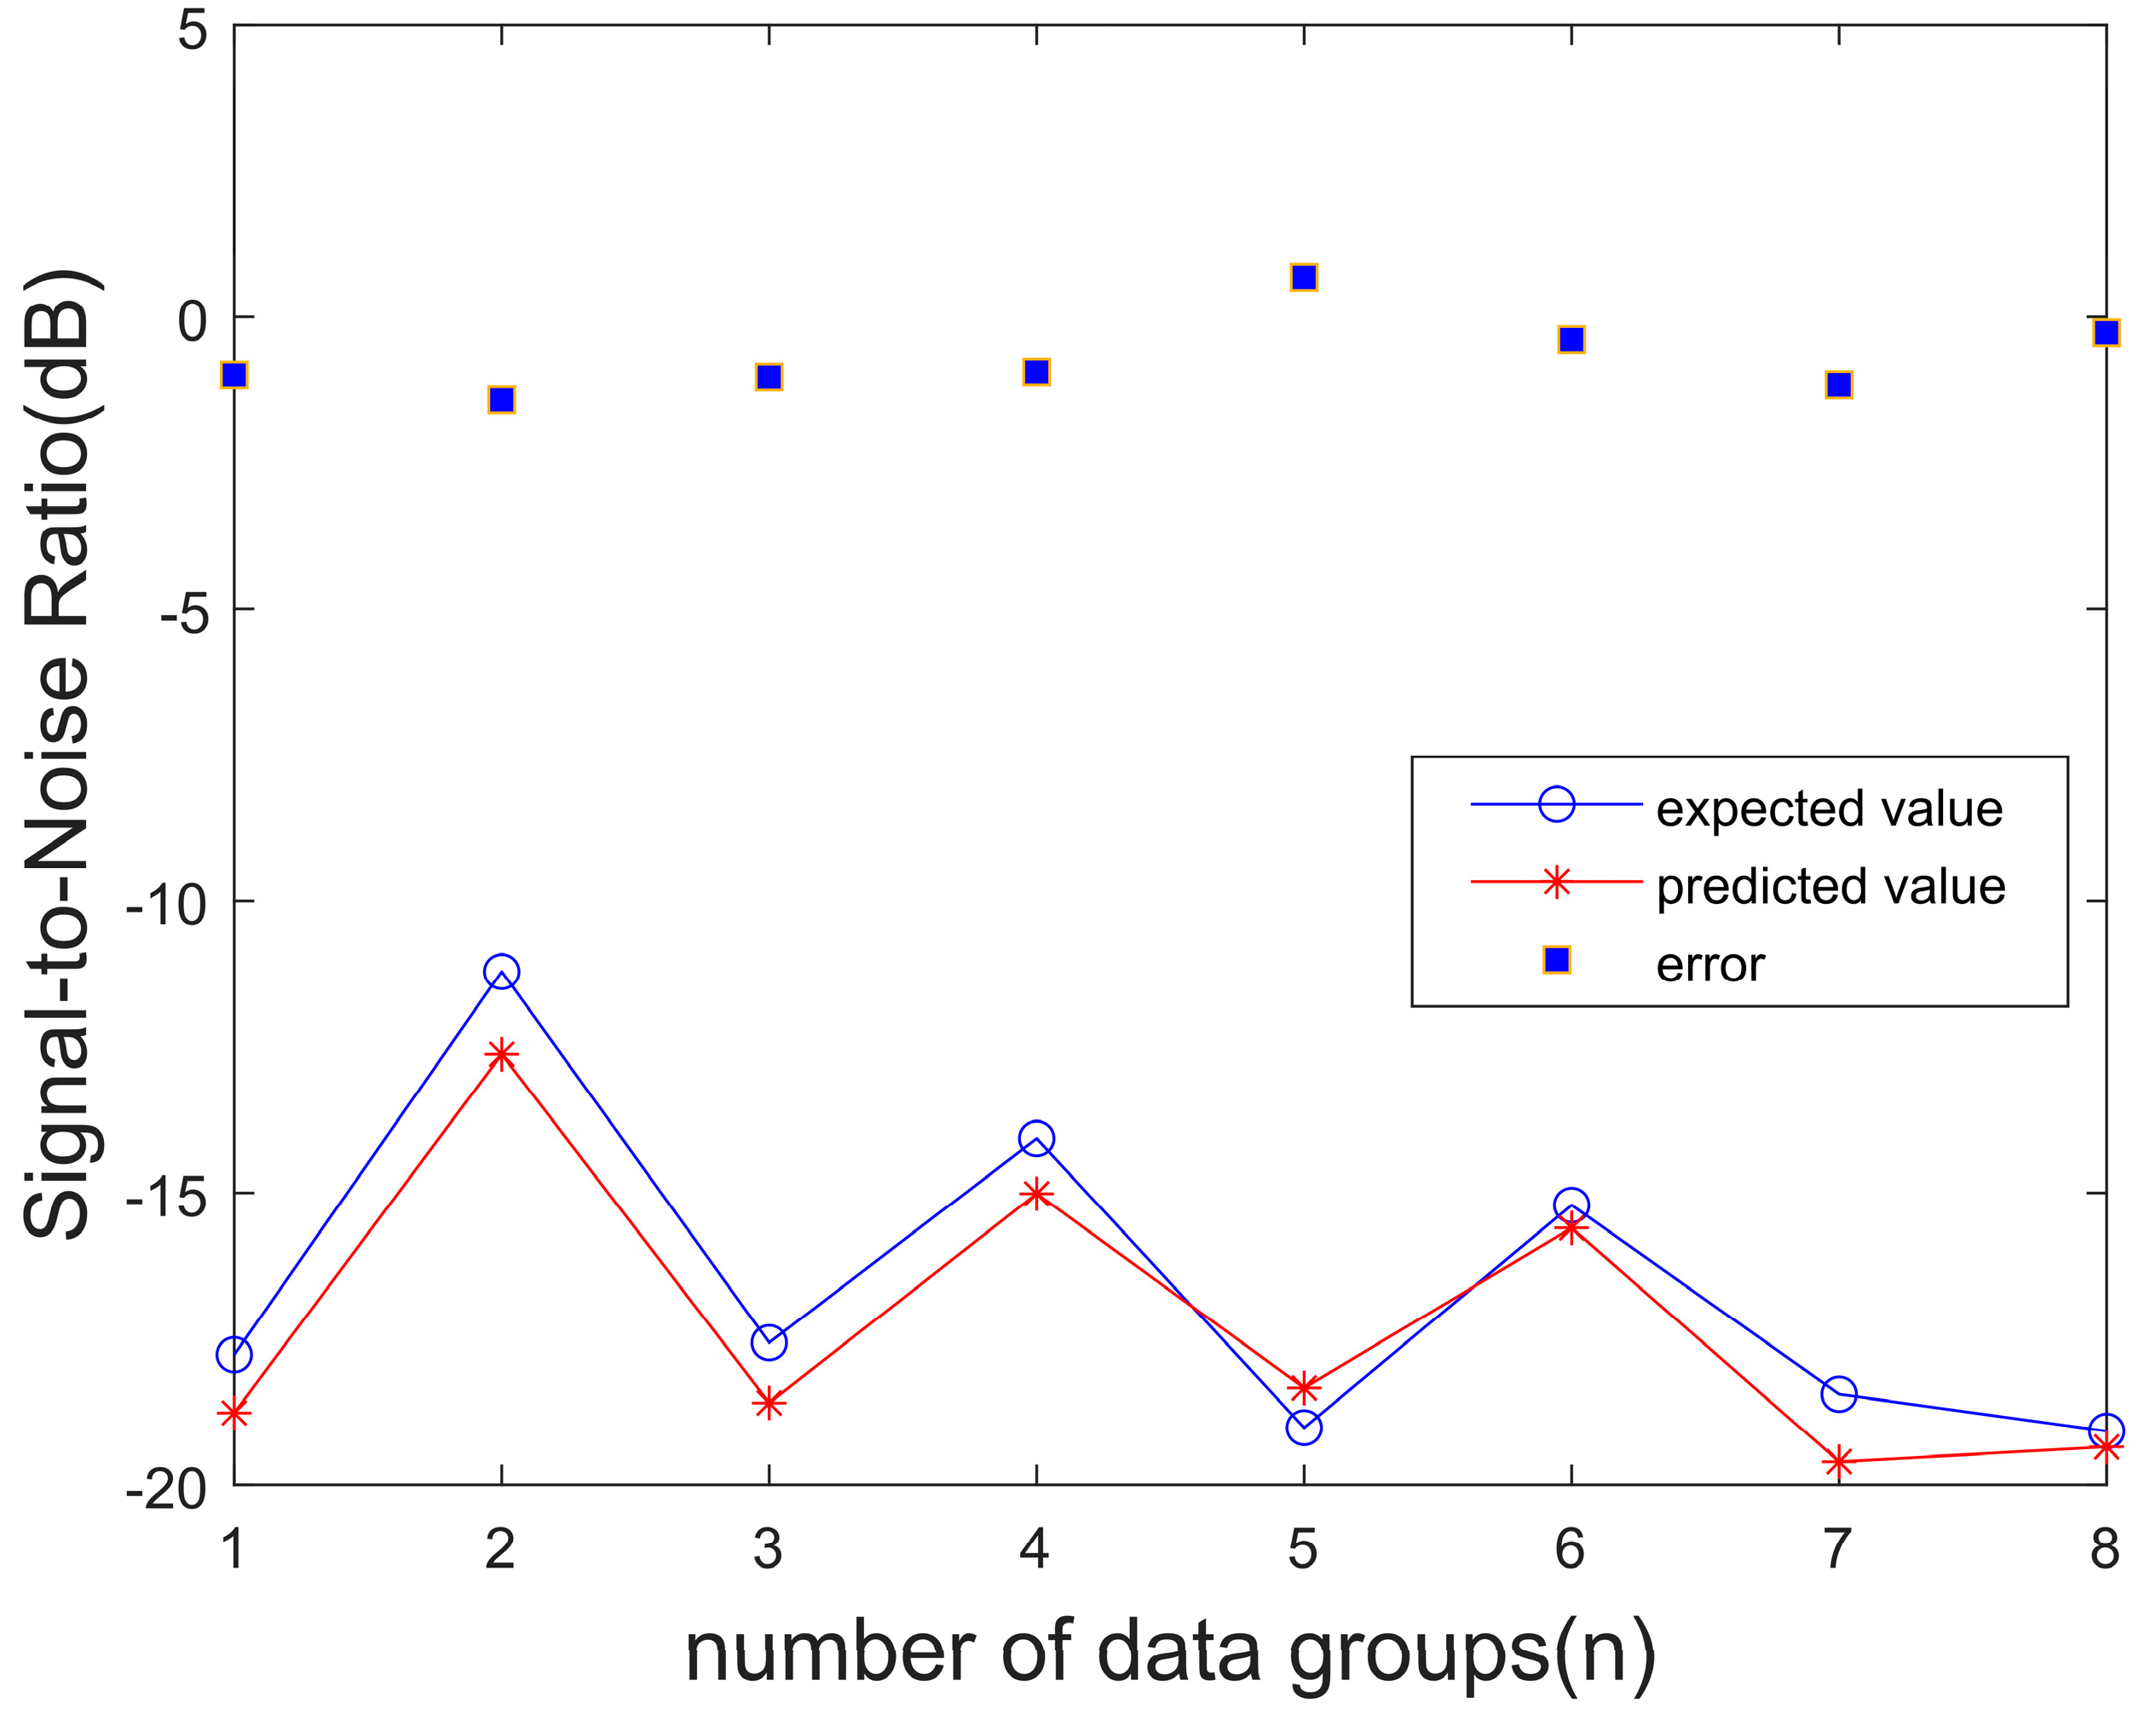
Normalize the data in the table, then compare the volume error rate and signal-to-noise ratio prediction results output by the prediction model with the measured values in the table above. The results are shown in Figure 7 and Figure 8:
The experimental results indicate that the 3-10-2 structure BP neural network model constructed in this study demonstrates excellent predictive performance for both the volume error rate and signal-to-noise ratio (S/N) parameters of FDM-printed specimens. Statistical analysis shows that the mean absolute percentage error (MAPE) for volume error rate prediction is no higher than 5.41%, and the MAPE for S/N prediction is 5.58%, validating the model’s high-precision predictive capability. This research provides theoretical basis and data support for the optimization of process parameters in FDM equipment.

3.3. Physical Comparison of Different Parameters

After grouping the parameters, a physical link model was printed using a 3D printer. This model will be printed in subsequent steps, and photographs of the printed model will be taken for comparison. The three images used in this comparative analysis were all captured using an Olympus microscope (BX51-P, Olympus Corporation, Tokyo, Japan) at 5× optical zoom. During photography, the camera position and angle were strictly fixed using fixtures to ensure identical imaging perspectives across all three models. Precise control of the object distance guaranteed identical imaging dimensions for the model in all three photographs, providing a highly consistent baseline for subsequent visual comparisons or quantitative analysis. Figure 9 displays the models printed under three sets of parameter configurations:
Printing experiments on connecting rod models under different parameter combinations were conducted. As shown in Figure 9a (layer thickness: 0.4 mm, infill ratio: 10%, shell layer count: 2), obvious interlayer gaps and delamination can be observed on the model surface, which appears relatively rough. Figure 9b presents the printing results after parameter optimization (layer thickness: 0.2 mm, infill ratio: 20%, shell layer count: 3). It is observed that interlayer gaps are significantly reduced, the surface tends to be flat, and the compactness of the internal structure is improved. The model printed with the optimal parameter combination determined in this study (layer thickness: 0.1 mm, infill ratio: 40%, shell layer count: 5) is shown in Figure 9c, with no obvious interlayer gaps and a smooth, flat surface. Meanwhile, the density of the internal support structure is significantly increased, providing sufficient support for the model’s printing strength and surface accuracy.
Through the physical comparison of the above-mentioned connecting rod models, it is evident that the optimized process parameters in this study can effectively enhance the printing quality and surface accuracy of the models.

4. Results and Discussion

This study systematically investigates the effects of three critical process parameters layer thickness, infill density, and outer shell layers on the volume error rate and signal-to-noise ratio (S/N) of Fused Deposition Modeling (FDM) parts through an L16 (43) orthogonal experimental design. Analysis of 16 experimental datasets clarified the mechanisms by which each parameter influences print quality and identified the optimal parameter combination [33].
Results indicate that layer thickness is the most significant factor affecting volume error rate. At 0.1 mm layer thickness, the volume error rate was lowest (3.062%); however, increasing layer thickness to 0.3 mm caused the error rate to rise significantly to 9.572%. Range analysis indicates that variations in layer thickness account for approximately 47.5% of the error rate fluctuation. Fill density has the second-most significant impact on accuracy: a 40% fill density helps reduce volumetric error, whereas lowering it to 10% causes a noticeable increase in the error rate. The number of shell layers had a relatively minor effect on the error rate but still exerted a certain regulatory influence. Within the selected parameter range, the optimal combination was a layer thickness of 0.1 mm, a fill density of 40%, and 5 shell layers. Under this combination, the volumetric error rate was only 3.062%, and the signal-to-noise ratio was −9.719 dB, indicating optimal print consistency and stability under these conditions.
From a forming mechanism perspective, thinner layer thickness accelerates heat dissipation, promoting more uniform temperature distribution throughout the specimen and thereby reducing thermal stress. Additionally, smaller interlayer temperature gradients facilitate molecular chain diffusion, promoting stress relaxation at the interlayer bonding interface. This effectively suppresses shrinkage deformation during the fused deposition process, reducing volumetric error. Higher infill density implies a more compact internal material structure, which helps minimize overall shrinkage during cooling. Simultaneously, increased shell layers provide more stable external support during the late cooling phase, effectively constraining shrinkage deformation and preserving geometric accuracy.
Based on these findings, this study further developed a BP neural network model to predict volume error rate and signal-to-noise ratio. This model demonstrated high goodness-of-fit and low prediction error, validating the reliability of process parameter optimization through orthogonal experiments and providing an effective tool for intelligent control of FDM processes [34].
In summary, this study clarified the influence patterns of layer thickness, infill density, and shell layers on print quality through orthogonal experiments and data analysis, identified optimal parameter combinations, and achieved accurate prediction of quality metrics via neural network modeling. These findings hold significant theoretical and engineering implications for enhancing the precision and stability of FDM processes.
It should be noted that different materials exhibit varying responses to the same set of printing parameters due to their inherent thermophysical properties (e.g., thermal shrinkage rate, glass transition temperature (Tg), crystallinity, hygroscopicity). Therefore, the optimal parameter combinations obtained herein are applicable to ABS material and materials with similar characteristics.

5. Conclusions

This study systematically investigates the dual impact of key printing parameters—layer thickness, infill density, and shell layers—on both quality and efficiency in Fused Deposition Modeling (FDM) technology. Key findings are summarized as follows:
  • Layer thickness exerts the most significant impact on printing time, followed by infill density and shell layers. Testing revealed that a 0.1 mm layer thickness combined with 40% infill density and a 5-layer shell structure effectively reduces volumetric error while enhancing surface quality, constituting the optimal parameter combination for achieving the best printing results.
  • Under optimized parameters, both volumetric error rate and signal-to-noise ratio were significantly reduced, thereby improving the geometric accuracy and structural consistency of printed parts.
  • The BP neural network-based prediction model demonstrated high accuracy, with mean absolute percentage errors for volume error and signal-to-noise ratio below 5.41% and 5.58%, respectively.
Despite these findings, this study has certain limitations. The parameter range and material type (ABS) may restrict the generalizability of results to other materials or printing technologies. Additionally, the neural network model was trained on a limited dataset, which may affect its predictive performance under untested conditions.
This study provides practical insights for parameter optimization in fused deposition modeling (FDM), contributing to enhanced printing efficiency and product quality. Theoretically, it establishes a predictive framework integrating experimental analysis with machine learning, supporting intelligent decision-making in additive manufacturing.
Future research should expand parameter ranges, incorporate diverse materials, and explore hybrid models integrating real-time monitoring to further improve prediction accuracy and adaptability.

Author Contributions

Conceptualization, J.W., Y.Z. and G.D.; methodology, J.W. and W.H.; software, J.W. and C.W.; validation, J.W., W.H. and G.D.; formal analysis, J.W.; investigation, J.W. and Z.Y.; resources, J.W., G.D., W.H., C.W. and Z.Y.; data curation, W.H. and Y.Z.; writing—original draft preparation, J.W.; writing—review and editing, G.D., C.W. and Z.Y.; visualization, G.D. and Y.Z. supervision, G.D.; project administration, J.W. and G.D. funding acquisition, J.W. and G.D. All authors have read and agreed to the published version of the manuscript.

Funding

This study was supported by the Natural Science Foundation of Guizhou Minzu University (Grant No: GZMUZK [2022] YB01); Doctoral Student Training Fund Project of Guizhou Minzu University (Grant No: GZMUZK [2024] QD72); Guizhou Provincial Science and Technology Project (Grant No: KJZY [2025] 082); and Guizhou Provincial Science and Technology Project (Grant No: KJZY [2025] 080).

Data Availability Statement

The original contributions presented in the study are included in the article; further inquiries can be directed to the corresponding author.

Conflicts of Interest

Jinxing Wu, Yi Zhang, Wenhao Hu, Changcheng Wu and Zuode Yang have received research grants from Guiyang Xianfeng Machine Tool Co., Ltd.

References

  1. Silveira, Z.D.C.; Freitas, M.S.; Inforçatti Neto, P.; Noritomi, P.Y.; da Silva, J.V.L. Design development and functional validation of an interchangeable head based on mini screw extrusion applied in an experimental desktop 3-D printer. Int. J. Rapid Manuf. 2014, 4, 49–65. [Google Scholar] [CrossRef]
  2. Zhou, H.M.; Wang, Z.Y. Distance-Field-Based Layered Manufacturing of FGM Objects. In Proceedings of the 2nd Annual International Conference on Advanced Material Engineering (AME 2016), Wuhan, China, 15–17 April 2016; Volume 52, pp. 694–699. [Google Scholar]
  3. Xiao, X.; Joshi, S. Automatic toolpath generation for heterogeneous objects manufactured by directed energy deposition additive manufacturing process. J. Manuf. Sci. Eng. 2018, 140, 071005. [Google Scholar] [CrossRef]
  4. Mei, S.M.; Zhang, M.Y.; Li, Z.W.; He, B.G.; Song, J.Q. Forming quality evaluation of 3D printed lines and layers with cement-based materials under different process parameters. Rapid Prototyp. J. 2025, 31, 1567–1580. [Google Scholar] [CrossRef]
  5. Lu, S.W.; Zhang, B.N.; Wang, Y.Z.; Bai, J.C.; Yang, C.C.; Sun, C.N.; Li, D.C. Sensitivity analysis of process parameters on the properties of carbon fiber reinforced polyether-ether-ketone composites in screw extrusion 3D printing. Polym. Test. 2025, 150, 108884. [Google Scholar] [CrossRef]
  6. Jiang, T.; Zhao, Y.; Yu, Y.; Gao, S.; Guo, B.; Wu, X.; Doumbia, B.S. Optimization Study of Digital Light Processing 3D Printing Process Parameters by Surface Response Approach. J. Mater. Eng. Perform. 2025, 1–12. [Google Scholar] [CrossRef]
  7. Kechagias, J.; Zaoutsos, S. Effects of 3D-printing processing parameters on FFF parts’ porosity: Outlook and trends. Mater. Manuf. Process. 2024, 39, 804–814. [Google Scholar] [CrossRef]
  8. Dwivedi, K.; Joshi, S.; Nair, R.; Sapre, M.S.; Jatti, V. Optimizing 3D printed diamond lattice structure and investigating the influence of process parameters on their mechanical integrity using nature-inspired machine learning algorithms. Mater. Today Commun. 2024, 38, 108233. [Google Scholar] [CrossRef]
  9. Ye, W.; Dou, H.; Zhang, D.; Yang, F.; Cheng, Y.; Cai, W. Effects of process parameters on mechanical properties and interface of 3D printed bamboo-inspired CCFR-PLA/TPU composites. Polym. Compos. 2024, 45, 227–242. [Google Scholar] [CrossRef]
  10. Mishra, A.; Kumar, R.; Sharma, A.K.; Gupta, N.K.; Somani, N. A statistical analysis on effect of process parameters on tensile, flexural, and hardness characteristics of wood–polylactic acid composites using FDM 3D printing. Int. J. Interact. Des. Manuf. 2024, 18, 1303–1315. [Google Scholar] [CrossRef]
  11. Kechagias, J.D.; Vidakis, N.; Petousis, M.; Mountakis, N. A multi-parametric process evaluation of the mechanical response of PLA in FFF 3D printing. Mater. Manuf. Process. 2023, 38, 941–953. [Google Scholar] [CrossRef]
  12. Sherif, M.; Mekhiel, S.; Elmesalamy, A.S.; Mahmoud, H. Investigation of FDM Process Parameters and their Interactions on Surface Roughness of PLA 3D Printed Parts. J. Phys. Conf. Ser. 2025, 3058, 012017. [Google Scholar] [CrossRef]
  13. Zhang, H.; Zhang, Z.; Long, Y.; Ran, X.; Guo, Y.; Li, Y. Enhanced Mechanical Properties of Continuous Carbon Fiber-Reinforced PEEK Composites via Process Parameters Optimization and Assisted Infrared Irradiation Heating. Compos. Commun. 2025, 58, 102531. [Google Scholar] [CrossRef]
  14. Gupta, A.; Meshram, J.R.; Singh, M.; Francis, V.; Saini, J.S. Experimental and numerical studies on the contributions of the different geometric and process parameters on 3D printed PLA pin joints. J. Braz. Soc. Mech. Sci. Eng. 2025, 47, 379. [Google Scholar] [CrossRef]
  15. Hartomacıoğlu, S.; Oksuz, M.; Ekinci, A.; Ates, M. Optimization of Produced Parameters for PA6/PA6GF30 Composite Produced by 3D Printing with Novel Knitting Method. Polymers 2025, 17, 1590. [Google Scholar] [CrossRef]
  16. Haque, M.M.M.; Dhrubo, S.R.; Pranto, A.F.Z.; Ahmed, A.; Arefin, M.M.; Arifuzzaman, M.; Islam, M.S. Impact of Process Parameters and Material Selection on the Mechanical Performance of FDM 3D-Printed Components. Hybrid Adv. 2025, 10, 100502. [Google Scholar] [CrossRef]
  17. Towaiq, A.; Obaidat, S.; Mumani, A.; Ziout, A. An application of the preference selection index decision making method for parameters selection of FDM printing process. J. Eng. Res. 2025, 13, 636–642. [Google Scholar] [CrossRef]
  18. Tran, N.H.; Phan, N.D.M. Analyzing the impact of process parameters on surface roughness and mechanical properties in FDM 3D printing using machine learning. Int. J. Interact. Des. Manuf. 2025, 1–20. [Google Scholar] [CrossRef]
  19. Özdoğan, S.; Meram, A.; Çetin, M.E. Manufacturing parameters’ effects on the flexural properties of 3D-printed PLA. Mater. Test. 2025, 67, 811–820. [Google Scholar] [CrossRef]
  20. Vemuri, V.P.B.; Basavaraja, V.K.G.; Chinthalapudi, R.; Pappula, B. Advanced process parameter optimization for dimensional accuracy in SS 316L 3D printing using response surface methodology. Mater. Res. Express 2025, 12, 056510. [Google Scholar] [CrossRef]
  21. Ashok, S.; Kaji, S.G.; Sabit, A. Effect of FDM process parameters on mechanical properties of 3D-printed fabrics and yarns from polyethylene terephthalate glycol, nylon and thermoplastic polyurethane. Rapid Prototyp. J. 2025, 31, 934–949. [Google Scholar] [CrossRef]
  22. Kidie, F.M.; Ayaliew, T.G.; Mekonone, S.T. Optimizing 3D printing process parameters to improve surface quality and investigate the microstructural characteristics of PLA material. Int. J. Adv. Manuf. Technol. 2025, 138, 457–470. [Google Scholar] [CrossRef]
  23. Medibew, T.M.; Ali, A.N. Analysis and optimization of FFF process parameters to enhance the mechanical properties of 3D printed PLA products. Int. Polym. Process. 2023, 38, 61–76. [Google Scholar] [CrossRef]
  24. Nyiranzeyimana, G.; Mutua, J.M.; Ochuku Mbuya, T.; Mose, B.R.; Bisengimana, E. Fused deposition modelling (FDM) process parameter optimization to minimize residual stresses of 3 d printed carbon fiber nylon 12 hip joint implant. Mater. Und Werkst. 2022, 53, 1184–1199. [Google Scholar] [CrossRef]
  25. Olam, M. Determining of process parameters of the PLA/titanium dioxide/hydroxyapatite filament. Adv. Mater. Process. Technol. 2022, 8, 4776–4787. [Google Scholar] [CrossRef]
  26. Monticeli, F.M.; Neves, R.M.; Ornaghi Jr, H.L.; Almeida Jr, J.H.S. Prediction of bending properties for 3D-printed carbon fibre/epoxy composites with several processing parameters using ANN and statistical methods. Polymers 2022, 14, 3668. [Google Scholar] [CrossRef]
  27. Abas, M.; Habib, T.; Noor, S.; Salah, B.; Zimon, D. Parametric investigation and optimization to study the effect of process parameters on the dimensional deviation of fused deposition modeling of 3D printed parts. Polymers 2022, 14, 3667. [Google Scholar] [CrossRef]
  28. Morvayová, A.; Contuzzi, N.; Fabbiano, L. Multi-Attribute Decision Making: Parametric Optimization and Modeling of the FDM Manufacturing Process Using PLA/Wood Biocomposites. Materials 2024, 17, 924. [Google Scholar] [CrossRef]
  29. Ge, G.; Fan, X.; Jiang, X. Parametric Optimization of FDM Process for Improving Mechanical Strengths Using Taguchi Method and Response Surface Method: A Comparative Investigation. Machines 2022, 10, 750. [Google Scholar] [CrossRef]
  30. Lv, N.; Ouyang, X.; Qiao, Y. Adaptive layering algorithm for FDM-3D printing based on optimal volume error. Micromachines 2022, 13, 836. [Google Scholar] [CrossRef]
  31. Wang, B.; Yang, R.; Li, P.; Li, Q.; Yu, H.; Li, Z. Design of Quality Gain-Loss Function with the Cubic Term Consideration for Larger-the-Better Characteristic and Smaller-the-Better Characteristic. Mathematics 2025, 13, 777. [Google Scholar] [CrossRef]
  32. Mohammadiun, H.; Mohammadiun, M.; Parvaneh, V. Investigation of the inverse problem in inclined lid-driven cavity with non-uniform heating on both side walls using the Levenberg-Marquardt algorithm. Case Stud. Therm. Eng. 2025, 69, 106051. [Google Scholar]
  33. Cicek, U.I.; Johnson, A.A. Multi-objective optimization of FDM process parameters for 3D-printed polycarbonate using Taguchi-based Gray Relational Analysis. Int. J. Adv. Manuf. Technol. 2025, 137, 3709–3725. [Google Scholar] [CrossRef]
  34. Liu, C.H.; Li, H.; Yu, C.L.; Liao, X.R.; Liu, X.J.; Sun, J.Z.; Yu, M. Balanced optimization of dimensional accuracy and printing efficiency in FDM based on data-driven modeling. Addit. Manuf. Front. 2025, 4, 200220. [Google Scholar] [CrossRef]
Figure 1. Local step effect diagram.
Coatings 15 01117 g001
Figure 2. Volume error diagram [30].
Coatings 15 01117 g002
Figure 3. Bruker ContourGT 3D Optical Profiler.
Coatings 15 01117 g003
Figure 4. Signal-to-noise ratio main effect plot. (a) Effect of layer thickness on signal-to-noise ratio; (b) Effect of fill ratio on signal-to-noise ratio; (c) Effect of the number of shell layers on the signal-to-noise ratio.
Coatings 15 01117 g004
Figure 5. Predictive modeling structure.
Coatings 15 01117 g005
Figure 6. Prediction Model Error Curve.
Coatings 15 01117 g006
Figure 7. Volume Error Rate Prediction Results Plot.
Coatings 15 01117 g007
Figure 8. Plot of signal-to-noise ratio prediction results.
Coatings 15 01117 g008
Figure 9. (a) Layer thickness: 0.4, fill ratio: 10%, number of shell layers: 2. (b) Layer thickness: 0.2, fill ratio: 20%, number of shell layers: 3. (c) Layer thickness: 0.1, fill ratio: 40%, number of shell layers: 5.
Coatings 15 01117 g009
Table 1. Horizontal design for different process parameters.
PARAMETER NAMELEVEL
LAYER THICKNES (MM)0.1, 0.2, 0.3, 0.4
FILLING RATIO (%)10%, 20%, 30%, 40%
SHELL LAYERS (LAYER)2, 3, 4, 5
Table 2. Print process parameter level grouping.
Serial NumberLayer Thickness
(mm)
Filling Ratio (%)Shell Layers
(Layer)
10.110%2
20.220%3
30.330%4
40.440%5
Table 3. Experimental data and signal-to-noise ratio.
Serial
Number
Layer Thickness
(MM)
Filling Ratio
(%)
Shell
Layers
Number of Measurements
(n)
Volumetric Error Rate (%)S/N
111167.896 ± 0.336−17.949 ± 0.275
212266.471 ± 0.341−16.219 ± 0.226
313364.062 ± 0.329−12.195 ± 0.244
414463.062 ± 0.321−9.719 ± 0.242
521267.843 ± 0.326−17.889 ± 0.343
622166.613 ± 0.341−16.408 ± 0.234
723464.929 ± 0.328−13.855 ± 0.366
824363.609 ± 0.320−11.148 ± 0.391
931367.843 ± 0.306−17.889 ± 0.327
1032465.492 ± 0.329−14.795 ± 0.347
1133167.272 ± 0.312−17.259 ± 0.298
1234266.432 ± 0.320−16.167 ± 0.394
1341468.716 ± 0.320−18.806 ± 0.394
1442369.572 ± 0.300−19.620 ± 0.302
1543268.079 ± 0.291−18.147 ± 0.275
1644169.057 ± 0.311−19.139 ± 0.356
Table 4. Print process parameter signal-to-noise response table.
Level Printing Process ParametersLayer Thickness (MM)Filling Ratio (%)Shell Layers
K1−56.082−72.533−70.755
K2−59.30−67.042−68.422
K3−66.11−61.456−60.852
K4−75.712−56.173−57.175
K1−14.021−18.133−17.689
K2−14.825−16.761−17.106
K3−16.528−15.364−15.213
K4−18.928−14.043−14.293
R4.9074.093.396
Impact ranking123
Table 5. Prediction validation experiment results.
Serial
Number
Layer Thickness (MM)Filling Ratio
(%)
Shell
Layers
Volumetric Error Rate (%)S/N
11127.064−16.741
21343.528−10.532
32116.178−15.429
42333.694−11.072
53148.809−19.024
63325.601−15.213
74138.526−18.449
84318.900−19.082
Disclaimer/Publisher’s Note: The statements, opinions and data contained in all publications are solely those of the individual author(s) and contributor(s) and not of MDPI and/or the editor(s). MDPI and/or the editor(s) disclaim responsibility for any injury to people or property resulting from any ideas, methods, instructions or products referred to in the content.