Article

Reuse of Polymeric Resin for Production of Activated Hydrochar Applied in Removal of Bisphenol A and Diclofenac Synthetic Aqueous Solution

by
Andreia Cristina Fonseca Alves
1,*,
Sérgio Botelho de Oliveira
2 and
Paulo Sérgio Scalize
1
1
School of Civil and Environmental Engineering, Federal University of Goiás, Av. Universitária, n°.1488, Setor Universitário, Goiânia 74605-220, Goiás, Brazil
2
Federal Institute for Education Science and Technology of Goias, Rua 75, nº46, Centro, Goiânia 74055-110, Goiás, Brazil
*
Author to whom correspondence should be addressed.
Coatings 2025, 15(1), 27; https://doi.org/10.3390/coatings15010027
Submission received: 15 November 2024 / Revised: 18 December 2024 / Accepted: 19 December 2024 / Published: 1 January 2025

Abstract

:
Spent ion exchange resins were subjected to hydrothermal carbonization (HTC) and physical activation to produce adsorbents, which were tested for the adsorption of bisphenol A (BPA) and sodium diclofenac (DCF) in water. PAHF0.35.WV and PAHF0.50.WV were the materials that presented the largest specific surface area, around 200 m2/g. The best performance was in the adsorption of BPA, with an adsorption capacity of 24.45 and 23.34 mg/g. The kinetic and adsorption isotherm models that presented the best adjustments of the curves to the experimental data were the pseudo-second-order model and the Freundlich model. The maximum adsorption capacity of DCF was 17.82 mg/g for PAHF0.35.WV and 15 mg/g for PAHF0.50.WV. The best fit of the adsorption kinetic curves to the experimental data was for the pseudo-second-order model. In the adsorption isotherms, the Langmuir and Freundlich models presented the best fit. The toxicity study with the microalgae Raphidocelis subcapitata did not demonstrate any toxic effects of the adsorbents. Material regeneration tests indicated a recovery of the adsorption capacity of around 50% in the first cycle, and from the second cycle onwards, the recovery was not satisfactory. However, the results indicate that the anionic resin residue has potential for use in the production of activated hydrocarbons.

1. Introduction

The presence of contaminants of emerging concern (CECs) in natural waters has been a frequently discussed topic in several studies [1,2]. CECs include pharmaceuticals (e.g., analgesics, anti-inflammatories and contraceptives), personal care products (e.g., surfactants, repellents and suntan lotions) and endocrine disruptors (e.g., pesticides, industrial chemicals such as bisphenol A) and hormones such as estradiol and ethinyl estradiol [3,4].
One of the problems with these compounds in water is their removal. Most water treatment systems do not have the capacity to remove CECs, since they are old systems, designed for a reality before the discovery of CECs [5]. The most widely used method for removing CECs in the literature is adsorption by activated carbon. Activated carbon is frequently used in the literature for the purpose of CEC adsorption [6] and for not generating toxic byproducts during the process [7].
Generally, commercial activated carbon is produced from coconut husk fibers (cocos Nucifera) or cork residues, for example, However, some studies have explored other wastes, such as rice husk [8], orange peel [9], argan nut [10], coffee waste [11,12] and persimmon seed [13], among others.
Another adsorbent that has similar functionalities to activated carbon is hydrochar, one of HTC’s products. Compared to activation processes, HTC requires milder temperature conditions and consequently lower energy expenditure [14].
As with the production of activated carbon, HTC also allows for the use of waste as a precursor material, such as coffee waste [15], sawdust [16], food waste [17] and fruit residues [18,19], for example.
In the search for new residues for use as precursors in the production of adsorbents, spent ion exchange resins are good candidates. These residues can be a potential precursor in the production of adsorbents since their ash content is low [20]. In addition, these products are widely used in industries in water purification processes, as catalysts and in the power generation sector of energy, for example [21].
As they are industrial waste, spent resins must be sent to incineration processes or discarded in industrial landfills. In this way, the possibility of the reuse of the material, in addition to adding value, can prolong its application in the market and contribute to the minimization of waste generation.
Given the above, our study aimed to produce adsorbents from spent anionic resin, applied to the adsorption of BPA and DCF in aqueous solution. HTC and physical activation processes were used to produce the materials. To evaluate safety in the use of these adsorbents, they were evaluated when metals were released into water; due to the origin of the precursor material, toxicity was also tested using the microalgae Raphidocelis subcapitata. Furthermore, regeneration by the ozonation of the adsorbents and their reuse in adsorption were studied.

2. Materials and Methods

2.1. Materials

BPA (98% purity) from Sigma Aldrich®, Rio de Janeiro, Brazil, and DCF supplied by Melcon Pharmaceutical Industry, Goiânia, Brazil, both of analytical grade, were used in the preparation of aqueous solutions for adsorption tests. The resin used as a precursor came from a water deionization system of the cosmetics industry, which was discarded after its useful life.

2.2. Production of Adsorbent Materials

2.2.1. Hydrothermal Carbonization

For the HTC process, the spent anion resin was stored in a stainless steel autoclave with internal pressure control, which was subjected to a temperature of 240 ± 5 °C for a reaction time of 4 h. However, hydrocarbonization was not promising, and new reactions were tested with the addition of a catalyst. For this, FeCl3 in solution at concentrations of 0.25 mol/L, 0.35 mol/L and 0.50 mol/L was used [22].
For HTC reactions, 70% of the total volume of the reactor was used, of which 30% was occupied by resin (42 g—dry basis) and 70% (98 mL) by deionized water of FeCl3 solution.
In the second step, the polymeric hydrochars obtained in HTC underwent a washing process with deionized water and were subsequently dried in an oven at 105 °C for 24 h and sieved through ASTM sieves with openings of 0.84 mm, 0.60 mm, 0.42 mm and 0.25 mm.

2.2.2. Physical Activation

In the physical activation process, the traditional carbonization step was replaced by HTC. The hydrochars were activated under two conditions, in the presence and absence of water vapor.
To activate the materials, a horizontal tubular furnace from Sanchis®, Porto Alegre, Brazil, was used, which has an internal ceramic reactor maintained at a rotation of 7 rpm. For both activation conditions, a temperature of 500 °C was used for a time of 2 h and a heating rate of 10 °C/min. In water vapor activation, N2 was used as carrier gas. To produce water vapor, a water saturator was used, maintained at a temperature of 80 ± 5. N2 was used at a flow rate of 150 mL/min as the carrier gas.
For activation without water vapor, the process occurred under the same conditions mentioned above, however, without the use of a water saturator. Only N2 was injected into the reactor at a flow rate of 150 mL/min. Our hypothesis is that the hydrochar concentrates water molecules inside it, which pass into the vapor state with the increase in temperature during the activation process.

2.2.3. Yield of Adsorbent Materials

After each production process, the yield of each adsorbent was determined. For this purpose, Equation (1) was applied.
R   % = M a / M P × 100
where Ma is the mass of the adsorbent, and Mp is the mass of the precursor used in each process.

2.3. The Characterization of the Spent Anionic Resin and the Adsorbents Produced

2.3.1. Texture Analysis by Adsorption and Desorption of N2 at 77 K

The specific surface area (SBET) and pore structure of the adsorbents were determined by the BET (Brunauer–Emmett–Teller) method [23] and BJH (Barrett–Joyner–Halenda) method [24], respectively.
For this, the ASAP2020 Plus (Micromeritics, Norcross, GA, USA) was used in the relative pressure range (P/P0) from 0 to 0.995.

2.3.2. Structural Analysis by Scanning Electron Microscopy (SEM)

The surface morphology and textural characteristics of the produced adsorbents were analyzed using a field emission scanning electron microscope (FEG-SEM; Jeol JSM7100-F) Zaventem, Belgium, and a 5 kV acceleration secondary electron detector.

2.3.3. Functional Group Analysis by Fourier Transform Infrared Spectroscopy (FT-IR)

The surface functional groups of the adsorbents were determined using an infrared spectrometer (Bruker, Ver-tex-70), Billerica, MA, USA with an attenuated total reflectance (ART) accessory and a scan from 400 to 4000 cm−1.

2.3.4. The Identification and Quantification of Metals in the Adsorbents Produced

Considering the origin of the resin used as a precursor, the materials produced were subjected to metal identification and quantification analysis. Initially, the microwave-assisted digestion of the adsorbents in nitric acid and hydrochloric acid was performed, following the EPA 3051a method [25].
The adsorbents were evaluated for the release of metals into experimental water.
For this purpose, a concentration of 3 g/L of adsorbent was kept under stirring (200 rpm) in 100 mL of deionized water for 24 h at a temperature of 25 ± 2 °C. The samples were then filtered, and an inductively coupled plasma optical emission spectrometer (ICP-OES) (PerkinElmer® Optima 7300 DV), MA, USA, was used to quantify the metals.

2.3.5. Quantification of Functional Groups by Boehm Analysis

Boehm analysis [26] was used to quantify the surface functional groups of adsorbents. For this, 0.5 g of adsorbent and 50 mL of each standard solution (HCl, NaOH, NaHCO3 and Na2CO3 all at a concentration of 0.1 mol/L) remained under stirring for 24 h at a temperature of 25 ± 1 °C. The solutions were prepared with previously decarbonized water and standardized.

Basic Groups

For the quantification of the basic groups, after 24 h, the sample containing HCL was filtered, and 10 mL aliquots were titrated using a standard NaOH solution (0.1 mol/L). Phenolphthalein was used as an indicator. The concentration of the basic groups was calculated from Equation (2).
Q B = V b V a m   M × V e   V a l   m
where Vb and Vam are the volume of the standard NaOH solution (0.1 mol/L) consumed in the blank and sample titrations (mL), respectively; Ve is the volume of the standard HCl solution (0.1 mol/L) used in the analysis (L); Val is the volume of the filtrate aliquot (mL); M is the concentration of the standard NaOH solution (0.1 mol/L); m is the adsorbent mass and QB is the amount of basic groups per gram of adsorbent (mmol/g).

Acidic Groups

For the acid groups, 10 mL aliquots of samples containing NaOH, Na2CO3 and NaHCO3 (0.1 mol/L) were filtered, and then 10, 15 and 20 mL of 0.1 mol/L HCL standard solution were added, respectively. Then, the samples were titrated with 0.1 mol/L NaOH and phenolphthalein as an indicator. The quantification of the carboxylic acid (QC), lactonic (QL) and phenolic (QF) groups was calculated using Equations (3)–(5):
Q C = V b V a m   M × V e   V a l   m
Q L = V b V a m   M × V e   V a l   m Q C
Q F = V b V a m   M × V e   V a l   m Q L

2.3.6. Point of Zero Charge (PZC)

To determine the PZC of the samples, 50 mg of adsorbent was added to 20 mL of NaCl aqueous solution (0.1 mol/L), for initial pH values of 1, 2, 3, 4, 5, 6, 8, 9, 10 and 11, and kept under stirring for 24 h [27]. Subsequently, the samples were filtered, and the final pH was determined using a Digimed pH meter, São Paulo, Brazil. From a graph of initial pH versus final pH, pHPCZ was determined.

2.4. Adsorption Tests

2.4.1. Adsorption Efficiency

For the adsorption efficiency tests, 20 mg of each adsorbent was kept under stirring for 24 h in 20 mL of BPA or DCF solution, both at a concentration of 50 mg/L. A Lab Companion orbital shaker, model SI-300R, was used, which was maintained at 200 rpm and a temperature of 25 ± 1 °C. The samples were then filtered, and the remaining concentration of each CEC was determined using a UV/Vis spectrophotometer (Bel Engineering; M51) at a wavelength of 278 nm. The adsorption efficiency was determined by Equation (6).
E   % = 1 C / C 0 × 100
where C0 is the initial concentration of each adsorbate (mg/L), and C is the remaining concentration after 24 h (mg/L).

2.4.2. Influence of Initial pH

Adsorption tests were also performed to evaluate the influence of the pH of the solutions. Values below and above the pHPZC of each adsorbent were used. The pH of the solutions was adjusted using 0.1 mol/L HCl or 0.1 mol/L NaOH. The other experimental conditions were the same as those described in Section 2.4.1, and the adsorption capacity of the materials was determined by Equation (7).
q t = C 0 C t   V m
where qt is the adsorption capacity at time t (mg/g); C0 is the initial adsorbate concentration (mg/L); Ct is the adsorbate concentration at time t (mg/L); V is the volume of the solution (L); m is the mass of the adsorbent (g).

2.4.3. Influence of Adsorbent Concentration

Adsorption tests were also performed by varying the adsorbent concentration from 0.5 to 5 g/L and using a concentration of 50 mg/L of BPA and 50 mg/L of DCF. The mixtures were kept under stirring for 24 h, at a rotation of 200 rpm and room temperature of 25 ± 1 °C. After the 24 h period, the samples were filtered, and the adsorption capacity of the adsorbents was determined by Equation (7).

2.4.4. Adsorption Kinetics

Adsorption kinetic tests were performed using an adsorbent concentration of 0.5 g/L of BPA and DCF solution (5 mg/L), produced at 200 rpm at room temperature (25 ± 1 °C). To obtain the equilibrium point, the remaining concentration of BPA and DCF was verified in times ranging from 5 min to 24 h. The kinetic models used were pseudo-first-order [28] and pseudo-second-order [29].
q t = q e ( 1 e k 1 t )
where k1 is the pseudo-first-order adsorption rate constant (1/min); qe and qt are the amounts adsorbed per unit mass of adsorbent at equilibrium and at time t, respectively (mg/g).
q t = q e ²   k 2 t ( q e   k 2   t + 1 )
where k2 is the pseudo-second-order adsorption rate constant (g/mg.min).

2.4.5. Adsorption Isotherms

For the adsorption isotherms, 0.5 g/L of adsorbent was placed in contact with BPA and DCF at concentrations of 5, 10, 15, 20, 30, 40 and 50 mg/L. The samples were stirred at 200 rpm for 24 h at room temperature (25 ± 1 °C). The isotherm models used for data analysis were Langmuir [30], Freundlich [31,32] and Redlich–Peterson [33], according to Equations (10)–(12), respectively.
q e = q m á x k L C e 1 + k L C e
where Ce is the adsorbate concentration at equilibrium (mg/L); qmax is the maximum adsorption capacity of the adsorbent (mg/g); kL is an interaction constant between the adsorbate and adsorbent (L/mg).
q e = k F C e 1 / n  
where KF (mg/g)/(mg/L) and n are the Freundlich constants related to adsorption capacity and intensity, respectively. The n parameter indicates whether the isotherm is favorable or unfavorable, being favorable when it presents values between 1 and 10.
q e = k R P C e 1 + a R P C e g
where kRP (L/g) and aRP (mg/L)−g are Redlich–Peterson constants; g (dimensionless) is an exponent, which must be between 0 and 1.

2.5. Ecotoxicological Evaluation of Adsorbents Produced Using Microalgae Raphidocelis subcapitata as Indicator Organism

To produce the microalgae exposure medium, adsorbent concentrations of 2.5 g/L and 100 mL of deionized water were used. The samples were kept in orbital agitation at 200 rpm, at a temperature of 25 ± 1 °C for a period of 24 h. The samples were then filtered, and contact water was used for ecotoxicity tests.
The ecotoxicity of the materials produced was evaluated using the microalgae R. subcapitata. The organism was cultivated in LC Oligo medium, maintained under a constant orbital agitation of 110 rpm, temperature of 25 ± 1 °C and continuous light of 4500 lumens. To perform the exposures, the culture medium was autoclaved at a temperature of 121 °C for 15 min, maintaining a pH of around 7.0 [34].
The quantification of the initial and final microalgal biomass was performed by spectrophotometry at a wavelength of 684 nm. According to the [34], the growth of algal biomass must be at least 16 times the initial concentration to indicate the absence of toxicity.

2.6. Regeneration and Reuse

For the regeneration and reuse tests, only the adsorbent with the best performance in adsorbing each contaminant was used, after reaching the equilibrium stage.
The saturated adsorbent was then dried naturally and subjected to the regeneration process. For this purpose, a filtration column was used, which was fed with O3 (3 mL/min), in descending flow, by means of a DCGO-1 ozone generator (Ecozon®) São Paulo, Brazil. For the optimum regeneration time, the process was tested for times of 2, 5, 10 and 15 min. Subsequently, the adsorbent was saturated again and regenerated for three more cycles.

3. Results and Discussions

3.1. Productions of Polymeric Adsorbent Materials

3.1.1. Polymeric Hydrochars

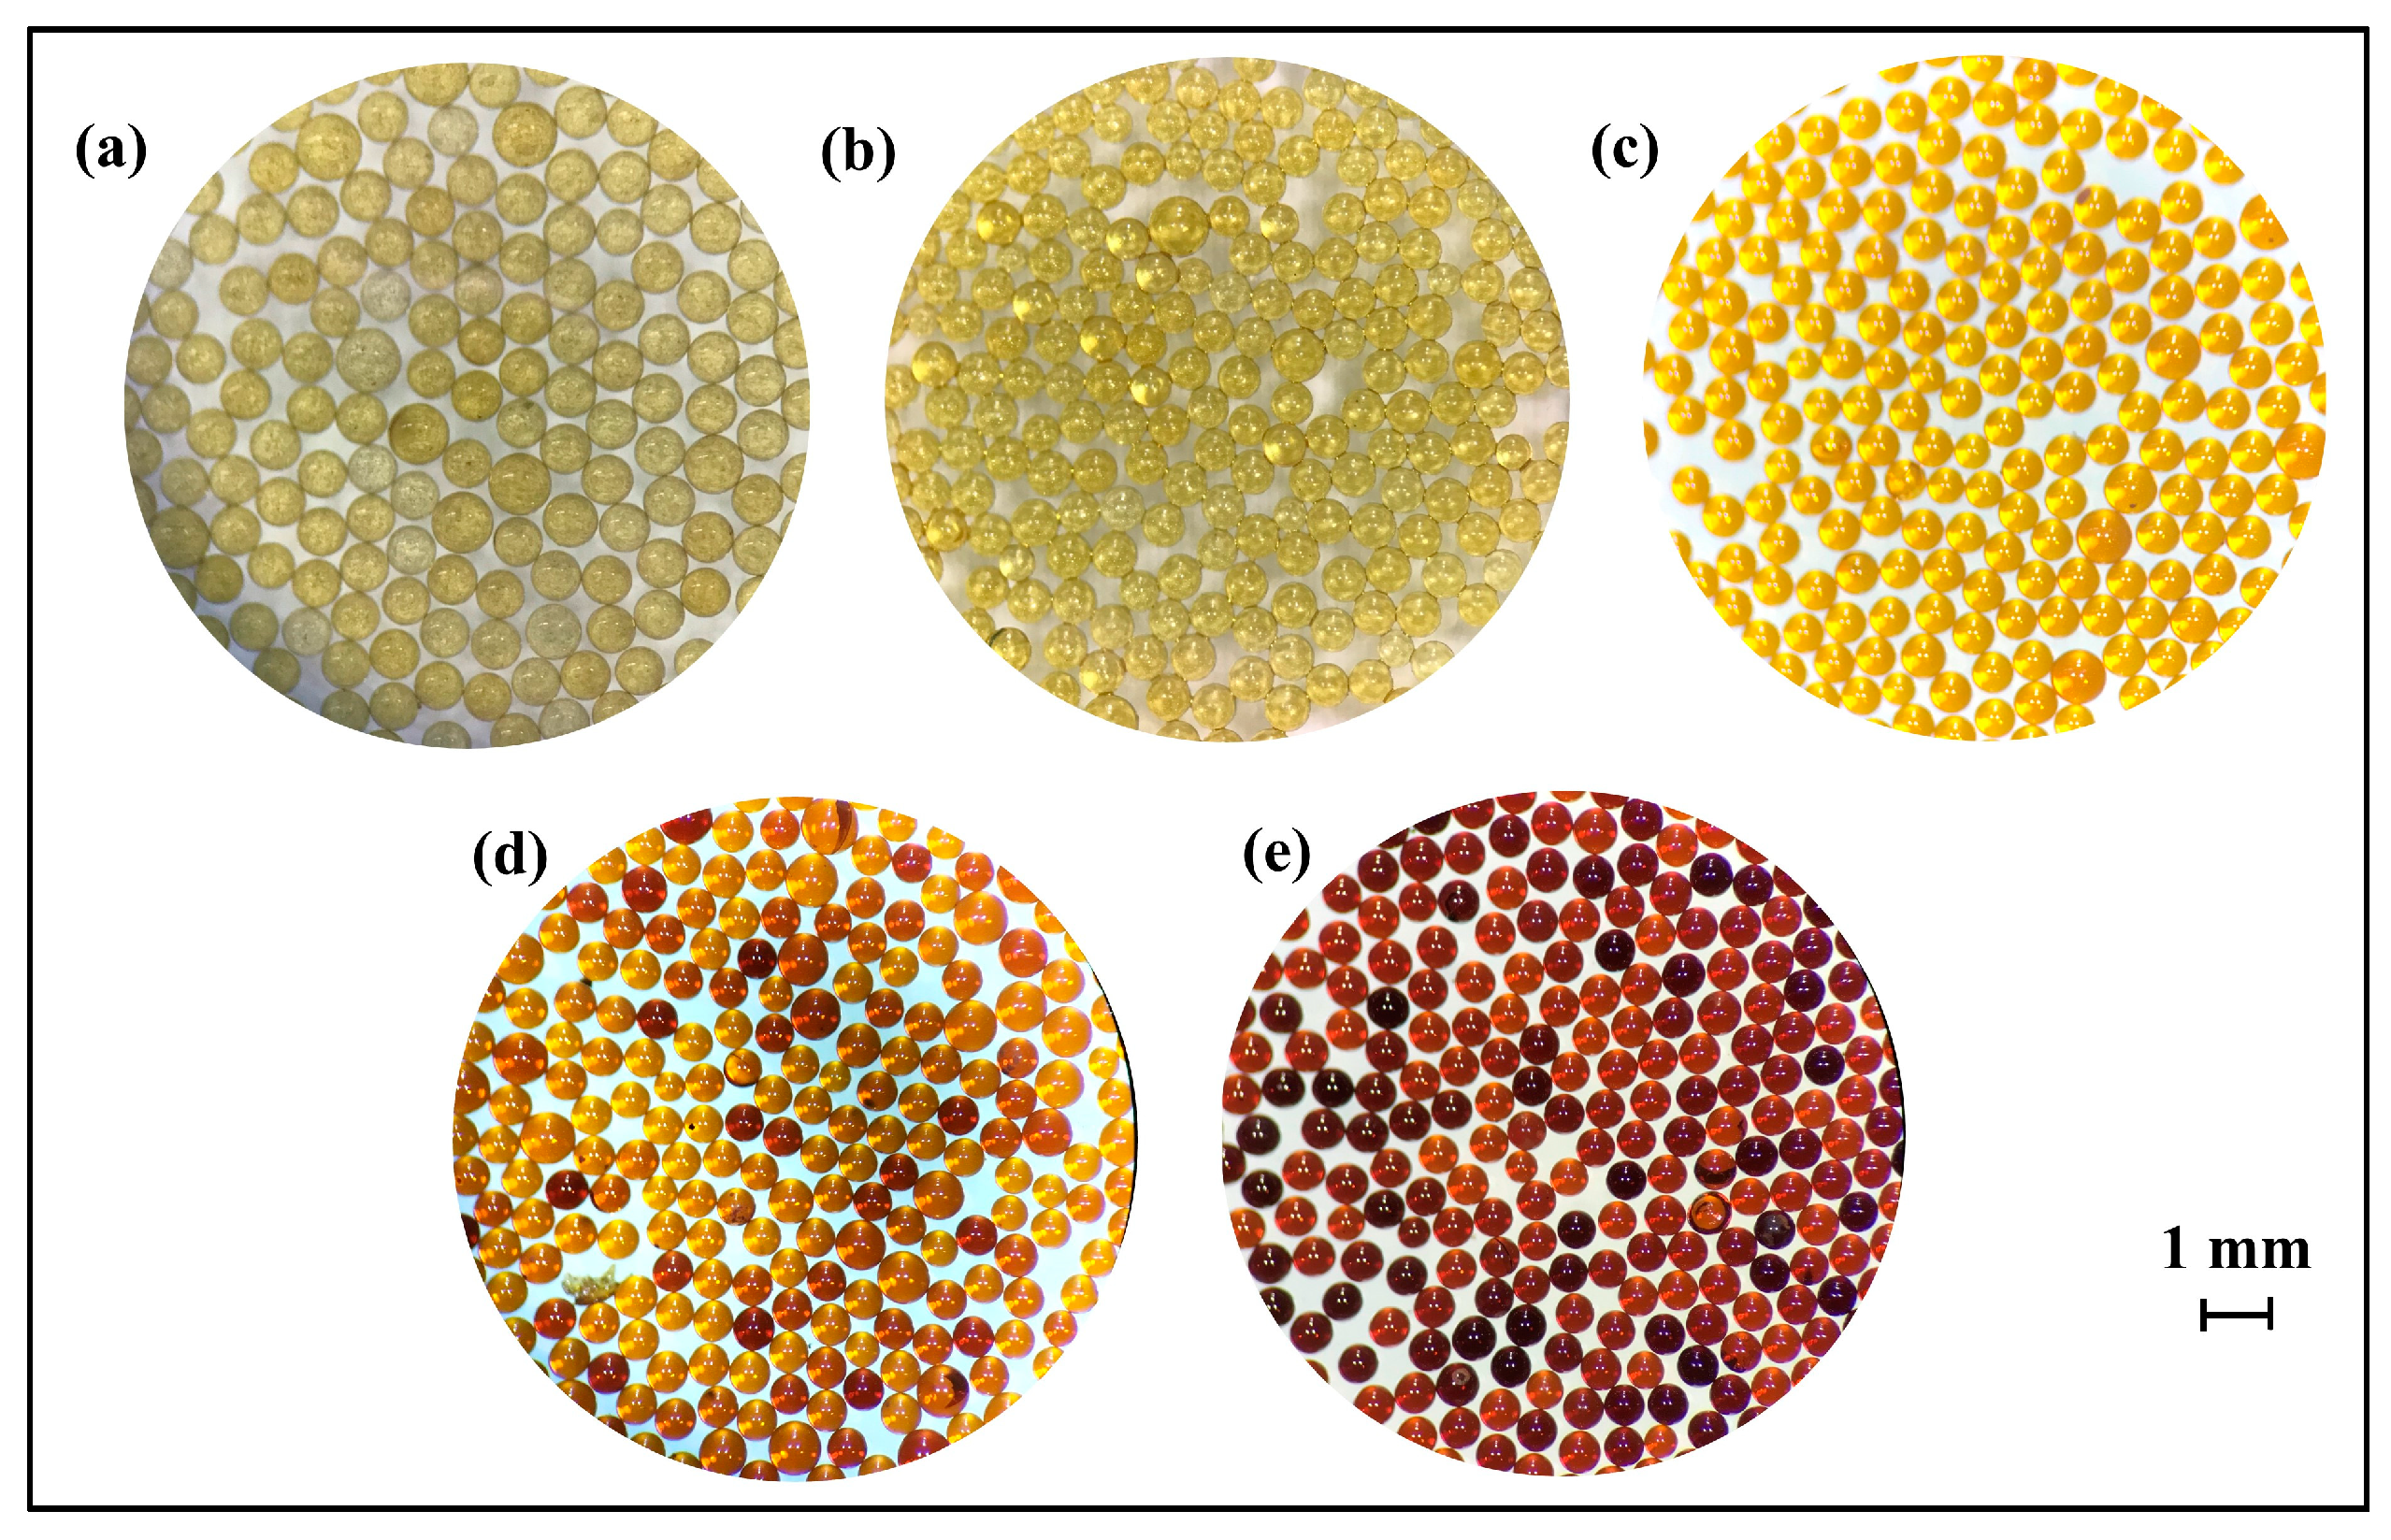
Figure 1 shows a comparison of images of the exhausted anionic resin and the polymeric hydrochars produced without a catalyst (PH) and with an FeCl3 catalyst at concentrations of 0.25 mg/L (PHF0.25), 0.35 mg/L (PHF0.35) and 0.50 mg/L (PHF0.50). PH (Figure 1b) presented a coloration like that of the exhausted anionic resin (Figure 1a). This may be related to the basic character of the resin, since the initial pH of the liquid phase was close to 6.0, and after HTC, the pH remained close to 6.0. Acidic conditions favor the HTC process, as they aid in the decomposition of organic compounds [35,36].
Thus, HTC reactions were tested in the presence of FeCl3, which is commonly used as a reaction catalyst [22]. It is observed that PHF0.35 and PHF0.50 were the polymeric hydrochars that presented more intense coloration when compared to PH. The color of PHF0.25 underwent little change when compared to the PHF0.35 and PHF0.50 samples.
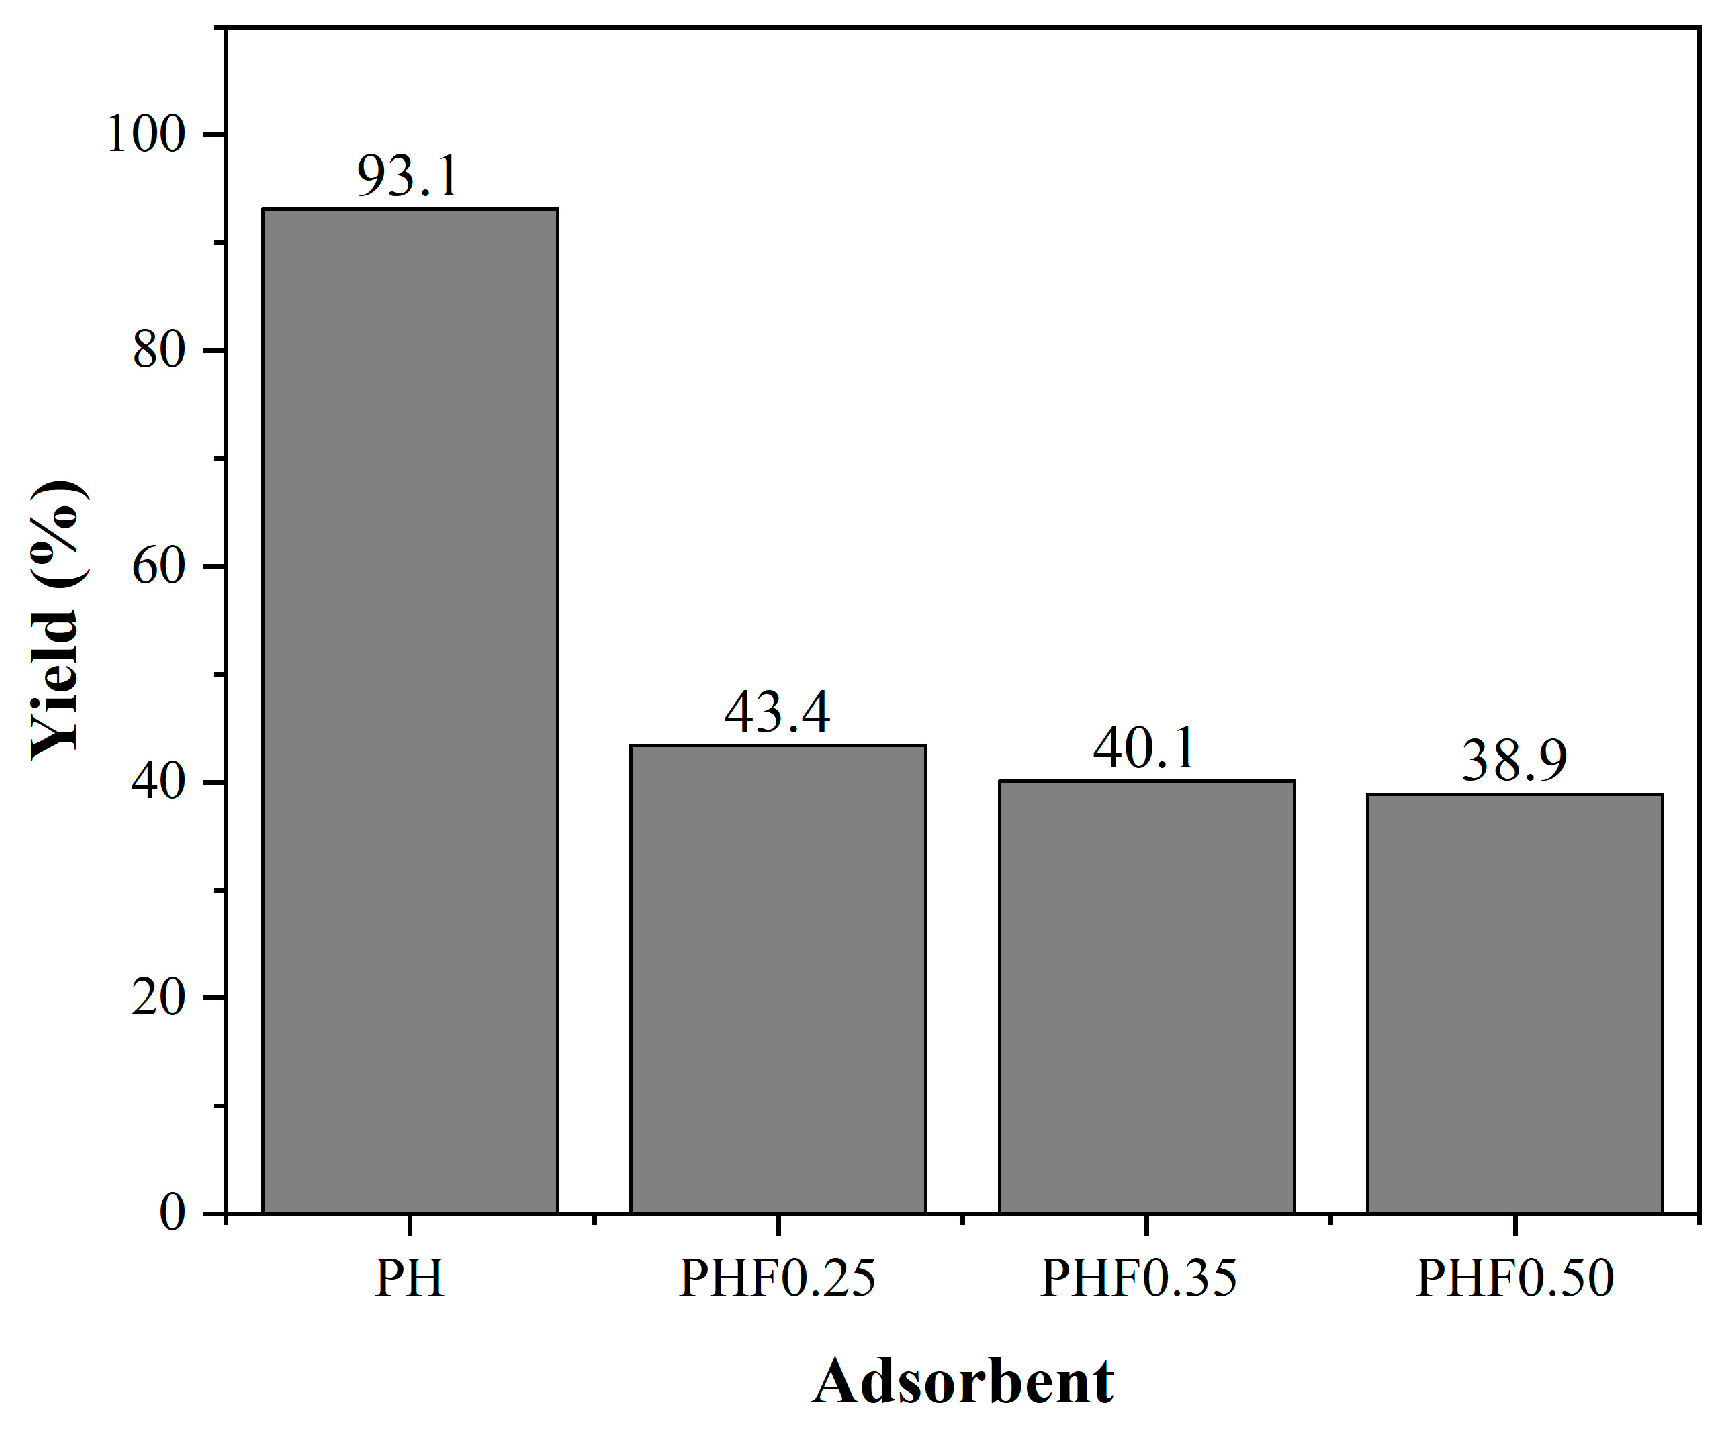
As shown in Figure 2, the yield of the polymeric hydrochar produced without a catalyst was around 50% higher than that produced with FeCl3. Yields were 43.4% for PHF0.25, 40.1% for PHF0.35 and 38.9% for PHF0.50. These values show the influence of the catalyst on the HTC reactions, resulting in a higher degree of hydrocharization of the samples.
Comparing the PHF0.25, PHF0.35 and PHF0.50 samples, the production yields were all close to 40%. However, PHF0.25 showed little variation in color compared to the other polymeric hydrochars. In addition, a higher yield was expected for this sample. Due to the lower catalyst dosage, the HTC process may have solubilized the polymer compounds but with incomplete hydrocharization. In this case, hydrolysis reactions prevail, and the yield of the solid phase of the material is reduced [37].
Considering the better hydrochar performance, only the PHF0.35 and PHF0.50 hydrochars were submitted to activation processes to produce polymeric activated hydrochars.

3.1.2. Polymeric Activated Hydrochars

The temperature used in the physical activation processes of polymeric hydrochars was 500 °C, based on the study by [38]. This study carried out a thermogravimetric analysis of cationic and anionic ion exchange resins, which showed that the greatest mass loss of the resin occurred around 400 °C to 600 °C. This indicates that at this temperature, the resulting mass basically corresponds to the carbonaceous structure, which is a favorable condition for the activation process.
The production yield of activated polymeric adsorbents, in the absence and presence of water vapor, is presented in Figure 3.
It is observed that the production yield was higher for the samples activated without the supply of water vapor when compared to the samples activated with water vapor. In physical activation, water vapor or CO2 is generally used as an activating agent. These agents have the function of penetrating the particles of the carbonized material, oxidizing the compounds that obstruct the pores developed during carbonization [39]. Therefore, a higher yield is an indication that pore unclogging was incomplete, which can harm the adsorption process.
In activation without the supply of water vapor, it was considered that more water molecules occluded in the hydrocarbonized material passed into the vapor state. However, the higher yield of samples activated with occluded water may be an indication of the permanence of decomposition products that block pores [40].

3.2. Characterization of Adsorbents Produced

3.2.1. Porosity Analysis by Adsorption and Desorption of N2 at 77 K

The values of the specific surface area, volume and average pore diameter of each adsorbent produced are presented in Table 1.
Comparing the polymeric activated hydrochars, it is possible to observe the influence of water vapor on the activation processes. The samples activated with water vapor presented a lower specific surface area and a higher pore volume. The results suggest that the water occluded in the polymeric hydrochars does not act as an activating agent; therefore, it does not replace the supply of water vapor during the activation process.
As for pore diameter, both PAHF0.35.WV and PAHF0.50.WV are mesoporous materials, with a pore diameter ranging from 2 to 50 nm.

3.2.2. Textural Analysis by Scanning Electron Microscopy (SEM)

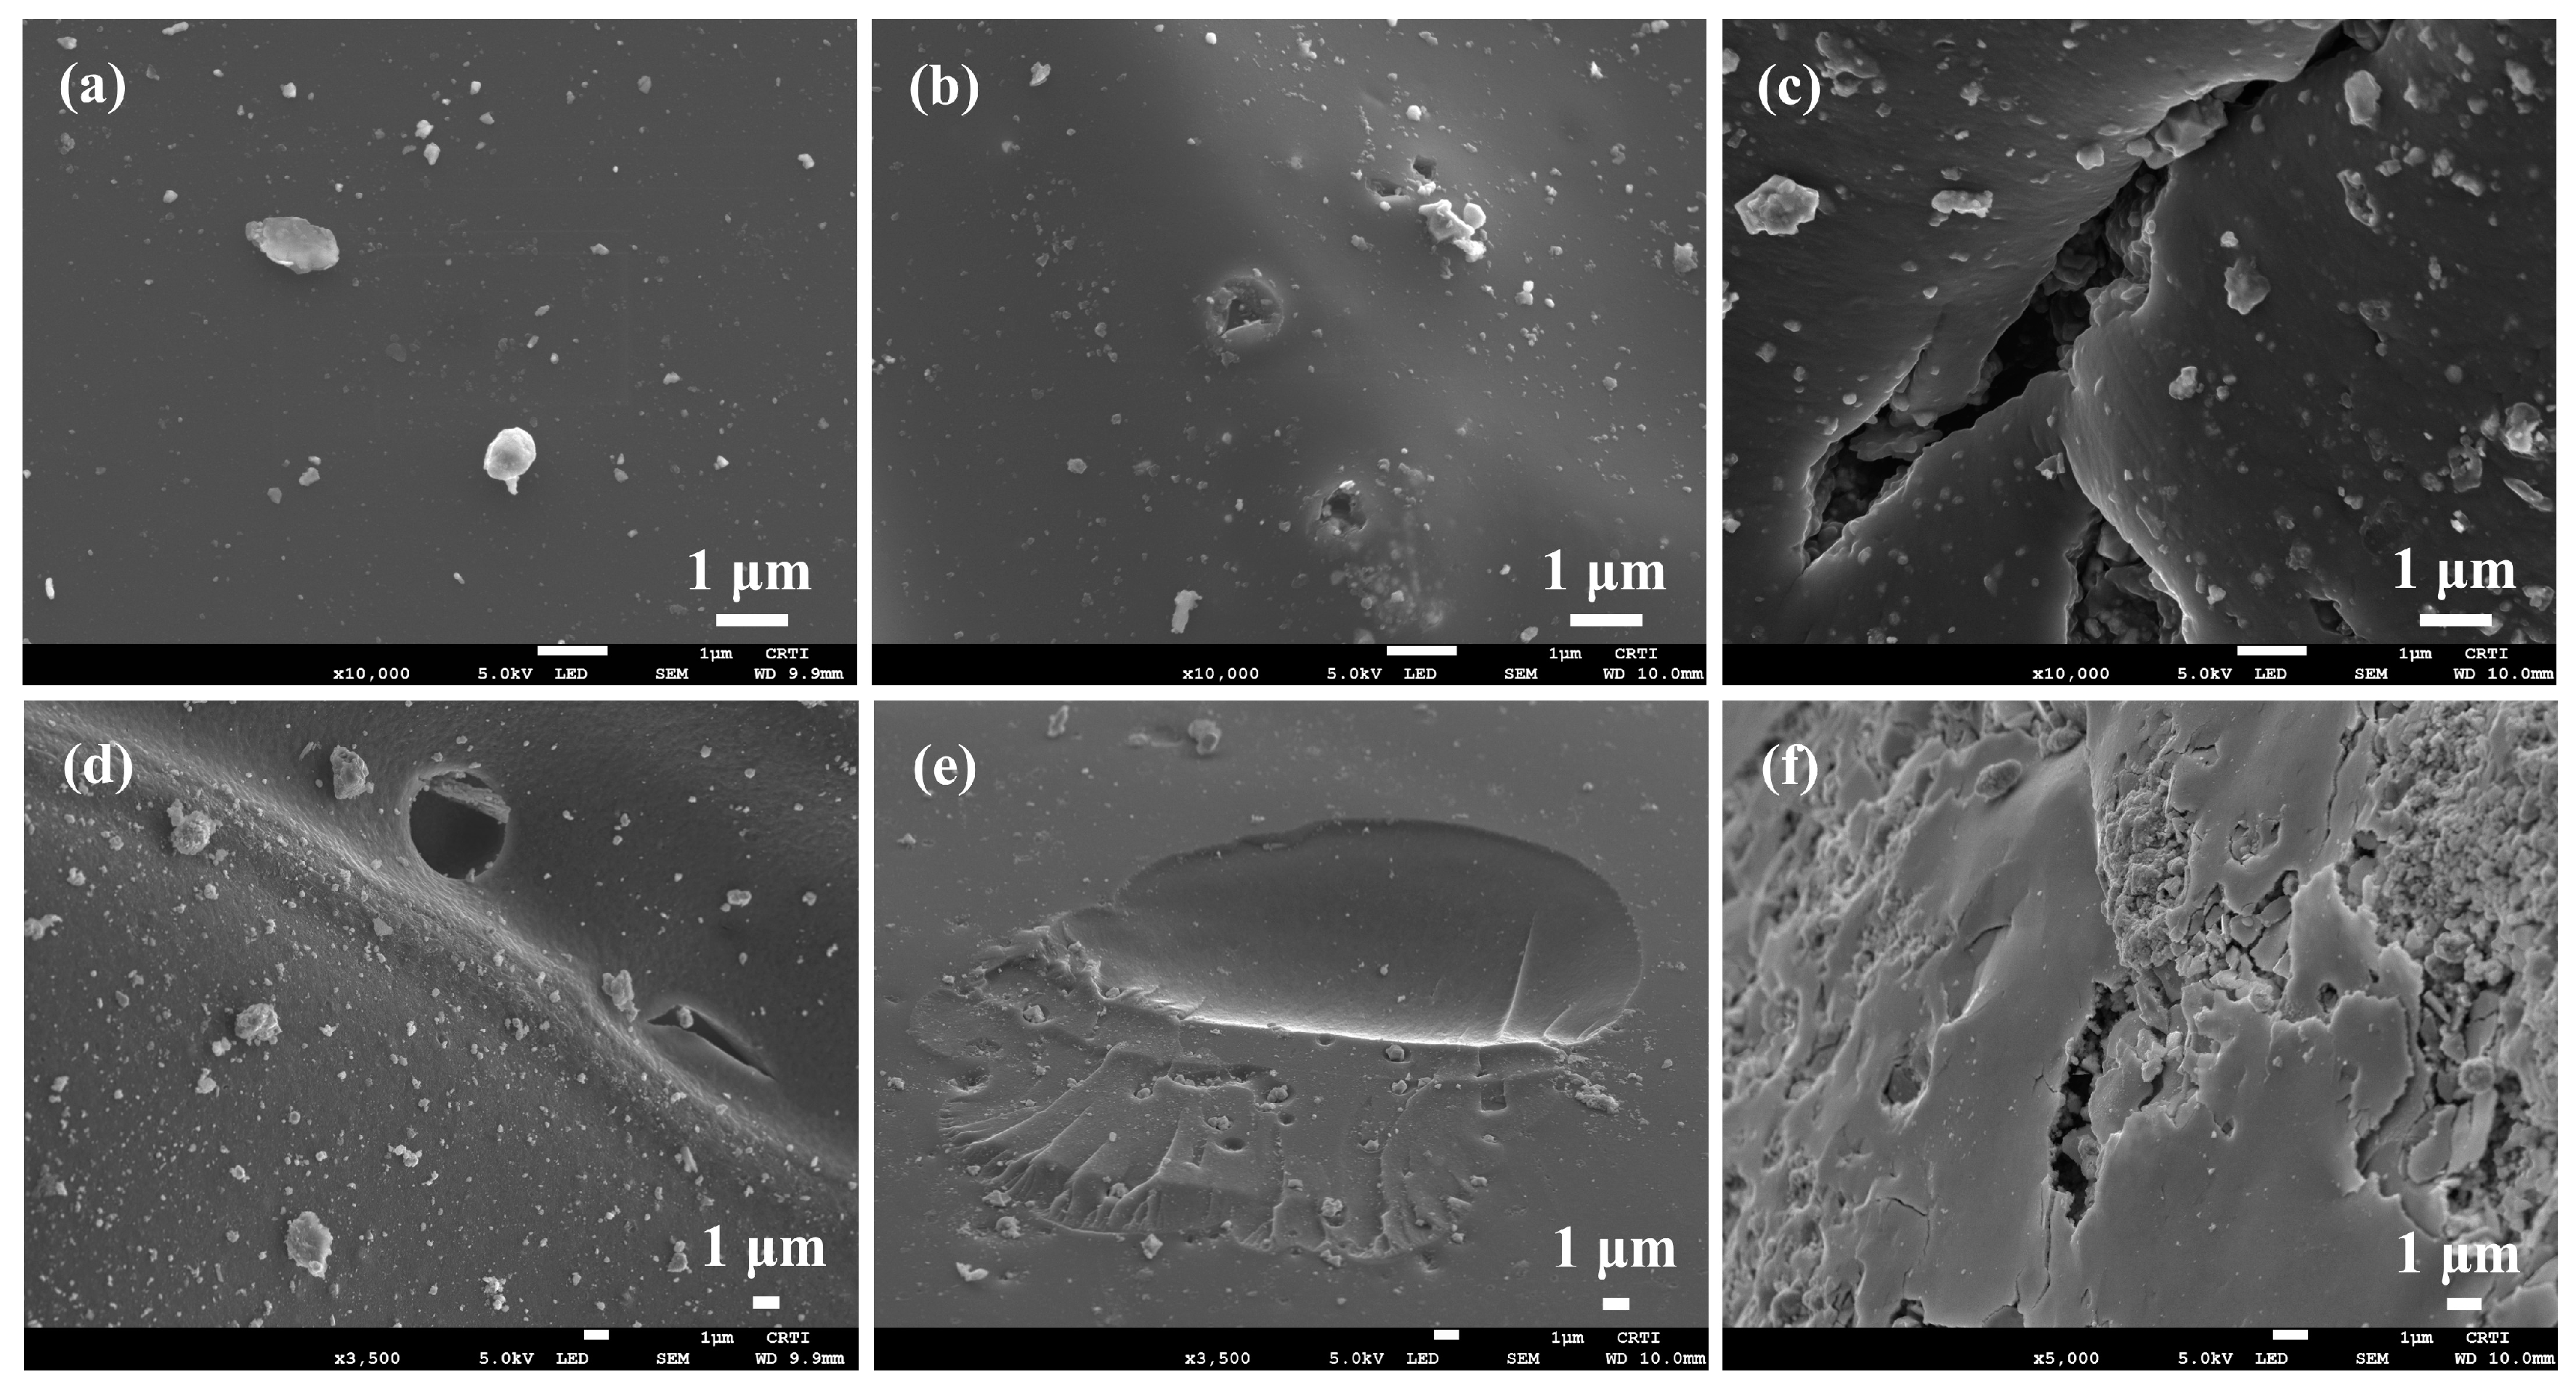
The micrograph of polymeric hydrochar PHF0.35 (Figure 4a) shows a smooth surface without the presence of pores. In contrast, the micrographs of the polymeric activated hydrochars PAHF0.35.OW (Figure 4b) and PAHF0.35.WV (Figure 4c) indicate the changes in the structure of the materials. For PAHF0.35.WV, the formation of the porous structure is more developed.
The polymeric hydrochar PHF0.50 (Figure 4d) presented a smooth surface, however, with depressions and the accumulation of some granules. A similar aspect was observed for polymeric activated hydrochar PAHF0.50.OW (Figure 4e). Greater modifications occurred on the surface of PAHF0.50.WV, which presented a surface with roughness and the presence of pores. Although micrograph (f) is presented at a higher magnification when compared to micrographs (d) and (e), the observations made are clear.
These results confirm the specific surface area data obtained. Considerable specific area formation was observed only in samples activated with water vapor. This is further evidence that the use of water vapor as an activating agent was essential in the development of the textural characteristics of the adsorbents. In this case, water vapor promotes the elimination of disorganized carbon, and consequently, the development of specific surface area and pore structure occurs [40].

3.2.3. Functional Group Analysis Using Fourier Transform Infrared Spectroscopy (FT-IR)

The FTIR spectra of the adsorbent materials are presented in Figure 5 and Figure 6, and Table 2 contains the identification of the surface functional groups of each sample.
It is possible to observe, in Figure 5, the occurrence of chemical modifications during the physical activation processes. Most of the bands observed in polymeric hydrochars were eliminated after physical activation. Some of the bands that remained in the activated samples showed a reduction in their intensities. In all spectra, there is a band at 3443 cm−1, which is present in the spectra of polymeric activated hydrochars, however, to a lower intensity.
The band at 1601 cm−1 occurs in sample PHF0.35 and remains in activated samples PAHF0.35.OW and PAHF0.35.WV. However, after activation processes, the band intensity increases. This occurs because aromatic rings prevail, forming graphenic groups, which are characteristic of activated samples. The same behavior was observed in the band at 1595 cm−1, present in the samples PHF0.50, PAHF0.50.OW and PAHF0.50.WV. As shown in Table 2, both bands are also characteristic of the N-H bonding of the amine group, which was expected since the adsorbent precursor material is an anionic resin with an amine group.
Another modification observed after the activation processes was the formation of new bands, such as that at 1180 cm−1 observed in the spectra of samples PAHF0.35.OW and PAHF0.35.WV and absent in sample PHF0.35. The band at 1209 cm−1 is present only in the PAHF0.50.WV spectrum, and the bands at 874 cm−1, 804 cm−1 and 750 cm−1 are observed in the PAHF0.50.OW and PAHF0.50.WV samples and absent in the PHF0.50 sample. In this case, the activation processes eliminate part of the functional groups, with the possibility of variation in the groups that remain in the region close to the respective band.

3.2.4. The Identification and Quantification of Metals Present in the Composition of Adsorbents

Table 3 presents the quantification of the metals identified in the anionic resin and in the polymeric adsorbents produced. As will be presented in Section 3.3.1, polymeric activated hydrochars PAHF0.35.OW and PAHF0.50.OW did not perform well in the adsorption of BPA and DCF. For this reason, the samples were not analyzed for the presence of metals.
After the HTC processes, the metals identified in the anionic resin are completely or partially eliminated. These results suggest that during HTC, metals are transferred to the liquid phase. This occurs due to the influence of the acidic conditions of the reaction medium, which favor the degradation of the polymeric precursor [42].
Iron is the only metal quantified in polymeric adsorbents. The metal concentrations in the PHF0.35 and PHF0.50 samples are higher than the quantified concentration in the anionic resin. This may be related to the addition of the FeCl3 catalyst during HTC reactions.
After the physical activation process, an iron concentration reduction in the samples was observed. In PHF0.35, the iron concentration was 0.60 mg/g of the polymeric hydrochar. After activation, this concentration was reduced to 0.12 mg/g of polymeric activated hydrochar PAHF0.35.WV. As for the PHF0.50 sample, the iron concentration was higher (1.53 mg/g) compared to the PHF0.35 sample, which is related to the higher concentration of FeCl3 used in the HTC of PHF0.50. After activation, this concentration was reduced to 0.31 mg/g of polymeric activated hydrochar PAHF0.50.WV.
The reduction in iron concentration observed after the activation processes is due to the partial leaching of the metal by water vapor, which occurs around 400 °C [43]. For water analysis, it was not possible to quantify the presence of metals released by polymeric activated hydrochars PAHF0.35.WV and PAHF0.50.WV. For both adsorbents, the analyzed metals showed a value lower than the equipment’s quantification limit.

3.2.5. Boehm Analysis

Table 4 shows that for both polymeric activated hydrochars, the concentrations of basic groups were similar, as were those of acidic groups. The sample PAHF0.50.WV presented twice the concentration of PAHF0.35.WV. The PAHF0.35.WV showed 0.44 mmol/g of basic groups and 0.21 mmol/g of acid groups, corresponding to carboxylic groups. These results can be related to the FT-IR spectra of polymeric activated hydrochar. The bands observed between 874 cm−1 and 698 cm−1 are characteristic of basic amine groups, and the band at 1180 cm−1 is attributed to carboxylic groups.
The concentration of basic groups in the PAHF0.50.WV sample was around 0.42 mmol/g and for the acidic groups 0.40 mmol/g. In the FT-IR spectra of PAHF0.50.WV, the presence of basic amine groups was also observed, which occurred at 1595 cm−1 and between 874 cm−1 and 698 cm−1. The carboxylic and phenolic acid groups were confirmed by the bands at 3443 cm−1 and 1209 cm−1.
The greater amount of acid groups in the PAHF0.50.WV sample, compared to PAHF0.35.WV, may be related to the higher concentration of FeCl3 used in the HTC process. Ref. [44] used FeCl3 as a reaction catalyst to produce an adsorbent from tangerine peel by hydrothermal carbonization. The authors attributed the presence of FeCl3 to the acid character of the adsorbent.

3.3. Adsorption Performance

3.3.1. Adsorption Efficiency of Produced Adsorbents

The polymeric adsorbents were evaluated in the adsorption of BPA and DCF. The performance in the adsorption capacity of the adsorbents for each chemical compound is shown in Figure 6. The tests were performed under natural pH conditions, being 5.2 for the BPA solution and 5.8 for the DCF solution and using an adsorption time of 24 h.
The polymeric activated hydrochars PAHF0.35.WV and PAHF0.50.WV showed similar performance in the adsorption of contaminants. As discussed in Section 3.2.1, compared to the other adsorbents, PAHF0.35.WV and PAH0.50.WV were the materials with the highest specific surface area values. Thus, the results suggest that the surface area factor positively influences the adsorption process.
For the activated hydrochars considering the occluded water, a poor adsorptive performance was observed for both CECs when compared to samples activated with water vapor. In addition to the low specific surface area, both adsorbents showed a surface poor in functional groups when compared to adsorbents. These factors may have impaired the adsorption processes of the samples.
Polymeric hydrochars PHF0.35 and PHF0.50 were the adsorbents with the lowest specific surface area but with a surface rich in functional groups. However, BPA adsorption capacities were low when compared to the PAHF0.35.WV and PAHF0.50.WV samples. In this case, the specific surface area exerted greater influence on the adsorption process when compared to the surface functional groups.
In the adsorption of DCF, both samples showed higher values of adsorption capacity. However, the occurrence of DCF precipitation was observed. The final pH of the medium was equal to 4.5 for the solution containing HPF0.35 and 5.3 for the solution with HPF0.50. The pKa of DCF was equal to 4.2, and for pH values lower than or close to pKa, the drug presents low solubility, promoting its precipitation [45].
Refs. [46,47] also observed the occurrence of the precipitation of DCF in adsorption processes under conditions of pH < pKa of DCF. Thus, the values of 26.03 mg/g and 29.44 mg/g cannot be attributed only to the adsorption capacity of DCF by the adsorbents HPF0.35 and HPF0.50.
Considering the best results of the adsorption performance of contaminants, other tests were carried out using only samples of polymeric activated hydrochars PAHF0.35.WV and PAHF0.50.WV.

3.3.2. Influence of Initial pH and Point of Zero Charge (PCZ)

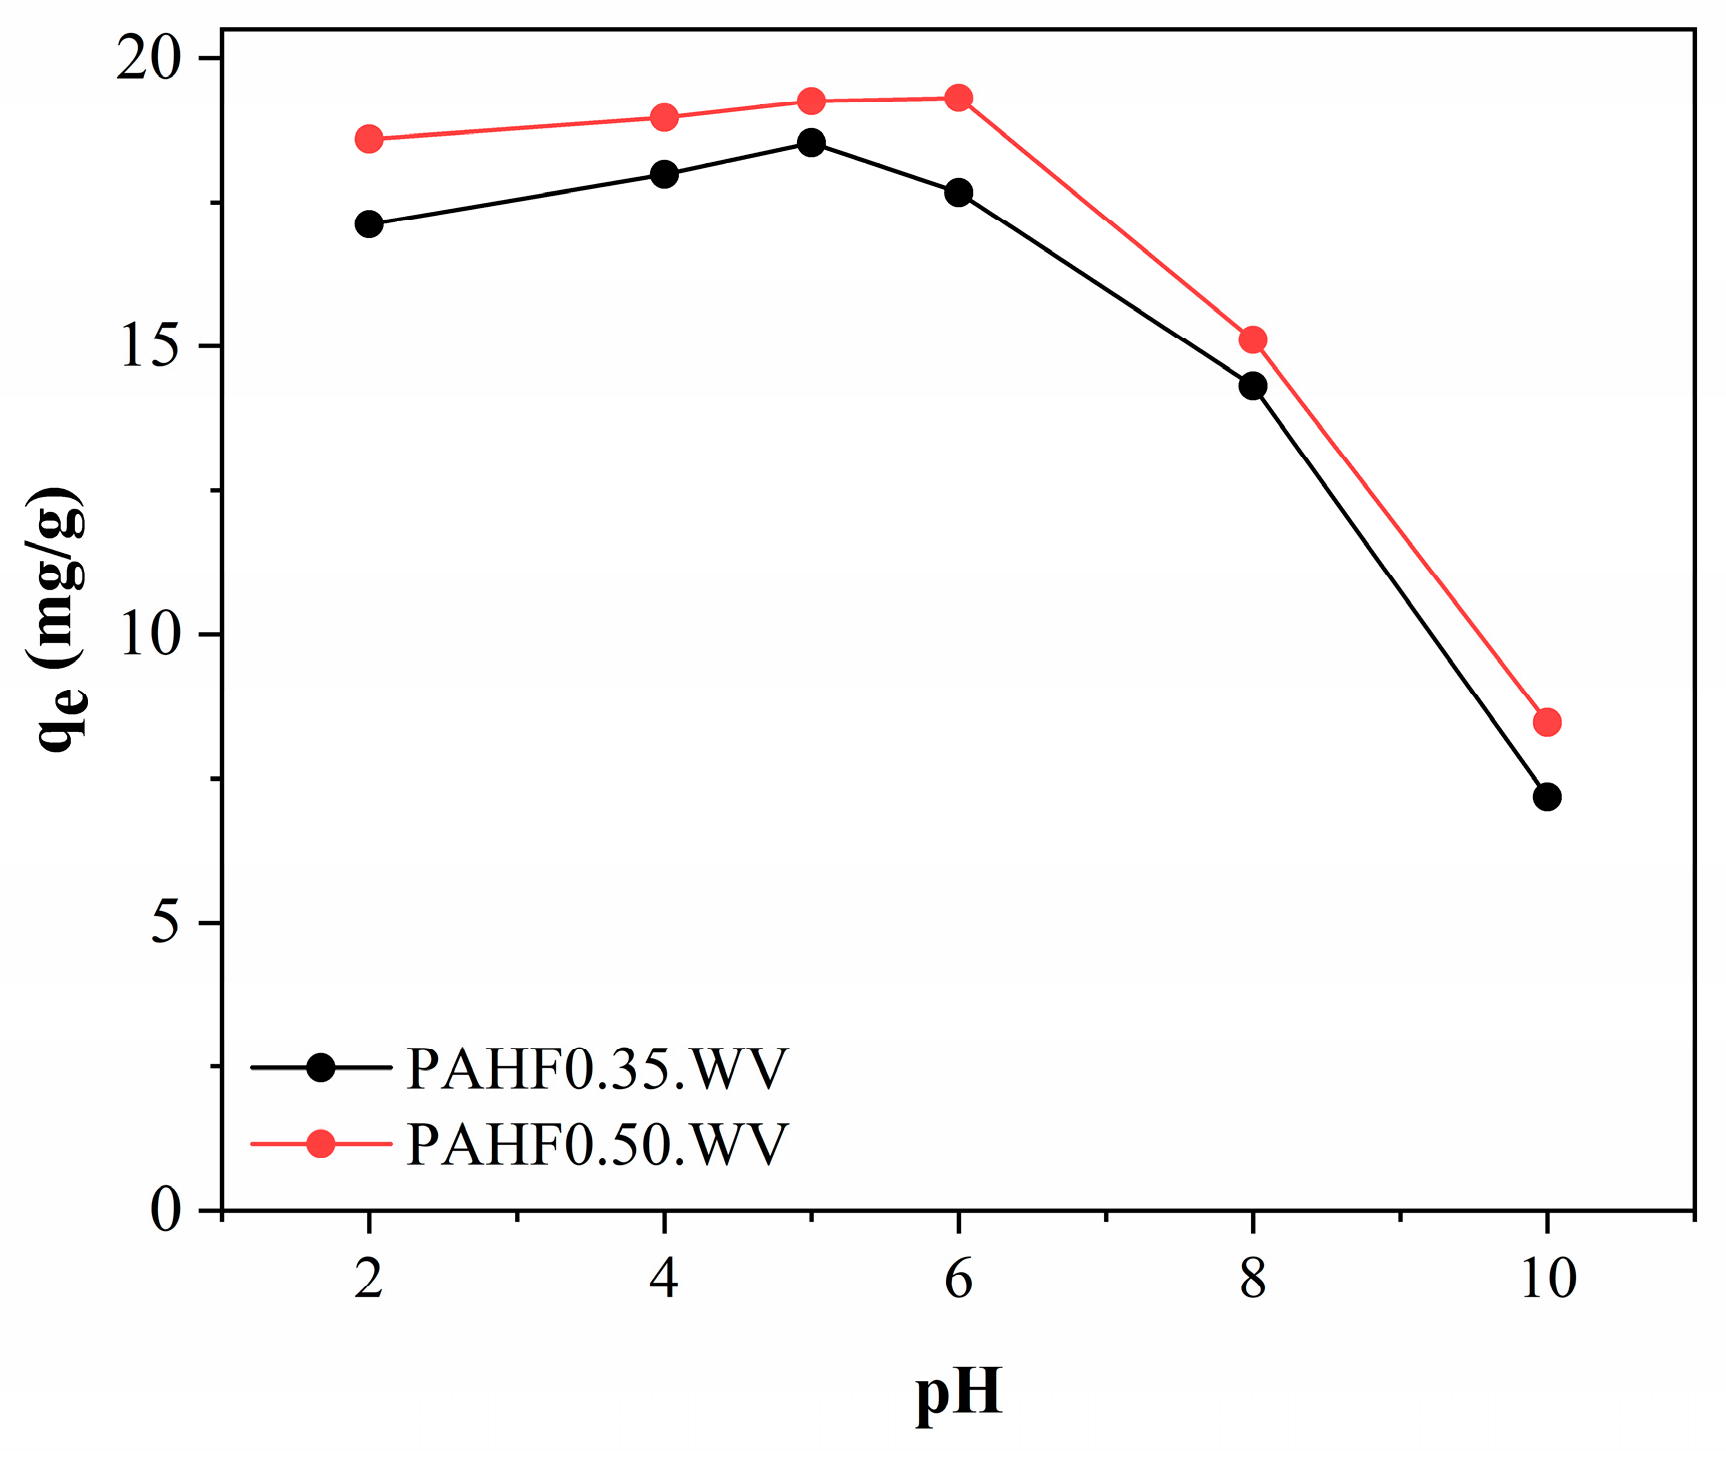
Figure 7 shows the influence of initial pH on the adsorption of BPA from activated polymeric hydrocarbons.
As can be seen, under pH conditions between 2.0 and 6.0, the polymeric activated hydrochars showed little variation in BPA adsorption capacity, which varied between 17 and 19 mg/g. At pH 8.0, a reduction to 14.31 mg/g for the PAHF0.35.WV sample and 15.11 mg/g for the PAHF0.50.WV sample was observed in the adsorption capacities. At pH 10, the adsorbents PAHF0.35.WV and PAHF0.50.WV had a higher reduction in adsorption capacities, reaching 7.19 mg/g and 8.47 mg/g, respectively.
Ref. [48] also observed similar behavior. The authors tested the adsorption of BPA by organoclay under different pH conditions. The adsorption capacity of the material was constant in the pH range from 4.0 to 8.0, and at pH 10, the authors observed a reduction in the adsorption capacity.
The pH of the medium influences both the adsorbent and the adsorbate, due to the charge density, which can be understood from the pHPCZ study [49]. As shown in Figure 8, the polymeric activated hydrochars showed pHPCZ values equal to 6.0 for PAHF0.35.WV and 5.8 for PAHF0.50.WV. For pH values above pHPCZ, the adsorbents have negative surface charges, and when the pH of the medium is lower than pHPCZ, the adsorbent surfaces are charged with positive charges.
Adsorbates can occur under different chemical species depending on the pH of the medium. BPA is inseparable when the pH of the medium is less than 8.0 and its molecules are in the neutral species [50]. In this case, the surface charges of the adsorbents tend not to influence the adsorption process.
For pH values above 8.0, the deprotonation of BPA molecules occurs (pKa = 9.8), which dissociates and forms BPA anions [50]. Consequently, charge repulsion occurs between the adsorbate and the adsorbents, which also have negative surface charges due to the pH of the medium being higher than the values of pHPCZ.
For DCF, the effect of the initial pH on the adsorption process was evaluated only for the values of pH 6.0, 8.0 and 10 due to the precipitation of the drug at a pH close to the pKa of the molecule. The results are shown in Table 5.
It is observed that under the condition of pH 6.0, the adsorbents showed greater adsorption capacities. At this pH, polymeric activated hydrochars tend to have a neutral surface. Already at pH 8.0 and 10, the adsorbents have negative surface charges, which may have resulted in a reduction in the adsorption capacity of DCF. In the evaluated pH range, DCF occurs in the anionic species (pH > pKa) [45], resulting in charge repulsion between the adsorbate and the adsorbents. Ref. [51] observed similar behavior in the study of the adsorption of DCF by activated carbon produced from the fruit of Ficus sycomorus.

3.3.3. Influence of Adsorbent Concentration

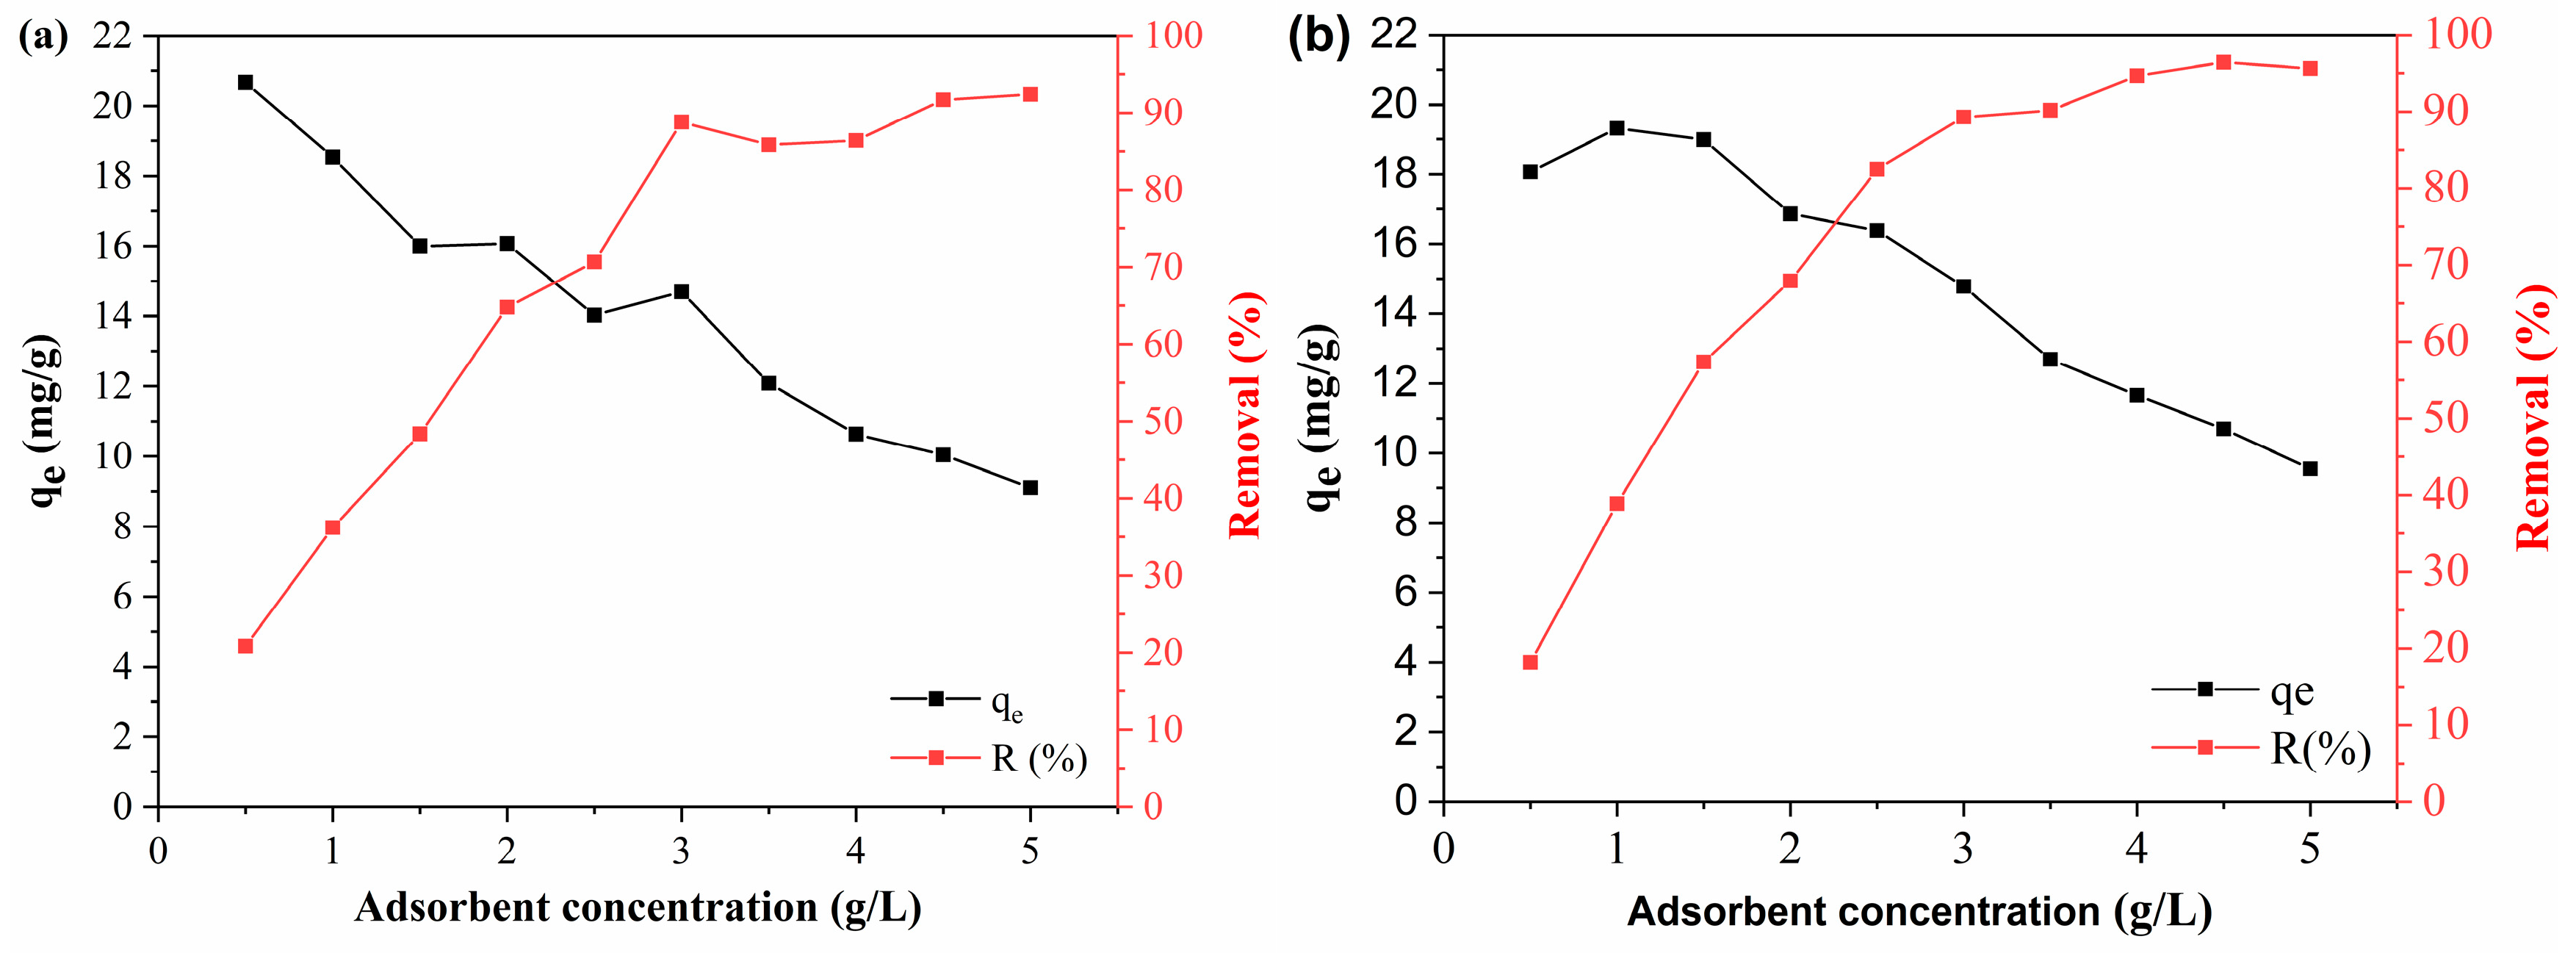
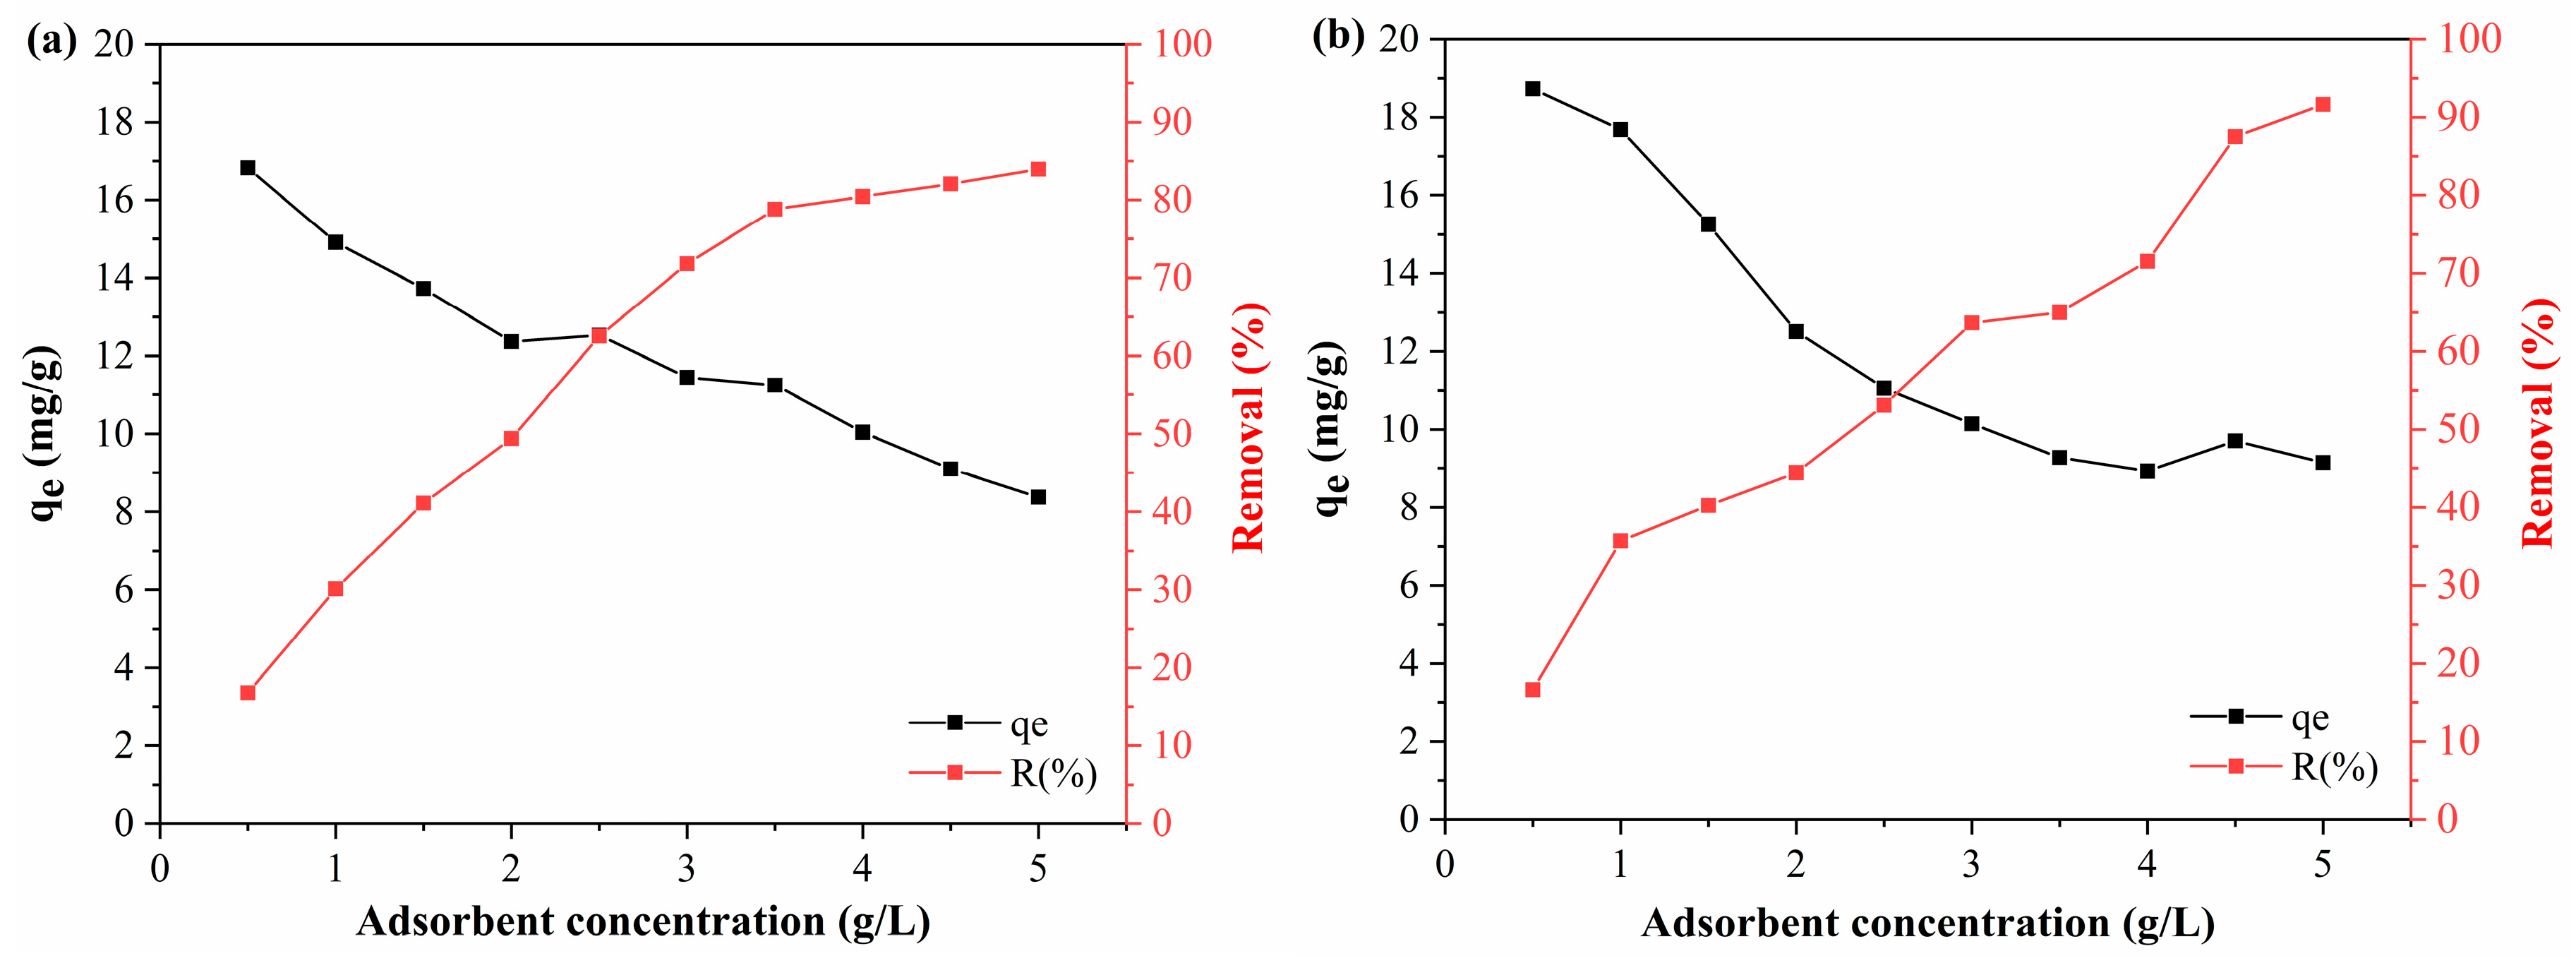
BPA and DCF adsorption tests were performed by varying the adsorbent concentration from 0.5 to 5 g/L depending on the adsorption capacity (qe, mg/g) and removal efficiency (R, %). The BPA and DCF adsorption results are shown in Figure 9 and Figure 10, respectively.
As shown in Figure 9, the efficiency and adsorption capacity showed an inverse behavior with an increasing dosage of adsorbents. The polymeric activated hydrochar PAHF0.35.WV showed a BPA adsorption capacity of 20.67 mg/g at a concentration of 0.5 g/L. As the adsorbent concentration was increased, the adsorption capacity was reduced, which was 9.10 mg/g at a dosage of 5 g/L of adsorbent. The removal efficiency was 20.82% for 0.5 g/L of PAHF0.35.WV and 92.41 g/L for a concentration of 5 g/L of adsorbent.
For the PAHF0.50.WV adsorbent, the adsorption capacity of BPA reduced from 18.07 mg/g to 9.55 mg/g, and the removal efficiency went from 18.19% to 95.59% with an increasing dosage of polymeric activated hydrochar.
The DCF adsorption tests showed similar behavior (Figure 10), and the performance of the activated polymeric hydrocarbons was close to their performance in the adsorption of BPA. With the increase in the PAHF0.35.WV concentration, the DCF adsorption capacity of the material reduced from 18.72 mg/g to 9.15 mg/g, and the removal efficiency increased from 16.63% to 91.62%. As for PAHF0.50.WV, the adsorption capacity with 0.5 g/L of adsorbent was 16.82 mg/g and reduced to 8.38 mg/g at the highest dosage of polymeric activated hydrochar. Its removal efficiency increased from 16.79% to 83.92%.
This is because increasing the adsorbent dosage results in a greater availability of specific surface area. As the adsorbent concentration is increased, BPA and DCF molecules quickly occupy the surface area sites of the polymeric activated hydrochars, favoring the efficiency of contaminant removal. However, with rapid adsorption, the innermost sites become unavailable, and the adsorption capacity is reduced [52]. Similar behavior was reported by [53,54] on the adsorption of BPA and by [55] on the adsorption of DCF. Thus, the optimum adsorbent dosage, both for PAHF0.35.WV and PAHF0.50.WV, was 2.5 g/L for BPA adsorption and 2.5 g/L for DCF adsorption.

3.3.4. Adsorption Kinetics

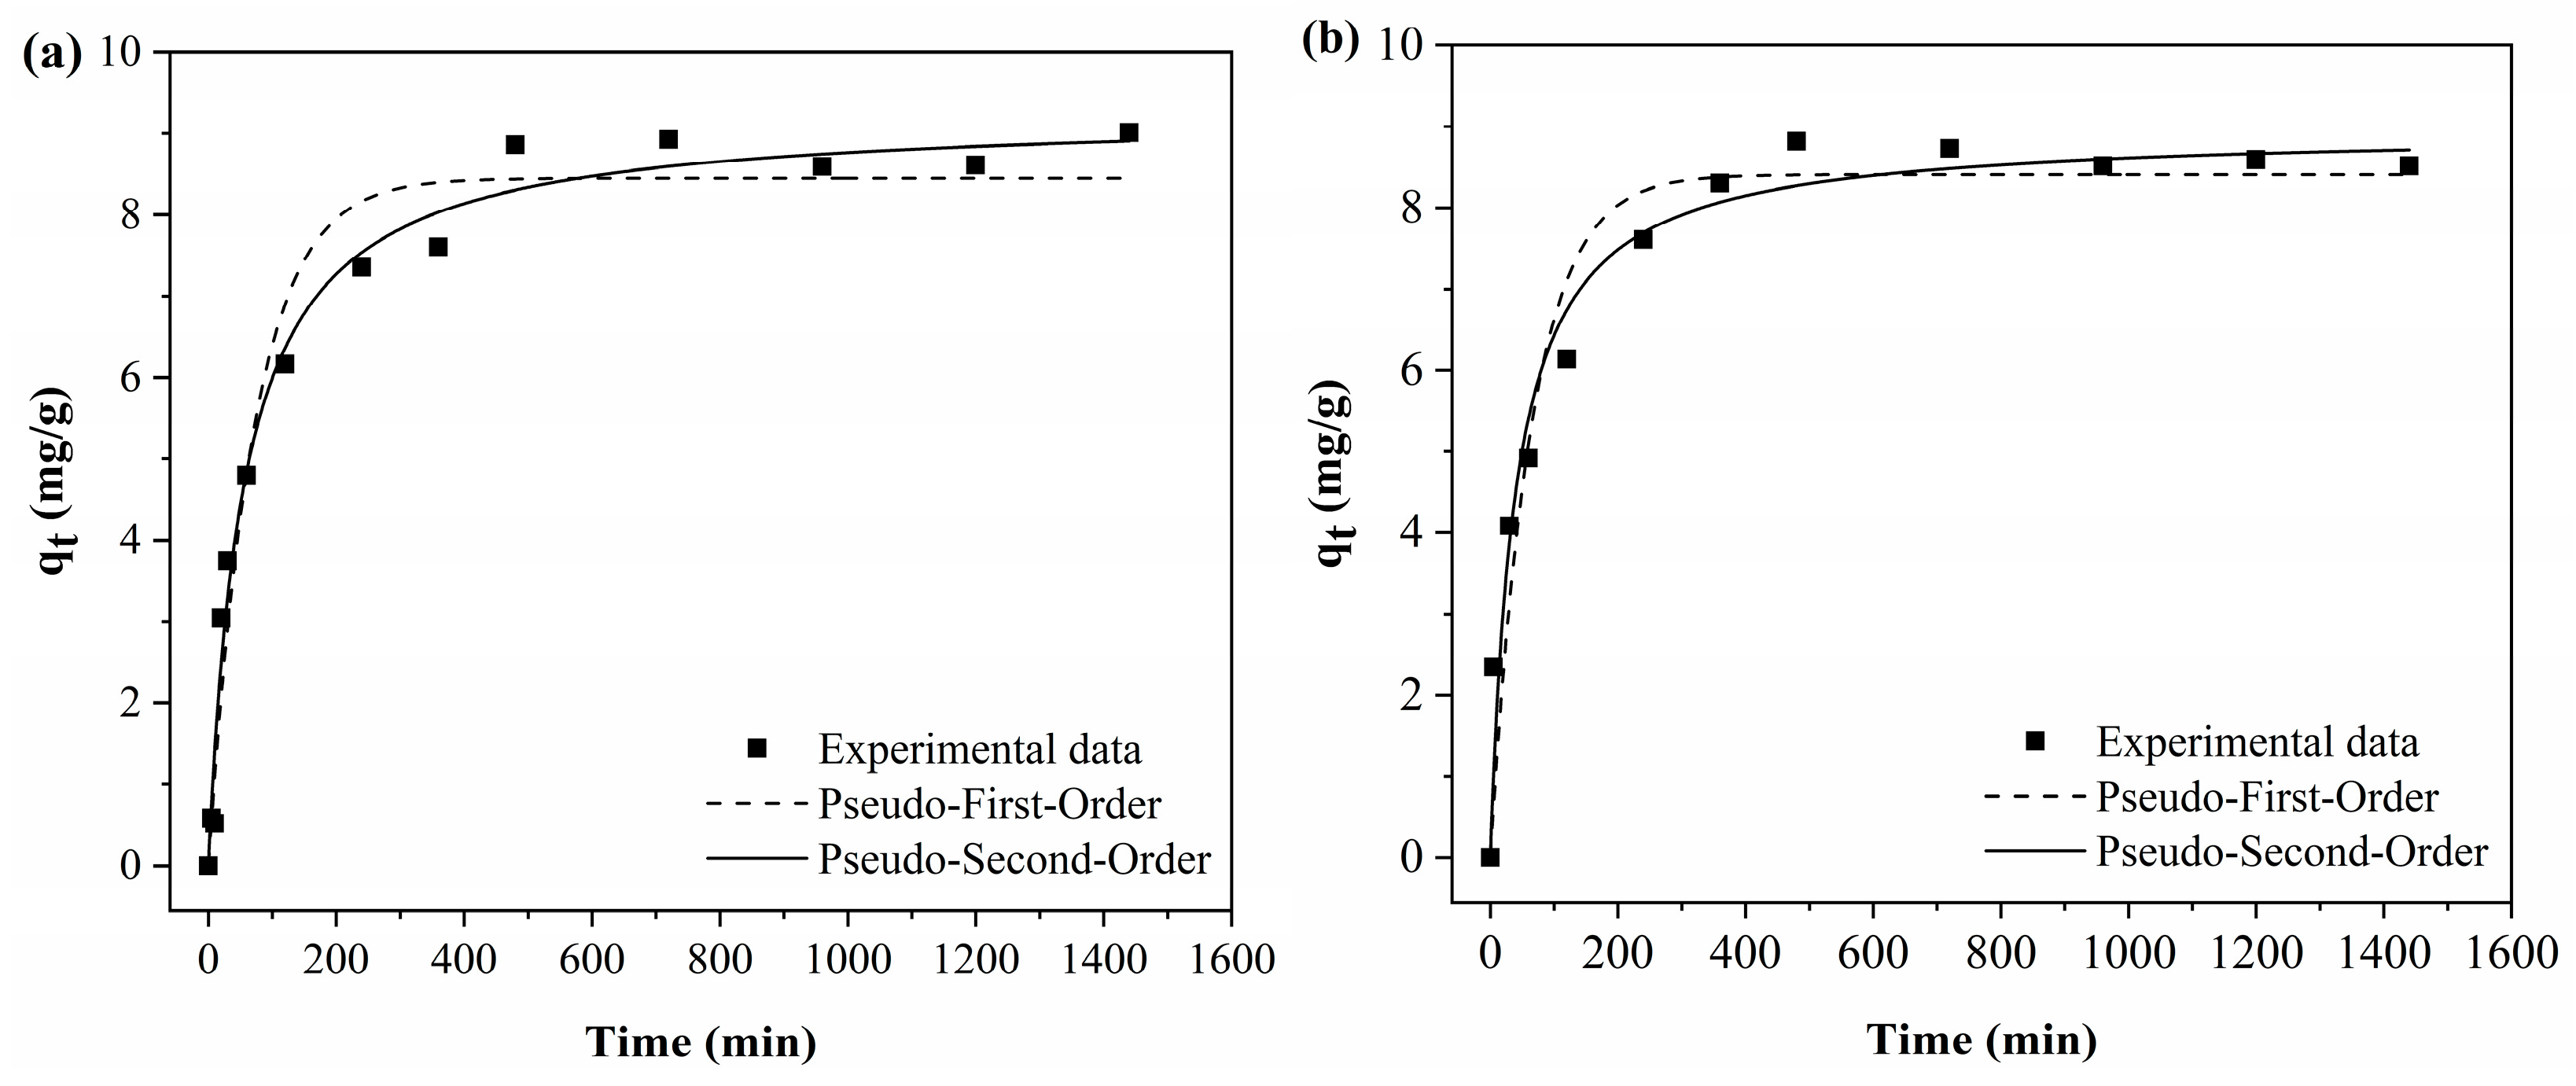
Figure 11 shows the adjustments of the curves to the experimental data of the adsorption kinetic tests using the pseudo-first-order and pseudo-second-order models.
As can be seen in Figure 11, for both polymeric activated hydrochars, the BPA adsorption capacity increases with time until reaching the equilibrium point. For both PAHF0.35.WV and PAHF0.50.WV, the equilibrium of the adsorption process occurs around 8 h.
In BPA adsorption, the reaction is fast in the first 60 min, and after this time, the process occurs more slowly until equilibrium is reached. This occurs because at the beginning of the process, there is a greater availability of specific surface area, and BPA molecules quickly occupy the adsorption sites. The process becomes slower as the sites are occupied, and the availability of specific surface area is smaller. When the adsorbent surface is saturated, the process reaches equilibrium [56].
Table 6 presents the parameters obtained from data fitting. Under the experimental conditions evaluated, the polymeric activated hydrochars showed values close to the adsorption capacity, which was equal to 8.86 mg/g for PAHF0.35.WV and 8.81 mg/g for PAHF0.50.WA. The pseudo-second-order model presented the best fit to the experimental data (highest R2 value and lowest chi-square value) for the two adsorbents studied.
As shown in Figure 12, the DCF adsorption process was faster in the first hour of the experiment. However, the adsorption reached equilibrium after 16 h of adsorption, which characterizes it as a slower adsorption when compared to the adsorption of BPA.
Table 7 presents the parameters of the adjustments of the kinetic models to the experimental data in the adsorption of DCF.
Compared to BPA, polymeric activated hydrochars showed worse performance in DFC adsorption. The drug adsorption capacity for PAHF0.35.WV was 5.02 mg/g and 6.07 mg/g for PAHF0.50.WV, which were close to the adsorption capacities calculated by the kinetic models.
The pseudo-second-order model presented the best fit of the curves to the experimental data. Thus, for both PAHF0.35.WV and PAHF0.50.WV, the adsorption processes of BPA and DFC can be explained by pseudo-second-order kinetics.
The model suggests that the adsorption process occurs by chemisorption, with electron sharing between the adsorbate and the adsorbent. And as the adsorbate molecules occupy the active sites of the adsorbents, the formation of monolayers occurs [57].

3.3.5. Adsorption Isotherms

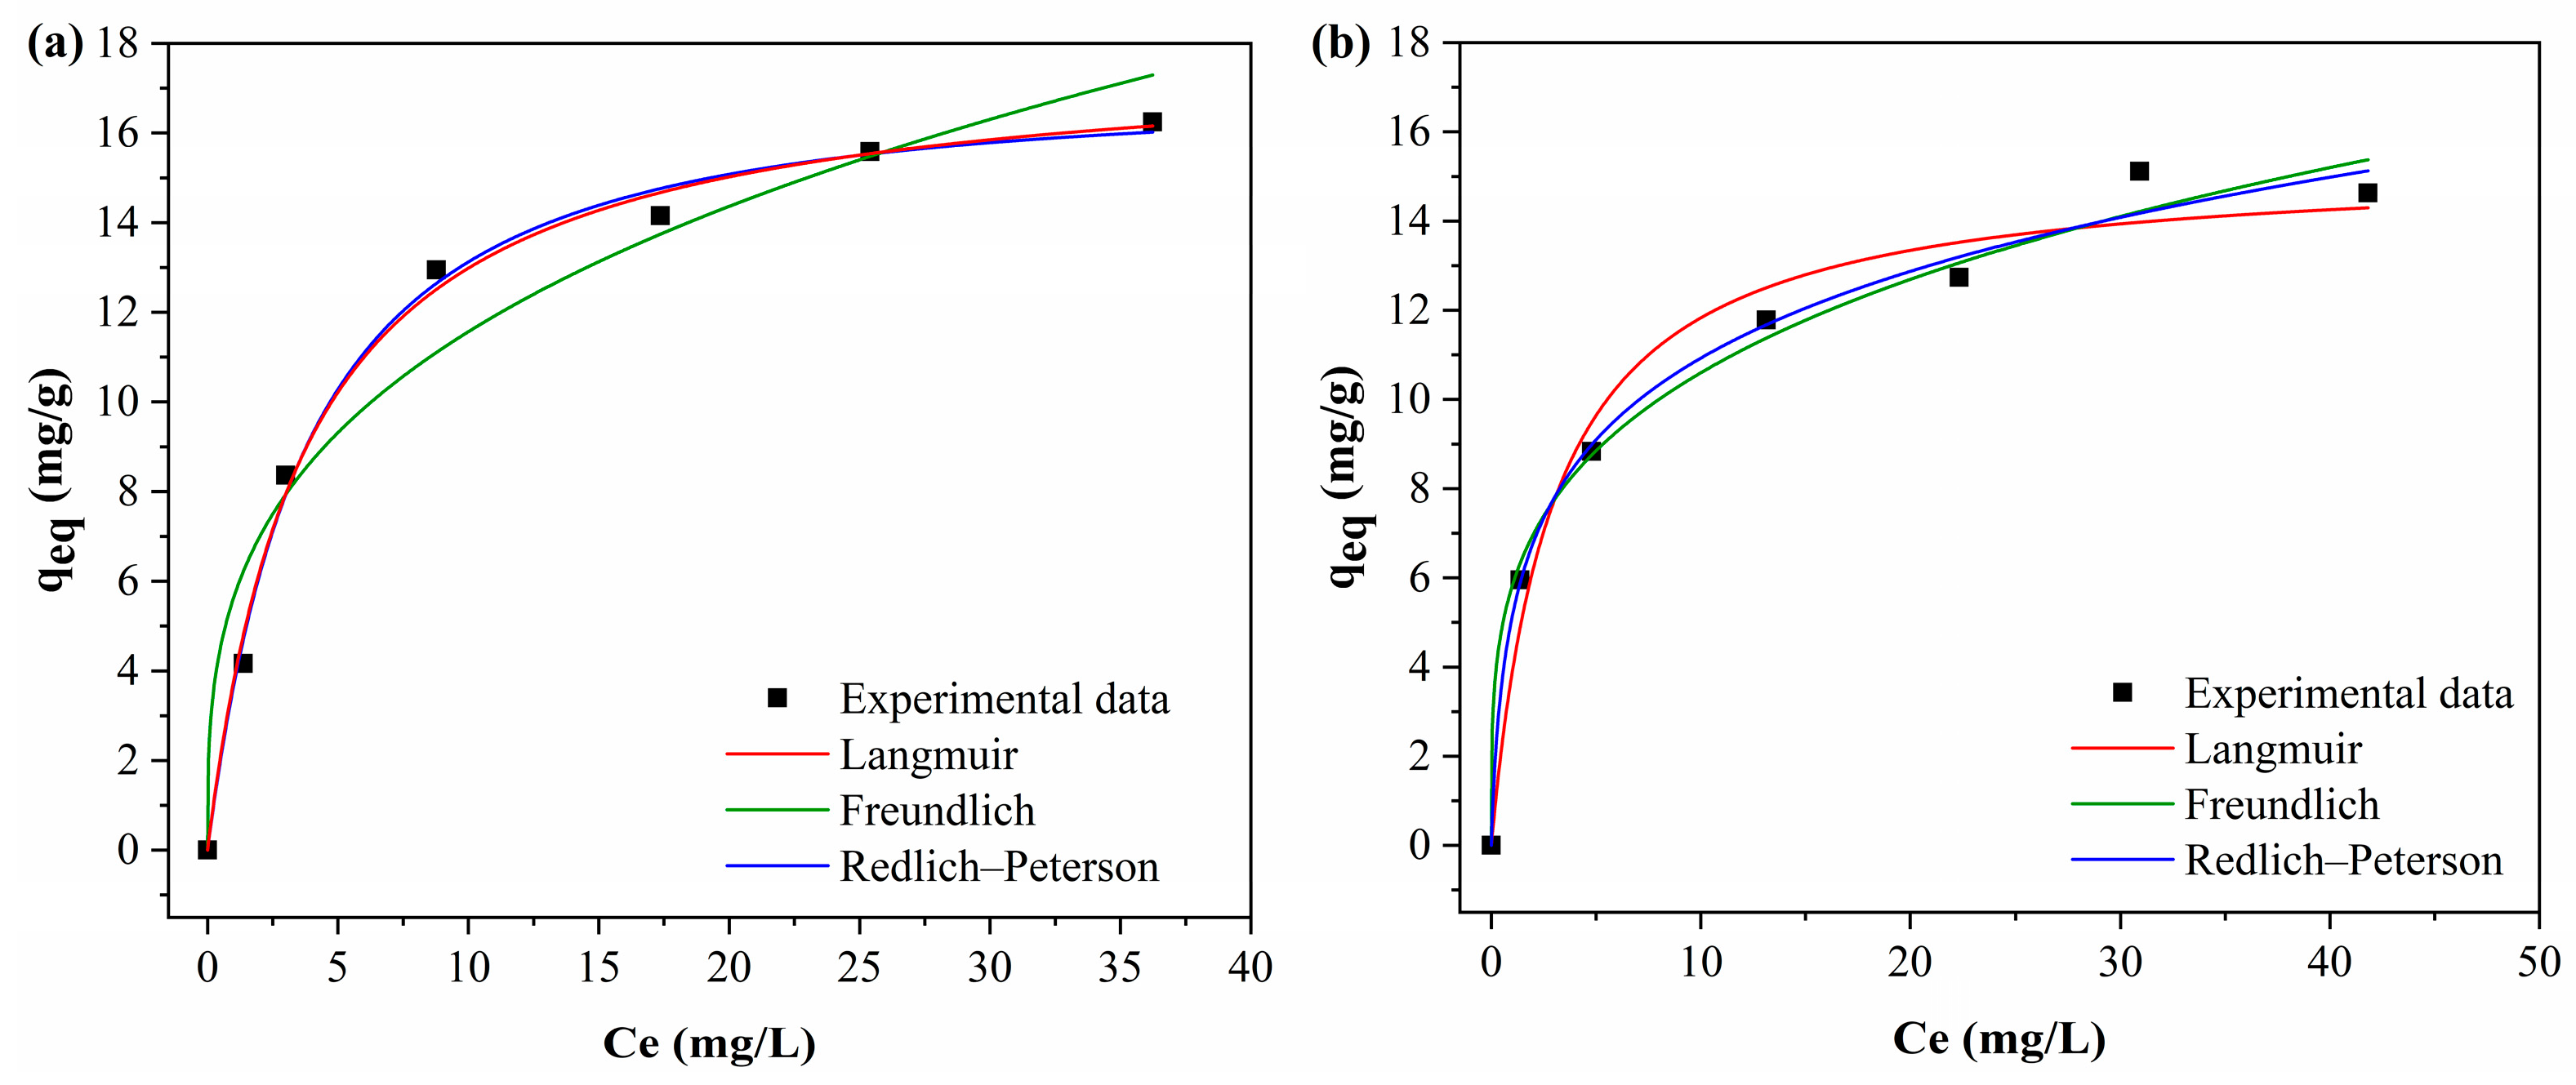
Figure 13 shows the fitted of the curves of the Langmuir, Freundlich and Redlich–Peterson isotherm models to the experimental data.
Table 8 presents the isotherm models in the adsorption of BPA by the adsorbents.
The Freundlich model presented the best fit of the curve to the experimental data, with higher R2 values. The R2 values were 0.989 for PAHF0.35.WV and 0.993 for PAHF0.50.WV. In addition, the Freundlich model also presented the lowest chi-square values when compared to the Langmuir model. The Freundlich n values for both adsorbents ranged from 1 to 10, indicating a favorable isotherm.
The Redlich–Peterson model includes features of the Langmuir and Freundlich models. For this reason, this model can be applied to homogeneous and heterogeneous systems [33]. The Redlich–Peterson equation was applied to confirm whether the adsorption data were adequately explained by the Langmuir or Freundlich model. The Redlich–Peterson R2 values were 0.997 and 0.999, which are close to 1 and indicate that the Redlich–Peterson model was applied correctly.
The model variables kF and akP are greater than 1. This is an indication that the Freundlich isotherm is the one that best explains the adsorption process. The premises of the Freundlich model are that adsorption occurs in multilayers and the adsorbent has a heterogeneous surface with an exponential distribution of energy in the different types of adsorption sites [31,32].
As shown in Table 9, the Langmuir model also showed significant R2 values, 0.985 for PAHF0.35.WV and 0.988 for PAHF0.50.WV. Although the main mechanism of BPA adsorption is multilayered, it is possible that the process also occurs, to a lesser extent, via the mechanism of the Langmuir model with monolayer adsorption [10]. By the Langmuir model, the maximum adsorption capacity of PAHF0.35.WV was equal to 24.52 mg/g, and that of PAHF0.50.WV was 23.34 mg/g.
The literature includes studies of BPA adsorption by commercial polymeric resins. However, no studies were found with alternative adsorbents of polymeric origin such as hydrochar, activated hydrochar or activated carbon, for example. Table 10 shows a comparison of the maximum adsorption capacity in relation to the specific surface area by the polymeric materials reported in the literature. The adsorbents produced in this study are also listed in Table 9. It is observed that the activated hydrocarbons PAHF0.35.WV and PAHF0.50.WV have a greater adsorption capacity for BPA when compared to other studies.
Table 9. A comparison of the adsorptive performance of PAHF0.35.WV and PAHF0.50.WV and adsorbents from other studies available in the literature.
AdsorbentSpecific Surface Area (m2/g)qmax (mg/g)Reference
Thermosensitive non-imprinted polymers (T-NIPs)28.751.22[58]
Thermosensitive molecular printing polymers (T-MIPs)80.555.03[58]
Polymeric resin (styrene–divinylbenzene) Diaion SP82510008.83[59]
Amberlite XAD-7 resin impregnated with Aliquat-33662.4010.86[60]
Poly(chloromethylstyrene) resin modified by porous β-cyclodextrin cross-linked polymer34.058.42[61]
Amberlite XAD-1180 polymeric resin impregnated with trioctylamine5004.40[62]
PAHF0.35.WV223.6024.52This study
PAHF0.50.WV217.2023.34This study
The fits of the Langmuir, Freundlich and Redlich–Peterson models to the experimental DCF adsorption isotherm data are presented in Figure 14, and the model parameters are presented in Table 10.
Table 10. The parameters of the Langmuir, Freundlich and Redlich–Peterson models for the adsorbents PAHF0.35.WV and PAHF0.50.WV in the adsorption of DCF.
Adsorbent
ModelParametersPAHF0.35.WVPAHF0.50.WV
qmax (mg/g)17.82 ± 0.44815.30 ± 0.738
kL (L/mg)0.269 ± 0.0270.34 ± 0.082
LangmuirRL0.069 to 0.6610.054 to 0.634
R20.9950.978
χ20.2110.821
kF (mg/g) (L/mg)n5.63 ± 0.8645.82 ± 0.433
n3.20 ± 0.5283.84 ± 0.354
Freundlich1/n0.3120.260
R20.9610.989
χ21.8190.358
kRP (L/g)4.49 ± 0.7256.44 ± 0.468
aRP (mg/L)−g0.224 ± 0.0912.20 ± 2.449
Redlich–Petersong1.03 ± 0.0720.805 ± 0.065
R20.9960.992
χ20.2490.345
Comparing the Langmuir and Freundlich parameters of the PAHF0.35.WV sample, the Langmuir model presented the highest R2 value (0.995) and the lowest chi-squared value (0.211), while the Freundlich model presented an R2 equal to 9.61 and chi-squared to 0.358. The Redlich–Peterson model confirmed the best fit by the Langmuir model when g tends to 1. Furthermore, the R2 of 0.996 indicates that the model was properly applied. Thus, the adsorption data of DCF by activated hydrochar PAHF0.35.WV can be explained by the Langmuir isotherm. The model indicates that adsorption occurs with the formation of monolayers, with sites of equivalent energy, in which only one molecule is adsorbed, without interaction with other molecules [63].
For PAHF0.50.WV, the Freundlich model presented a better fit of the curve to the experimental data when compared to the R2 and chi-square values of the Langmuir model. The Freundlich n variable was equal to 5.821 and was within the range of 1 to 10, which indicates that the adsorption isotherm is favorable.
The Redlich–Peterson model presented values of the variables kF and akP greater than 1 and g close to 1, which confirms that the adsorption of DCF by PAHF0.50.WV is adequately explained by the Freundlich model. Thus, the data suggest that the adsorption of DCF by PAHF0.50.WV occurs with the formation of multilayers and with a heterogeneous surface with exponential energy distribution at the adsorption sites [31,32]. From the experimental data, as can be seen in Figure 14b, the maximum adsorption capacity of PAHF0.50.WV was close to 15 mg/g.
The literature does not include studies on DCF adsorption using activated carbon or HTC adsorbents. However, some studies on drug adsorption from other polymeric materials were found, as shown in Table 11.
A good adsorptive performance of DCF by the adsorbent produced by [64] was observed, followed by that of the adsorbents used by [65]. In contrast, the worst performance was observed in the study by [66], who analyzed the adsorption of DCF by a commercial polymeric resin.
The material with the highest specific surface area was the one with the worst adsorptive performance, which may have occurred due to textural characteristics incompatible with the size of the DCF molecule; this was also due to the resin surface chemistry. However, this factor was not discussed by the authors.
Table 11. DCF adsorption capacity of PAHF0.35.WV and PAHF0.50.WV adsorbents and respective specific surface areas compared to literature data.
AdsorbentSpecific Surface Area (m2/g)qmax (mg/g)Reference
Molecularly imprinted polymerNo presented324.80[64]
Polymeric Resin SR5500 Resinex8611.5 × 10−4[66]
Porous organic polymer based on diphenyl phosphate714166[65]
Porous organic polymer based on 1,1,2,2-tetraphenylethylene581217[65]
PAHF0.35.WV223.6017.82This study
PAHF0.50.WV217.2015This study
In this study, the polymeric activated hydrochars produced showed a maximum adsorption capacity of 15 and 17.82 mg/g, with values close to the specific surface area. Compared with the studies by [64,65], activated hydrocarbons PAHF0.35.WV and PAHF0.50.WV showed worse DCF adsorption performance. However, the adsorption capacities were sufficient for the concentrations detected in surface waters in several cases, as shown in Table 12.
As can be seen, studies report drug concentrations in the order of nanograms per liter of sample. All concentrations presented are compatible with the maximum adsorption capacities of the adsorbents produced in this study. In this way, it becomes unnecessary to develop materials with high values of specific surface area and adsorptive development due to the data shown in Table 12.
3.4. Ecotoxicological Evaluation of Adsorbents of Polymeric Origin in Water Using Raphidocelis subcapitata as Indicator Organism

Table 13 shows the growth of algal biomass in the exposures carried out. The biomass growth data of the microalgae R. subcapitata in the ecotoxicity study are presented in Table 13.
The final algal biomass concentration of the negative control was 2.11 × 10⁵ cells/mL. This growth corresponds to an increase of 21.1 times the initial concentration of the microorganism, which meets the [34] guidelines.
In the positive control, the final concentration of algal biomass was 6.54 × 10⁴ cells/mL, which corresponds to 31% of the increase observed in the negative control. This result indicates that the inhibition of microalgae growth occurred according to the [34].
Unlike the positive control, the samples with activated hydrochars PAHF0.35.WV and PAHF0.50.WV had a final concentration of 1.97 × 10⁵ cells/mL and 1.91 × 10⁵ cells/mL, respectively. For both samples, chronic toxicity to the microalgae R. subcapitata was not observed, and the exposures did not inhibit the growth of organisms.

3.5. Regeneration of Adsorbents

Only polymeric activated hydrochar PAHF0.35.WV saturated with BPA was submitted to the regeneration tests, due to the performance in BPA adsorption being close to that of PAHF0.50.WV. The choice of ozone regeneration was made due to the possibility of the process occurring at room temperature. The removal of the adsorbate occurred due to the oxidizing characteristic of ozone, which eliminates the need to heat the regeneration system and consequently lowers the energy expenditure of the process [71].
To determine the ideal ozonation time, the PAHF0.35.WV samples with adsorbed BPA were ozonized for different times (Figure 15) in the first regeneration cycle.
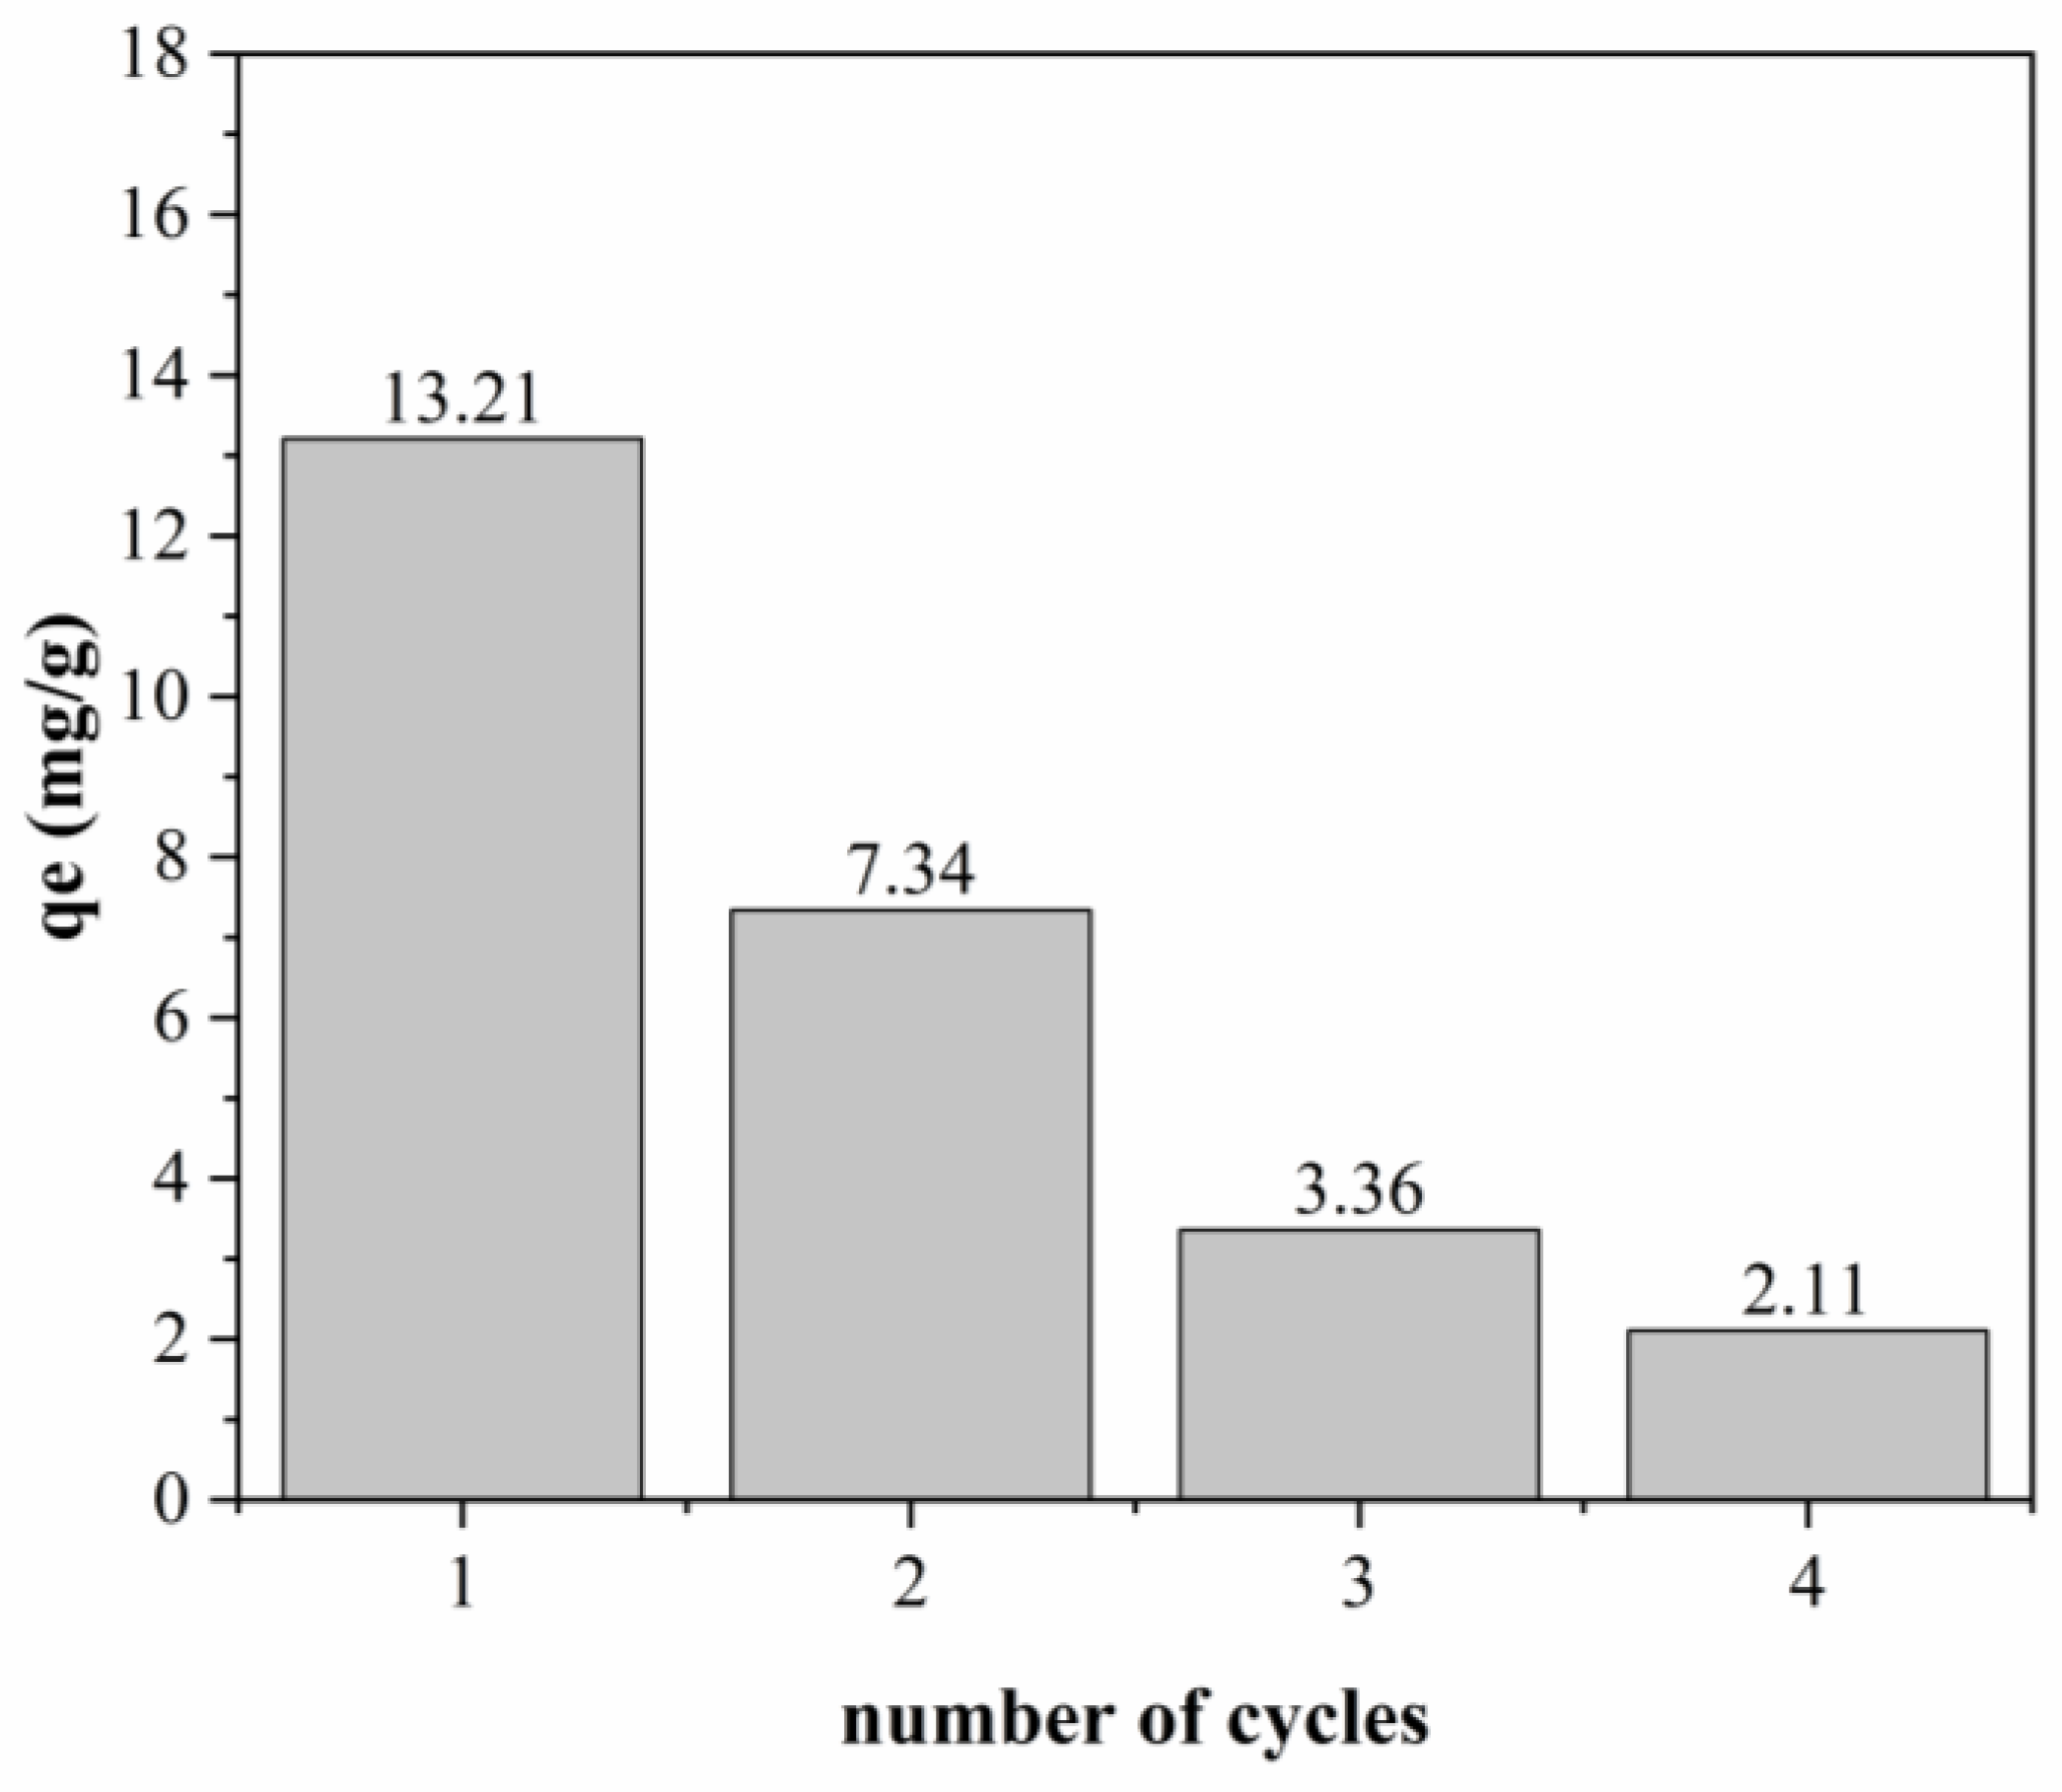
The regeneration time that showed the greatest recovery of the maximum adsorption capacity of BPA was 15 min, with a regeneration of approximately 57%. However, it was observed that between the times of 5, 10 and 15 min, there was little variation in the new maximum adsorption capacity of PAHF0.35.WV. Thus, other experiments were carried out considering a regeneration time of 5 min. Figure 16 shows the BPA adsorption performance in each cycle.
It is observed that from the first to the second cycle and from the second to the third cycle, the maximum adsorption capacities are reduced by approximately 50%. The results indicate that, under the evaluated conditions, the regeneration of polymeric activated hydrochar PAHF0.35.WV by ozonation was incomplete.
Other studies also report the incomplete regeneration of activated carbon using ozone [72,73,74]. After regenerating the adsorbents, the authors observed structural and chemical changes in the adsorbents. The authors observed a reduction in the specific surface area due to pore enlargement and changes in the surface chemistry of the materials, such as an increase in oxygenated groups. The studies relate such modifications to the reduction in the adsorption capacity of the adsorbents.
Oxygenated functional groups generally contribute to adsorption processes by chemical bonds with the adsorbate. However, an increase in these groups may occur during the ozonation processes; consequently, there may be variations in the pHPZC of the adsorbents, which can impair adsorption.

4. Conclusions

This study shows that anionic ion exchange resins have potential for use as precursors in the production of adsorbent materials. The best HTC conditions occurred in the presence of the FeCl3 catalyst at a concentration of 0.35 mol/L and 0.50 mol/L. The polymeric hydrochars produced presented a low specific surface area, which was less than 50 m2/g. However, the materials developed a surface rich in functional groups.
The physical activation processes using water vapor showed a greater development of specific surface area and pores compared to physical activation using occluded water. The samples PAHF0.35.WV and PAHF0.50.WV presented specific surface areas equal to 223.6 mg/g and 217.2 mg/g, respectively. However, part of the surface functional groups was eliminated during the activation process.
All materials produced were tested to remove BPA and DCF in prepared water. The best performances in the adsorption of both CECs were for the water vapor polymeric activated hydrochars. For BPA, the maximum adsorption capacities of 24.52 mg/g and 23.34 mg/g were obtained for samples PAHF0.35.WV and PAHF0.50.WV, respectively. The pseudo-second-order kinetic model presented the best fit of the curve to the experimental data for both polymeric activated hydrochars. For the adsorption isotherms, the best fit was the Freundlich model.
For DCF, the maximum adsorption capacities were 17.68 mg/g and 15 mg/g for polymeric activated hydrochars PAHF0.35.WV and PAHF0.50.WV, respectively. The pseudo-second-order model had the best fit to the experimental adsorption kinetic data. Regarding the isotherm data, the best fit for PAHF0.35.WV was the Langmuir model, and for PAHF0.50.WV, the Freundlich model had the best fit.
The toxicity study for adsorbents PAHF0.35.WV and PAHF0.50.WV did not show the inhibition of the growth of the microalgae R. subcapitata in the evaluated experimental conditions. The ozone regeneration of PAHF0.35.WV saturated with BPA allowed for the recovery of the adsorption capacity of the polymeric activated hydrochar to about 50% of the initial capacity in the first regeneration cycle. From the second cycle, the regeneration capacity was below 25%. More specific studies must be carried out to identify the factors that resulted in the incomplete regeneration of the adsorbent.
In future studies, adsorbents will be tested for the adsorption of CECs simulating real surface water samples, considering their environmental conditions and the interaction between more than one CEC. In addition, for adsorbent regeneration tests, it is necessary to identify the formation of byproducts in the reaction between CECs and ozone.

Author Contributions

Conceptualization, A.C.F.A., S.B.d.O. and P.S.S.; Methodology, A.C.F.A.; Formal analysis, A.C.F.A.; Resources, S.B.d.O. and P.S.S.; Data curation, A.C.F.A.; Writing—original draft, A.C.F.A.; Writing—review & editing, A.C.F.A., S.B.d.O. and P.S.S.; Supervision, S.B.d.O. and P.S.S. All authors have read and agreed to the published version of the manuscript.

Funding

This research received no external funding

Institutional Review Board Statement

Not applicable.

Informed Consent Statement

Not applicable.

Data Availability Statement

Data is contained within the article.

Acknowledgments

The authors would like to thank the Multiuser Laboratory of Pontal of the Federal University of Uberlândia (FINEP/2013 INFR13 01.13.0371.00) for its technical support in carrying out the characterization analyses of the materials produced and would like to thank the Coordination for the Improvement of Higher Education Personnel (CAPES) for providing the research grant.

Conflicts of Interest

The authors declare no conflict of interest.

References

  1. Škrbić, B.D.; Kadokami, K.; Antić, I. Survey on the micro-pollutants presence in surface water system of northern Serbia and environmental and health risk assessment. Environ. Res. 2018, 166, 130–140. [Google Scholar] [CrossRef] [PubMed]
  2. Zhu, L.; Jiang, C.; Panthi, S.; Allard, S.M.; Sapkota, A.R.; Sapkota, A. Impact of high precipitation and temperature events on the distribution of emerging contaminants in surface water in the Mid-Atlantic, United States. Sci. Total Environ. 2021, 755, 142552. [Google Scholar] [CrossRef]
  3. Hespanhol, I. Reuso potável direto e o desafio dos poluentes emergente. Rev. USP 2015, 79–94. [Google Scholar] [CrossRef]
  4. Brandt, E.M.F.; Aquino, S.F.; Bastos, R.K.X. Revisão do Anexo XX da Portaria de Consolidação n. 5 de 28 de setembro de 2017 do Ministério da Saúde (Antiga Portaria MS No 2914/2011) Padrão de Potabilidade e Planos de Amostragem Substâncias Químicas—Fármacos e Desreguladores Endócrinos; Ministério da Saúde: Brasília, Brasil, 2020.
  5. Santos, A.V.; Couto, C.F.; Lebron, Y.A.R.; Moreira, V.R.; Foureaux, A.F.S.; Reis, E.O.; Santos, L.V.D.S.; de Andrade, L.H.; Amaral, M.C.S.; Lange, L.C. Occurrence and risk assessment of pharmaceutically active compounds in water supply systems in Brazil. Sci. Total Environ. 2020, 746, 141011. [Google Scholar] [CrossRef]
  6. Kumar, S.; Datta, D. Separation of Bisphenol-A using Amberlite-1180 impregnated with tri-n-octylamine. Chem. Data Collect. 2022, 37, 100815. [Google Scholar] [CrossRef]
  7. Madikizela, L.M.; Ncube, S.; Chimuka, L. Analysis, occurrence and removal of pharmaceuticals in African water resources: A current status. J. Environ. Manag. 2020, 253, 109741. [Google Scholar] [CrossRef] [PubMed]
  8. Phan, K.A.; Phihusut, D.; Tuntiwiwattanapun, N. Preparation of rice husk hydrochar as an atrazine adsorbent: Optimization, characterization, and adsorption mechanisms. J. Environ. Chem. Eng. 2022, 10, 107575. [Google Scholar] [CrossRef]
  9. Malesic-Eleftheriadou, N.; Liakos, E.V.; Evgenidou, E.; Kyzas, G.Z.; Bikiaris, D.N.; Lambropoulou, D.A. Low-cost agricultural wastes (orange peels) for the synthesis and characterization of activated carbon biosorbents in the removal of pharmaceuticals in multi-component mixtures from aqueous matrices. J. Mol. Liq. 2022, 368, 120795. [Google Scholar] [CrossRef]
  10. Zbair, M.; Bottlinger, M.; Ainassaari, K.; Ojala, S.; Stein, O.; Keiski, R.L.; Bensitel, M.; Brahmi, R. Hydrothermal Carbonization of Argan Nut Shell: Functional Mesoporous Carbon with Excellent Performance in the Adsorption of Bisphenol A and Diuron. Waste Biomass Valorization 2020, 11, 1565–1584. [Google Scholar] [CrossRef]
  11. Alves, A.C.F.; Antero, R.V.P.; de Oliveira, S.B.; Ojala, S.A.; Scalize, P.S. Activated carbon produced from waste coffee grounds for an effective removal of bisphenol-A in aqueous medium. Environ. Sci. Pollut. Res. 2019, 26, 24850–24862. [Google Scholar] [CrossRef] [PubMed]
  12. Laksaci, H.; Belhamdi, B.; Khelifi, O.; Khelifi, A.; Trari, M. Elimination of amoxicillin by adsorption on coffee waste based activated carbon. J. Mol. Struct. 2023, 1274, 134500. [Google Scholar] [CrossRef]
  13. Salomón, Y.L.; Georgin, J.; Franco, D.S.P.; Netto, M.S.; Piccilli, D.G.A.; Foletto, E.L.; Pinto, D.; Oliveira, M.L.S.; Dotto, G.L. Adsorption of atrazine herbicide from water by diospyros kaki fruit waste activated carbon. J. Mol. Liq. 2022, 347, 117990. [Google Scholar] [CrossRef]
  14. Antero, R.V.P.; Alves, A.C.F.; de Oliveira, S.B.; Ojala, S.A.; Brum, S.S. Challenges and alternatives for the adequacy of hydrothermal carbonization of lignocellulosic biomass in cleaner production systems: A review. J. Clean. Prod. 2020, 252, 119899. [Google Scholar] [CrossRef]
  15. Santana, M.S.; Alves, R.P.; Santana, L.S.; Gonçalves, M.A.; Guerreiro, M.C. Structural, inorganic, and adsorptive properties of hydrochars obtained by hydrothermal carbonization of coffee waste. J. Environ. Manag. 2022, 302, 114021. [Google Scholar] [CrossRef] [PubMed]
  16. Inkoua, S.; Li, C.; Shao, Y.; Lin, H.; Fan, M.; Zhang, L.; Zhang, S.; Hu, X. Co-hydrothermal carbonization of fruit peel with sugars or furfural impacts structural evolution of hydrochar. Ind. Crops Prod. 2023, 193, 116221. [Google Scholar] [CrossRef]
  17. Ahmed Alshareef, S.; Abdullah Alqadami, A.; Ali Khan, M.; Alanazi, H.S.; Raza Siddiqui, M.; Jeon, B.-H. Simultaneous co-hydrothermal carbonization and chemical activation of food wastes to develop hydrochar for aquatic environmental remediation. Bioresour. Technol. 2022, 347, 126363. [Google Scholar] [CrossRef] [PubMed]
  18. Nogueira, G.D.R.; Duarte, C.R.; Barrozo, M.A.S. Hydrothermal carbonization of acerola (Malphigia emarginata D.C.) wastes and its application as an adsorbent. Waste Manag. 2019, 95, 466–475. [Google Scholar] [CrossRef] [PubMed]
  19. Sisuthog, W.; Attanatho, L.; Chaiya, C. Conversion of empty fruit bunches (EFBs) by hydrothermal carbonization towards hydrochar production. Energy Rep. 2022, 8, 242–248. [Google Scholar] [CrossRef]
  20. Wu, H.; Wei, H.; Yang, X.; Jin, C.; Sun, W.; Deng, K.; Rong, X.; Bin, G.; Sun, C. Spherical activated carbons derived from resin-microspheres for the adsorption of acetic acid. J. Environ. Chem. Eng. 2023, 11, 109394. [Google Scholar] [CrossRef]
  21. Wojtaszek, M.; Wasielewski, R. The use of waste ion exchange resins as components of the coal charge for the production of metallurgical coke. Fuel 2021, 286, 119249. [Google Scholar] [CrossRef]
  22. Zheng, X.; Zhi, Z.; Gu, X.; Li, X.; Zhang, R.; Lu, X. Kinetic study of levulinic acid production from corn stalk at mild temperature using FeCl3 as catalyst. Fuel 2017, 187, 261–267. [Google Scholar] [CrossRef]
  23. Brunauer, S.; Emmett, P.H.; Teller, E. Adsorption of Gases in Multimolecular Layers. J. Am. Chem. Soc. 1938, 60, 309–319. [Google Scholar] [CrossRef]
  24. Barrett, E.P.; Joyner, L.G.; Halenda, P.P. The Determination of Pore Volume and Area Distributions in Porous Substances. I. Computations from Nitrogen Isotherms. J. Am. Chem. Soc. 1951, 73, 378–380. [Google Scholar] [CrossRef]
  25. U.S. EPA. Method 3051A (SW-846): Microwave Assisted Acid Digestion of Sediments, Sludges, and Oils; Revision 1; U.S. EPA: Washington, DC, USA, 2007.
  26. Boehm, H.P. Surface oxides on carbon and their analysis: A critical assessment. Carbon N. Y. 2002, 40, 145–149. [Google Scholar] [CrossRef]
  27. Robles, J.O.; Regalbuto, J.R. The Engineering of Pt/Carbon Catalyst Preparation for application on Proton Exchange Fuel Cell Membrane (PEFCM); University of Illinois: Champaign, IL, USA, 2004; Volume 14. [Google Scholar]
  28. Lagergren, S. About the theory of so-called adsorption of soluble substances. K. Sven. Vetenskapsakademiens Handl. 1898, 24, 1–39. [Google Scholar]
  29. Blanchard, G.; Maunaye, M.; Martin, G. Removal of heavy metals from waters by means of natural zeolites. Water Res. 1984, 18, 1501–1507. [Google Scholar] [CrossRef]
  30. Langmuir, I. The adsorption of gases on plane surfaces of glass, mica and platinum. J. Am. Chem. Soc. 1918, 40, 1361–1403. [Google Scholar] [CrossRef]
  31. Freundlich, H.M.F. Over the adsorption in solution. J. Phys. Chem. 1906, 57, 385–471. [Google Scholar]
  32. Do, D.D. Adsorption Analysis: Equilibria and Kinetics. Chem. Eng. 1998, 2, 913. [Google Scholar] [CrossRef]
  33. Redlich, O.; Peterson, D.L. A Useful Adsorption Isotherm. J. Phys. Chem. 1959, 63, 1024. [Google Scholar] [CrossRef]
  34. OECD—Organization for Economic Cooperation and Development Guideline for the Testing Chemicals. Freshwater Alga and Cyanobacteria, Growth Inhibition Test (No. 201); Organization for Economic Cooperation and Development: Paris, France, 2011. [Google Scholar]
  35. Marcus, Y. On transport properties of hot liquid and supercritical water and their relationship to the hydrogen bonding. Fluid Phase Equilibria 1999, 164, 131–142. [Google Scholar] [CrossRef]
  36. Ruiz, H.A.; Rodríguez-Jasso, R.M.; Fernandes, B.D.; Vicente, A.A.; Teixeira, J.A. Hydrothermal processing, as an alternative for upgrading agriculture residues and marine biomass according to the biorefinery concept: A review. Renew. Sustain. Energy Rev. 2013, 21, 35–51. [Google Scholar] [CrossRef]
  37. Liang, B.; Deng, Y.; Liang, X.; Cai, X.; Zhang, Y.; Yin, Y.; Hu, H.; Huang, Z.; Qin, Y. Enhancement of hydrothermal carbonization of chitin by combined pretreatment of mechanical activation and FeCl3. Int. J. Biol. Macromol. 2021, 189, 242–250. [Google Scholar] [CrossRef] [PubMed]
  38. Luo, J.; Hu, W.; Suo, Z.; Wang, Y.; Zhang, Y. Co-pyrolysis of spent radioactive ion exchange resin and manganese dioxide: Decrease the decomposition temperatures of functional groups. J. Hazard. Mater. 2021, 418, 126275. [Google Scholar] [CrossRef] [PubMed]
  39. Bansal, C.R.; Goyal, M. Activated Carbon Adsorption, 1st ed.; CRC Press: New York, NY, USA, 2005. [Google Scholar] [CrossRef]
  40. Rodriguez-Reinoso, F. Handbook of Porous Solids; Wiley-VCH: Weinheim, Germany, 2002. [Google Scholar]
  41. Silverstein, R.M.; Webster, F.X.; David, K.J. Identificação Espectrométrica de Compostos Orgânicos, 7th ed.; LTC: Rio de Janeiro, Brazil, 2013. [Google Scholar]
  42. Lu, X.; Ma, X.; Qin, Z.; Chen, X.; Qi, X. Investigation of aqueous phase recirculation on co-hydrothermal carbonization of sewage sludge and lignite: Hydrochar properties and heavy metal chemical speciation. J. Environ. Chem. Eng. 2022, 10, 107111. [Google Scholar] [CrossRef]
  43. Zhou, S.; You, K.; Gao, H.; Deng, R.; Zhao, F.; Liu, P.; Ai, Q.; Luo, H. Mesoporous silica-immobilized FeCl3 as a highly efficient and recyclable catalyst for the nitration of benzene with NO2 to nitrobenzene. Mol. Catal. 2017, 433, 91–99. [Google Scholar] [CrossRef]
  44. Diaz De Tuesta, J.L.; Roman, F.F.; Marques, V.C.; Silva, A.S.; Silva, A.P.F.; Bosco, T.C.; Shinibekova, A.A.; Aknur, S.; Kalmakhanova, M.S.; Massalimova, B.K.; et al. Performance and modeling of Ni(II) adsorption from low concentrated wastewater on carbon microspheres prepared from tangerine peels by FeCl3-assisted hydrothermal carbonization. J. Environ. Chem. Eng. 2022, 10, 108143. [Google Scholar] [CrossRef]
  45. dos Santos, G.E.D.S.; Ide, A.H.; Duarte, J.L.S.; McKay, G.; Silva, A.O.S.; Meili, L. Adsorption of anti-inflammatory drug diclofenac by MgAl/layered double hydroxide supported on Syagrus coronata biochar. Powder Technol. 2020, 364, 229–240. [Google Scholar] [CrossRef]
  46. Yaah, V.B.K.; Ojala, S.; Khallok, H.; Laitinen, T.; Botelho de Oliveira, S. Hybrid carbon materials: Synthesis, characterization, and application in the removal of pharmaceuticals from water. J. Water Process Eng. 2021, 43, 102279. [Google Scholar] [CrossRef]
  47. Younes, H.A.; Taha, M.; Mahmoud, R.; Mahmoud, H.M.; Abdelhameed, R.M. High adsorption of sodium diclofenac on post-synthetic modified zirconium-based metal-organic frameworks: Experimental and theoretical studies. J. Colloid Interface Sci. 2022, 607, 334–346. [Google Scholar] [CrossRef]
  48. de Farias, M.B.; Silva, M.G.C.; Vieira, M.G.A. Adsorption of bisphenol A from aqueous solution onto organoclay: Experimental design, kinetic, equilibrium and thermodynamic study. Powder Technol. 2022, 395, 695–707. [Google Scholar] [CrossRef]
  49. Zbair, M.; Ainassaari, K.; Drif, A.; Ojala, S.; Bottlinger, M.; Pirilä, M.; Keiski, R.L.; Bensitel, M.; Brahmi, R. Toward new benchmark adsorbents: Preparation and characterization of activated carbon from argan nut shell for bisphenol A removal. Environ. Sci. Pollut. Res. 2017, 25, 1869–1882. [Google Scholar] [CrossRef] [PubMed]
  50. López-Ramón, M.V.; Ocampo-Pérez, R.; Bautista-Toledo, M.I.; Rivera-Utrilla, J.; Moreno-Castilla, C.; Sánchez-Polo, M. Removal of bisphenols A and S by adsorption on activated carbon clothes enhanced by the presence of bacteria. Sci. Total Environ. 2019, 669, 767–776. [Google Scholar] [CrossRef] [PubMed]
  51. Avcu, T.; Üner, O.; Geçgel, Ü. Adsorptive removal of diclofenac sodium from aqueous solution onto sycamore ball activated carbon—Isotherms, kinetics, and thermodynamic study. Surf. Interfaces 2021, 24, 101097. [Google Scholar] [CrossRef]
  52. Zhu, Y.; Cui, Y.; Peng, Y.; Dai, R.; Chen, H.; Wang, Y. Preparation of CTAB intercalated bentonite for ultrafast adsorption of anionic dyes and mechanism study. Colloids Surf. A Physicochem. Eng. Asp. 2023, 658, 130705. [Google Scholar] [CrossRef]
  53. Liu, F.; Dai, Y.; Zhang, S.; Li, J.; Zhao, C.; Wang, Y.; Liu, C.; Sun, J. Modification and application of mesoporous carbon adsorbent for removal of endocrine disruptor bisphenol A in aqueous solutions. J. Mater. Sci. 2018, 53, 2337–2350. [Google Scholar] [CrossRef]
  54. Vidovix, T.B.; Januário, E.F.D.; Bergamasco, R.; Vieira, A.M.S. Bisfenol A adsorption using a low-cost adsorbent prepared from residues of babassu coconut peels. Environ. Technol. 2021, 42, 2372–2384. [Google Scholar] [CrossRef] [PubMed]
  55. Abo El Naga, A.O.; El Saied, M.; Shaban, S.A.; El Kady, F.Y. Fast removal of diclofenac sodium from aqueous solution using sugar cane bagasse-derived activated carbon. J. Mol. Liq. 2019, 285, 9–19. [Google Scholar] [CrossRef]
  56. Sajid, M.; Bari, S.; Saif Ur Rehman, M.; Ashfaq, M.; Guoliang, Y.; Mustafa, G. Adsorption characteristics of paracetamol removal onto activated carbon prepared from Cannabis sativum Hemp. Alex. Eng. J. 2022, 61, 7203–7212. [Google Scholar] [CrossRef]
  57. Ho, Y.S.; Mckay, G.A. Comparison of Chemisorption Kinetic Models Applied to Pollutant Removal on Various Sorbents. Process Saf. Environ. Prot. 1998, 76, 332–340. [Google Scholar] [CrossRef]
  58. Dong, R.; Li, J.; Xiong, H.; Lu, W.; Peng, H.; Chen, L. Thermosensitive molecularly imprinted polymers on porous carriers: Preparation, characterization and properties as novel adsorbents for bisphenol A. Talanta 2014, 130, 182–191. [Google Scholar] [CrossRef]
  59. Ipek, I.; Kabay, N.; Yüksel, M. Separation of bisphenol A and phenol from water by polymer adsorbents: Equilibrium and kinetics studies. J. Water Process Eng. 2017, 16, 206–211. [Google Scholar] [CrossRef]
  60. Batra, S.; Datta, D.; Sai Beesabathuni, N.; Kanjolia, N.; Saha, S. Adsorption of Bisphenol-A from aqueous solution using amberlite XAD-7 impregnated with aliquat 336: Batch, column, and design studies. Process Saf. Environ. Prot. 2019, 122, 232–246. [Google Scholar] [CrossRef]
  61. Wei, Z.; Ping, S.; Desheng, L.; Quanlin, Z.; Binze, Z.; Lincheng, Z.; Zhengfang, Y. Method to fabricate porous multifunction β-cyclodextrin modified resin for ultrafast and efficient removal of Cu(II) and bisphenol A. J. Taiwan Inst. Chem. Eng. 2021, 119, 286–297. [Google Scholar] [CrossRef]
  62. Kumar, M.; Sridharan, S.; Sawarkar, A.D.; Shakeel, A.; Anerao, P.; Mannina, G.; Sharma, P.; Pandey, A. Current research trends on emerging contaminants pharmaceutical and personal care products (PPCPs): A comprehensive review. Sci. Total Environ. 2023, 859, 160031. [Google Scholar] [CrossRef]
  63. Tran, H.N.; You, S.J.; Hosseini-Bandegharaei, A.; Chao, H.P. Mistakes and inconsistencies regarding adsorption of contaminants from aqueous solutions: A critical review. Water Res. 2017, 120, 88–116. [Google Scholar] [CrossRef] [PubMed]
  64. Dai, C.-M.; Geissen, S.-U.; Zhang, Y.-L.; Zhang, Y.-J.; Zhou, X.-F. Selective removal of diclofenac from contaminated water using molecularly imprinted polymer microspheres. Environ. Pollut. 2011, 159, 1660–1666. [Google Scholar] [CrossRef]
  65. Ravi, S.; Choi, Y.; Choe, J.K. Novel phenyl-phosphate-based porous organic polymers for removal of pharmaceutical contaminants in water. Chem. Eng. J. 2020, 379, 122290. [Google Scholar] [CrossRef]
  66. Haddad, M.; Oie, C.; Vo Duy, S.; Sauvé, S.; Barbeau, B. Adsorption of micropollutants present in surface waters onto polymeric resins: Impact of resin type and water matrix on performance. Sci. Total Environ. 2019, 660, 1449–1458. [Google Scholar] [CrossRef] [PubMed]
  67. Arsand, J.B.; Dallegrave, A.; Jank, L.; Feijo, T.; Perin, M.; Hoff, R.B.; Arenzon, A.; Gomes, A.; Pizzolato, T.M. Spatial-temporal occurrence of contaminants of emerging concern in urban rivers in southern Brazil. Chemosphere 2023, 311, 136814. [Google Scholar] [CrossRef]
  68. Yang, Y.; Chen, Z.; Zhang, J.; Wu, S.; Yang, L.; Chen, L.; Shao, Y. The challenge of micropollutants in surface water of the Yangtze River. Sci. Total Environ. 2021, 780, 146537. [Google Scholar] [CrossRef]
  69. Rivera-Jaimes, J.A.; Postigo, C.; Melgoza-Alemán, R.M.; Aceña, J.; Barceló, D.; López de Alda, M. Study of pharmaceuticals in surface and wastewater from Cuernavaca, Morelos, Mexico: Occurrence and environmental risk assessment. Sci. Total Environ. 2018, 613–614, 1263–1274. [Google Scholar] [CrossRef]
  70. Praveena, S.M.; Shaifuddin, S.N.M.; Sukiman, S.; Nasir, F.A.M.; Hanafi, Z.; Kamarudin, N.; Ismail, T.H.T.; Aris, A.Z. Pharmaceuticals residues in selected tropical surface water bodies from Selangor (Malaysia): Occurrence and potential risk assessments. Sci. Total Environ. 2018, 642, 230–240. [Google Scholar] [CrossRef] [PubMed]
  71. Salvador, F.; Martin-Sanchez, N.; Sanchez-Hernandez, R.; Sanchez-Montero, M.J.; Izquierdo, C. Regeneration of carbonaceous adsorbents. Part II: Chemical, Microbiological and Vacuum Regeneration. Microporous Mesoporous Mater. 2015, 202, 277–296. [Google Scholar] [CrossRef]
  72. Álvarez, P.M.; Beltrán, F.J.; Gómez-Serrano, V.; Jaramillo, J.; Rodríguez, E.M. Comparison between thermal and ozone regenerations of spent activated carbon exhausted with phenol. Water Res. 2004, 38, 2155–2165. [Google Scholar] [CrossRef]
  73. Cabrera-Codony, A.; Gonzalez-Olmos, R.; Martín, M.J. Regeneration of siloxane-exhausted activated carbon by advanced oxidation processes. J. Hazard. Matererials 2015, 285, 501–508. [Google Scholar] [CrossRef]
  74. Mustafa, M.; Kozyatnyk, I.; Gallampois, C.; Oesterle, P.; Ostman, M.; Tysklind, M. Regeneration of saturated activated carbon by electro-peroxone and ozonation: Fate of micropollutants and their transformation products. Sci. Total Environ. 2021, 776, 145723. [Google Scholar] [CrossRef]
Figure 1. (a) Exhausted cationic resin, (b) PH, (c) PHF0.25, (d) PHF0.35 and (e) PHF0.50. HTC temperature range of all samples: 240 ± 5 °C. Images obtained at 320× magnification of samples using Leica Stereomicroscope—EZ4. HTC temperature range of all samples: 240 ± 5 °C.
Coatings 15 00027 g001
Figure 2. Production yield of polymeric adsorbents produced without catalyst and with FeCl3 catalyst at different concentrations.
Coatings 15 00027 g002
Figure 3. Production yield of polymeric activated hydrochars.
Coatings 15 00027 g003
Figure 4. Micrographs: (a) PHF0.35—magnification 10,000× (b) PAHF0.35.WO—magnification 10.000× (c) PAHF0.35.WV—magnification 10,000× (d) PHF0.50—magnification 3500× (e) PAHF0.50.OW—magnification 3500×; (f) PAHF0.50.WV—magnification 5000×.
Coatings 15 00027 g004
Figure 5. Infrared spectrum of (a) PHF0.35, PAHF0.35.OW and PAHF0.35.WV and (b) PHF0.50, PAHF0.50.OW and PAHF0.50.WV.
Coatings 15 00027 g005
Figure 6. Efficiency of adsorbents (a) PHF0.35, PAHF0.35.OW and PAHF0.35.WV and (b) PHF0.50, PAHF0.50.OW and PAHF0.50.WV in adsorption of BPA and DCF.
Coatings 15 00027 g006
Figure 7. Effect of pH on BPA adsorption by PAHF0.35.WV and PAHF0.50.WV adsorbents.
Coatings 15 00027 g007
Figure 8. Zero charge potential of samples (a) PAHF0.35.WV and (b) PAHF0.35.WV.
Coatings 15 00027 g008
Figure 9. Influence of adsorbent concentration of (a) PAHF0.35.WV and (b) PAHF0.50.WV on BPA adsorption.
Coatings 15 00027 g009
Figure 10. Influence of adsorbent concentration of (a) PAHF0.35.WV and (b) PAHF0.50.WV on DCF adsorption.
Coatings 15 00027 g010
Figure 11. The fits of the pseudo-first-order and pseudo-second-order models to the experimental data of BPA adsorption by the adsorbents (a) PAHF0.35.WV and (b) PAHF0.50.WV.
Coatings 15 00027 g011
Figure 12. The fits of the pseudo-first-order and pseudo-second-order models to the experimental data of DCF adsorption by the adsorbents (a) PAHF0.35.WV and (b) PAHF0.50.WV.
Coatings 15 00027 g012
Figure 13. The fits of the Langmuir, Freundlich and Redlich–Peterson models to the experimental data of BPA adsorption by the adsorbents (a) PAHF0.35.WV and (b) PAHF0.50.WV.
Coatings 15 00027 g013
Figure 14. Langmuir, Freundlich and Redlich–Peterson model parameters for (a) PAHF0.35.WV and (b) PAHF0.50.WV adsorbents in DCF adsorption.
Coatings 15 00027 g014
Figure 15. Effect of ozonation time on first cycle of recovery and effect of reuse of PAHF0.35.WV on BPA removal.
Coatings 15 00027 g015
Figure 16. Adsorptive capacity of BPA in each regeneration cycle of PAHF0.35.WV.
Coatings 15 00027 g016
Table 1. The porosity data of the adsorbents produced.
SamplesSpecific Surface Area (m2/g) Total Pore Volume (cm3/g) Average Pore Diameter (nm)
PHF0.352.64<0.021.00
PAHF0.35.OW12.520.026.00
PAHF0.35.WV223.610.142.50
PHF0.502.74<0.021.00
PAHF0.50.OW0.66<0.027.00
PAHF0.50.WV217.170.132.00
Table 2. The identification of the possible functional groups of the FT-IR spectra of the adsorbents produced [41].
Band (cm−1)Functional Groups
3443Axial O-H deformation of hydroxyl group of alcohols and phenolic groups and/or O-H of water in sample
3017, 2924 and 2916C-H axial deformation of alkanes
1705C=O axial deformation of carboxylic acids
1601 to 1506C-C axial deformation of aromatic ring
1595Angular deformation in N-H plane of amines
1306C-O axial deformation and O-H angular deformation of carboxylic acids
1211 to 1015C-O axial deformation of alcohols and phenols and carboxylic groups
874 to 698C-H out-of-plane angular deformation of aromatic ring and N-H out-of-plane angular deformation of amines
Table 3. Quantification of metals per gram of anionic resin, PHF0.35, PAHF0.35.WV, PHF0.50 and PAHF0.35.WV.
Chemical ElementConcentration of Chemical Element in mg/g of Adsorbent
Anionic ResinPHF0.35PAHF0.35.WVPHF0.50PAHF0.50.WV
Aluminum 0.008----
Antimony-----
Arsenic-----
Barium0.001----
Boron-----
Cadmium -----
Calcium0.099----
Chrome-----
Cobalt-----
Copper0.006----
Iron0.1070.6020.1181.5280.305
Lead-----
Lithium-----
Magnesium0.016----
Manganese0.002----
Molybdenum-----
Nickel0.005----
Potassium-----
Selenium0.009----
Silver-----
Sodium0.006----
Strontium-----
Tin-----
Vanadium-----
Zinc-----
Table 4. Quantification of acidic and basic groups by Boehm method.
AdsorbentBasic Groups (mmol/g)Acid Groups (mmol/g)
CarboxylsPhenolicsLactonicTotal
PAHF0.35.WV0.440.21--0.21
PAHF0.50.WV0.42 0.380.02-0.40
Table 5. Influence of pH on DCF adsorption by PAHF0.35.WV and PAHF0.50.WV adsorbents.
pHqe (mg/g)
PAHF0.35.WVPAHF0.50.WV
6.017.6814.91
8.014.7912.03
1013.1110.97
Table 6. BPA adsorption kinetic parameters by adsorbents PAHF0.35.WV and PAHF0.50.WV.
Adsorbentqeexp (mg/g)Pseudo-First-OrderPseudo-Second-Order
PAHF0.35.WV8.86qecal (mg/g)8.45 ± 0.241qecal (mg/g)9.24 ± 0.220
k1 (L/mg)0.014 ± 0.002k2 (L/mg)0.002 ± 0.000
R20.967R20.986
χ20.379χ20.181
PAHF0.50.WV8.81qeexpl (mg/g)8.41 ± 0.288qeexp (mg/g)8.95 ± 0.267
k1 (L/mg)0.016 ± 0.003k2 (L/mg)0.003 ± 0.001
R20.942R20.969
χ20.553χ20.291
Table 7. Kinetic parameters of adsorption of DCF by adsorbents PAHF0.35.WV and PAHF0.50.WV.
Adsorbentqeexp (mg/g)Pseudo-First-OrderPseudo-Second-Order
PAHF0.35.WV5.018qecal (mg/g)5.011 ± 0.177qecal (mg/g)5.469 ± 0.156
k1 (L/mg)0.0075 ± 0.0011k2 (L/mg)0.0021 ± 0.0003
R20.958R20.982
χ20.167χ20.071
PAHF0.50.WV6.069qeexpl (mg/g)5.655 ± 0.192 qeexp (mg/g)6.260 ± 0.149
k1 (L/mg)0.0098 ± 0.0016k2 (L/mg)0.0020 ± 0.0003
R20.952R20.985
χ20.246χ20.077
Table 8. Parameters of Langmuir, Freundlich and Redlich–Peterson models in adsorption of BPA by PAHF0.35.WV and PAHF0.50.WV adsorbents.
Adsorbent
ModelParametersPAHF0.35.WVPAHF0.50.WV
Langmuirqmax (mg/g)24.52 ± 0.8223.34 ± 0.71
kL (L/mg)0.721 ± 0.1350.620 ± 0.104
RL0.029 to 1 0.040 to 1
R20.9850.988
χ21.531.049
FreundlichkF (mg/g) (L/mg)n11.29 ± 0.7210.45 ± 0.56
n4.33 ± 0.4114.26 ± 0.329
1/n0.2310.235
R20.9890.993
χ21.1500.666
Redlich–PetersonkRP (L/g)34.56 ± 10.9629.86 ± 1.50
aRP (mg/L)−g2.19 ± 0.9342.05 ± 0.138
g0.866 ± 0.0350.860 ± 0.005
R20.9970.999
χ20.4080.009
Table 12. DCF concentration detected in river water samples.
AdsorbentDCF Concentration (ng/g)Reference
Rivers in the state of Sao Paulo, Brazil0.76–3.93[67]
Yangtze River, China4.94[68]
Northern region of the Antarctic Peninsula7761[65]
Rivers in México258–1398[69]
Rivers in Malaysia4.92–15.49[70]
Table 13. Biomass concentration of microalgae R. subcapitata for each exposure evaluated.
SampleInitial Concentration of
Algae (cells/mL)
Average Final Concentration of Algae (cells/mL)
Positive control1 × 1046.54 × 104 ± 86.67
Negative control2.11 × 105 ± 51.11
PAHF0.35.WV1.97 × 105 ± 126.67
PAHF0.50.WV1.91 × 105 ± 124.44
Disclaimer/Publisher’s Note: The statements, opinions and data contained in all publications are solely those of the individual author(s) and contributor(s) and not of MDPI and/or the editor(s). MDPI and/or the editor(s) disclaim responsibility for any injury to people or property resulting from any ideas, methods, instructions or products referred to in the content.