3.3.1. Adsorption Efficiency of Produced Adsorbents
The polymeric adsorbents were evaluated in the adsorption of BPA and DCF. The performance in the adsorption capacity of the adsorbents for each chemical compound is shown in
Figure 6. The tests were performed under natural pH conditions, being 5.2 for the BPA solution and 5.8 for the DCF solution and using an adsorption time of 24 h.
The polymeric activated hydrochars PAHF0.35.WV and PAHF0.50.WV showed similar performance in the adsorption of contaminants. As discussed in
Section 3.2.1, compared to the other adsorbents, PAHF0.35.WV and PAH0.50.WV were the materials with the highest specific surface area values. Thus, the results suggest that the surface area factor positively influences the adsorption process.
For the activated hydrochars considering the occluded water, a poor adsorptive performance was observed for both CECs when compared to samples activated with water vapor. In addition to the low specific surface area, both adsorbents showed a surface poor in functional groups when compared to adsorbents. These factors may have impaired the adsorption processes of the samples.
Polymeric hydrochars PHF0.35 and PHF0.50 were the adsorbents with the lowest specific surface area but with a surface rich in functional groups. However, BPA adsorption capacities were low when compared to the PAHF0.35.WV and PAHF0.50.WV samples. In this case, the specific surface area exerted greater influence on the adsorption process when compared to the surface functional groups.
In the adsorption of DCF, both samples showed higher values of adsorption capacity. However, the occurrence of DCF precipitation was observed. The final pH of the medium was equal to 4.5 for the solution containing HPF0.35 and 5.3 for the solution with HPF0.50. The pKa of DCF was equal to 4.2, and for pH values lower than or close to pKa, the drug presents low solubility, promoting its precipitation [
45].
Refs. [
46,
47] also observed the occurrence of the precipitation of DCF in adsorption processes under conditions of pH < pKa of DCF. Thus, the values of 26.03 mg/g and 29.44 mg/g cannot be attributed only to the adsorption capacity of DCF by the adsorbents HPF0.35 and HPF0.50.
Considering the best results of the adsorption performance of contaminants, other tests were carried out using only samples of polymeric activated hydrochars PAHF0.35.WV and PAHF0.50.WV.
3.3.2. Influence of Initial pH and Point of Zero Charge (PCZ)
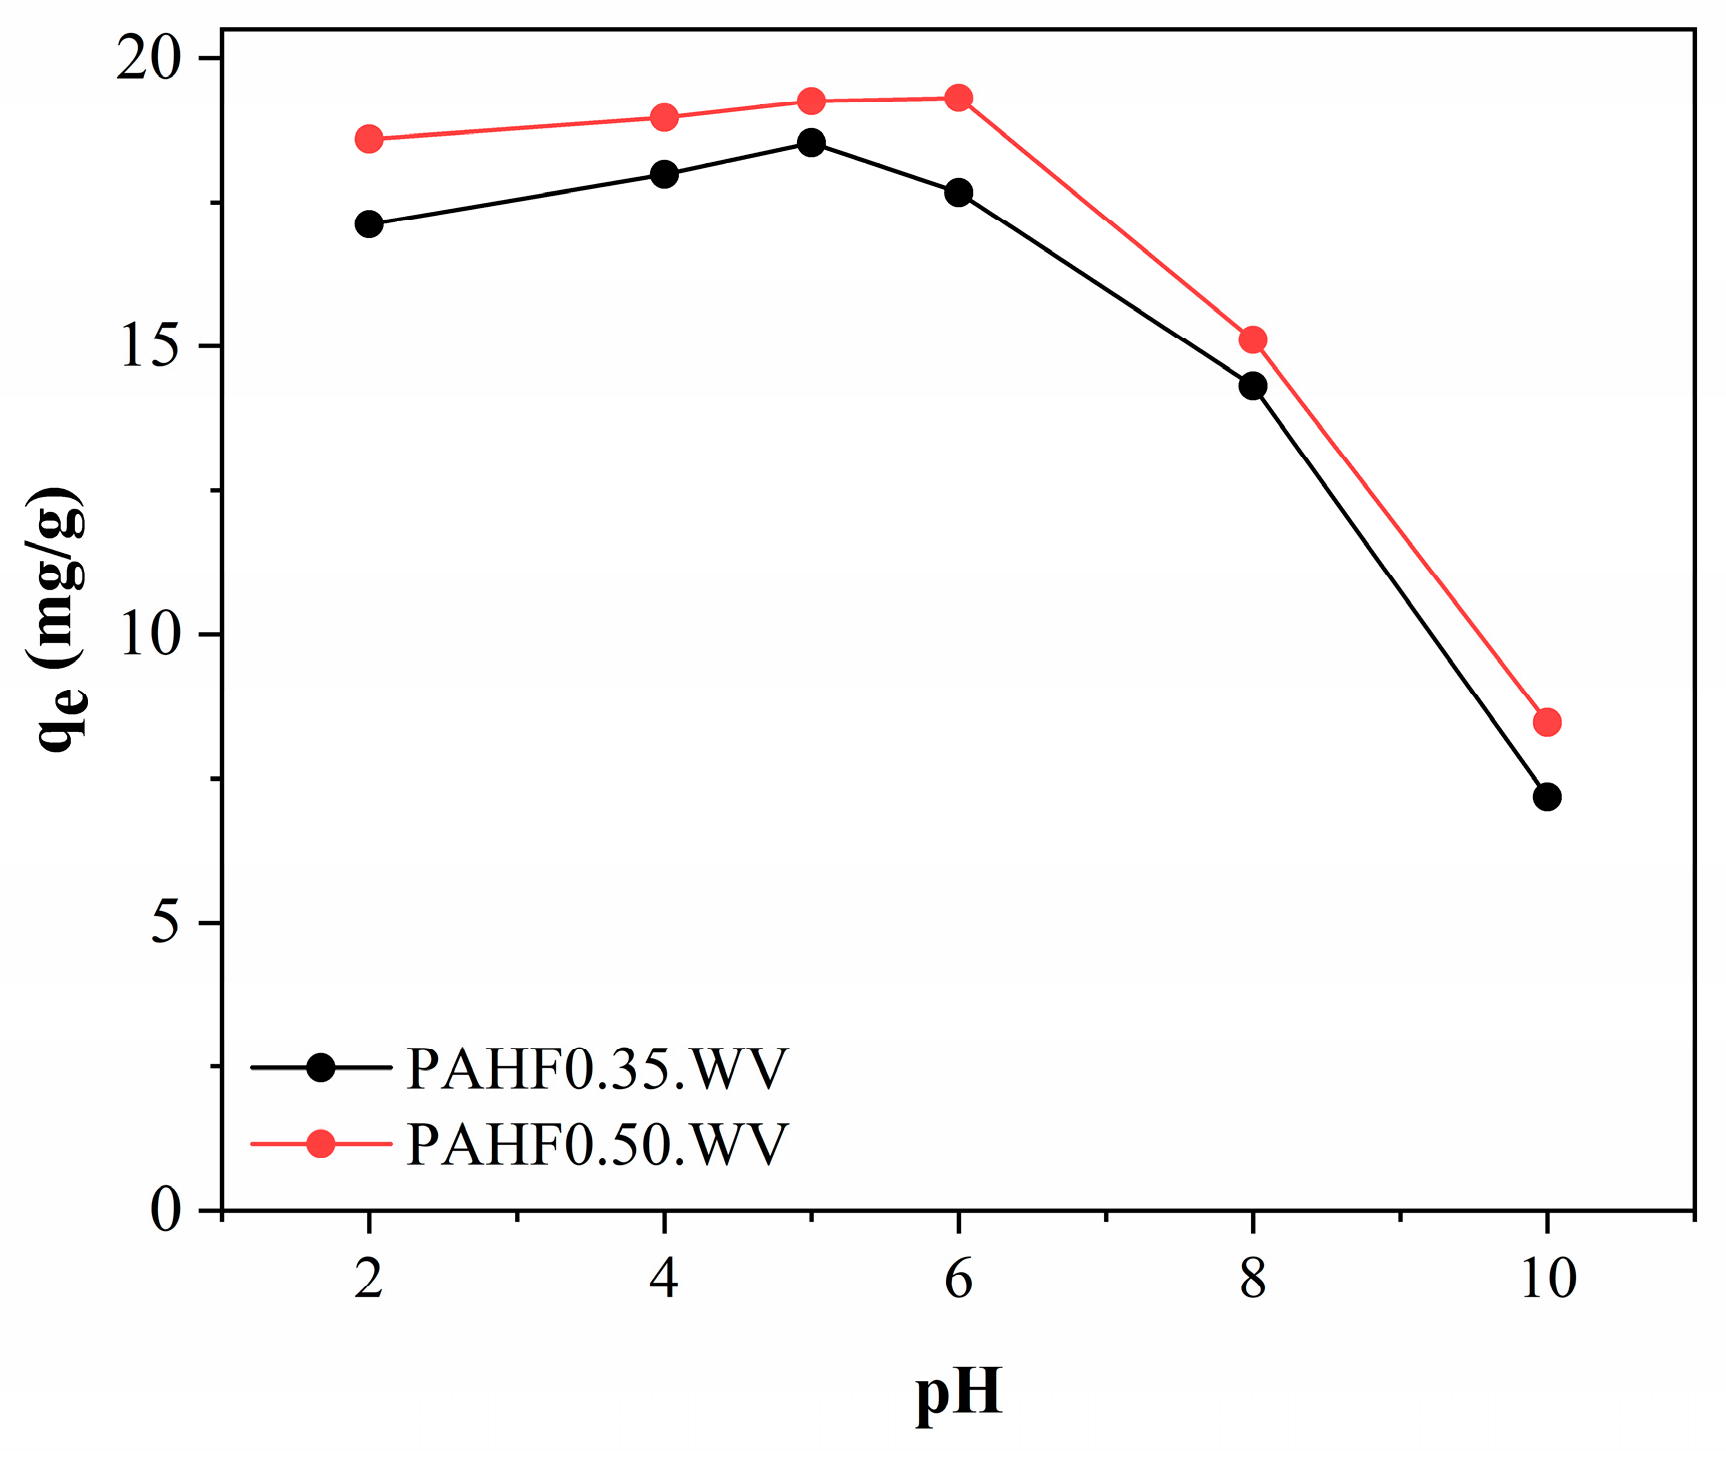
Figure 7 shows the influence of initial pH on the adsorption of BPA from activated polymeric hydrocarbons.
As can be seen, under pH conditions between 2.0 and 6.0, the polymeric activated hydrochars showed little variation in BPA adsorption capacity, which varied between 17 and 19 mg/g. At pH 8.0, a reduction to 14.31 mg/g for the PAHF0.35.WV sample and 15.11 mg/g for the PAHF0.50.WV sample was observed in the adsorption capacities. At pH 10, the adsorbents PAHF0.35.WV and PAHF0.50.WV had a higher reduction in adsorption capacities, reaching 7.19 mg/g and 8.47 mg/g, respectively.
Ref. [
48] also observed similar behavior. The authors tested the adsorption of BPA by organoclay under different pH conditions. The adsorption capacity of the material was constant in the pH range from 4.0 to 8.0, and at pH 10, the authors observed a reduction in the adsorption capacity.
The pH of the medium influences both the adsorbent and the adsorbate, due to the charge density, which can be understood from the pH
PCZ study [
49]. As shown in
Figure 8, the polymeric activated hydrochars showed pH
PCZ values equal to 6.0 for PAHF0.35.WV and 5.8 for PAHF0.50.WV. For pH values above pH
PCZ, the adsorbents have negative surface charges, and when the pH of the medium is lower than pH
PCZ, the adsorbent surfaces are charged with positive charges.
Adsorbates can occur under different chemical species depending on the pH of the medium. BPA is inseparable when the pH of the medium is less than 8.0 and its molecules are in the neutral species [
50]. In this case, the surface charges of the adsorbents tend not to influence the adsorption process.
For pH values above 8.0, the deprotonation of BPA molecules occurs (pKa = 9.8), which dissociates and forms BPA
− anions [
50]. Consequently, charge repulsion occurs between the adsorbate and the adsorbents, which also have negative surface charges due to the pH of the medium being higher than the values of pH
PCZ.
For DCF, the effect of the initial pH on the adsorption process was evaluated only for the values of pH 6.0, 8.0 and 10 due to the precipitation of the drug at a pH close to the pKa of the molecule. The results are shown in
Table 5.
It is observed that under the condition of pH 6.0, the adsorbents showed greater adsorption capacities. At this pH, polymeric activated hydrochars tend to have a neutral surface. Already at pH 8.0 and 10, the adsorbents have negative surface charges, which may have resulted in a reduction in the adsorption capacity of DCF. In the evaluated pH range, DCF occurs in the anionic species (pH > pKa) [
45], resulting in charge repulsion between the adsorbate and the adsorbents. Ref. [
51] observed similar behavior in the study of the adsorption of DCF by activated carbon produced from the fruit of
Ficus sycomorus.
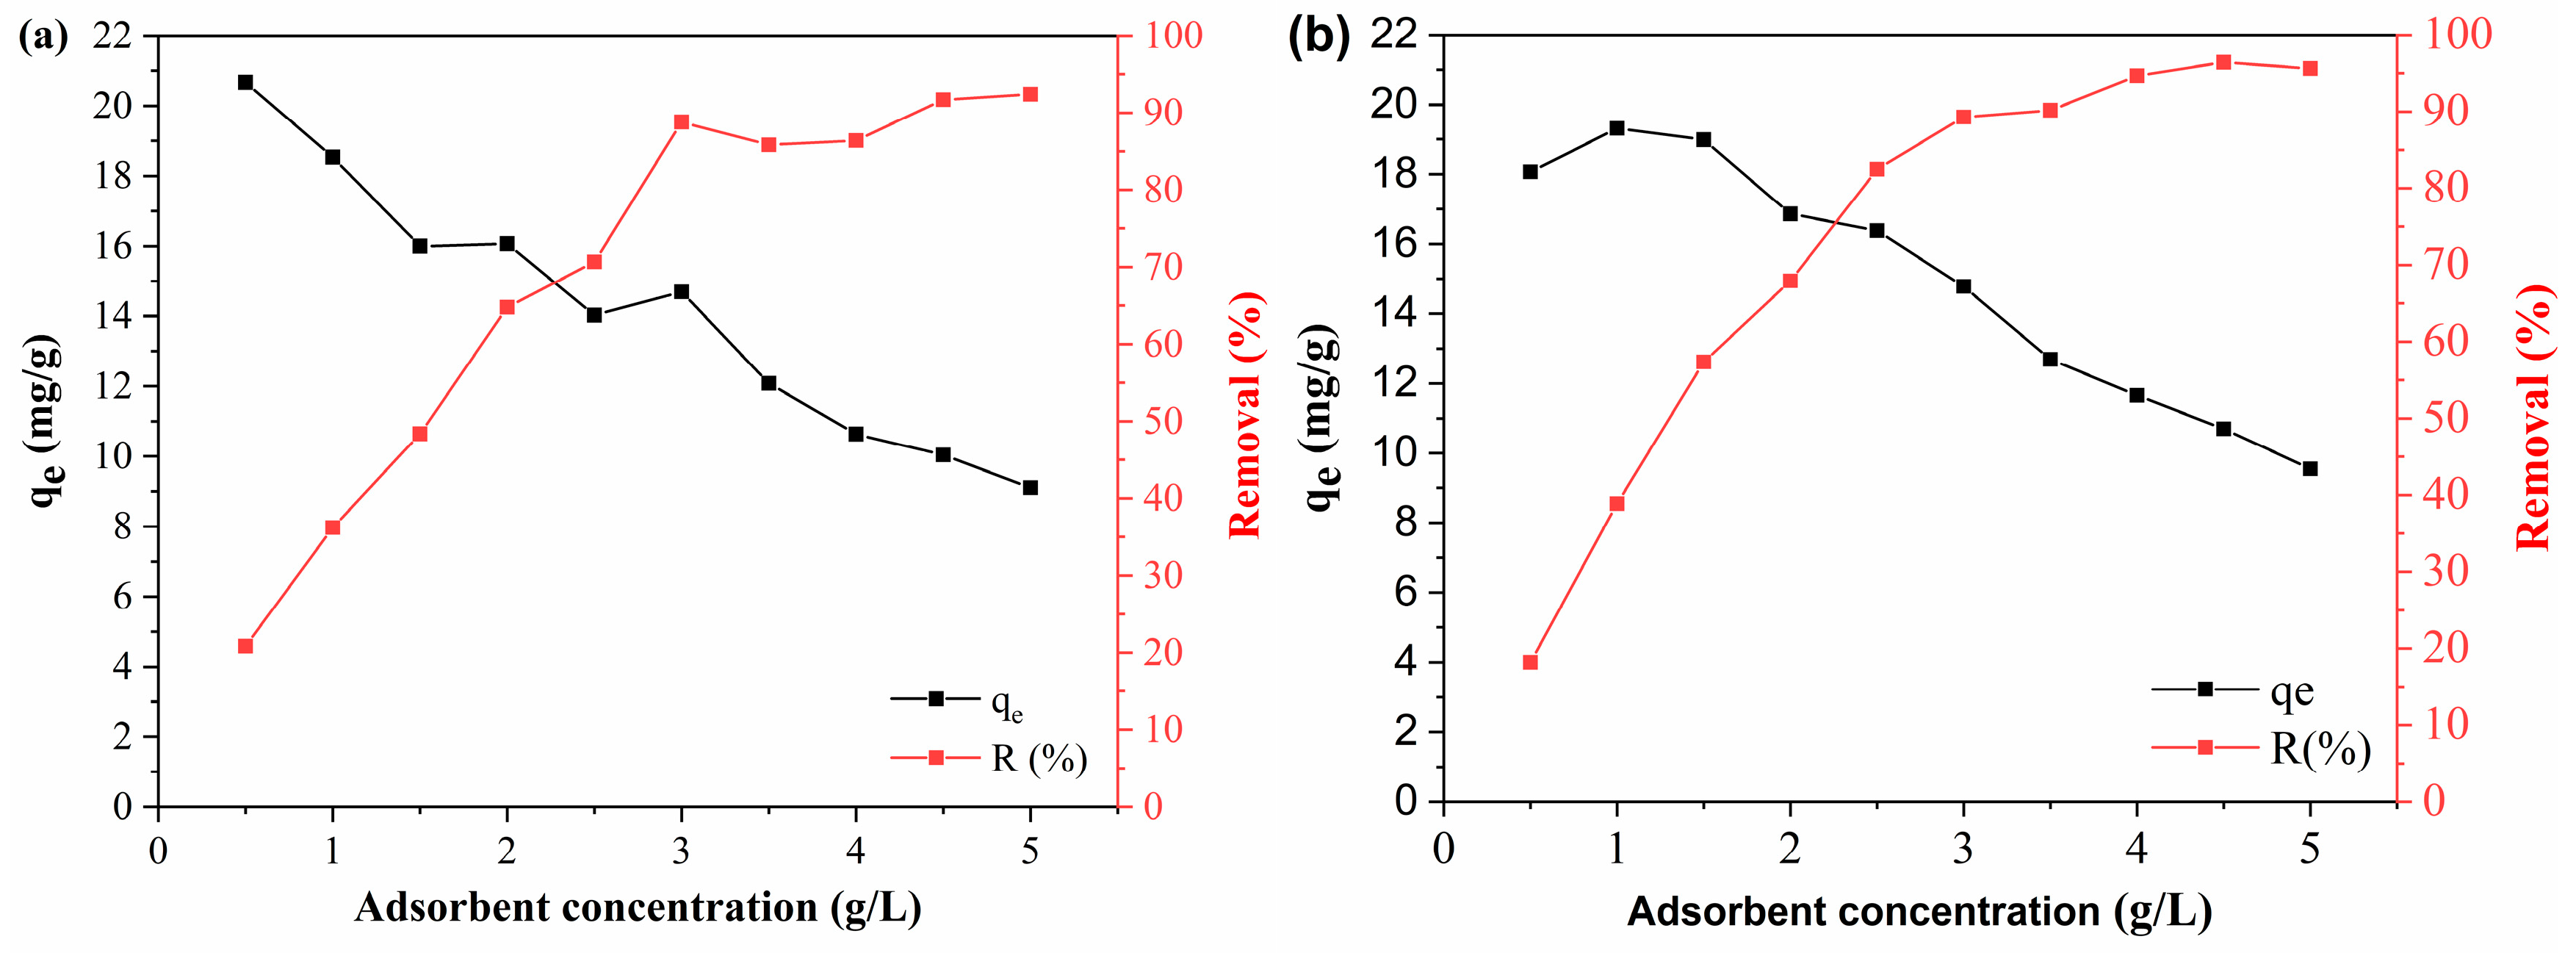
3.3.3. Influence of Adsorbent Concentration
BPA and DCF adsorption tests were performed by varying the adsorbent concentration from 0.5 to 5 g/L depending on the adsorption capacity (q
e, mg/g) and removal efficiency (R, %). The BPA and DCF adsorption results are shown in
Figure 9 and
Figure 10, respectively.
As shown in
Figure 9, the efficiency and adsorption capacity showed an inverse behavior with an increasing dosage of adsorbents. The polymeric activated hydrochar PAHF0.35.WV showed a BPA adsorption capacity of 20.67 mg/g at a concentration of 0.5 g/L. As the adsorbent concentration was increased, the adsorption capacity was reduced, which was 9.10 mg/g at a dosage of 5 g/L of adsorbent. The removal efficiency was 20.82% for 0.5 g/L of PAHF0.35.WV and 92.41 g/L for a concentration of 5 g/L of adsorbent.
For the PAHF0.50.WV adsorbent, the adsorption capacity of BPA reduced from 18.07 mg/g to 9.55 mg/g, and the removal efficiency went from 18.19% to 95.59% with an increasing dosage of polymeric activated hydrochar.
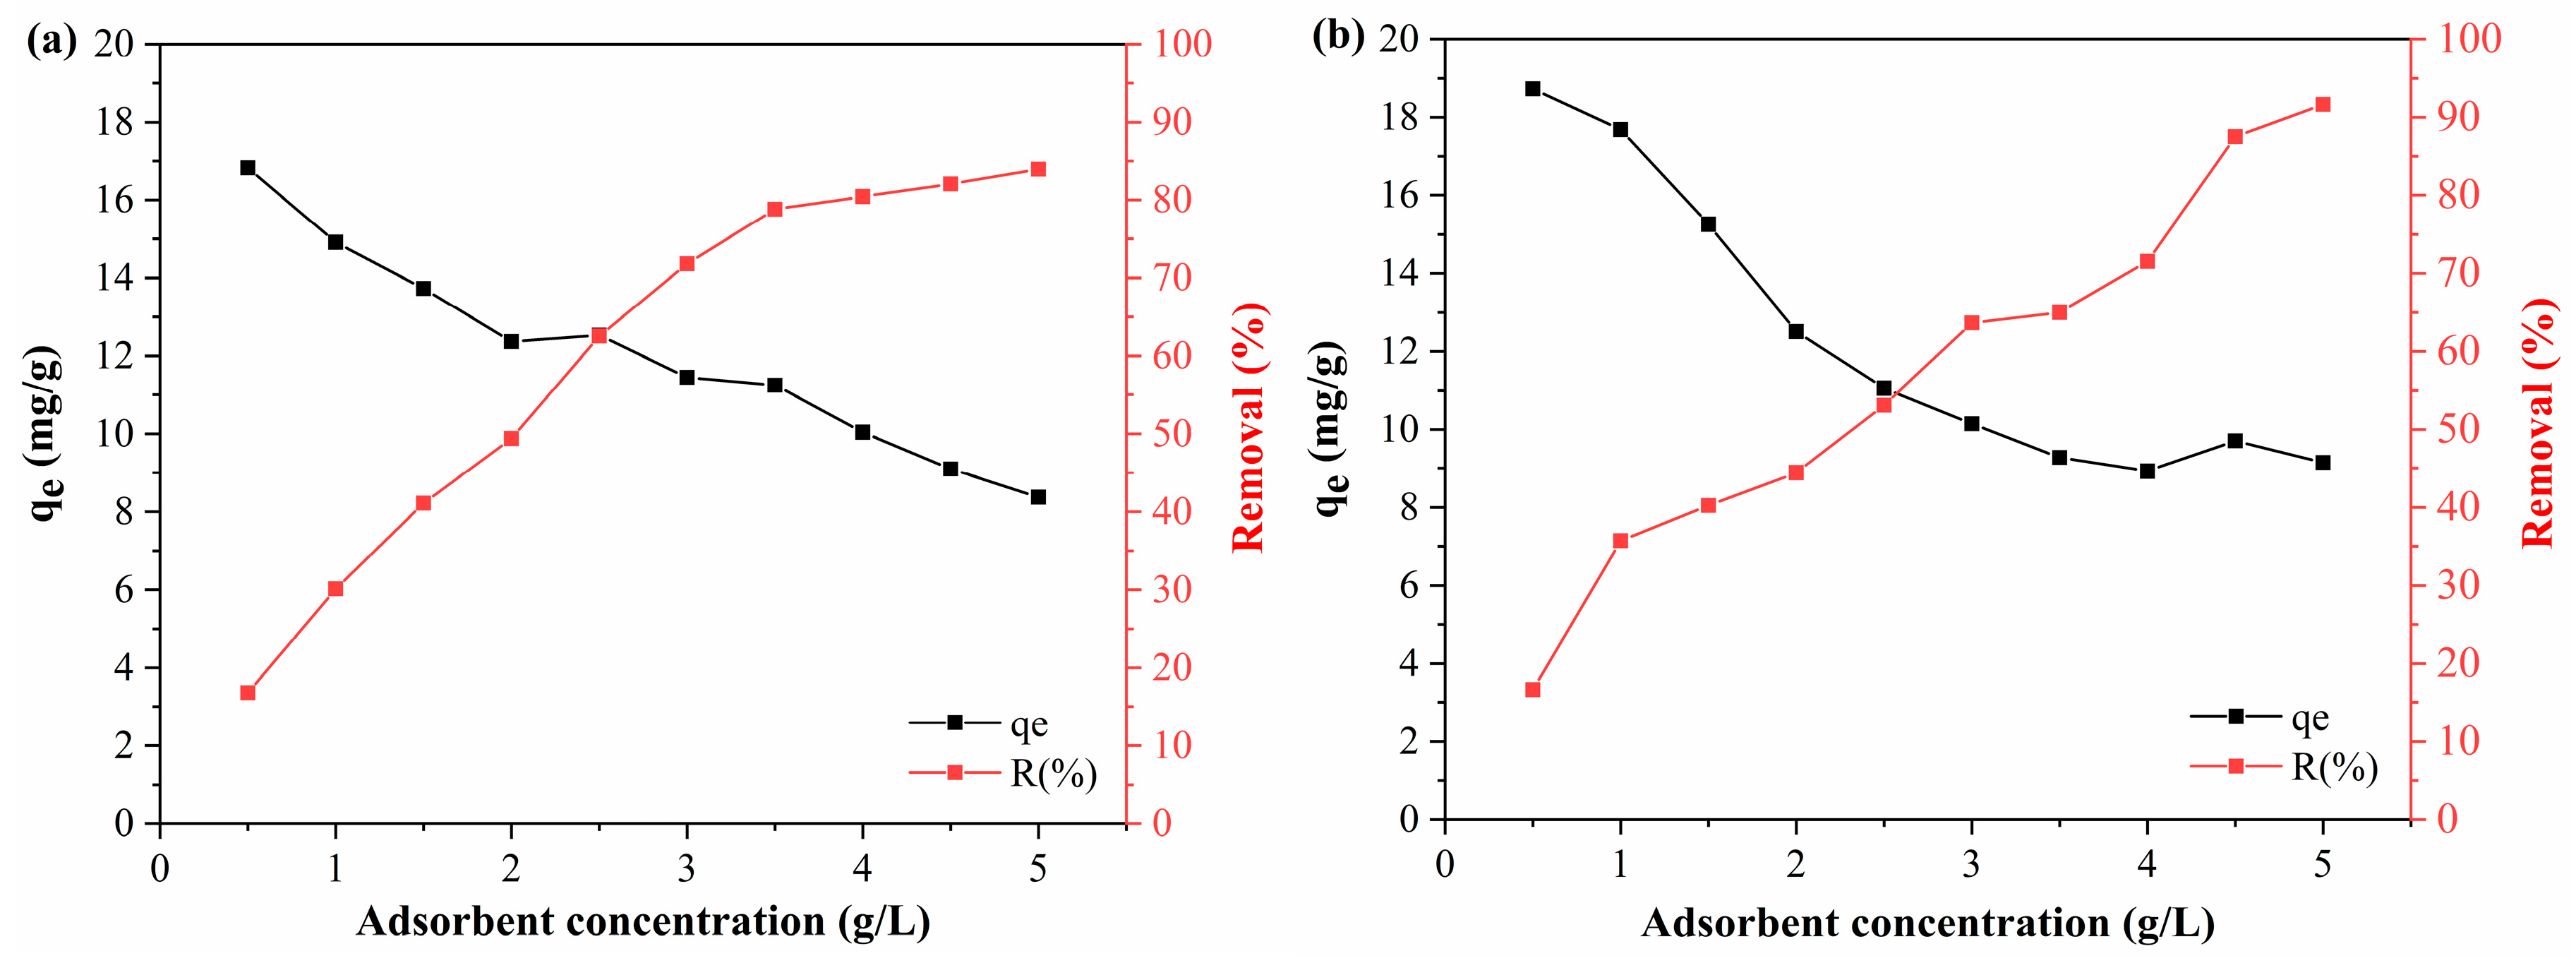
The DCF adsorption tests showed similar behavior (
Figure 10), and the performance of the activated polymeric hydrocarbons was close to their performance in the adsorption of BPA. With the increase in the PAHF0.35.WV concentration, the DCF adsorption capacity of the material reduced from 18.72 mg/g to 9.15 mg/g, and the removal efficiency increased from 16.63% to 91.62%. As for PAHF0.50.WV, the adsorption capacity with 0.5 g/L of adsorbent was 16.82 mg/g and reduced to 8.38 mg/g at the highest dosage of polymeric activated hydrochar. Its removal efficiency increased from 16.79% to 83.92%.
This is because increasing the adsorbent dosage results in a greater availability of specific surface area. As the adsorbent concentration is increased, BPA and DCF molecules quickly occupy the surface area sites of the polymeric activated hydrochars, favoring the efficiency of contaminant removal. However, with rapid adsorption, the innermost sites become unavailable, and the adsorption capacity is reduced [
52]. Similar behavior was reported by [
53,
54] on the adsorption of BPA and by [
55] on the adsorption of DCF. Thus, the optimum adsorbent dosage, both for PAHF0.35.WV and PAHF0.50.WV, was 2.5 g/L for BPA adsorption and 2.5 g/L for DCF adsorption.
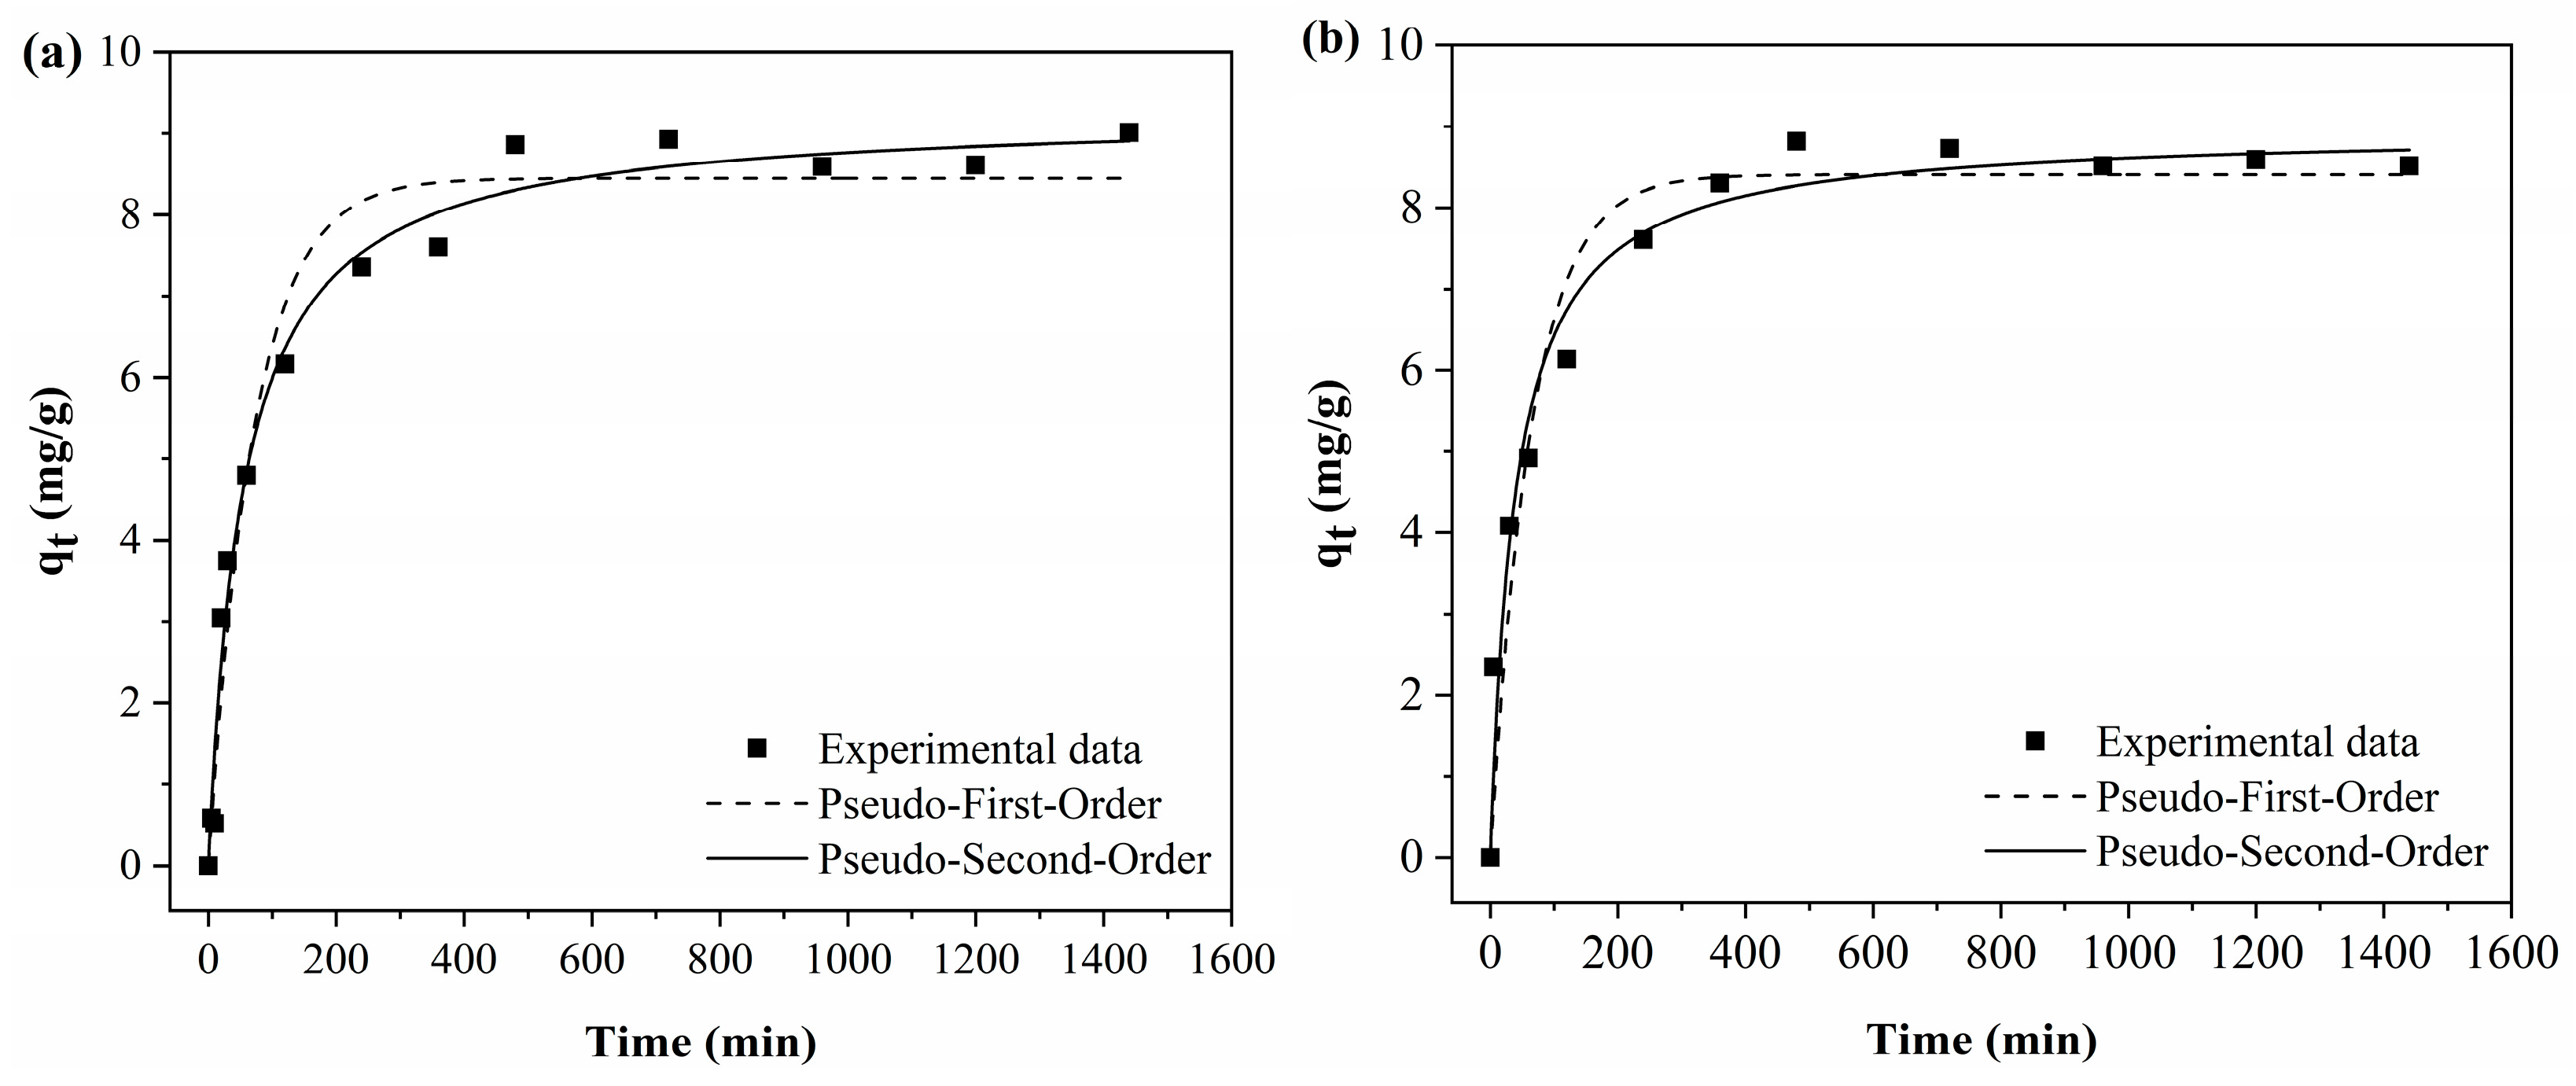
3.3.4. Adsorption Kinetics
Figure 11 shows the adjustments of the curves to the experimental data of the adsorption kinetic tests using the pseudo-first-order and pseudo-second-order models.
As can be seen in
Figure 11, for both polymeric activated hydrochars, the BPA adsorption capacity increases with time until reaching the equilibrium point. For both PAHF0.35.WV and PAHF0.50.WV, the equilibrium of the adsorption process occurs around 8 h.
In BPA adsorption, the reaction is fast in the first 60 min, and after this time, the process occurs more slowly until equilibrium is reached. This occurs because at the beginning of the process, there is a greater availability of specific surface area, and BPA molecules quickly occupy the adsorption sites. The process becomes slower as the sites are occupied, and the availability of specific surface area is smaller. When the adsorbent surface is saturated, the process reaches equilibrium [
56].
Table 6 presents the parameters obtained from data fitting. Under the experimental conditions evaluated, the polymeric activated hydrochars showed values close to the adsorption capacity, which was equal to 8.86 mg/g for PAHF0.35.WV and 8.81 mg/g for PAHF0.50.WA. The pseudo-second-order model presented the best fit to the experimental data (highest R
2 value and lowest chi-square value) for the two adsorbents studied.
As shown in
Figure 12, the DCF adsorption process was faster in the first hour of the experiment. However, the adsorption reached equilibrium after 16 h of adsorption, which characterizes it as a slower adsorption when compared to the adsorption of BPA.
Table 7 presents the parameters of the adjustments of the kinetic models to the experimental data in the adsorption of DCF.
Compared to BPA, polymeric activated hydrochars showed worse performance in DFC adsorption. The drug adsorption capacity for PAHF0.35.WV was 5.02 mg/g and 6.07 mg/g for PAHF0.50.WV, which were close to the adsorption capacities calculated by the kinetic models.
The pseudo-second-order model presented the best fit of the curves to the experimental data. Thus, for both PAHF0.35.WV and PAHF0.50.WV, the adsorption processes of BPA and DFC can be explained by pseudo-second-order kinetics.
The model suggests that the adsorption process occurs by chemisorption, with electron sharing between the adsorbate and the adsorbent. And as the adsorbate molecules occupy the active sites of the adsorbents, the formation of monolayers occurs [
57].
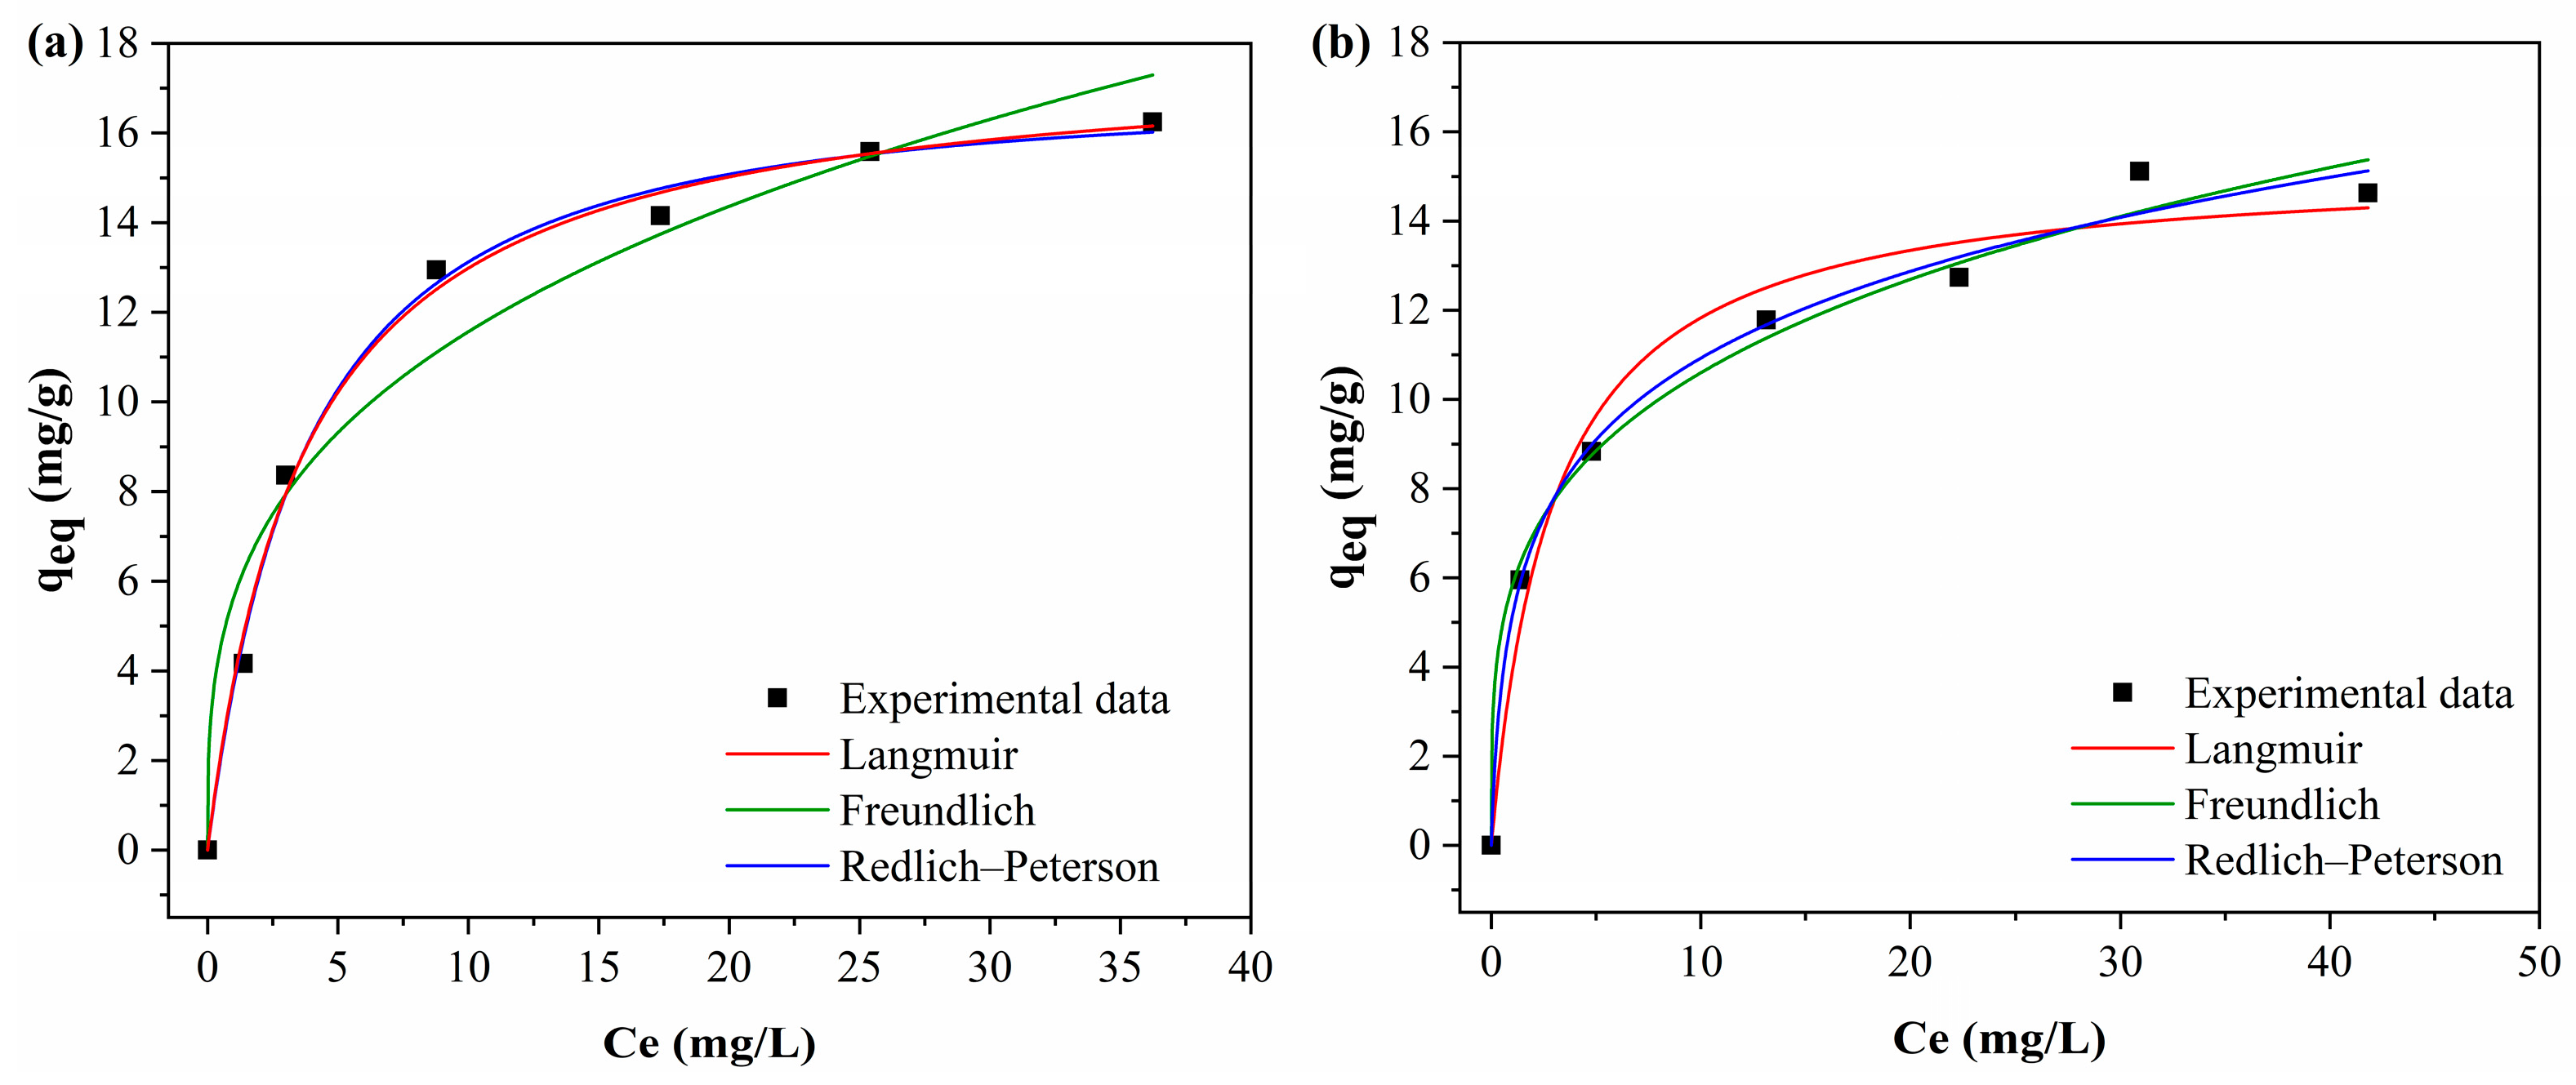
3.3.5. Adsorption Isotherms
Figure 13 shows the fitted of the curves of the Langmuir, Freundlich and Redlich–Peterson isotherm models to the experimental data.
Table 8 presents the isotherm models in the adsorption of BPA by the adsorbents.
The Freundlich model presented the best fit of the curve to the experimental data, with higher R2 values. The R2 values were 0.989 for PAHF0.35.WV and 0.993 for PAHF0.50.WV. In addition, the Freundlich model also presented the lowest chi-square values when compared to the Langmuir model. The Freundlich n values for both adsorbents ranged from 1 to 10, indicating a favorable isotherm.
The Redlich–Peterson model includes features of the Langmuir and Freundlich models. For this reason, this model can be applied to homogeneous and heterogeneous systems [
33]. The Redlich–Peterson equation was applied to confirm whether the adsorption data were adequately explained by the Langmuir or Freundlich model. The Redlich–Peterson R
2 values were 0.997 and 0.999, which are close to 1 and indicate that the Redlich–Peterson model was applied correctly.
The model variables k
F and a
kP are greater than 1. This is an indication that the Freundlich isotherm is the one that best explains the adsorption process. The premises of the Freundlich model are that adsorption occurs in multilayers and the adsorbent has a heterogeneous surface with an exponential distribution of energy in the different types of adsorption sites [
31,
32].
As shown in
Table 9, the Langmuir model also showed significant R
2 values, 0.985 for PAHF0.35.WV and 0.988 for PAHF0.50.WV. Although the main mechanism of BPA adsorption is multilayered, it is possible that the process also occurs, to a lesser extent, via the mechanism of the Langmuir model with monolayer adsorption [
10]. By the Langmuir model, the maximum adsorption capacity of PAHF0.35.WV was equal to 24.52 mg/g, and that of PAHF0.50.WV was 23.34 mg/g.
The literature includes studies of BPA adsorption by commercial polymeric resins. However, no studies were found with alternative adsorbents of polymeric origin such as hydrochar, activated hydrochar or activated carbon, for example.
Table 10 shows a comparison of the maximum adsorption capacity in relation to the specific surface area by the polymeric materials reported in the literature. The adsorbents produced in this study are also listed in
Table 9. It is observed that the activated hydrocarbons PAHF0.35.WV and PAHF0.50.WV have a greater adsorption capacity for BPA when compared to other studies.
Table 9.
A comparison of the adsorptive performance of PAHF0.35.WV and PAHF0.50.WV and adsorbents from other studies available in the literature.
Table 9.
A comparison of the adsorptive performance of PAHF0.35.WV and PAHF0.50.WV and adsorbents from other studies available in the literature.
| Adsorbent | Specific Surface Area (m2/g) | qmax (mg/g) | Reference |
|---|
| Thermosensitive non-imprinted polymers (T-NIPs) | 28.75 | 1.22 | [58] |
| Thermosensitive molecular printing polymers (T-MIPs) | 80.55 | 5.03 | [58] |
| Polymeric resin (styrene–divinylbenzene) Diaion SP825 | 1000 | 8.83 | [59] |
| Amberlite XAD-7 resin impregnated with Aliquat-336 | 62.40 | 10.86 | [60] |
| Poly(chloromethylstyrene) resin modified by porous β-cyclodextrin cross-linked polymer | 34.05 | 8.42 | [61] |
| Amberlite XAD-1180 polymeric resin impregnated with trioctylamine | 500 | 4.40 | [62] |
| PAHF0.35.WV | 223.60 | 24.52 | This study |
| PAHF0.50.WV | 217.20 | 23.34 | This study |
The fits of the Langmuir, Freundlich and Redlich–Peterson models to the experimental DCF adsorption isotherm data are presented in
Figure 14, and the model parameters are presented in
Table 10.
Table 10.
The parameters of the Langmuir, Freundlich and Redlich–Peterson models for the adsorbents PAHF0.35.WV and PAHF0.50.WV in the adsorption of DCF.
Table 10.
The parameters of the Langmuir, Freundlich and Redlich–Peterson models for the adsorbents PAHF0.35.WV and PAHF0.50.WV in the adsorption of DCF.
| | | Adsorbent | |
|---|
| Model | Parameters | PAHF0.35.WV | PAHF0.50.WV |
|---|
| | qmax (mg/g) | 17.82 ± 0.448 | 15.30 ± 0.738 |
| | kL (L/mg) | 0.269 ± 0.027 | 0.34 ± 0.082 |
| Langmuir | RL | 0.069 to 0.661 | 0.054 to 0.634 |
| | R2 | 0.995 | 0.978 |
| | χ2 | 0.211 | 0.821 |
| | | | |
| | kF (mg/g) (L/mg)n | 5.63 ± 0.864 | 5.82 ± 0.433 |
| | n | 3.20 ± 0.528 | 3.84 ± 0.354 |
| Freundlich | 1/n | 0.312 | 0.260 |
| | R2 | 0.961 | 0.989 |
| | χ2 | 1.819 | 0.358 |
| | | | |
| | kRP (L/g) | 4.49 ± 0.725 | 6.44 ± 0.468 |
| | aRP (mg/L)−g | 0.224 ± 0.091 | 2.20 ± 2.449 |
| Redlich–Peterson | g | 1.03 ± 0.072 | 0.805 ± 0.065 |
| | R2 | 0.996 | 0.992 |
| | χ2 | 0.249 | 0.345 |
Comparing the Langmuir and Freundlich parameters of the PAHF0.35.WV sample, the Langmuir model presented the highest R
2 value (0.995) and the lowest chi-squared value (0.211), while the Freundlich model presented an R
2 equal to 9.61 and chi-squared to 0.358. The Redlich–Peterson model confirmed the best fit by the Langmuir model when g tends to 1. Furthermore, the R
2 of 0.996 indicates that the model was properly applied. Thus, the adsorption data of DCF by activated hydrochar PAHF0.35.WV can be explained by the Langmuir isotherm. The model indicates that adsorption occurs with the formation of monolayers, with sites of equivalent energy, in which only one molecule is adsorbed, without interaction with other molecules [
63].
For PAHF0.50.WV, the Freundlich model presented a better fit of the curve to the experimental data when compared to the R2 and chi-square values of the Langmuir model. The Freundlich n variable was equal to 5.821 and was within the range of 1 to 10, which indicates that the adsorption isotherm is favorable.
The Redlich–Peterson model presented values of the variables k
F and a
kP greater than 1 and g close to 1, which confirms that the adsorption of DCF by PAHF0.50.WV is adequately explained by the Freundlich model. Thus, the data suggest that the adsorption of DCF by PAHF0.50.WV occurs with the formation of multilayers and with a heterogeneous surface with exponential energy distribution at the adsorption sites [
31,
32]. From the experimental data, as can be seen in
Figure 14b, the maximum adsorption capacity of PAHF0.50.WV was close to 15 mg/g.
The literature does not include studies on DCF adsorption using activated carbon or HTC adsorbents. However, some studies on drug adsorption from other polymeric materials were found, as shown in
Table 11.
A good adsorptive performance of DCF by the adsorbent produced by [
64] was observed, followed by that of the adsorbents used by [
65]. In contrast, the worst performance was observed in the study by [
66], who analyzed the adsorption of DCF by a commercial polymeric resin.
The material with the highest specific surface area was the one with the worst adsorptive performance, which may have occurred due to textural characteristics incompatible with the size of the DCF molecule; this was also due to the resin surface chemistry. However, this factor was not discussed by the authors.
Table 11.
DCF adsorption capacity of PAHF0.35.WV and PAHF0.50.WV adsorbents and respective specific surface areas compared to literature data.
Table 11.
DCF adsorption capacity of PAHF0.35.WV and PAHF0.50.WV adsorbents and respective specific surface areas compared to literature data.
| Adsorbent | Specific Surface Area (m2/g) | qmax (mg/g) | Reference |
|---|
| Molecularly imprinted polymer | No presented | 324.80 | [64] |
| Polymeric Resin SR5500 Resinex | 861 | 1.5 × 10⁻⁴ | [66] |
| Porous organic polymer based on diphenyl phosphate | 714 | 166 | [65] |
| Porous organic polymer based on 1,1,2,2-tetraphenylethylene | 581 | 217 | [65] |
| PAHF0.35.WV | 223.60 | 17.82 | This study |
| PAHF0.50.WV | 217.20 | 15 | This study |
In this study, the polymeric activated hydrochars produced showed a maximum adsorption capacity of 15 and 17.82 mg/g, with values close to the specific surface area. Compared with the studies by [
64,
65], activated hydrocarbons PAHF0.35.WV and PAHF0.50.WV showed worse DCF adsorption performance. However, the adsorption capacities were sufficient for the concentrations detected in surface waters in several cases, as shown in
Table 12.
As can be seen, studies report drug concentrations in the order of nanograms per liter of sample. All concentrations presented are compatible with the maximum adsorption capacities of the adsorbents produced in this study. In this way, it becomes unnecessary to develop materials with high values of specific surface area and adsorptive development due to the data shown in
Table 12.


