Article

Electro-Coloring Mechanism of Aluminum Anodic Oxides in Tin-Based Electrolytes

1
Department of Metallurgical and Materials Engineering, Istanbul Technical University, Istanbul 34469, Turkey
2
MacDermid Enthone Industrial Solutions, Tuzla KOSB, Istanbul 34953, Turkey
*
Author to whom correspondence should be addressed.
Coatings 2024, 14(5), 616; https://doi.org/10.3390/coatings14050616
Submission received: 8 April 2024 / Revised: 29 April 2024 / Accepted: 9 May 2024 / Published: 13 May 2024
(This article belongs to the Section Surface Characterization, Deposition and Modification)

Abstract

:
A method for accurately determining the chemical composition of deposits at the bottom of pores during the electrocoloring (e-coloring) of aluminum anodic oxide (AAO) layers in tin-based solutions is developed. The aluminum samples were AC e-colored after DC sulfuric anodization. Free-standing, tin e-colored aluminum oxide film was obtained by selective dissolution of the metallic aluminum from the AAO in copper chloride solution to access the deposit directly at the bottom of the pore. This allowed us to conduct XPS analysis directly on the deposits at pore bottoms without any interference from the base material or insulating barrier layer. The results revealed the presence of a mixture of tin oxide and metal in the deposits, which were richer in oxide content. Furthermore, a cyclic voltammetry experiment mimicking real polarization conditions during AC conditions was optimized and used to gain a deeper understanding of the electrochemical reactions that occur during AC electrocoloring. The comparison of CV results in tin-free and tin-containing electrolytes indicated that the tin deposited during a cathodic cycle is oxidized in the anodic cycle. The formation of tin-based deposits radically changed the CV behavior. The XPS and cyclic voltammetry results consistently show that the deposits formed during e-coloring comprised a mixture of metallic and oxidic tin species richer in oxide content.

Graphical Abstract

1. Introduction

Anodic oxidation (anodization) has been performed for the formation of oxide layers on the surface of a variety of metals and alloys such as Al, Ti, Hf, V, Mo, Mg, Co, and Sn [1,2,3]. Different metal oxides have various usage areas in the industry. Anodically formed cobalt oxides find applications in magnetic data storage devices, heterogeneous catalysts, lithium-ion battery materials, supercapacitors, and solid-state sensors [3]. Titanium oxides are widely used in biomedical applications, solar cells, and drug delivery due to their high corrosion resistance, biocompatibility, and photocatalytic activity [2]. It is well-known that the nature of an electrolyte used for anodization and voltage are key factors determining the morphology of oxides grown on the metal surface. In general, compact oxides are formed in mild electrolytes, while porous oxide layers are observed in moderately aggressive electrolytes having a moderate ability to dissolve oxide layers [1,2,3,4,5,6,7,8,9,10,11,12,13,14,15].
Among anodized metals, aluminum is the most widely used one with extensive applications in household goods, architectural, and automotive applications. Under ambient conditions, aluminum metal already has a very thin oxide film on its surface. However, the corrosion resistance of this oxide film needs to be improved since it is thin, inhomogeneous, and incoherent [4,5,6,7,8]. With the anodic oxidation process, a thick, homogenous, and protective oxide film can be grown on the aluminum surface with higher hardness, corrosion, and abrasion resistance. If the anodic aluminum oxide (AAO) film is formed in acidic electrolytes, the morphology of the resulting film will be highly porous. The thin, dense, and dielectric barrier layer is the first structure that forms on the surface, and it builds the basis for the growth of the porous layer [7,8,9]. The mechanism of pore formation is still a matter of discussion [5,6,7,8,9,10]. The morphology (pore dimensions and shape) of the AAO layer changes with the electrolyte type, applied voltage, current density, temperature, and process time [6,8].
Sulfuric acid is the most widely used electrolyte for producing AAO layers because of its low cost, speed, lower energy consumption, and pore structure suitability for further coloring. In addition, the porous nature of AAO layers makes them suitable for coloring using different methods that find extensive use in architectural and decorative applications. AAO layers can be colored with organic or inorganic dyes or by integral coloring. However, the most preferred coloring method is electrolytic (e-coloring) since it has an extended service life compared to the other methods while preserving the metallic texture of the substrate even after the coloring process [10,11,12,13,14,15,16,17,18,19,20,21,22,23,24,25,26,27,28,29].
Electrolytic coloring of AAO is generally carried out in an acidic solution that contains metal ions such as Ni, Co, Sn, and Cu. During the process of coloring, species are deposited in the AAO pores using AC/DC or pulse polarization. Today, the most common e-coloring electrolytes are tin-based and are realized by applying 10–20 V AC voltage on sulfuric acid anodized aluminum alloys. With this process, all shades of bronze to black colors can be obtained [8,9]. The mechanism of the electrolytic coloring of AAO and the chemical nature of the deposit in the pores has yet to be fully established [11,12,13,14,15,16,17,18,19,20,21,22,23,24,25]. Many studies in the literature are devoted to understanding the nature of the deposits that form in the AAO by using different e-coloring electrolytes and characterization techniques. In a variety of studies, the nature of the deposit is claimed to be colloidal or composed of nano-sized metallic particles [11,12,16,17,18,22,23,24,25,27,28]; there are also a limited number of studies that claim the presence of a mixture of metallic and oxidic species in the pores [13,14]. We found only two studies on the industrially most widely used tin-based e-coloring electrolytes. Cohen et al. analyzed the deposits in the AAO pores obtained in 20 g/L SnSO4 containing 5% H2SO4 at room temperature, using a 9 V, 50 Hz AC by Mössbauer spectroscopy, and concluded that pore deposits have a metallic character [26]. Jagminas et al. used voltammetry and chronoamperometry methods to determine the nature of deposits in AAO. They used tartaric acid solutions acidified with sulfuric acid (pH 0.9–1.1), varied the SnSO4 concentration between 0.025 and 0.4 M, and e-colored the AAO using 14–20 V AC (50 Hz). Their results showed that Me(OH)x-type structures were formed in the pore base [21].
As presented above, the characterization results obtained from different sources in the literature contradict each other. Since the nature of products within the pores defines the mechanism of e-coloring, a sound method is needed to determine the nature of deposits in the pores. Additionally, considering the high magnitude of positive and negative voltages applied and the possible local chemistry changes within the restricted volumes of pores during e-coloring, a discrete electrochemical method that can simulate the complex conditions during AC e-coloring is also required. In the literature, we found no electrochemical studies conducted under AC e-coloring conditions. Accordingly, this study aims to develop a sound method to determine the chemical nature of the deposits formed at pore bottoms and a reliable electrochemical method that can simulate the conditions during AC-coloring and intercorrelate the results to clarify the mechanism of e-coloring in tin-based electrolytes. To achieve these aims, we have used an original approach that allowed the determination of the chemistry of deposits formed at the bottom of AAO pores. After double anodizing aluminum in sulfuric acid, we colored the AAO in a tin-based e-coloring electrolyte. After hot sealing to plug the pores, metallic aluminum was selectively etched to produce a free-standing colored AAO layer. This method allowed us to determine the chemistry of the deposits at the pore bottom with XPS with minimum alteration of their nature after sputtering the thin barrier layer. The industrial e-coloring process in tin-based solutions is realized by using AC voltage (sinusoidal with 50–60 Hz frequency) in the range of 10–20 V. An original CV-based electrochemical method that can simulate these conditions and determine the anodic and cathodic polarization behavior of AAO under these complex conditions is developed. For this, we first validated the potential range and scan rate of CV measurements that allowed the coloring of AAO in tin-based solutions within the limits of the potentiostat used in the study, and then, by using the validated parameters, we determined the anodic and cathodic polarization behaviors of AAO in tin-ion-free and tin-ion-containing solutions that showed significant contributions of the presence of tin ions in the electrolyte. The findings of the CV experiments supported the results of the XPS experiments.

2. Materials and Methods

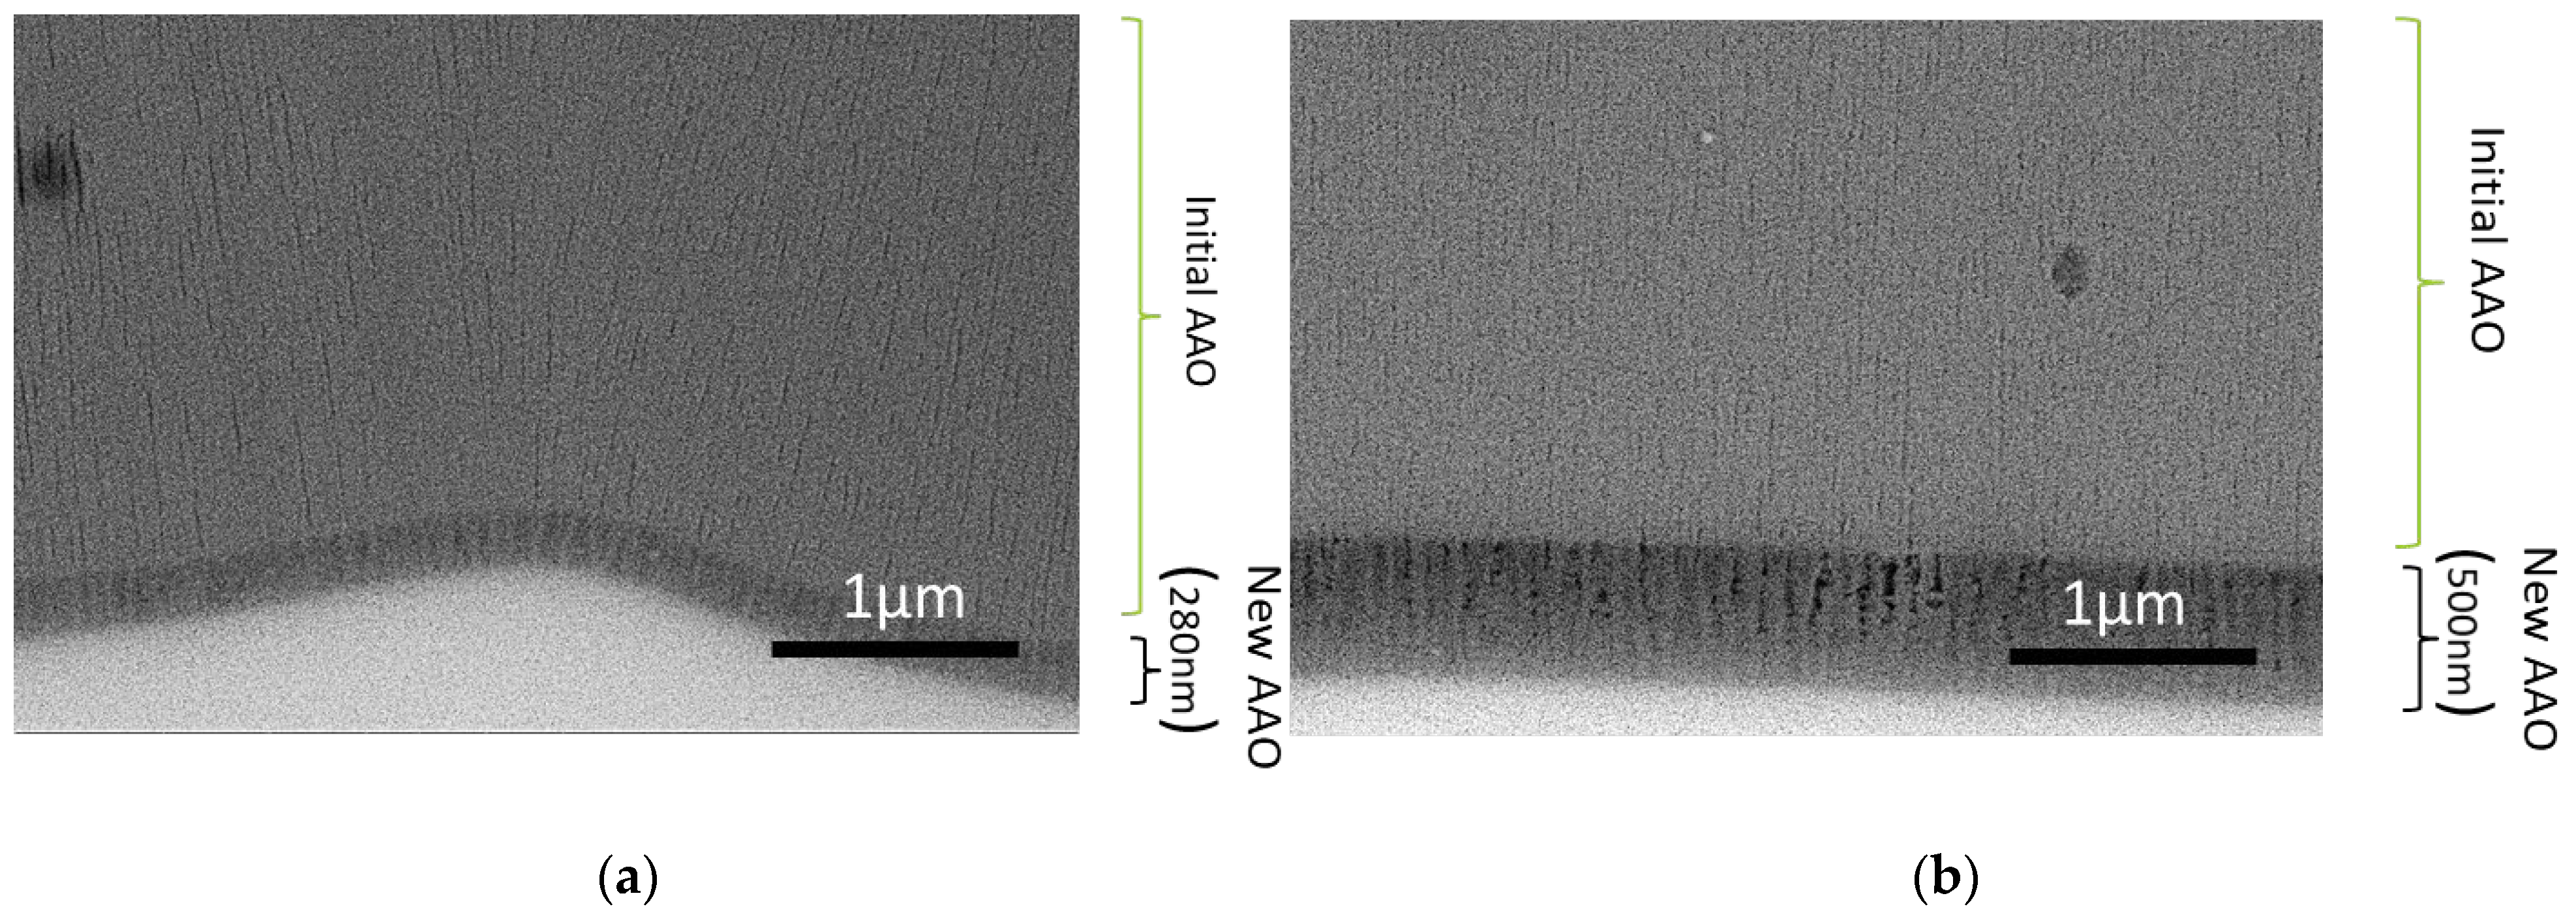
2.1. Preparation and Characterization of Free-Standing AAO Layers

Before anodization, high-purity aluminum sheets (99.995%, 0.7 mm-thick, GoodFellow, Cambridge, UK) were annealed at 450 ° C for 3 h to obtain the ordered nanostructure after two-step anodization [30,31]. Annealed samples (20 mm × 80 mm in size) were then electropolished in 80%v phosphoric and 20%v sulfuric acid solution at a constant voltage of 17 V for 5 min at 70 ° C . First, anodization was performed by applying 16 V DC at 19 ° C in a 1.7 M H2SO4 solution in a conventional two-electrode cell with an aluminum counter electrode for 30 min. After selectively dissolving the AAO layer in 0.25 M chromic acid solution at 70 ° C for 4 h, a second anodization step was performed under the same conditions. In these experiments, only one face of the aluminum was exposed to the anodization solution by masking the other surface with cellulosic lacquer. During this step, the anodization time was increased to obtain an AAO thickness of 40 µm. Increasing AAO thickness is crucial to obtaining a free-standing AAO layer after the selective dissolution of remnant metallic aluminum below the AAO layer.
Electro-coloring of pure aluminum (99.999%) was carried out in an Sn-based solution consisting of 0.1 M SnSO4, 0.2 M H2SO4, and 0.05 M sulfosalicylic acid as a stabilizer. The coloring time was kept between 10 and 12 min at an AC of 17 V. After the coloring process, samples were sealed in hot water to protect Sn species deposited at the bottom of the pores during the selective dissolution of metallic aluminum substrate. Self-standing AAO layers were produced by the selective dissolution of metallic aluminum in 3% CuCl2 solution after dissolving the lacquer layer in acetone, covering the metallic Al. By stripping, it became possible to obtain free-standing films ready to be analyzed by different techniques without the interfering effects of the base metal.
Reagent-grade chemicals (from Merck (Darmstadt, Germany) and Riedel (Toronto, ON, Canada)) were used in the experiments.
The structure and chemistry of the self-standing films were characterized using a JSM-7500F Field Emission Scanning Electron Microscope, JEOL, Tokyo, Japan, and XPS, respectively.
The XPS investigations were conducted using a K-Alpha X-ray Photoelectron Spectrometer (XPS) System (Thermo Scientific, Waltham, MA, USA) with a monochromatized Al K-alpha X-ray source. The binding energy scale was calibrated with respect to C1s (285 eV). Before the analyses, the barrier layer of free-standing film is removed with argon sputtering. A flood gun was also used to avoid valence state-changing problems associated with Ar etching. Casa XPS software Ver. 2.3.25 was used to deconvolute the spectra. Gaussian/Lorentzian functions and Shirley background were used during the XPS spectra deconvolution. The area ratios of doublets and the energy difference between the doublets were kept constant during deconvolution.

2.2. Electrochemical Investigation Methodology for the Determination of the Coloring Mechanism of AAO in Sn-Based E-Coloring Solutions

2.2.1. Preparation of AAO Films for E-Coloring

In these experiments, the most commonly anodized aluminum alloy (AA6063-T6) was used as the substrate to determine the e-coloring mechanism in Sn-based solutions. Their composition is specified in Table 1.
These alloys were anodized after alkaline etching in a sodium hydroxide solution (2.5 M solution of NaOH, 60 °C, 3 min) followed by 2 M of nitric-acid-based neutralization for 3 min. The AAO films with 11 ± 1 µm thicknesses were grown by applying 16 V DC at 19 ° C in a 1.7 M H2SO4 aqueous solution in a conventional two-electrode cell with an aluminum counter electrode. In all e-coloring experiments, the anodization parameters were kept constant.

2.2.2. CV-Controlled E-Coloring Experiments

In the industrial practice, e-coloring of AAO in Sn-based solutions is realized by using AC (frequency 50–60 Hz) voltage in the range of 10–20 V in an acidic solution consisting of 0.1–0.3 M SnSO4, 0.15–0.25 M H2SO4, and a stabilizer at room temperature (18–24 ° C ). Accordingly, very high scan rates and high potentials are required to simulate these parameters with a CV method. The high-rate CV experiment potential limit of the available potentiostat is +/−10 V, and the scan rate that can obtain reliable data collection results is 100 V/s. The potential limit of 10 V is sufficient for e-coloring [18,19,20,21,22,23,24]. On the other hand, in the case of frequency, a 10-fold decreased frequency can be obtained compared to 50 Hz. Thus, checking the possibility of e-coloring using these limit parameters became necessary.
Accordingly, the first experiments were conducted to determine the limits of the scan rate for e-coloring. A series of experiments with scan rates of 100 V/s and in the potential range of +/−10 V were realized in a three-electrode cell consisting of an Ag/AgCl reference electrode (Ag/Ag/Cl, +0.197 V/NHE), a graphite counter electrode, and the anodized aluminum working electrode.
After determining the suitability of the scan rate and potential range for e-coloring, time (cycle)-dependent CV experiments were conducted using SP-150 Potentiostat, Biologic, Besançon, France, in Sn-free and Sn-containing acidic solutions. Cycle-dependent changes in the morphology of the AAO layers were investigated using a JSM-7500F Field Emission Scanning Electron Microscope, JEOL, Japan.

3. Results and Discussion

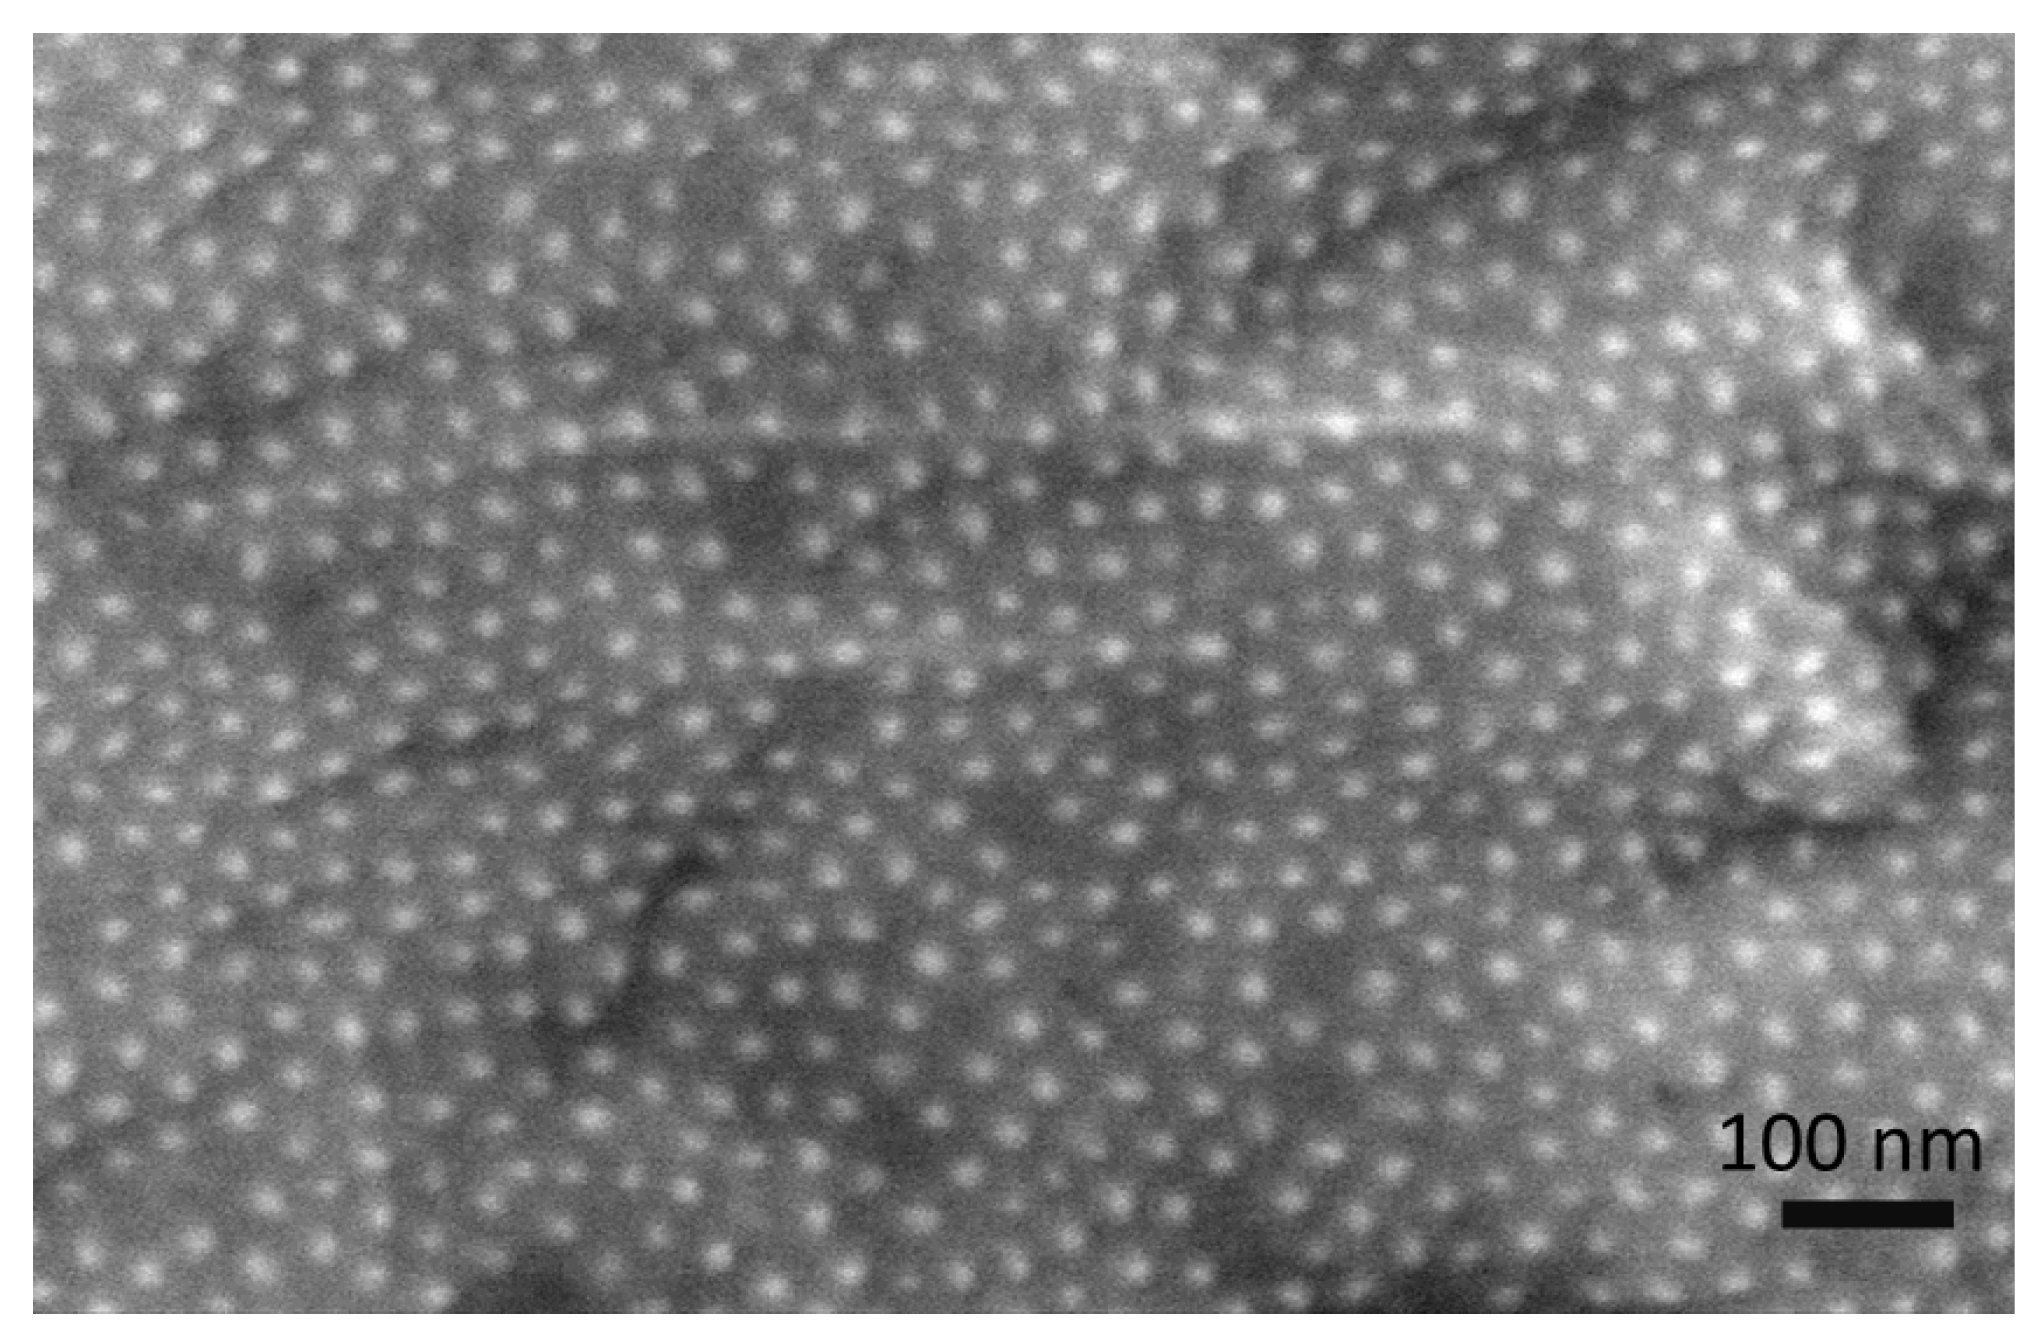
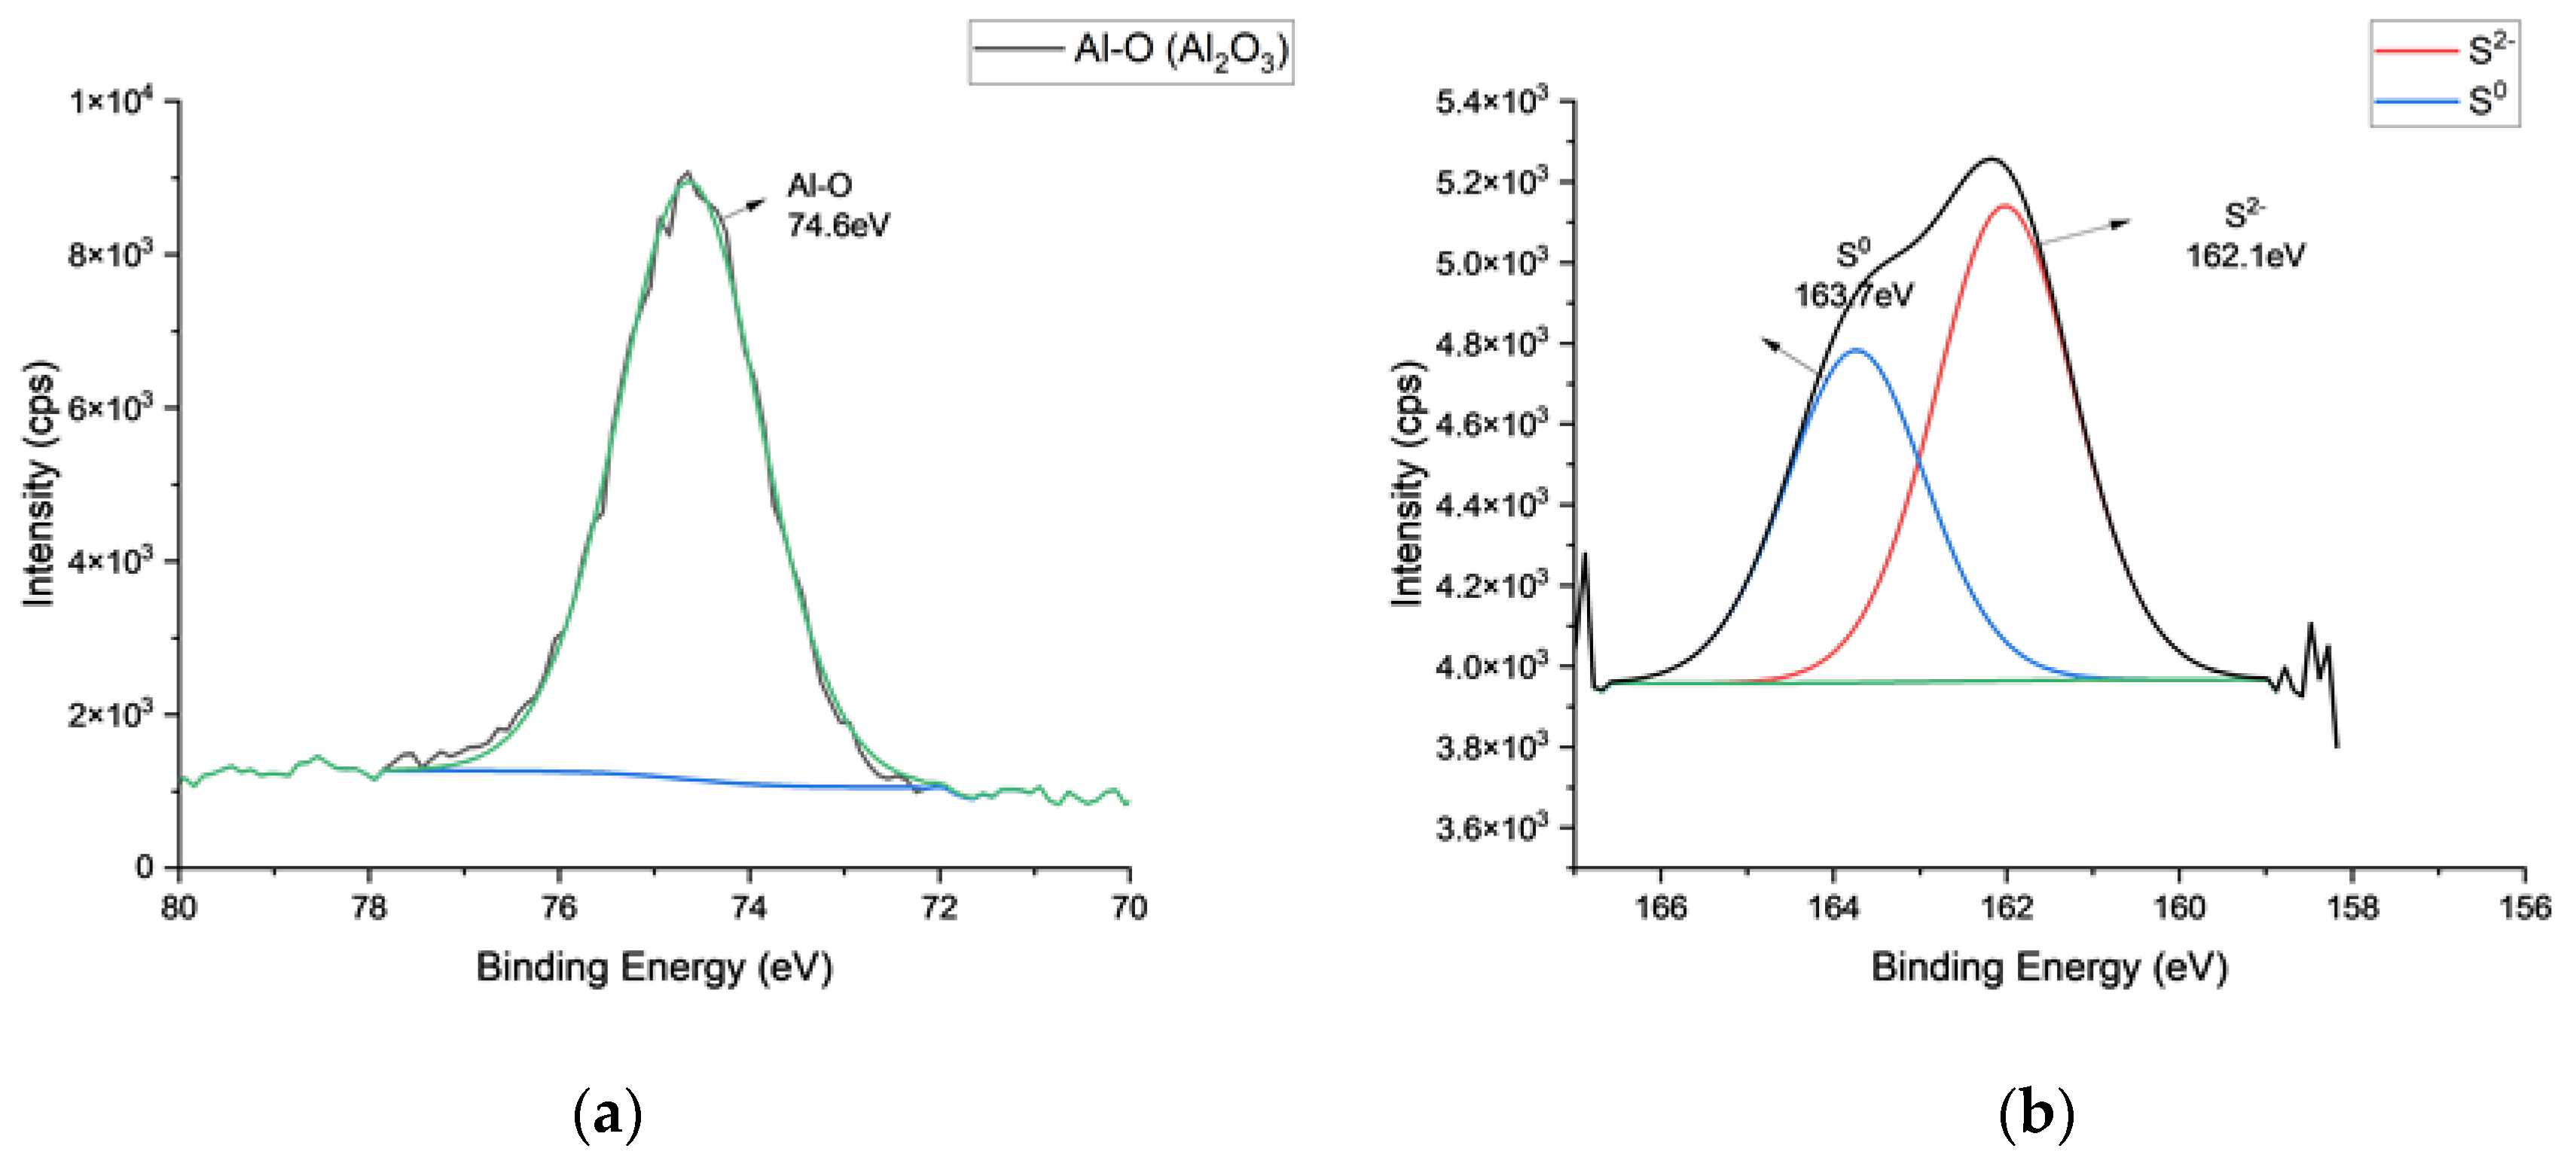
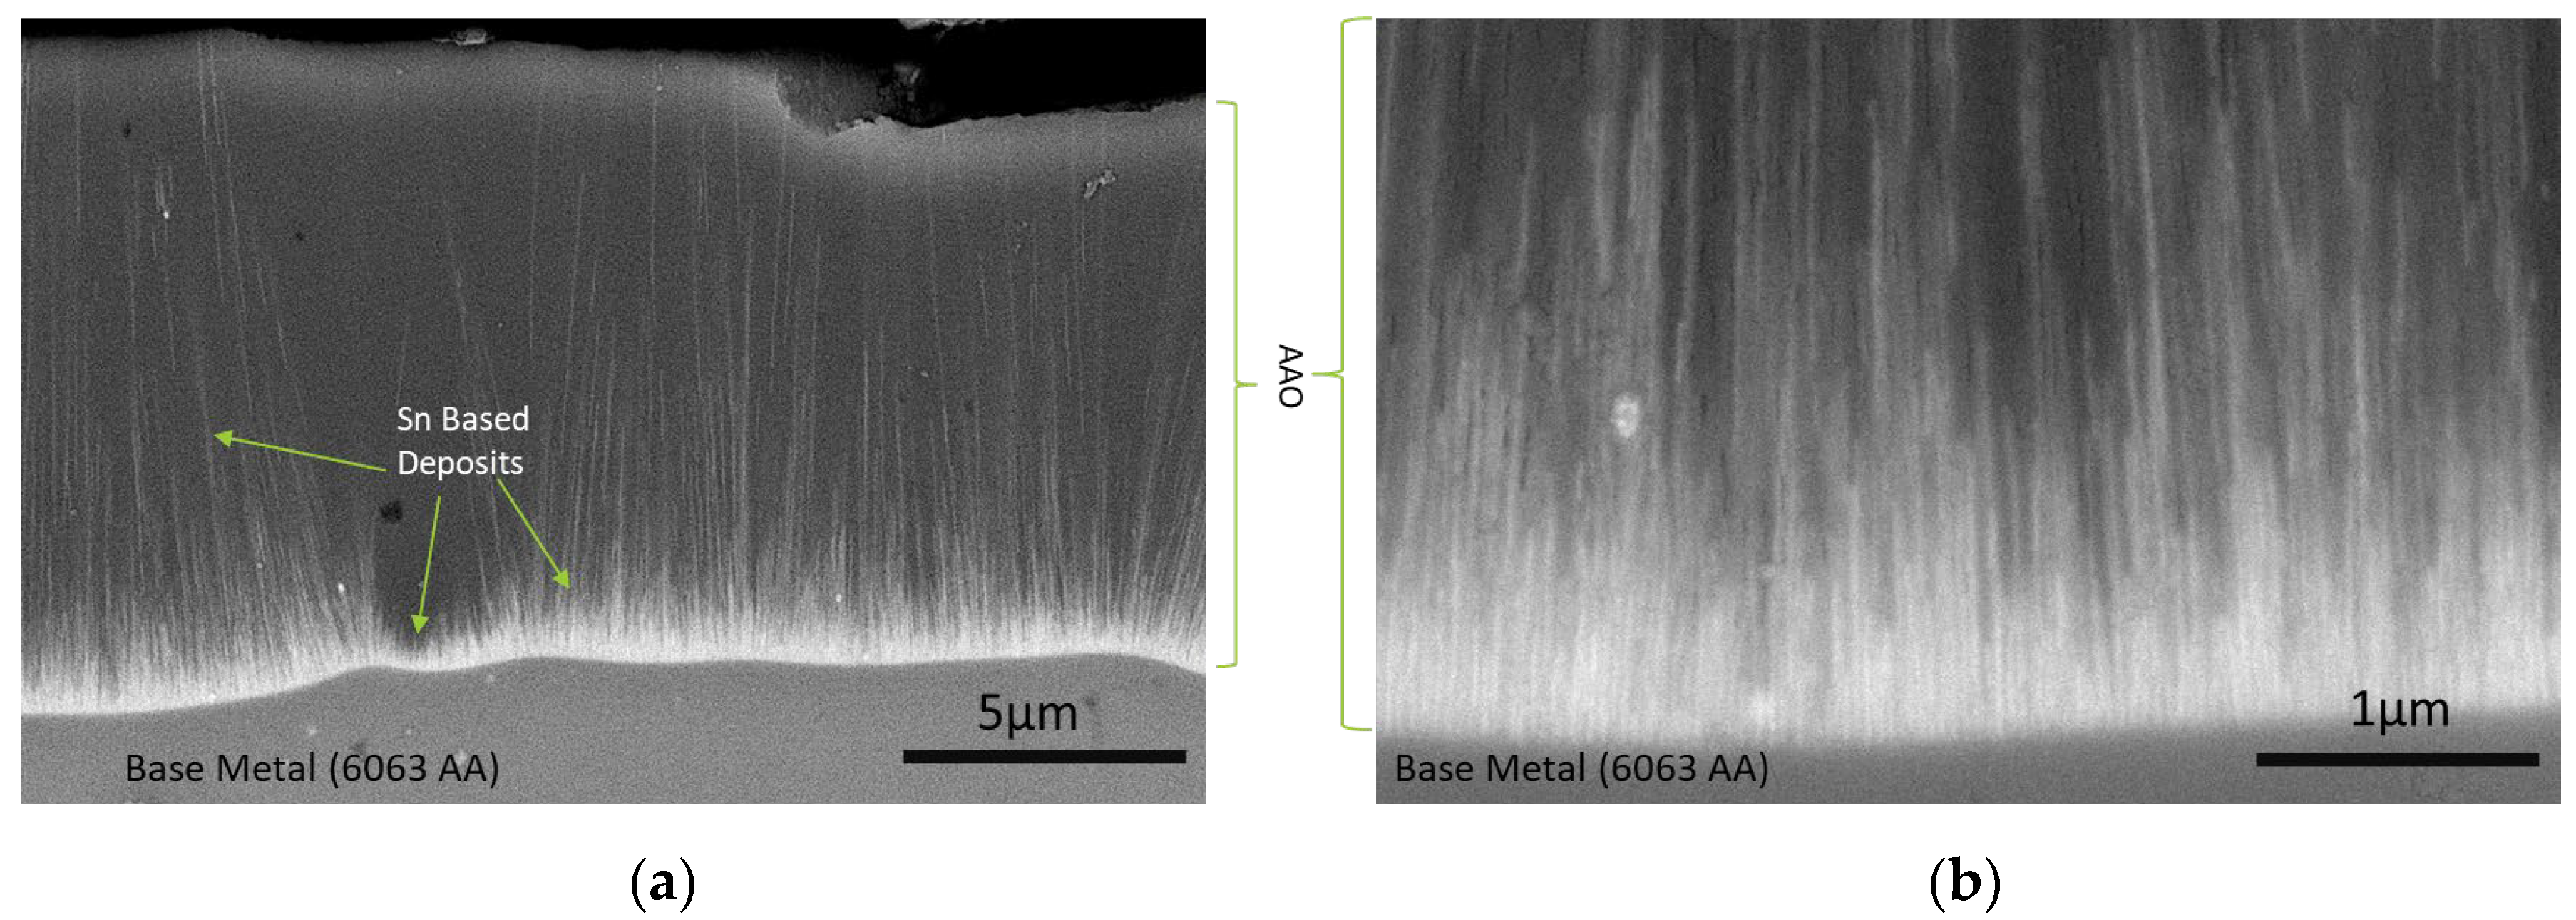
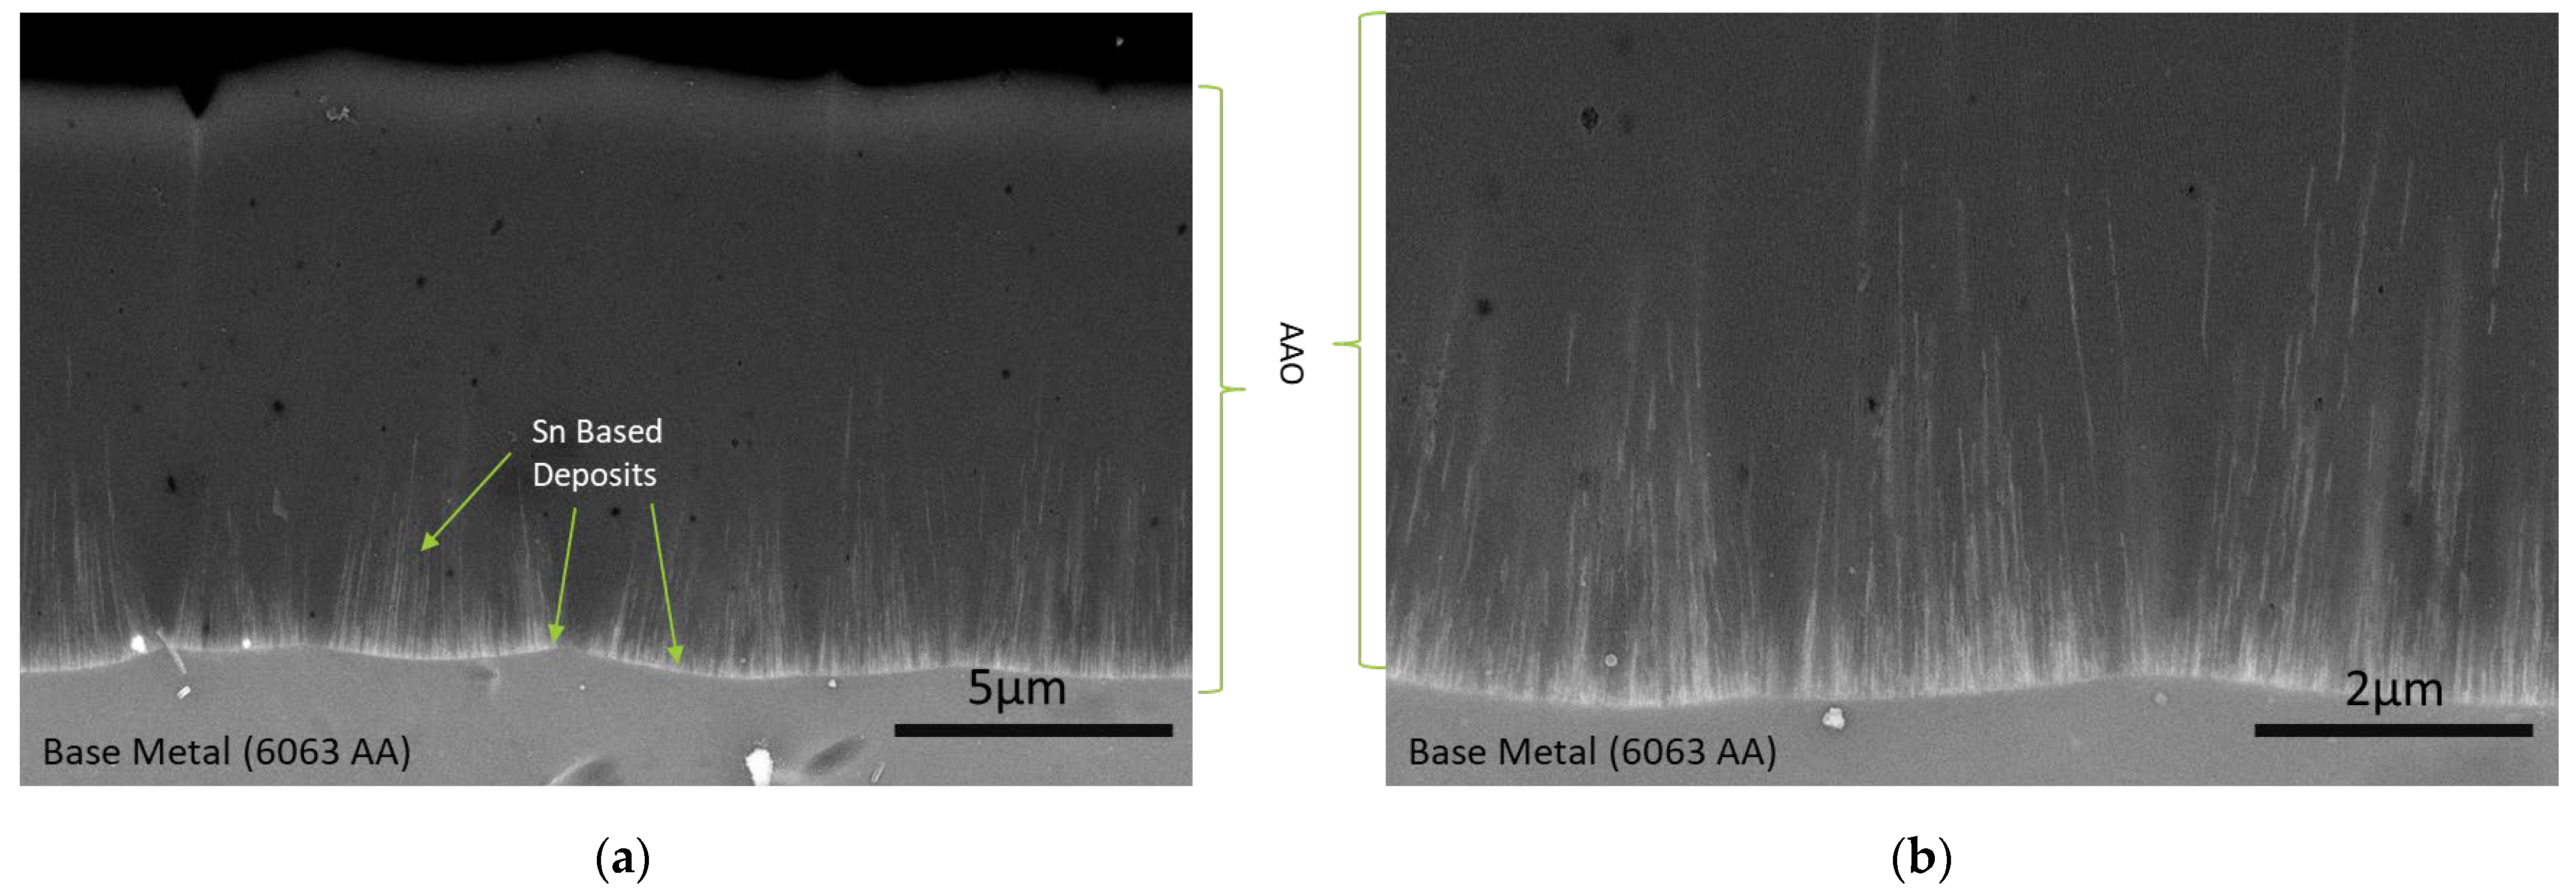
3.1. Chemical Characterization of Tin Deposits in Free-Standing AAO Films

XPS analysis of free-standing e-colored AAO films obtained after stripping the metallic pure aluminum from their backside and sputtering the barrier layer covering the deposits was conducted. SEM images taken from the backside of the films after XPS analysis revealed the presence of Sn-based deposits that appear as brighter spots (Figure 1).
The major peaks in the XPS survey were related to different binding states of Al, O, C, S, and Sn. The occurrence of sulfur in AAO is related to using sulfuric acid as the anodization electrolyte [4,8]. Figure 2 presents high-resolution scans of Al, Sn, O, and S.
As expected, the position of the Al 2p peak at 74.6 eV is consistent [32,33] with the binding energy of Al2O3 (Figure 2a). In this figure, the blue line indicates the background determined by the Shirley method, and the green line is the deconvoluted spectrum respectively.
The deconvolution of the S2s peak revealed the presence of elemental (0) and (+3) valent S species with binding energies of 162.1 and 163.7 eV, respectively. These binding energy values are consistent with the literature [34,35] (Figure 2b).
The deconvolution 1Os spectra of the sample comprised three different peaks centered at 530.3 eV, 531.5 eV, and 532.8 eV (Figure 2c). The O1s line at 530.3 eV corresponded to the tin oxide species, and the others were oxygen bound to aluminum oxides and sulfur, respectively [31,32,35].
The deconvoluted 3d region of Sn peaks of samples revealed the presence of metallic tin and tin oxide species in the deposits (Figure 2d). In this figure, the yellow line indicates the background determined by the Shirley method. After the deconvolution, two separate peak groups with Sn3d5/2 binding energy at 486.7 and 485 eV and Sn3d3/2 binding energy at 495.23 eV and 493.53 eV were observed. The peaks at 493.5 and 485 eV represent 3d3/2 and 3d5/2 of metallic tin. The binding energies Sn2+ and Sn4+ have binding energies very close to each other (0.5 eV) that fall into the detection sensitivity range of 0.6 eV of the instrument (3d5/2 for +2 and +4 valent Sn: 486.3 ± 0.6 eV) [33,36], which makes the differentiation between them very difficult. Despite this difficulty, it is not wrong to say that the tin species in the pores consisted of a mixture of metallic and oxidic tin species.
These results indicated the formation of tin oxide species in the deposits at AAO pore bottoms. In the following sections of the study, the mechanism behind the formation of these deposits will be investigated using a CV method compatible with the AC e-coloration process.

3.2. Electrochemical Analysis of E-Coloring Process with High-Scan-Rate CV

In this section, studies are presented for optimizing a CV method compatible with AC e-coloring, followed by studies in tin-free and tin-containing electrolytes using optimized CV parameters.

3.2.1. Determination of the Suitability of Potential and Scan Rate Limits for E-Coloring

To control the possibility of e-coloring within voltage and scan rate limits of the potentiostat, CV measurements of anodized samples in the potential range of +/−10 V and with 100 V/s scan rate for 10 min (2500 cycles) were realized on 6063AA. After this experiment, the typical brown color of anodized aluminum in tin-containing electrolytes was obtained. During e-coloring, tin-based species start to deposit at the pore bottom. Their thickness increases with the duration of the process, resulting in colors extending from light to dark brown shades. The SEM cross-section of the same sample indicated the deposition of tin species in the pores of AAO (Figure 3).
Accordingly, the +/−10 V range and 100 V/s scan rate are used for further CV experiments.

3.2.2. CV Experiments Conducted on AAO in Tin-Ion-Free and Tin-Ion-Containing Electrolytes

In this section, CV experiments were conducted using the optimized scan rate and voltage (100 V/s and +/−10 V) for determining the contribution of tin ions to the cycle-dependent anodic and cathodic polarization behavior of AAO.

Explanation of Critical Potentials Observed during CV of AAO in Tin-Ion-Free Electrolytes

CV experiments were first conducted on the base e-coloring electrolytes free from tin ions to determine the contribution of tin ions in the electrolytes. Before detailing the CV behavior, the meanings of the potentials and currents observed during cathodic and anodic polarization need to be explained to understand the behavior of AAO layers while cycling. In Figure 4, the critical potentials are marked from 1 to 6. The CV is presented on an E-logi scale to show potential positions more precisely.
The cycling starts from point 1 towards the cathodic direction, giving very low cathodic currents limited by the presence of the barrier layer until point 2. This potential is called the cathodic breakdown potential, indicating the breakdown of the barrier layer, followed by vigorous hydrogen evolution at the metal–oxide interface [37,38,39,40] that leads to the alkalinization of the electrolyte in the pores in which AAO is chemically unstable. Breakdown of the barrier layer depends on the amount of charge build-up during cathodic cycling [40,41,42], showing a strong dependence on the scan rate, defect density of the AAO, and electrolyte properties. Lower scan rates lead to the earlier breakdown of the barrier layer since the charge build-up is time-dependent and does not allow coloring because of the destruction of the AAO layer due to vigorous hydrogen evolution and alkalinization at the bottom of the pores. Thus, a sufficiently high scan rate is required to prevent total dissolution of the barrier layer due to local alkalinization and further build-up of porous AAO in the anodic cycle [38]. Upon reversal of the scan direction (point 3), the cathodic current decays, showing a hysteresis behavior, indicating ongoing activity of the cathodic reaction until point 4. The potential at point 4 is the corrosion potential of the aluminum in the alkalinized pore [43,44,45,46]. Starting from point 4, a low anodic current starts to flow until point 5, at which AAO formation and OER start. The charge build-up on AAO is released upon reversing the potential towards the cathodic direction, indicating a capacitive behavior [47,48]. After releasing the anodic charge, cathodic charging of the AAO layers starts at point 6 and continues until the breakdown potential.
The possible chemical and electrochemical reactions at different potential regions are listed below.
  • At point 2 after cathodic breakdown until point 4:
2 H + + 2 e H 2
2 H 2 O + 2 e H 2 + 2 O H
A l + 3 H 2 O + O H 3 2 H 2 + A l ( O H ) 4
A l 2 O 3 + 2 O H + 3 H 2 O 2 A l ( O H ) 4
The electrochemical cathodic reactions (Reactions 1 and 2) lead to alkalinization that induces the chemical dissolution of Al and Al2O3 by producing aluminate ions [1,43]:
  • At point 4 for until point 5.
  • At point 4, Al metal is not protected at pore bottoms; thus, corrosion starts at the mixed potential of the anodic (Reaction 5) and cathodic (Reaction 6) half-cell reactions in aluminate-rich pore bottom electrolytes. This is followed by passivation of Al (Reaction 7).
A l A l 3 + + 3 e
2 H 2 O + 2 e H 2 + 2 O H
2 A l + 3 H 2 O A l 2 O 3 + 6 H + + 6 e
  • At Point 5:
Oxygen evolution reaction (OER) (Reaction 8) starts with further AAO growth.
2 H 2 O O 2 + 4 H + + 4 e
2 A l + 3 H 2 O A l 2 O 3 + 6 H + + 6 e
  • At Point 6:
The discharge of anodic charge on the dielectric AAO and initiation of cathodic charge build up starts.

Variation in CV Behavior with Cycling in Tin-Ion-Free Electrolytes

Cycle-dependent E vs. i and E vs. logi relations are presented in Figure 5a,b. The breakdown shifts to more negative potentials (−4 to −5.30 V) with cycling, indicating the requirement of more charge build-up for breakdown related to the change in the barrier layer properties of the AAO layer on 6063AA that forms at the potential range between points 4 and 5 (Figure 4). The SEM images of the AAO layer (Figure 6) after cycling indicate that a new AAO layer is formed during the anodic cycles. The possibility of AAO growth with AC polarization has already been shown in several studies [49,50,51,52,53]. The new AAO layer’s morphology differs from that of the original anodization electrolyte. The AAO is more porous and irregular and possesses larger pore diameters than those formed in lower pH anodization electrolytes (Figure 6). This new oxide morphology can be attributed to changes in pH in the pores and/or precipitation of aluminum hydroxides within the pores [40,41,42,43,54,55] during cathodic cycling that dehydrates during anodic polarization. The shift in breakdown potentials can be related to the thicker barrier layer of the new AAO that forms in higher pH solutions. Another indication of increased pore bottom pH is the magnitude of cathodic currents after breakdown. The cathodic maximum currents decrease after 20 cycles from −145 to −57 mA/cm2, which can be attributed to the lower activity of hydrogen ions due to alkalinization (Figure 5a).
The potential at point 3 is only observed after cathodic breakdown, indicating the corrosion of aluminum. The potential values (−1.57 ± 0.2 V) lie close to the corrosion potential of aluminum metal in alkaline solutions [38,49,50,51,52]. After point 4, the variation in anodic currents is negligible due to the well-known diode behavior of aluminum [41,45]. The onset of the anodization potential (point 5) did not vary with cycling. However, the increase in cycling decreased the maximum anodic current from 17 to 13 mA/cm2, which can also be attributed to the increased thickness of AAO and higher pH within the pores. The discharge potentials at point 6 (+5.7 V ± 0.1 V) did not vary significantly, indicating similar capacitive behavior of the layers after cycling.

CV Behavior of AAO in Tin-Ion-Containing Electrolytes

The CV behavior during the first 20 cycles is similar to that of a solution free from tin ions. However, after 20 cycles, cathodic (peak A) and anodic (peak B) peaks appear, and the CV behavior changes completely (Figure 7a,b).
At the 20th cycle, after the realization of the cathodic breakdown and hydrogen evolution, the deposition of tin becomes apparent at point A. The tin’s deposition potentials at point A are comparable with the electrodeposition potential of tin in alkaline electrolytes containing stabilizers [56,57]. After the deposition of tin in the pores, the potential at point 4 also starts to change in a positive direction towards the corrosion potential of tin in alkaline electrolytes [56,57,58,59,60]. With the change in potential towards an anodic direction, oxidation of deposited tin starts to commence at point B [55,56,57,58,59,60]. After the oxidation of metallic tin, a very low anodic current is recorded even beyond the anodic oxidation potential (oxygen evolution reaction) (point 5 in Figure 4), similar to the anodic behavior of tin in alkaline solutions anodized at high anodic potentials. All of these observations indicated that after the deposition of tin in the pores, the tin deposits govern the electrochemical behavior. Further support for this observation is the lack of new AAO growth (Figure 8), contrary to the ones subjected to cyclic polarization in tin-free electrolytes. Upon reversal of the potential, the capacitive behavior of the system also changed dramatically towards more positive potentials, indicating a higher charge accumulation ability aroused from the presence of tin oxide species in the pores [61,62]. Interestingly, no sign of cathodic reduction is observed upon reaching the reduction potential of tin ions during cathodic cycling, which can be attributed to the non-conductive nature of tin oxide species in the pores or a thin AAO barrier layer below them. The potential (point 2 in Figure 4) at which cathodic reduction starts also switches to higher cathodic potentials after the build-up of tin oxide species in the pores. The charge transfer reactions through the barrier layer strongly depend on their thickness; if the oxide layer thickness is lower than approx. 10 nm [39,40], charge transfer is realized at the oxide solution interface. However, when the thickness is higher than 10 nm, the charge transfer reaction occurs via proton transfer at the metal–oxide interface. Assuming the presence of a thinner barrier layer at point 2, allowing charge transfer at the oxide solution interface in the presence of tin ions is not wrong because of their hindering effect on oxide growth at point 5 (Figure 8a,b). Charge transfer through a thinner barrier layer is expected to occur at lower cathodic potentials, which means the charge will be readily available to reduce hydrogen ions. The delay of initiation of HER in the presence of a tin-oxide-covered barrier layer can be explained by the conversion of nonconductive +4 tin oxide species towards a more conductive nature by conversion into sub-stoichiometric oxides [59,62] during cathodic polarization or by the difficulty of charge transport through a relatively thick tin oxide layer. The shift in the cathodic breakdown potential to more negative values with cycling and thickening of the tin oxide layer may indicate that the second mechanism better explains this shift. The observation of lower cathodic currents at point 2 is due to the well-known high overvoltage of HER on tin oxides [63,64,65]. With the increase in cycle numbers beyond 20, the reduction and oxidation current increases (points A and B) and stabilizes after 50 cycles.
In the presence of tin ions in the solution, the possible changes in the chemical and electrochemical reactions with respect to tin free electrolytes can be summarized as follows:
  • At point 2 after cathodic breakdown until point A, rates of reaction 1 and 2 decreased because of the high over potential of HER on tin oxides. The rates of chemical dissolution of the AAO layer (reaction 3) and Al (reaction 4) at the pore bottom also decreased due to limited alkalinization.
  • At Point A:
Metallic   tin   deposition   at   the   pore   bottom   is   realized       S n 2 + + 2 e S n 0
  • At Point B:
  • Primary, secondary passivation of metallic tin and dehydration of anodic oxide occurs [59].
Primary   passivation         S n + 2 O H S n ( O H ) 2 + 2 e
Primary   passivation         S n ( O H ) 2 S n O + H 2 O
Secondary   passivation         S n O + H 2 O + 2 O H S n ( O H ) 4 + 2 e
Dehydration   of   anodic   oxide         S n ( O H ) 4 S n O 2 + 2 H 2 O
  • At point 5:
  • Reactions 8 and 9 take place at a lower rate compared to tin-free electrolytes because of the presence of tin oxides at the pore bottom.
When the deposit chemistry determination and cycling voltammetry results are evaluated together, it is concluded that the pores of AAO in tin-based e-coloring solutions are a mixture of metallic and oxidic tin species. These results indicate that the semiconductor nature of the deposited tin oxide species will also contribute to the coloring of AAO by absorption and explain different color tints observed while using different e-coloring electrolytes.

4. Conclusions

The analysis of free-standing e-colored AAO with XPS showed that the pore deposits are a mixture of tin and tin oxides. However, it was impossible to differentiate between the valence states of the tin oxides because of the close proximity of binding energies of +2 and +4 valence states of tin.
It is determined that cyclic voltammetry in the +/−10 V potential range and a 100 V/s scan rate can simulate the e-coloring process using AC voltage. However, further work is required to determine the role of higher scan rates in the e-coloring process.
Five critical potentials, the cathodic breakdown, corrosion potential, anodic oxidation potential, and discharge potential, are present in the CV of AAO in tin-free e-coloring electrolytes. It has been determined that after cathodic breakdown, alkalinization of the electrolyte at the bottoms is realized, which is supported by the appearance of corrosion potential during switching from a cathodic to anodic cycle. Under the conditions utilized, an AAO layer with a more porous and irregular nature is formed.
Significant differences exist between the CV behavior of AAO in tin-ion-bearing electrolytes and tin-free electrolytes. Additional peaks related to the reduction of tin ions and oxidation of metallic peaks appeared after 20 cycles, indicating the deposition of metallic tin during the cathodic cycle and its oxidation during the anodic cycle.
After the deposition of tin species in the pores, the cathodic breakdown potential shifted toward a more cathodic potential, the corrosion potential switched toward the corrosion potential of tin in alkaline solutions, and the anodic oxidation and discharge potentials shifted toward more positive values. Related currents decreased.
The presence of tin ions in the electrolyte hindered the growth of a new AAO layer during anodic polarization, indicating the significant role of tin deposits on cathodic and anodic polarization that occurs during cycling.
The results of CV experiments supported the findings of XPS analysis, which indicated the presence of a tin-oxide-rich, tin metal, and oxide mixture in the AAO pores.
The methodology used in this study can be applied to other e-coloring processes to understand the nature of deposits in the AAO.
Further work is required to clarify the chemical and electrochemical reactions occurring at different regions of anodic and cathodic polarization during cycling.

Author Contributions

P.A.: Methodology; Conceptualization; Investigation; Visualization; Writing—Original Draft; Validation. C.A.: Review and Editing; Resources; Funding. K.K.: Methodology; Resources; Review and Editing. M.Ü.: Conceptualization; Methodology; Project Resources; Supervision; Writing—Review and Editing; Validation. All authors have read and agreed to the published version of the manuscript.

Funding

This research received no external funding.

Institutional Review Board Statement

Not applicable.

Informed Consent Statement

Not applicable.

Data Availability Statement

The data that support the findings of this study are available from the corresponding author upon reasonable request.

Conflicts of Interest

Authors Pinar Afsin and Can Akyil were employed by the company MacDermid Enthone Industrial Solutions. The remaining authors declare that the research was conducted in the absence of any commercial or financial relationships that could be construed as a potential conflict of interest.

References

  1. Sulka, G.D. Introduction to Anodization of Metals. In Nanostructured Anodic Metal Oxides: Synthesis and Applications; Elsevier: Amsterdam, The Netherlands, 2020; pp. 1–34. ISBN 9780128167069. [Google Scholar]
  2. Nahum, E.Z.; Lugovskoy, A.; Lugovskoy, S.; Sobolev, A. Synthesis of Titanium Oxide Nanotubes Loaded with Hydroxyapatite. Nanomaterials 2023, 13, 2743. [Google Scholar] [CrossRef] [PubMed]
  3. Lee, C.Y.; Lee, K.; Schmuki, P. Anodic Formation of Self-Organized Cobalt Oxide Nanoporous Layers. Angew. Chem.-Int. Ed. 2013, 52, 2077–2081. [Google Scholar] [CrossRef]
  4. Sheasby, P.G.; Pinner, R. Anodizing of aluminum. In The Surface Treatment and Finishing of Aluminum and Its Alloys; Finishing Publications Ltd.: Warrington, UK, 2001; Volume 1, pp. 330–420. [Google Scholar]
  5. Schwirn, K.; Lee, W.; Hillebrand, R.; Steinhart, M.; Nielsch, K.; Gösele, U. Self-Ordered Anodic Aluminum Oxide Formed by H2SO4 Hard Anodization. ACS Nano 2008, 2, 302–310. [Google Scholar] [CrossRef]
  6. Lee, K.; Tang, Y.; Ouyang, M. Self-Ordered, Controlled Structure Nanoporous Membranes Using Constant Current Anodization. Nano Lett. 2008, 8, 4624–4629. [Google Scholar] [CrossRef] [PubMed]
  7. Sulka, G.D.; Parkoła, K.G. Temperature Influence on Well-Ordered Nanopore Structures Grown by Anodization of Aluminium in Sulphuric Acid. Electrochim. Acta 2007, 52, 1880–1888. [Google Scholar] [CrossRef]
  8. Thompson, G.E.; Wood, G.C. Anodic Films on Aluminium. In Treatise on Material Science and Technology; Scully, J.C., Ed.; Elsevier: Amsterdam, The Netherlands, 1983; Volume 23, pp. 205–329. [Google Scholar] [CrossRef]
  9. Diggle, J.W.; Downie, T.C.; Goulding, C.W. Anodic Oxide Films On Aluminum. Chem. Rev. 1969, 69, 365–405+393. [Google Scholar] [CrossRef]
  10. Md Jani, A.M.; Losic, D.; Voelcker, N.H. Nanoporous Anodic Aluminium Oxide: Advances in Surface Engineering and Emerging Applications. Prog. Mater. Sci. 2013, 58, 636–704. [Google Scholar] [CrossRef]
  11. Nozari Nezhad, M.; Kolahi, A.; KazemZad, M.; Saiedifar, M. Electrolytic Coloring of Anodized Aluminum by Copper. Adv. Mater. Res. 2014, 829, 381–385. [Google Scholar] [CrossRef]
  12. Liang, K.; Liang, C.H.; Wang, H. Structure and Distribution of Electrodeposits on Anodic Aluminium Films by Electrolytic Colouring in Zinc Sulphate Solution. Trans. Inst. Met. Finish. 2007, 85, 159–161. [Google Scholar] [CrossRef]
  13. Doughty, A.S.; Thompson, G.E.; Wood, G.C. Investigation of the electrolytic Coloring of Porous Anodic Films on Aluminum using Electron Microscopy. Trans. Inst. Met. Finish. 1975, 53, 33–35. [Google Scholar] [CrossRef]
  14. Nahar, N.M.; Mo, G.H.; Ignatiev, A. Development of an Al203-Co Selective Absorber For Solar Collectors. Thin Solid Films 1989, 172, 19–25. [Google Scholar] [CrossRef]
  15. Suzer, S.S.; Kadirgan, F.; Sohmen, H.M.S.; Wetherilt, A.J.; Tureture, I.E. Spectroscopic Characterization of Al O-Ni Selective Absorbers for Solar Collectors. Sol. Energy Mater. Sol. Cells 1998, 52, 55–60. [Google Scholar] [CrossRef]
  16. Hakimizad, A.; Raeissi, K.; Ashrafizadeh, F. Characterization of Aluminum Anodized Layers Modified in Sulfuric and Phosphoric Acid Baths and Their Effect on Conventional Electrolytic Coloring. Surf. Coat. Technol. 2012, 206, 2438–2445. [Google Scholar] [CrossRef]
  17. De Graeve, I.; Laha, P.; Goossens, V.; Furneaux, R.; Verwimp, D.; Stijns, E.; Terryn, H. Colour Simulation and Prediction of Complex Nano-Structured Metal Oxide Films. Test Case: Analysis and Modeling of Electro Coloured Anodized Aluminium. Surf. Coat. Technol. 2011, 205, 4349–4354. [Google Scholar] [CrossRef]
  18. Santiago, S.; Fernandez, A.M. Electrolytic Nickel Impregnation of Porous Anodic Aluminum Oxide Films Using AC Voltage as Solar Selective Absorber. Energy Procedia 2014, 57, 2733–2742. [Google Scholar] [CrossRef]
  19. Sheasby, P.G.; Pinner, R. Anodizing in Architecture. In The Surface Treatment and Finishing of Aluminum and Its Alloys; Finishing Publications Ltd.: Warrington, UK, 2001; Volume 2, pp. 700–740. [Google Scholar]
  20. Lin, C.-F.; Hebert, K.R. Change Produced by Cathodic Polarization in the Electrical Conduction Behavior of 419 Surface Films on Aluminum Electrochemical Systems. J. Electrochem. Soc. 1994, 141, 105–110. [Google Scholar]
  21. Jagminas, A.; Lichušina, S.; Kurtinaitiene, M.; Selskis, A. Concentration Effect of the Solutions for Alumina Template AC Filling by Metal Arrays. Appl. Surf. Sci. 2003, 211, 194–202. [Google Scholar] [CrossRef]
  22. Salmi, J.; Bonino, J.-P.; Bes, R.S. Nickel Pigmented Anodized Aluminium as Solar Selective Absorbers. J. Mater. Sci. 2000, 35, 1347–1351. [Google Scholar] [CrossRef]
  23. Goad, D.G.W.; Moskovits, M. Colloidal Metal in Aluminum-Oxide. J. Appl. Phys. 1978, 49, 2929–2934. [Google Scholar] [CrossRef]
  24. Tsangaraki-Kaplanoglou, I.; Theohari, S.; Dimogerontakis, T.; Kallithrakas-Kontos, N.; Wang, Y.M.; Kuo, H.H.; Kia, S. An Investigation of Electrolytic Coloring Process of Anodized Aluminum Coatings. Surf. Coat. Technol. 2006, 201, 2749–2759. [Google Scholar] [CrossRef]
  25. Akolkar, R.; Wang, Y.M.; Kuo, H.H. Kinetics of the Electrolytic Coloring Process on Anodized Aluminum. J. Appl. Electrochem. 2007, 37, 291–296. [Google Scholar] [CrossRef]
  26. Cohen, R.L.; Raub, C.J.; Muramaki, T. The State of Tin in Tin-Anodized Aluminum. J. Electrochem. Soc. 1978, 125, 124–125. [Google Scholar] [CrossRef]
  27. Zemanová, M.; Chovancová, M.; Krivošík, P. A New Approach to Nickel Electrolytic Colouring of Anodised Aluminium. Chem. Pap. 2009, 63, 62–70. [Google Scholar] [CrossRef]
  28. Shaffei, M.F.; Abd El-Rehim, S.S.; Shaaban, N.A.; Huisen, H.S. Electrolytic Coloring of Anodic Aluminum for Selective Solar Absorbing Films: Use of Additives Promoting Color Depth and Rate. Renew. Energy 2001, 23, 489–495. [Google Scholar] [CrossRef]
  29. Jagminas, A.; Niaura, G.; Kuzmarskyte, J.; Butkiene, R. Surface-Enhanced Raman Scattering Effect for Copper Oxygenous Compounds Array within the Alumina Template Pores Synthesized by AC Deposition from Cu(II) Acetate Solution. Appl. Surf. Sci. 2004, 225, 302–308. [Google Scholar] [CrossRef]
  30. Bouchama, L.; Azzouz, N.; Boukmouche, N.; Chopart, J.P.; Daltin, A.L.; Bouznit, Y. Enhancing Aluminum Corrosion Resistance by Two-Step Anodizing Process. Surf. Coat. Technol. 2013, 235, 676–684. [Google Scholar] [CrossRef]
  31. Han, X.Y.; Shen, W.Z. Improved Two-Step Anodization Technique for Ordered Porous Anodic Aluminum Membranes. J. Electroanal. Chem. 2011, 655, 56–64. [Google Scholar] [CrossRef]
  32. Zähr, J.; Oswald, S.; Türpe, M.; Ullrich, H.J.; Füssel, U. Characterisation of Oxide and Hydroxide Layers on Technical Aluminum Materials Using XPS. Proc. Vac. 2012, 86, 1216–1219. [Google Scholar] [CrossRef]
  33. Thomas, B.; Skariah, B. Spray Deposited Mg-Doped SnO2 Thin Film LPG Sensor: XPS and EDX Analysis in Relation to Deposition Temperature and Doping. J. Alloys Compd. 2015, 625, 231–240. [Google Scholar] [CrossRef]
  34. St Smart, R.C.; Skinner, W.M.; Gerson, A.R. XPS of Sulphide Mineral Surfaces: Metal-Deficient, Polysulphides, Defects and Elemental Sulphur. Surf. Interface Anal. 1999, 28, 101–105. [Google Scholar] [CrossRef]
  35. Lee, A.F.; Wilson, K.; Goldoni, A.; Larciprete, R.; Lizzit, S. A Fast XPS Study of Sulphate Promoted Propene 447 Decomposition over Pt{1 1 1}. Surf. Sci. 2002, 553, 140–148. [Google Scholar] [CrossRef]
  36. Oswald, S. X -Ray Photoelectron Spectroscopy in Analysis of Surfaces Update Based on the Original Article by Steffen Oswald. In Encyclopedia of Analytical Chemistry 2000; John Wiley & Sons, Ltd.: Hoboken, NJ, USA, 2013. [Google Scholar]
  37. Nisancioglu, K.; Holtan, H. Cathodic Polarization of Commercially Pure Aluminium. Corros. Sci. 1979, 19, 537–552. [Google Scholar] [CrossRef]
  38. Bunker, B.C.; Nelson, G.C.; Zavadil, K.R.; Barbour, J.C.; Wall, F.D.; Sullivan, J.P.; Windisch, C.F.; Engelhardt, M.H.; Baer, D.R. Hydration of Passive Oxide Films on Aluminum. J. Phys. Chem. B 2002, 106, 4705–4713. [Google Scholar] [CrossRef]
  39. Adhikari, S.; Hebert, K.R. Participation of Aluminum Hydride in the Anodic Dissolution of Aluminum in Alkaline Solutions. J. Electrochem. Soc. 2008, 155, C189. [Google Scholar] [CrossRef]
  40. Seo, J.H.; Lee, D.N. Assessment of Proton Transport in Amorphous Aluminum Oxide by Cathodic Polarization. J. Electrochem. Soc. 2003, 150, 329–335. [Google Scholar] [CrossRef]
  41. Hassel, A.W.; Lohrengel, M.M. Initial Stages of Cathodic Breakdown of Thin Anodic Aluminium Oxide Films. Electrochim. Acta 1995, 40, 433–437. [Google Scholar] [CrossRef]
  42. Gasco Owens, A.; Veys-Renaux, D.; Rocca, E. Reverse Scan Polarization of Anodic Aluminum Oxide until 505 Detachment in Sulfuric Acid: Mechanisms and Morphologies. Electrochim. Acta 2022, 435, 141361. [Google Scholar] [CrossRef]
  43. Zhang, J.; Klasky, M.; Letellier, B.C. The Aluminum Chemistry and Corrosion in Alkaline Solutions. J. Nucl. Mater. 2009, 384, 175–189. [Google Scholar] [CrossRef]
  44. Thompson, G.E.; Wood, G.C. The Effect of Alternating Voltage on Aluminum Electrodes. Corros. Sci. 1978, 18, 721–746. [Google Scholar] [CrossRef]
  45. Adhikari, S.; Hebert, K.R. Factors Controlling the Time Evolution of the Corrosion Potential of Aluminum in Alkaline Solutions. Corros. Sci. 2008, 50, 1414–1421. [Google Scholar] [CrossRef]
  46. Ching-Feng, L.; Porter, M.D.; Hebert, K.R. Surface Films Produced by Cathodic Polarization of Aluminum. J. Electrochem. Soc. 1994, 141, 96–104. [Google Scholar]
  47. Hong, C.; Chu, L.; Lai, W.; Chiang, A.S.; Fang, W. Implementation of a New Capacitive Touch Sensor Using the Nanoporous Anodic Aluminum Oxide (Np-AAO) Structure. IEEE Sens. J. 2011, 11, 3409–3416. [Google Scholar] [CrossRef]
  48. Marsal, L.F.; Vojkuvka, L.; Formentin, P.; Pallarés, J.; Ferré-Borrull, J. Fabrication and Optical Characterization of Nanoporous Alumina Films Annealed at Different Temperatures. Opt. Mater. 2009, 31, 860–864. [Google Scholar] [CrossRef]
  49. Sacchi, F.; Paolini, G. A Study of AC Anodizing of Aluminium in Sulphuric Acid Solutions. Trans. IMF 1964, 42, 298–311. [Google Scholar] [CrossRef]
  50. Segawa, H.; Okano, H.; Wada, K.; Inoue, S. Fabrication of Alumina Films with Laminated Structures by Ac Anodization. Sci. Technol. Adv. Mater. 2014, 15, 014209. [Google Scholar] [CrossRef]
  51. Segawa, H.; Okano, H.; Wada, K.; Inoue, S.; Byun, I. Synthesis of Laminated Alumina Films by AC Oxidation. J. Electrochem. Soc. 2013, 160, D240–D245. [Google Scholar] [CrossRef]
  52. Kape, J.M. Further Development in the AC Anodizing of Aluminum in Sulfuric Acid Electrolytes. Trans. Inst. Met. Finish. 1985, 63, 90–97. [Google Scholar] [CrossRef]
  53. Balasubramanian, V.; John, S.; Shenoi, B.A. Influence of Addition Agents for A.C: Anodizing in Sulphuric Acid Electrolytes. Surf. Technol. 1983, 19, 293–303. [Google Scholar] [CrossRef]
  54. Pyun, S.I.; Moon, S.M. Corrosion Mechanism of Pure Aluminium in Aqueous Alkaline Solution. J. Solid State Electrochem. 2000, 4, 267–272. [Google Scholar] [CrossRef]
  55. Tran, T.T.M.; Tribollet, B.; Sutter, E.M.M. New Insights into the Cathodic Dissolution of Aluminium Using Electrochemical Methods. Electrochim. Acta 2016, 216, 58–67. [Google Scholar] [CrossRef]
  56. Broggi, R.L.; De Oliveira, G.M.; Barbosa, L.L.; Pallone, E.M.J.A.; Carlos, I.A. Study of an Alkaline Bath for Tin Deposition in the Presence of Sorbitol and Physical and Morphological Characterization of Tin Film. J. Appl. Electrochem. 2006, 36, 403–409. [Google Scholar] [CrossRef]
  57. Kwaśniewski, D.; Grdeń, M. Electrochemical Behaviour of Tin in Alkaline Electrolyte. Electrochem. Commun. 2015, 61, 125–128. [Google Scholar] [CrossRef]
  58. Ammar, I.A.; Darwish, S.; Khalil, M.W.; Galal, A. Potentiodynamic and Cyclic Voltametric Studies on the Passivity of Tin in Neutral Phosphate Buffer. Materwiss Werksttech 1985, 16, 194–203. [Google Scholar] [CrossRef]
  59. Brunetti, V.; López Teijelo, M. Oxide/Hydroxide Films on Tin. II: Characterization of the Anodic Growth in Alkaline Solutions. J. Electroanal. Chem. 2008, 613, 16–22. [Google Scholar] [CrossRef]
  60. Kapusta, S.D.; Norman, H. Anodic passivation of tin in slightly alkaline solutions. Electrochim. Acta 1980, 25, 1625–1639. [Google Scholar] [CrossRef]
  61. Tunold, R.; Broli, A. Anodic And Cathodic Behaviour of Tin In Acidic Sulphate Solutions. Corros. Sci. 1973, 13, 361–373. [Google Scholar] [CrossRef]
  62. Akyil, C.; Akdas, G.; Afsin, P.; Ürgen, M. Freestanding SnO2 Films Produced with Anodic Polarization in Acidic Media Containing Colloidal Tin Hydroxides. Mater. Chem. Phys. 2019, 221, 263–271. [Google Scholar] [CrossRef]
  63. Er, D.; Avcı, B.; Ürgen, M. Electrocatalytic Performance of Interconnected Self-Standing Tin Nanowire Network Produced by AAO Template Method for Electrochemical CO2 Reduction. ChemElectroChem 2023, 10, e202300196. [Google Scholar] [CrossRef]
  64. Zaraska, L.; Gawlak, K.; Wiercigroch, E.; Malek, K.; Kozieł, M.; Andrzejczuk, M.; Marzec, M.M.; Jarosz, M.; Brzózka, A.; Sulka, G.D. The Effect of Anodizing Potential and Annealing Conditions on the Morphology, Composition and Photoelectrochemical Activity of Porous Anodic Tin Oxide Films. Electrochim. Acta 2019, 319, 18–30. [Google Scholar] [CrossRef]
  65. Zaraska, L.; Gawlak, K.; Gurgul, M.; Dziurka, M.; Nowak, M.; Gilek, D.; Sulka, G.D. Influence of Anodizing Conditions on Generation of Internal Cracks in Anodic Porous Tin Oxide Films Grown in NaOH Electrolyte. Appl. Surf. Sci. 2018, 439, 672–680. [Google Scholar] [CrossRef]
Figure 1. FEG-SEM images of free-standing AAO (40 µm) film, e-colored in the Sn-based solution consisting of 0.1 M SnSO4, 0.2 M H2SO4, and 0.05 M sulfosalicylic acid as a stabilizer using 17 V (AC-50 Hz) at 24 ° C (100,000× magnification).
Coatings 14 00616 g001
Figure 2. XPS spectra of freestanding AAO film e-colored in tin-based electrolyte (0.1 M SnSO4, 0.2 M H2SO4, and 0.05 M stabilizer). (a) Al 2p, (b) S2s, (c) O1s, and (d) Sn 3d.
Coatings 14 00616 g002aCoatings 14 00616 g002b
Figure 3. FE-SEM cross-section image of tin e-colored AAO in 0.1 M SnSO4, 0.2 M H2SO4, and sulfosalicylic acid (stabilizer) using cyclic voltammetry, potential range +/−10 V DC and 100 V/s scan rate for 10 min (2500 cycles) at 24 ° C ; (a) 20 K magnification, (b) 100 K magnification.
Coatings 14 00616 g003
Figure 4. Critical potentials recorded during 5th cycle of CV obtained on 10 µm AAO in tin-ion-free electrolytes (0.2 M H2SO4 and stabilizer at 24 ° C ) using +/−10 V range and 100 V/s scan rate.
Coatings 14 00616 g004
Figure 5. Cyclic voltammograms (2, 5, 20, 50, 250 cycles) obtained on AAO in the potential range of +/−10 V and 100 V/s scan rate in 0.2 M H2SO4 + 0.05 M stabilizer solution at 24 ° C . (a) E-Logi and (b) E-i scales.
Coatings 14 00616 g005
Figure 6. FE-SEM image of newly created AAO layer (a) after 1000 cycles and (b) after 2500 cycles obtained in 0.2 M H2SO4 + 0.05 M stabilizer solution at 24 ° C using +/−10 V range and 100 V/s scan rate.
Coatings 14 00616 g006
Figure 7. Cyclic voltammograms (2, 5, 20, 50, and 250 cycles) obtained on AAO in the potential range of +/−10 V and 100 V/s scan rate in 0.2 M H2SO4N + 0.1 M SnSO4 + 0.05 M stabilizer solution at 24 ° C . (a) E-i and (b) E-Logi scales.
Coatings 14 00616 g007
Figure 8. FE-SEM cross-section images of colored AAO after 250 cycles of CV experiments in 0.1 M SnSO4 + 0.2 M H2SO4 + 0.05 M sulfosalicylic solution at 24 ° C using +/−10 V potential range and 100 V/s scan rate. (a) 20 K magnification (b) 50 K magnification.
Coatings 14 00616 g008
Table 1. Composition of AA6063-T6 used in experiments.
Alloying ElementSiFeCuMgCrZnMnAl
%0.410.110.050.51<0.10<10<10Balance
Disclaimer/Publisher’s Note: The statements, opinions and data contained in all publications are solely those of the individual author(s) and contributor(s) and not of MDPI and/or the editor(s). MDPI and/or the editor(s) disclaim responsibility for any injury to people or property resulting from any ideas, methods, instructions or products referred to in the content.

