Article

Effect of Electrolytic Plasma Polishing on Surface Properties of Titanium Alloy

1
College of Mechanical and Vehicle Engineering, Taiyuan University of Technology, Taiyuan 030024, China
2
Engineering Training Center, Taiyuan Institute of Technology, Taiyuan 030008, China
*
Author to whom correspondence should be addressed.
Coatings 2024, 14(5), 615; https://doi.org/10.3390/coatings14050615
Submission received: 5 April 2024 / Revised: 27 April 2024 / Accepted: 9 May 2024 / Published: 13 May 2024
(This article belongs to the Section Plasma Coatings, Surfaces & Interfaces)

Abstract

:
Electrolytic plasma polishing (EPPo) is an advanced metal surface finishing technology with high quality and environmental protection that has broad application prospects in the biomedical field. However, the effect of EPPo on surface properties such as corrosion resistance and the wettability of biomedical titanium alloys remains to be investigated. This paper investigated the changes in surface roughness, surface morphology, microstructure, and chemical composition of Ti6Al4V alloy by EPPo and their effects on surface corrosion resistance, wettability, and residual stress. The results showed that Ra decreased from 0.3899 to 0.0577 μm after EPPo. The surface crystallinity was improved, and the average grain size increased from 251 nm to more than 800 nm. The oxidation behavior of EPPo leads to an increase in surface oxygen content and the formation of TiO2 and Al2O3 oxide layers. EPPo can significantly improve the corrosion resistance and wettability of titanium alloy in simulated body fluid and eliminate the residual stress on the sample surface. The surface properties are enhanced not only by the reduction in surface roughness but also by the formation of a denser oxide film on the surface, changes in the microstructure, an increase in surface free energy, and the annealing effect developed during EPPo. This study can provide guidance and references for applying EPPo to biomedical titanium alloy parts.

1. Introduction

Ti6Al4V, as an α + β biphasic titanium alloy, is widely utilized in aerospace, defense, and biomedical fields due to its comprehensive performance [1,2,3]. Especially in the biomedical field, Ti6Al4V alloy is used for the manufacturing of bone implants, joint prostheses, and artificial heart valves due to its characteristics such as low density, high strength-to-weight ratio, low elastic modulus, corrosion resistance, and excellent biocompatibility [4,5]. However, titanium alloy exhibits a low thermal conductivity and high chemical reactivity, posing challenges during processing, such as elevated cutting temperatures, susceptibility to machining rebound, and surface hardening. Precision casting, CNC milling, and additive manufacturing are often used to process titanium alloy parts, leaving high roughness, remelting layers, uneven residual stress distribution, and other processing defects on the surface, affecting service performance. In addition, post-treatments, such as spraying hydroxyapatite coatings on some biomedical parts, require high-quality substrate surfaces. Therefore, polishing is often required to improve components’ surface quality and service life.
Electrolytic plasma polishing (EPPo) is an innovative metal surface finishing technology that combines anodic dissolution and plasma-chemical processes [6]. During processing, the workpiece is immersed in a low concentration of inorganic salt water-based electrolyte at a specific temperature. The vapor gaseous envelope (VGE) wrapping the workpiece is formed on the surface by applying a DC high voltage. Localized high voltage breaks down the VGE and leads to plasma generation. The anode surface forms the oxide film under plasma-enhanced electrochemical oxidation, which is then stripped off by complex physical and chemical processes such as discharge bombardment, electrochemical dissolution, and plasma discharge erosion. The dynamic equilibrium between the formation and stripping of the oxide film achieves the workpiece’s material removal and surface polishing [7]. Compared to other polishing methods, such as electrochemical and mechanical polishing [8,9,10,11], EPPo offers advantages such as no structural selectivity, no macroscopic forces, high processing efficiency, excellent polishing quality, and environmental friendliness. EPPo is particularly suitable for polishing biomedical parts with free-form surfaces or complex geometries such as knee joints, dental implants, and surgical instruments [12]. It can be used not only as a final processing procedure for biomedical parts but also as a pretreatment for thermal spraying [13], ion implantation [14], physical vapor deposition [15], chemical vapor deposition [16], and other processing processes, which has a broad application prospect in the biomedical field.
There are few reports on the research of EPPo on titanium alloys, mainly focusing on electrolyte and process optimization. Yongchun Zou et al. studied multiple factors affecting surface quality during EPPo, including voltage, time, electrolyte temperature, and immersion depth, and optimized the parameters through orthogonal experiments [17]. Smyslova et al. performed EPPo on a TC4 titanium alloy with an ultra-fine crystalline structure, discussed the electrolyte temperature and voltage range used, and studied the effect of processing time on surface roughness and material removal rate [18]. Kristina Navickaitė et al. compared two post-processing techniques for additive manufacturing of aerospace titanium parts, namely EPPo and powder blasting combined with EPPo [19]. The results show that the involvement of powder blasting can reduce the treatment time of EPPo and achieve the same surface quality but would reduce the fatigue resistance.
The effect of EPPo on surface properties such as the wettability and physiological corrosion resistance of Ti6Al4V alloys has not been reported and still needs further investigation. The interaction of proteins, enzymes, and cells in body fluids can cause corrosion of metal implants [20] and may lead to toxic side effects and implant failure [21,22]. Studies have shown that Al and V ions released by corrosion of Ti6Al4V implants may cause osteolysis and neurological diseases [23]. The wettability of implants can affect the cell–substance interaction, which impacts osteoblast growth and mineral deposition [24]. The residual stress will affect the stability and long-term performance of biomedical implants. Excessive residual stress may lead to fatigue damage to the material or cracking and failure due to stress concentration [25]. It has been reported that EPPo may affect the surface properties of parts. Since titanium alloy is a valve metal, plasma electrolysis treatment will leave a layer of ceramic oxide film on its surface, which may affect the wettability and corrosion resistance of the surface [24,26,27,28]. In addition, the dynamic composite energy generated during the EPPo process can affect the microstructure [29], causing changes in the surface residual stresses.
This paper investigated the effects of EPPo on the physiological corrosion resistance, wettability, and residual stress of biomedical Ti6Al4V alloys. First, the changes in surface morphology, roughness, microstructure, and surface chemical state before and after EPPo were characterized by scanning electron microscopy, super field microscopy, XRD, and XPS. Then, the effects of EPPo on the surface properties and the mechanism of its action were explored by testing and evaluating the surface properties of three kinds of PP, MP, and EPPo samples. This work can provide guidance and reference for applying EPPo technology in biomedical titanium alloys.

2. Materials and Methods

2.1. Sample Preparation

To facilitate characterization and testing, Ti6Al4V alloy plates of 20 × 15 × 3 mm conforming to GB/T13810-2017 [30] standards were used as workpieces, with the chemical composition (wt. %) shown in Table 1. The samples were sanded sequentially with 120, 240, and 500 mesh silicon carbide sandpapers to achieve a consistent roughness Ra of 0.4 μm (±0.05 μm). The surfaces were then ultrasonically cleaned using ethanol and deionized water and recorded as PP (pre-processing) samples. To verify that the effect of EPPo on surface properties was not solely caused by the reduction in surface roughness, the PP samples were sanded to a roughness value similar to that of the EPPo samples (0.05 ± 0.01 μm) using 1000, 1500, 2000, 3000, 5000, and 7000 mesh silicon carbide sandpaper, respectively, to serve as the control. The surfaces were cleaned and recorded as MP (mechanical processing) samples.

2.2. EPPo Process

The EPPo experimental platform mainly comprises the polishing pool, power supply, temperature control system, and anode fixture, as shown in Figure 1. The high-power DC power supply (IT6015D, ITECH, Nanjing, China) can provide a maximum power of 30 kW, a voltage of 1200 V, or a current of 30 A. The temperature control system used to regulate the temperature of the electrolyte consists of a temperature sensor, a controller, and a heater. The cathode is made of a 316 stainless-steel plate with dimensions of 100 × 100 × 3 mm. The workpiece is fixed to the fixture (made of titanium alloy) by punching a hole in the upper part of the workpiece. The distance between the cathode and anode and the depth of immersion in the electrolyte can be adjusted by moving the fixture. All processing parameters such as the voltage used for EPPo are shown in Table 2. The workpiece fixed to the anode fixture was immersed in the electrolyte before applying voltage. After processing, the surfaces were cleaned and recorded as EPPo samples.

2.3. Characterization

Surface morphology and energy dispersive spectra (EDS) were obtained using a thermal field emission scanning electron microscope (JEOL JSM-7900F, Tokyo, Japan). The three-dimensional morphology of the surface was measured using an ultra-depth-of-field microscope (Leica DM6M, Wetzlar, Germany). The high-precision surface roughness meter (Mahr M400, Gottingen, Germany) was used to measure the line roughness (ISO 4287:1997 [31], Lt = 5.6 mm) with a resolution of 0.8 nm and a contact measurement force of 0.75 mN. All samples were measured five times at the uniformly distributed position, and the results were averaged. The crystal structure and phase transition of the samples were characterized by XRD (Panalytical Empyrean, Almelo, The Netherlands) using Cu Kα radiation (λ = 0.15406 nm) with a scanning speed of 5°/min and a 2θ range of 5 to 90°. The chemical states of the surface elements were characterized using an X-ray photoelectron spectrometer (XPS, Thermo Scientific K-Alpha, Waltham, MA, USA). Peak splitting was fitted to the XPS data using the software Avantage 5.9, and all spectral peaks were calibrated with the C 1 s adsorbed carbon C-C/C-H binding energy of 284.8 eV.

2.4. Performance Measurement

The corrosion resistance was tested using an electrochemical workstation (CHI660E, Chenhua, Shanghai, China) and a three-electrode system, in which the sample was the working electrode, a high-purity platinum mesh was the counter electrode, and the Ag/AgCl electrode (CHI111, Chenhua, Shanghai, China, filled with 3 mol KCl solution) was the reference electrode. The test solution was the standard simulated body fluid PBS phosphate buffer, and the test temperature was 37.0 ± 0.5 °C, close to actual body temperature. The composition of PBS phosphate buffer (per liter, dissolved in distilled water) was as follows: 0.24 g KH2PO4, 1.44 g Na2HPO4, 8 g NaCl, 0.2 g KCl. The exposure area of the working electrode in the electrolyte was 1 cm2. The open circuit potential (OCP) of 1800 s was first measured and recorded to ensure the stability of the samples in PBS solution. After OCP measurements, an electrochemical impedance spectroscopy analysis was performed running a 5 mV peak-to-peak sinusoidal voltage signal in the 10−2 to 105 Hz frequency range. Dynamic potential polarization tests were then performed in the range of −0.5 to 0.5 V (relative to the OCP) with a scan step of 1 mV/s. A minimum of 3 samples were used for each electrochemical test to ensure accuracy and reproducibility of the data. Residual stress on the surface was measured using an X-ray residual stress analyzer (PROTO iXRD, Burnaby, BC, Canada) with Cu Kα as the source, 25 kV, 5 mA as the current, 2 s as the exposure time, and 10 exposures. All samples were measured 5 times at different positions, and the average value was taken to ensure the test accuracy. The surface wettability was measured by a video contact angle measuring instrument (JY-82C, Chengde, China) using the measurement height method. The test droplets were distilled water and ethanediol in a volume of 2 μL, and the test environment was at 25 °C and 45% humidity. According to the results of the contact angle measurement, combined with the surface energy parameters of the standard test solution (Table 3), the surface free energy of the sample was calculated by the following formula:
1 + cos θ = 2 γ s d ( γ l d γ l ) + 2 γ s p ( γ l p γ l )
γ l = γ l d + γ l p
where θ is the contact angle of the test liquid on the sample surface; γsd represents the free energy of the dispersive part of the sample surface; γsp represents the free energy of the polar part of the surface; γld and γlp denote the free energies of the surface nonpolar and polar parts of the test liquid, respectively.

3. Results and Discussion

3.1. Surface Roughness and Morphology

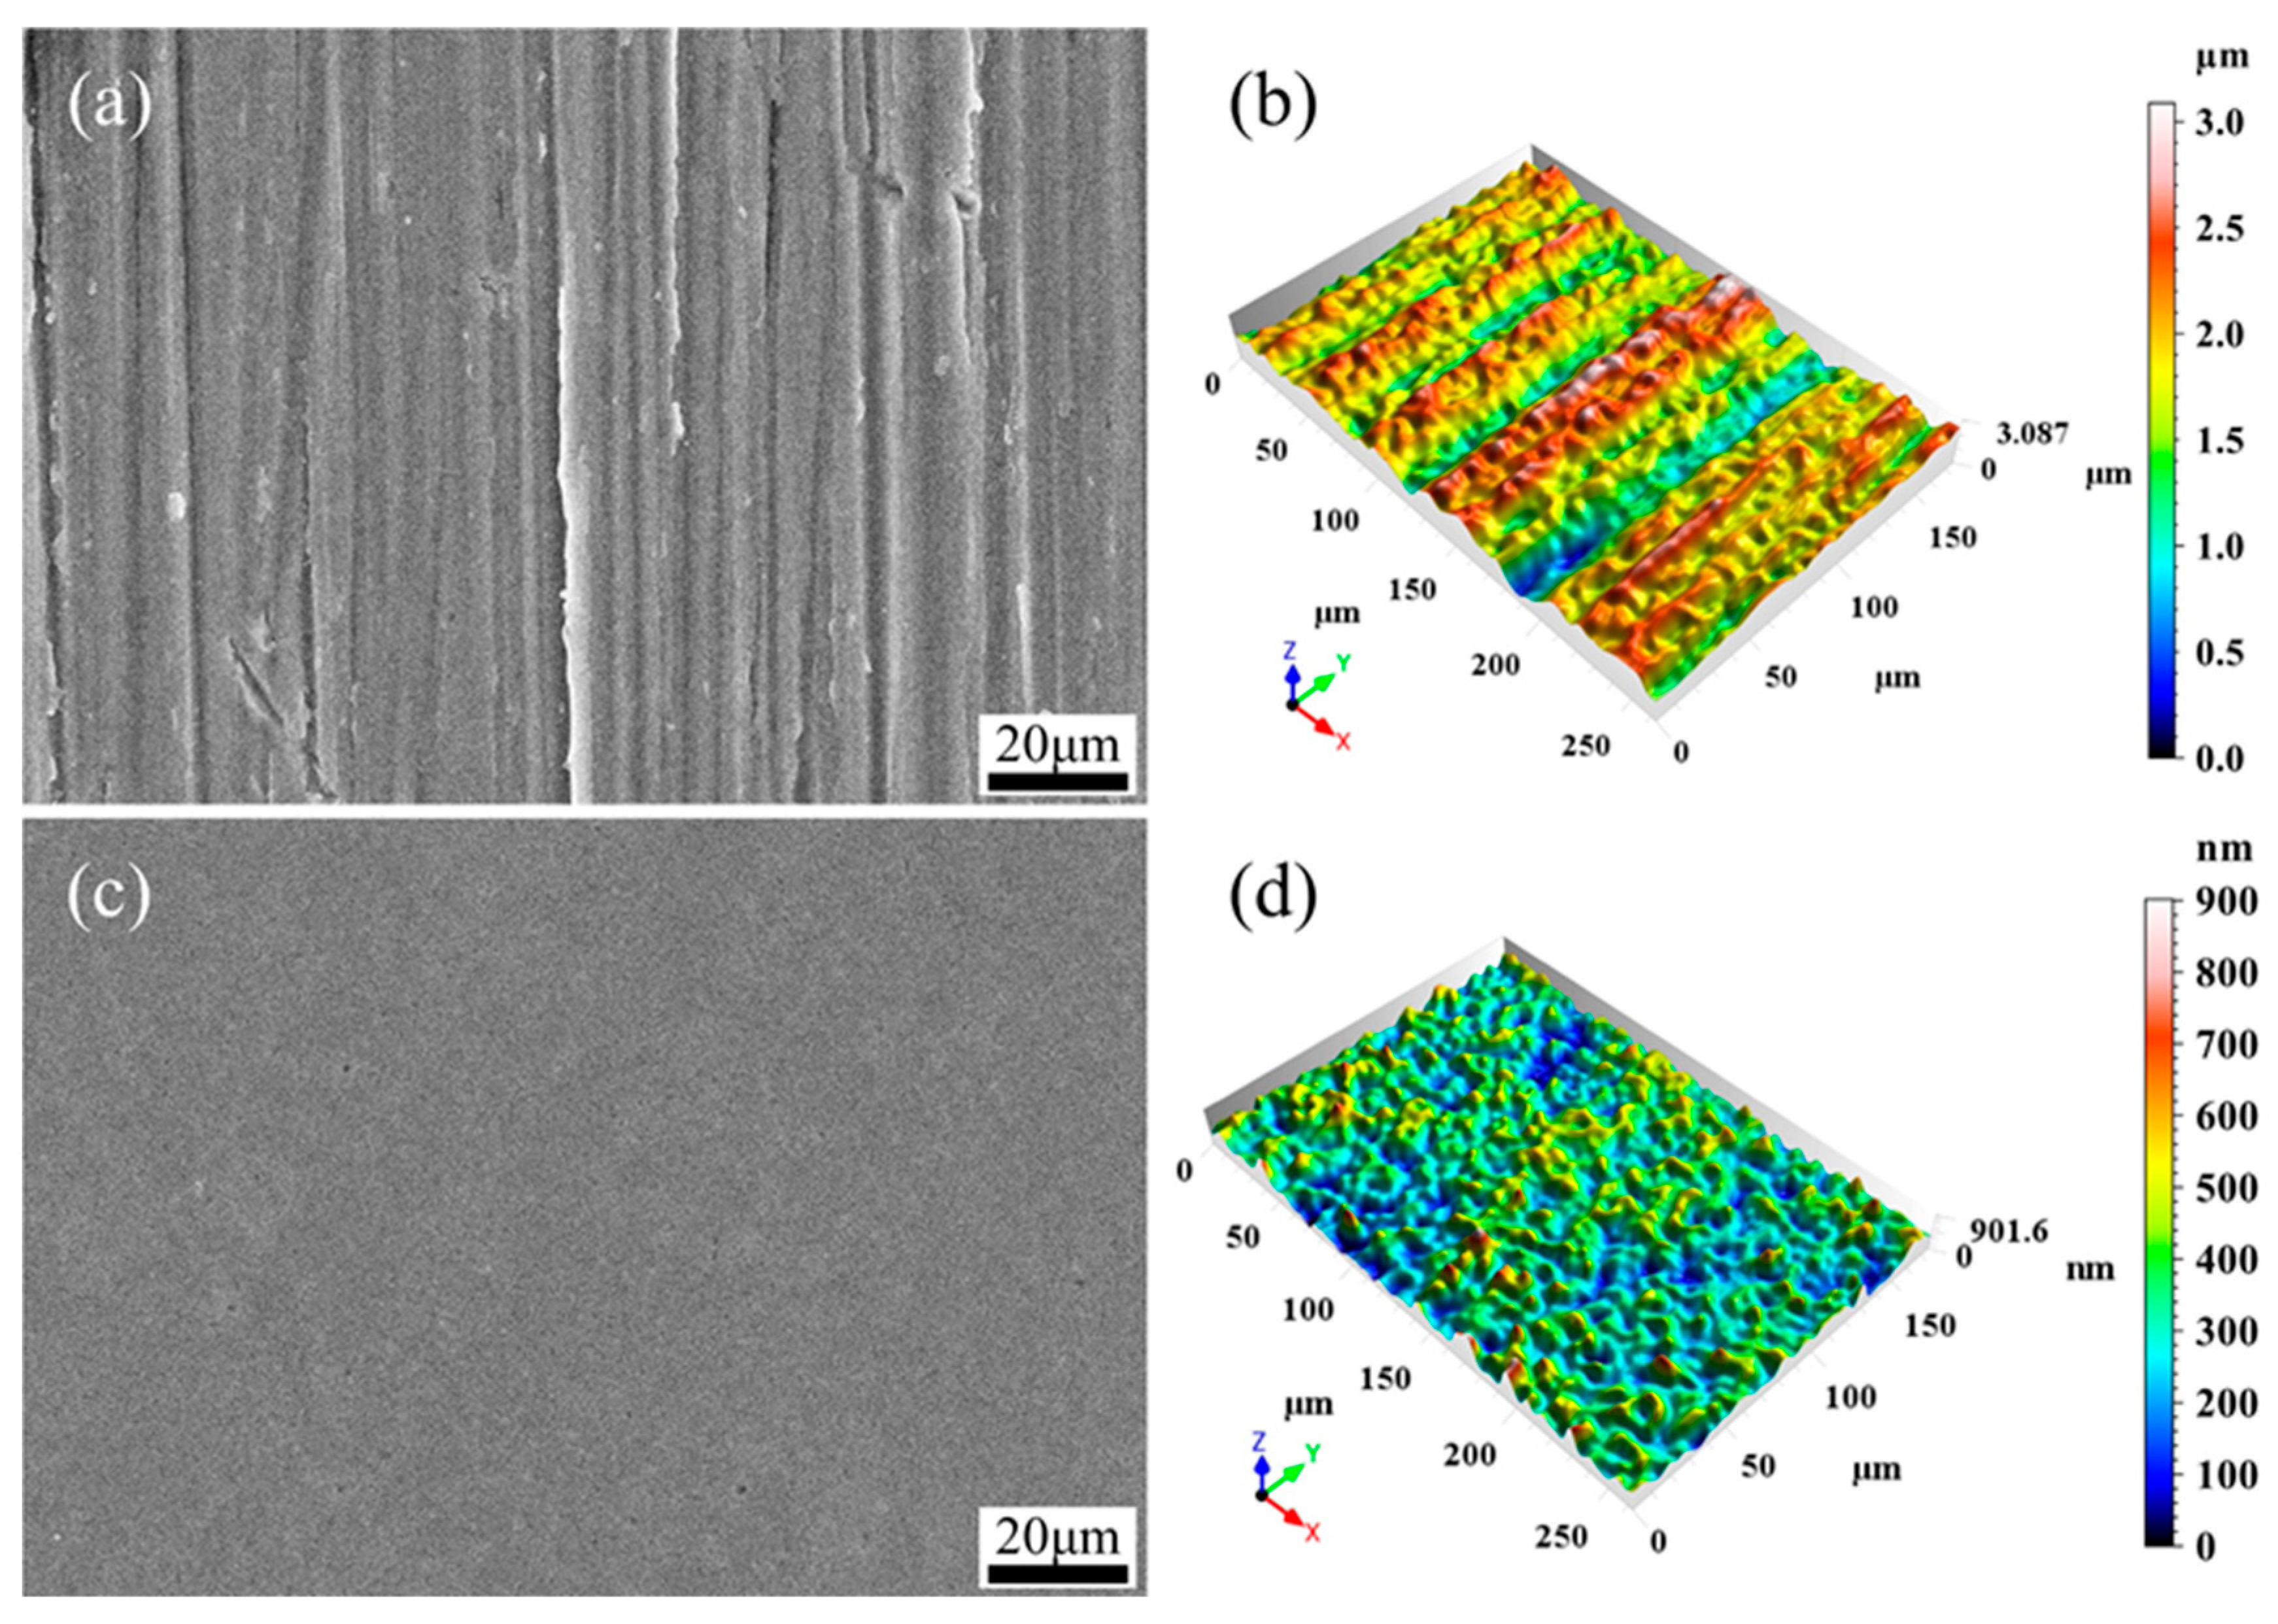
Figure 2 shows the SEM images and 3D topographies of the surfaces before and after EPPo processing. The SEM images show that the unpolished surface is rough and full of scratches, bumps, and pits left by sandpaper. The polished surface is smooth, and grinding marks such as scratches, bumps, and pits are entirely removed. From the 3D topography, it can be seen that the difference in peak and valley heights on the unpolished surface is obvious, and the scratches are clearly visible. The height of peaks and valleys on the surface is significantly reduced and distributed more uniformly. The results show that EPPo can effectively remove the convex peaks on the titanium alloy surface, make the distribution of peaks and valleys on the surface uniform, and improve the surface topography.
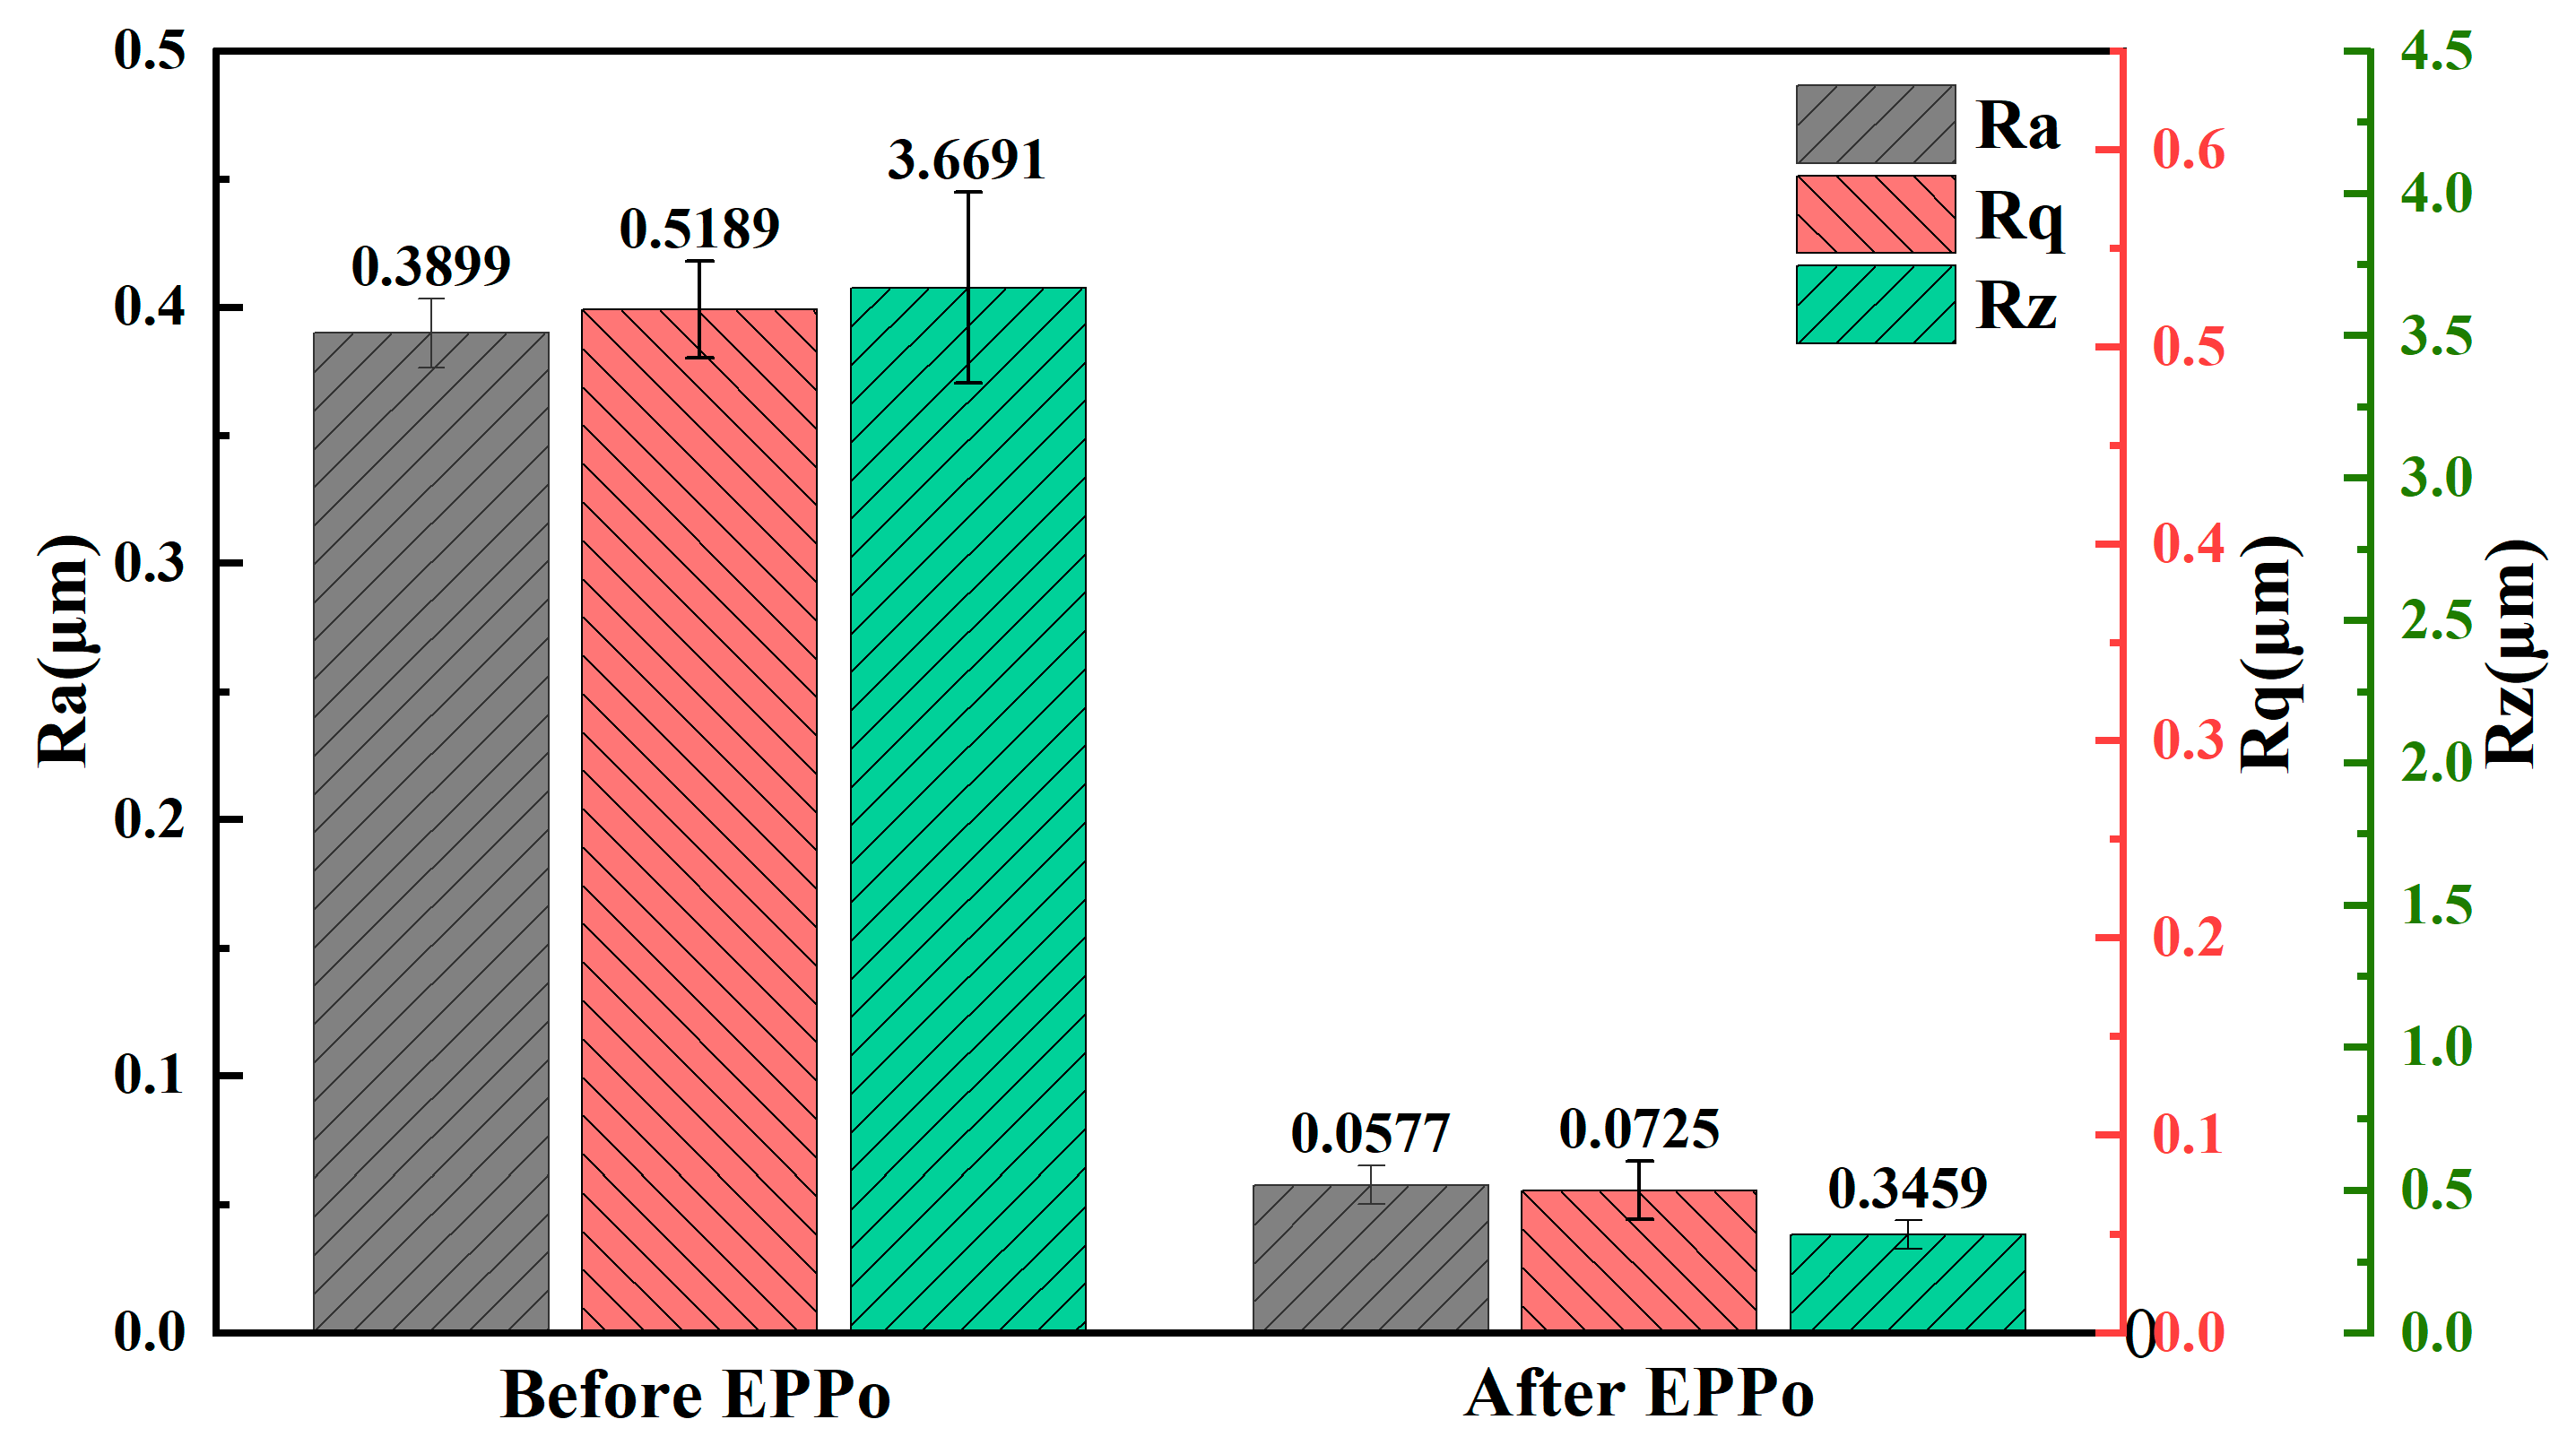
The roughness measured according to the ISO4287 standard is shown in Figure 3. All results are the averages of five measurements. It can be seen that after EPPo processing, Ra, Rq, and Rz are reduced from 0.3899, 0.5189, and 3.6691 to 0.0577, 0.0725, and 0.3459 μm, with a reduction rate of 85.20%, 86.03%, and 90.57%, respectively. The roughness Ra was reduced by three grades. The results show that EPPo can significantly reduce the surface roughness of titanium alloys and improve the smoothness and cleanness of the surface.

3.2. Microstructure Analysis

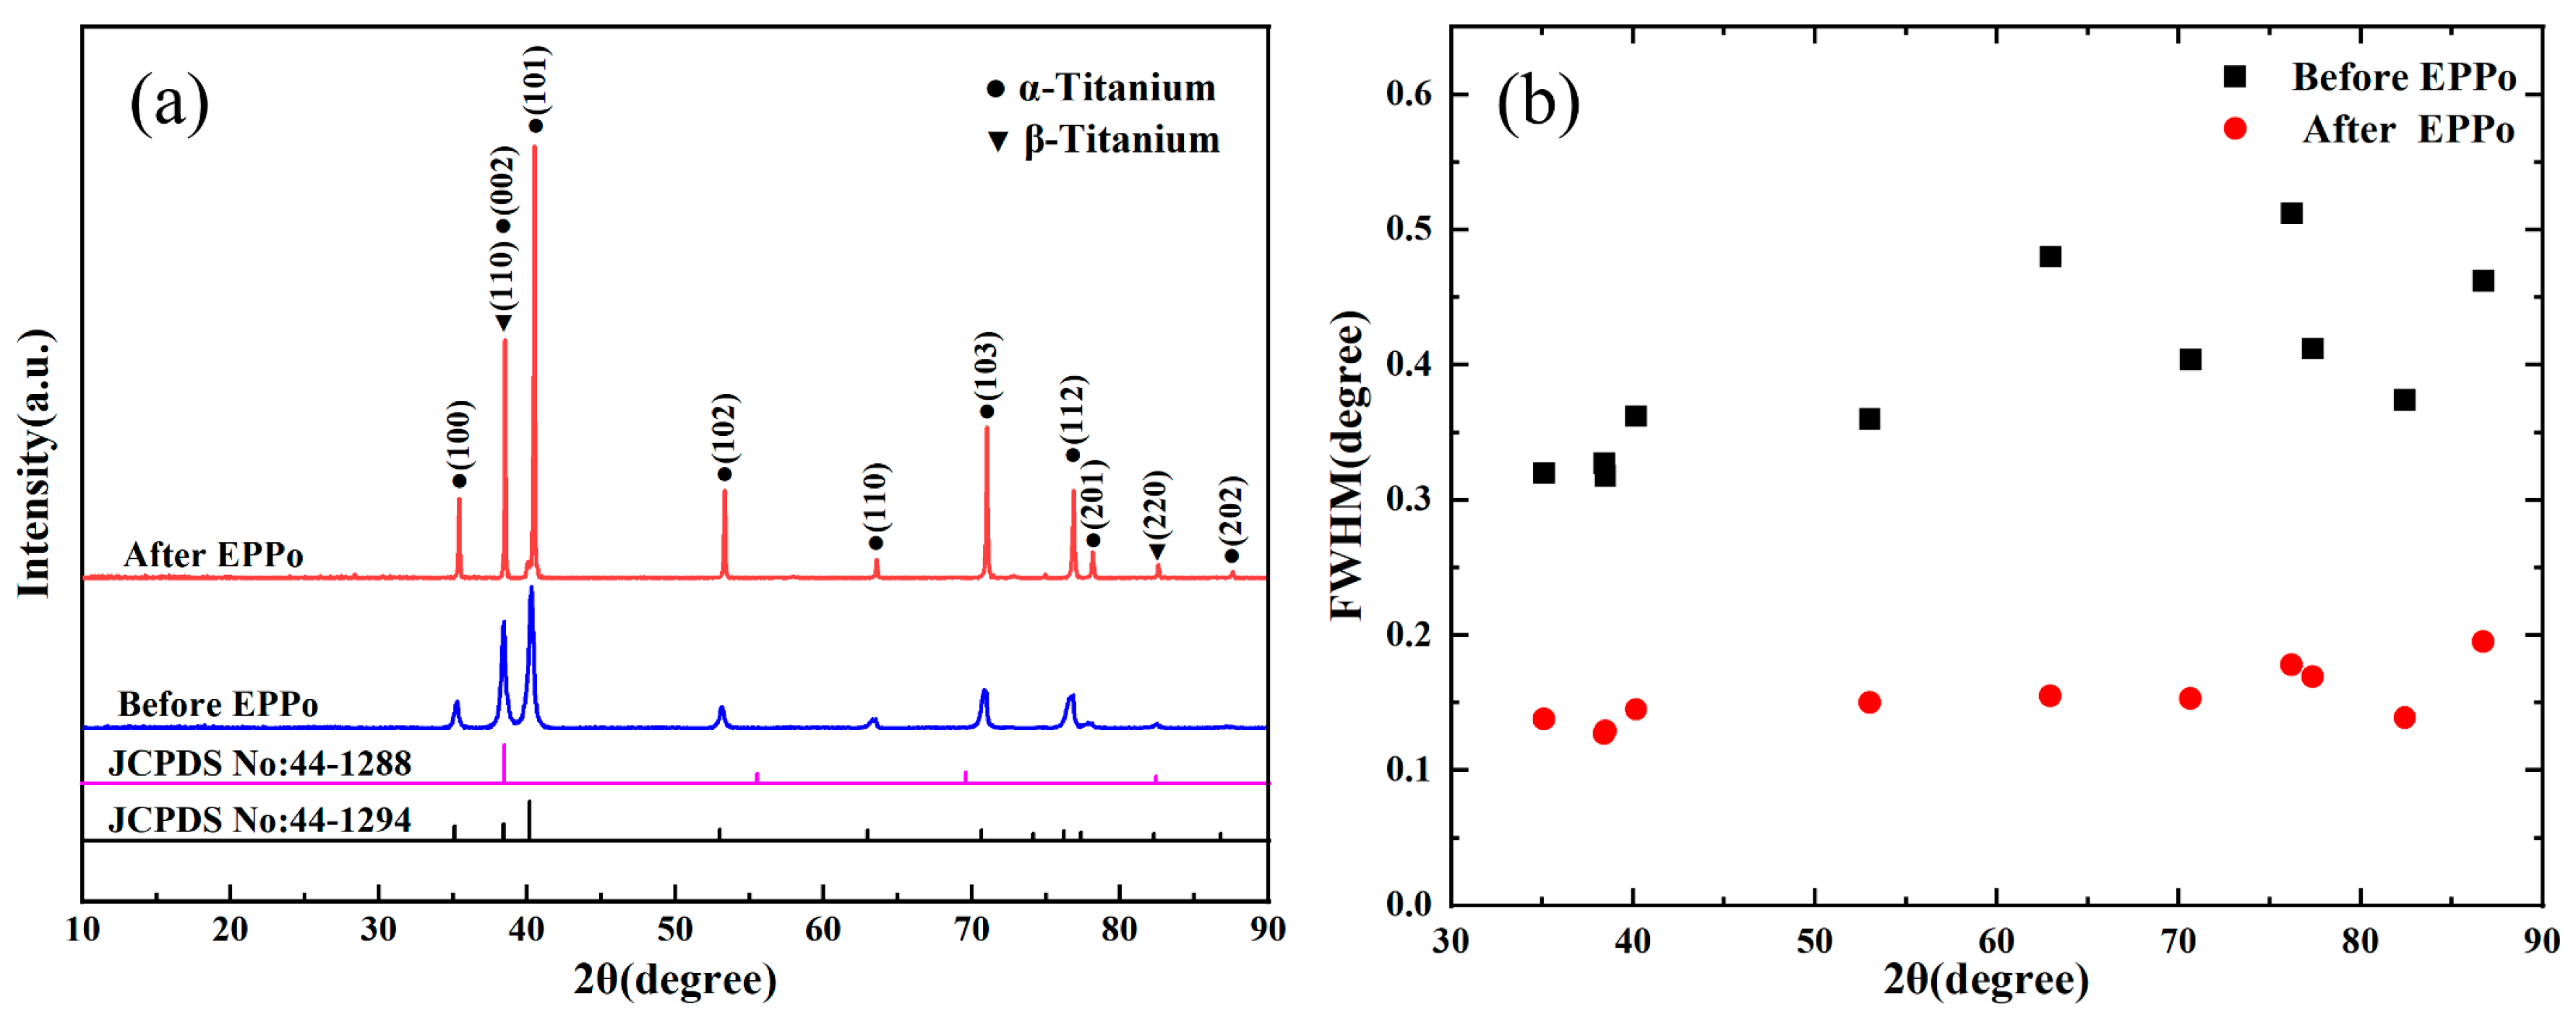
The XRD patterns of the sample surfaces before and after polishing are shown in Figure 4a. After comparison with the standard pdf card, the diffraction peaks appearing on the sample surface near 35.093°, 38.421°, 40.170°, 53.004°, 62.949°, 70.660°, 76.218°, 77.368°, 86.759° correspond to (1 0 0), (0 0 2), (1 0 1), (1 0 2), (1 1 0), (1 0 3), (1 1 2), (2 0 1), (2 0 2) dense hexagonal structure (HCP) α-titanium on the crystal plane, and the diffraction peaks appearing near 38.481°, 82.444° correspond to (1 1 0), (2 2 0) body-centered cubic structure (BCC) β-Ti on the crystal plane. After EPPo treatment, no new diffraction peaks appeared, but the intensity of each diffraction peak was enhanced to varying degrees, indicating that the crystallinity was improved. The variation in FWHM (full width at half maxima) of each diffraction peak is shown in Figure 4b. The FWHM of the sample after EPPo was significantly reduced, which may be caused by the increase in temperature of the sample surface during EPPo. According to studies related to electrolytic plasma processing [32,33,34], the surface temperature of the sample during EPPo processing may reach hundreds of degrees Celsius instantaneously and is subsequently cooled by the electrolyte. The stress in the crystal cell was released under thermal activation, and the grain grew and coarsened. Crystallite size before and after EPPo is shown in Table 4. The average grain size of the sample increased from 251 Å to more than 800 Å after EPPo. Variations in sample temperature can have potential effects on surface properties, such as promoting stress adjustment and relaxation, promoting ordered and tight arrangement of grains, thereby affecting residual stress, surface energy, and corrosion resistance.

3.3. Surface Elements Analysis

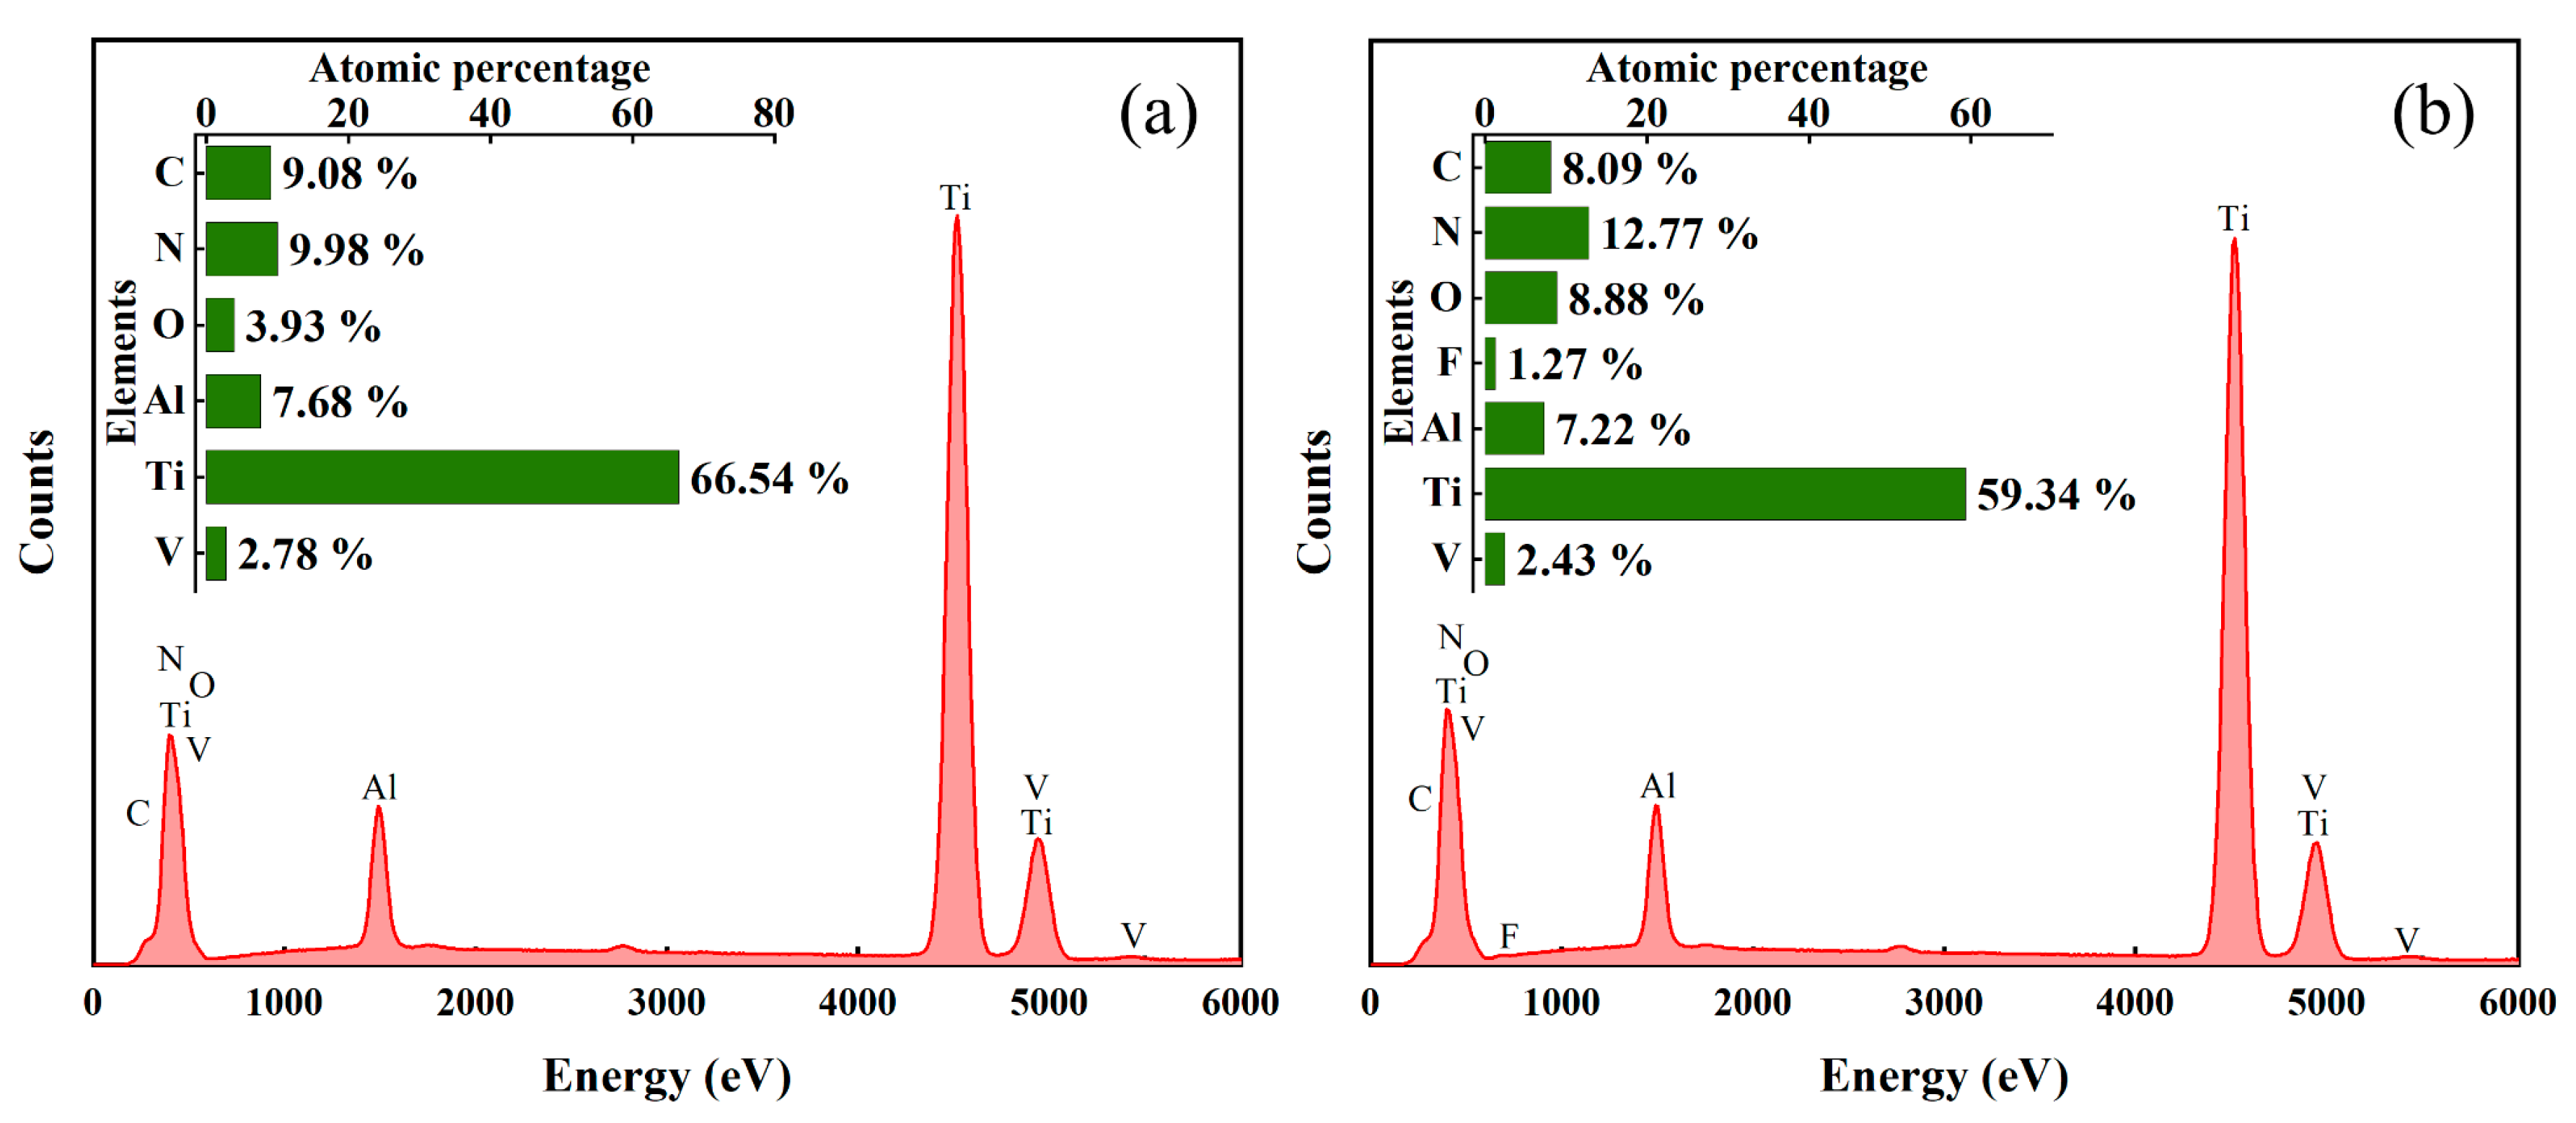
Figure 5 shows the EDS results of the surface before and after EPPo. EDS is a semi-quantitative analysis in which the number of atoms represents only a relative percentage of each other. It can be seen that the relative content of metal elements (Ti, Al, V) atoms on the polished surface is reduced, and the content of oxygen atoms is more than doubled. This is mainly due to the fact that EPPo is a material removal process that involves the formation and removal of oxide films. The increased content of oxygen atoms originates from the oxide film left on the polished surface. The increased content of nitrogen and fluorine atoms can be attributed to the polishing solution consisting of ammonium fluoride and potassium fluoride used for the titanium alloy EPPo.
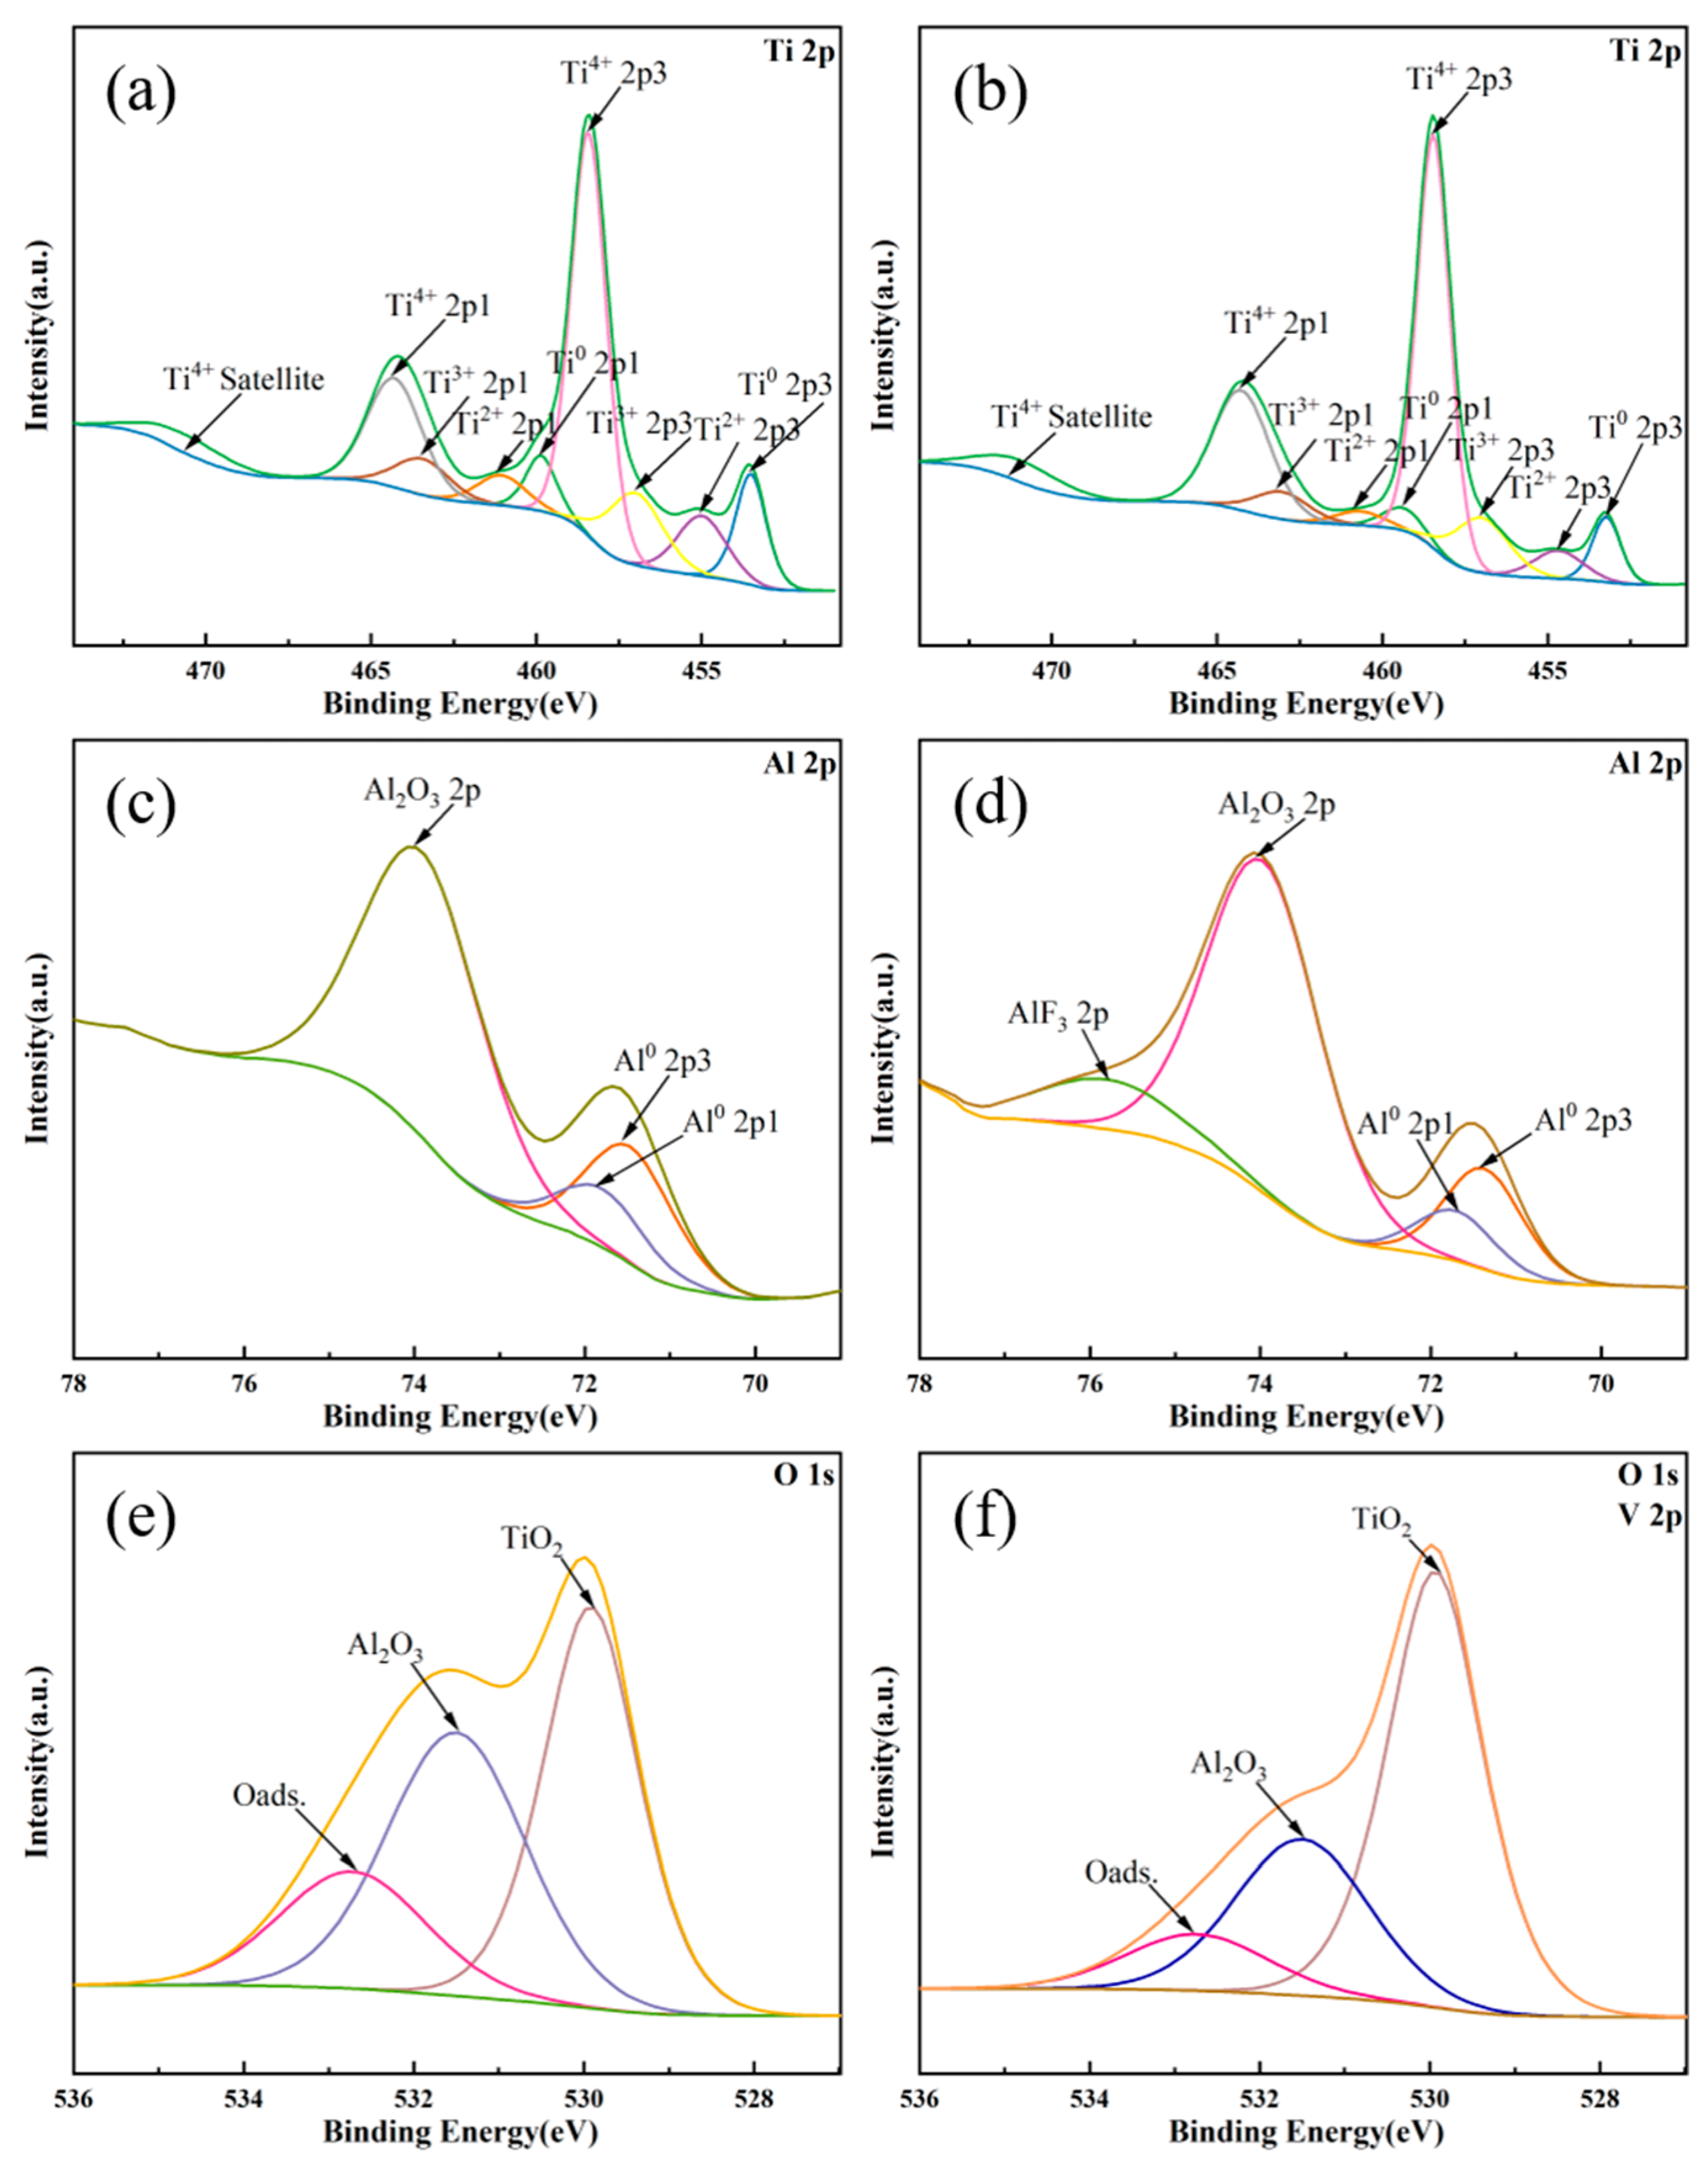
According to the position of the binding energy of the fine spectrum and the database, the chemical states of different elements and the content changes in each chemical state before and after EPPo can be obtained. The XPS fine spectra of Ti, Al, and O elements on the sample surface before and after EPPo are shown in Figure 6. As shown in Figure 6a,b, the Ti elements on the sample surfaces are both composed of Ti0, Ti2+, Ti3+, Ti4+, and Ti4+ satellite peaks corresponding to the binding energy positions of 453.4, 455, 457.0, 458.4, and 471 eV [35,36,37]. In Figure 6c,d, the peaks with binding energies of 73.9, 75.8, and 71.5 eV correspond to Al2O3, AlF3, and Al0 [35,36,38,39]. The Al elements on the surface of the sample were mainly Al2O3 and Al0 before polishing and were composed of Al2O3, AlF3, and Al0 after polishing. From Figure 6e,f, it can be seen that the O elements on the sample surfaces have the same three chemical states, namely TiO2, Al2O3, and Oads. (adsorbed oxygen), which correspond to the binding energy positions of 529.9, 531.5, and 532.7 eV [36,40]. However, the content of different chemical states of each element varies significantly.
The atomic percentage changes for the different chemical states of Ti, Al, and O elements are shown in Table 5. It can be seen that the contents of Ti0, Ti2+, and Ti3+ on the sample surface decreased after EPPo treatment, while the content of Ti4+ increased significantly to 68.82%. The Al2O3 content did not change much, but the new appearance of AlF3 accompanied the decrease in Al0 content. This may be because Al0 was first oxidized to Al2O3, which then reacted with HF in the electrolyte to form AlF3 [7]. In terms of O elements, the contents of Al2O3 and Oads. were decreased, while TiO2 was significantly increased. It can be concluded that the oxidation reaction of Ti and Al elements from low to high valence states occurs during EPPo, and the main components of the surface film are TiO2 and Al2O3. EPPo resulted in a significant increase in TiO2 content in the surface film of the samples.

3.4. Corrosion Properties

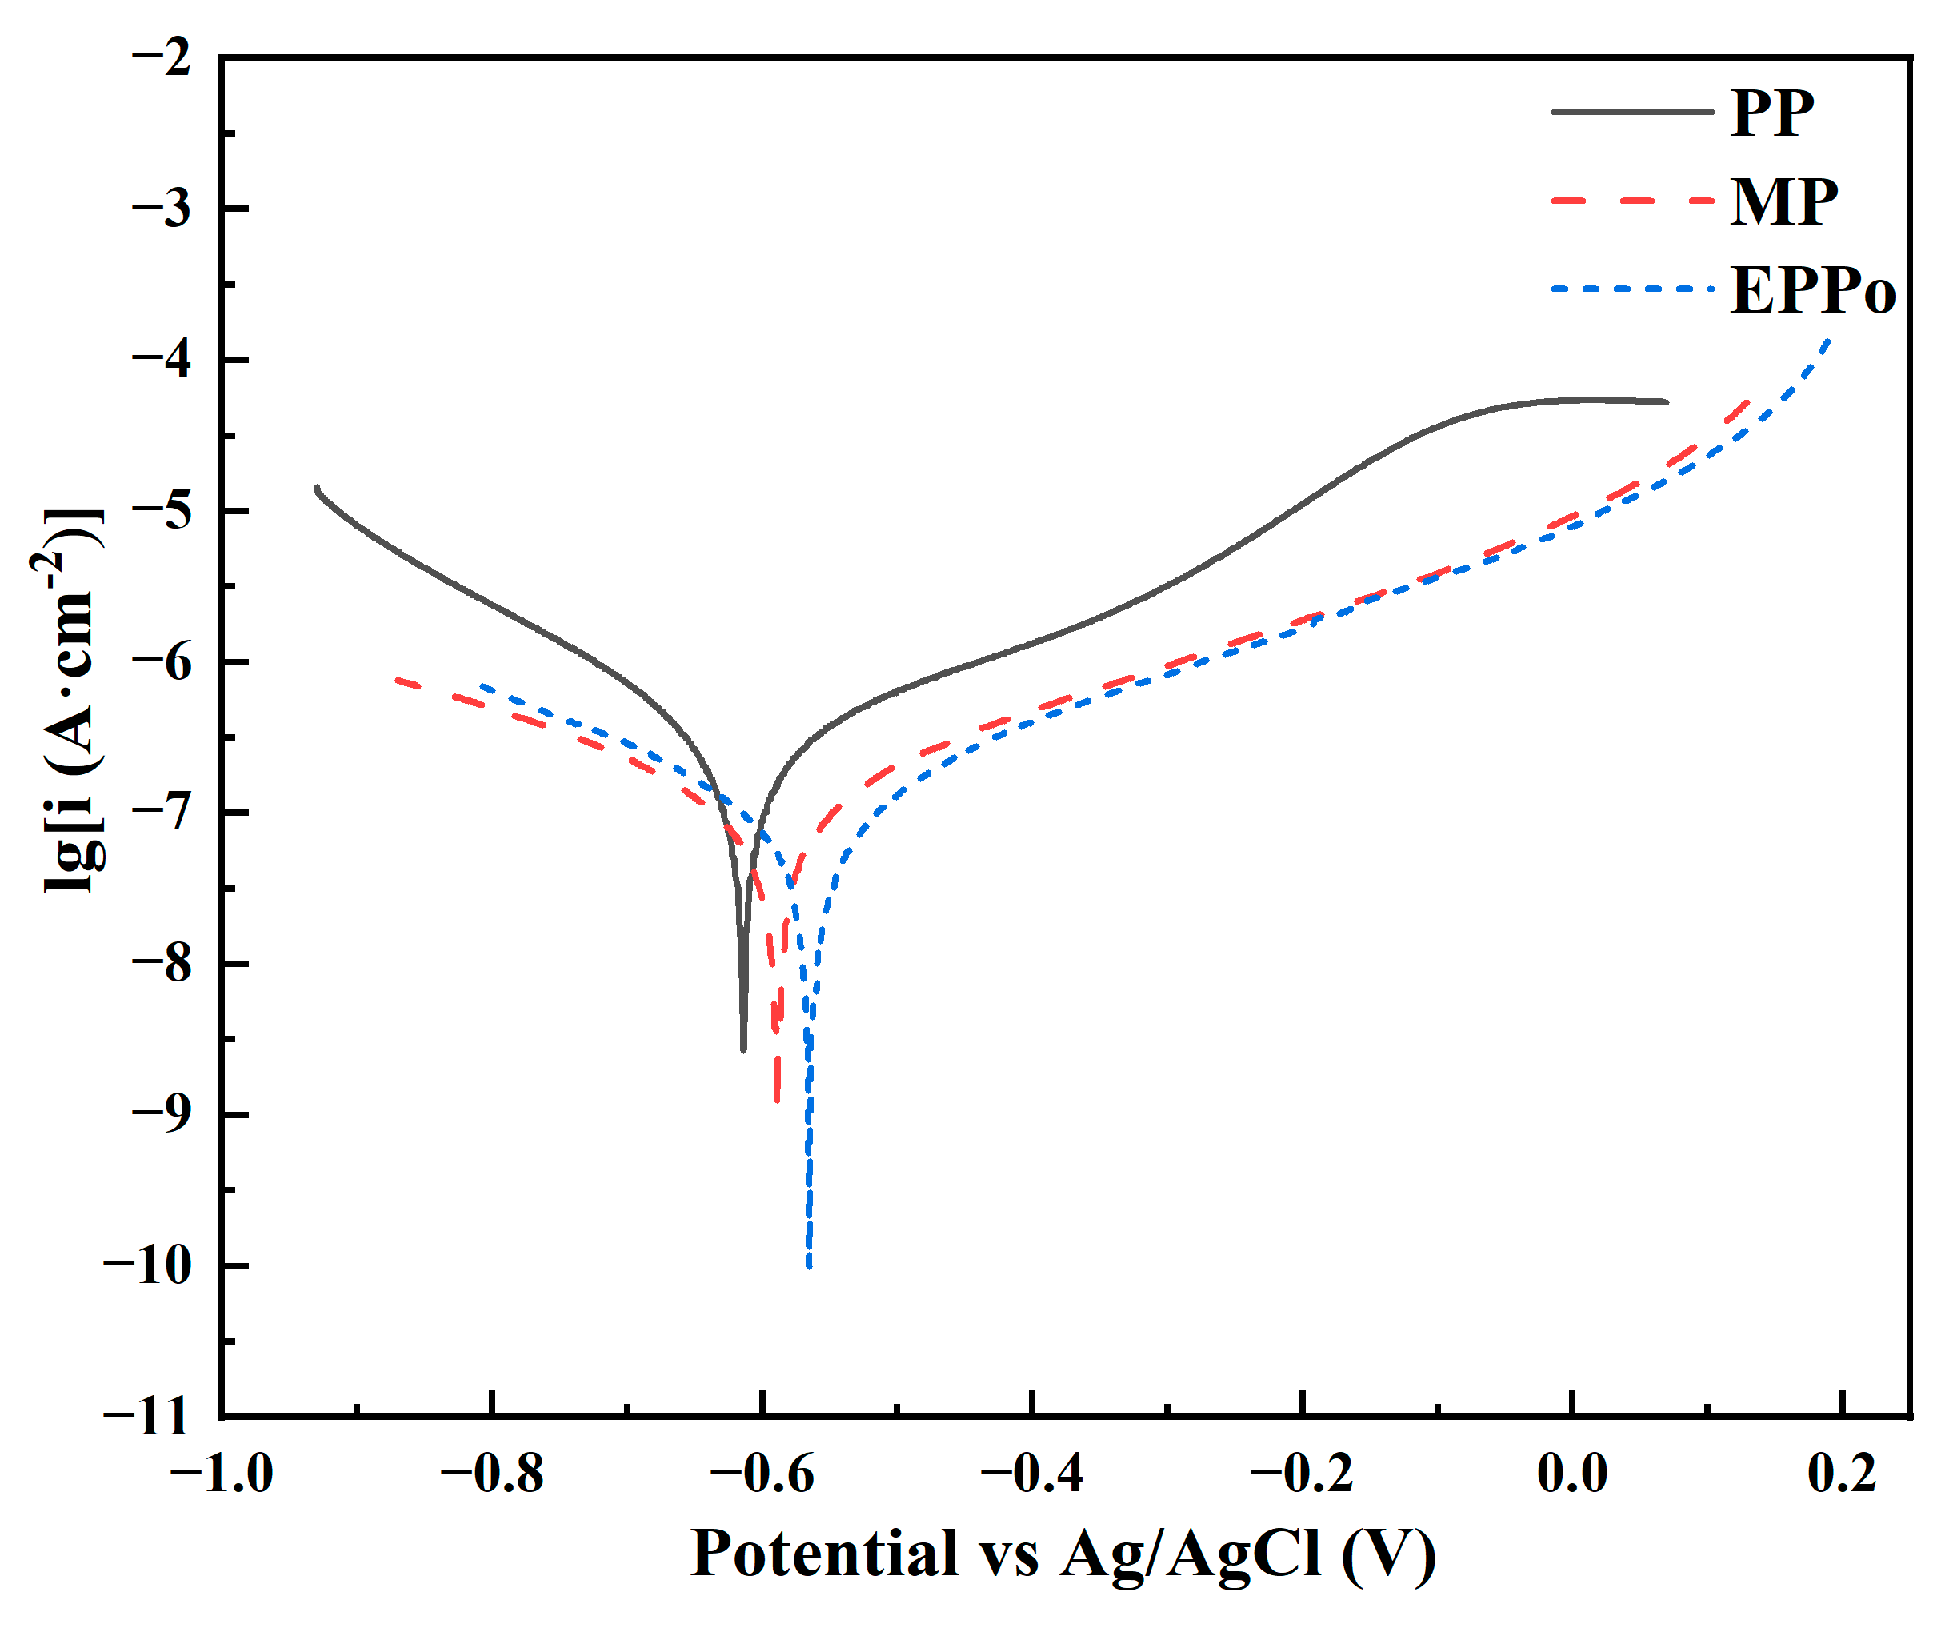
The anodic polarization curves of PP, MP, and EPPo samples in PBS simulated body fluids are shown in Figure 7. Table 6 shows the fitting parameters obtained from the polarization curves. Corrosion potential (Ecorr) is the equilibrium potential measured when the metal reaches a steady state of corrosion without applying an external current. The higher the corrosion potential, the higher the energy required to initiate corrosion, and the better the corrosion resistance [41]. The corrosion current (Icorr) is the corresponding current under the condition of corrosion potential, reflecting the corrosion rate of the anode under no applied current. From Faraday’s law, the corrosion rate is positively correlated with the corrosion current density [42]. Polarization resistance (Rp) is an important index to evaluate metal materials’ corrosion resistance. The greater the polarization resistance, the more complete, dense, and stable the oxide film on the surface of the metal material and the stronger the ability to resist corrosion. The Ecorr values of PP, MP, and EPPo samples were −0.614, −0.589, and −5.556 V; Icorr values were 0.266, 0.125, and 0.076 μA·cm−2; and Rp values were 149.896, 380.792, and 523.439 kΩ, respectively, indicating that the corrosion resistance of PP, MP, and EPPO samples increased in order. The corrosion potential and corrosion current of the PP samples were compared with those of the Ti6Al4V alloy in PBS solution reported in the relevant literature. Ecorr and Icorr were −0.470 V and 1.019 μA·cm−2 for the commercial Ti6Al4V alloy [43] and −0.350 V and 0.143 μA·cm−2 for Ti6Al4V without surface coating [44], respectively. Considering differences such as surface roughness, the Tafel curve fitting data were considered reliable. EPPo can significantly improve the surface corrosion resistance of Ti6Al4V alloy.
To further study the electrochemical behavior of the passivated film on the sample surface by EPPo, the corrosion resistance of the sample was further analyzed by electrochemical impedance spectroscopy (EIS). Nyquist plots and Bode phase diagrams of different sample surfaces in PBS solution are shown in Figure 8, corresponding to the corrosion reaction at the interface between Ti6Al4V and PBS solution at the simulated body temperature. In general, the larger the radius of the impedance arc, the better the corrosion resistance of the samples [45]. The Nyquist plots show that the impedance arcs of PP, MP, and EPPo samples increase sequentially, reflecting the sequential enhancement of their electrochemical corrosion resistance. In the low-frequency range of the Bode plot, the impedance modulus and phase angle of the PP, MP, and EPPo samples increase sequentially in the low-frequency region, proving that their corrosion resistance increases sequentially. The phase angles of the samples were all less than 90 degrees, indicating the existence of an oxide film on the material surface that can resist corrosion. The oxide films on the surface of PP and MP samples come from the natural oxidation of Ti6Al4V with oxygen in the air. The density and stability of the oxide film may be one of the reasons for the difference in corrosion resistance [46].
The equivalent circuit (Figure 9) is used to fit the EIS results of the samples, where Rs is the solution impedance; Rct corresponds to the charge transfer impedance, which reflects the electrochemical corrosion resistance; CPE represents the constant phase angle element of the capacitance of the electric double layer formed by the sample and the solution. CPE parameters were obtained by the following formula [47]:
Z C P E = T j w P 1
where T is the constant of CPE, ω is the frequency, j2 = −1, and P represents the CPE index (0.5 ≤ P ≤ 1). When P = 1, the CPE acts as an ideal capacitor. The equivalent capacitance C is defined as follows:
C = T R 1 - P 1 / P
where R is the resistance in parallel with the capacitor in the equivalent circuit. The software Zview 3.1 was used to fit the EIS test data, and the fitting results are shown in Table 7. The parameter residuals of the fitting procedure ranged from 0.04 to 4.56%.
From Table 7, it can be seen that Rs varied very little, which is due to the fact that the uses of EIS were all performed in the same solution conditions. The fitting Rct of PP, MP, and EPPo samples were 179.89, 381.18, and 1109.10 kΩ·cm2, respectively, indicating that the charge transfer impedance gradually increased during the corrosion process. The change in bilayer capacitance is related to the surface porosity. The lower the porosity, the smaller the equivalent capacitance C [48]. Under the same roughness condition, the equivalent capacitance of the EPPo sample is significantly smaller than that of the MP sample, indicating that the oxide film on the surface of the EPPo sample is denser and more resistant to corrosion. This is similar to the mechanism of corrosion resistance of selective laser melting Ti6Al4V in a variety of solutions [43].
The reduction in surface roughness and higher levelling degree can improve corrosion resistance. After the surface of the sample is in contact with the solution, there are different degrees of bumps and dents on the micro-surface, and the height difference makes the microstructure and the flow state of the medium in different regions different. When the surface flatness is improved, the small surface irregularity is removed, reducing the contact area between the surface and the solution, resulting in a decrease in the corrosion current. This may explain the superior corrosion resistance of MP and EPPo samples over PP samples. Corrosion resistance is also related to the microstructure and surface oxide film [49]. The EPPo and MP samples have the same roughness, but the corrosion resistance of the EPPo sample is significantly better than that of the MP sample. After the EPPo treatment, the surface crystallinity of the sample improved, and the grain size increased. The increase in crystallinity may reduce the number of defects and dislocations, thus reducing the starting point and the rate of expansion of corrosion. The increase in grain size may imply a decrease in the grain boundary area, thus reducing the possibility of surface corrosion by PBS solution. According to the analysis of surface elements in Section 3.3, EPPo oxidizes the sample’s surface and forms a denser oxide film than the PP samples. The TiO2 oxide film has higher chemical stability, while also blocking the direct contact of the external medium to the metal matrix and inhibiting the corrosion at the grain boundaries. This may also be an essential reason for why EPPo improves the corrosion resistance of the samples.

3.5. Wettability

The contact angle can describe the degree of wetting of a liquid on a solid surface. Figure 10 compares the contact angle and water droplet images of distilled water and ethylene glycol on the surface of PP, MP, and EPPo samples. On the three sample surfaces, the average contact angles of distilled water droplets were 81.14, 55.78, and 69.78°, and those of ethylene glycol droplets were 55.17, 39.03, and 42.78°, respectively. The contact angles of the sample surfaces were all less than 90°, showing overall hydrophilicity. The smaller the contact angle, the stronger the interaction between the liquid and the solid surface and the better the wettability. The wettability of the three materials ranked as MP > EPPo > PP. The hydrophilicity of solid surfaces is mainly determined by internal factors (such as chemical composition, functional groups, etc.) and external factors (such as roughness, surface structure, etc.). The superior wettability of MP and EPPo samples compared to PP samples is mainly due to the reduction in surface roughness and microscopic morphology levelling [50]. Reduced roughness means that the surface’s concave and convex structures at the microscopic scale become flatter and uniform. The liquid will form a larger contact area at the depression, which is conducive to uniform distribution and adsorption on the surface, thus improving the wettability. The inferior wettability of EPPo samples compared to MP samples could be due to the surface structure, chemical composition, and surface energy. Sandpaper sanding leaves small scratches and textures on the surface, helping to increase the effective contact area of the surface and improving the unfolding and diffusion of droplets on the surface. Compared with MP samples, the denser oxide film on the surface of EPPo samples will reduce the surface porosity and form a flatter and smoother surface without microstructure, which makes it difficult for droplets to penetrate into the oxide film and thus reduce the wettability.
The results of the sample surface free energy calculated according to Equations (1) and (2) in Section 2.4 are shown in Table 8. The dispersive part of the surface free energy of PP, MP, and EPPo samples increased first and then decreased, while the polar part decreased first and then increased. The surface free energies were 30.5725, 44.7122, and 36.2707 mJ·m−2, respectively. The surface free energy is the embodiment of the intermolecular forces on the surface of an object, and the improvement of the surface free energy usually has a positive effect on the wettability. After MP and EPPo, the surface free energy of the sample is significantly increased, and the wettability is enhanced. Compared with MP samples, the surface free energy of EPPo samples is reduced. This may be due to the fact that the dense TiO2 oxide film usually has a more ordered molecular arrangement structure and restricts the intermolecular space, making the intermolecular forces stronger. The enhanced intermolecular forces will reduce the free energy on the surface of the EPPo sample, thus resulting in slightly weaker wettability than the MP sample. However, in general, the surface free energy and wettability of PP samples are increased after EPPo processing. The increase in free energy can increase the adsorption capacity of the surface to the liquid, thus promoting the uniform distribution and rapid expansion of the liquid on the surface and improving the wettability. The higher surface free energy helps to adsorb extracellular matrix and proteins and promotes cell adhesion and growth, thus reducing rejection between the implant and the tissue [28]. By increasing the surface free energy, the interaction between the implant and the surrounding environment can be improved by increasing the interaction force with body fluids and improving the drug release efficiency to improve the implant’s functional performance.

3.6. Residual Stress Variation

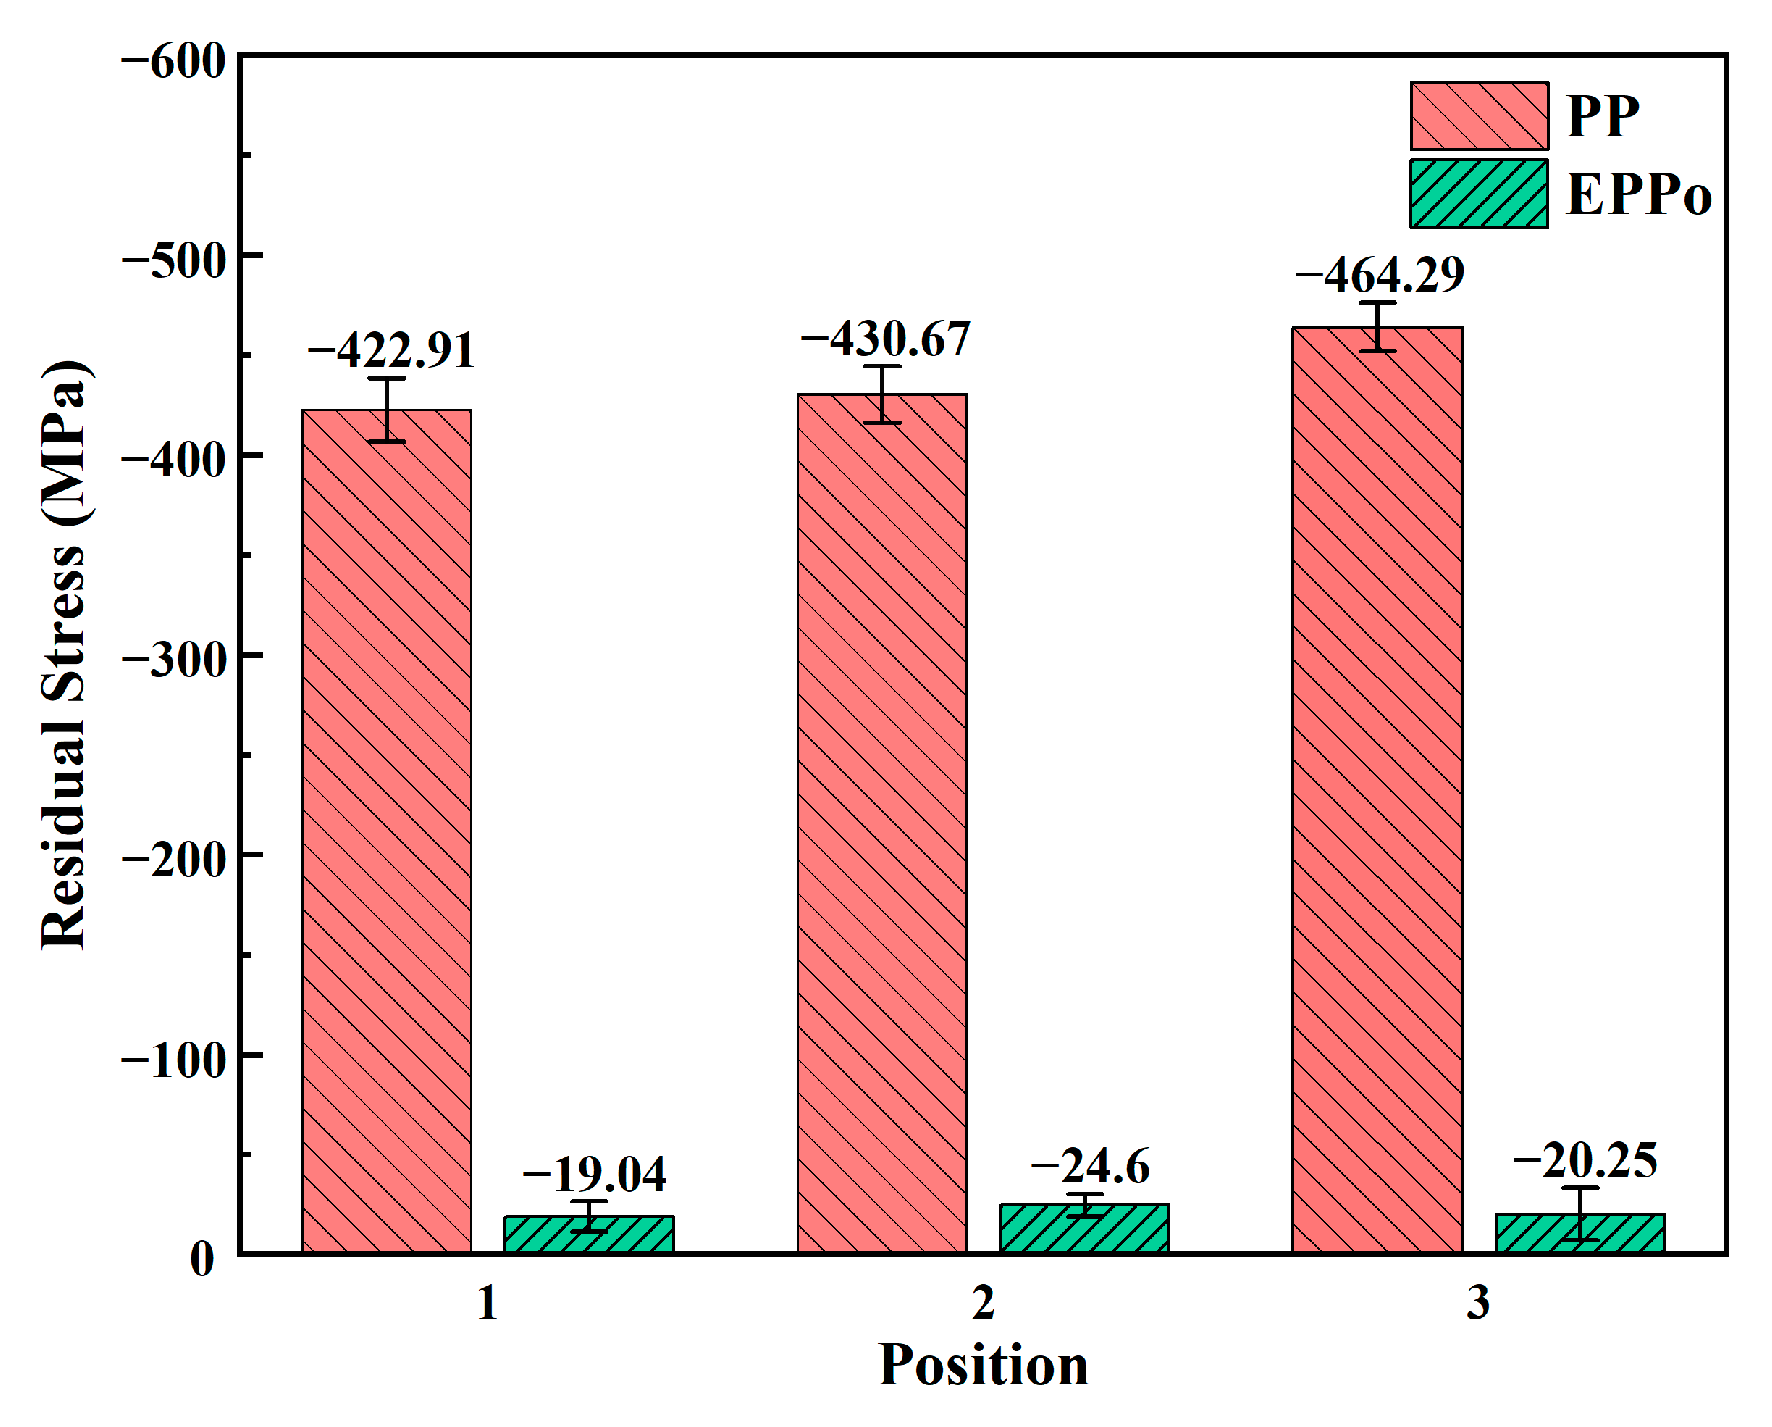
The variation in residual stresses on the Ti6Al4V surface before and after EPPo is shown in Figure 11. It can be seen that the residual stresses of the samples are all manifested as compressive stresses because the titanium alloy plates used are roll-formed and subjected to extrusion by the rollers during the forming process. After EPPo, the residual stresses on the surface decreased dramatically, with the average value reduced from 439.29 to 21.30 MPa and a reduction rate of 95.2%, showing the phenomenon of stress elimination. This may be due to the increase in sample surface temperature under plasma bombardment and ohmic heat during EPPo. With the continuous generation and rupture of VGE, the workpiece and the electrolyte are constantly in contact and separation [34]. The surface temperature of the sample is continuously increased and decreased alternately to form an annealing effect, which causes the residual stress on the surface to be released quickly. Its essence can be seen as the microstructure evolution and stress relaxation behavior of the material at a certain temperature [51]. According to the analysis of microstructural changes in Section 3.2, after EPPo, the increase in crystallinity and grain size on the sample surface can reduce the number of grain boundaries and reduce the local dislocation barrier and stress concentration phenomenon, which are thus conducive to the reduction in residual stress. The reduction in residual stress is helpful to inhibit the stress concentration phenomenon, reduce the risk of mechanical failure such as fracture of biological implants, and improve the long-term reliability of biological implants [52]. The fatigue crack propagation rate of the material under cyclic loading conditions will also decrease with the reduction in residual stress, thereby prolonging the fatigue life of biomedical implants [53]. In addition, the reduction in residual stress may also reduce the local wear and fatigue wear of the material surface, which in turn improves the contact conditions between the implant and the surrounding tissues, reduces the friction and wear of the implant, and improves its long-term mechanical properties and durability.

4. Conclusions

This study investigated the effects of EPPo on the surface characteristics and properties of Ti6Al4V alloy. The variations in surface properties, such as surface roughness, surface morphology, microstructure, and chemical state of surface elements before and after EPPo, were analyzed. The effects of EPPo on the physiological corrosion resistance, wettability, and residual stress of the sample surface were comparatively studied, and the influence mechanism of EPPo on surface properties was explored in combination with the variations in surface characteristics. Based on the experimental results and discussion, the following conclusions can be drawn:
(1)
EPPo can significantly reduce the surface roughness of Ti6Al4V alloy and improve the surface morphology. After EPPo, the sample surface crystallinity and average grain size increased. The surface oxygen content of the sample was significantly increased, and an oxide layer with higher TiO2 content was formed.
(2)
After EPPo treatment, the corrosion current of Ti6Al4V decreased from 0.266 to 0.07 6 μA·cm−2, the corrosion potential increased from −0.614 to −0.556 V, and the polarization resistance increased from 149.896 to 523.439 kΩ, indicating that the corrosion resistance of the Ti6Al4V sample increased significantly. The improvement of corrosion resistance by EPPo is related to the improvement of surface flatness, crystal microstructure, and the formation of the oxide film on the surface.
(3)
EPPo could improve the hydrophilicity of Ti6Al4V surface, and the contact angles of distilled water and ethanediol droplets on the surface were reduced from 81.14 and 55.17° to 69.78 and 42.78°. The improvement of hydrophilicity by EPPo is related to the decrease in surface roughness, the increase in surface energy, and the alteration of surface structure and chemical composition.
(4)
The Ti6Al4V surface shows residual stress relief after EPPo treatment, which may be related to the annealing effect formed by the constant alternating increase and decrease in the surface temperature of the samples during the EPPo process.

Author Contributions

Conceptualization, D.Y. and H.S.; methodology, D.Y. and G.J.; validation, D.Y., Y.X. and J.W.; formal analysis, G.J.; investigation, G.J.; resources, D.Y. and G.J.; data curation, Y.X. and J.W.; writing—original draft preparation, D.Y.; writing—review and editing, H.S.; visualization, D.Y.; supervision, D.Y. and H.S.; project administration, H.S.; funding acquisition, H.S. All authors have read and agreed to the published version of the manuscript.

Funding

This research was funded by Shanxi Provincial Key Research and Development Project, grant number 201903D121091.

Institutional Review Board Statement

Not applicable.

Informed Consent Statement

Not applicable.

Data Availability Statement

Data are contained within the article.

Conflicts of Interest

The authors declare no conflicts of interest.

References

  1. Biffi, C.A.; Fiocchi, J.; Ferrario, E.; Fornaci, A.; Riccio, M.; Romeo, M.; Tuissi, A. Effects of the Scanning Strategy on the Microstructure and Mechanical Properties of a TiAl6V4 Alloy Produced by Electron Beam Additive Manufacturing. Int. J. Adv. Manuf. Technol. 2020, 107, 4913–4924. [Google Scholar] [CrossRef]
  2. Alessandra Gobbo, V.; Lallukka, M.; Gamna, F.; Prato, M.; Vitale, A.; Ferraris, S.; Najmi, Z.; Cochis, A.; Rimondini, L.; Massera, J.; et al. Functionalization of a Chemically Treated Ti6Al4V-ELI Alloy with Nisin for Antibacterial Purposes. Appl. Surf. Sci. 2023, 620, 156820. [Google Scholar] [CrossRef]
  3. Rotella, G.; Del Prete, A. Development of Customized Physics-Based Predictive Models for Improved Performance in Turning of Ti6Al4V. J. Manuf. Process. 2022, 81, 727–737. [Google Scholar] [CrossRef]
  4. Rominiyi, A.L.; Mashinini, P.M. Continuous Wave Laser Welding of Ti6Al4V Alloy Joints: Microstructure and Mechanical Properties. Mater. Lett. 2023, 336, 133934. [Google Scholar] [CrossRef]
  5. Siti Nur Hazwani, M.R.; Lim, L.X.; Lockman, Z.; Zuhailawati, H. Fabrication of Titanium-Based Alloys with Bioactive Surface Oxide Layer as Biomedical Implants: Opportunity and Challenges. Trans. Nonferrous Met. Soc. China 2022, 32, 1–44. [Google Scholar] [CrossRef]
  6. Zeidler, H.; Boettger-Hiller, F.; Edelmann, J.; Schubert, A. Surface Finish Machining of Medical Parts Using Plasma Electrolytic Polishing. Procedia CIRP 2016, 49, 83–87. [Google Scholar] [CrossRef]
  7. Yang, D.; Sun, H.; Wang, J.; Ji, G.; Duan, H.; Xiang, Y.; Fan, Y. The Formation and Stripping Mechanism of Oxide Film on Ti6Al4V Alloy Surface during Electrolytic Plasma Polishing. Surf. Coat. Technol. 2024, 478, 130469. [Google Scholar] [CrossRef]
  8. Ke, X.; Wu, W.; Wang, C.; Yu, Y.; Zhong, B.; Wang, Z.; Wang, T.; Fu, J.; Guo, J. Material Removal and Surface Integrity Analysis of Ti6Al4V Alloy after Polishing by Flexible Tools with Different Rigidity. Materials 2022, 15, 1642. [Google Scholar] [CrossRef]
  9. Bordatchev, E.V.; Hafiz, A.M.K.; Tutunea-Fatan, O.R. Performance of Laser Polishing in Finishing of Metallic Surfaces. Int. J. Adv. Manuf. Technol. 2014, 73, 35–52. [Google Scholar] [CrossRef]
  10. Bezuidenhout, M.; Ter Haar, G.; Becker, T.; Rudolph, S.; Damm, O.; Sacks, N. The Effect of HF-HNO3 Chemical Polishing on the Surface Roughness and Fatigue Life of Laser Powder Bed Fusion Produced Ti6Al4V. Mater. Today Commun. 2020, 25, 101396. [Google Scholar] [CrossRef]
  11. Zaborski, S.; Sudzik, A.; Wolyniec, A. Electrochemical Polishing of Total Hip Prostheses. Arch. Civ. Mech. Eng. 2011, 11, 1053–1062. [Google Scholar] [CrossRef]
  12. Aliakseyeu, Y.G.; Korolyov, A.Y.; Niss, V.S. Electrolytic-plasma polishing of cobalt-chromium alloys for medical products. Vescì Akad. Navuk Belarusì. Seryâ Fiz. Teh. Navuk 2019, 64, 296–303. [Google Scholar] [CrossRef]
  13. Jagadeeshanayaka, N.; Awasthi, S.; Jambagi, S.C.; Srivastava, C. Bioactive Surface Modifications through Thermally Sprayed Hydroxyapatite Composite Coatings: A Review of Selective Reinforcements. Biomater. Sci. 2022, 10, 2484–2523. [Google Scholar] [CrossRef] [PubMed]
  14. Wang, L.; Luo, Q.; Zhang, X.; Qiu, J.; Qian, S.; Liu, X. Co-Implantation of Magnesium and Zinc Ions into Titanium Regulates the Behaviors of Human Gingival Fibroblasts. Bioact. Mater. 2021, 6, 64–74. [Google Scholar] [CrossRef] [PubMed]
  15. Gabor, R.; Cvrček, L.; Doubková, M.; Nehasil, V.; Hlinka, J.; Unucka, P.; Buřil, M.; Podepřelová, A.; Seidlerová, J.; Bačáková, L. Hybrid Coatings for Orthopaedic Implants Formed by Physical Vapour Deposition and Microarc Oxidation. Mater. Des. 2022, 219, 110811. [Google Scholar] [CrossRef]
  16. Radtke, A.; Grodzicka, M.; Ehlert, M.; Muzioł, T.; Szkodo, M.; Bartmański, M.; Piszczek, P. Studies on Silver Ions Releasing Processes and Mechanical Properties of Surface-Modified Titanium Alloy Implants. IJMS 2018, 19, 3962. [Google Scholar] [CrossRef] [PubMed]
  17. Zou, Y.; Wang, S.; Chen, G.; Wang, Y.; Zhang, K.; Zhang, C.; Wei, D.; Ouyang, J.; Jia, D.; Zhou, Y. Optimization and Mechanism of Precise Finishing of TC4 Alloy by Plasma Electrolytic Polishing. Surf. Coat. Technol. 2023, 467, 129696. [Google Scholar] [CrossRef]
  18. Smyslova, M.K.; Tamindarov, D.R.; Plotnikov, N.V.; Modina, I.M.; Semenova, I.P. Surface Electrolytic-Plasma Polishing of Ti-6Al-4V Alloy with Ultrafine-Grained Structure Produced by Severe Plastic Deformation. IOP Conf. Ser. Mater. Sci. Eng. 2018, 461, 012079. [Google Scholar] [CrossRef]
  19. Navickaitė, K.; Nestler, K.; Böttger-Hiller, F.; Matias, C.; Diskin, A.; Golan, O.; Garkun, A.; Strokin, E.; Biletskiy, R.; Safranchik, D.; et al. Efficient Polishing of Additive Manufactured Titanium Alloys. Procedia CIRP 2022, 108, 346–351. [Google Scholar] [CrossRef]
  20. Li, H.; Ma, G.; Wang, Z. Corrosion Behavior of ZrO2-TiO2 Composite Coatings Produced on Titanium Alloy via Plasma Electrolytic Oxidation. Surf. Coat. Technol. 2023, 469, 129814. [Google Scholar] [CrossRef]
  21. Venkateswarlu, K.; Rameshbabu, N.; Chandra Bose, A.; Muthupandi, V.; Subramanian, S.; MubarakAli, D.; Thajuddin, N. Fabrication of Corrosion Resistant, Bioactive and Antibacterial Silver Substituted Hydroxyapatite/Titania Composite Coating on Cp Ti. Ceram. Int. 2012, 38, 731–740. [Google Scholar] [CrossRef]
  22. Venkateswarlu, K.; Rameshbabu, N.; Sreekanth, D.; Bose, A.C.; Muthupandi, V.; Babu, N.K.; Subramanian, S. Role of Electrolyte Additives on In-Vitro Electrochemical Behavior of Micro Arc Oxidized Titania Films on Cp Ti. Appl. Surf. Sci. 2012, 258, 6853–6863. [Google Scholar] [CrossRef]
  23. Jiang, N.; Zhu, S.; Li, J.; Zhang, L.; Liao, Y.; Hu, J. Development of a Novel Biomimetic Micro/Nano-Hierarchical Interface for Enhancement of Osseointegration. RSC Adv. 2016, 6, 49954–49965. [Google Scholar] [CrossRef]
  24. Chu, Y.; Liu, P.; Chen, Y.; Li, X. Influence of Applied Voltage on Surface Morphology and Wettability of Biological Coatings on Ti6-Al-4V by Micro-Arc Oxidation Treatment. Mat. Res. 2020, 23, e20200002. [Google Scholar] [CrossRef]
  25. Fan, K.; Liu, D.; Yang, J.; Zhang, X.; Liu, D.; Li, M.; Xiang, J.; Wang, C.; Abdel Wahab, M. Thermal Relaxation of Compressive Residual Stresses in Surface Gradient Nanostructure of TC11 Titanium Alloy. J. Alloys Compd. 2024, 970, 172549. [Google Scholar] [CrossRef]
  26. Yang, C.; Meng, X.; Li, X.; Li, Z.; Yan, H.; Wu, L.; Cao, F. Effect of Electrolyte Composition on Corrosion Behavior and Tribological Performance of Plasma Electrolytic Oxidized TC4 Alloy. Trans. Nonferrous Met. Soc. China 2023, 33, 141–156. [Google Scholar] [CrossRef]
  27. Yao, J.; Wang, Y.; Wu, G.; Sun, M.; Wang, M.; Zhang, Q. Growth Characteristics and Properties of Micro-Arc Oxidation Coating on SLM-Produced TC4 Alloy for Biomedical Applications. Appl. Surf. Sci. 2019, 479, 727–737. [Google Scholar] [CrossRef]
  28. Gittens, R.A.; Scheideler, L.; Rupp, F.; Hyzy, S.L.; Geis-Gerstorfer, J.; Schwartz, Z.; Boyan, B.D. A Review on the Wettability of Dental Implant Surfaces II: Biological and Clinical Aspects. Acta Biomater. 2014, 10, 2907–2918. [Google Scholar] [CrossRef]
  29. Ji, G.; Sun, H.; Duan, H.; Yang, D.; Sun, J. Effect of Electrolytic Plasma Polishing on Microstructural Evolution and Tensile Properties of 316L Stainless Steel. Surf. Coat. Technol. 2021, 420, 127330. [Google Scholar] [CrossRef]
  30. GB/T13810-2017; Wrought Titanium and Titanium Alloy for Surgical Implants. Standardization Administration Committee: Beijing, China, 2017.
  31. ISO 4287:1997; Geometrical Product Specifications (GPS) Surface Texture: Profile Method. Terms, Definitions and Surface Texture Parameters. ISO Publishing: Geneve, Switzerland, 1997.
  32. Belkin, P.N.; Kusmanov, S.A.; Parfenov, E.V. Mechanism and Technological Opportunity of Plasma Electrolytic Polishing of Metals and Alloys Surfaces. Appl. Surf. Sci. Adv. 2020, 1, 100016. [Google Scholar] [CrossRef]
  33. Парфенoв, Е.В.; Мукаева, В.Р.; Фарракхoв, Р.Г. Plasma Electrolytic Treatments for Advanced Surface Finishing Technologies. Mater. Technol. Des. 2019, 1, 34–41. [Google Scholar]
  34. Zhou, C.; Su, H.; Qian, N.; Zhang, Z.; Xu, J. Characteristics and Function of Vapour Gaseous Envelope Fluctuation in Plasma Electrolytic Polishing. Int. J. Adv. Manuf. Technol. 2022, 119, 7815–7825. [Google Scholar] [CrossRef]
  35. Hierro-Oliva, M.; Gallardo-Moreno, A.M.; González-Martín, M.L. XPS Analysis of Ti6Al4V Oxidation Under UHV Conditions. Metall. Mater. Trans. A 2014, 45, 6285–6290. [Google Scholar] [CrossRef]
  36. Hedberg, Y.S.; Žnidaršič, M.; Herting, G.; Milošev, I.; Odnevall Wallinder, I. Mechanistic Insight on the Combined Effect of Albumin and Hydrogen Peroxide on Surface Oxide Composition and Extent of Metal Release from Ti6Al4V: Effect of Albumin and Hydrogen Peroxide. J. Biomed. Mater. Res. 2019, 107, 858–867. [Google Scholar] [CrossRef] [PubMed]
  37. Shirkhanzadeh, M. XRD and XPS Characterization of Superplastic TiO2 Coatings Prepared on Ti6Al4V Surgical Alloy by an Electrochemical Method. J. Mater. Sci. Mater. Med. 1995, 6, 206–210. [Google Scholar] [CrossRef]
  38. Chávez-Díaz, M.P.; Luna-Sánchez, R.M.; Vazquez-Arenas, J.; Lartundo-Rojas, L.; Hallen, J.M.; Cabrera-Sierra, R. XPS and EIS Studies to Account for the Passive Behavior of the Alloy Ti-6Al-4V in Hank’s Solution. J. Solid State Electrochem. 2019, 23, 3187–3196. [Google Scholar] [CrossRef]
  39. Böse, O.; Kemnitz, E.; Lippitz, A.; Unger, W.E. C 1s and Au 4f 7/2 Referenced XPS Binding Energy Data Obtained with Different Aluminium Oxides, -Hydroxides and -Fluorides. Fresenius’ J. Anal. Chem. 1997, 358, 175–179. [Google Scholar] [CrossRef]
  40. Yazdi, R.; Ghasemi, H.M.; Abedini, M.; Wang, C.; Neville, A. Mechanism of Tribofilm Formation on Ti6Al4V Oxygen Diffusion Layer in a Simulated Body Fluid. J. Mech. Behav. Biomed. Mater. 2018, 77, 660–670. [Google Scholar] [CrossRef] [PubMed]
  41. Abdun Nafi, M.; Anjir Karim, M.; Lalvani, S.; James, P.F.; Sommers, A.; Jahan, M.P. Investigating Wettability and Corrosion Resistance of the Titanium Alloy Surface Engineered by the WEDM Process. Manuf. Lett. 2023, 35, 450–459. [Google Scholar] [CrossRef]
  42. Chen, L.-Y.; Zhang, H.-Y.; Zheng, C.; Yang, H.-Y.; Qin, P.; Zhao, C.; Lu, S.; Liang, S.-X.; Chai, L.; Zhang, L.-C. Corrosion Behavior and Characteristics of Passive Films of Laser Powder Bed Fusion Produced Ti–6Al–4V in Dynamic Hank’s Solution. Mater. Des. 2021, 208, 109907. [Google Scholar] [CrossRef]
  43. Chen, X.; Liao, Q.; Gong, M.; Fu, Q. Corrosion Performances of Selective Laser Melting Ti6Al4V Alloy in Different Solutions. Metals 2023, 13, 192. [Google Scholar] [CrossRef]
  44. Asgar, H.; Deen, K.M.; Rahman, Z.U.; Shah, U.H.; Raza, M.A.; Haider, W. Functionalized Graphene Oxide Coating on Ti6Al4V Alloy for Improved Biocompatibility and Corrosion Resistance. Mater. Sci. Eng. C 2019, 94, 920–928. [Google Scholar] [CrossRef] [PubMed]
  45. Lodhi, M.J.K.; Deen, K.M.; Greenlee-Wacker, M.C.; Haider, W. Additively Manufactured 316L Stainless Steel with Improved Corrosion Resistance and Biological Response for Biomedical Applications. Addit. Manuf. 2019, 27, 8–19. [Google Scholar] [CrossRef]
  46. Ji, G.; Sun, H.; Duan, H.; Yang, D.; Sun, J. Enhancement of Corrosion Resistance for Medical Grade 316L Stainless Steel by Electrolytic Plasma Polishing. J. Mater. Eng Perform 2023, 32, 1498–1507. [Google Scholar] [CrossRef]
  47. Hao, Y.; Yang, S.; Li, D.; Li, W.; Li, X. Vibratory Finishing for the Cavity of Aero-Engine Integral Casting Casing: Mechanism Analysis and Performance Evaluation. Int. J. Adv. Manuf. Technol. 2022, 125, 713–729. [Google Scholar] [CrossRef]
  48. Winiarski, J.; Tylus, W.; Szczygieł, B. EIS and XPS Investigations on the Corrosion Mechanism of Ternary Zn–Co–Mo Alloy Coatings in NaCl Solution. Appl. Surf. Sci. 2016, 364, 455–466. [Google Scholar] [CrossRef]
  49. Liu, C.; Tong, S.; Yue, Y.; Wang, H.; Song, J.; Li, Y.; Wang, Q.; Wang, Z. Laser-Based Fabrication of Superwetting Titanium Alloy with Enhanced Corrosion and Erosion-Corrosion Resistance. Colloids Surf. A Physicochem. Eng. Asp. 2024, 688, 133648. [Google Scholar] [CrossRef]
  50. Nelson, B.; Huang, W.; Shen, N.; Shaw, S.; Lamuta, C.; Ding, H. Evolving Surface Wettability in Laser-Powder Bed Fusion Printed Metal Parts. Manuf. Lett. 2024, 40, 45–49. [Google Scholar] [CrossRef]
  51. Chen, S.; Ma, J.; Gao, H.; Wang, Y.; Chen, X. Research on Residual Stresses and Microstructures of Selective Laser Melted Ti6Al4V Treated by Thermal Vibration Stress Relief. Micromachines 2023, 14, 354. [Google Scholar] [CrossRef]
  52. Singh, G.; Sharma, S.; Mittal, M.; Singh, G.; Singh, J.; Changhe, L.; Khan, A.M.; Dwivedi, S.P.; Tahir Mushtaq, R.; Singh, S. Impact of Post-Heat-Treatment on the Surface-Roughness, Residual Stresses, and Micromorphology Characteristics of Plasma-Sprayed Pure Hydroxyapatite and 7%-Aloxite Reinforced Hydroxyapatite Coatings Deposited on Titanium Alloy-Based Biomedical Implants. J. Mater. Res. Technol. 2022, 18, 1358–1380. [Google Scholar] [CrossRef]
  53. Sanjuán, M.; Brizuela-Velasco, A.; Gil, J.; Cerrolaza, M.; Montalvillo, E.; Fernández-Hernández, S.; Robles, D. Hybrid Surface Implants: Influence of Residual Stress on Mechanical Behavior, Evaluated by Finite Element Analysis and Validation by Fatigue Tests. Dent. Mater. 2024, 40, 9–18. [Google Scholar] [CrossRef] [PubMed]
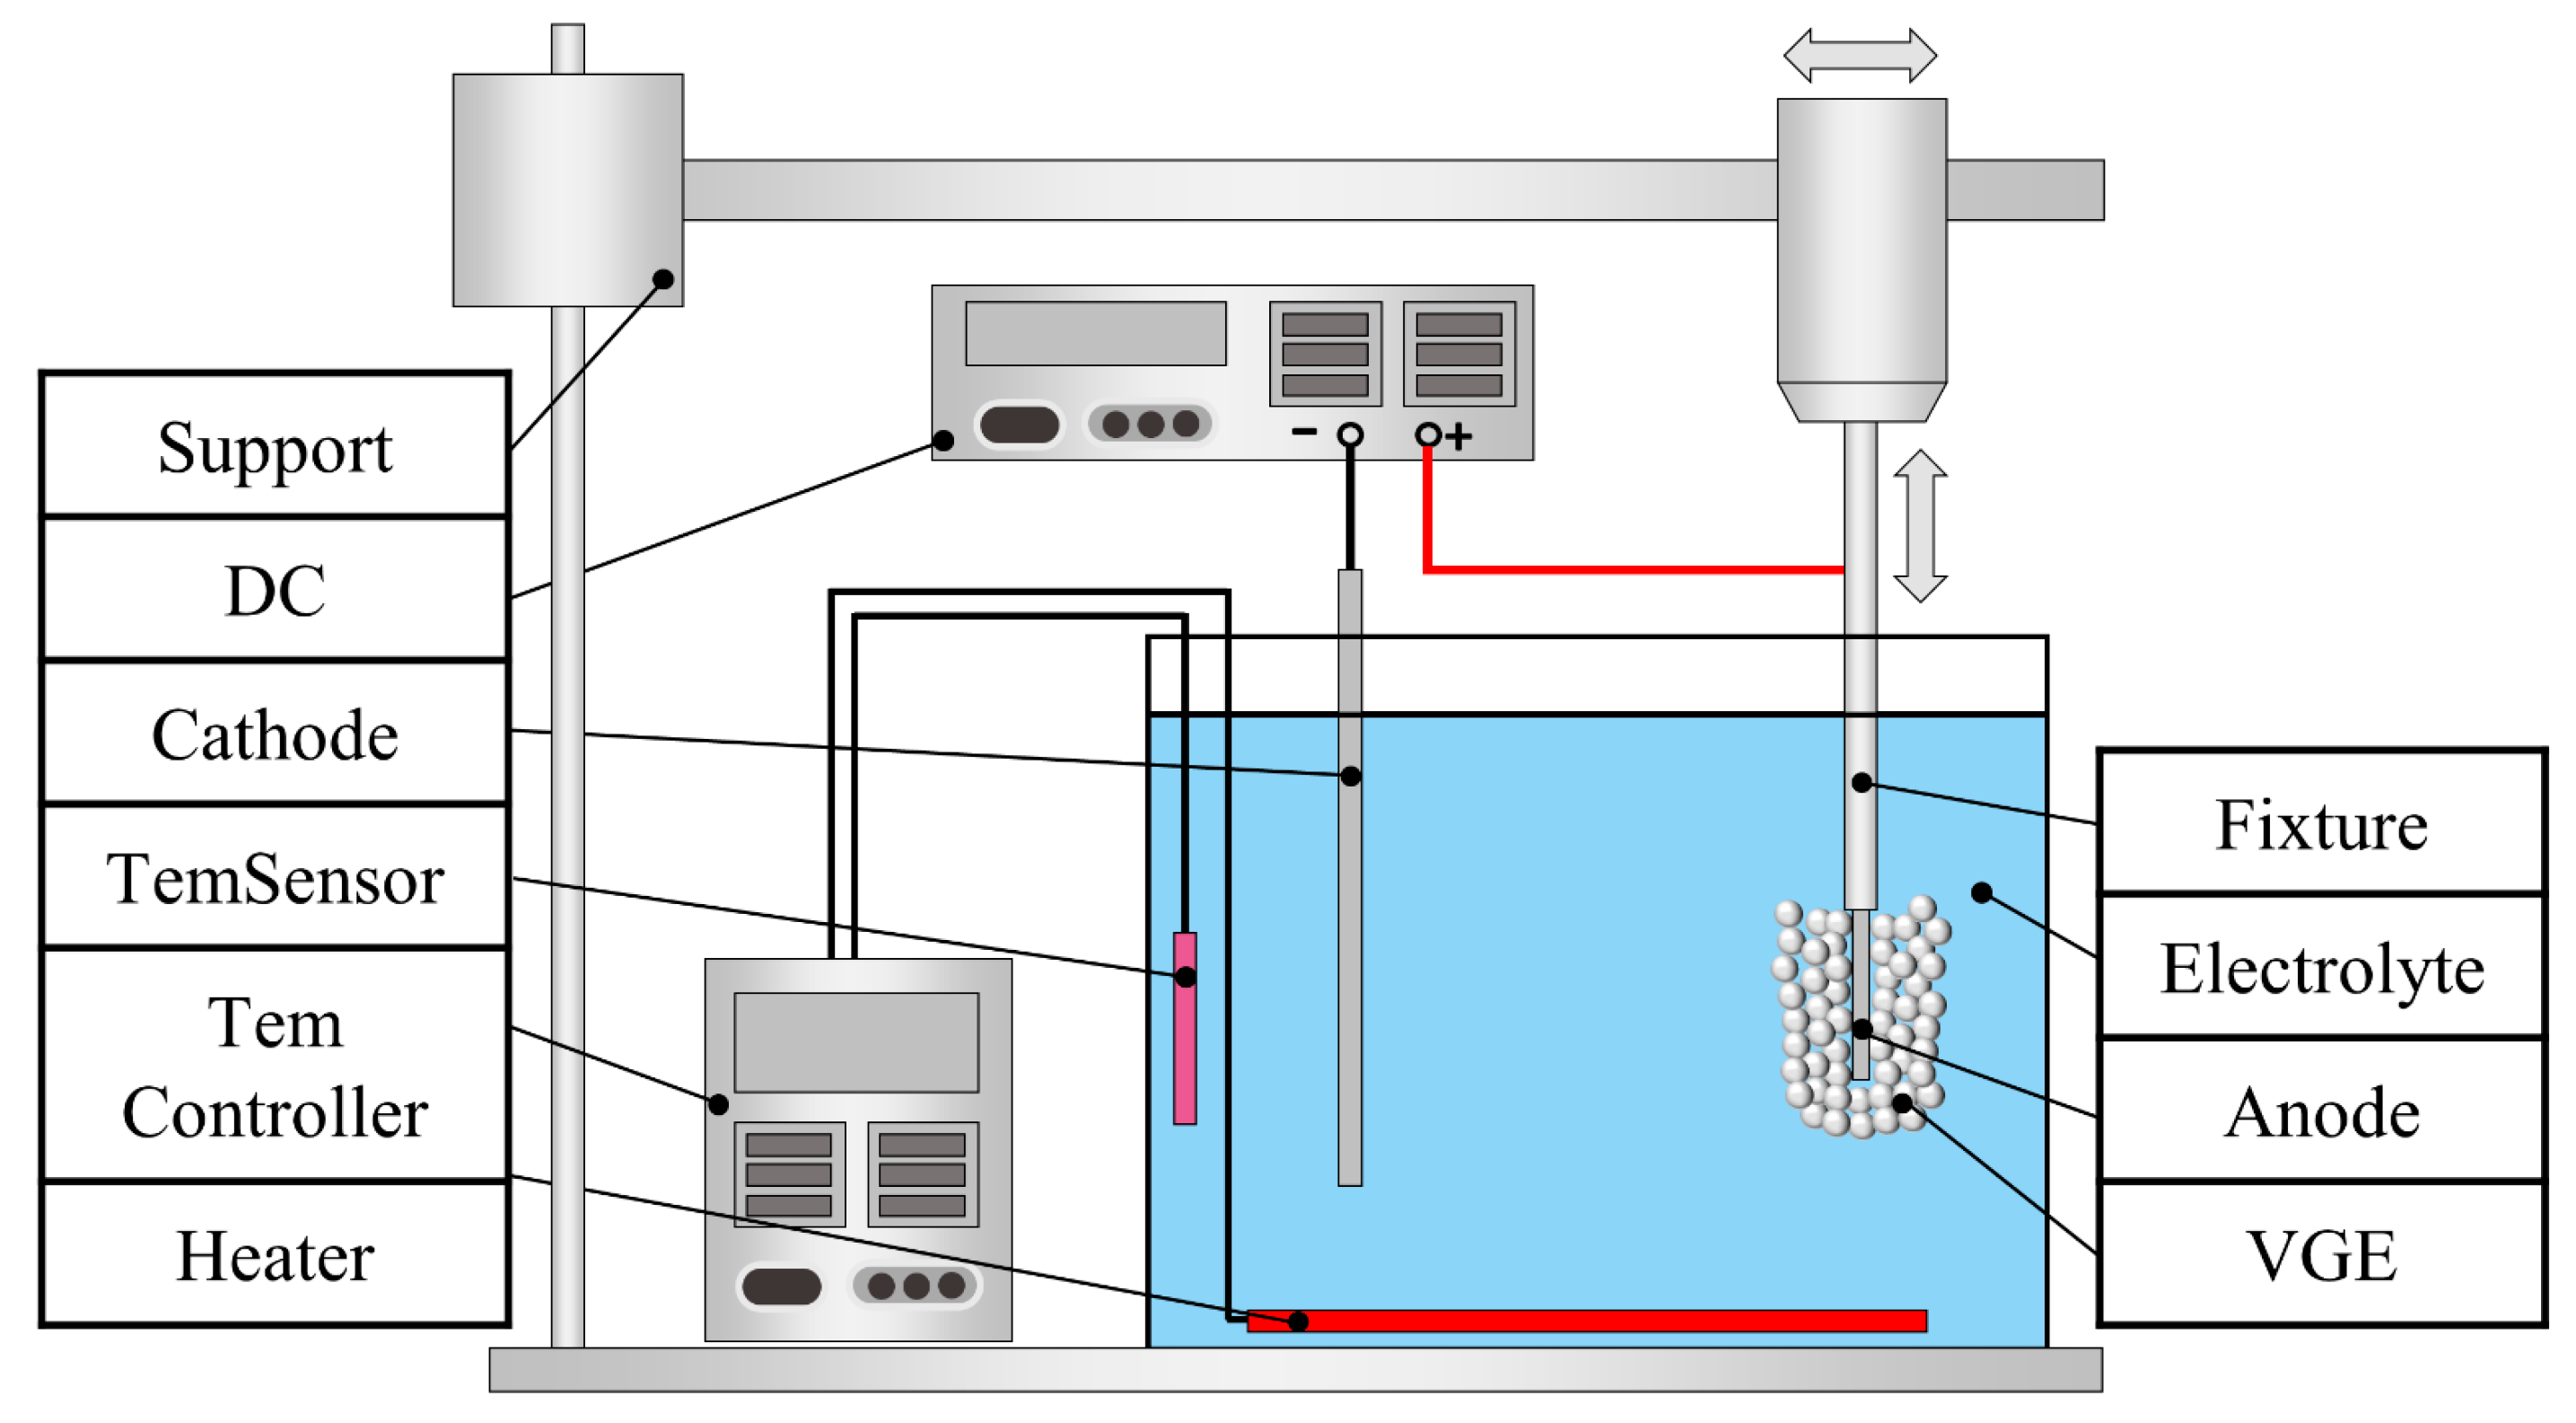
Figure 1. Schematic diagram of the EPPo experimental platform [7].
Coatings 14 00615 g001
Figure 2. SEM images and 3D topographies of the samples: (a,b) before EPPo; (c,d) after EPPo.
Coatings 14 00615 g002
Figure 3. Results of surface roughness.
Coatings 14 00615 g003
Figure 4. XRD patterns and FWHM of the samples. (a) XRD patterns; (b) FWHM.
Coatings 14 00615 g004
Figure 5. EDS of the sample surfaces. (a) before EPPo; (b) after EPPo.
Coatings 14 00615 g005
Figure 6. XPS spectra of the Ti 2p and Al 2p: (a,c,e) before EPPo; (b,d,f) after EPPo.
Coatings 14 00615 g006
Figure 7. Tafel polarization curves of samples in PBS solution.
Coatings 14 00615 g007
Figure 8. Results of electrochemical impedance analysis of samples in PBS solution: (a) Nyquist plots; (b) Bode phase diagrams.
Coatings 14 00615 g008
Figure 9. Equivalent circuit to model experimental EIS data.
Coatings 14 00615 g009
Figure 10. Comparison of contact angle and droplet image between PP, MP, and EPPo samples. (a) contact angle; (b) droplet image.
Coatings 14 00615 g010
Figure 11. Variation in residual stress on the sample surface.
Coatings 14 00615 g011
Table 1. The chemical composition of Ti6Al4V alloy [7].
ElementVAlFeNCOHTi
wt.%4.16.330.100.010.010.1120.001Base
Table 2. Process parameters of EPPo [7].
ParameterElectrolyteTemperatureVoltageTimeImmersion DepthInterelectrode Distance
Value3.53753507155
Unitwt.% NH4F and KF·2H2O°CVmincmcm
Table 3. Surface free energy parameters of distilled water and ethanediol.
Test Liquidsγld (mJ/m2)γlp (mJ/m2)γl (mJ/m2)
Distilled water51.021.872.8
Ethanediol19.029.348.3
Table 4. Crystallite size before and after EPPo.
Indices of Crystal Face (h k l)Crystallite Size before EPPo (Å)Crystallite Size after EPPo (Å)
(1 0 0)274881
(0 0 2)270943
(1 1 0)279941
(1 0 1)243805
(1 0 2)257799
(1 1 0)199792
(1 0 3)249839
(1 1 2)202686
(2 0 1)256748
(2 2 0)293>1000
(2 0 2)243658
Table 5. The content changes of Ti, Al, and O elements in different chemical states.
Atomic (%)Ti0Ti2+Ti3+Ti4+Al0Al2O3Al-FTiO2Al2O3Oads.
Before EPPo14.5212.2516.3456.8931.5568.45042.4439.1918.37
After EPPo9.296.8715.0168.8220.8366.8712.360.1228.7211.16
Table 6. Fitting results of Tafel polarization curves.
SamplesEcorr (V)Icorr (μA·cm−2)Cathodic Tafel SlopAnodic Tafel SlopRp (kΩ)
PP−0.614 ± 0.0100.266 ± 0.0366.398 ± 0.2184.491 ± 0.155149.896 ± 11.526
MP−0.589 ± 0.0080.125 ± 0.0584.281 ± 0.1434.838 ± 0.097380.792 ± 9.347
EPPo−0.556 ± 0.0120.076 ± 0.0215.330 ± 0.2625.548 ± 0.214523.439 ± 21.763
Table 7. Fitting results of EIS plots.
SamplesRs (Ω·cm2)T × 10−6−1·cm−2·S-P)PRct (kΩ·cm2)C (μF·cm−2)
PP104.3034.3510.9072179.8941.38
MP103.2025.8160.8799381.1835.27
EPPo102.2021.8040.90941109.1029.95
Table 8. Surface free energy of the PP, MP, and EPPo samples.
Samplesγsd (mJ·m−2)γsp (mJ·m−2)γs (mJ·m−2)
PP7.526823.045730.5725
MP34.476710.235544.7122
EPPo14.500521.770236.2707
Disclaimer/Publisher’s Note: The statements, opinions and data contained in all publications are solely those of the individual author(s) and contributor(s) and not of MDPI and/or the editor(s). MDPI and/or the editor(s) disclaim responsibility for any injury to people or property resulting from any ideas, methods, instructions or products referred to in the content.