Abstract
The article discusses the fabrication of sandwich steel and geopolymer structures using spray technology without the need for formwork. In the article, the effects of high temperatures on geopolymer materials are analyzed and their mechanical properties and durability are examined. The importance of geopolymer coatings for steel protection is also highlighted, and specific features such as the setting time, application process, attachment strength, fire testing, and production costs are analyzed. The materials and methods used in the study are described, including the composition of geopolymer binders and the process of applying geopolymer coatings to steel plates. The research includes test methods such as strength tests, density tests, thermal conductivity tests, accelerated aging tests, microstructure analyses, pore size analyses, and fire resistance tests. The research section concludes with a summary of the chemical and phase composition of the materials and a discussion of the fire resistance of the geopolymer composites (GCs). The results show that GC foams offer excellent thermal insulation, providing up to 75 min of fire resistance with a 6 mm coating, reducing temperatures by 150 °C compared to uncoated steel. GC foams have a density of 670 kg/m3, a thermal conductivity of 0.153 W/m∙K, and a cost effectiveness of USD 250 per cubic meter.
1. Introduction
To decrease losses and keep structures safe, a current study in the field of fire protection is crucial. The importance of this problem has been highlighted by past events such as the attack on the World Trade Center in 2001, the Windsor Tower fire, and the fires in the Mont Blanc Tunnel and the Channel Tunnel. The tendency of high-strength concrete, a typical construction material, toward instability when exposed to fire is an essential component of this difficulty. Under such conditions, fires that start inside tunnels and buildings may lead concrete to spill or steel reinforcement to overheat, which may have disastrous effects. In place of traditional Portland-cement-based materials, geopolymer composites (GCs) have attracted interest as an alternative for this critical problem.
GCs stand out for their superior mechanical traits, reduced permeability, resilience against chemical aggression, and prolonged fire resistance compared to conventional Portland cement. Their environmental sustainability is underscored by minimal carbon dioxide emissions during production, coupled with cost effectiveness [1]. GCs have found applications in diverse realms, including heat and sound absorption [2], fire protection [3], and construction materials, serving as catalysts, adsorbents, and fillers [4,5].
Advancements in optimizing GC attributes and refining fabrication processes have led to the emergence of highly porous GC foam composites [6,7,8,9]. These lightweight foams demonstrate remarkable resistance to acidic environments, reduced thermal conductivity, and lower sintering temperatures. Fortified with aluminum-based metal powder, inorganic basalt fibers, and glass fibers, GC foam achieves a delicate equilibrium between low density and strength. Diverse foaming agents contribute to synthesizing low-density GCs, conducive to surface application. Notably, potassium-based GCs incorporating coarse fly ash, quartz sand, and silica fumes as fillers have exhibited structural integrity even after fire tests, with negligible macroscopic damage [10,11,12].
While GC foaming may impact mechanical properties, it significantly amplifies insulation capabilities, presenting a compelling alternative to traditional insulation materials. GCs hold promise for crafting fire-resistant coatings and efficient thermal and acoustic insulators. Comprehensive studies have delved into the repercussions of elevated temperatures on GCs, influencing physical and mechanical attributes encompassing the apparent density, drying shrinkage, water absorption, weight loss, and flexural and compressive strengths [1,2,3]. This study specifically examines the fire resistance capacity of GC coatings, a crucial determinant for their practical implementation.
Numerous investigations have probed the influence of high temperatures on GC materials [4,5,6,7]. These endeavors have led to diverse outcomes, ranging from diminished compressive strength and augmented mass loss at 1000 °C [5] to reduced compressive strength and Young’s modulus with increasing temperatures [6]. While coarse-fly-ash-based GC mortars may sustain strength at 1000 °C [7], GC foams have demonstrated robust strength retention and minimal thermal shrinkage under elevated temperatures [8,9,10]. Alkali-activated fly-ash GC foam exhibits improved durability at 1100 °C [9], and sintering enhances the mechanical properties of acid-based geopolymers [11].
Sprayed concrete, commonly known as shotcrete, is a technique employed in subterranean constructions like tunnels, eliminating the need for formwork and sometimes even reinforcement [12]. The process involves projecting a concrete mix onto a prepared surface using specialized equipment. Tailoring the mix composition with modified compounds and fibers can optimize its physical and mechanical properties [13]. Careful consideration of concrete’s rheology and deformability during application ensures its uniformity and load-bearing capacity [14]. The procedure entails surface preparation, concrete mixing, initial application, reinforcement mat placement, reapplication, and upkeep [15]. Advanced methods like wet spraying and accelerant additives enhance the quality and efficiency [16]. A versatile nozzle can improve mixing and diminish dust hazards. This technique revolutionizes underground construction with its versatility and adaptability.
By contrasting them with ordinary Portland cement (OPC) concrete, Peng et al. [3] clarified the fire resistance of steel-reinforced fly-ash GCs. They elucidate the protective application of foamed GC coatings to steel plates, spotlighting both the thermal stability and the spraying procedure. Substantial emphasis is placed on harnessing GCs to enhance fire protection and insulation attributes. By advancing our comprehension of GC coatings’ behavior at elevated temperatures, this research opens up opportunities for optimizing their practical deployment across diverse industries.
However, the goal of the present investigation was to determine whether GCs are appropriate coating materials for steel protection by examining specific features, including the acceptable setting or solidifying time, a more rapid application process, a strong attachment strength to existing steel, excellent fire testing in outdoor environments, and affordable production costs.
2. Materials and Methods
2.1. Materials and Sample Preparation
The research utilized the “Baucis lk” binder from Ceské Lupkové Závody, a.s., a binder that consists of metakaolin and potassium hydroxide. Metakaolin results from calcining kaolinite at 500–800 °C, correlating reactivity with physical strength. Metakaolin’s uniformity makes it a GC formation benchmark. Mechanical enhancements in GCs resulted from chopped basalt fibers from Basaltex, a.s. These fibers are 3.2 mm long, and 13 μm in diameter, with a density of 2.67 g/cm3. Basalt fiber thermal conductivity is 0.031–0.038 W/m·K. Coarse silica sand from Sklopisek Strelec, a.s., with 0.3–0.8 mm size and density of 2.65 g/cm3, contributed to structural coherence and mechanical strength. Increased fire resistance due to additives: aluminum powders and silica dust. Silica fumes from Kema Morava—sanacní centrum a.s.—had 90 wt.% SiO2. The interaction of aluminum powder (Pkchemie, Inc., Třebíč, Czech Republic) with an alkaline solution led to the trapping of hydrogen-rich gas mixtures due to the separate gas and polymer phases. These components collectively form the basis of this comprehensive investigation.
Potassium activator and four types of precursors were used to prepare the geopolymers. The compositions of the individual geopolymer materials are shown in Table 1. Similar base materials for geopolymer materials have been used by other researchers in their work [17,18,19].

Table 1.
Composition of alkali-activated samples.
GC coatings were applied to a carbon steel plate via spraying. The steps involved in preparing the GC mix were as follows: first, cement-based metakaolin and an alkaline potassium activator (in a 5:4 ratio according to the manufacturer) were thoroughly mixed for three minutes. Second, silica fume, sand, and fibers were added to the geopolymer mortar and mixed for five minutes (GS). The aluminum powder was added at the final stage and mixed at high speed for one minute, resulting in a foaming effect on the geomortar (GF) (note: if the GC does not foam, then do not add this step). The diagram in Figure 1 shows the GC manufacturing process along with the method of application to a metal surface. The mixture was sprayed onto a steel plate and cured at room temperature for 28 days.
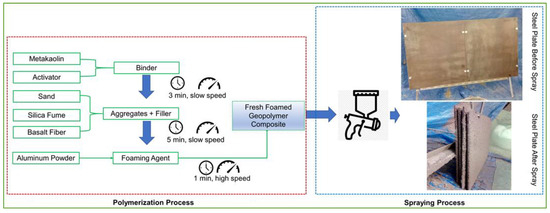
Figure 1.
The preparation procedure of the GC for the application spray.
2.2. Research Methods
2.2.1. Particle Size Laser Analysis
The particle size distribution of the base materials was analyzed using an Anton-Paar PSA 1190LD laser particle size analyzer (AntonPaar GmbH, Graz, Austria). The wet method (distilled water as a dispersing agent) was used to analyze the base materials. Each material was tested five times, and the results were then averaged using Kalliope Professional software (version 2.22.1, AntonPaar GmbH, Graz, Austria). The results from the laser particle size analysis were presented in the form of graphs—the average particle size distribution and average cumulative curve.
2.2.2. Chemical and Mineralogical Composition of Precursors
The PANalytical Aeris equipment (Malvern PANalytical, Lelyweg 1, Almelo, The Netherlands) was used to obtain phase composition information. The Rietveld method was used to calculate the quantitative content of the individual crystalline phases, using HighScore Plus software (version: 4.8, Malvern PANalytical B.V., Almelo, The Netherlands). The PDF-4+ database of the International Centre for Diffraction Data (ICDD) was used to analyze the individual phases in the materials. The angular range of the analysis was 10–100° with a step of 0.003° (2θ) using Cu Kα radiation. The time for a single step was 340 s.
X-ray fluorescence (XRF) was used to determine the chemical (oxide) composition. The test was carried out using a SHIMADZU EDX-7200 (Shimad-zu Corporation, Kyoto, Japan) in an air atmosphere. Holders were used along with Mylar film, dedicated to bulk materials.
2.2.3. Compressive and Flexural Strengths
Mechanical tests were carried out following EN 1015-11:2020-04 (Determination of Flexural and Compressive Strength of Hardened Mortar), using an Instron model 4202 (LABORTECH s.r.o., Opava, Czech Republic). The measuring range of the device is up to 10 kN (using an axial extensometer). The testing speed for compressive strength and bending strength was set at 2.5 mm/min. Samples for flexural and compressive strength tests were produced as 30 × 30 × 150 mm3 and 30 × 30 × 30 mm3, respectively.
2.2.4. Density Tests
The apparent density of GC samples was calculated using CSN EN 1936 and was obtained by dividing the mass of the sample by its apparent volume. It was determined using a series of samples dedicated before the bending-strength test. The samples had dimensions of 30 × 30 × 150 mm3.
2.2.5. Thermal Conductivity Tests
An HFM 446 plate apparatus (NETZSCH, Selb, Germany) was used to determine the thermal conductivity. Hot and cold slab parameters were determined using the above apparatus. Investigations were conducted in the temperature range of 0–20 °C. Each plate was tested twice—with the metal surface facing upwards and downwards.
2.2.6. Accelerated Ageing Tests
The Q-UV SPRAY accelerated aging test chamber (Q-LAB, Homestead, FL, USA) is an accelerated aging test device that simulates damage caused by sun, rain, and dew. To simulate aging, the Q-UV chamber exposes materials to alternating cycles of UV radiation and humidity at a controllable elevated temperature. Sunlight simulation is achieved using special UV-A 340+ fluorescent lamps. Table 2 shows the parameters and cycle length of the test carried out. The samples were removed from the chamber after 1000 h.
Table 2.
QUV-lab accelerated aging chamber test parameters.
2.2.7. Microstructure Research
The precursors underlying the geopolymer mixtures, as well as the geopolymer materials themselves, were analyzed via scanning electron microscopy using a JEOL IT200 scanning electron microscope (JEOL Ltd., Peabody, MA, USA). Samples after mechanical property tests were used to analyze the microstructure of the geopolymer materials. A conductive gold layer was applied to the surface of the samples before testing, using a DII-29030SCTR Smart Coater vacuum sputtering machine (JEOL Ltd., Peabody, MA, USA).
2.2.8. Analysis of Pore Size
The specific surface area of GS and GF was measured as a function of relative pressure using the BET (Brunauer–Emmett–Teller) method with a Quantachrome Autosorb iQ-MP physical sorption analyzer (Anton Paar, Graz, Austria). The volume of pores and average pore size were quantified via nitrogen adsorption/desorption, using the BJH technique (Barrett–Joyner–Halenda). The outgassing temperature of the sample was 300 °C, the speed was 20 °C min−1, and the treatment time was 180 min. Volumetric determinations of nitrogen adsorption and desorption were performed at relative pressures (p/p0) ranging from 0.021 to 0.994 for 44 measurement points. Results were interpreted using ASiQwin software (version: 5.21).
2.2.9. Fire Resistance
The fire resistance tests were carried out on a 500 × 500 × 5 mm3 steel plate covered with a 6 mm-thick layer of GF. A thermocouple was attached to both the outside and inside of the natural gas furnace. The experimental setup is shown in Figure 1. The readers are referred to [2,20] for more details on the experimental setup. The way the fire resistance test was carried out is shown in Figure 2.
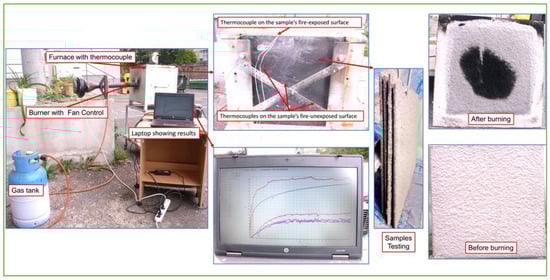
Figure 2.
The configuration used for evaluating the sample’s fire resistance.
3. Results and Discussion
3.1. Particle Size Analysis of Precursors
A histogram of the particle size distribution and cumulative particle size distribution curves as a function of the particle percentage for the binder precursors used are shown in Figure 3 and Table 3. The particle size measurements were conducted using an AntonPaar PSA 1190LD laser particle size analyzer (AntonPaar GmbH, Graz, Austria). Five measurements were taken for each material, and the average of the results was calculated using Kalliope Professional software (version 2.22.1, AntonPaar GmbH, Graz, Austria) and shown as a diagram of the average distribution of particle size and the average curve of the cumulative curve (Figure 3).
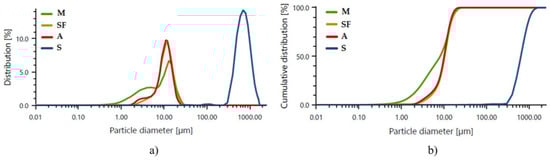
Figure 3.
Average results of laser particle size analysis: (a) histogram of the size distribution of individual precursors: M—metakaolin, SF—silica fume, A—aluminum powder, S—sand; (b) cumulative particle size distribution curves of the respective precursors.
Table 3.
Results of laser particle size analysis.
Each precursor’s particle size distribution has the form of a Gaussian diagram [21]. This is most evident in the case of silica fumes, aluminum powder, and sand.
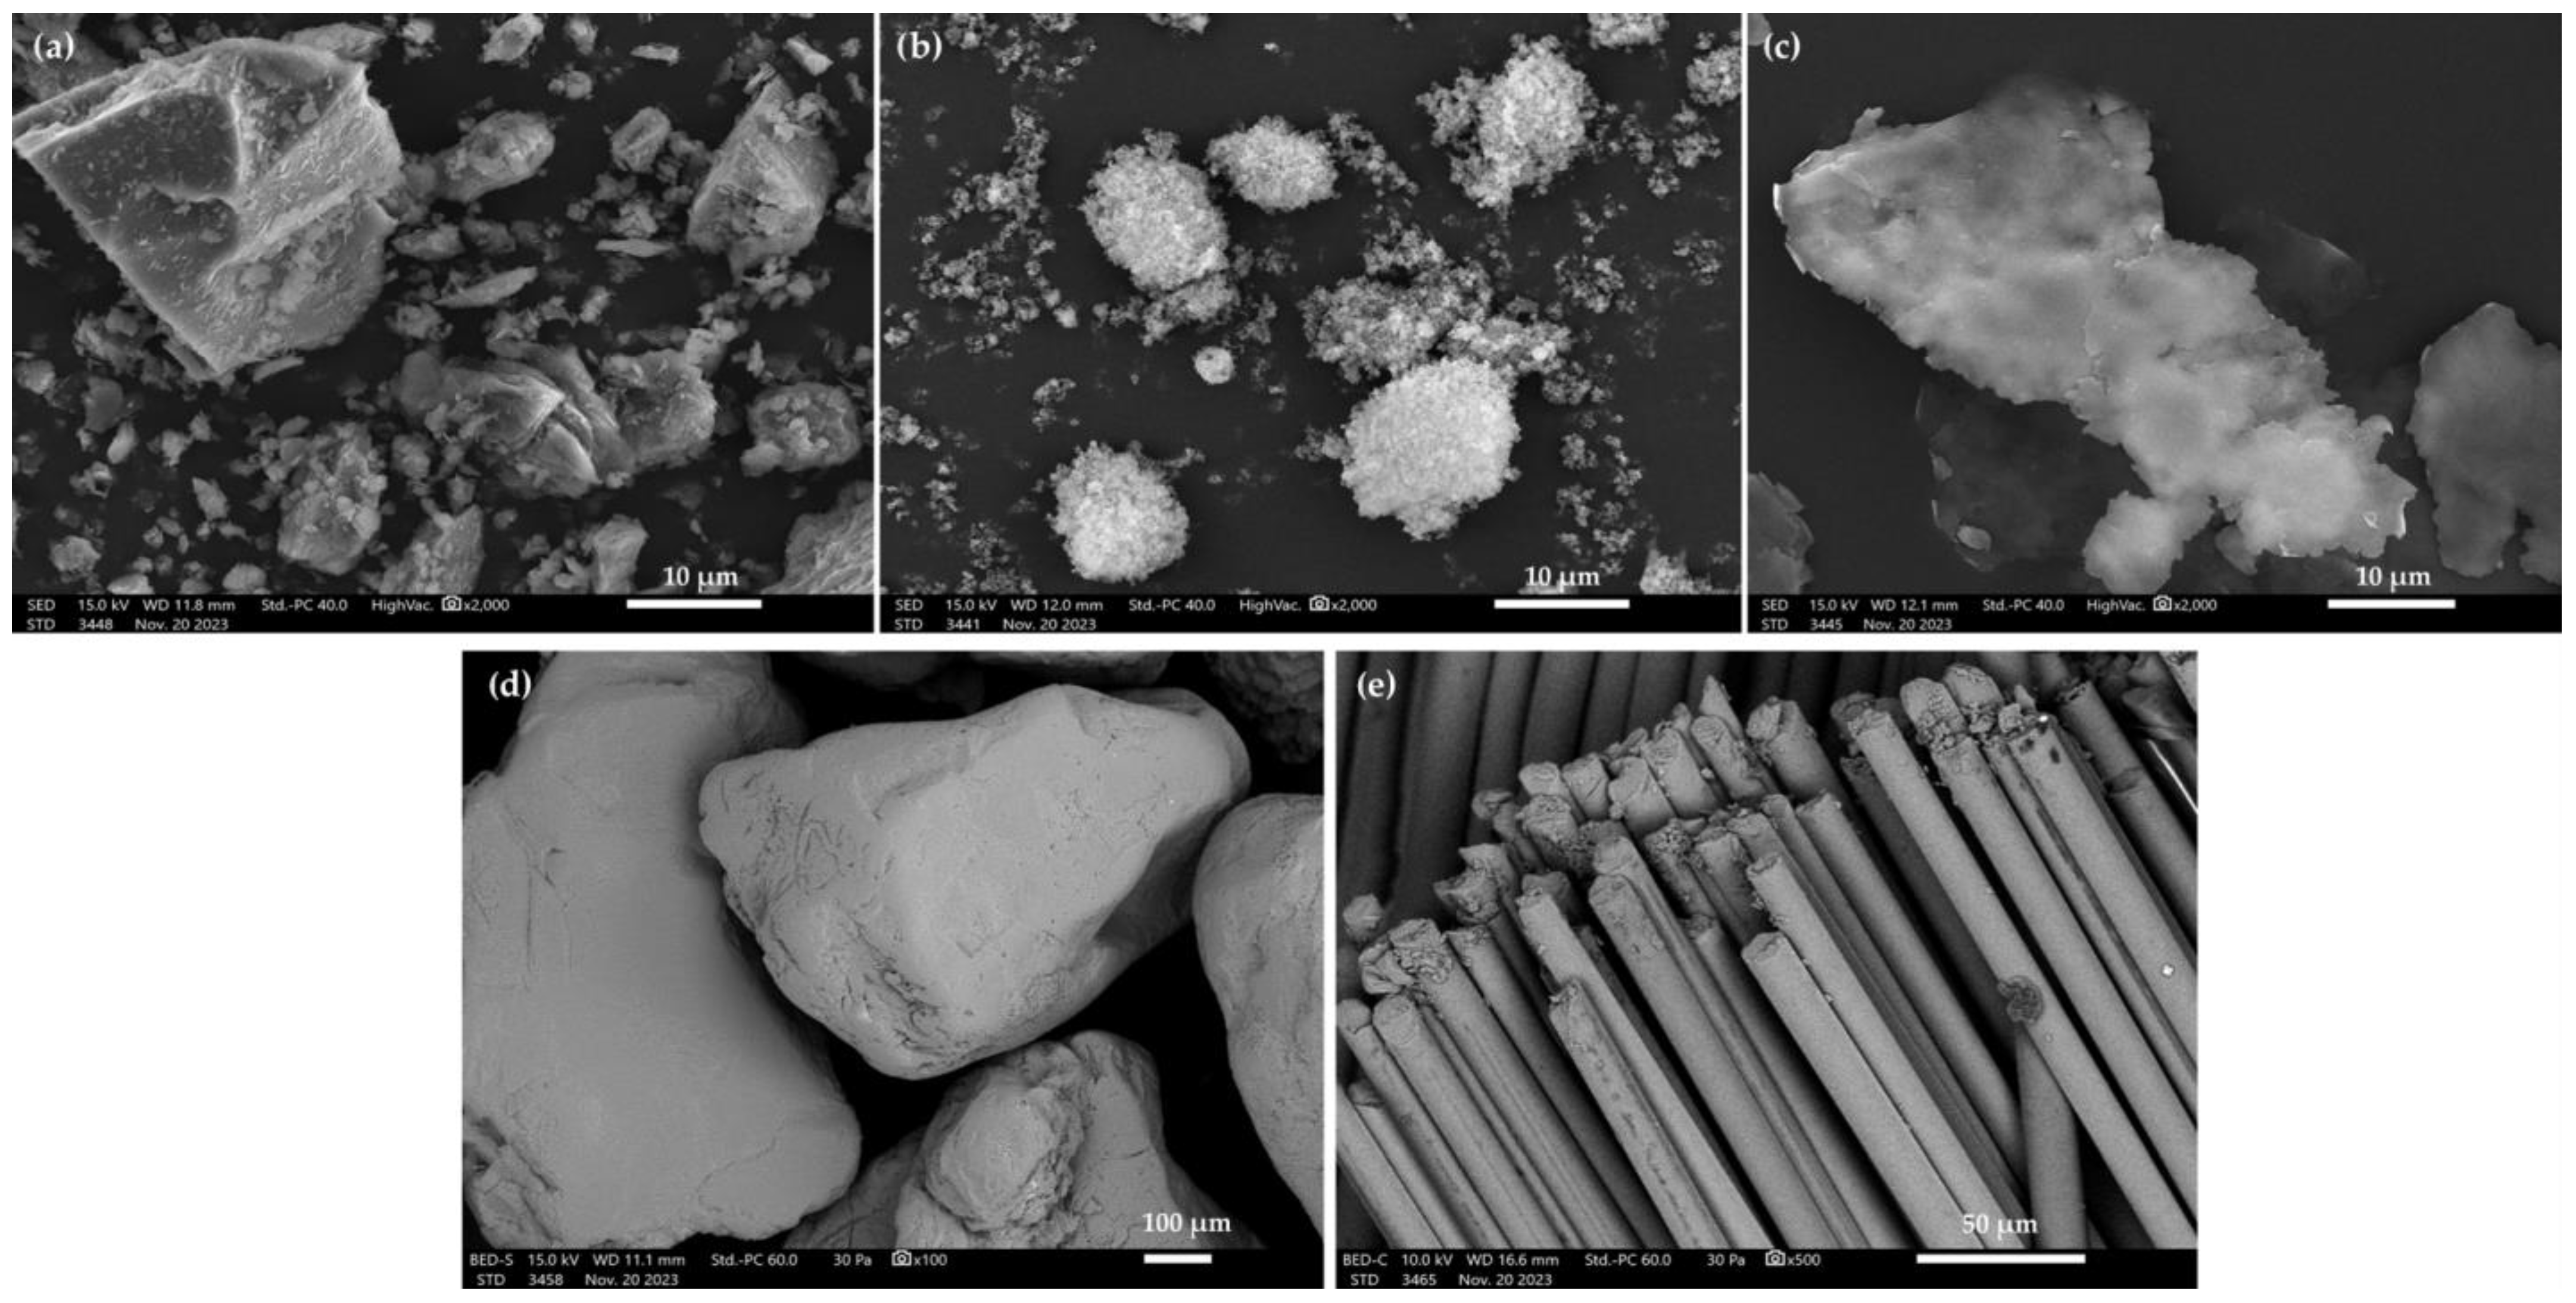
For all base materials, the average particle sizes mainly vary between 8 and 730 µm. The analysis of the particle sizes for metakaolin (Table 3) indicated that the average value of all particles of this material oscillates around 8.94 µm. Those particles with an average size of 1.77 µm account for 10% of the total volume of the test sample. The analysis of particle size for silica fumes (Table 3) indicated that the mean value for all particles oscillates around 10.90 µm. Those of an average size of around 5.03 µm represent 10% of the total volume of the test sample. The particle size analysis of the aluminum powder (Table 3) showed that the average value of all particles oscillates around 10.46 µm. Those particles with an average size of 4.35 µm represent 10% of the total volume of the test sample. In the sand particle size analysis results (Table 3), the average value of all particles oscillates around 729.76 µm. Parts with an average size of 392.96 µm represent 10% of the total volume of the test sample. The morphology of the selected base materials is shown in Figure 4.

Figure 4.
SEM images of alkali-activated binder base materials: (a) metakaolin; (b) silica fumes; (c) aluminum powder; (d) sand; and (e) basalt fiber.
The measurements from the scanning electron microscopy of the base materials confirm the particle size results from the laser particle size survey. Figure 4a shows metakaolin particles with a diameter oscillating around 10 µm. The particles have sharp edges and an irregular surface. Figure 4b shows silica fume particles—they are quite regular, with smooth edges. The size of these particles oscillates around 10 µm. Figure 4c shows a single aluminum oxide particle. Figure 4d shows the sand used to produce GS. The grain size for the sand oscillates around 700 µm. Figure 4e shows the basaltic fibers. The diameter of a single fiber osculates around 10 µm. Traven et al. noted in their work that the particle size of precursors influenced the subsequent strength properties of the alkali-activated material (AAM). The researchers’ study confirmed the fact that the particle size of the base raw materials influences the subsequent strength results for the material obtained [22]. Li et al., in their work, performed a study on the effect of the aggregate particle fines on the mechanic properties of fly-ash-based geopolymer mortar. The research results showed an optimum degree of gradation and sand-filling effect. The mortar strength was found to be highly dependent on the adhesive properties between the geopolymer and the fine-grain aggregate [23].
3.2. Chemical and Phase Compositions
To determine the chemical composition of the tested precursors, the XRF method was used. The results are shown in Table 4. All the tested precursors contained mainly SiO2, Al2O3, Fe2O3, SO3, K2O, or CaO.
Table 4.
Composition of the oxide of the analyzed basic materials: M—metakaolin, SF—silica fume, A—aluminum powder, S—sand, B—basalt fiber.
Metakaolin’s chemical composition (M) showed that it contains: SiO2—over 51%, Al2O3—over 34%, CaO—over 11%, and TiO2—less than 1%. Similar chemical composition results for metakaolin were found by other scientists in their work [24]. A chemical composition study for silica fume (SF) showed oxides such as SiO2 at almost 99% and K2O and CaO at similar levels. A chemical composition test for aluminum powder (A) showed an aluminum oxide content of almost 100%. An examination of the chemical composition of the sand (S) revealed a SiO2 content of more than 99%. The study also revealed trace amounts of SO3, Fe2O3, or CaO. Basalt fiber (BF) is a material made of basalt rock, which consists of minerals such as pyroxene, plagioclase, and olivine group minerals [25]. The examination of the chemical composition of basalt fibers revealed the following chemical composition: almost 60% SiO2 content, almost 20% Al2O3 content, more than 10% Fe2O3 content, more than 7% CaO content, and more than 1% K2O and TiO2 content.
To determine the phase composition of the investigated precursors, XRD was used. The results are summarized in Table 5.
Table 5.
Identified phases in the base precursors.
Regarding metakaolin, the X-ray diffraction method has shown that it includes 18.9% quartz (SiO2), 12.1% Calcite (Ca(CO3)), and 16.3% Kaolinite (Al2Si2O5(OH)4, and Muscovite (Kal3Si3O10(OH)2) in its phase composition. Silica fume, in XRD analysis, showed in its phase composition the presence of quartz and gypsum in the respective percentages of 51.1% and 48.9%. Phase composition analysis for aluminum powder showed 100% presence of pure aluminum (Al). Also, the analysis of the sand revealed only one crystalline phase, quartz (SiO2). The purpose of XRF analysis is to determine the chemical composition of a sample. The technique is based on the emission of X-rays after the exposure of the sample to X-rays [26]. It provides information on the amount of chemical elements in the sample but does not provide information on their distribution in the crystal structure. XRD, on the other hand, is primarily used for the analysis of the crystalline structure of materials. It measures the diffraction of X-rays through a crystal to determine the distribution of atoms in the crystal structure. It provides information about the crystal structure of the material, such as the distance between crystal layers, diffraction angles, and crystal orientation [27]. Only the crystalline phases present in the investigated material were determined via XRD using Rietveld analysis.
3.3. Mechanical Properties and Structure Observation
The flexural and compressive strengths, respectively, are fundamental parameters for evaluating the validity of the geopolymerisation process and for assessing the possible usefulness of the synthesized binder for building purposes [28]. Alkali-activated materials’ compressive strength is determined by several different variables, such as the composition of the material or the presence of a crystalline phase. In this respect, the additives, as well as the base raw materials, the composition, and the presence of undissolved Al-Si particles or the reaction occurring at the surface between the gel phase and the undissolved Al-Si particles, also affect the results for the mechanical values of the geopolymer mortar [29].
The average flexural and compressive strength results for the alkali-activated binders produced and their average density are shown in Figure 5.
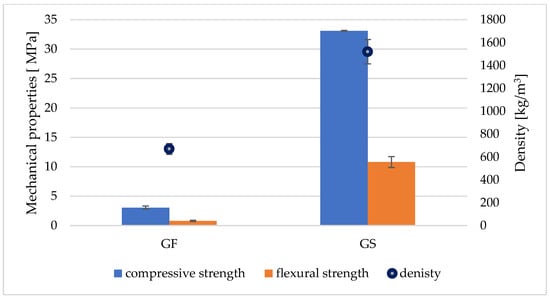
Figure 5.
Average compressive and flexural strength results for GC materials, together with their average density.
Both types of research materials belong to the category of lightweight construction materials [30]. Compared with a concrete density of 2400 kg/m3 [31], GF and GS are lighter at 72.08%, and 36.67%, respectively. The lightness of GC materials is highly dependent on aggregates and fillers, and they also greatly affect their properties [1,2].
The strength tests showed that GS had an average compressive strength of 33.1 MPa and a flexural strength of 10.8 MPa, with an average density of 1520 kg/m3. GF achieved an average compressive strength of 3.1 MPa and a flexural strength of 0.8 MPa, with an average material density of 670 kg/m3. The paper by Fiertak and Stryszewska investigated the compressive strength of binders based on Portland cement. The compressive strength of the sample based on cement alone was 30.3 MPa after 28 days. With the addition of 10% silica dust, the compressive strength increased to 35.5 MPa [32]. Baziak et al. analyzed the effect of hybrid fiber reinforcement on the properties of a lightweight fly-ash-based geopolymer. They used short steel fibers (SFs) and/or carbon fibers (CFs) as reinforcement. A significant improvement in flexural strength values was achieved in all cases by adding reinforcing fibers to the lightweight geopolymer composites, which could change the material’s brittle nature to a more plastic one. However, the highest flexural strength was achieved for the hybrid-reinforced composite: 1.5 wt.%. CFs and 0.5 wt.%. SFs [33].
For the assessment of detailed changes occurring in the surface topography of a material, scanning electron microscopy is used to evaluate the resulting structures [29]. Figure 6 shows the microstructure of the GC materials—solid and foamed.

Figure 6.
Structure of GC materials: (a) geopolymer solid (GS); (b) geopolymer foam (GF).
Figure 6a shows the microstructure of the GC without the foaming agent in the form of aluminum powder (GS). The material is characterized by a consistent and homogeneous structure with no visible pores. In addition, basalt fibers embedded in the GC matrix can be seen. Figure 6b shows the microstructure of the GC with the addition of a foaming agent in the form of aluminum powder (GF). The structure of the foamed GC is more heterogeneous, with numerous pores oscillating around 1–2 µm in size. In this case, basalt fibers can also be seen embedded in the GC matrix. However, they are less consistent with the GC matrix than in the case of the solid GC.
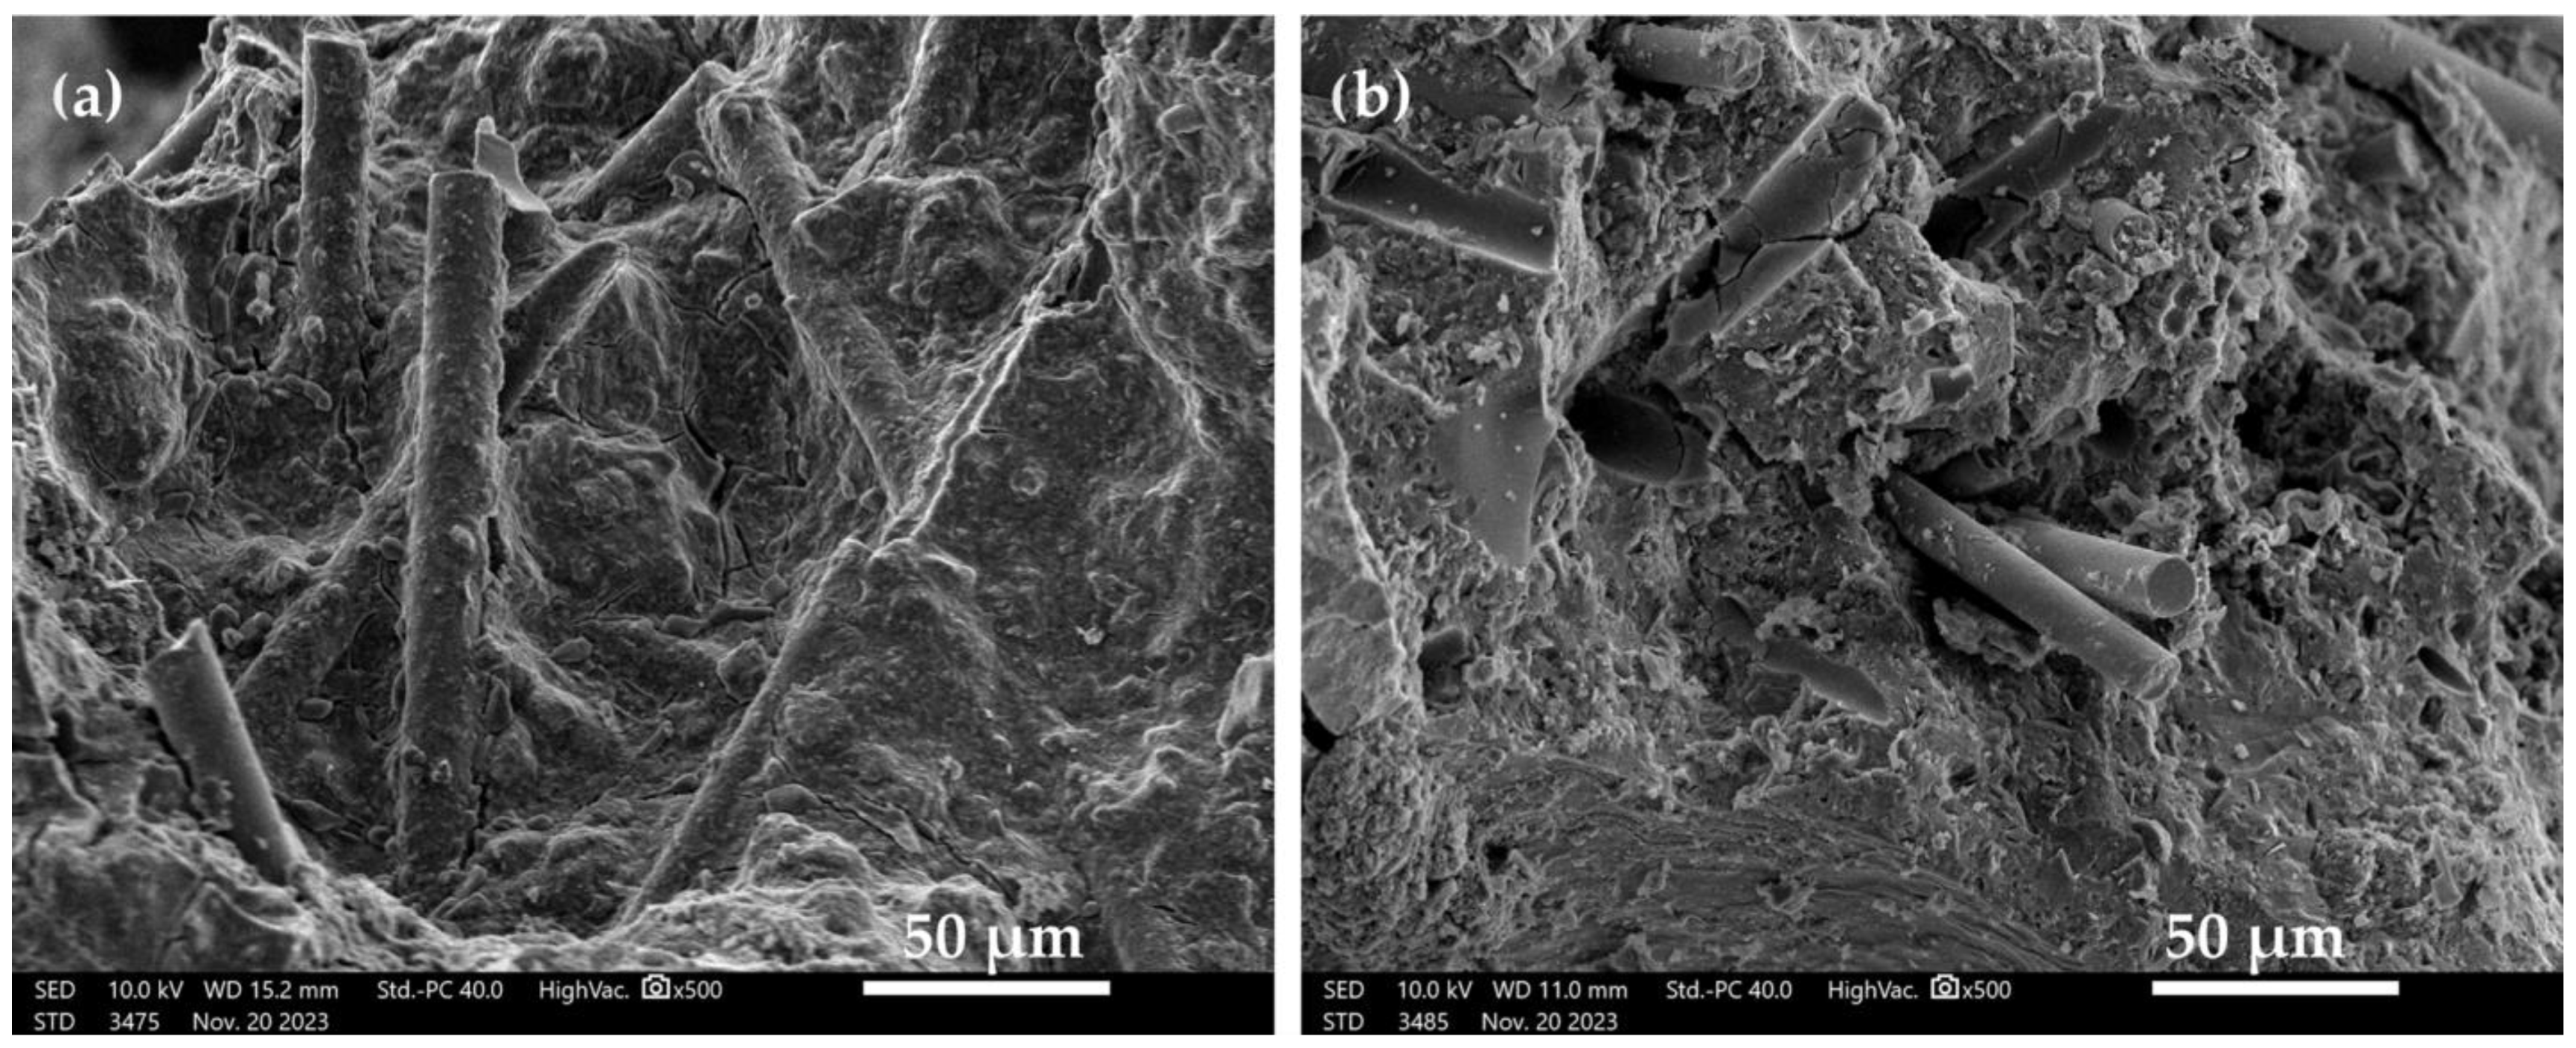
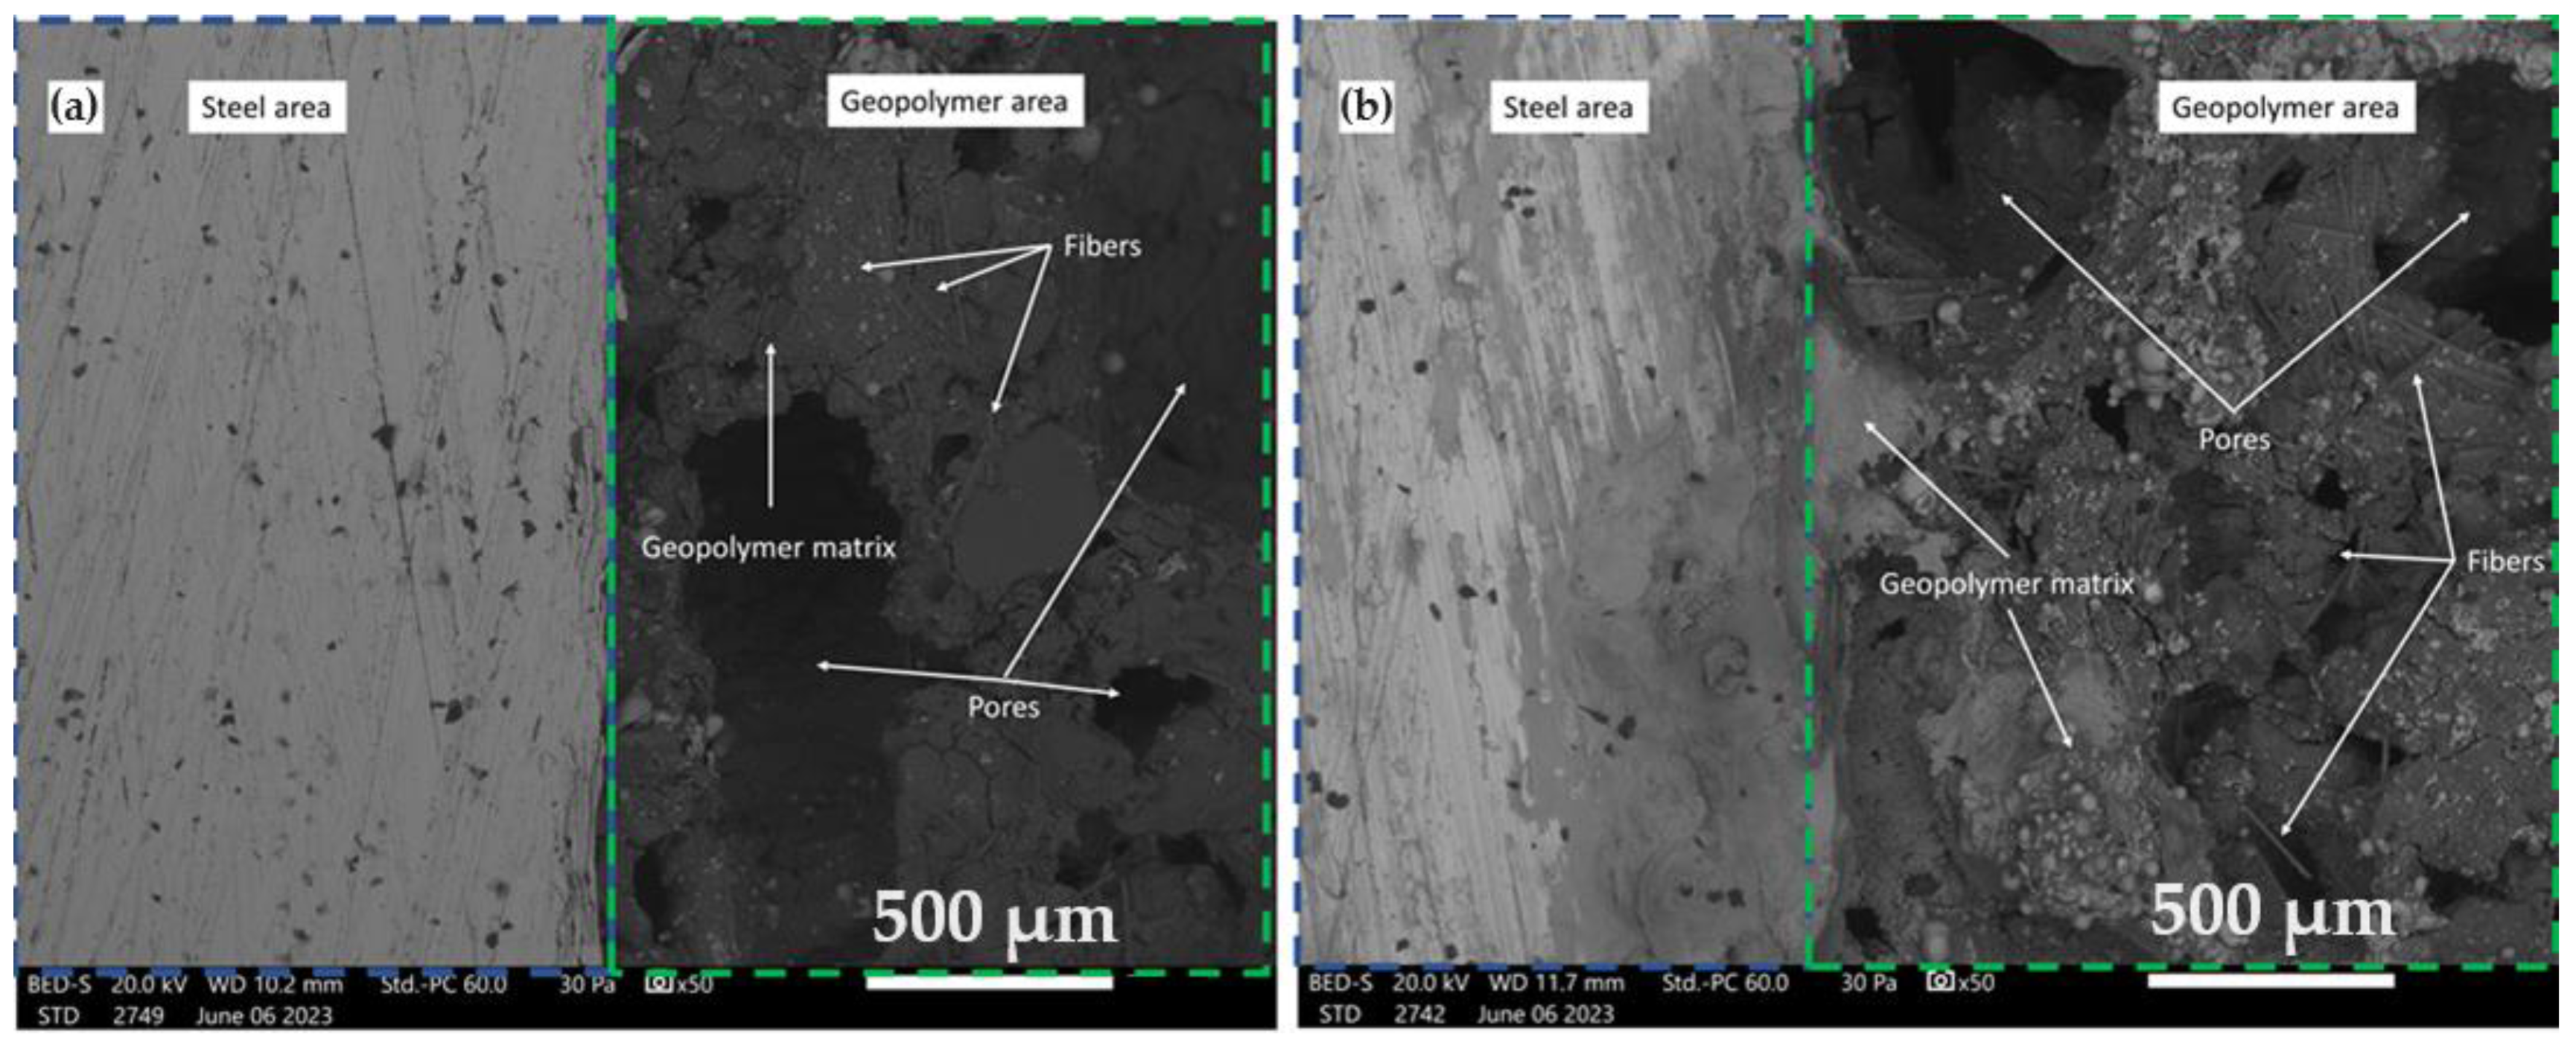
GCs are characterized by good adhesion to various types of steel and can be successfully used for protective coatings [34]. Figure 7 and Figure 8 show the changes in the integrity of the GC material with the metal matrix before and after accelerated aging tests. Figure 7 shows the changes in the bonding of a sintered GF applied via spraying onto a metal surface.
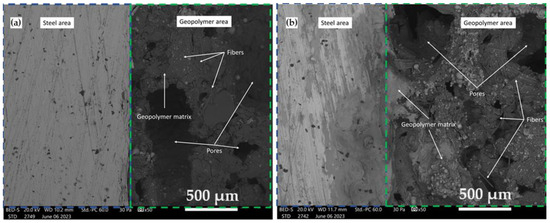
Figure 7.
SEM photograph of the surface interface between the foamed GC and the steel substrates (a) before and (b) after a 1000 h aging test.
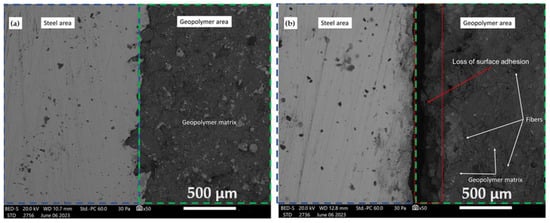
Figure 8.
SEM photograph of the surface interface between the non-foam GC and the steel substrates (a) before and (b) after a 1000 h aging test.
Figure 8 shows the variations in the bonding method of a GS applied via spraying onto a metal surface.
The investigation extends to SEM micrographs, offering insights into the interfacial zone connecting the GC and steel substrates. These micrographs, encompassing pre- and post-1000 h aging tests, are represented in Figure 7 and Figure 8. The robust structural integrity characterizing the foamed GC is conspicuously resilient when subjected to the rigors of the durability assessment, an observation lucidly depicted in Figure 7. In stark contrast, the non-foamed GC material is shown to undergo detachment from the steel substrate, a phenomenon clearly evidenced in Figure 8. The relationships between substrate surface roughness and adhesion strength have been extensively studied in the coating industry, providing invaluable information on geopolymer coatings applied to metal surfaces [35]. In general, the bond of a geopolymer coating to stainless steel and aluminum is low, as only a physically binding bond is formed [36]. In his study, Temuujin investigated the adhesion strength of a geopolymer coating based on fly ash applied to mild steel and stainless steel. The results indicated that it had a higher adhesion strength to mild steel (2.7 MPa) compared to stainless steel (0.25 MPa) [37]. The high adhesion strength is likely to be due to chemical interlocking or bonding between the coating and the substrate, in addition to the presence of physical bonding. This is achieved by increasing the surface roughness of the substrate, thus leading to a larger contact area between the surface of the coating and the substrate [36].
3.4. Thermal Conductivity and Pore Size Distribution
Thermal conductivity tests were carried out on GC–metal sheets in the temperature range of 0–20 °C. Each sample was analyzed twice, with the metal surface facing upwards and downwards, and the average thermal conductivity was calculated from the results. The results for the thermal conductivity of the GC–metal plate connections are shown in Table 6.
Table 6.
Thermal conductivity results for the metal-plate–GC joints.
In the 0–20 °C range, the combination of GS and metal plate achieved an average thermal conductivity of 0.864 [W/(m·K)]. Compared to the GF (metal plate–foamed geopolymer) combination, the thermal conductivity result was 560% higher. The average result for this type of joint was 0.153 [W/(m·K)]. Similar attempts at applying GC coatings were made by Kaczmarski et al. [38]. For the GC surface applied to cardboard, they obtained a thermal conductivity value of 0.155 [W/(m·K)]. In their work, Feng et al. synthesized foamed geopolymers (H2O2 as a foaming agent) based on fly ash, using different amounts of sodium water glass and two curing temperatures (55 and 85 °C). As a result, they obtained a geopolymer material that had a porosity of 79.9% and a thermal conductivity of 0.0744 [W/(m·K)] (curing temperature 55 °C, 80 g of sodium water glass, and 6 g of H2O2) [39]. In another study, researchers examined the thermal conductivity of fly-ash-based geopolymer blends using six different water-to-solid ratios ranging from 0.16 to 0.31. The average thermal conductivity results for the resulting geopolymers ranged from 0.75 to 1.54 [W/(m·K)] [40]. Masi et al., in their study, investigated the effects of basaltic fiber and PVA embedded in a foamed geopolymer matrix. They obtained thermal conductivity results of 0.38 [W/(m·K)] for basalt fibers and 0.30 [W/(m·K)] for PVA fibres [41]. Due to their porous structure, sintered geopolymer materials have reduced thermal conductivity, allowing them to successfully act as passive fire protection or thermal barriers [42].
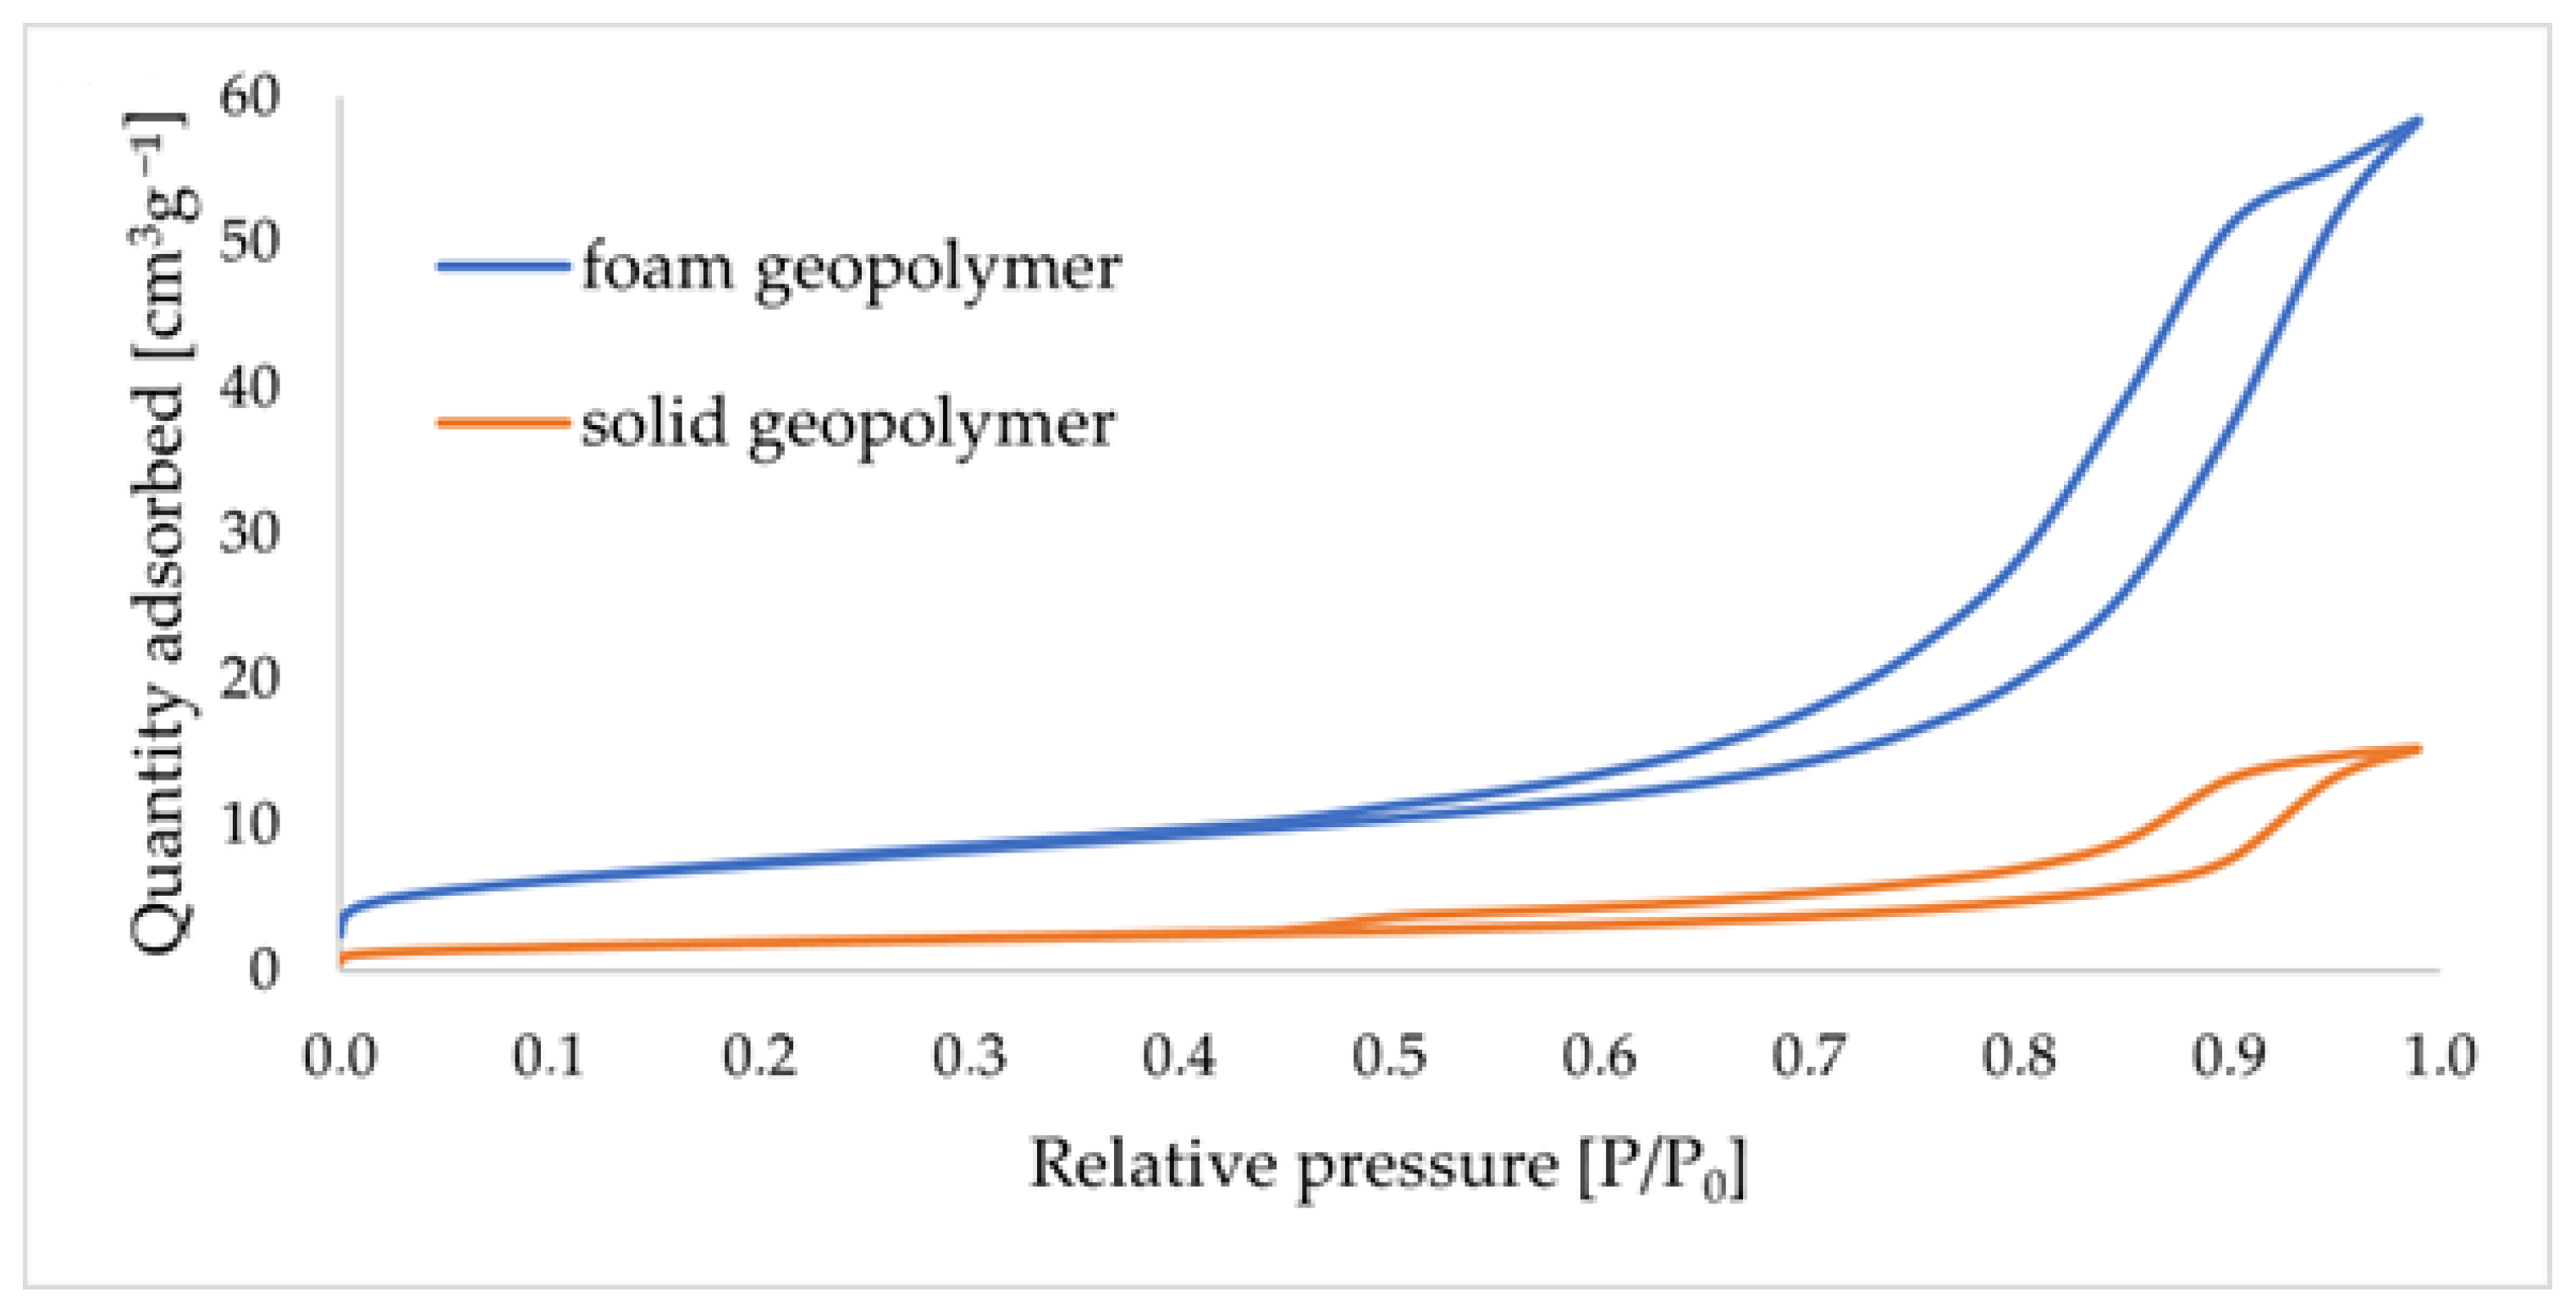
Figure 9 shows the sorption/desorption isotherms obtained for GS and GF materials.
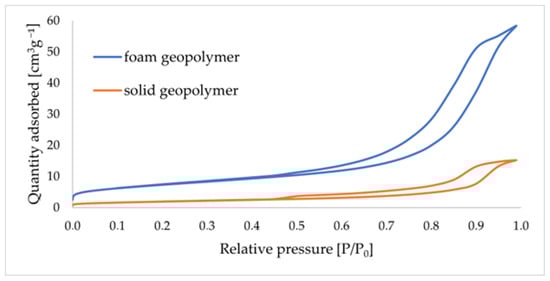
Figure 9.
Nitrogen adsorption–desorption isotherms for solid and foamed GCs.
The nitrogen adsorption–desorption isotherms presented above, according to the IUPAC classification, can be characterized as type-IV isotherms. These are typical isotherms for mesoporous materials. Similar adsorption–desorption curves when studying metakaolin-based GC materials were obtained in the work by Gomes et al. [43]. A characteristic H3-type hysteresis loop, typical of fractured inter-particle pores, is evident for the isotherms obtained. Mishra et al. describe in their paper that the cause of the H3-type hysteresis curve is the clustering of particles similar to plates, resulting in the formation of pore-shaped fissures [44]. Table 7 shows the results of the porous texture analysis for GC materials, taking into account the volume of micro- and mesopores and their average diameter.
Table 7.
Results of the porous texture analysis of the GC samples.
The specific surface area of SBET for the GS material was 7.044 m2/g. The volume of micropores in this material oscillated around 0.003 cm3/g, with an average diameter of approximately 1.833 nm. In contrast, the volume of mesopores in the GS represented a value of 0.023 cm3/g, with an average diameter of approximately 2.190 nm. The specific surface area of SBET for the GF material was 26.129 m2/g. The volume of micropores in this material oscillated around 0.010 cm3/g, with an average diameter of approximately 1.904 nm. In contrast, the volume of mesopores in the GF represented a value of 0.090 cm3/g, with an average diameter of approximately 12.303 nm. It was found that mesopores were the dominant porosity type in the samples after GC synthesis. Their contributions to the overall measured porosity volume ranged between values above 90%.
3.5. Fire Resistance
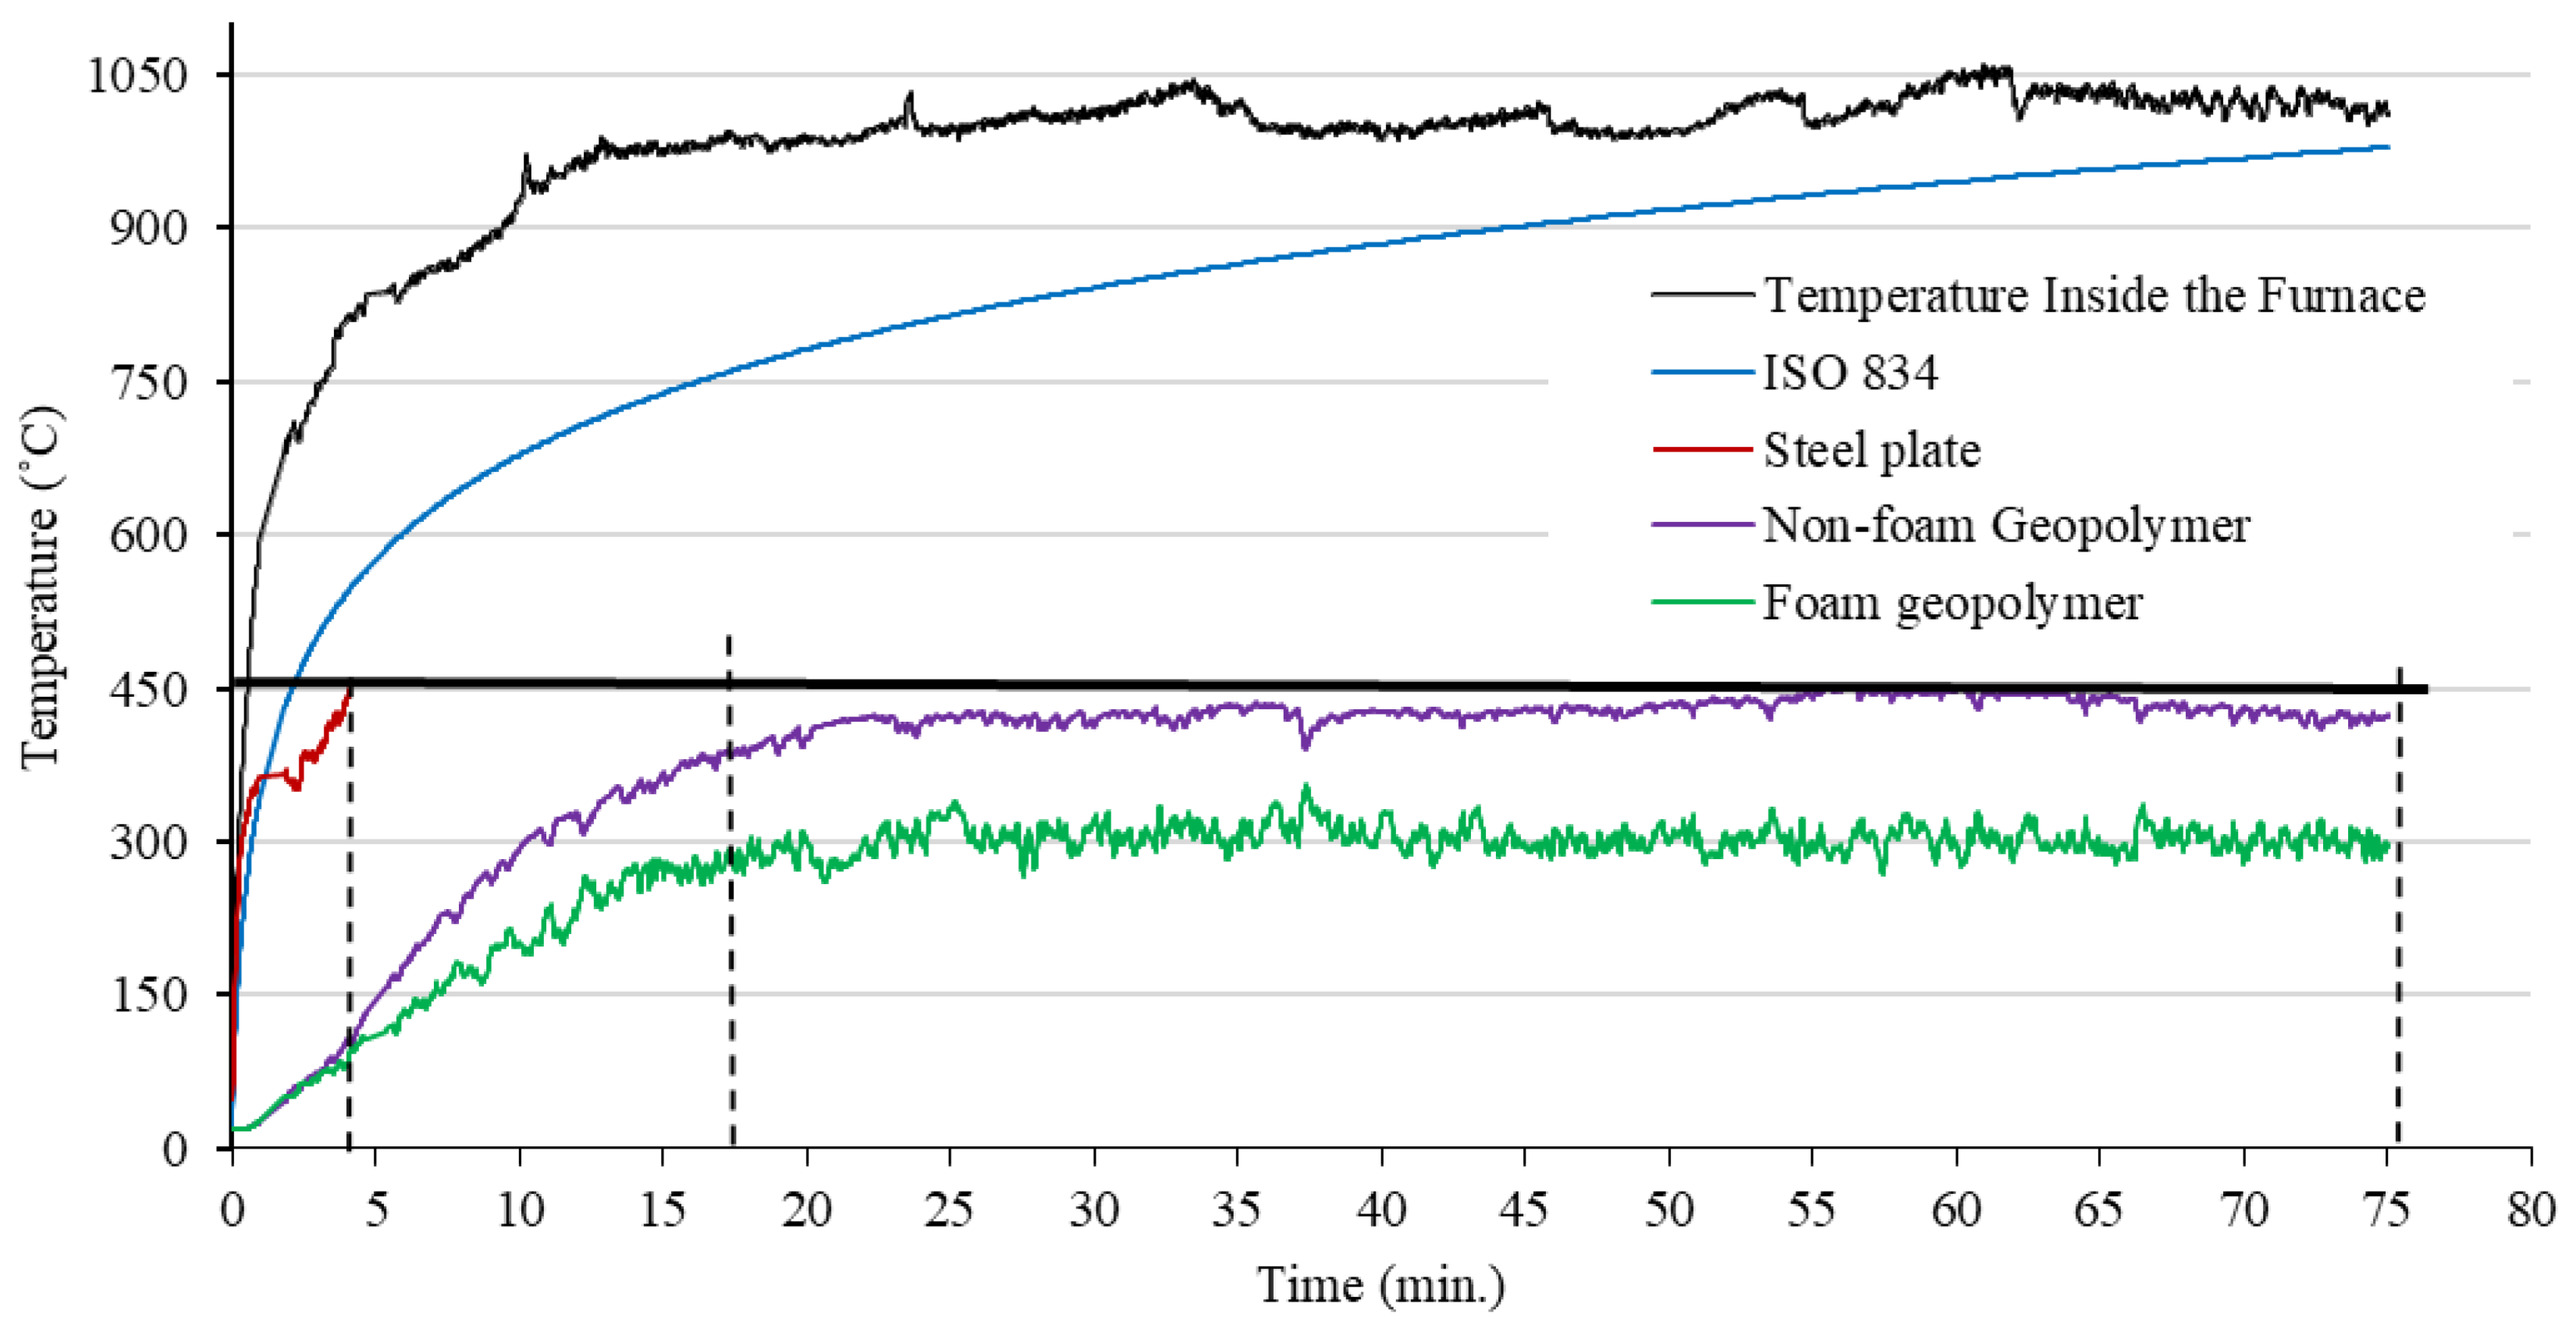
The temperature–time curve of the sample test is shown in Figure 10. The test was based on ISO 834. Initially, the surface temperature of the samples exposed to the flame of the gas torch rose rapidly until about 20 min, and then saturation occurred. The sample with the GS coating (coating thickness of 6 mm) withstood a temperature below 450 °C for 75 min, while the steel plate without the coating layer achieved this temperature for just 3.78 min. In addition, the foamed geopolymer (GS) coating achieved better fire resistance values compared to the solid geopolymer coating applied to the steel surface (a difference of almost 100 °C). The fire resistance of the samples is also affected by the thermal conductivity of the coatings and their thickness [18]. On the temperature–time curve from the 20th to the 75th minute, the temperature inside the furnace and the temperature outside the test sample were almost constant. The results show that GFs provide excellent thermal barriers, reducing the temperature of the steel plate by up to 150 °C. As the heat outside the plate is exposed to the environment, it is lost. In the next study, the author will investigate the behavior of the temperature–time curve as a function of the test conditions. On the outside, the test sample is covered with an insulating material. GCs were studied because of their unique properties, such as good fire resistance. Davidovits, in his paper, described the fact that geopolymers have excellent fire resistant properties up to 1200 °C, making them suitable for fire barrier applications [45]. A fire test of fly-ash-based geopolymers and metallurgical slag by Provis showed a low degree of material damage during a 4 h fire test [46]. Compared to Portland-cement-based products, geopolymers are more chemically stable when exposed to high temperatures. The structural damage or thermal deformation as a result of high temperatures depends mainly on the type and composition of the alkali activator or the water content [47]. In the temperature range 100–300 °C, the shrinkage of geopolymers can be caused by the dehydration of so-called free water. On the other hand, changes in the thermal deformation in the 300–600 °C temperature range of geopolymers can be correlated to the condensation reactions of the hydroxyl groups present in the geopolymers or the phase transformations occurring in this temperature range. The most significant shrinkage occurs in the temperature range 550–900 °C and is related to the sintering of the geopolymer gel [48]. Giannopou et al. described in their paper that the addition of fibers and fillers can stabilize and help maintain adequate mechanical strength at temperatures up to 1000 °C [49]. In their study, Sarazin et al. investigated the effect of high temperature (1100 °C) on the fire resistance of three geopolymer pastes applied to a steel coating. They found that the coatings provided an excellent thermal barrier to the steel surface. The geopolymer foam coating reduced the temperature of the back surface of the metal plate by 251 °C, compared to the surface of the metal plate without the applied geopolymer protective layer [50]. In their work, Carabba et al. described the effect of alkali-activated lightweight mortars as fire passive protection for metal structures. The 20 mm-thick geopolymer coating systems that they used contributed to slowing the temperature rise to 500 °C for the steel substrate for 38 min [51].
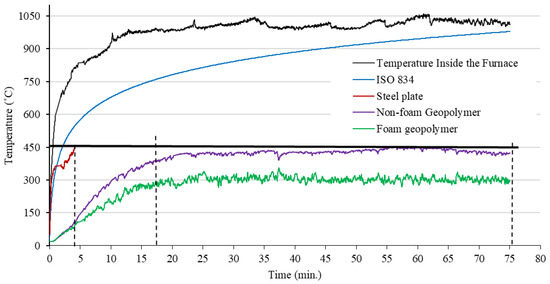
Figure 10.
Temperature–time curve of the sample test.
The constitution of the GC material transforms the degradation, combustion, diffusion, and thermal conduction processes. This intricate interplay is further exacerbated by evolving temperature conditions. With escalating temperatures, a proliferation of microcracks emerges, large both in number and size, along the material’s surface. This phenomenon significantly diminishes the thermal conductivity of the geopolymers [3].
3.6. Production Cost
The production cost of foam and non-foam GCs is represented by the values of 250 and 450 USD/m3. The global production cost of fresh concrete is about 200–300 USD/m3. The production cost of fresh concrete for each company is different [4]. The production cost has a positive linear relationship with the strength grade and the density of the GC.
4. Conclusions
In summary, the study sheds light on the transformative potential of GCs and spray technology, specifically highlighting the following:
- This article underscores the transformative role of GCs in advancing fire protection and insulation within structures, presenting a promising alternative to conventional construction materials;
- The utilization of spray technology, particularly shotcrete, emerges as a pivotal technique for underground construction, emphasizing its adaptability and versatility in diverse construction scenarios;
- The significance of GC coatings for steel protection is highlighted, delving into specific features, such as the setting time, application process, attachment strength, fire testing, and production costs;
- This research employs a comprehensive array of methods, including strength tests, density tests, thermal conductivity tests, accelerated aging tests, microstructure analyses, analyses of pore size, and fire resistance tests, providing a thorough exploration of GC materials;
- The study concludes with noteworthy results on GC coating (GC) foams, showcasing their outstanding thermal insulation capabilities. With a mere 6 mm coating, GC foams provide up to 75 min of fire resistance, reducing uncoated steel temperatures by 150 °C. Key properties such as a density of 670 kg/m3, thermal conductivity of 0.153 W/m·K, and cost efficiency of USD 250 per cubic meter further affirm their efficacy in practical applications.
Author Contributions
V.S.L.: Conceptualization, methodology, investigation, validation, writing—original draft preparation, writing—review and editing, visualization, resources, supervision, funding acquisition. K.S.: conceptualization, investigation, formal analysis, writing—original draft preparation, writing—review and editing. All authors have read and agreed to the published version of the manuscript.
Funding
This research received no external funding.
Institutional Review Board Statement
Not applicable.
Informed Consent Statement
Not applicable.
Data Availability Statement
Data are contained within the article.
Acknowledgments
This investigation was supported by the project “Development of geopolymer composites as a material for protection of hazardous wrecks and other critical underwater structures against corrosion”, project number TH80020007. The support was obtained through the Financial Support Technology Agency of the Czech Republic (TACR) within the Epsilon Program in the Call 2021 M-ERA.Net3. Additionaly this paper was written at the Technical University of Liberec, Institute for Nanomaterials, Advanced Technologies and Innovation with the support of the Institutional Endowment for the Long Term Conceptual Development of Research Institutes, as provided by the Ministry of Education, Youth and Sports of the Czech Republic in the year 2024.
Conflicts of Interest
The authors declare no conflict of interest.
References
- Prałat, K.; Ciemnicka, J.; Koper, A.; Szczypiński, M.M.; Łoś, P.; Nguyen, V.V.; Le, V.S.; Rapiejko, C.; Ercoli, R.; Buczkowska, K.E. Determination of the Thermal Parameters of Geopolymers Modified with Iron Powder. Polymers 2022, 14, 2009. [Google Scholar] [CrossRef] [PubMed]
- Le, V.S.; Louda, P.; Tran, H.N.; Nguyen, P.D.; Bakalova, T.; Buczkowska, K.E.; Dufková, I. Study on Temperature-Dependent Properties and Fire Resistance of Metakaolin-Based Geopolymer Foams. Polymers 2020, 12, 2994. [Google Scholar] [CrossRef] [PubMed]
- Peng, X.; Li, H.; Shuai, Q.; Wang, L. Fire Resistance of Alkali Activated Geopolymer Foams Produced from Metakaolin and Na2O2. Materials 2020, 13, 535. [Google Scholar] [CrossRef] [PubMed]
- Ye, J.; Zhang, W.; Shi, D. Effect of Elevated Temperature on the Properties of Geopolymer Synthesized from Calcined Ore-Dressing Tailing of Bauxite and Ground-Granulated Blast Furnace Slag. Constr. Build. Mater. 2014, 69, 41–48. [Google Scholar] [CrossRef]
- Chithambaram, S.; Kumar, S.; Prasad, M.M. Thermo-Mechanical Characteristics of Geopolymer Mortar. Constr. Build. Mater. 2019, 213, 100–108. [Google Scholar] [CrossRef]
- Yang, Z.; Mocadlo, R.; Zhao, M.; Sisson, R.D.; Tao, M.; Liang, J. Preparation of a Geopolymer from Red Mud Slurry and Class F Fly Ash and Its Behavior at Elevated Temperatures. Constr. Build. Mater. 2019, 221, 308–317. [Google Scholar] [CrossRef]
- Kürklü, G. The Effect of High Temperature on the Design of Blast Furnace Slag and Coarse Fly Ash-Based Geopolymer Mortar. Compos. Part. B Eng. 2016, 92, 9–18. [Google Scholar] [CrossRef]
- František, Š.; Rostislav, Š.; Zdeněk, T.; Petr, S.; Vít, Š.; Zuzana, Z.C. Preparation and Properties of Fly Ashbased Geopolymer Foams. Ceramics-Silikáty 2014, 58, 188–197. [Google Scholar]
- Hlaváek, P.; Milauer, V.; Kvára, F.; Kopecký, L.; Šulc, R. Inorganic Foams Made from Alkali-Activated Fly Ash: Mechanical, Chemical and Physical Properties. J. Eur. Ceram. Soc. 2015, 35, 703–709. [Google Scholar] [CrossRef]
- Cilla, M.S.; de Mello Innocentini, M.D.; Morelli, M.R.; Colombo, P. Geopolymer Foams Obtained by the Saponification/Peroxide/Gelcasting Combined Route Using Different Soap Foam Precursors. J. Am. Ceram. Soc. 2017, 100, 3440–3450. [Google Scholar] [CrossRef]
- Liu, L.; Cui, X.; He, Y.; Liu, S.; Gong, S. The Phase Evolution of Phosphoric Acid-Based Geopolymers at Elevated Temperatures. Mater. Lett. 2012, 66, 10–12. [Google Scholar] [CrossRef]
- Tong, Y. Sprayed Concrete Multipurpose Nozzle. 2020. Available online: https://typeset.io/papers/sprayed-concrete-multipurpose-nozzle-2zn9lf93qi (accessed on 15 August 2023).
- Wang, M. Concrete Spraying Construction Method. 2019. Available online: https://typeset.io/papers/concrete-spraying-construction-method-4ix4w13ma1 (accessed on 15 August 2023).
- Xiao, F. Concrete Spraying Construction Technology. 2019. Available online: https://typeset.io/papers/concrete-spraying-construction-technology-4x1lmjzcsq (accessed on 15 August 2023).
- Vyacheslav, A.; Bazhenova, S. Optimization of Concrete Compositions for Sprayed Concrete in the Construction of Underground Structures. Bull. Belgorod State Technol. Univ. Named V. G. Shukhov 2020, 8–17. [Google Scholar] [CrossRef]
- Melbye, T.A.; Dimmock, R.H. Modern Advances and Applications of Sprayed Concrete. In Shotcrete: Engineering Developments; CRC Press: Boca Raton, FL, USA, 2020; pp. 7–29. [Google Scholar] [CrossRef]
- Nguyen, V.V.; Le, V.S.; Louda, P.; Szczypiński, M.M.; Ercoli, R.; Růžek, V.; Łoś, P.; Prałat, K.; Plaskota, P.; Pacyniak, T.; et al. Low-Density Geopolymer Composites for the Construction Industry. Polymers 2022, 14, 304. [Google Scholar] [CrossRef]
- Le, V.S.; Nguyen, V.V.; Sharko, A.; Ercoli, R.; Nguyen, T.X.; Tran, D.H.; Łoś, P.; Buczkowska, K.E.; Mitura, S.; Špirek, T.; et al. Fire Resistance of Geopolymer Foams Layered on Polystyrene Boards. Polymers 2022, 14, 1945. [Google Scholar] [CrossRef] [PubMed]
- Le, C.H.; Louda, P.; Ewa Buczkowska, K.; Dufkova, I. Investigation on Flexural Behavior of Geopolymer-Based Carbon Textile/Basalt Fiber Hybrid Composite. Polymers 2021, 13, 751. [Google Scholar] [CrossRef] [PubMed]
- Le, V.S.; Louda, P. Research of Curing Time and Temperature-Dependent Strengths and Fire Resistance of Geopolymer Foam Coated on an Aluminum Plate. Coatings 2021, 11, 87. [Google Scholar] [CrossRef]
- Troisi, J.; Troisi, G.; Scala, G.; Richards, S.M. Techniques for Converting Metabolomic Data for Analysis. In Metabolomics Perspectives: From Theory to Practical Application; Academic Press: Cambridge, MA, USA, 2022; pp. 265–285. [Google Scholar] [CrossRef]
- Traven, K.; Češnovar, M.; Ducman, M. Particle size manipulation as an influential parameter in the development of mechanical properties in electric arc furnace slag-based AAM. Ceram. Int. 2019, 45, 22632–22641. [Google Scholar] [CrossRef]
- Li, H.; Gao, P.; Xu, F.; Sun, T.; Zhou, Y.; Zhu, J.; Peng, C.; Lin, J. Effect of fine aggregate particle characteristics on mechanical properties of fly ash-based geopolymer mortar. Minerals 2021, 11, 897. [Google Scholar] [CrossRef]
- Marczyk, J.; Ziejewska, C.; Korniejenko, K.; Łach, M.; Marzec, W.; Góra, M.; Dziura, P.; Sprince, A.; Szechyńska-Hebda, M.; Hebda, M. Properties of 3D Printed Concrete–Geopolymer Hybrids Reinforced with Aramid Roving. Materials 2022, 15, 6132. [Google Scholar] [CrossRef]
- Singha, K. A Short Review on Basalt Fiber. Int. J. Text. Sci. 2012, 1, 19–28. [Google Scholar]
- Temitope, D.; Oyedotun, T. X-ray fluorescence (XRF) in the investigation of the composition of earth materials: A review and an overview. Geol. Ecol. Landsc. 2018, 2, 148–154. [Google Scholar] [CrossRef]
- Pinto, C.D.C.; Sanches, E.A.; Clerici, M.T.P.S.; Pereira, M.T.; Campelo, P.H.; Souza, S.M. X-ray diffraction and Rietveld characterization of radiation-induced physicochemical changes in Ariá (Goeppertia allouia) C-type starch. Food Hydrocoll. 2021, 117, 106682. [Google Scholar] [CrossRef]
- Demiral, N.C.; Ozkan Ekinci, M.; Sahin, O.; Ilcan, H.; Kul, A.; Yildirim, G.; Sahmaran, M. Mechanical Anisotropy Evaluation and Bonding Properties of 3D-Printable Construction and Demolition Waste-Based Geopolymer Mortars. Cem. Concr. Compos. 2022, 134, 104814. [Google Scholar] [CrossRef]
- Ural, N. The Significance of Scanning Electron Microscopy (SEM) Analysis on the Microstructure of Improved Clay: An Overview. Open Geosci. 2021, 13, 197–218. [Google Scholar] [CrossRef]
- Sharma, A.S. Influence of Foam Densities in Cellular Lightweight Concrete. Int. J. Res. Appl. Sci. Eng. Technol. 2017, 5, 1078–1089. [Google Scholar] [CrossRef]
- Clements, D.H. ‘Concrete’ Manipulatives, Concrete Ideas. Contemp. Issues Early Child. 2000, 1, 45–60. [Google Scholar] [CrossRef]
- Fiertak, M.; Stryszewska, T. Resistance of Three-Component Cement Binders in Highly Chemically Corrosive Environments. Procedia Eng. 2013, 57, 278–286. [Google Scholar] [CrossRef]
- Baziak, A.; Pławecka, K.; Hager, I.; Castel, A.; Korniejenko, K. Development and Characterization of Lightweight Geopolymer Composite Reinforced with Hybrid Carbon and Steel Fibers. Materials 2021, 14, 5741. [Google Scholar] [CrossRef]
- Parzych, S.; Paszkowska, M.; Stanisz, D.; Bąk, A.; Łach, M. Possibilities of Using Geopolymers in Welding Processes and Protection against High Temperatures. Materials 2023, 16, 7035. [Google Scholar] [CrossRef]
- Rong, X.; Wang, Z.; Xing, X.; Zhao, L. Review on the adhesion of geopolymer coatings. ACS Omega 2021, 6, 5108–5112. [Google Scholar] [CrossRef]
- Tian, Q.; Wang, S.; Sui, Y.; Lv, Z. Alkali-activated materials as coatings deposited on various substrates: A review. Int. J. Adhes. Adhes. 2021, 110, 102934. [Google Scholar] [CrossRef]
- Temuujin, J.; Minjigmaa, A.; Rickard, W.; Lee, M.; Williams, I.; van Riessen, A. Preparation of metakaolin based geopolymer coatings on metal substrates as thermal barriers. Appl. Clay Sci. 2009, 46, 265–270. [Google Scholar] [CrossRef]
- Kaczmarski, K.; Pławecka, K.; Kozub, B.; Bazan, P.; Łach, M. Preliminary Investigation of Geopolymer Foams as Coating Materials. Appl. Sci. 2022, 12, 11205. [Google Scholar] [CrossRef]
- Feng, J.; Zhang, R.; Gong, L.; Li, Y.; Cao, W.; Cheng, X. Development of porous fly ash-based geopolymer with low thermal conductivity. Mater. Des. (1980–2015) 2015, 65, 529–533. [Google Scholar] [CrossRef]
- Agustini, N.K.A.; Triwiyono, A.; Sulistyo, D.; Suyitno, D. Effects of water to solid ratio on thermalconductivity of fly ash-based geopolymer paste. IOP Conf. Ser. Earth Environ. Sci. 2020, 426, 012010. [Google Scholar] [CrossRef]
- Masi, G.; Richard, W.D.A.; Bignozzi, M.C.; van Riessen, A. The effect of organic and inorganic fibres on the mechanical and thermal properties of aluminate activated geopolymers. Compos. Part. B Eng. 2015, 76, 218–228. [Google Scholar] [CrossRef]
- Klima, K.M.; Schollbach, K.; Brouwers, H.J.H.; Yu, Q. Thermal and fire resistance of Class F fly ash based geopolymers—A review. Constr. Build. Mater. 2022, 323, 126529. [Google Scholar] [CrossRef]
- Gomes, S.; Petit, E.; Frezet, L.; Nedelec, J.; Gharzouni, A.; Rossignol, S.; Renaudin, G. Temperature Stability of a Pure Metakaolin Based K-geopolymer: Part 2. Variations in the Mesoporous Network and Its Rehydration Stability. J. Am. Ceram. Soc. 2020, 103, 5813–5824. [Google Scholar] [CrossRef]
- Mishra, D.K.; Samad, S.K.; Varma, A.K.; Mendhe, V.A. Pore Geometrical Complexity and Fractal Facets of Permian Shales and Coals from Auranga Basin, Jharkhand, India. J. Nat. Gas Sci. Eng. 2018, 52, 25–43. [Google Scholar] [CrossRef]
- Davidovits, J. Fire proof geopolymeric cements. In Proceedings of the Geopolymer ‘99 2nd International Conference on Geopolymer, Saint-Quentin, France, 30 June–2 July 1999. [Google Scholar]
- Provis, J. Fire Resistance of Geopolymer Concretes; Melbourne Univercity Victoria: Melbourne, Australia, 2010; pp. 1–8. Available online: https://apps.dtic.mil/sti/pdfs/ADA516453.pdf (accessed on 25 November 2023).
- Yasaswini, K.; Rao, A.V. Behaviour of geopolymer concrete at elevated temperature. Mater. Today Proc. 2020, 33, 239–244. [Google Scholar] [CrossRef]
- Lahoti, M.; Tan, K.H.; Yang, E.-H. A critical review of geopolymer properties for structural fire-resistance applications. Constr. Build. Mater. 2019, 221, 514–526. [Google Scholar] [CrossRef]
- Giannopoulou, I.; Robert, P.M.; Sakkas, K.M.; Petrou, M.F.; Nicolaides, D. High temperature performance of geopolymers based on construction and demolition waste. J. Build. Eng. 2023, 72, 106575. [Google Scholar] [CrossRef]
- Sarazin, J.; Davy, C.A.; Bourbigot, S.; Tricot, G.; Hosdez, J.; Lambertin, D.; Fontaine, G. Flame resistance of geopolymer foam coatings for the fire protection of steel. Compos. Part B Eng. 2021, 222, 109045. [Google Scholar] [CrossRef]
- Carabba, L.; Masi, G.; Pirskawetz, S.; Krüger, S.; Gluth, G.; Bignozzi, M.C. Thermal properties and steel corrosion in light-weight alkali-activated mortars. In Proceedings of the International Conference on Sustainable Materials, Systems and Structures (SMSS2019)—New generation of Construction Materials, Rovinji, Croatia, 18–22 March 2019; Volume 1, pp. 125–132. [Google Scholar]


Disclaimer/Publisher’s Note: The statements, opinions and data contained in all publications are solely those of the individual author(s) and contributor(s) and not of MDPI and/or the editor(s). MDPI and/or the editor(s) disclaim responsibility for any injury to people or property resulting from any ideas, methods, instructions or products referred to in the content. |
© 2024 by the authors. Licensee MDPI, Basel, Switzerland. This article is an open access article distributed under the terms and conditions of the Creative Commons Attribution (CC BY) license (https://creativecommons.org/licenses/by/4.0/).