
Peak Cutting Force Estimation of Improved Projection Profile Method for Rock Fracturing Capacity Prediction with High Lithological Tolerance


Abstract
:1. Introduction
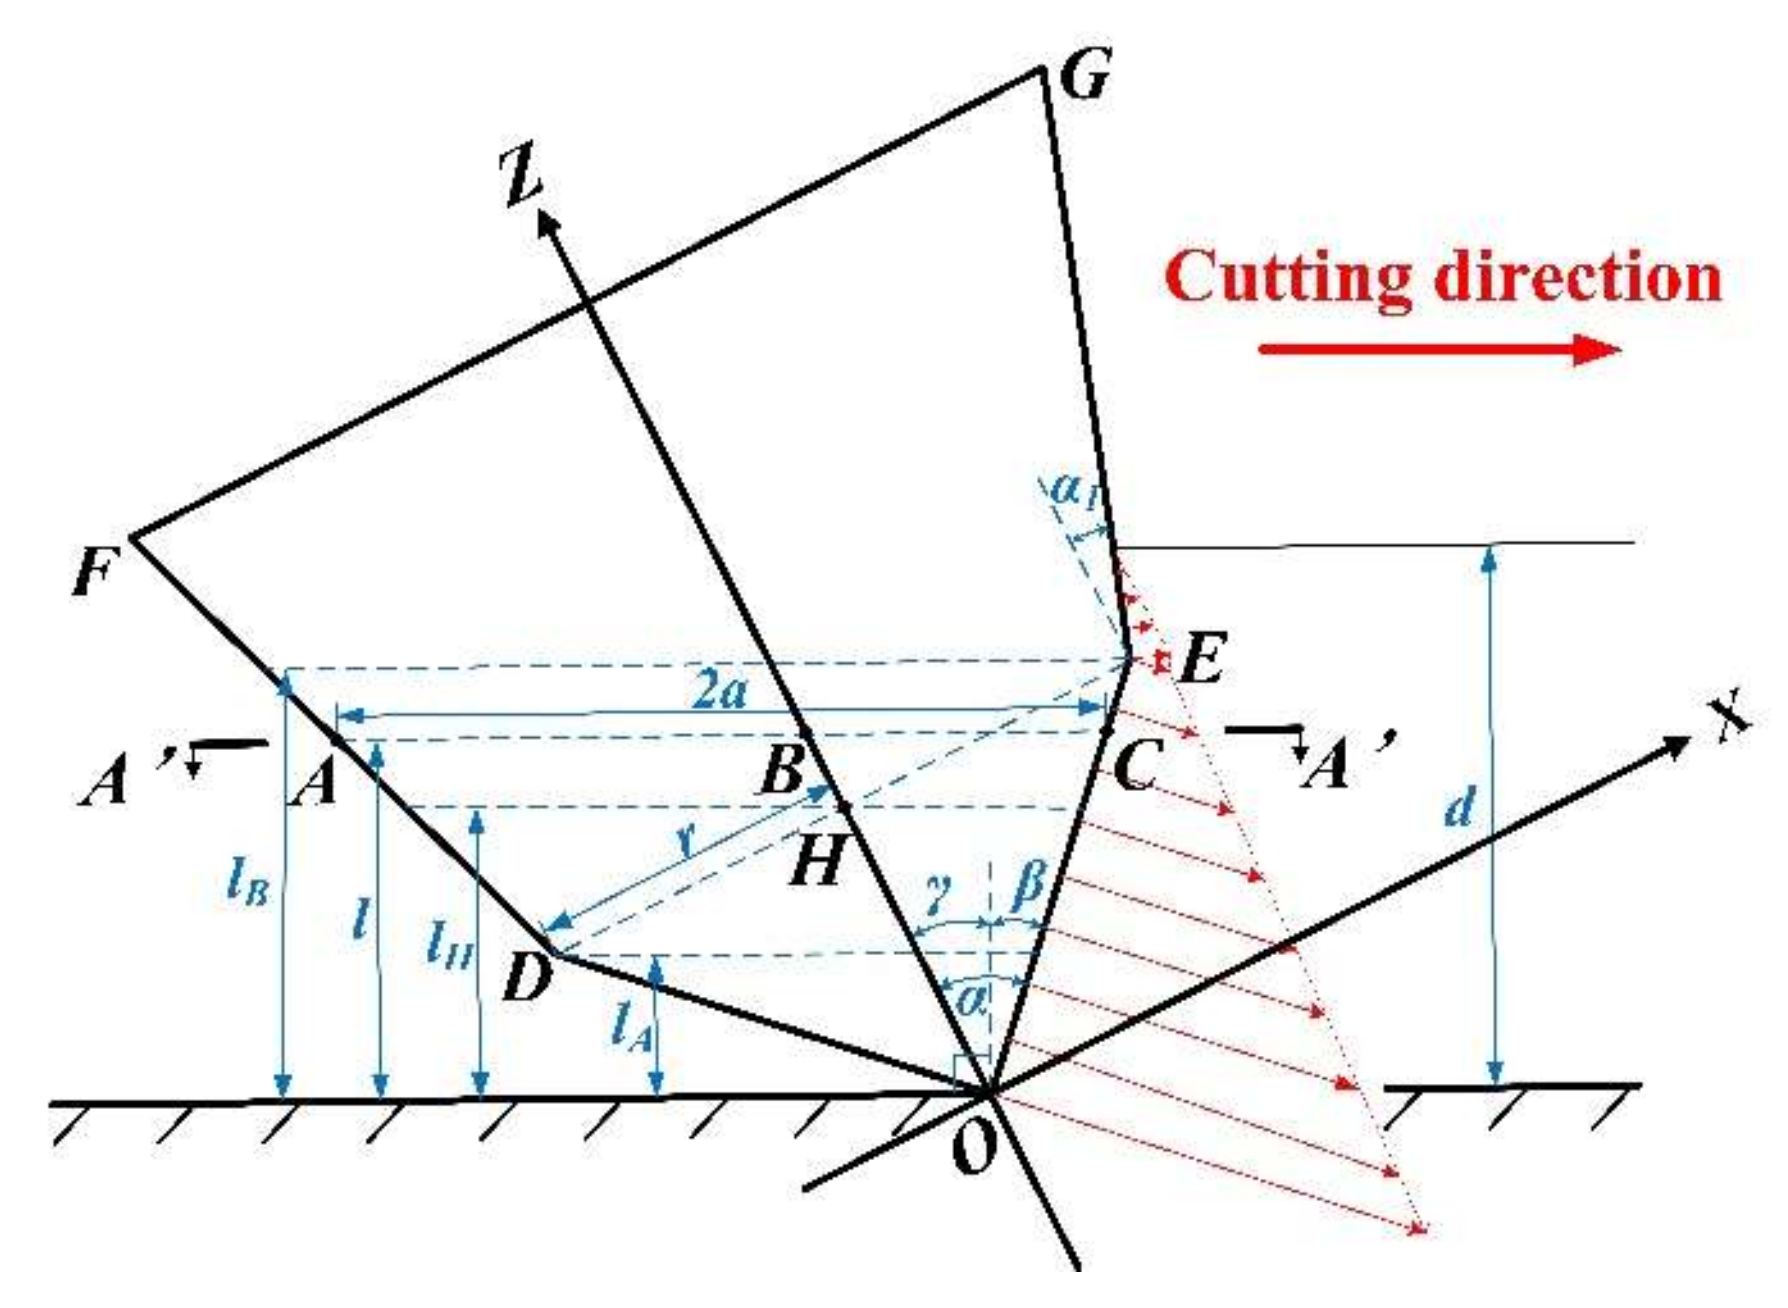
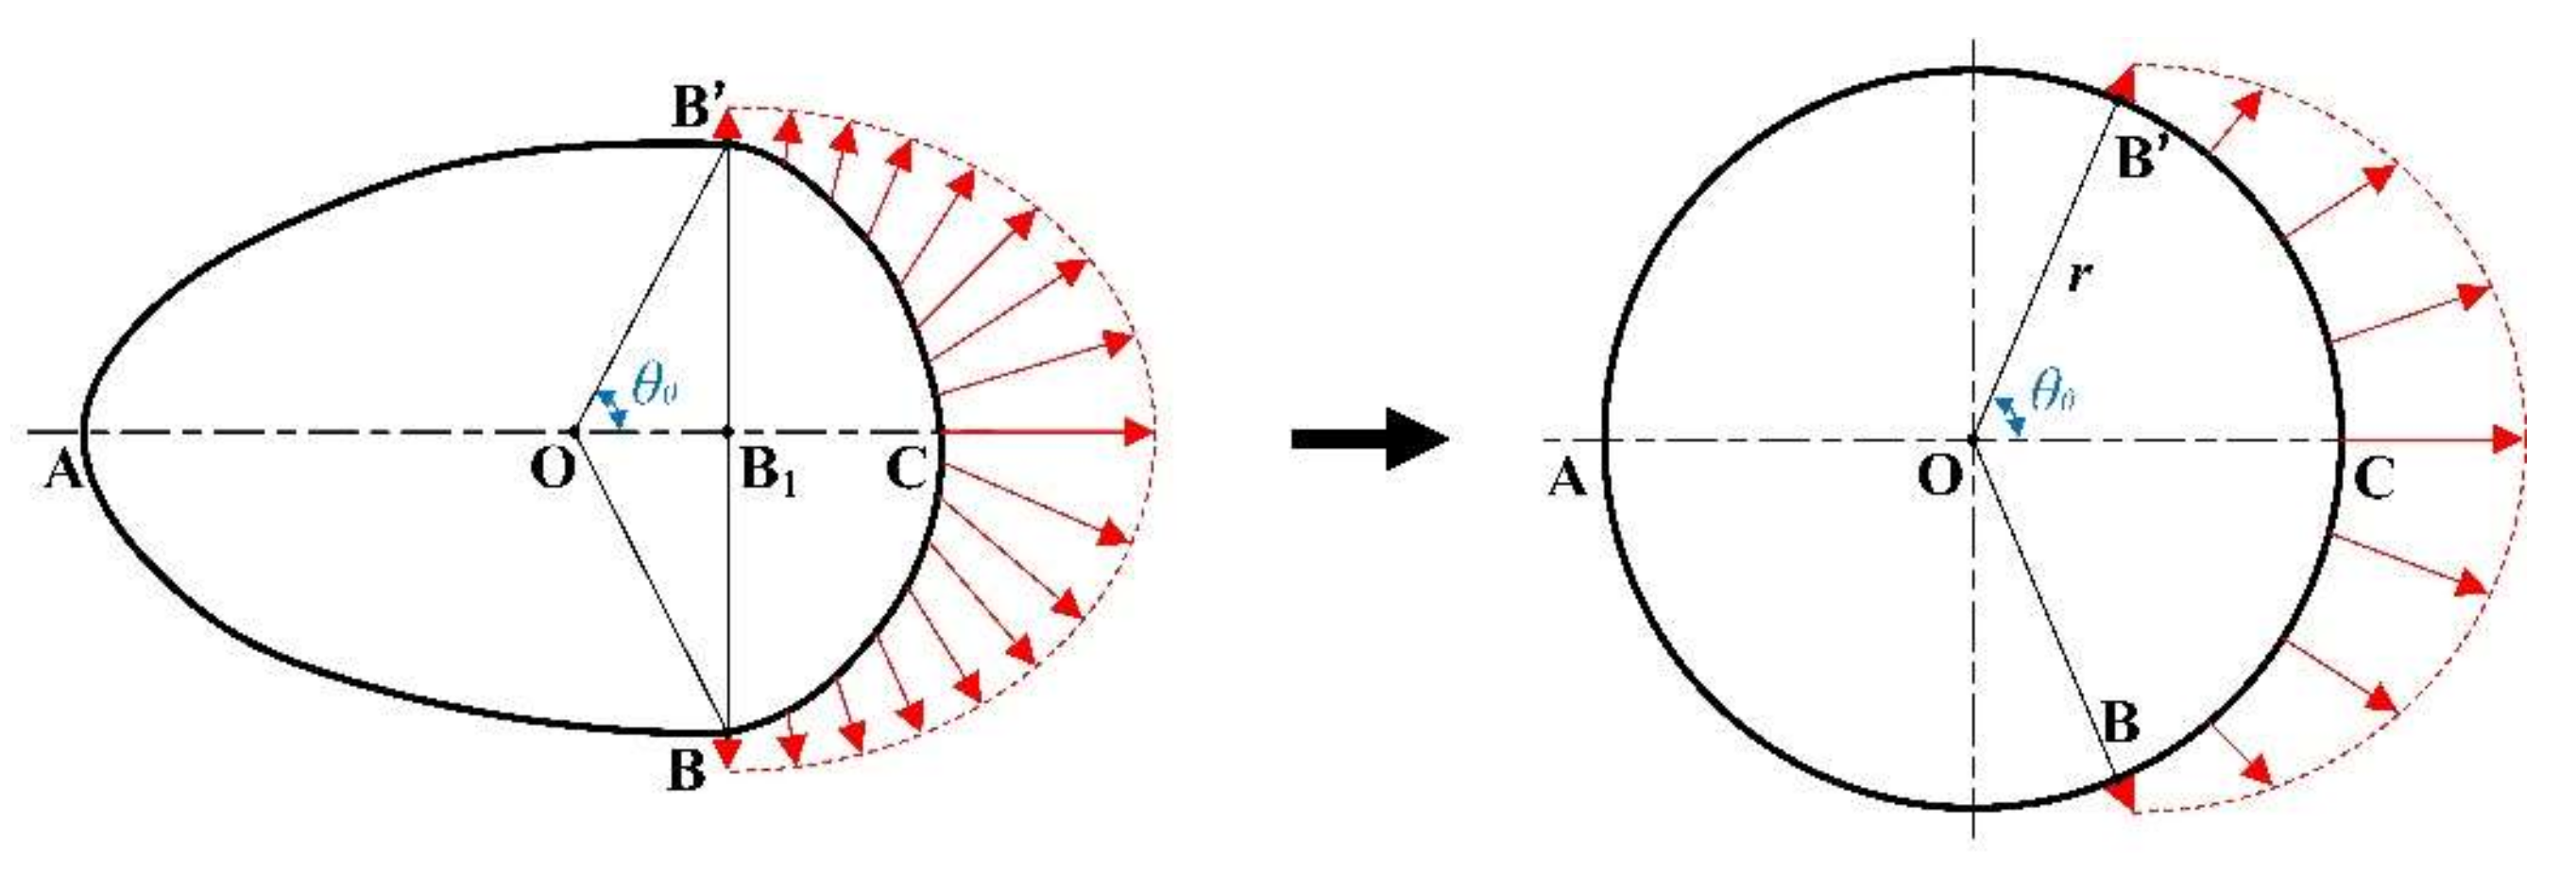
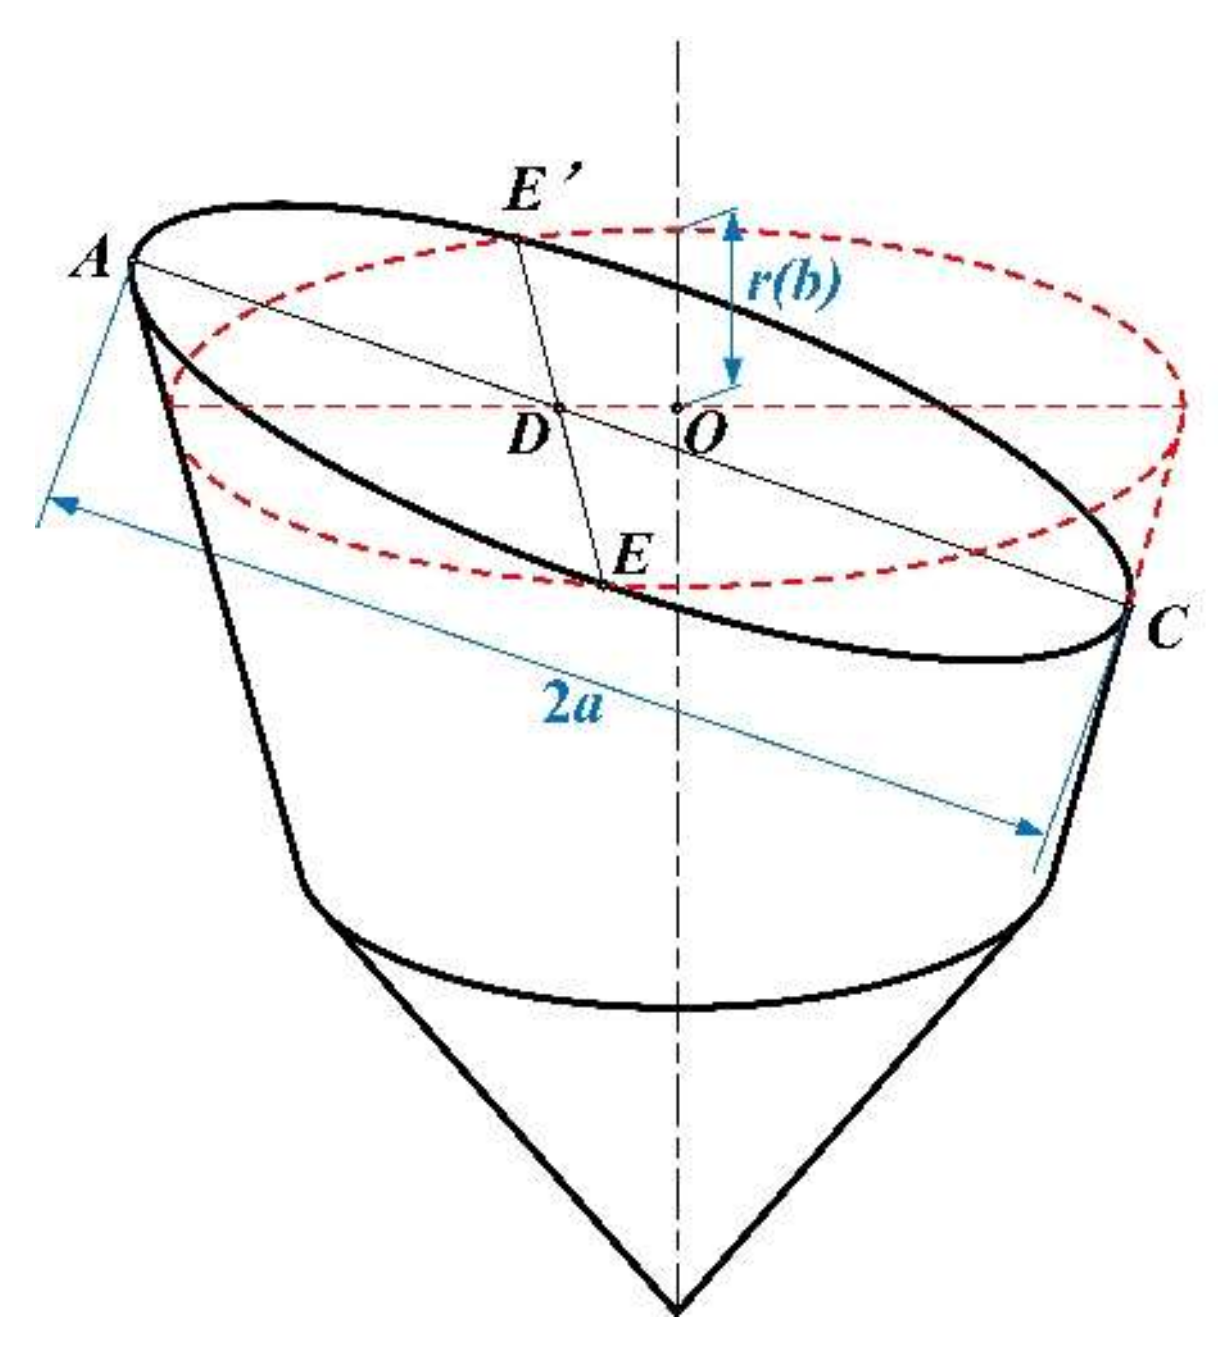
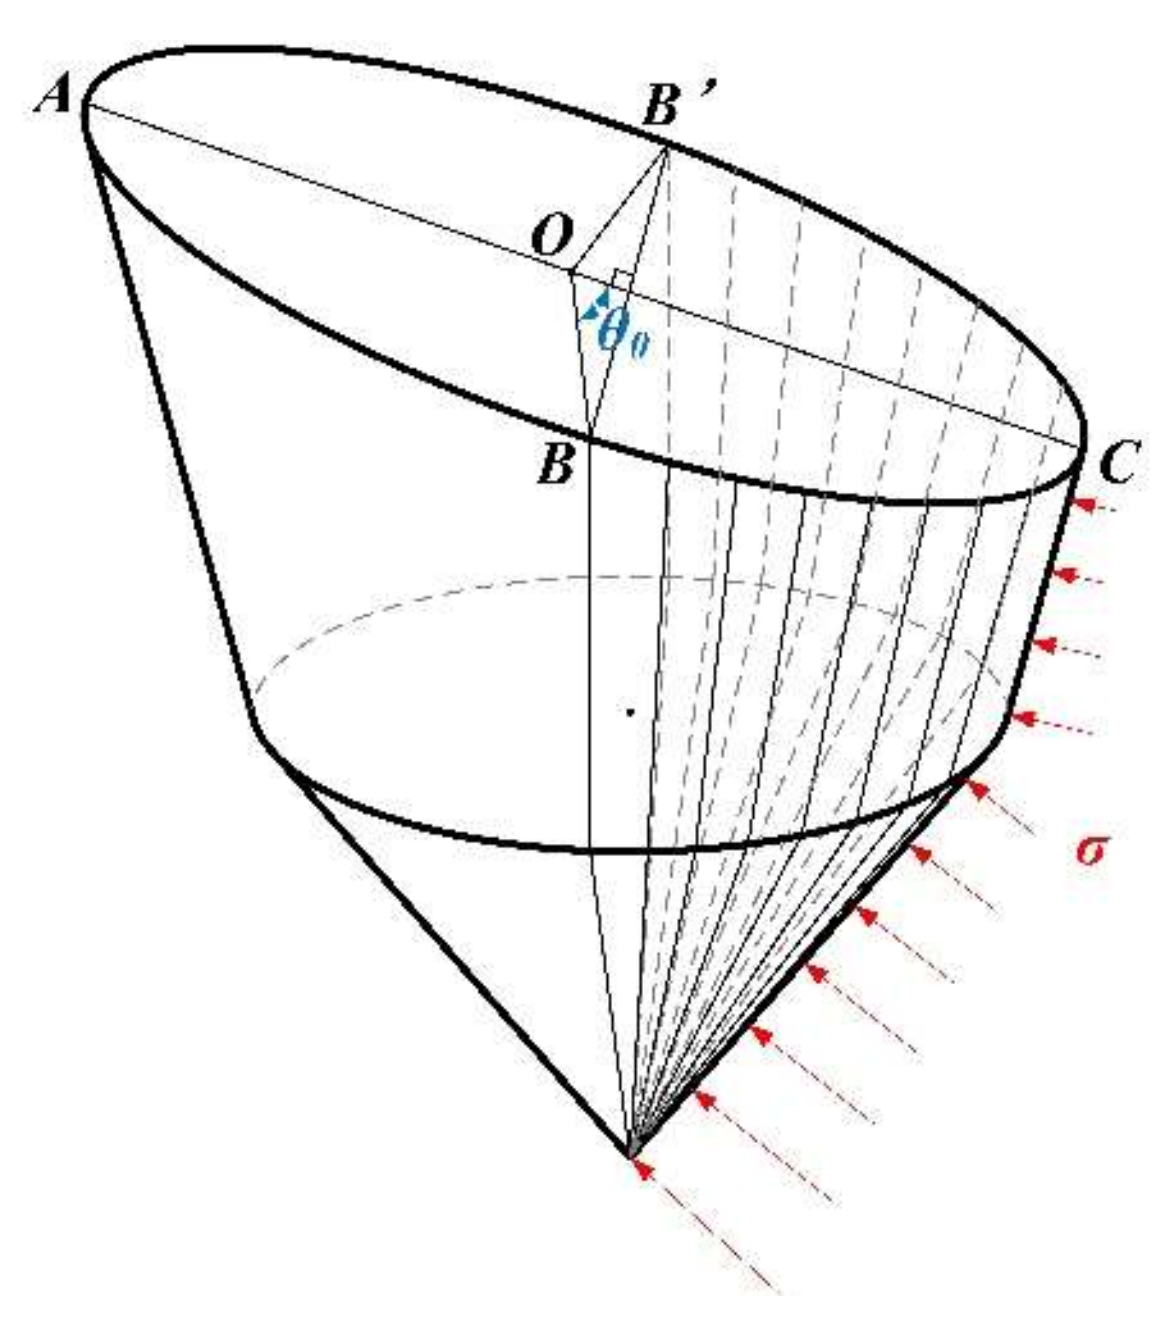
2. Improved Projection Profile Method
3. Validation and Discussion
4. Conclusions
- (1)
- The improved projection profile method can cover the mechanical property of alloy head and conical pick body in rock fracture process, which is more suitable for rock fracturing capacity prediction than the existing method which only considers alloy head and ignores the role of conical pick body.
- (2)
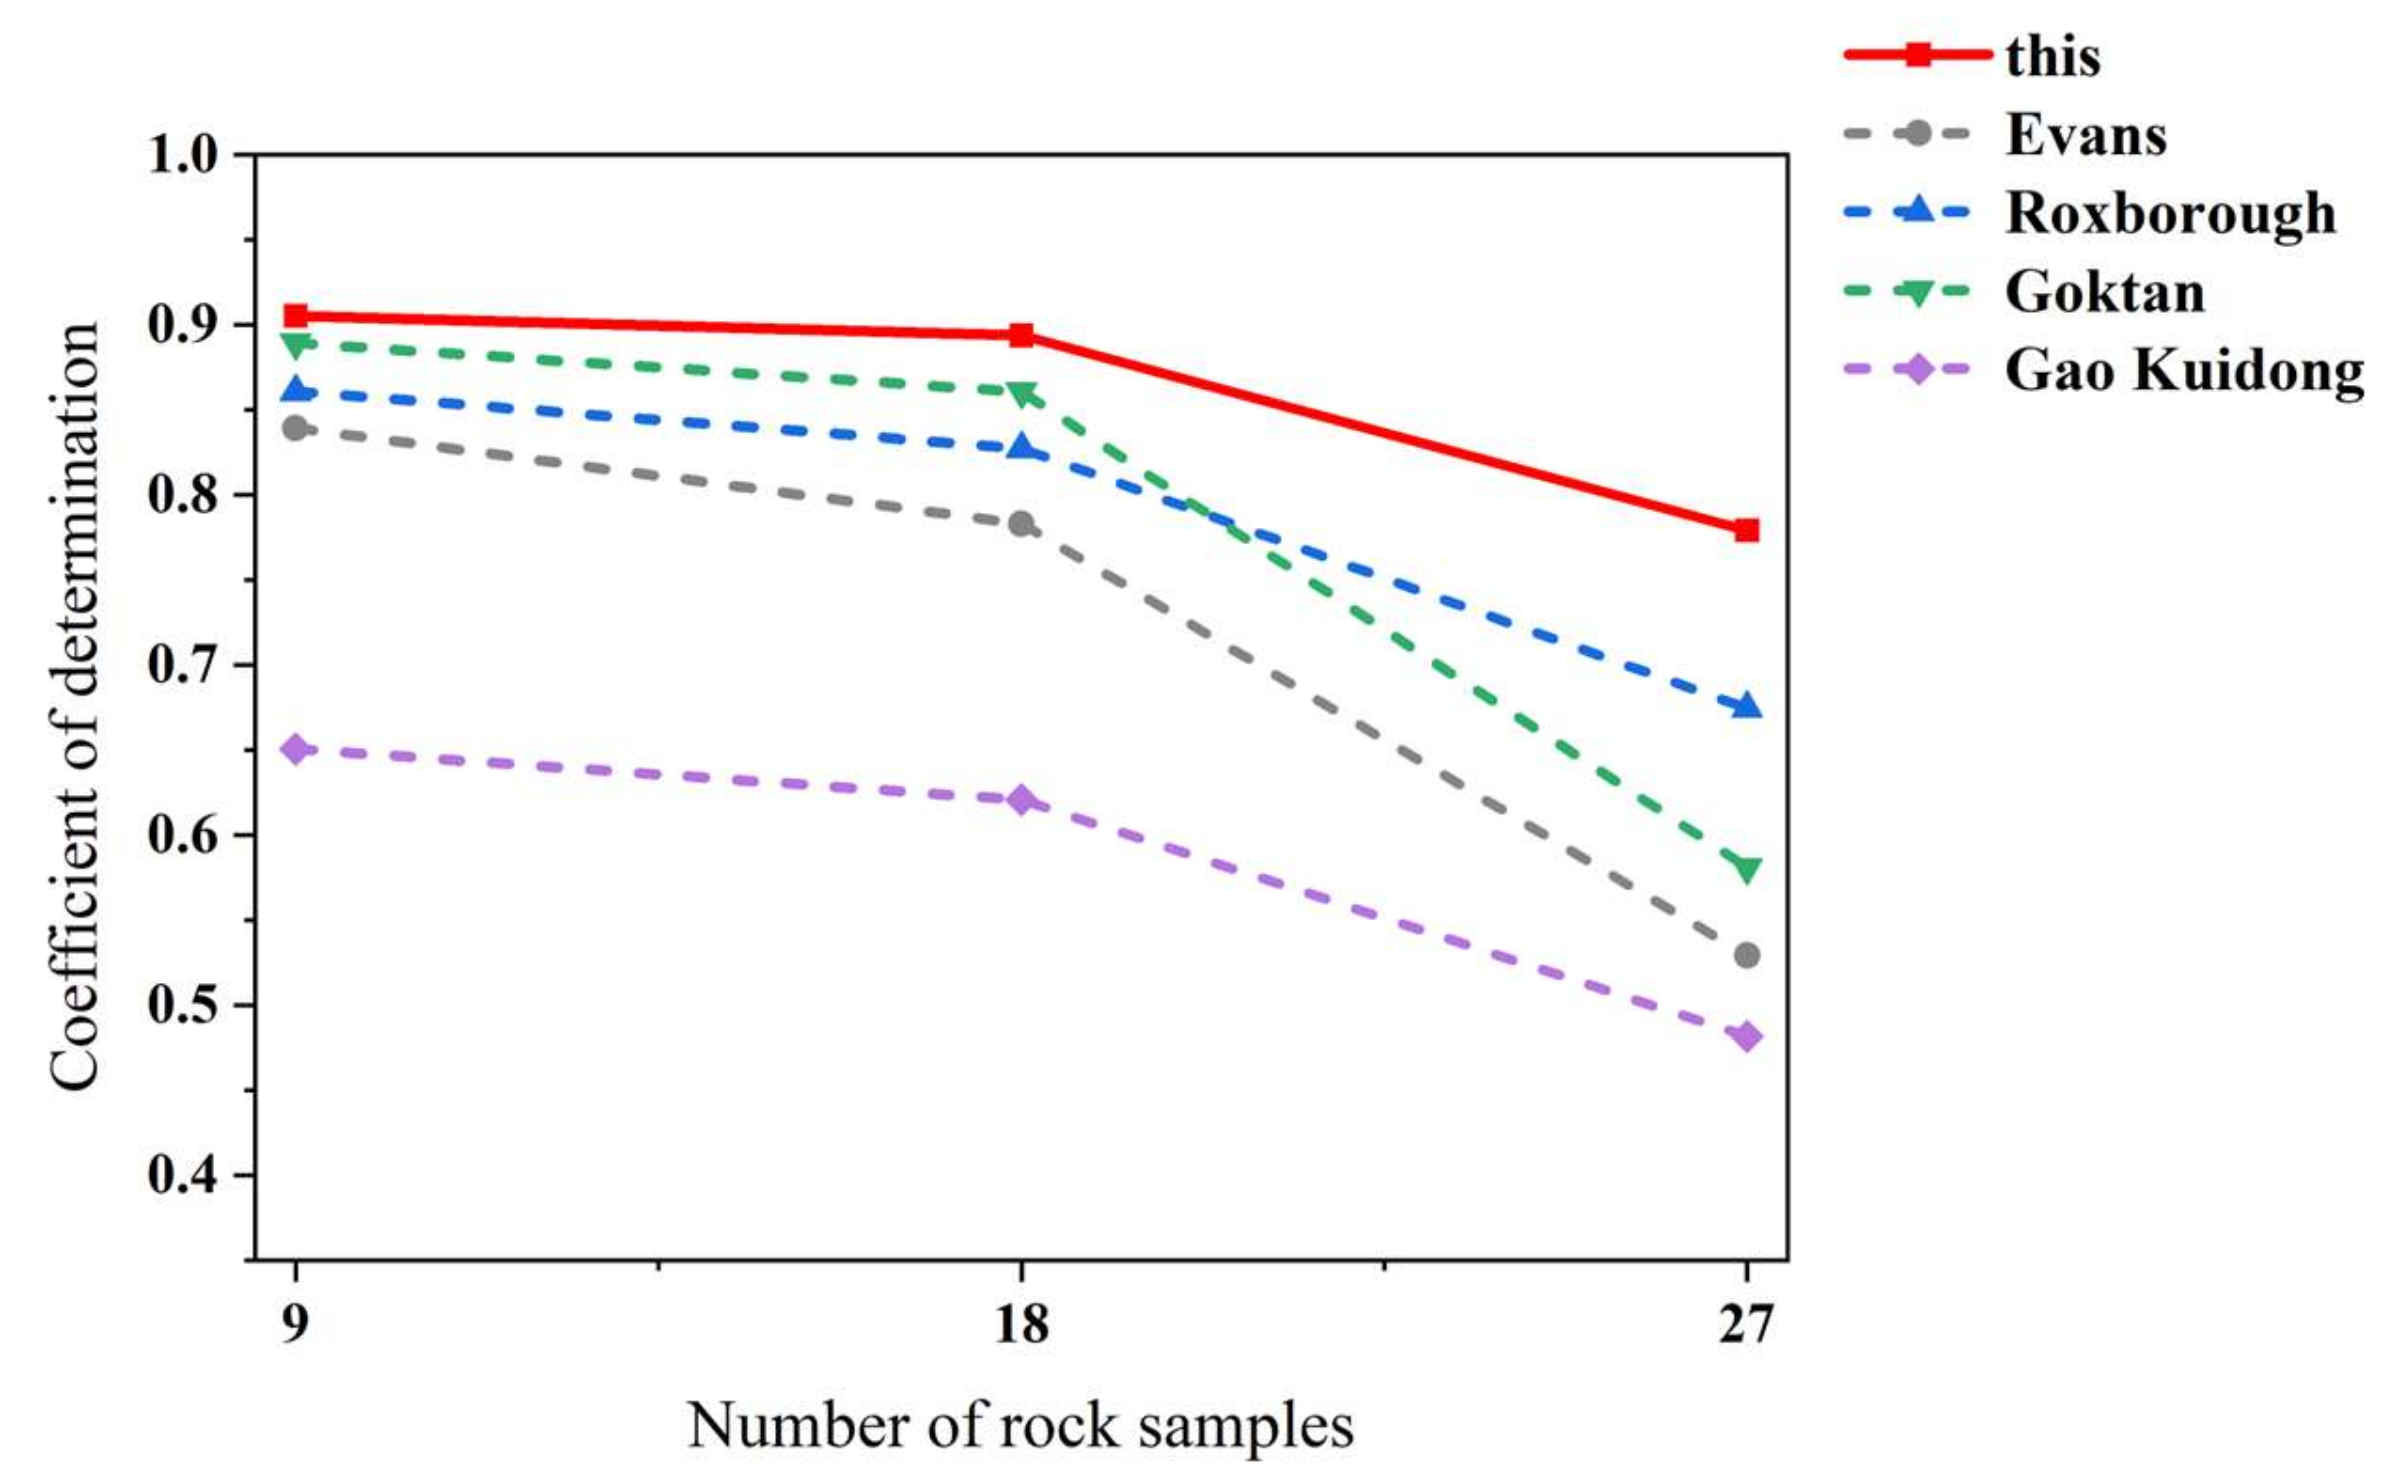
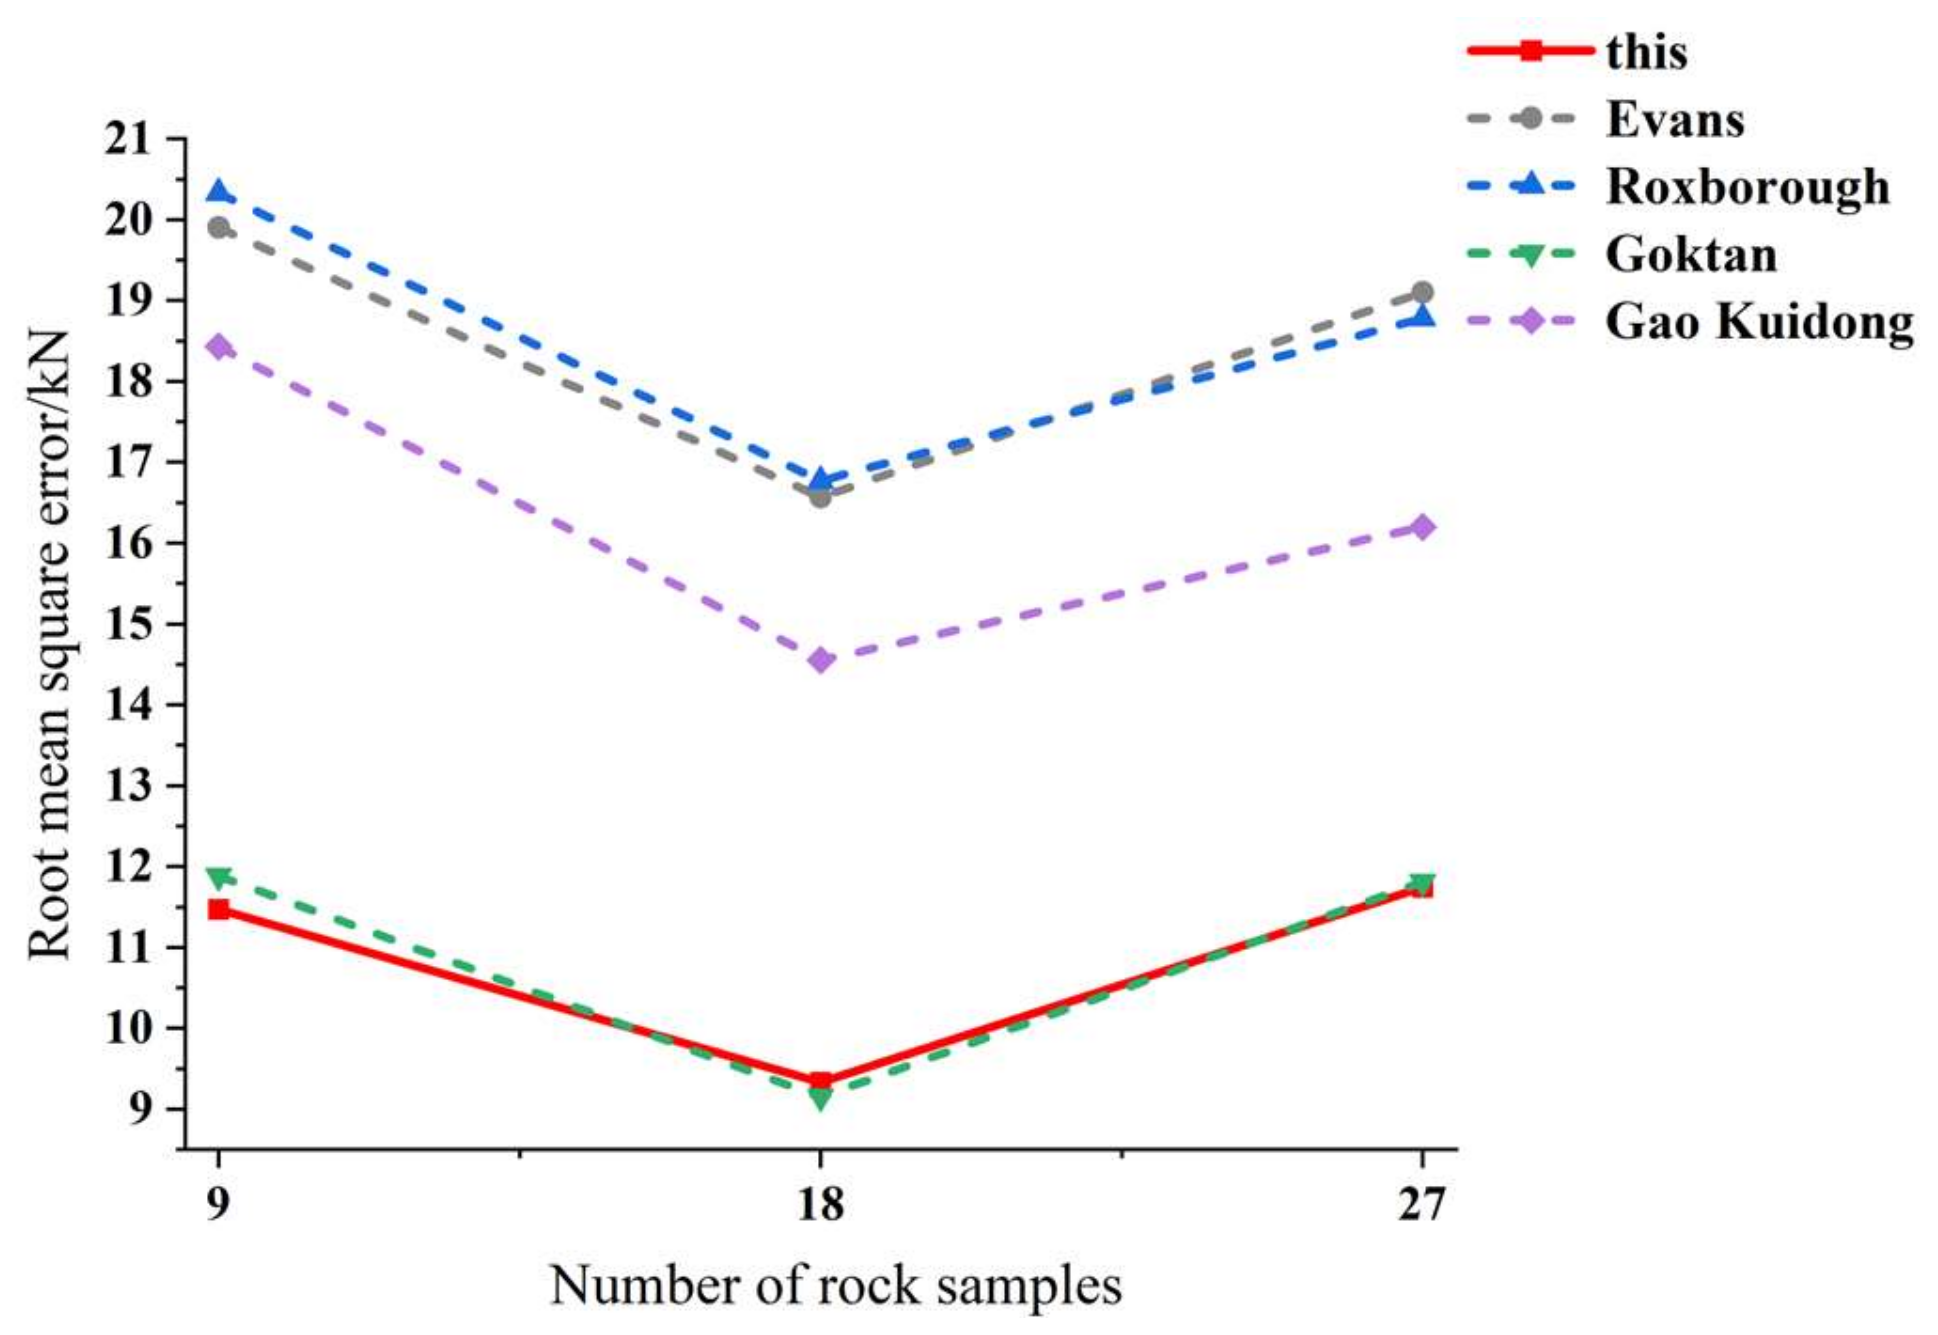
- In the linear regression analysis and root-mean-square error analysis of 27 rock samples, compared with the Evans model, the correlation coefficient is increased by 47.24% and the root mean square error is reduced by 38.53%, which provides the basis of quantitative accuracy in rock breaking capacity prediction.
- (3)
- Compared with the other four models, the prediction performance of this method is the most stable when the rock type increases and the lithology changes. The decrease of correlation coefficient R2 is less than 13.93% when the rock sample increases, while other models decrease by more than 21.62%. The reliability and stability of PCF prediction provide a technical basis for the subsequent optimal design of conical pick parameters which consider lithological tolerance.
Author Contributions
Funding
Institutional Review Board Statement
Informed Consent Statement
Data Availability Statement
Acknowledgments
Conflicts of Interest
Nomenclature
| PCF | The Peck Cutting Force |
| UCS | The Uniaxial Compressive Strength |
| BTS | The Brazilian Tensile Strength |
| RMSE | The Root Mean Square Error |
| α | the half tip angle |
| α1 | the taper angle of pick body |
| r | the radius of alloy head |
| β | the front angle |
| γ | the installation angle |
| d | the cutting depth |
| a | the long semi-axis |
| b | the short semi-axis |
| θ0 | the semi-envelope angle |
| θ | the position angle |
| λ | the radius of the simplified circle |
| k1 | the correction coefficients |
| k2 | the correction coefficients |
| k3 | the correction coefficients |
| ρS | the surface energy density |
| U0 | the energy given by the truncation process |
| GS | the energy for new surface |
| δ | the initial crack size |
| μ | the rock Poisson’s ratio |
| E | the rock modulus of elasticity |
| KIc | the rock type I fracture toughness |
| ϕ | the horizontal rupture angle |
| K | the constant related to pick shape and cutting angle |
| ψ′ | the vertical rupture angle |
References
- Evans, I. A theory of the basic mechanics of coal ploughing. In Proceedings of the International Symposium on Mining Research, 2nd ed.; Clark, G.B., Ed.; Pergamon Press: Oxford, UK, 1961; pp. 761–798. [Google Scholar]
- Evans, I. Theory of the cutting force for point-attack picks. Int. J. Min. 1984, 2, 63–71. [Google Scholar] [CrossRef]
- Roxborough, F.F.; Liu, Z.C. Theoretical considerations on pick shape in rock and coal cutting. In Proceedings of the Sixth Underground Operator’s Conference, Kalgoorlie, Australia, 13–14 November 1995. [Google Scholar]
- Goktan, R.M. A suggested improvement on Evans’ cutting theory for conical bits. In Proceedings of the Fourth International Symposium on Mine Mechanization and Automation, Brisbane, Australia, 6–9 July 1997. [Google Scholar]
- Goktan, R.M.; Gunes, N. A semi-empirical approach to cutting force prediction for point-attack picks. J. S. Afr. Inst. Min. Metall. 2005, 105, 257–263. [Google Scholar]
- Nishimatsu, Y. The mechanics of the rock cutting. Int. J. Rock Mech. Min. Sci. 1972, 9, 261–271. [Google Scholar] [CrossRef]
- Bilgin, N.; Demircin, M.A. Dominant rock properties affecting the performance of conical picks and the comparison of some experimental and theoretical results. Int. J. Rock Mech. Min. Sci. 2006, 43, 139–156. [Google Scholar] [CrossRef]
- Tiryaki, B.; Boland, J.N. Empirical models to predict mean cutting forces on point-attack pick cutters. Int. J. Rock Mech. Min. Sci. 2010, 47, 858–864. [Google Scholar] [CrossRef]
- Bao, R.H.; Zhang, L.C. Estimating the peak indentation force of the edge chipping of rocks using single point-attack pick. Rock Mech. Rock Eng. 2011, 44, 339–347. [Google Scholar] [CrossRef]
- Kuidong, G.; Du Changlong, J.H. A theoretical model for predicting the Peak Cutting Force of conical picks. Fract. Struct. Integr. 2014, 8, 43–52. [Google Scholar] [CrossRef]
- Li, X.F.; Wang, S. Numerical simulation of rock breakage modes under confining pressures in deep mining: An experimental investigation. IEEE Access 2016, 4, 5710–5720. [Google Scholar] [CrossRef]
- Li, X.F.; Wang, S. Numerical simulation of rock fragmentation during cutting by conical picks under confining pressure. Comptes Rendus. Mécanique 2017, 345, 890–902. [Google Scholar] [CrossRef]
- Li, X.F.; Wang, S. A theoretical model for estimating the peak cutting force of conical picks. Exp. Mech. 2018, 58, 709–720. [Google Scholar] [CrossRef]
- Li, X.F.; Wang, S. A study on drum cutting properties with full-scale experiments and numerical simulations. Measurement 2018, 114, 25–36. [Google Scholar] [CrossRef] [Green Version]
- Li, X.F.; Wang, S. Investigation on the influence mechanism of rock brittleness on rock fragmentation and cutting performance by discrete element method. Measurement 2018, 113, 120–130. [Google Scholar]
- Li, H.S.; Liu, S.Y. Numerical simulation on interaction stress analysis of rock with conical picks. Tunn. Undergr. Space Technol. 2019, 85, 231–242. [Google Scholar] [CrossRef]
- Wang, S.; Huang, L. Analysis of rockburst triggered by hard rock fragmentation using a conical pick under high uniaxial stress. Tunn. Undergr. Space Technol. 2020, 96, 103195. [Google Scholar] [CrossRef]
- Wang, S.; Yu, T.A.N.G. Analyses and predictions of rock cuttabilities under different confining stresses and rock properties based on rock indentation tests by conical pick. Trans. Nonferrous Met. Soc. China 2021, 31, 1766–1783. [Google Scholar] [CrossRef]
- Wang, S.; Sun, L. Experimental investigation of cuttability improvement for hard rock fragmentation using conical cutter. Int. J. Geomech. 2021, 21, 06020039. [Google Scholar] [CrossRef]
- Wang, S. Experimental investigation and theoretical analysis of indentations on cuboid hard rock using a conical pick under uniaxial lateral stress. Geomech. Geophys. Geo-Energy Geo-Resour. 2022, 8, 34. [Google Scholar] [CrossRef]
- Gao, K.D.; Du, C.L.; Liu, X. Study on the variation law of pick teeth installation angle and half taper angle with cut-off depth. Coal Sci. Technol. 2011, 39, 93–96. [Google Scholar]
- Wang, L.P.; Jiang, B.S.; Zhang, Q. Calculation of peak cut-off force for asymmetric cut-off slot of pick-type cut-off teeth. J. Coal 2016, 41, 2876–2882. [Google Scholar]
- Roxborough, F.F.; King, P.; Pedroncelli, E.J. Tests on the cutting performance of a continuous miner. J. S. Afr. Inst. Min. Metall. 1981, 81, 9–25. [Google Scholar]
- Roxborough, F.F.; Pedroncelli, E.J. Practical evaluation of some coal-cutting theories using a continuous miner. Min. Eng. 1982, 142. [Google Scholar]
- Yang, X.; Sun, L.; Song, J. Study on the Effect of Bond Strength on the Failure Mode of Coarse-Grained Sandstone in Weakly Cemented Stratum. Minerals 2022, 12, 55. [Google Scholar] [CrossRef]
- Liu, D.; Zhang, Y.; Zhou, A. The Kaolinite Crystallinity and Influence Factors of Coal-Measure Kaolinite Rock from Datong Coalfield, China. Minerals 2022, 12, 54. [Google Scholar] [CrossRef]
- Hu, X.; Zhang, M.; Xu, W. A Dynamic Coupled Elastoplastic Damage Model for Rock-like Materials Considering Tension-Compression Damage and Pressure-Dependent Behavior. Minerals 2022, 12, 851. [Google Scholar] [CrossRef]
- Ren, C.; Xu, J.; Xu, J. Coal–Rock Cutting Sound Denoising Based on Complete Ensemble Empirical Mode Decomposition with Adaptive Noise and an improved Fruit Fly Optimization Algorithm. Machines 2022, 10, 412. [Google Scholar] [CrossRef]


| Group | Rock No. | Rock Type | UCS/MPa | BTS/MPa | E/GPa | ρ/kg/m3 | KIc/MPa·m1/2 |
|---|---|---|---|---|---|---|---|
| S | 1 | Tuff 6 | 6 | 0.2 | 0.4 | 1490 | 0.09 |
| 2 | Coal | 3.1 | 0.45 | 4.5 | 1480 | 0.09 | |
| 3 | Tuff 1 | 10 | 0.9 | 1.1 | 1490 | 0.21 | |
| 4 | Tuff 2 | 11 | 1.2 | 1.4 | 1700 | 0.25 | |
| 5 | Tuff 4 | 14 | 1.5 | 1.6 | 1710 | 0.3 | |
| 6 | Tuff 5 | 19 | 2.3 | 1.3 | 1710 | 0.41 | |
| 7 | Trona | 30 | 2.2 | 3.4 | 2130 | 0.49 | |
| 8 | Tuff 3 | 27 | 2.6 | 2.4 | 1800 | 0.51 | |
| 9 | Jips | 33 | 3 | / | 2320 | 0.59 | |
| M | 10 | Copper -1 | 33 | 3.4 | / | 4130 | 0.62 |
| 11 | Selestite | 29 | 4 | / | 3970 | 0.63 | |
| 12 | Chromite -1 | 32 | 3.7 | 3.5 | 4030 | 0.64 | |
| 13 | Chromite -3 | 46 | 3.7 | 2.9 | 288 | 0.74 | |
| 14 | Simulated coal sample | 42.5 | 4.9 | 39.8 | 1800 | 0.81 | |
| 15 | Chromite -2 | 47 | 4.5 | 2.3 | 3390 | 0.82 | |
| 16 | Serpantinite | 38 | 5.7 | 2.3 | 5490 | 0.82 | |
| 17 | Copper -2 | 41 | 5.7 | / | 4070 | 0.85 | |
| 18 | Siltstone | 58 | 5.3 | / | 2650 | 0.96 | |
| H | 19 | Harsburgite | 58 | 5.5 | 2.1 | 2650 | 0.97 |
| 20 | Anhydrite | 82 | 5.5 | 11 | 2900 | 1.13 | |
| 21 | Red Sandstone | 76.3 | 6.6 | 22.4 | 2140 | 1.19 | |
| 22 | Sandstone -3 | 87.4 | 8.3 | 33.3 | 2670 | 1.38 | |
| 23 | Sandstone -1 | 113.6 | 6.6 | 17 | 2650 | 1.41 | |
| 24 | Limestone -1 | 121 | 7.8 | 57 | 2720 | 1.55 | |
| 25 | Limestone -2 | 116.4 | 8.2 | 46.3 | 2650 | 1.56 | |
| 26 | Granite | 161.2 | 8.1 | 1.4 | 2800 | 1.69 | |
| 27 | Sandstone -2 | 173.7 | 11.6 | 28 | 2670 | 2.15 |
| Test No. | Rock No. | Pick Type | Installation Angle/° | Cutting Depth/mm | Tip Angle/° | Alloy Head Diameter/mm |
|---|---|---|---|---|---|---|
| 1 | 4(S) | Sandvik 35/80H | 57 | 5/9 | 80 | 22 |
| 2 | 5(S) | Sandvik 35/80H | 57 | 5/9 | 80 | 22 |
| 3 | 6(S) | Sandvik 35/80H | 57 | 5/9 | 80 | 22 |
| 4 | 13(M) | Sandvik 35/80H | 57 | 5/9 | 80 | 22 |
| 5 | 14(M) | Sandvik 35/80H | 57 | 5/9 | 80 | 22 |
| 6 | 15(M) | Sandvik 35/80H | 55 | 10/15/20 | 90 | 22 |
| 7 | 22(H) | Sandvik 35/80H | 57 | 5/9 | 80 | 22 |
| 8 | 23(H) | Sandvik 35/80H | 57 | 5/9 | 80 | 22 |
| 9 | 24(H) | Sandvik 35/80H | 57 | 5/9 | 80 | 22 |
| Test No. | Cut Thickness/mm | PCFEx1 | PCFthis1 | PCFEv1 | PCFRo1 | PCFGo1 | PCFGao1 |
|---|---|---|---|---|---|---|---|
| 1 | 5 | 7.08 | 1.25 | 0.28 | 0.32 | 1.57 | 1.13 |
| 9 | 11.84 | 3.26 | 0.91 | 1.03 | 5.1 | 2.47 | |
| 2 | 5 | 2.83 | 1.5 | 0.34 | 0.4 | 1.97 | 1.46 |
| 9 | 7.3 | 3.91 | 1.12 | 1.28 | 6.37 | 3.19 | |
| 3 | 5 | 3.44 | 2.05 | 0.6 | 0.64 | 3.02 | 2.72 |
| 9 | 7.35 | 5.35 | 1.93 | 2.06 | 9.77 | 5.95 | |
| 4 | 5 | 8.71 | 3.7 | 0.64 | 0.86 | 4.85 | 4.19 |
| 9 | 16.24 | 9.65 | 2.06 | 2.78 | 15.72 | 9.18 | |
| 5 | 10 | 30.63 | 16.24 | 5.68 | 4.67 | 27.71 | 6.48 |
| 15 | 48.06 | 27.42 | 12.78 | 10.5 | 62.34 | 11.12 | |
| 20 | 70.12 | 40.99 | 22.72 | 18.66 | 110.84 | 16.32 | |
| 6 | 5 | 7.85 | 4.1 | 0.92 | 1.13 | 5.9 | 5.69 |
| 9 | 26.49 | 10.7 | 2.99 | 3.67 | 19.12 | 12.46 | |
| 7 | 5 | 9.09 | 6.91 | 1.7 | 2.09 | 10.88 | 5.28 |
| 9 | 15.9 | 18 | 5.49 | 6.76 | 35.26 | 11.57 | |
| 8 | 5 | 19.69 | 7.06 | 0.82 | 1.27 | 8.65 | 5.47 |
| 9 | 28.1 | 18.39 | 2.65 | 4.11 | 28.04 | 11.97 | |
| 9 | 5 | 21.51 | 7.76 | 1.08 | 1.6 | 10.23 | 4.42 |
| 9 | 29.4 | 20.22 | 3.49 | 5.18 | 33.14 | 9.69 |
| Test No. | Rock No. | Pick Type | Installation Angle/° | Cutting Depth/mm | Tip Angle/° | Alloy Head Diameter/mm |
|---|---|---|---|---|---|---|
| 10 | 1(S) | Sandvik 35/80H | 57 | 5/9 | 80 | 22 |
| 11 | 2(S) | Sandvik 35/80H | 55 | 10/20 | 90 | 22 |
| 12 | 3(S) | Sandvik 35/80H | 57 | 5/9 | 80 | 22 |
| 13 | 10(M) | Sandvik 35/80H | 57 | 5/9 | 80 | 22 |
| 14 | 11(M) | Sandvik 35/80H | 57 | 5/9 | 80 | 22 |
| 15 | 12(M) | Sandvik 35/80H | 57 | 5/9 | 80 | 22 |
| 16 | 19(H) | Sandvik 35/80H | 57 | 5/9 | 80 | 22 |
| 17 | 20(H) | Sandvik 35/80H | 57 | 5/9 | 80 | 22 |
| 18 | 21(H) | Sandvik 35/80H | 55 | 5/10 | 90 | 22 |
| Test No. | Cut Thickness/mm | PCFEx1 | PCFthis1 | PCFEv1 | PCFRo1 | PCFGo1 | PCFGao1 |
|---|---|---|---|---|---|---|---|
| 10 | 5 | 1.33 | 0.45 | 0.01 | 0.03 | 0.26 | 0.24 |
| 9 | 2.18 | 1.17 | 0.05 | 0.08 | 0.85 | 0.52 | |
| 11 | 10 | 2.25 | 1.8 | 0.66 | 0.47 | 2.54 | 1.32 |
| 20 | 7.77 | 4.55 | 2.63 | 1.86 | 10.18 | 3.32 | |
| 12 | 5 | 2.05 | 1.05 | 0.17 | 0.22 | 1.18 | 0.86 |
| 9 | 4.02 | 2.74 | 0.56 | 0.71 | 3.82 | 1.88 | |
| 13 | 5 | 4.4 | 3.1 | 0.75 | 0.88 | 4.46 | / |
| 9 | 15.07 | 8.09 | 2.43 | 2.86 | 14.45 | / | |
| 14 | 5 | 4.74 | 3.15 | 1.18 | 1.15 | 5.25 | / |
| 9 | 9.07 | 8.22 | 3.83 | 3.74 | 17 | / | |
| 15 | 10 | 7.16 | 3.2 | 0.92 | 1.01 | 4.85 | 3.7 |
| 15 | 14.83 | 8.35 | 2.97 | 3.26 | 15.72 | 8.11 | |
| 20 | 14.97 | 4.86 | 1.12 | 1.38 | 7.21 | 7.68 | |
| 16 | 5 | 26.91 | 12.65 | 3.62 | 4.47 | 23.37 | 16.81 |
| 9 | 12.52 | 5.66 | 0.79 | 1.15 | 7.21 | 4.75 | |
| 17 | 5 | 16.3 | 14.74 | 2.56 | 3.74 | 23.37 | 10.41 |
| 9 | 21.98 | 9.17 | 1.43 | 1.37 | 9.33 | 7.35 | |
| 18 | 5 | 32.46 | 23.85 | 5.74 | 5.5 | 37.32 | 18.53 |
| 10 | 1.33 | 0.45 | 0.01 | 0.03 | 0.26 | 0.24 |
| Test No. | Rock No. | Pick Type | Installation Angle/° | Cutting Depth/mm | Tip Angle/° | Alloy Head Diameter/mm |
|---|---|---|---|---|---|---|
| 19 | 7(S) | Sandvik 35/80H | 57 | 5/9 | 80 | 22 |
| 20 | 8(S) | Sandvik 35/80H | 57 | 5/9 | 80 | 22 |
| 21 | 9(S) | Sandvik 35/80H | 57 | 5/9 | 80 | 22 |
| 22 | 16(M) | Sandvik 35/80H | 57 | 5/9 | 80 | 22 |
| 23 | 17(M) | Sandvik 35/80H | 57 | 5/9 | 80 | 22 |
| 24 | 18(M) | Sandvik 35/80H | 57 | 5/9 | 80 | 22 |
| 25 | 25(H) | Sandvik 35/80H | 55 | 2/3/5 | 90 | 22 |
| S150-25 | 50 | 8 | 76 | 25 | ||
| S150-25 | 55 | 8 | 76 | 25 | ||
| S150-25 | 55 | 4 | 76 | 25 | ||
| S150-25 | 45 | 3/5/7 | 76 | 25 | ||
| 26 | 26(H) | Sandvik 35/80H | 57 | 5/9 | 80 | 22 |
| 27 | 27(H) | S150-25 | 55 | 4 | 76 | 25 |
| Test No. | Installation Angle/° | Cut Thickness/mm | PCFEx1 | PCFthis1 | PCFEv1 | PCFRo1 | PCFGo1 | PCFGao1 |
|---|---|---|---|---|---|---|---|---|
| 19 | 57 | 5 | 3.88 | 2.45 | 0.35 | 0.49 | 2.88 | 2.03 |
| 57 | 9 | 12.26 | 6.39 | 1.12 | 1.57 | 9.35 | 4.44 | |
| 20 | 57 | 5 | 3.77 | 2.55 | 0.54 | 0.66 | 3.41 | 2.7 |
| 57 | 9 | 7.22 | 6.65 | 1.74 | 2.13 | 11.05 | 5.9 | |
| 21 | 57 | 5 | 8.72 | 2.95 | 0.58 | 0.74 | 3.93 | / |
| 57 | 9 | 6.53 | 7.7 | 1.89 | 2.39 | 12.75 | / | |
| 22 | 57 | 5 | 7.85 | 4.1 | 1.83 | 1.68 | 7.47 | 7.35 |
| 57 | 9 | 20.15 | 10.7 | 5.93 | 5.45 | 24.22 | 16.09 | |
| 23 | 57 | 5 | 7.33 | 4.25 | 1.7 | 1.65 | 7.47 | / |
| 57 | 9 | 25.82 | 11.09 | 5.5 | 5.34 | 24.22 | / | |
| 24 | 57 | 2 | 23.04 | 4.81 | 1.04 | 1.31 | 6.95 | 3.03 |
| 57 | 3 | 32 | 12.52 | 3.36 | 4.24 | 22.52 | 6.64 | |
| 57 | 5 | 12.52 | 2.65 | 0.23 | 0.24 | 1.85 | 2.35 | |
| 25 | 55 | 2 | 28.72 | 5.23 | 0.52 | 0.55 | 4.17 | 4.03 |
| 55 | 3 | 33.48 | 12.02 | 1.45 | 1.52 | 11.59 | 7.96 | |
| 55 | 5 | 31.9 | 21.42 | 2.99 | 5.91 | 11.53 | 12.24 | |
| 50 | 8 | 53.56 | 16.47 | 2.99 | 5.91 | 11.53 | 12.04 | |
| 55 | 8 | 9.91 | 5.2 | 0.75 | 1.48 | 2.88 | 4.78 | |
| 55 | 4 | 19 | 2.88 | 0.42 | 0.83 | 1.62 | 3.37 | |
| 45 | 3 | 28.78 | 9.14 | 1.17 | 2.31 | 4.5 | 6.66 | |
| 45 | 5 | 29.47 | 17.33 | 2.29 | 4.52 | 8.83 | 10.42 | |
| 45 | 7 | 14.83 | 5.63 | 0.53 | 1.21 | 2.85 | 18.74 | |
| 26 | 57 | 5 | 23.25 | 10.76 | 1.66 | 2.43 | 15.21 | 9.43 |
| 57 | 9 | 48.7 | 28.04 | 5.37 | 7.86 | 49.29 | 20.65 | |
| 27 | 55 | 4 | 3.88 | 2.45 | 0.35 | 0.49 | 2.88 | 2.03 |
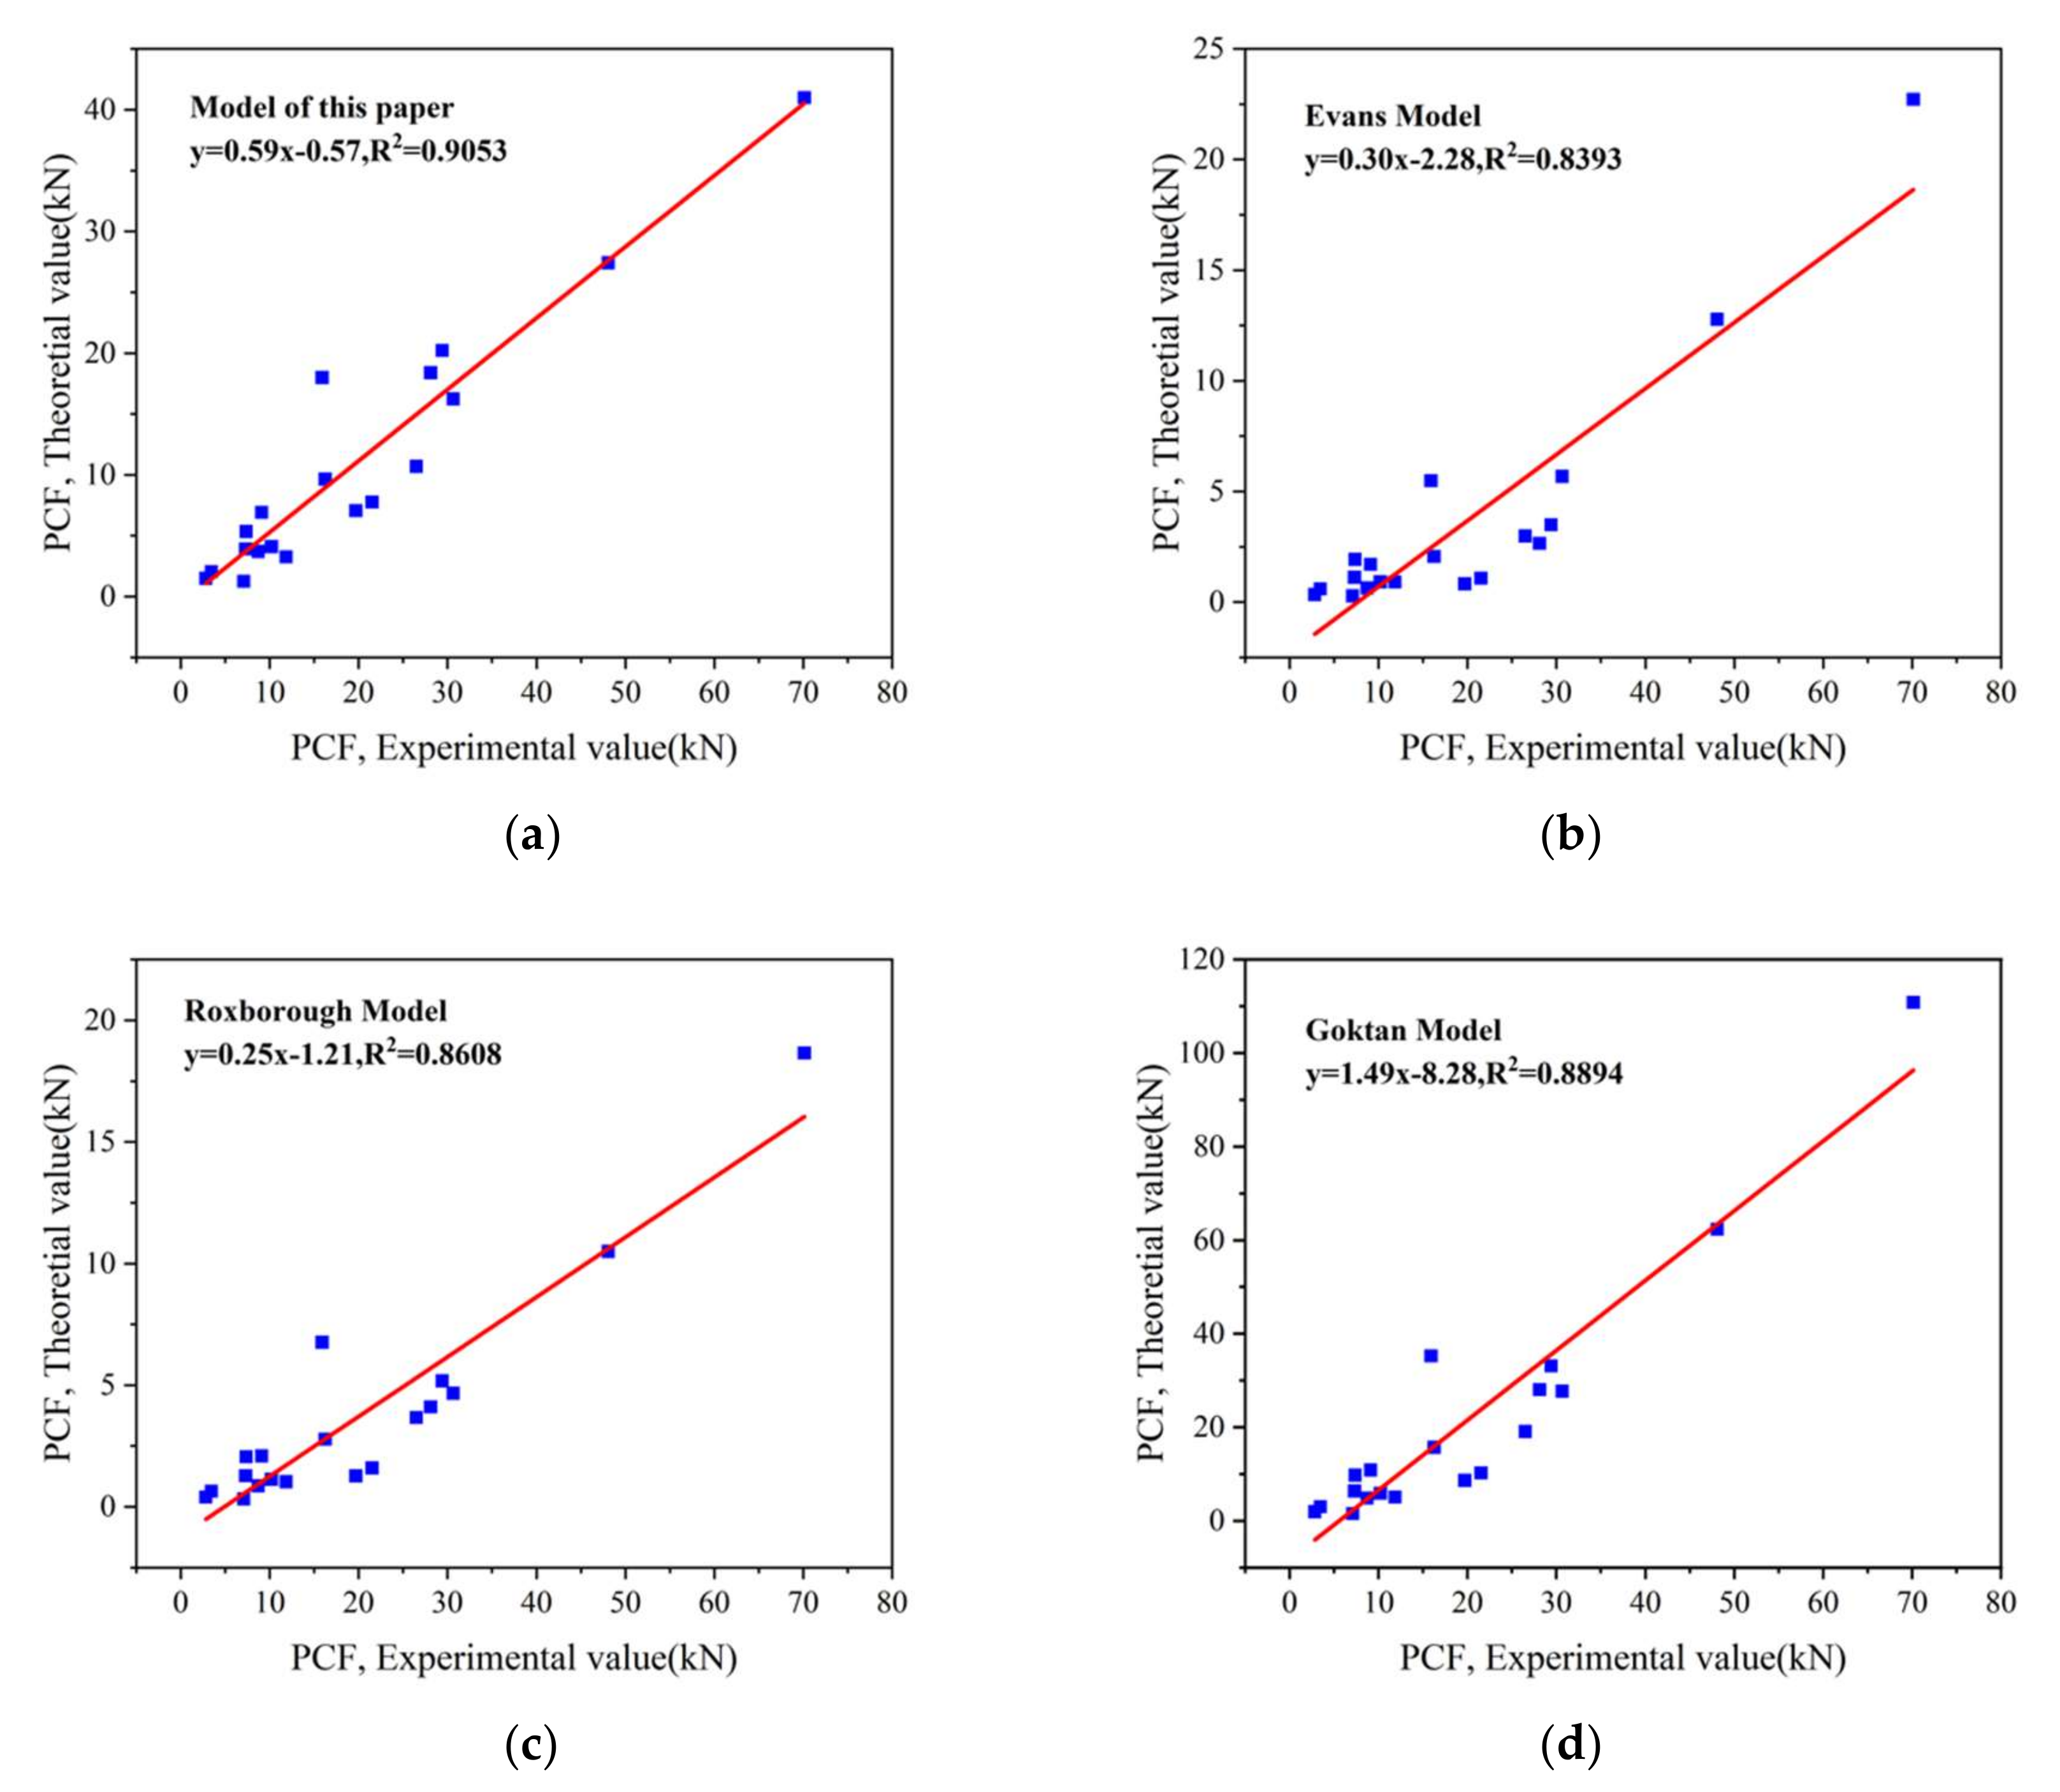
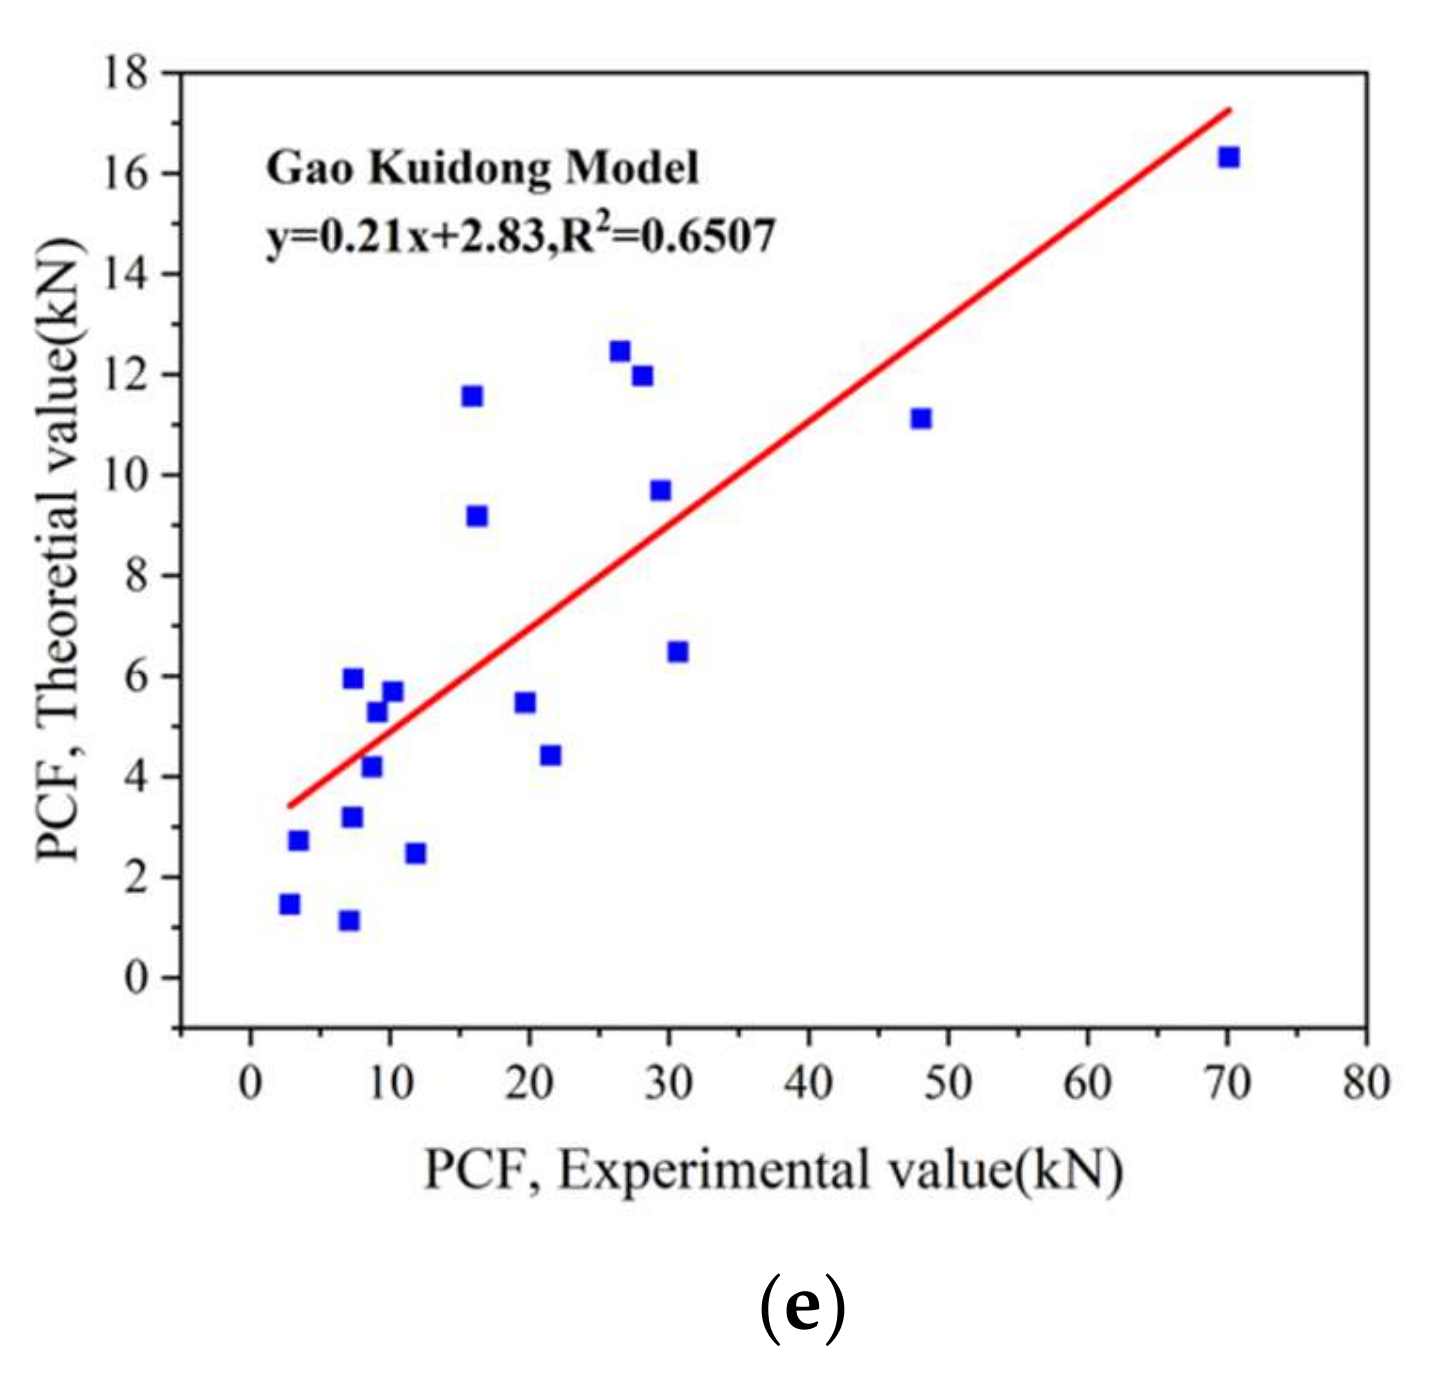
| Analysis No. | No. of Rock Samples | No. of Data | R2this 1 | R2Ev 1 | R2Ro 1 | R2Go 1 | R2Gao 1 |
|---|---|---|---|---|---|---|---|
| 1st | 9 | 19 | 0.9053 | 0.8393 | 0.8608 | 0.8894 | 0.6507 |
| 2nd | 18 | 37 | 0.8937 | 0.7830 | 0.8273 | 0.8606 | 0.6208 |
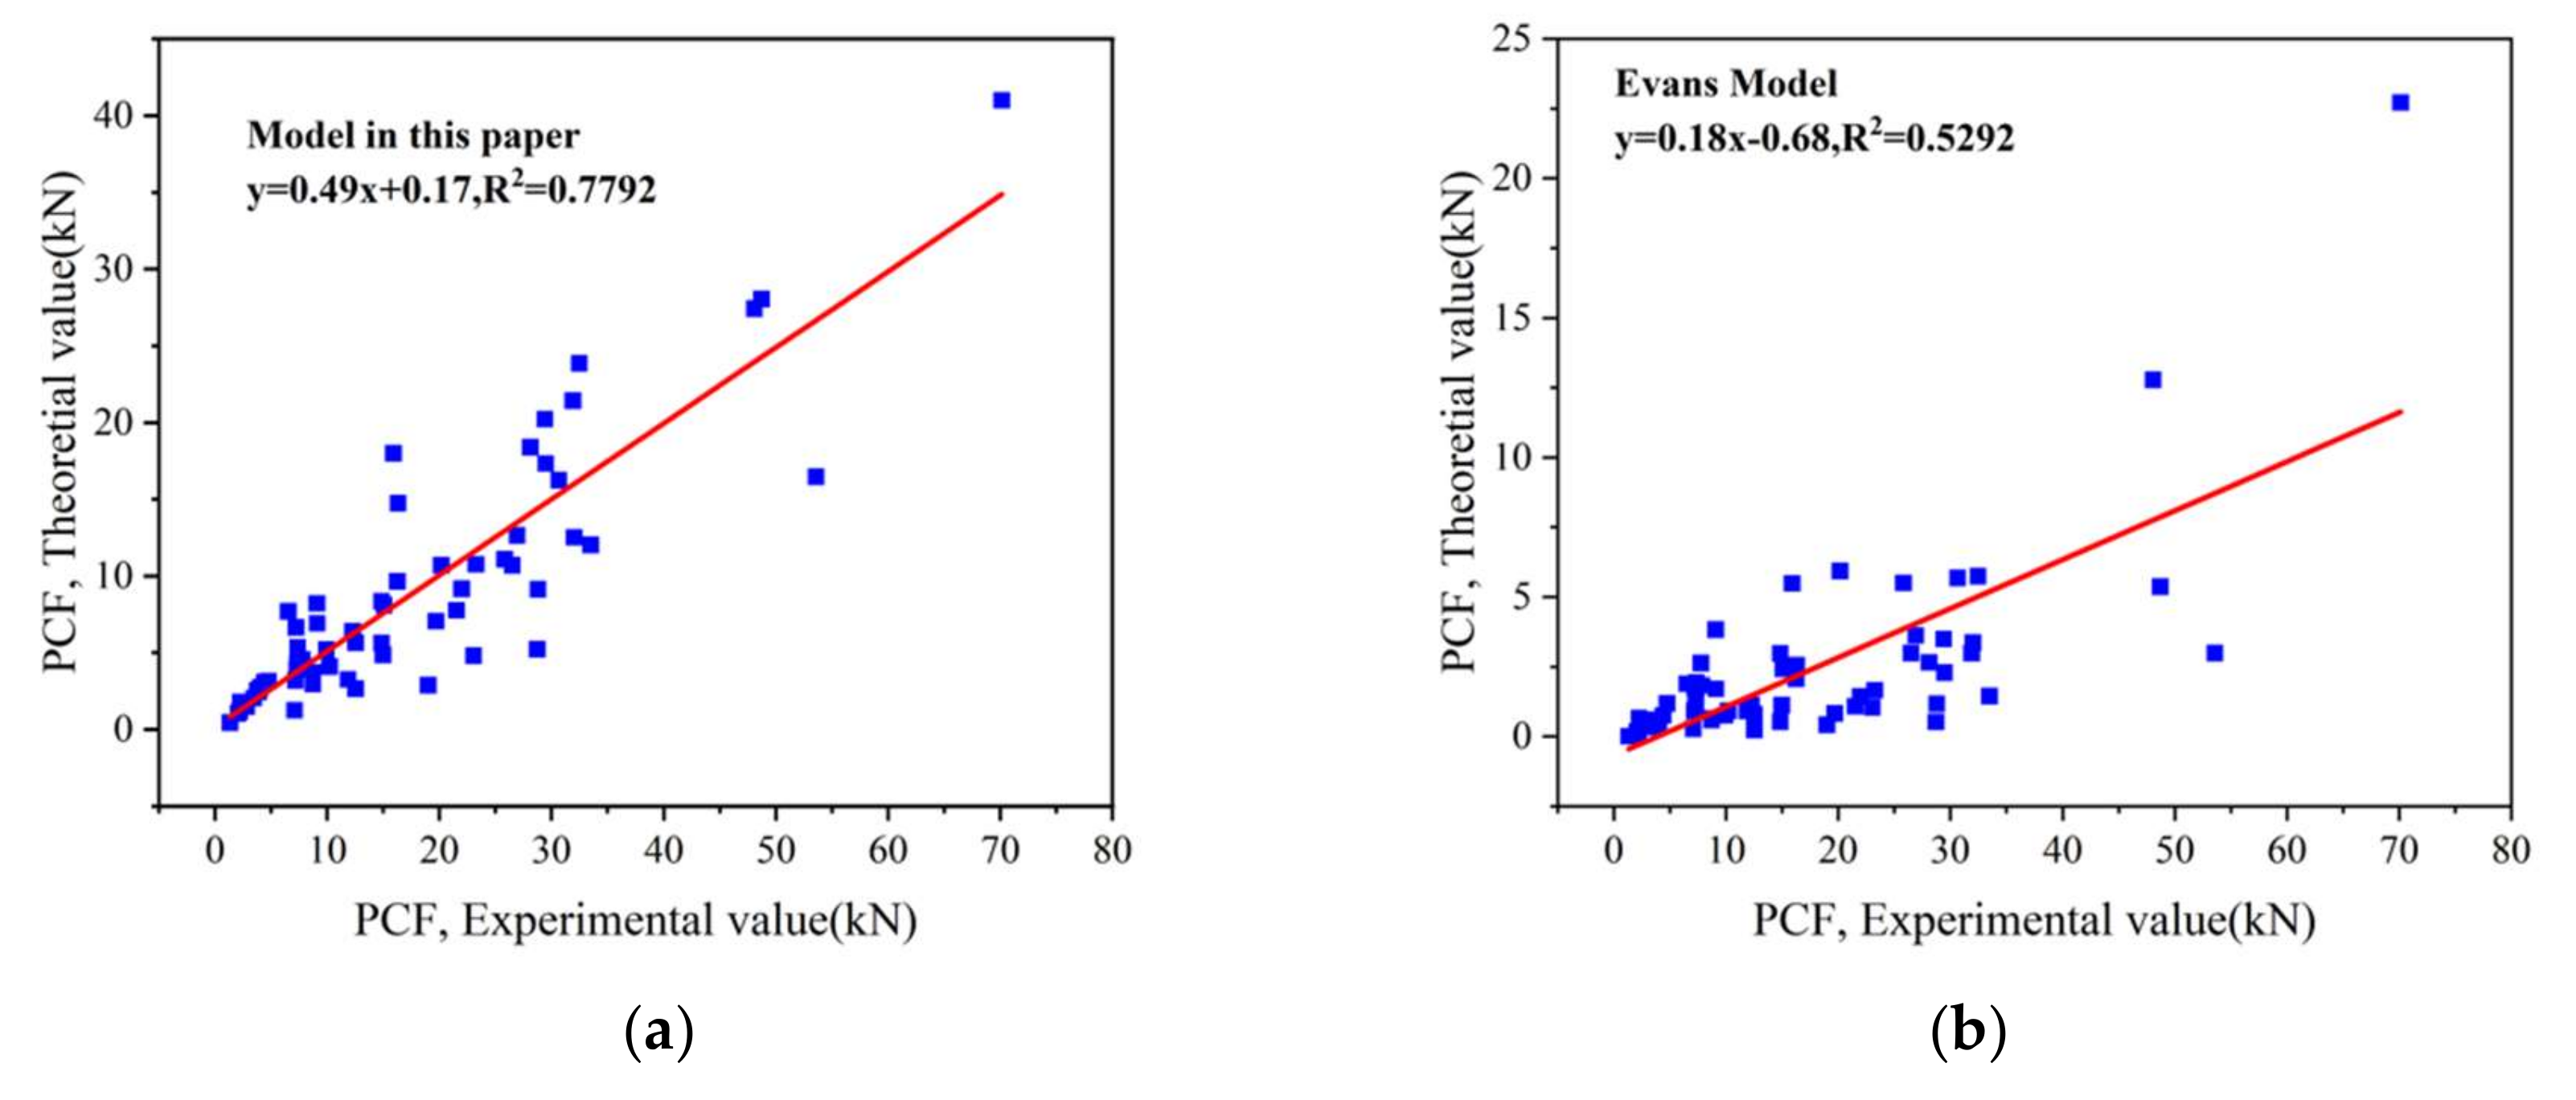
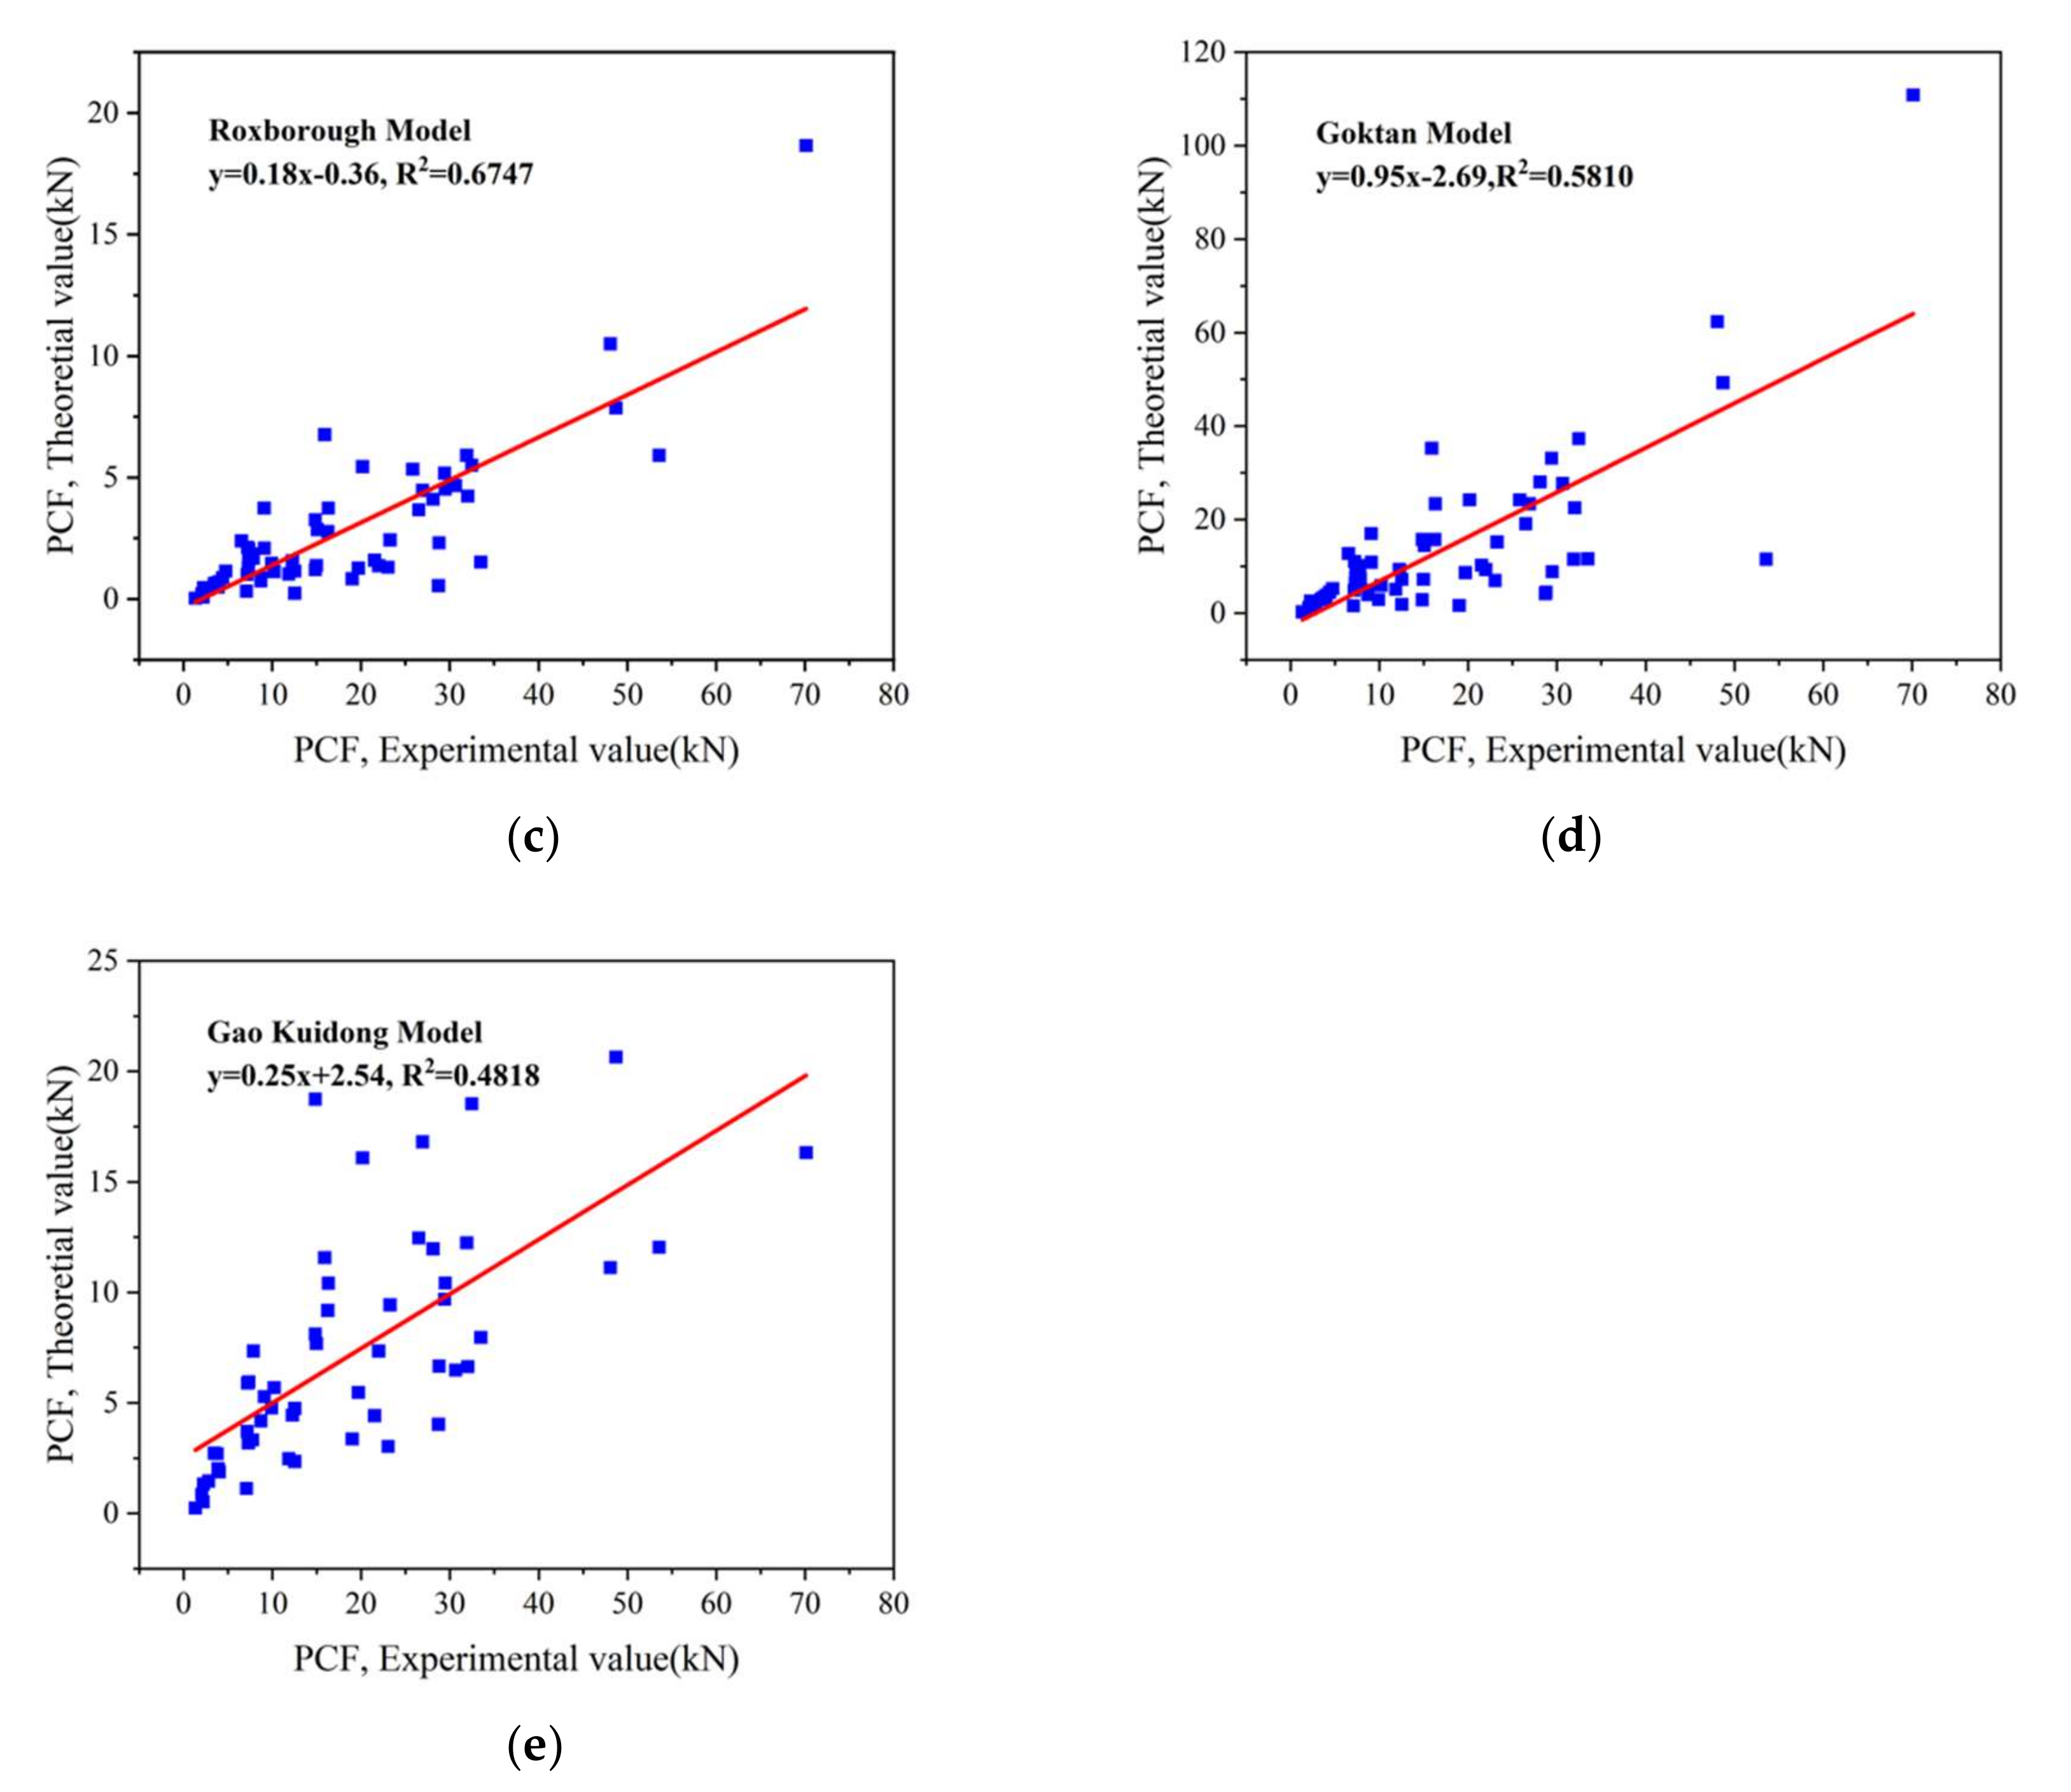
| 3rd | 27 | 61 | 0.7792 | 0.5292 | 0.6747 | 0.5810 | 0.4818 |
| Analysis No. | No. of Rock Samples | No. of Data | RMSE2this 1 | RMSE2Ev 1 | RMSE2Ro 1 | RMSE2Go 1 | RMSE2Gao 1 |
|---|---|---|---|---|---|---|---|
| 1st | 9 | 19 | 11.47 | 19.90 | 20.33 | 11.88 | 18.43 |
| 2nd | 18 | 37 | 9.33 | 16.57 | 16.77 | 9.15 | 14.55 |
| 3rd | 27 | 61 | 11.74 | 19.10 | 18.78 | 11.81 | 16.20 |
Publisher’s Note: MDPI stays neutral with regard to jurisdictional claims in published maps and institutional affiliations. |
© 2022 by the authors. Licensee MDPI, Basel, Switzerland. This article is an open access article distributed under the terms and conditions of the Creative Commons Attribution (CC BY) license (https://creativecommons.org/licenses/by/4.0/).
Share and Cite
Duan, M.; Shao, L.; Huang, Q.; Wang, C.; Li, X.; Huang, Y. Peak Cutting Force Estimation of Improved Projection Profile Method for Rock Fracturing Capacity Prediction with High Lithological Tolerance. Coatings 2022, 12, 1306. https://doi.org/10.3390/coatings12091306
Duan M, Shao L, Huang Q, Wang C, Li X, Huang Y. Peak Cutting Force Estimation of Improved Projection Profile Method for Rock Fracturing Capacity Prediction with High Lithological Tolerance. Coatings. 2022; 12(9):1306. https://doi.org/10.3390/coatings12091306
Chicago/Turabian StyleDuan, Mingyu, Lefei Shao, Qibai Huang, Chenlin Wang, Xuefeng Li, and Yizhe Huang. 2022. "Peak Cutting Force Estimation of Improved Projection Profile Method for Rock Fracturing Capacity Prediction with High Lithological Tolerance" Coatings 12, no. 9: 1306. https://doi.org/10.3390/coatings12091306
APA StyleDuan, M., Shao, L., Huang, Q., Wang, C., Li, X., & Huang, Y. (2022). Peak Cutting Force Estimation of Improved Projection Profile Method for Rock Fracturing Capacity Prediction with High Lithological Tolerance. Coatings, 12(9), 1306. https://doi.org/10.3390/coatings12091306