

Performance Study and Multi-Index Synergistic Effect Analysis of Phosphogypsum-Based Composite Cementitious Material


 ,
,
Abstract
:1. Introduction
2. Experiment
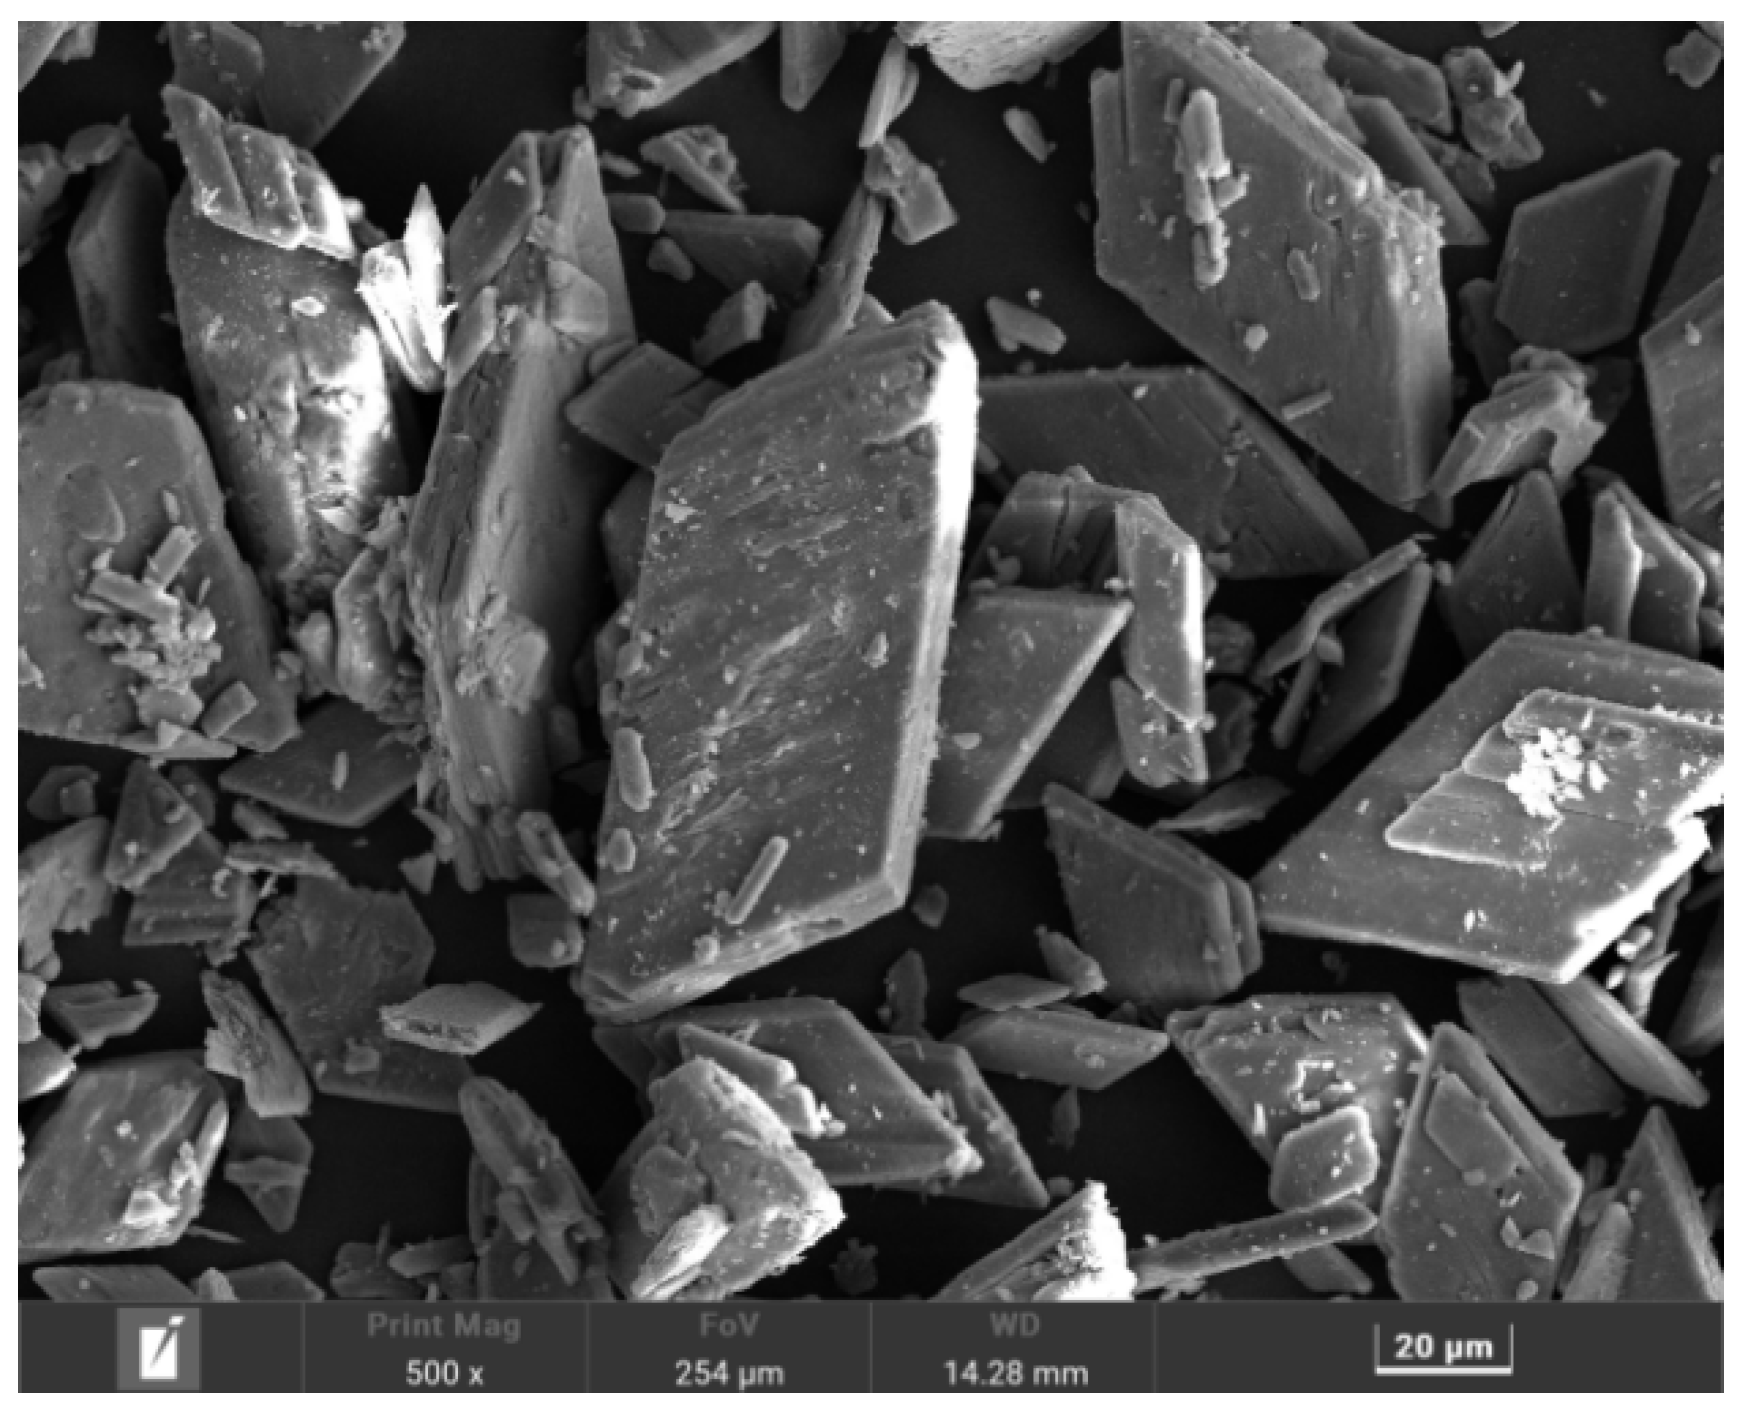
2.1. Material
2.2. Experimental Design
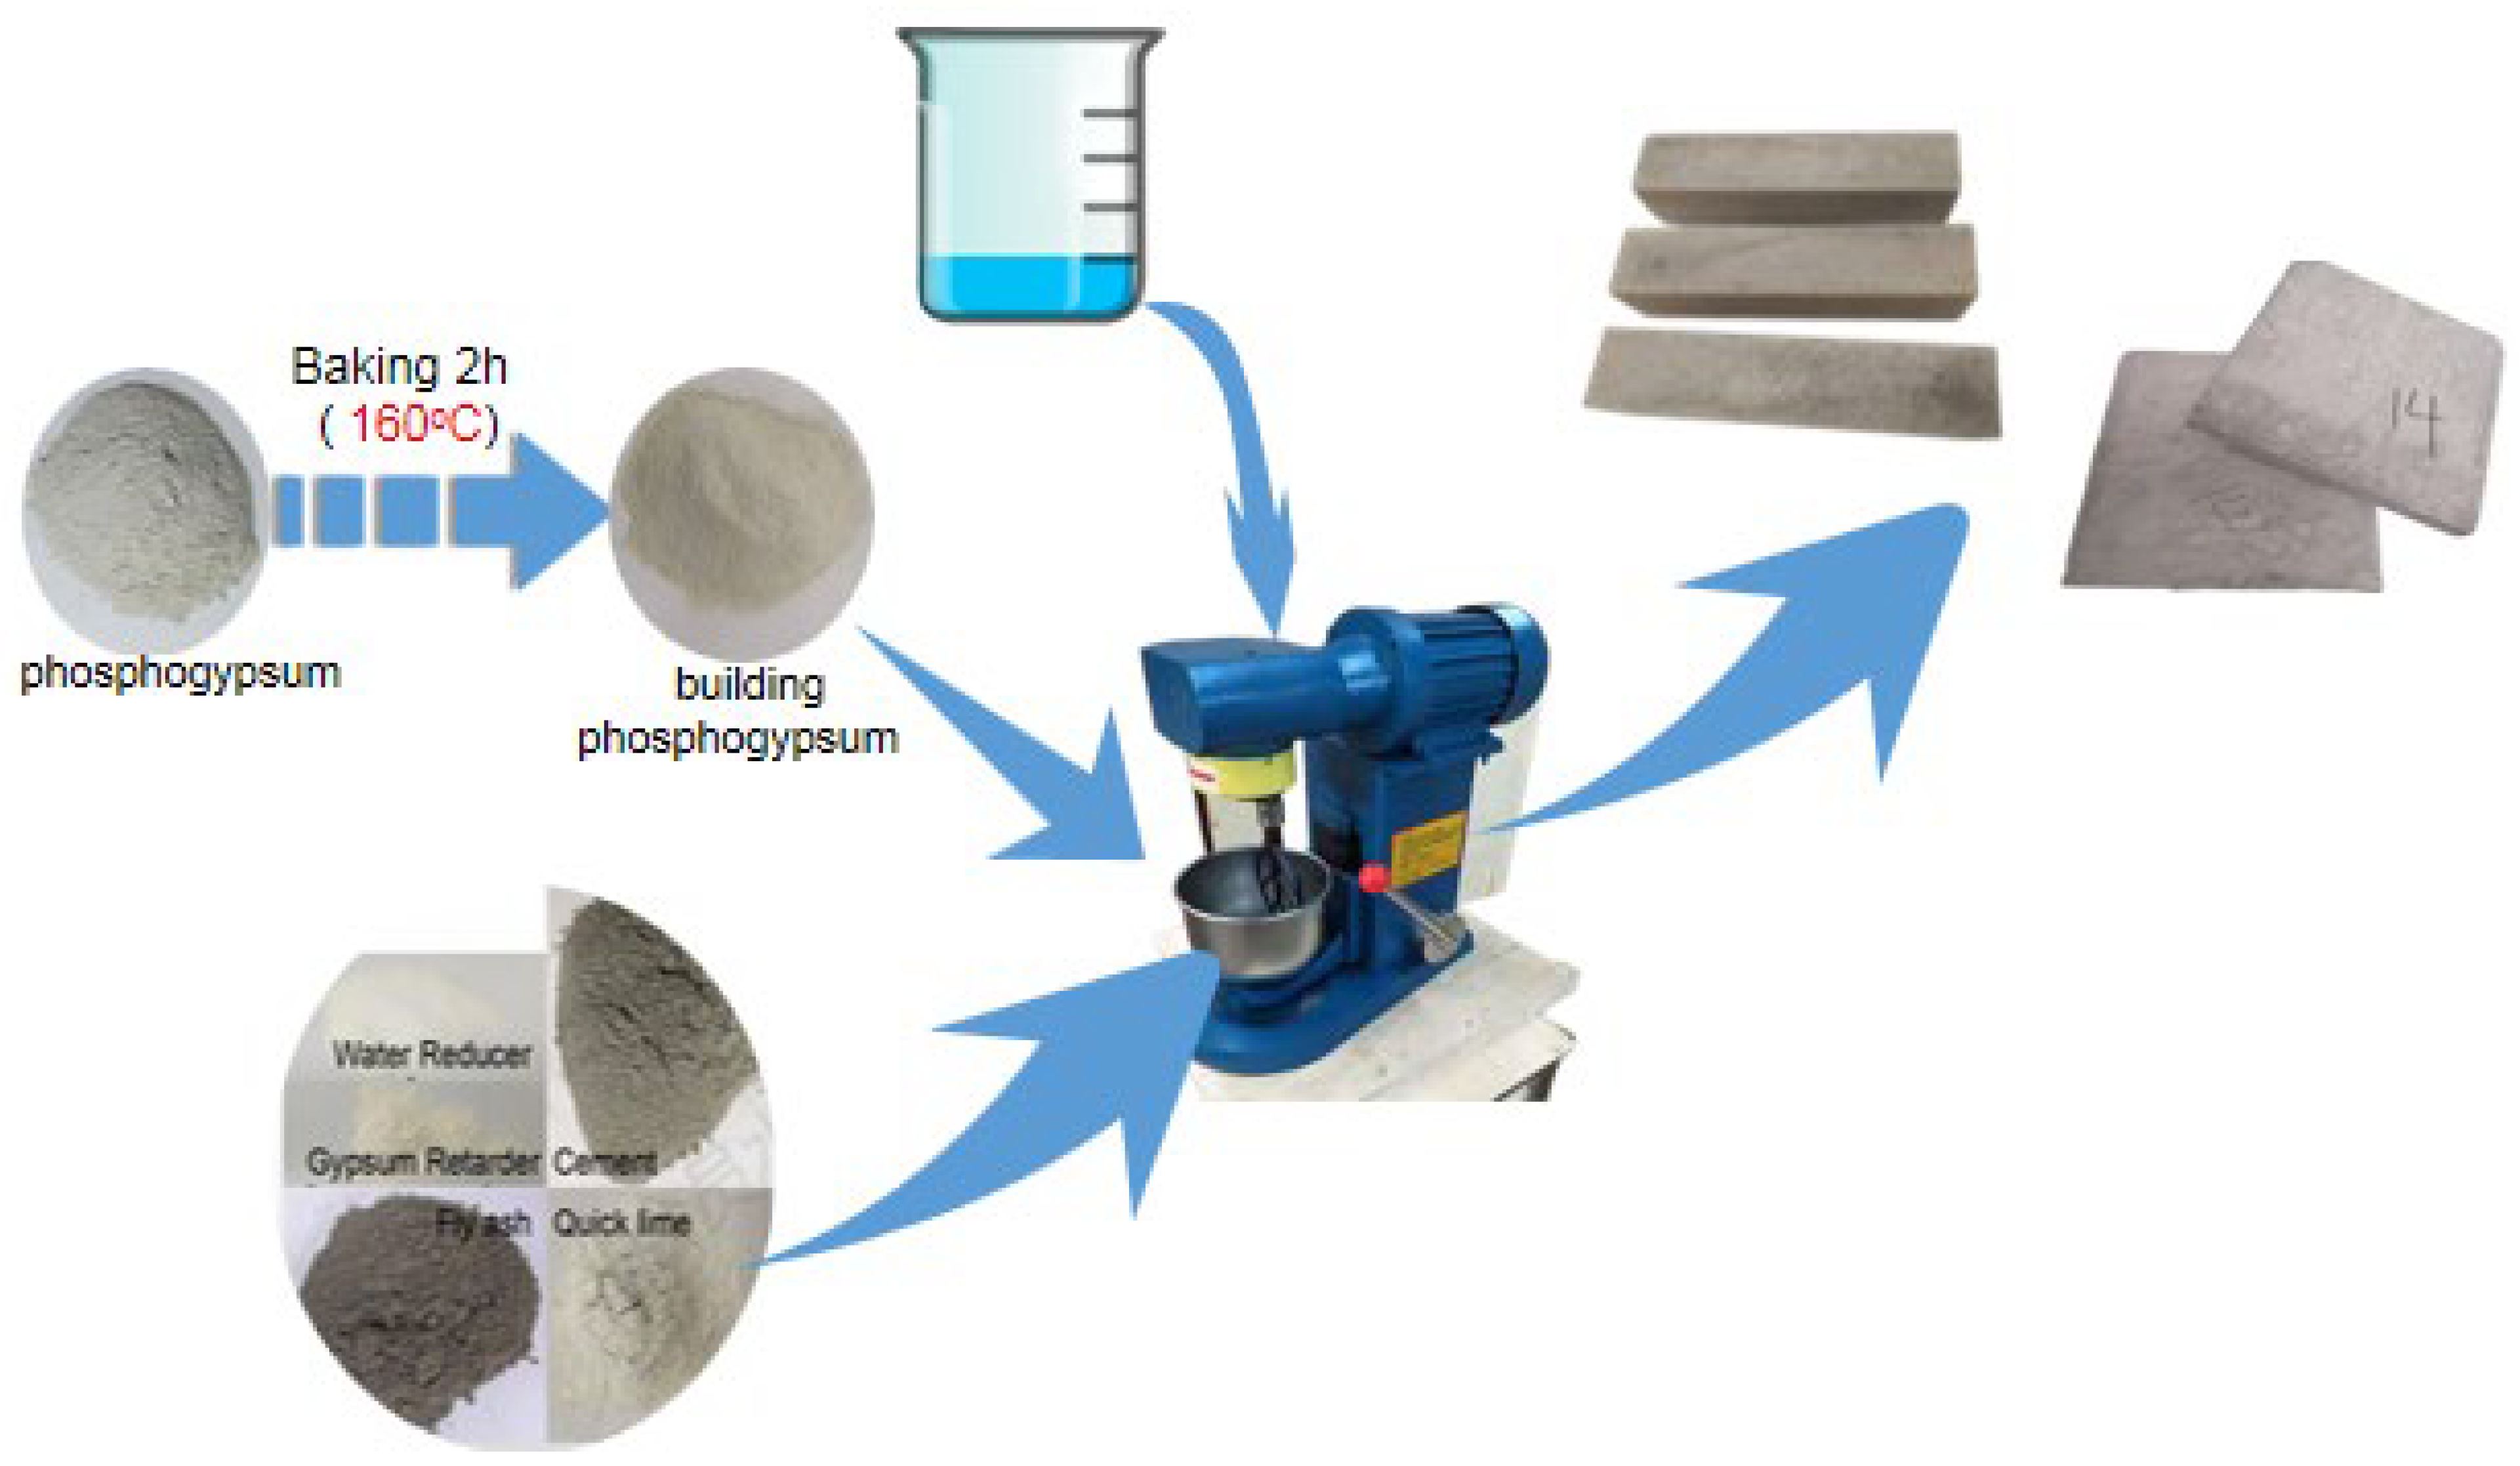
2.3. Test Piece Production Method
2.4. Test Method
2.4.1. Sample Phase
2.4.2. Unconfined Compressive Strength
2.4.3. Thermal Conductivity
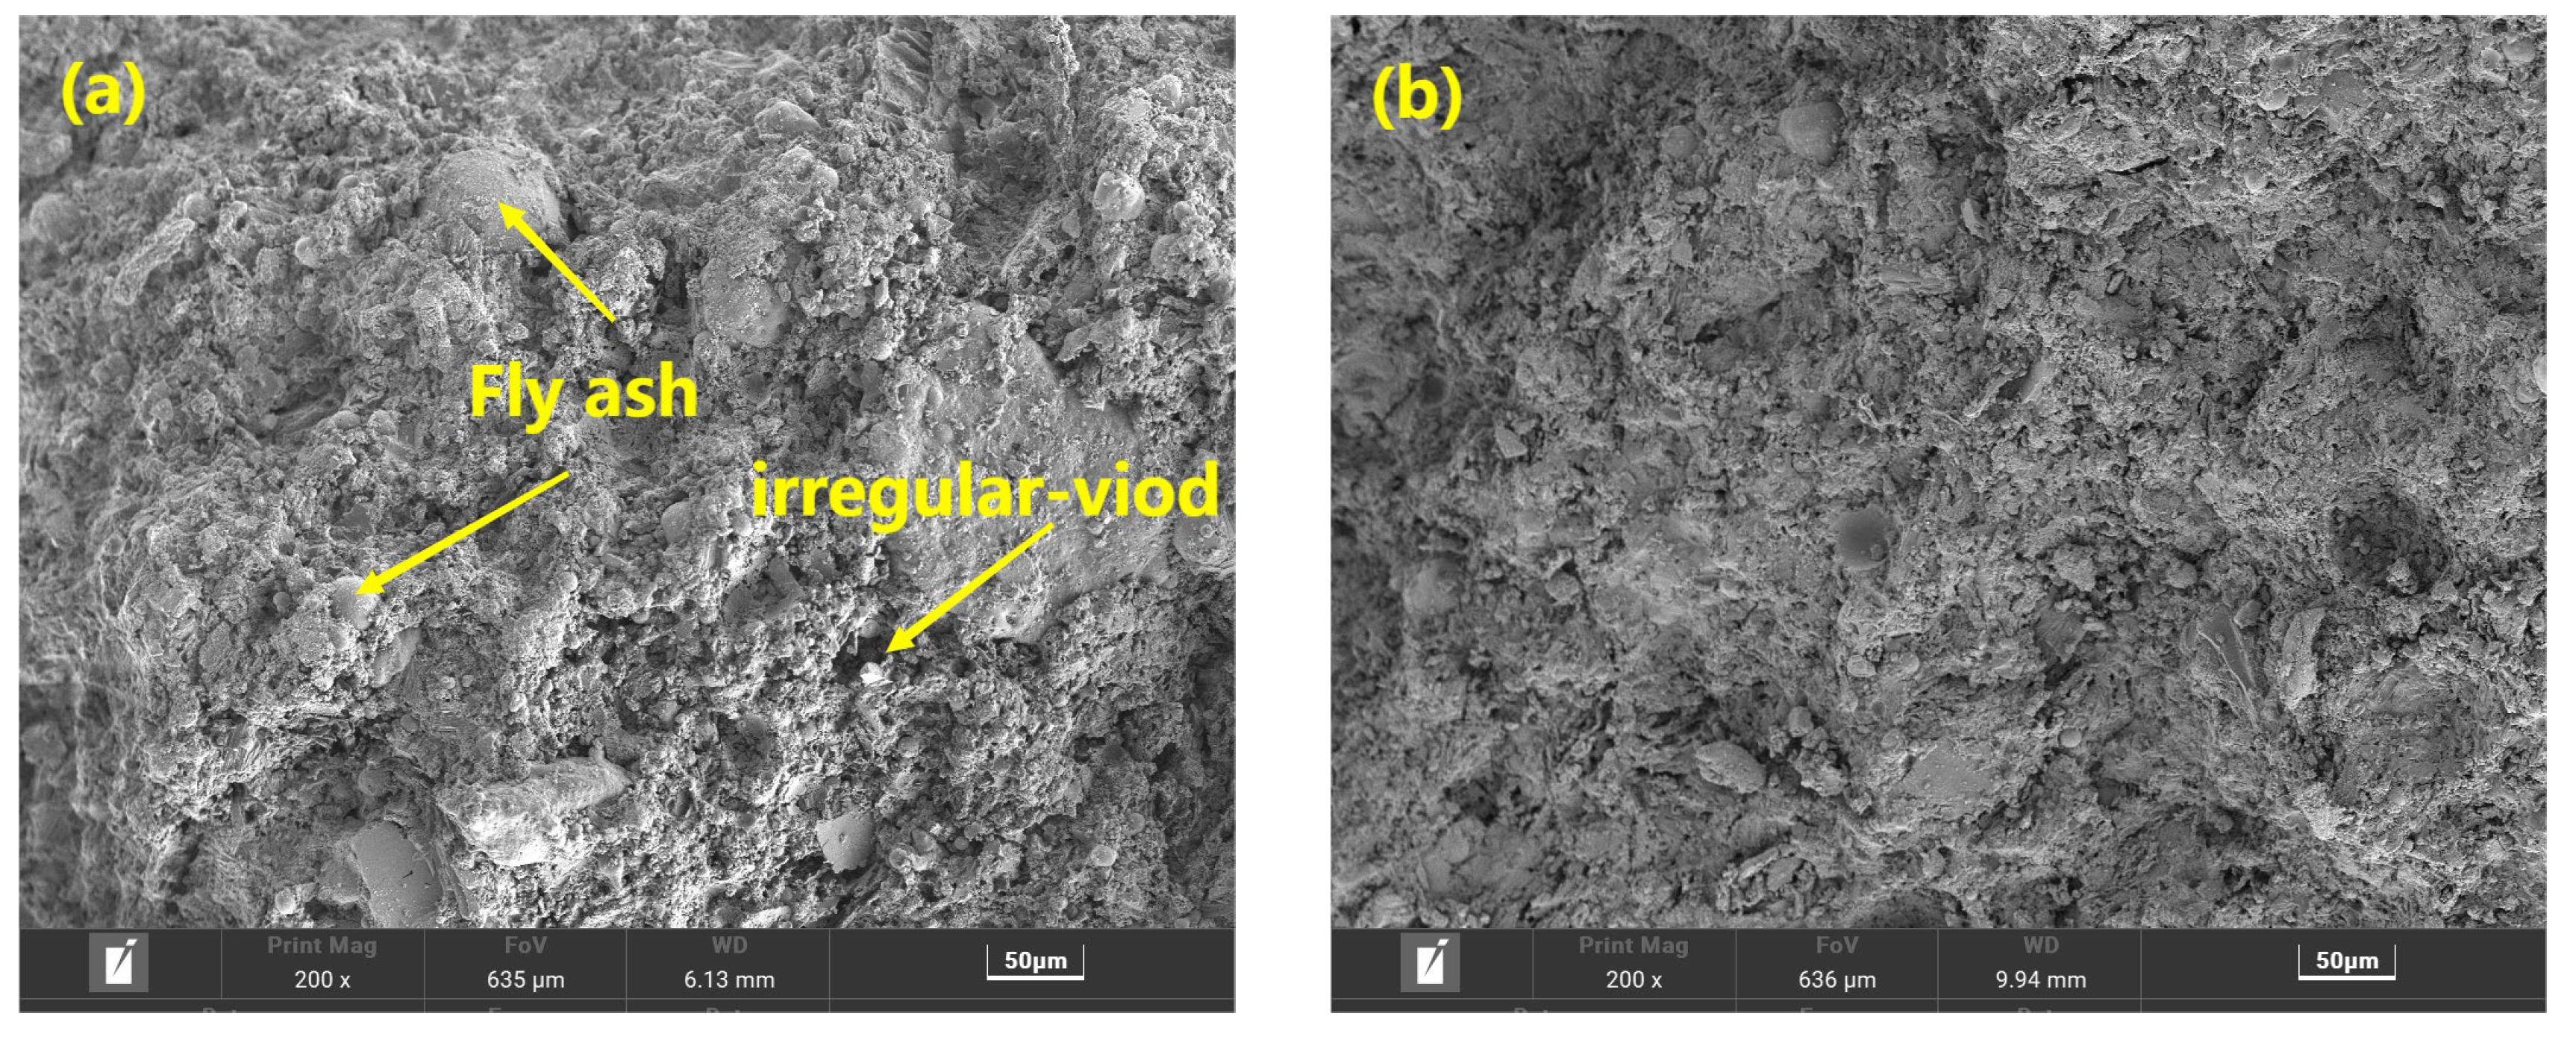
2.4.4. Micromorphology of Specimens
3. Results and Discussion
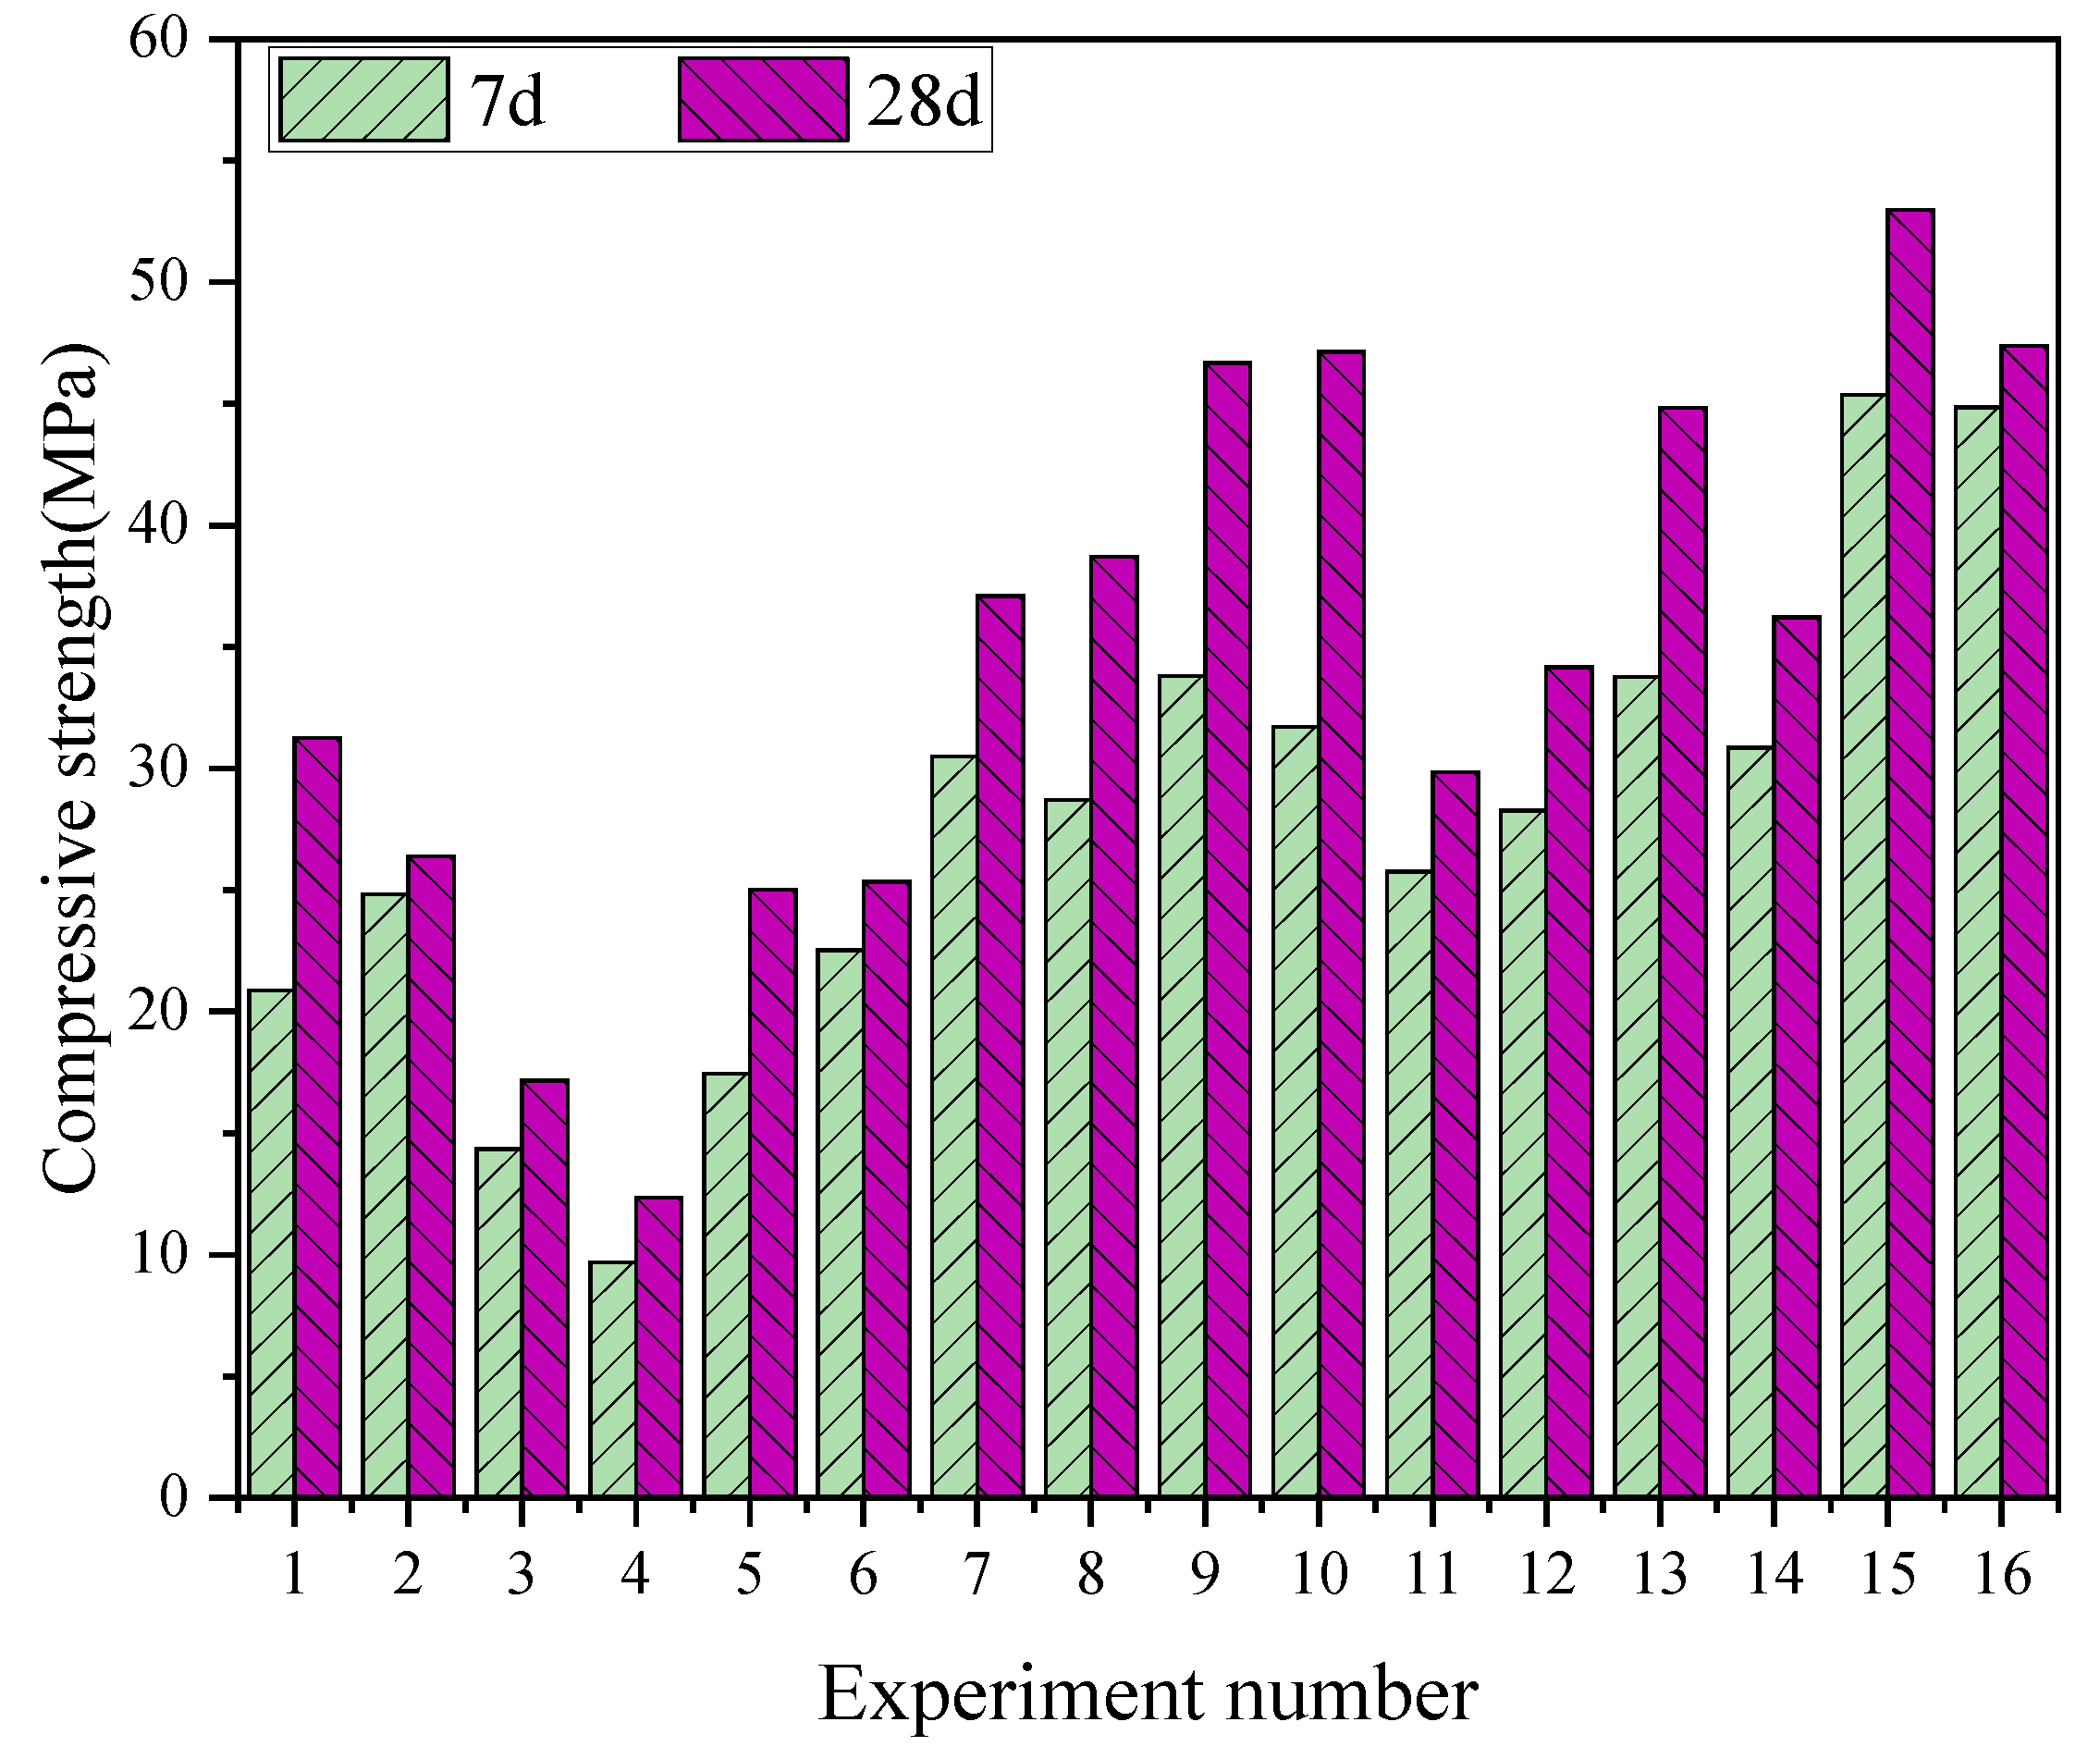
3.1. Compressive Strength Test Analysis
3.2. Thermal Conductivity Test Analysis
3.3. Multi-Index Collaborative Analysis
3.3.1. Index Membership Calculation
3.3.2. Synergistic Effect of Thermal Conductivity and Compressive Strength
3.4. Analysis of Influence Mechanism of the Comprehensive Performance of Phosphogypsum-Based Composite Cementitious Materials and the Synergistic Effect
4. Conclusions
- (1)
- From the coefficient of the numerical fitting equation of the phosphogypsum-based composite cementitious material, it can be seen that the content of building phosphogypsum has the greatest influence on the compressive strength and is a positive influence. The influence of water cement mass ratio and fly ash content on compressive strength ranks second and third, both of which are negative. The above fitting results are consistent with the actual performance analysis results.
- (2)
- From the numerical fitting equation of the thermal conductivity of phosphogyp-sum-based composite cementitious materials, it can be seen that the water-cement mass ratio has the greatest influence on the thermal conductivity, which is mainly due to the hindering effect of the pores left by water evaporation on heat transfer. At the same time, the combined effect of building phosphogypsum content and lime content and the combined effect of fly ash and lime also have an effect on the change of thermal conductivity.
- (3)
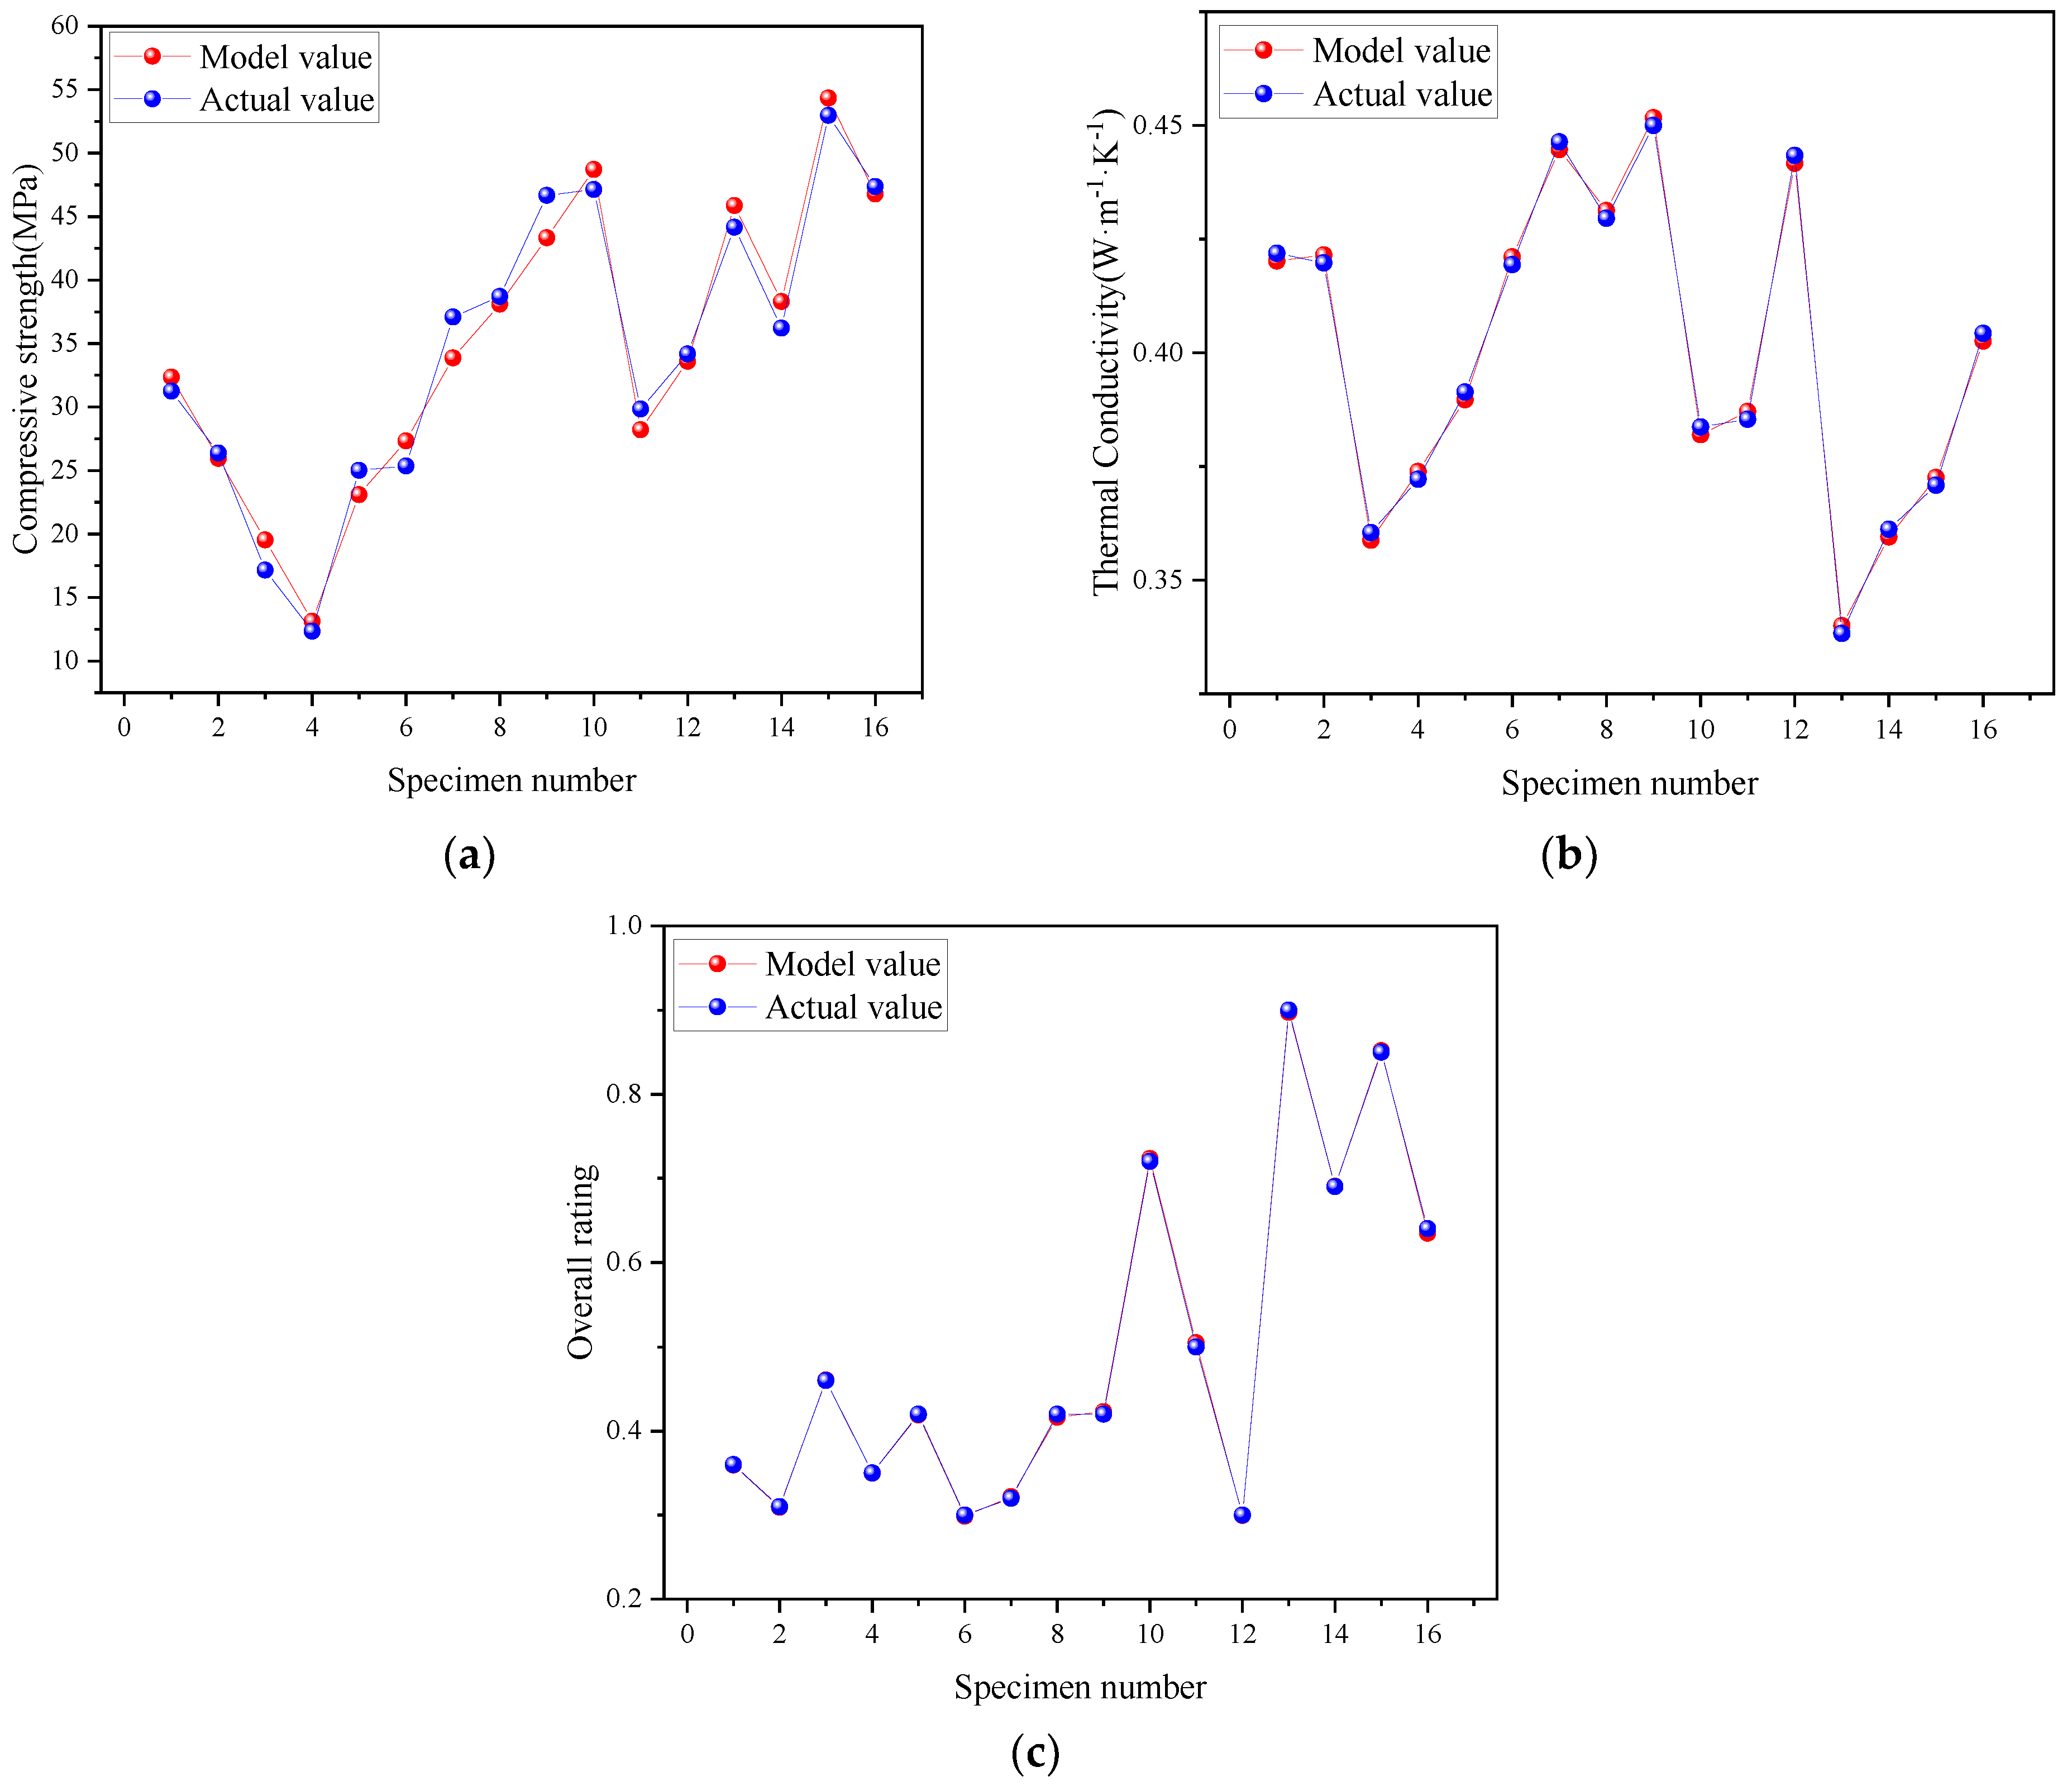
- The comprehensive evaluation equation of mechanical and thermal insulation properties of phosphogypsum-based composite cementitious materials was ob-tained by synthesis. The comprehensive performance of phosphogypsum-based composite cementitious materials can be predicted by substituting the content of each component into the evaluation equation. This method provides an evaluation equation for the comprehensive performance evaluation of phosphogypsum-based composite cementitious materials.
Author Contributions
Funding
Institutional Review Board Statement
Informed Consent Statement
Data Availability Statement
Conflicts of Interest
References
- Antar, K.; Jemal, M. Kinetics and thermodynamics of the attack of a phosphate ore by acid solutions at different temperatures. Thermochim. Acta 2008, 474, 32–35. [Google Scholar] [CrossRef]
- Li, H.; Ge, W.; Zhang, J.; Kasomo, R.M.; Leng, J.; Weng, X.; Chen, Q.; Gao, Q.; Song, S.; Xiao, L.; et al. Control foaming performance of phosphate rocks used for wet-process of phosphoric acid production by phosphoric acid. Hydrometallurgy 2020, 195, 105364. [Google Scholar] [CrossRef]
- Carr, J.; Zhang, L.; Davis, M.; Ravishankar, S.A.; Flieg, G. Scale Controlling Chemical Additives for Phosphoric Acid Production Plants. Procedia Eng. 2014, 83, 233–242. [Google Scholar] [CrossRef] [Green Version]
- Jamialahmadi, M.; Müller-Steinhagen, H. Heat Exchanger Fouling and Cleaning in the Dihydrate Process for the Production of Phosphoric Acid. Chem. Eng. Res. Des. 2007, 85, 245–255. [Google Scholar] [CrossRef]
- Belboom, S.; Szöcs, C. Léonard, Environmental impacts of phosphoric acid production using di-hemihydrate process: A Belgian case study. J. Clean. Prod. 2015, 108, 978–986. [Google Scholar] [CrossRef]
- da Silva, G.A.; Kulay, L.A. Environmental performance comparison of wet and thermal routes for phosphate fertilizer production using LCA—A Brazilian experience. J. Clean. Prod. 2005, 13, 1321–1325. [Google Scholar] [CrossRef]
- Calderón-Morales, B.R.S.; García-Martínez, A.; Pineda, P.; García-Tenório, R. Valorization of phosphogypsum in cement-based materials: Limits and potential in eco-efficient construction. J. Build. Eng. 2021, 44, 102506. [Google Scholar] [CrossRef]
- Yang, J.; Liu, W.; Zhang, L.; Xiao, B. Preparation of load-bearing building materials from autoclaved phosphogypsum. Constr. Build. Mater. 2009, 23, 687–693. [Google Scholar] [CrossRef]
- Sahu, S.K.; Ajmal, P.Y.; Bhangare, R.C.; Tiwari, M.; Pandit, G.G. Natural radioactivity assessment of a phosphate fertilizer plant area. J. Radiat. Res. Appl. Sci. 2014, 7, 123–128. [Google Scholar] [CrossRef]
- Cuadri, A.A.; Navarro, F.J.; García-Morales, M.; Bolívar, J.P. Valorization of phosphogypsum waste as asphaltic bitumen modifier. J. Hazard. Mater. 2014, 279, 11–16. [Google Scholar] [CrossRef]
- Wu, F.; Zhao, C.; Qu, G.; Liu, S.; Ren, Y.; Chen, B.; Li, J.; Liu, L. A critical review of the typical by-product clean ecology links in the Chinese phosphorus chemical industry in China: Production technologies, fates and future directions. J. Environ. Chem. Eng. 2022, 10, 106685. [Google Scholar] [CrossRef]
- Liu, S.; Fang, P.; Ren, J.; Li, S. Application of lime neutralised phosphogypsum in supersulfated cement. J. Clean. Prod. 2020, 272, 122660. [Google Scholar] [CrossRef]
- Gu, K.; Chen, B. Loess stabilization using cement, waste phosphogypsum, fly ash and quicklime for self-compacting rammed earth construction. Constr. Build. Mater. 2020, 231, 117195. [Google Scholar] [CrossRef]
- Li, X.; Du, J.; Gao, L.; He, S.; Gan, L.; Sun, C.; Shi, Y. Immobilization of phosphogypsum for cemented paste backfill and its environmental effect. J. Clean. Prod. 2017, 156, 137–146. [Google Scholar] [CrossRef]
- Amrani, M.; Taha, Y.; Kchikach, A.; Benzaazoua, M.; Hakkou, R. Phosphogypsum recycling: New horizons for a more sustainable road material application. J. Build. Eng. 2020, 30, 101267. [Google Scholar] [CrossRef]
- Ouakarrouch, M.; el Azhary, K.; Laaroussi, N.; Garoum, M.; Kifani-Sahban, F. Thermal performances and environmental analysis of a new composite building material based on gypsum plaster and chicken feathers waste. Therm. Sci. Eng. Prog. 2020, 19, 100642. [Google Scholar] [CrossRef]
- Zhang, L.; Zhang, A.; Li, K.; Wang, Q.; Han, Y.; Yao, B.; Gao, X.; Feng, L. Research on the pretreatment and mechanical performance of undisturbed phosphogypsum. Case Stud. Constr. Mater. 2020, 13, e400. [Google Scholar] [CrossRef]
- Liu, S.; Ouyang, J.; Ren, J. Mechanism of calcination modification of phosphogypsum and its effect on the hydration properties of phosphogypsum-based supersulfated cement. Constr. Build. Mater. 2020, 243, 118226. [Google Scholar] [CrossRef]
- Xie, L.; Zhou, Y.; Xiao, S.; Miao, X.; Murzataev, A.; Kong, D.; Wang, L. Research on basalt fiber reinforced phosphogypsum-based composites based on single factor test and RSM test. Constr. Build. Mater. 2022, 316, 126084. [Google Scholar] [CrossRef]
- Jiang, G.; Wu, A.; Wang, Y.; Lan, W. Low cost and high efficiency utilization of hemihydrate phosphogypsum: Used as binder to prepare filling material. Constr. Build. Mater. 2018, 167, 263–270. [Google Scholar] [CrossRef]
- Chen, M.; Liu, P.; Kong, D.; Wang, Y.; Wang, J.; Huang, Y.; Yu, K.; Wu, N. Influencing factors of mechanical and thermal conductivity of foamed phosphogypsum-based composite cementitious materials. Constr. Build. Mater. 2022, 346, 128462. [Google Scholar] [CrossRef]
- GB/T17669.3-1999; Gypsum Plasters-Determination of Mechanical Properties. General Administration of Quality Supervision, Inspection and Quarantine of the People’s Republic of China: Beijing, China, 1999.
- GB/T 10294-2008; Thermal Insulation-Determination of Steady-State Thermal Resistance and Related Properties-Guarded Hot Plate Apparatus. General Administration of Quality Supervision, Inspection and Quarantine of the People’s Republic of China: Beijing, China, 2008.
- Fernández-Jiménez, A.; Palomo, A.; Criado, M. Microstructure development of alkali-activated fly ash cement: A descriptive model. Cem. Concr. Res. 2005, 35, 1204–1209. [Google Scholar] [CrossRef]
- Hou, Y.; Hu, F.; Kuo, K.; Yeh, P. Anterior amorphous corneal opacity and corneal thinning. Taiwan J. Ophtalmol. 2014, 4, 123–128. [Google Scholar] [CrossRef] [Green Version]
- Rees, C.A.; Provis, J.L.; Lukey, G.C.; van Deventer, J.S. In situ ATR-FTIR study of the early stages of fly ash geopolymer gel formation. Langmuir 2007, 23, 9076–9082. [Google Scholar] [CrossRef]
- Su, L.; Fu, G.; Liang, B.; Sun, Q.; Zhang, X. Mechanical properties and microstructure evaluation of fly ash—Slag geopolymer foaming materials. Ceram. Int. 2022, 48, 18224–18237. [Google Scholar] [CrossRef]
- Al-Alwan, A.A.K.; Al-Bazoon, M.; Mussa, F.I.; Alalwan, H.A.; Shadhar, M.H.; Mohammed, M.M.; Mohammed, M.F. The impact of using rice husk ash as a replacement material in concrete:An experimental study. J. King Saud Univ.-Eng. Sci. 2022; in press. [Google Scholar] [CrossRef]
- Li, T.; Zhou, Y.; Zhu, J.; Liu, J. Effect of fine aggregate gradation on the rheology of mortar. Constr. Build. Mater. 2022, 332, 127362. [Google Scholar] [CrossRef]
- Yang, L.; Yan, Y.; Hu, Z. Utilization of phosphogypsum for the preparation of non-autoclaved aerated concrete. Constr. Build. Mater. 2013, 44, 600–606. [Google Scholar] [CrossRef]
- Chuanrong, H.; Yunyan, L. Experimental Design and Data Processing, 3rd ed.; Chemical Industry Press: Beijing, China, 2017. [Google Scholar]


| Project | SO3 | CaO | SiO2 | P2O5 | Al2O3 | Fe2O3 | K2O | TiO2 | Na2O | SrO | Cl | Y2O3 | MgO |
|---|---|---|---|---|---|---|---|---|---|---|---|---|---|
| Building Phosphogypsum | 54.94 | 41.04 | 1.80 | 1.30 | 0.38 | 0.27 | 0.12 | 0.07 | 0.05 | 0.02 | 0.01 | - | - |
| Fly ash | 1.24 | 5.22 | 49.10 | 0.40 | 36.87 | 3.13 | 0.98 | 1.83 | 0.34 | 0.03 | 0.05 | 0.13 | 0.68 |
| Level | Factor | |||
|---|---|---|---|---|
| A (Building Phosphogypsum/%) | B (Fly Ash/%) | C (Quicklime/%) | D (Water-Cement Mass Ratio) | |
| 1 | 30 | 30 | 5 | 0.250 |
| 2 | 40 | 40 | 6 | 0.275 |
| 3 | 50 | 50 | 7 | 0.300 |
| 4 | 60 | 60 | 8 | 0.325 |
| Sample Number | A (Building Phosphogypsum/%) | B (Fly Ash/%) | C (Quicklime/%) | D (Water-Cement Mass Ratio) |
|---|---|---|---|---|
| 1 | 30 | 30 | 5 | 0.250 |
| 2 | 30 | 40 | 6 | 0.275 |
| 3 | 30 | 50 | 7 | 0.300 |
| 4 | 30 | 60 | 8 | 0.325 |
| 5 | 40 | 30 | 6 | 0.325 |
| 6 | 40 | 40 | 5 | 0.300 |
| 7 | 40 | 50 | 8 | 0.275 |
| 8 | 40 | 60 | 7 | 0.250 |
| 9 | 50 | 30 | 7 | 0.275 |
| 10 | 50 | 40 | 8 | 0.250 |
| 11 | 50 | 50 | 5 | 0.325 |
| 12 | 50 | 60 | 6 | 0.300 |
| 13 | 60 | 30 | 8 | 0.300 |
| 14 | 60 | 40 | 7 | 0.325 |
| 15 | 60 | 50 | 6 | 0.250 |
| 16 | 60 | 60 | 5 | 0.275 |
| Source of Difference | SS | DF | MS | F | F0.01, F0.05, F0.1 |
|---|---|---|---|---|---|
| A | 958.90 | 3 | 319.63 | 335.08 | F0.01 = 29.46 F0.05 = 9.28 F0.1 = 5.39 |
| B | 13.13 | 3 | 4.38 | 4.59 | |
| C | 18.02 | 3 | 6.01 | 6.30 | |
| D | 415.85 | 3 | 138.62 | 145.31 | |
| e△ | 2.86 | 3 | 0.95 | - | - |
| Source of Difference | SS | DF | MS | F | F0.01, F0.05, F0.1 |
|---|---|---|---|---|---|
| A | 1250.79 | 3 | 416.93 | 280.70 | F0.01 = 29.46 F0.05 = 9.28 F0.1 = 5.39 |
| B | 33.46 | 3 | 11.15 | 7.51 | |
| C | 7.46 | 3 | 2.49 | 1.67 | |
| D | 718.87 | 3 | 239.62 | 161.32 | |
| e△ | 8.91 | 6 | 1.49 | - | - |
| Source of Difference | SS | DF | MS | F | F0.01, F0.05, F0.1 |
| A | 0.006948825 | 3 | 0.002316275 | 4.387456907 | F0.01 = 6.99 F0.05 = 3.86 F0.1 = 2.81 |
| B | 0.001014805 | 3 | 0.000338268 | 0.640743321 | |
| C | 0.001285165 | 3 | 0.000428388 | 0.811447411 | |
| D | 0.006023855 | 3 | 0.002007952 | 3.803435002 | |
| e△ | 0.00475138 | 9 | 0.000527931 | 0.00475138 | - |
| Specimen Number | Degree of Membership of Compressive Strength Index | Degree of Membership in the Reverse Index of Thermal Conductivity | Overall Rating |
|---|---|---|---|
| 1 | 0.4652 | 0.2516 | 0.3584 |
| 2 | 0.3453 | 0.2704 | 0.3079 |
| 3 | 0.1185 | 0.8013 | 0.4599 |
| 4 | 0.0000 | 0.6965 | 0.3483 |
| 5 | 0.3117 | 0.5246 | 0.4182 |
| 6 | 0.3201 | 0.2739 | 0.2970 |
| 7 | 0.6091 | 0.0322 | 0.3207 |
| 8 | 0.6489 | 0.1826 | 0.4157 |
| 9 | 0.8452 | 0.0000 | 0.4226 |
| 10 | 0.8562 | 0.5936 | 0.7249 |
| 11 | 0.4309 | 0.5783 | 0.5046 |
| 12 | 0.5375 | 0.0591 | 0.2983 |
| 13 | 0.7996 | 1.0000 | 0.8998 |
| 14 | 0.5877 | 0.7950 | 0.6913 |
| 15 | 1.0000 | 0.7081 | 0.8541 |
| 16 | 0.8622 | 0.4091 | 0.6356 |
| Parameter | R | R2min | R2 | F Value | F0.01, F0.05 | Significance |
|---|---|---|---|---|---|---|
| Compressive strength | 0.987 | 0.752 | 0.974 | 107.00 | F0.01 = 5.670 F0.05 = 3.360 | ** |
| Thermal Conductivity | 0.998 | 0.752 | 0.996 | 83.02 | F0.01 = 27.05 F0.05 = 8.74 | ** |
| Overall rating | 0.999 | 0.712 | 0.999 | 37,923.65 | F0.01 = 6.700 F0.05 = 3.810 | ** |
Publisher’s Note: MDPI stays neutral with regard to jurisdictional claims in published maps and institutional affiliations. |
© 2022 by the authors. Licensee MDPI, Basel, Switzerland. This article is an open access article distributed under the terms and conditions of the Creative Commons Attribution (CC BY) license (https://creativecommons.org/licenses/by/4.0/).
Share and Cite
Chen, M.; Liu, P.; Kong, D.; Li, Y.; Chen, Y.; Cui, G.; Wang, J.; Yu, K.; Wu, N. Performance Study and Multi-Index Synergistic Effect Analysis of Phosphogypsum-Based Composite Cementitious Material. Coatings 2022, 12, 1918. https://doi.org/10.3390/coatings12121918
Chen M, Liu P, Kong D, Li Y, Chen Y, Cui G, Wang J, Yu K, Wu N. Performance Study and Multi-Index Synergistic Effect Analysis of Phosphogypsum-Based Composite Cementitious Material. Coatings. 2022; 12(12):1918. https://doi.org/10.3390/coatings12121918
Chicago/Turabian StyleChen, Mingsheng, Peng Liu, Dewen Kong, Yuan Li, Yao Chen, Gengyin Cui, Jingdong Wang, Ke Yu, and Ningbo Wu. 2022. "Performance Study and Multi-Index Synergistic Effect Analysis of Phosphogypsum-Based Composite Cementitious Material" Coatings 12, no. 12: 1918. https://doi.org/10.3390/coatings12121918
APA StyleChen, M., Liu, P., Kong, D., Li, Y., Chen, Y., Cui, G., Wang, J., Yu, K., & Wu, N. (2022). Performance Study and Multi-Index Synergistic Effect Analysis of Phosphogypsum-Based Composite Cementitious Material. Coatings, 12(12), 1918. https://doi.org/10.3390/coatings12121918