Article

Mechanical Properties of σ-Phase and Its Effect on the Mechanical Properties of Austenitic Stainless Steel

1
School of Mechanical and Power Engineering, Nanjing TECH University, No. 30 Puzhu South Road, Nanjing 211816, China
2
Jiangsu Key Lab of Design and Manufacture of Extreme Pressure Equipment, Nanjing 211816, China
3
Nanjing Bolier and Pressure Vessel Inspection Institute, Nanjing 210019, China
4
Department of Mechanical Engineering, McGill University, Montreal, QC H3A 0C3, Canada
*
Author to whom correspondence should be addressed.
Coatings 2022, 12(12), 1917; https://doi.org/10.3390/coatings12121917
Submission received: 28 October 2022 / Revised: 30 November 2022 / Accepted: 3 December 2022 / Published: 7 December 2022
(This article belongs to the Special Issue Advances in Surface Engineering of Metals and Alloys)

Abstract

:
In this present paper, the mechanical properties of σ-phase and its effect on the mechanical properties of 304H austenitic stainless steel after servicing for about 8 years at 680–720 °C were studied by nano-indentation test, uniaxial tensile test, and impact test. The results showed that the nano-hardness (H), Young’s modulus (E), strain hardening exponent (n), and yield strength (σy) of σ-phase were 14.95 GPa, 263 GPa, 0.78, and 2.42 GPa, respectively. The presence of σ-phase increased the hardness, yield strength, and tensile strength, but greatly reduced the elongation and impact toughness of the material.

1. Introduction

Since σ-phase was first reported by Treitschke in 1907, about one century has passed. The structure and formation of σ-phase and its effects on material properties have been extensively studied and reported. σ-phase is basically an intermetallic phase that has a characteristic complex tetragonal unit cell structure [1]. The typical unit cell of σ-phase has 30 atoms, and these atoms are distributed in five inequivalent lattice sites [2,3]. A study also showed that the five inequivalent lattice sites of the σ-phase display a specific site-occupation sequence with the increase in element composition [4]. After exposure to an elevated temperature, σ-phase can be present in many stainless steels such as ferritic [5,6], austenitic [7,8], and duplex stainless steels [9,10]. The nucleation and growth of σ-phase are controlled by the thermodynamic driving forces and diffusion. σ-phase always has a high content of substitutional elements such as Cr, Mo, V, and so on. The partitioning of these elements is crucial, because their mobility and richness determine the precipitation position of σ-phase. For example, in duplex stainless steel, Cr and Mo elements are higher in the ferrite than in the austenite. Accordingly, σ-phase predominantly occurs in the ferrite–ferrite and ferrite–austenite grain boundaries. The nuclei then grow into the adjacent ferrite grains. As the precipitation continues, the ferrite-forming elements Cr and Mo diffuse from the ferrite to the σ-phase [11,12,13,14].
σ-phase is hard and brittle. Bain and Griffiths [15] have reported a hardness of ≈68 HRC for (Fe-Cr) σ-phase, and they found that specimens often fractured during hardness testing. You et al. [16] found that the nano-hardness of σ-phase in high entropy alloy was 12.2–14.7 GPa, which was ≈3 times higher than the base matrix. Because of the high hardness, the σ-phase was brittle, and they observed the preferential presence of micro-cracks at the σ/σ interfaces. It is known that the precipitation of σ-phase affects the material strength [17], elongation [18], toughness [19], creep property [20,21], creep-fatigue property [22], corrosion resistance [23,24], and weldability [25].
Because the size of σ-phase is too small, it is difficult to obtain the true mechanical properties of σ-phase directly. So, except for several articles on the hardness of σ-phase [17,26,27,28], there are no reports on other mechanical properties of σ-phase (such as Young’s modulus, yield strength, and so on). However, these mechanical properties of σ-phase itself are valuable for further understanding the mechanical properties’ degradation due to σ-phase precipitation. Therefore, it is necessary to study the mechanical properties of σ-phase.
In addition, most of these reported studies on σ-phase are determined through short-term annealing in the laboratory. A comprehensive study of the properties of σ-phase requires not only research in the laboratory, but also research under actual industrial conditions. In this paper, the hardness, Young’s modulus, yield strength, and hardening index of the σ-phase in a 304H austenitic stainless steel wing valve of rotary separator in catalytic regenerator after servicing for 8 years at 680–720 °C were investigated. The effect of the presence of σ-phase on the mechanical properties of this 304H austenitic stainless steel was also studied.

2. Experimental Details

2.1. Material and Metallographic Structure

The material used in this study is Ø 220 mm × 11 mm ASME A213 304H austenitic stainless steel tube (C 0.04, Cr 19.09, Ni 8.29, Si 0.31, Mn 1.36, P 0.03, S 0.007, and balance Fe (wt. %)), which is cut from an 8-year-old wing valve of the rotary separator in the catalytic regenerator. The cyclone separator is an important process equipment used to separate catalyst and flue gas in the catalytic cracking unit. The wing valve is located at the end part of the feed leg in the separator. When the catalyst particles accumulate to a certain weight in the feed leg, the wing valve will be opened by the dead weight of catalyst, and the catalyst will fall to the bottom of separator and be recycled. The servicing temperature of the wing valve is 680–720 °C and pressure is 0.289 MPa.
The metallographic specimens were mounted and wet abraded using progressive grits of sandpaper from 100 up to 2000 grit, and then polished with 3.5 μm synthetic diamond grinding paste. The σ-phase was revealed by electrolytic etching method (ASTM A923 standard solution of 40% NaOH, 2 V, 10 s, 25 °C). The metallographic structure was observed by optical microscopy (OM, ZEISS AXIO Imager A1m, Göttingen, Germany). The Image pro plus software (version 6.0) was used to analyse the proportion of the σ-phase. The elements’ detection was performed by scanning electron microscope (SEM, FEI quanta 250, Hillsboro, OR, USA) equipped with EDS (energy dispersive X-ray spectroscopy, Hillsboro, OR, USA).

2.2. Microhardness Test

The microhardness test specimen was mounted and wet abraded using progressive grits of sandpaper from 100 to 1000 grit, and then polished successively with 3.5 μm synthetic diamond grinding paste. Vickers hardness (HV) was measured by HVS-1000Z digital micro hardness tester with a load of 200 g (Huayin, Laizhou, China). The average value of the five measurements is taken as the final result.

2.3. Mechanical Properties Tests

According to ASTM A370 [29], standard flat ‘dog bone’ uniaxial tension test specimens (gauge length: 50 mm, width: 12.5 mm, thickness: 9 mm) and full size Charpy impact test specimens were sampled along the axial direction of the tube. Three impact and tensile specimens were processed for repeated experiments and averaged values were used for analysis. Uniaxial tension tests were performed using an electromechanical machine (INSTRON5869, Darmstadt, Germany) under total strain rate control mode with a constant strain rate of 0.002/s. The impact test was carried out on an automatic metal pendulum impact test machine (PIT-452D, Melbourne, Australia). The test machine can provide a maximum impact energy of 450 J. The test parameters are as follows: pendulum pre-lift angle: 150° and impact velocity: 5.24 m/s. After the uniaxial tension test and impact test, the fracture surfaces were observed by SEM.

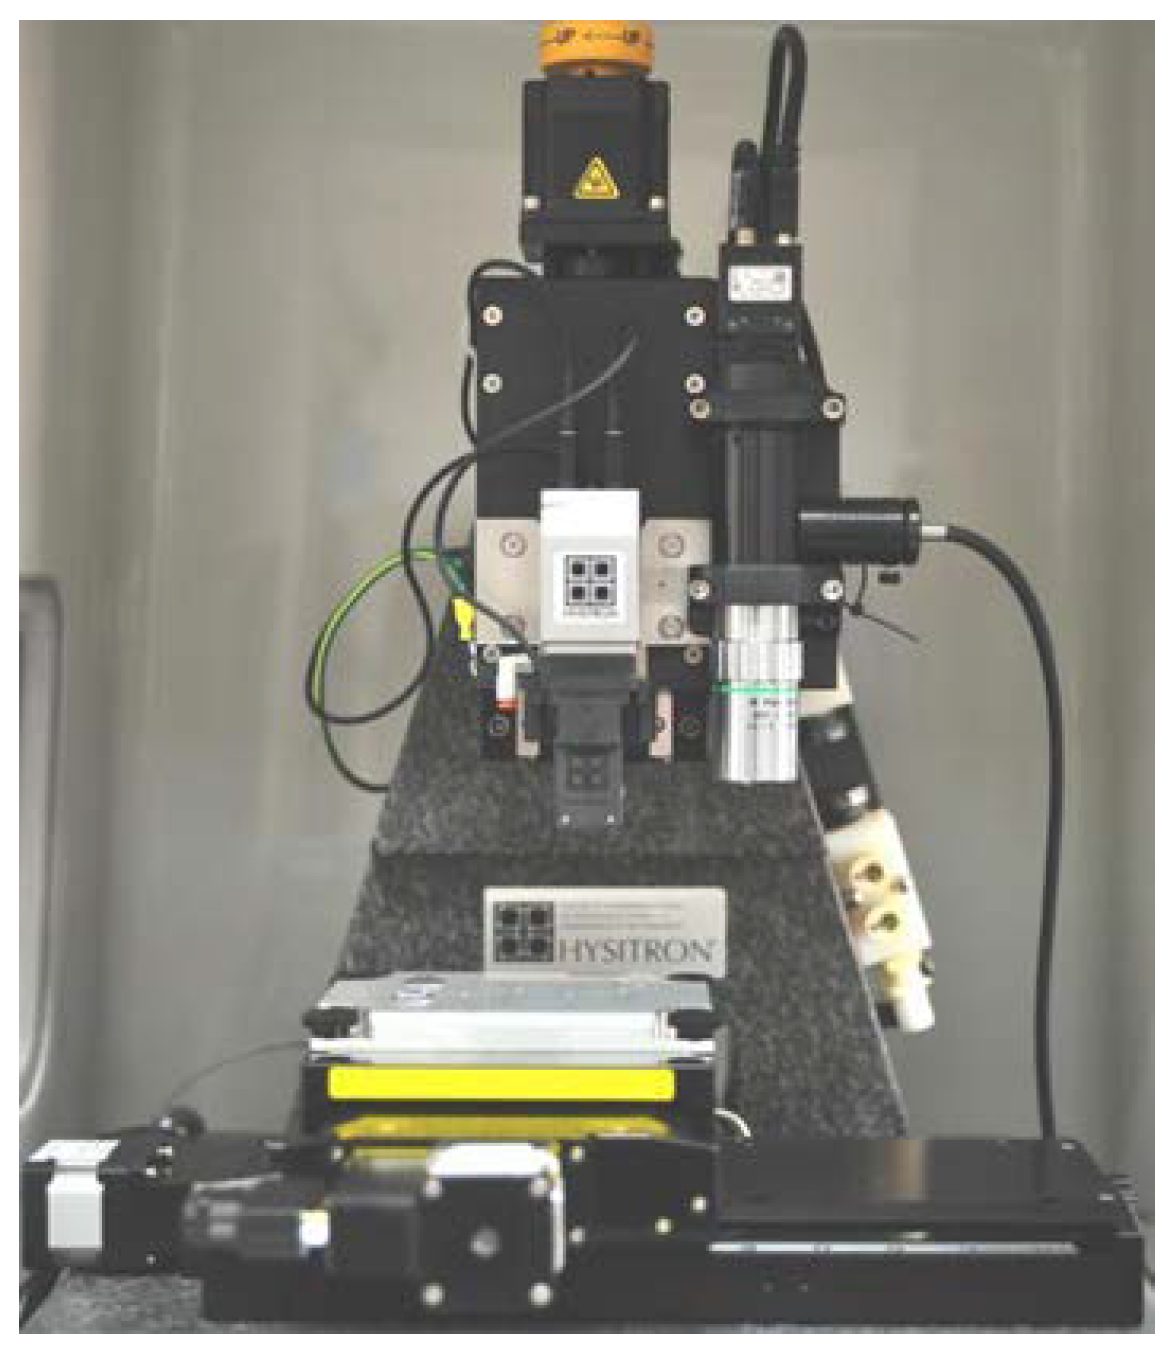
2.4. Nano-Indentation Tests

The nano-indentation specimens were mounted and wet abraded using progressive grits of sandpaper from 100 to 2000 grit, and then polished successively with 3.5 μm and 0.5 μm synthetic diamond grinding paste. Nano-indentation tests were performed on Hysitron Triboindenter TI-Premier with a Berkovich indenter (Hysitron Inc., Minneapolis, MN, USA). The nanoindentation instrument is shown in Figure 1. Maximum indentation loads of 1, 2, 3, 4, 5, 6, 7, 8, 9, 10, 11, and 12 mN were employed. Ten nano-indentation tests were performed under each loading condition and averaged values were used for analysis. The measurement mode of loading–holding–unloading (with time as 5/2/5 s) was adopted [30]. Surface morphologies under the maximum indentation load (12 mN) were scanned by in situ scanning probe microscopy (SPM).

3. Results

3.1. Metallographic Structure

Figure 2 shows the microstructure of serviced 304H austenitic stainless steel. After being electrolyzed in 40% NaOH solution, σ-phase exhibits an orange-brown color, and no obvious retained ferrite (which should be in a light brown color) or other phases (such as MnS in dark gray color) are observed. The Image pro plus software calculates that the σ-phase proportion is ≈3.5%. The composition of nine randomly selected independent orange-brown precipitated phases was analyzed by EDS. As shown in Figure 3, these phases displayed typical Cr-rich and Ni-depleted profiles. The Cr and Fe element content of σ-phase is not constant, but varies from ≈32 to 42 wt. % and ≈56 to 65 wt. %, respectively, which is consistent with the ratio of the Cr elements in the Fe-Cr σ-phase [1].

3.2. Room Temperature Mechanical Properties

The average value of room temperature mechanical properties of serviced 304H are listed in Table 1, meeting the standard requirements, although the elongation is reduced. It shows that, after servicing for about 8 years at a high temperature, the strengths and elongation of the material meet the standard requirements. By comparing with the warranty data, the strength and hardness increased, while the elongation reduced from 59% for the new material to 39% after service. However, the impact energy declined greatly from 258 J to only 25 J.
The most part of the fracture surface of the tensile test specimen shows a typical ductile fracture character with dimples. Brittle cracks in σ-phase are also observed, as shown by red arrows in Figure 4. Fortunately, these brittle cracks are all located in the σ-phase and do not extend into the austenite through the σ/γ phase boundary. This is an important reason for why the material still retains the elongation of 39%. Separation along the interface between the σ/γ phases is also observed on the fracture surface (shown by the small blue arrows in Figure 4). This indicates that the cross-sectional bonding of the two phases is weak and separation will occur during deformation. Cracking characters on the side of tensile specimen are shown in Figure 4b.
It also shows that the cracks only occurred in the σ-phase and the interface of σ/γ. Cracks did not extend into the austenite phase.
Figure 5 shows the fracture surface character of the impact test specimen. On the fracture surface, a large number of banded fracture zones are distributed along the impact crack propagation direction (Figure 5a). After magnification, it can be seen that brittle fracture particles are distributed in strips on these fracture surfaces (Figure 5b). The results of energy spectrum analysis show that these small particles are σ-phase. Although the austenite zone still shows the dimple characteristic of ductile fracture, the dimple is very shallow, which is consistent with the low impact energy.

3.3. Nano-Indentation Test Results

Figure 6 shows the load–displacement curves for the σ-phase and austenitic matrix. Owing to the dependence of indentation displacement on the square root of the applied load for the Berkovich indenter, the loading part under different peak loads overlapped each other at the same depth. Figure 7 shows the typical impression in situ scanning probe microscopy (SPM) images in different micro-domains. It is clear that the indentation size of austenite is much larger than σ-phase.
The Young’s modulus E and the hardness H can be calculated from the load–displacement curves (Figure 6) using the Oliver and Pharr model [31,32] as Equations (1)–(6).
H = P m a x A c
A c = D 0 h c 2 + D 1 h c + D 2 h c 1 / 2 + D 3 h c 1 / 4 + + D 8 h c 1 / 128
h c = h m a x ε P m a x S
S = d P d h | h = h m a x
E r = S 2 β π A c
1 E r = 1 v 2 E + 1 v i n 2 E i n
where Pmax is the maximum indentation load, P is the load, h is displacement, Ac is the projected contact area, Di coefficients are the Oliver and Pharr model parameters (with D0 = 24.56), hc is the contact depth, and ε is a constant related to the shape of the indenter. For Berkovich indenter, ε = 0.75. S is material stiffness, which can be determined from the slope of the unloading part of the load–displacement curve. Er is the reduced modulus, β (=1.034) is the Berkovich tip, ν (=0.3) is the Poisson’s ratio of the test material, Ein (=1140 GPa) is the modulus of the indenter, and νin (=0.07) is the Poisson’s ratio of the indenter. Details can be found in the relevant literature [33].
According to Equations (1)–(6), the Young’s modulus E and hardness H can be obtained for each nano-indentation load, as shown in Figure 8. It is clear that there is a great difference between E and H of σ-phase and the austenitic matrix. For σ-phase, E and H are both relatively constant and are not affected by the increase in applied load. Thus, the average values of nano-hardness H and Young’s modulus E of σ-phase are calculated as 14.95 GPa and 262.67 GPa, respectively. However, it is different in the austenitic phase (matrix), where the E and H decrease with the increase in load. This might be caused by either the factor of sinking-in behavior or the indentation size effect [34,35]. In order to verify whether the sinking-in behavior occurs, the three-dimensional shape of the indentations at matrix austenitic phase are measured, as shown in Figure 9. It is clear that there is no obvious sinking-in behavior, which indicates that the decrease in H and E with increasing applied load was due to the indentation size effect. Nix-Gao et al. [36,37,38] found that the indentation size effect can be corrected, and the relationship between true nano-hardness H0 and nano-hardness H, as well as between true Young’s modulus E0 and Young’s modulus E, can be written as Equations (7) and (8):
H H 0 2 = 1 + h H h H 2 = H 0 2 + H 0 2 × h H × 1 h
E E 0 4 = 1 + h E h E 4 = E 0 4 + E 0 4 × h E × 1 h
where hH* and hE* are both characteristic lengths, which are constants depending on the property of tested material and the shape of the indenter.
The linear regression of nano-hardness and Young’s modulus of the austenitic phase are shown in Figure 10. The true nano-hardness H0 = 2.51 GPa and true Young’s modulus E0 = 135 GPa.
Using dimensional and inverse analysis methods, Ma et al. [39] give the relationship between nano-indentation test results, the yield strength (σy), Young’s modulus (E), hardening exponent (n), and the true yield strength σy0 as follows:
P m a x E h 2 = 2.77 2.11 n σ y E 0.064 ln σ y E 0.42 n
h c h = 0.70 + 0.55 exp ( 2.16 n ) exp 40.32 σ y E
where h c = h κ   P m a x   /   S , κ = 0.75 , and S is material stiffness.
By Equations (9) and (10), the yield strength σy and hardening index n of austenite and σ-phase under different loads can be obtained as shown in Table 2.
It is obvious that, for σ-phase, the yield strength and hardening index are not affected by the increase in load. Therefore, the average value is used as the true yield strength and hardening index, which are σy0 = 2.42 GPa and n = 0.78, respectively. It is worth noting that the σy and n value of σ-phase fluctuate greatly, which will be analyzed later.
However, for the austenitic phase (matrix), although the hardening index is basically constant, the yield strength decreases with the increase in load, which shows an obvious indentation size effect. According to the study of Ma et al. [37], the indentation size effect can be eliminated using Equation (11), and the relationship between yield strength σy and true yield strength σy0 can be written as follows:
σ y = σ y 0 ( 1 + h H h ) f n ( 1 + h E h ) 0.25 0.54 1 2 1 n
Figure 11 shows the fitted curves of yield strength σy and true yield strength σy0. The true yield strength σy0 and hardening index n of austenite are 0.294 GPa and 0.365, respectively.

4. Discussion

4.1. Credibility of Mechanical Properties Obtained by Nano-Indentation Test

Nano-indentation is an excellent method for measuring the mechanical properties of small areas or small precipitates [40,41,42]. However, the credibility of the nano-indentation result and its consistency with macro performance have always been of concern. In order to ensure the consistency of the measurement results obtained by nano-indentation and macro test methods, some researchers [43] used both the nano-indentation and finite element method, and others [44,45] used the method of inverse analysis, combined with data fitting. Studies [46] showed that the indentation size effect could seriously affect the results of nano-indentation measurement. In our previous studies [47,48], we found that, if we first correct the indentation size effect using nano-indentation test data under different loads, then the true hardness, elastic modulus, and yield strength of austenitic stainless steel and titanium alloy can be obtained by the inverse analysis method. The results are in good agreement with the macro mechanical property test results. In this study, the mechanical properties of the σ-phase and austenitic phase were obtained by the same method. As the mechanical properties of σ-phase have not been reported, it is difficult to directly verify whether the mechanical properties of σ-phase measured by nano-indentation are reliable. Therefore, we first verify the credibility of the test method by comparing the consistency between the austenitic phase nano-indentation measurement results and the 304H macro mechanical property measurement results. If the results obtained by these two methods agree well, then the credibility of the method is proven, and the credibility of mechanical properties of σ-phase obtained by this method could be proven indirectly. By comparing the hardness Young’s modulus and yield strength obtained by nano-indentation test (H0 = 2.51 GPa, which is equivalent to about HV = 251 [49,50], E0 = 135 GPa, and σy0 = 0.294 GPa) and macro mechanical test (HV = 245, E = 165 GPa, and σy = 0.32 GPa), it can be concluded that the two hardness values are in good agreement. However, the yield strength and Young’s modulus measured by uniaxial tensile test are ≈10% and 20% higher, respectively, than those measured by the nano-indentation test. This is because the nano-indentation test measures the strength of the austenitic matrix, while the uniaxial tensile test measures the overall strength of the 304H matrix strengthened by the sigma phase. Therefore, it can be determined that, if the influence of σ-phase reinforcement is ignored, the error between the yield strength of the γ-phase matrix measured by the nano-indentation test and uniaxial tensile test will not exceed 10% and 20%, respectively. This indirectly proves that the mechanical properties of σ-phase obtained by the nano-indentation test are reliable.

4.2. Mechanical Properties’ Fluctuation of σ-Phase in the Nano-Indentation Test

Figure 7a shows irregular fluctuations in the measurement results of nano hardness (≈13.3 GPa to 16.5 GPa). Accordingly, the yield strength of σ-phase also showed irregular fluctuations from the minimum value as 1.88 GPa to the maximum as 2.96 GPa (Table 2). In general, uniform and stable phases have consistent mechanical properties, but in our studies, the fluctuation amplitude of hardness and yield strength of σ-phase reaches ≈24% and 50%, respectively. This is due to the non-uniformity of σ-phase itself. Zieliński et al. [51] conducted a linear measurement of element contents across the whole σ-phase and found that the element distributions of Fe and Cr were not uniform. The Cr element content was higher at the edge of σ-phase than in the center, while the distribution of Fe element was just the opposite. In the study of Kumar [26], the concentrations of Cr and Mo for all different aging temperatures were analyzed across σ/γ phase interfaces in different positions and it was found that, in the different σ-phase, the content of Cr or Mo elements fluctuated obviously. They also found that the hardness of the σ-phase varies in the range of 13–16 GPa. This is very similar to our research results in this paper (Figure 2 and Figure 7a).

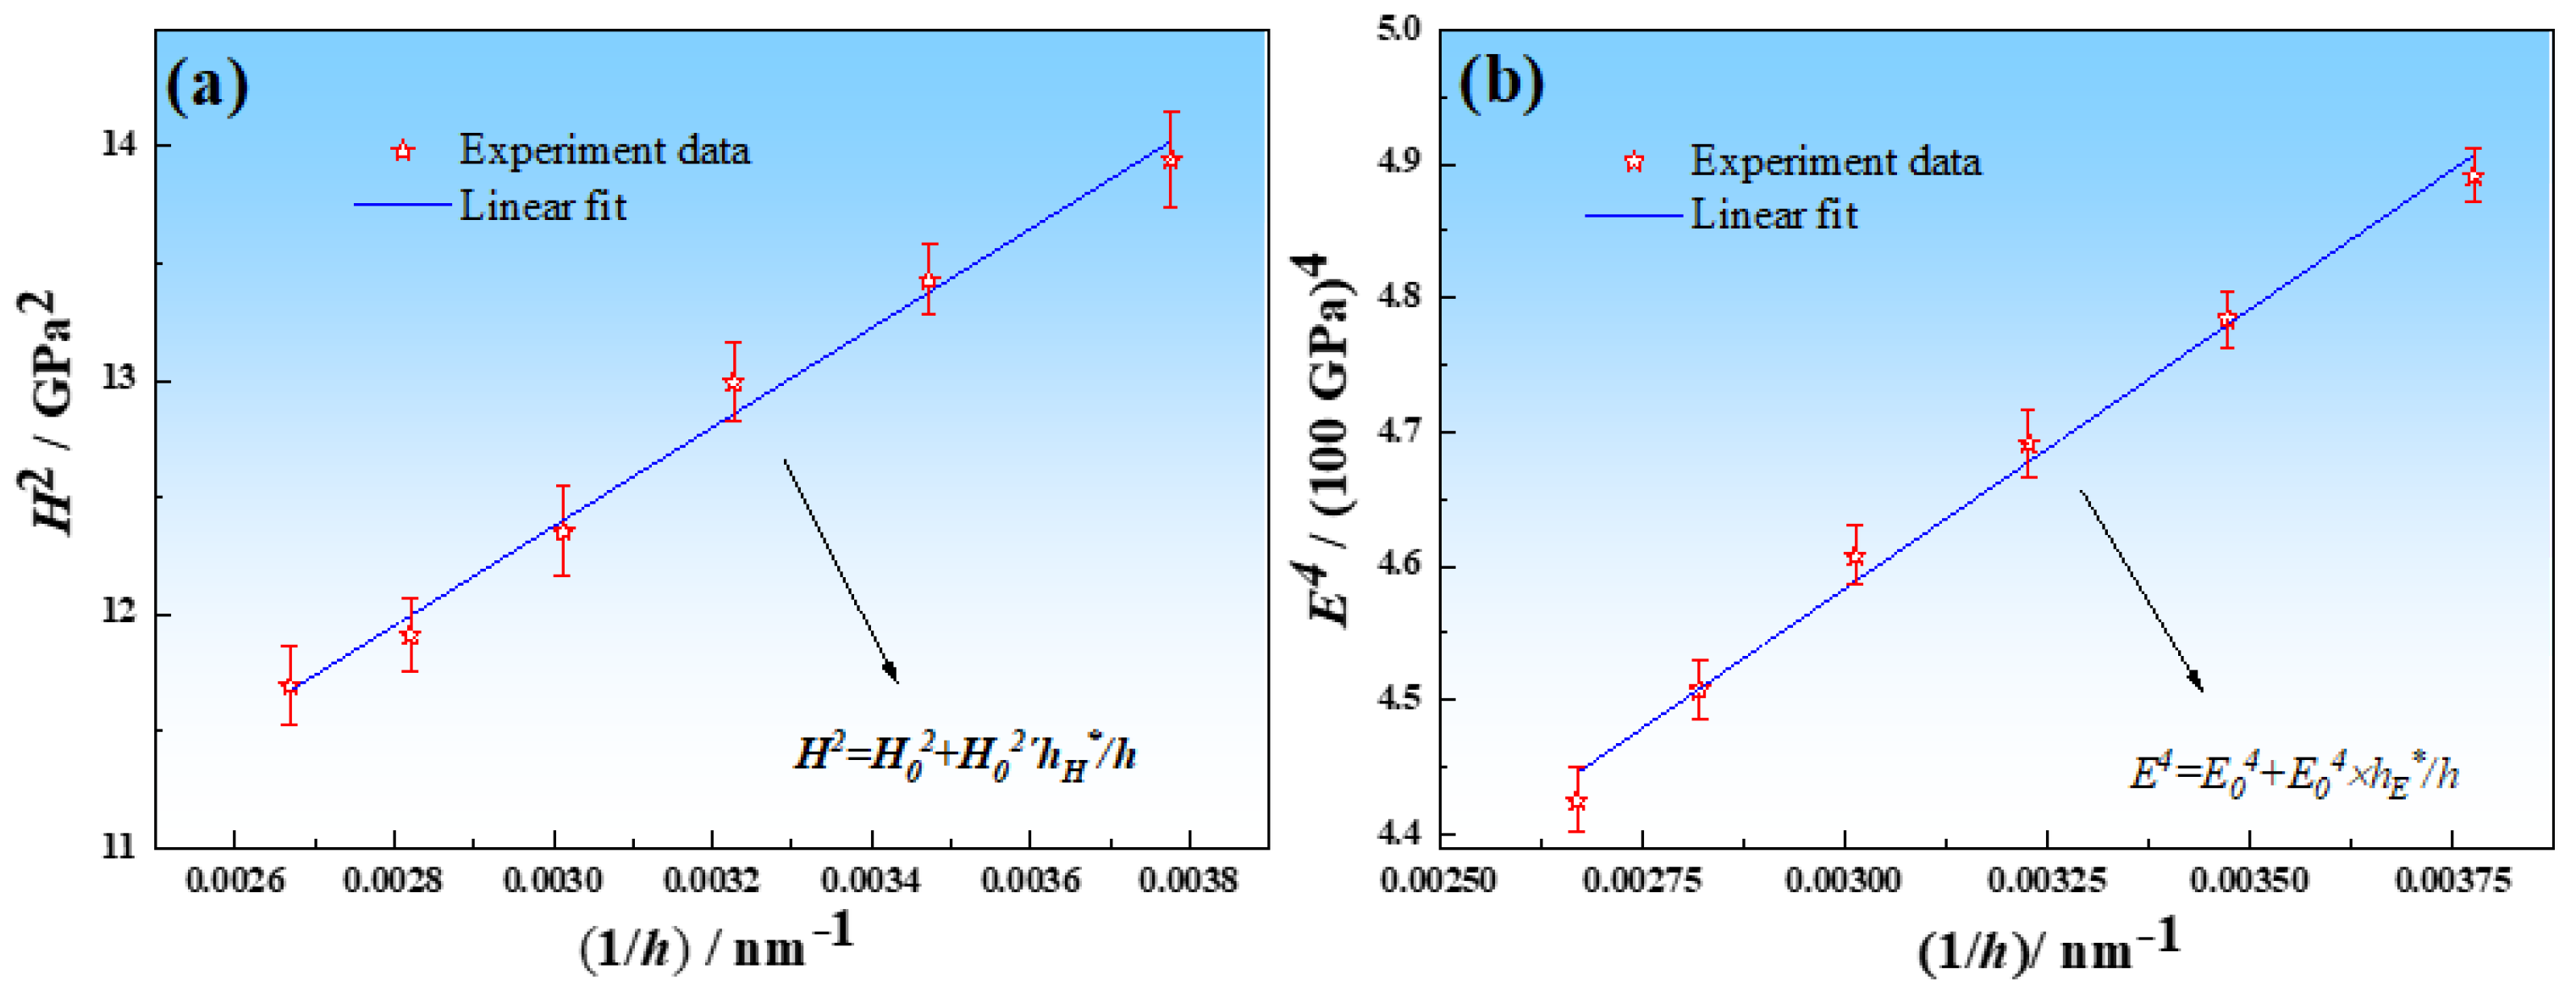
4.3. Analysis of Size Effect in Nano-Indentation

The physical description that hardness is observed to increase with the decreasing indentation size was given earlier by Stelmashenko et al. [52,53]. In 1994, Fleck et al. [54] pointed out that the indentation size effect for metals can be understood by noting that large strain gradients inherent in small indentations lead to geometrically necessary dislocations that cause enhanced hardening. In 1997, Nix and Gao [46] showed an accurate model using the concept of geometrically necessary dislocations:
H H 0 = 1 + h h
where H is the hardness for a given depth of indentation, h; H0 is the hardness in the limit of infinite depth; and h* is a characteristic length that depends on the shape of the indenter, the shear modulus, and H0.
h = 81 2 b x 2 t a n 2 θ ( μ H 0 ) 2  
h* is not a constant for a given material and indenter geometry. Rather, it depends on the statistically stored dislocation density through H0. Nix and Gao also announced that this model suggests that the hardness of a material should not depend strongly on the depth of indentation if the material is intrinsically hard. Specifically, large values of H0 would cause h* to be very small (Equation (13)), and this would cause the hardness to depend less on depth at a given depth of indentation (Equation (12)). They gave the hardness–plastic depth curve of intrinsically hard fused quartz (average hardness is 8.9 GPa), and showed that the hardness is essentially independent of the depth of indentation. In our study, the average hardness H0 of σ-phase is 14.95 GPa, which causes the h* to be smaller. This is why no obvious size effect is observed in the nano-indentation test of σ-phase.

4.4. Effect of σ-Phase Precipitation on Mechanical Properties

Most austenitic steels have a tendency to undergo precipitation hardening. σ-phase is a hard and brittle topologically close packed (TCP) phase, and the precipitation of σ-phase particles during aging will increase the hardness of the steel [55]. This is why the hardness of 304H steel in our study increased from HV 190 to about HV 245. Hardness and strength tend to have the same trend. The tensile results show that the tensile strength of 304H austenitic stainless steel increases from 620 MPa to 710 MPa owing to the existence of σ-phase. This is because σ-phase particles, as non-shearable precipitates, can effectively prevent dislocation movement [56]. The strength and hardness show that σ-phase can be used as a strengthening phase of the material.
Similar to the results of other researchers [51,57,58], we also found that the elongation and impact toughness of the material decreased significantly owing to the precipitation of σ-phase. This is because the presence of σ-phase in the structure could serve as an obstacle to the mobility of dislocation and offer a path for brittle crack propagation, resulting in lower alloy ductility [59,60]. In austenitic stainless steel, it is widely agreed that the interfaces between the matrix and other phases, e.g., δ-ferrite, σ-phase, precipitates, and so on, are recognized as the preferential sites for crack initiation because of strain incompatibility induced by excessive dislocation pile-ups occurring at the interfaces [61,62].
About half a century ago, it was accepted that the impact toughness in steel is strongly dependent on the cracking of precipitates, inclusion, and the second phases [63]. In the particle cracking progress, the initiation sites of cracks are highly related to the distribution, size, volume fraction, and morphology of these particles [64]. In addition, according to the fracture model of the precipitated phase by Smith et al. [65], the larger the size of the precipitated phase, the lower the critical fracture stress of a precipitated phase/matrix interface. The dramatically decreased impact toughness of 304H stainless steel after long-term service should be attributed to the precipitation and coarsening of σ-phase. The dislocation pile-up at a σ/σ and σ/matrix interface thus initiate the microcrack. In Figure 4 and Figure 5, large amounts of micro-cracks are observed between the σ/σ and σ/matrix interface, which shows that these interfaces are the main source of the micro-cracks’ initiation. The easy generation of microcracks leads to a sharp decrease in the toughness of 304H studied in this paper. In addition, Pohl [66] found that the cracking strain of σ-phase is only 2.6%, which can accelerate the occurrence of fracture. They also found that the amount of σ-phases also affects the impact toughness. The impact energy of duplex stainless steels falls from 322 J to 100 J and ≈20 J when precipitated σ-phase content reached 0.5 vol.% and 5 vol.%, respectively. After analysis using Image pro plus software, the σ-phase content in this study is about 3.5%, which is why the impact energy in this study declined from 258 J to 25 J.

5. Conclusions

In this study, the mechanical properties of σ-phase and its effect on the mechanical properties of austenitic stainless steel were studied, and the following major conclusions could be made:
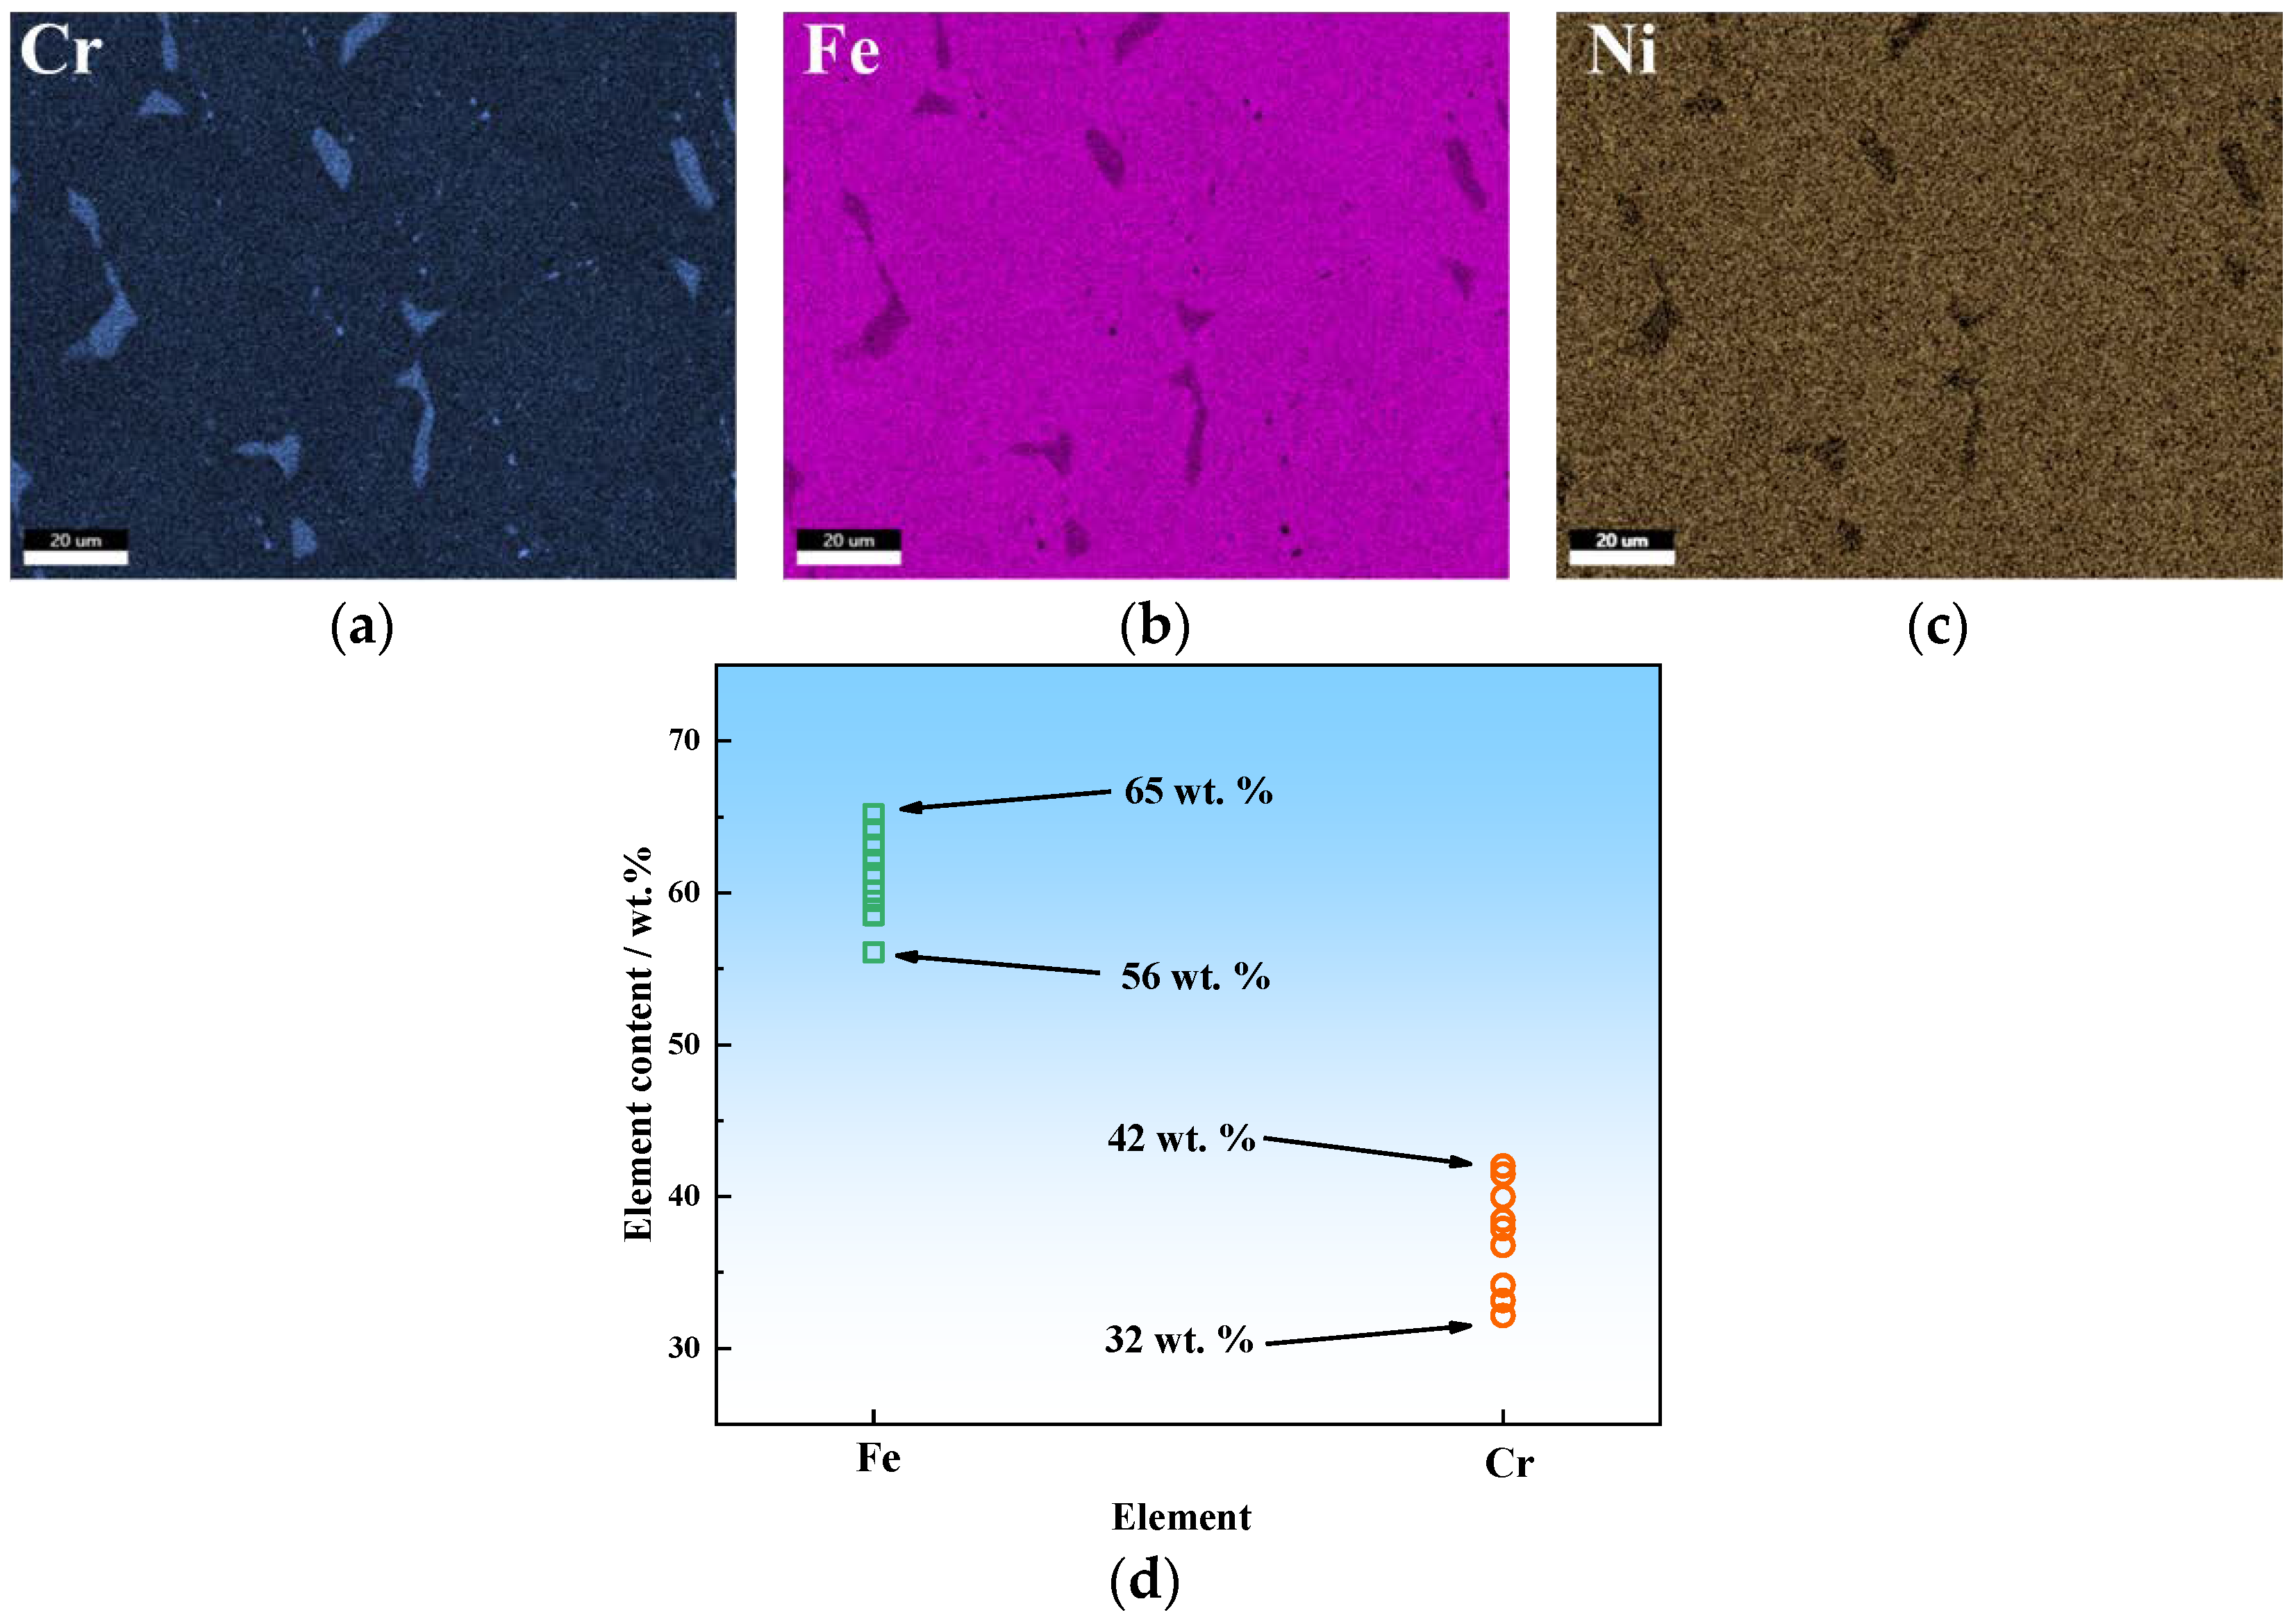
  • σ-phase in 304H is a kind of Fe-Cr intermetallic. In different σ-phases, the Cr and Fe element content is not constant, but varies from ≈32 to 42 wt. % and ≈56 to 65 wt. %, respectively.
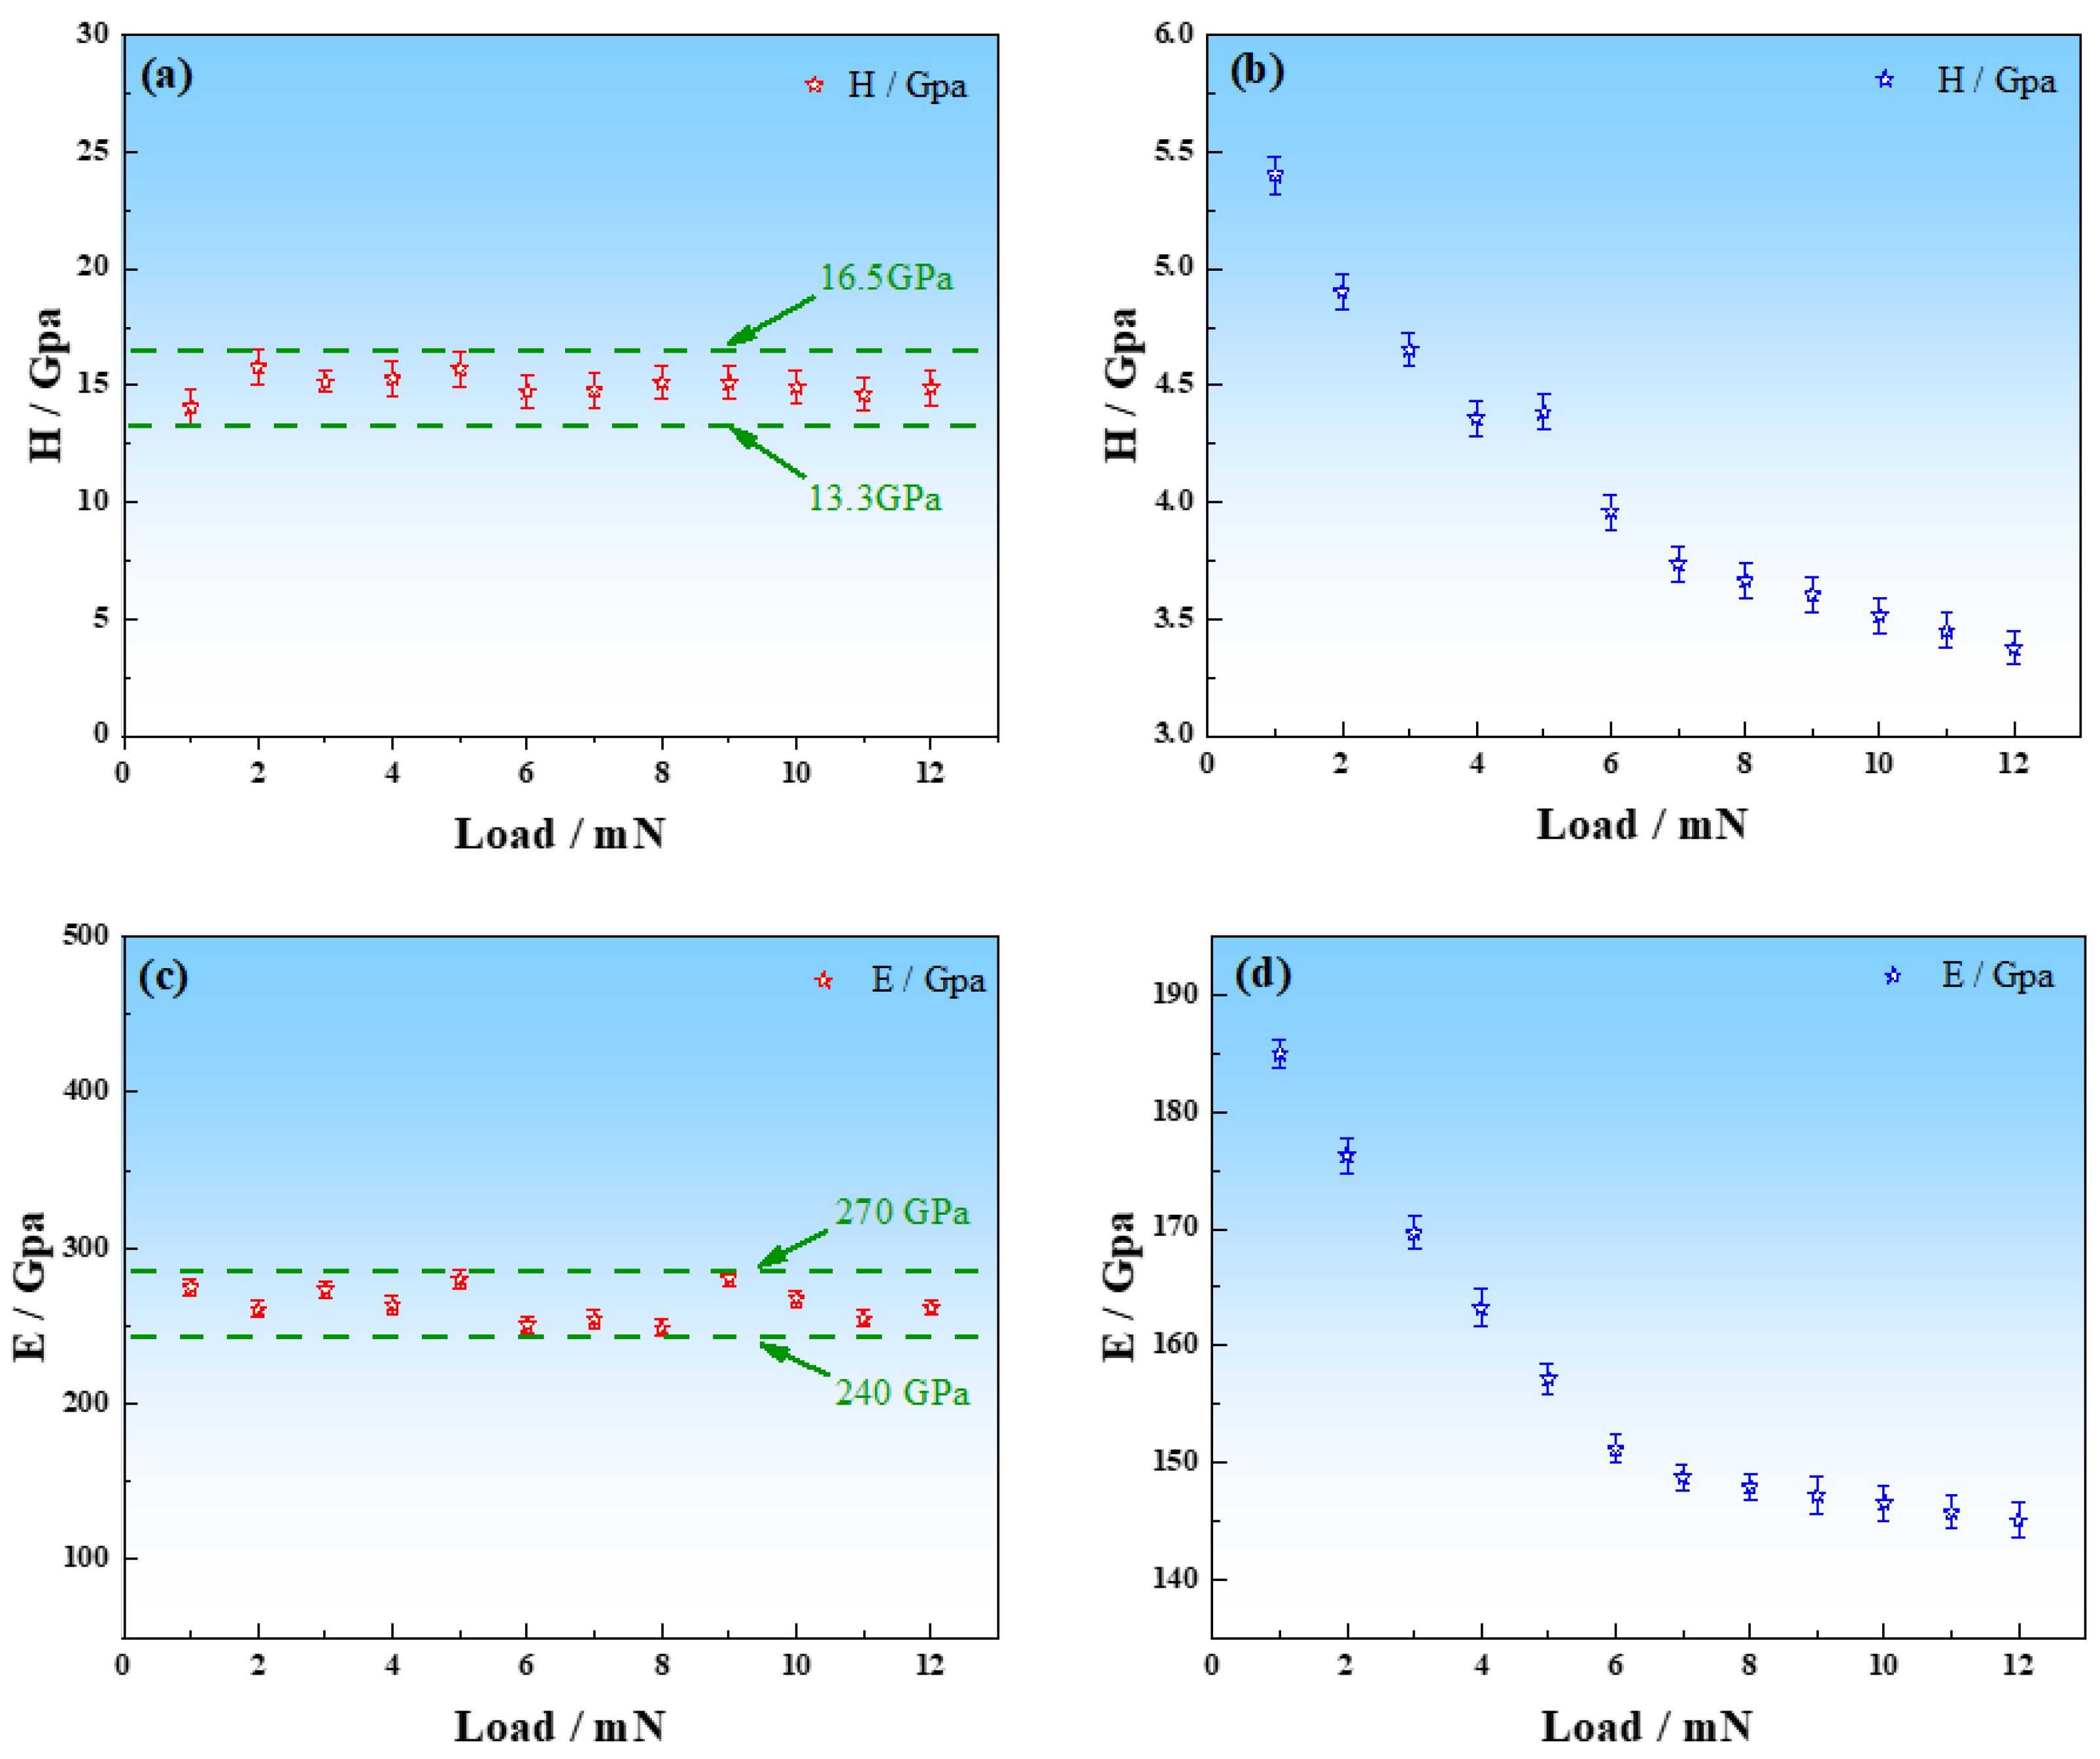
  • Because of the high hardness of σ-phases (13.3 to 16.5 GPa), no obvious size effect is observed in the nano-indentation test of σ-phase. The average true hardness H0, elastic modulus E0, strain hardening exponent n, and yield strength σy of σ-phases are 14.95 GPa, 263 GPa, 0.78, and 2.42 GPa, respectively.
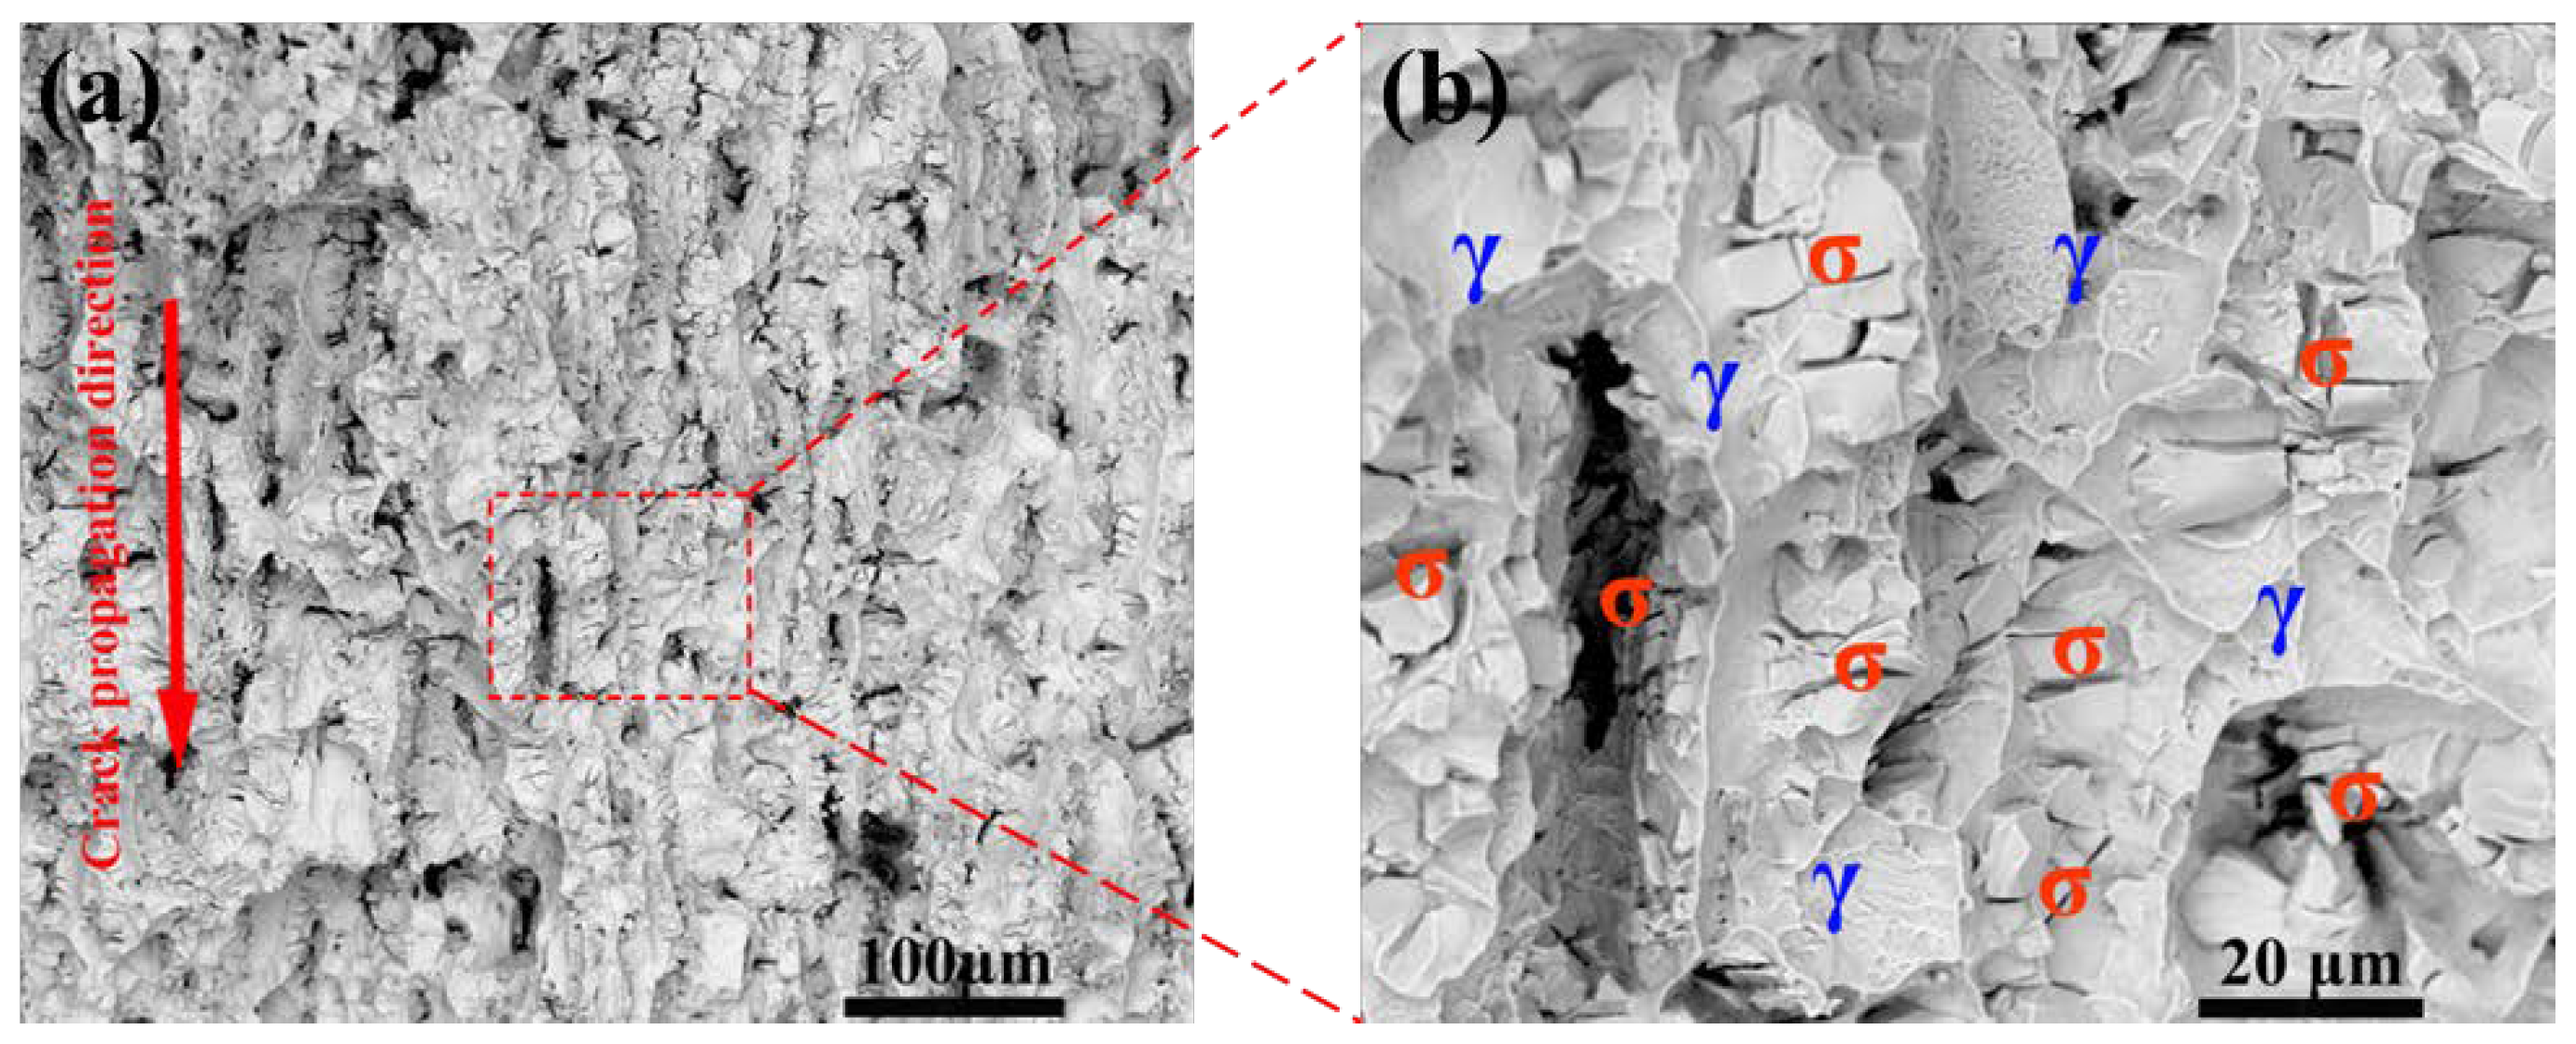
  • Because of precipitation hardening effects, σ-phase leads to the improvement in Vickers hardness, yield strength, and tensile strength of 304H. However, the elongation and impact toughness of 304H are reduced greatly owing to the brittleness of σ-phase.
  • According to this study, the nano-indentation test is a feasible method to study the mechanical properties of small-scale precipitates, such as σ-phase.

Author Contributions

Conceptualization, P.Q.; Methodology, P.T.; Formal analysis, Y.J. and B.L.; Investigation, Y.L.; Data curation, J.X.; Project administration, J.G. All authors have read and agreed to the published version of the manuscript.

Funding

The work is supported by the National Key Research & Development (R&D) Program of China (2022YFF0605600) and Postgraduate Research & Practice Innovation Program of Jiangsu Province (College Project) (JXSS-019).

Institutional Review Board Statement

Not applicable.

Informed Consent Statement

Not applicable.

Data Availability Statement

Not applicable.

Conflicts of Interest

The authors declare no conflict of interest.

References

  1. Hsieh, C.C.; Wu, W. Overview of intermetallic sigma (σ) phase precipitation in stainless steels. Int. Sch. Res. Not. 2012, 2012, 732471. [Google Scholar] [CrossRef]
  2. Bergman, G.; Shoemaker, D.P. The determination of the crystal structure of the σ phase in the iron–chromium and iron–molybdenum systems. Acta Crystallogr. 1954, 7, 857–865. [Google Scholar] [CrossRef]
  3. Kasper, J.S.; Decker, B.F.; Belanger, J.R. The Crystal Structure of the Sigma-Phase in the Co-Cr System. J. Appl. Phys. 1951, 22, 361–362. [Google Scholar] [CrossRef]
  4. Berne, C.; Sluiter, M.; Kawazoe, Y.; Hansen, T.; Pasturel, A. Site occupancy in the Re-W sigma phase. Phys. Rev. B 2001, 64, 144103. [Google Scholar] [CrossRef]
  5. Silva, C.C.; Farias, J.P.; Miranda, H.C.; Guimaraes, R.F.; Menezes, J.W.; Neto, M.A. Microstructural characterization of the HAZ in AISI 444 ferritic stainless steel welds. Mater. Charact. 2008, 59, 528–533. [Google Scholar] [CrossRef]
  6. Park, C.J.; Ahn, M.K.; Kwon, H.S. Influences of Mo substitution by W on the precipitation kinetics of secondary phases and the associated localized corrosion and embrittlement in 29% Cr ferritic stainless steels. Mater. Sci. Eng. A 2006, 418, 211–217. [Google Scholar] [CrossRef]
  7. Park, S.H.C.; Sato, Y.S.; Kokawa, H.; Okamoto, K.; Inagaki, M. Rapid formation of the sigma phase in 304 stainless steel during friction stir welding. Scr. Mater. 2003, 49, 1175–1180. [Google Scholar] [CrossRef]
  8. Vach, M.; Kuníková, T.; Dománková, M.; Ševc, P.; Čaplovič, L.; Gogola, P.; Janovec, J. Evolution of secondary phases in austenitic stainless steels during long-term exposures at 600, 650 and 800 °C. Mater. Charact. 2008, 59, 1792–1798. [Google Scholar] [CrossRef]
  9. Sieurin, H.; Sandström, R. Sigma phase precipitation in duplex stainless steel 2205. Mater. Sci. Eng. A 2007, 444, 271–276. [Google Scholar] [CrossRef]
  10. Magnabosco, R. Kinetics of sigma phase formation in a duplex stainless steel. Mater. Res. 2009, 12, 321–327. [Google Scholar] [CrossRef]
  11. Chen, T.H.; Yang, J.R. Effects of solution treatment and continuous cooling on σ-phase precipitation in a 2205 duplex stainless steel. Mater. Sci. Eng. A 2001, 311, 28–41. [Google Scholar] [CrossRef]
  12. Duprez, L.; De Cooman, B.C.; Akdut, N. Redistribution of the substitutional elements during σ and χ phase formation in a duplex stainless steel. Steel Res. 2001, 72, 311–316. [Google Scholar] [CrossRef]
  13. Chiu, L.H.; Hsieh, W.C.; Wu, C.H. Cooling rate effect on vacuum brazed joint properties for 2205 duplex stainless steels. Mater. Sci. Eng. A 2003, 354, 82–91. [Google Scholar] [CrossRef]
  14. Chen, T.H.; Weng, K.L.; Yang, J.R. The effect of high-temperature exposure on the microstructural stability and toughness property in a 2205 duplex stainless steel. Mater. Sci. Eng. A 2002, 338, 259–270. [Google Scholar] [CrossRef]
  15. Bain, E.C.; Griffiths, W.E. An introduction to the iron-chromium-nickel alloys. Trans. Aime 1927, 75, 166–211. [Google Scholar]
  16. You, D.; Yang, G.; Choa, Y.H.; Kim, J.K. Crack-resistant σ/FCC interfaces in the Fe40Mn40Co10Cr10 high entropy alloy with the dispersed σ-phase. Mater. Sci. Eng. A 2022, 831, 142039. [Google Scholar] [CrossRef]
  17. Minami, Y.; Kimura, H.; Ihara, Y. Microstructural changes in austenitic stainless steels during long-term aging. Mater. Sci. Technol. 1986, 2, 795–806. [Google Scholar] [CrossRef]
  18. Kington, A.V.; Noble, F.W. σ phase embrittlement of a type 310 stainless steel. Mater. Sci. Eng. A 1991, 138, 259–266. [Google Scholar] [CrossRef]
  19. Acevedo, F.; Sáenz, L. Estudio de la fragilización de un acero inoxidable austenítico AISI 304h con 15 años de servicio expuesto a elevada temperatura. DYNA-Ing. E Ind. 2018, 93, 428–434. [Google Scholar] [CrossRef] [Green Version]
  20. Morris, D. The influence of sigma phase on creep ductility in type 316 stainless steel. Scr. Metall. 1979, 13, 1195–1196. [Google Scholar] [CrossRef]
  21. Babakr, A.M.; Al-Ahmari, A.; Al-Jumayiah, K.; Habiby, F. Sigma phase formation and embrittlement of cast iron-chromium-nickel (Fe-Cr-Ni) alloys. J. Miner. Mater. Charact. Eng. 2008, 7, 127. [Google Scholar] [CrossRef]
  22. Liu, F.; Hwang, Y.H.; Nam, S.W. Precipitation of σ-phase and creep-fatigue behavior of 308L steel weldment. Mater. Sci. Eng. A 2008, 483, 418–421. [Google Scholar] [CrossRef]
  23. Conejero, O.; Palacios, M.; Rivera, S. Premature corrosion failure of a 316L stainless steel plate due to the presence of sigma phase. Eng. Fail. Anal. 2009, 16, 699–704. [Google Scholar] [CrossRef]
  24. Perren, R.; Suter, T.; Uggowitzer, P.; Weber, L.; Magdowski, R.; Böhni, H.; Speidel, M. Corrosion resistance of super duplex stainless steels in chloride ion containing environments: Investigations by means of a new microelectrochemical method: I. Precipitation-free states. Corros. Sci. 2001, 43, 707–726. [Google Scholar] [CrossRef]
  25. Saida, K. Prediction of sigma-phase embrittlement and its influence on repair weldability for type 316FR stainless steel weld metals with different solidification modes. J. Nucl. Mater. 2018, 505, 212–226. [Google Scholar] [CrossRef]
  26. Kumar, S.; Krisam, S.; Jacob, A.; Kiraly, F.; Keplinger, A.; Abart, R.; Povoden-Karadeniz, E. Microstructures and element distributions in an aged hyper duplex stainless steel and corresponding hardness variation. Mater. Des. 2020, 194, 108951. [Google Scholar] [CrossRef]
  27. Ohmura, T.; Tsuzaki, K.; Sawada, K.; Kimura, K. Inhomogeneous nano-mechanical properties in the multi-phase microstructure of long-term aged type 316 stainless steel. J. Mater. Res. 2006, 21, 1229–1236. [Google Scholar] [CrossRef]
  28. Badji, R.; Cheniti, B.; Kahloun, C.; Chauveau, T.; Hadji, M.; Bacroix, B. Microstructure, mechanical behavior, and crystallographic texture in a hot forged dual-phase stainless steel. Int. J. Adv. Manuf. Technol. 2021, 116, 1115–1132. [Google Scholar] [CrossRef]
  29. ASTM A. 370; Standard Test Methods and Definitions for Mechanical Testing of Steel Products. ASTM International: California, USA, 2017.
  30. Jiang, Y.; Li, Y.; Jia, Y.F.; Zhang, X.C.; Gong, J.M. Gradient elastic–plastic properties of expanded austenite layer in 316L stainless steel. Acta Metall. Sin. (Engl. Lett.) 2018, 31, 831–841. [Google Scholar] [CrossRef] [Green Version]
  31. Oliver, W.C.; Pharr, G.M. An improved technique for determining hardness and elastic modulus using load and displacement sensing indentation experiments. J. Mater. Res. 1992, 7, 1564–1583. [Google Scholar] [CrossRef]
  32. Oliver, W.C.; Pharr, G.M. Measurement of hardness and elastic modulus by instrumented indentation: Advances in understanding and refinements to methodology. J. Mater. Res. 2004, 19, 3–20. [Google Scholar] [CrossRef]
  33. Schneider, C.; Fayette, L.; Zacharie-Aubrun, I.; Blay, T.; Sercombe, J.; Favergeon, J.; Chevalier, S. Study of the hardness and Young’s modulus at the fuel-cladding interface of a high-burnup PWR fuel rod by nanoindentation measurements. J. Nucl. Mater. 2022, 560, 153511. [Google Scholar] [CrossRef]
  34. Sadiq, M.; Lecomte, J.S.; Cherkaoui, M. Individual phase mechanical properties at different temperatures of Sn–Ag–Cu lead-free solders incorporating special pileup effects using nanoindentation. J. Electron. Packag. 2015, 137, 031005. [Google Scholar] [CrossRef]
  35. Swadener, J.G.; George, E.P.; Pharr, G.M. The correlation of the indentation size effect measured with indenters of various shapes. J. Mech. Phys. Solids 2002, 50, 681–694. [Google Scholar] [CrossRef]
  36. Ma, Z.S.; Zhou, Y.C.; Long, S.G.; Lu, S.C. An inverse approach for extracting elastic–plastic properties of thin films from small scale sharp indentation. J. Mater. Sci. Technol. 2012, 28, 626–635. [Google Scholar] [CrossRef]
  37. Xiao, X.; Terentyev, D.; Chen, Q.; Yu, L.; Chen, L. The depth dependent hardness of bicrystals with dislocation transmission through grain boundaries: A theoretical model. Int. J. Plast. 2017, 90, 212–230. [Google Scholar] [CrossRef]
  38. Cheng, Y.T.; Cheng, C.M. Relationships between hardness, elastic modulus, and the work of indentation. Appl. Phys. Lett. 1998, 73, 614–616. [Google Scholar] [CrossRef]
  39. Ma, Z.S. Characterization of Mechanical Properties of Metallic Film by Nanoindentation Method. Ph.D. Thesis, Xiangtan University, Xiangtan, China, 2011. [Google Scholar]
  40. Zhao, Y.R.; Wang, L.; Dong, Y.Y. Micromechanical Properties of Steel-Fiber-Reinforced Cementitious Composites Characterized with Nanoindentation. Adv. Civ. Eng. 2021, 2021, 6673283. [Google Scholar] [CrossRef]
  41. Wang, X.H.; Jacobsen, S.; He, J.Y.; Zhang, Z.L.; Lee, S.F.; Lein, H.L. Application of nanoindentation testing to study of the interfacial transition zone in steel fiber reinforced mortar. Cem. Concr. Res. 2009, 39, 701–715. [Google Scholar] [CrossRef]
  42. Xu, L.; Yu, H.; Chi, Y.; Deng, F.; Hu, J. Nano-indentation character of interfacial transition zone between steel fiber and cement paste. J. Chin. Ceram. Soc. 2016, 44, 1134–1146. [Google Scholar] [CrossRef]
  43. Giannakopoulos, A.E.; Suresh, S. Theory of indentation of piezoelectric materials. Acta Mater. 1999, 47, 2153–2164. [Google Scholar] [CrossRef]
  44. Xiao, G.; Ma, Y.; Ji, X.; Wang, T.; Shu, X.; Liu, E. Effective acquisition of elastoplastic and creep parameters of lead-free solder alloy from high-temperature micro-indentation eliminating the size effect. Mech. Mater. 2021, 160, 103985. [Google Scholar] [CrossRef]
  45. Huang, Y.; Zhang, F.; Hwang, K.C.; Nix, W.D.; Pharr, G.M.; Feng, G. A model of size effects in nano-indentation. J. Mech. Phys. Solids 2006, 54, 1668–1686. [Google Scholar] [CrossRef]
  46. Nix, W.D.; Gao, H. Indentation size effects in crystalline materials: A law for strain gradient plasticity. J. Mech. Phys. Solids 1998, 46, 411–425. [Google Scholar] [CrossRef]
  47. Jiang, Y.; Wu, Q.; Li, Y.; Peng, Y.W.; Gong, J.M. Mechanical properties of low-temperature gaseous carburizated layer in 316L stainless steel based on nano-indentation and four-point bending tests. Surf. Coat. Technol. 2020, 387, 125501. [Google Scholar] [CrossRef]
  48. Fei, H.; Pan, B.; Zhang, C.; Jiang, Y.; Xu, Q.; Lu, Y.; Gong, J. Study on the mechanical properties gradient in surface oxygen diffusion hardened layer of Ti6Al4V alloy. J. Mater. Res. Technol. 2022, 18, 3173–3183. [Google Scholar] [CrossRef]
  49. Yang, Y.; Zhang, C.; Ding, Z.; Su, C.; Yan, T.; Song, Y.; Cheng, Y. A correlation between micro-and nano-indentation on materials irradiated by high-energy heavy ions. J. Nucl. Mater. 2018, 498, 129–136. [Google Scholar] [CrossRef]
  50. ISO 14577-1; Metallic Materials—Instrumented Indentation Test for Hardness and Materials Parameters—Part 1. International Organization for Standardization: Geneva, Switzerland, 2002.
  51. Zieliński, A.; Golański, G.; Sroka, M. Evolution of the microstructure and mechanical properties of HR3C austenitic stainless steel after ageing for up to 30,000 h at 650–750 °C. Mater. Sci. Eng. A 2020, 796, 139944. [Google Scholar] [CrossRef]
  52. Stelmashenko, N.A.; Walls, M.G.; Brown, L.M.; Milman, Y.V. STM study of micro-indentations on oriented metallic single crystals. In Mechanical Properties and Deformation Behavior of Materials Having Ultra-Fine Microstructures; Springer: Dordrecht, The Netherlands, 1993; pp. 605–610. [Google Scholar] [CrossRef]
  53. De Guzman, M.S.; Neubauer, G.; Flinn, P.; Nix, W.D. The Role of Indentation Depth on the Measured Hardness of Materials. MRS Online Proc. Libr. 1993, 308, 613–618. [Google Scholar] [CrossRef]
  54. Fleck, N.A.; Muller, G.M.; Ashby, M.F.; Hutchinson, J.W. Strain gradient plasticity: Theory and experiment. Acta Metall. Et Mater. 1994, 42, 475–487. [Google Scholar] [CrossRef]
  55. Tanaka, H.; Murata, M.; Abe, F.; Irie, H. Microstructural evolution and change in hardness in type 304H stainless steel during long-term creep. Mater. Sci. Eng. A 2001, 319, 788–791. [Google Scholar] [CrossRef]
  56. Zhang, L.; Huo, X.; Wang, A.; Du, X.H.; Zhang, L.; Li, W.P.; Zou, N.; Wan, G.; Duan, G.; Wu, B. A ductile high entropy alloy strengthened by nano sigma phase. Intermetallics 2020, 122, 106813. [Google Scholar] [CrossRef]
  57. Yamagishi, T.; Akita, M.; Nakajima, M.; Uematsu, Y.; Tokaji, K. Effect of σ-phase embrittlement on fatigue behaviour in high-chromium ferritic stainless steel. Procedia Eng. 2010, 2, 275–281. [Google Scholar] [CrossRef] [Green Version]
  58. Golański, G.; Lachowicz, M.M. Failure cause analysis for the suspension element of boiler superheater. Eng. Fail. Anal. 2019, 105, 490–495. [Google Scholar] [CrossRef]
  59. Ibrahim, O.H.; Ibrahim, I.S.; Khalifa, T.A.F. Effect of aging on the toughness of austenitic and duplex stainless steel weldments. J. Mater. Sci. Technol. 2010, 26, 810–816. [Google Scholar] [CrossRef]
  60. Guan, K.; Xu, X.; Xu, H.; Wang, Z.W. Effect of aging at 700 °C on precipitation and toughness of AISI 321 and AISI 347 austenitic stainless steel welds. Nucl. Eng. Des. 2005, 235, 2485–2494. [Google Scholar] [CrossRef]
  61. Hong, H.U.; Rho, B.S.; Nam, S.W. A study on the crack initiation and growth from δ-ferrite/γ phase interface under continuous fatigue and creep-fatigue conditions in type 304L stainless steels. Int. J. Fatigue 2002, 24, 1063–1070. [Google Scholar] [CrossRef]
  62. Rho, B.S.; Hong, H.U.; Nam, S.W. The effect of δ-ferrite on fatigue cracks in 304L steels. Int. J. Fatigue 2000, 22, 683–690. [Google Scholar] [CrossRef]
  63. Curry, D.A.; Knott, J.F. Effect of microstructure on cleavage fracture toughness of quenched and tempered steels. Met. Sci. 1979, 13, 341–345. [Google Scholar] [CrossRef]
  64. Li, Z.; Xiao, N.; Li, D.; Zhang, J.; Luo, Y.; Zhang, R. Effect of microstructure evolution on strength and impact toughness of G18CrMo2-6 heat-resistant steel during tempering. Mater. Sci. Eng. A 2014, 604, 103–110. [Google Scholar] [CrossRef]
  65. Curry, D.A.; Knott, J.F. Effects of microstructure on cleavage fracture stress in steel. Met. Sci. 1978, 12, 511–514. [Google Scholar] [CrossRef]
  66. Pohl, M.; Storz, O.; Glogowski, T. σ-phase morphologies and their effect on mechanical properties of duplex stainless steels. Int. J. Mater. Res. 2008, 99, 1163–1170. [Google Scholar] [CrossRef]
Figure 1. TI premier nano-indenter.
Coatings 12 01917 g001
Figure 2. Metallographic images showing the distribution (a) and size of the sigma Fe-Cr precipitates (b).
Coatings 12 01917 g002
Figure 3. Scanning electron microscopy (SEM) images of the 304H stainless steel showing the variation in the proportion of Cr and Fe in the sigma phase in the nine Fe-Cr precipitates examined. (a) is distribution of Cr element in austenite and σ-phase, (b) is distribution of Fe element in austenite and σ-phase, (c) is distribution of Ni element in austenite and σ-phase and (d) is the change in Cr and Fe in the nine σ-phases (the green icon shows the change in the content of Fe element in different σ-phases and the orange icon shows the change in the content of Cr element in different σ-phases).
Coatings 12 01917 g003
Figure 4. Fracture character of tensile test specimen. (a) Fracture surface and (b) side of the specimen. The red arrows indicate cracking in the σ-phase and the blue arrows indicate the separation of the interface between the σ-phase and austenitic phase. σ is σ-phase and γ is austenite.
Coatings 12 01917 g004
Figure 5. Fracture character of the impact test specimen tested at room temperature. (a) Fracture surface and (b) partial magnification.
Coatings 12 01917 g005
Figure 6. Load–displacement curves of the (a) σ-phase and (b) austenitic matrix, in which six nano-indentation loads from 7 mN to 12 mN were applied.
Coatings 12 01917 g006
Figure 7. Impression in situ SPM images in the (a) austenitic matrix and (b) σ-phase.
Coatings 12 01917 g007
Figure 8. Relationship between nano-hardness H and nano-indentation load of the (a) σ-phase and (b) austenitic phase. Relationship between the Young’s modulus E and nano-indentation load of the (c) σ-phase and (d) austenitic phase.
Coatings 12 01917 g008
Figure 9. Three-dimensional shapes of indentations under 12 mN. (a) is the three-dimensional shapes of austenite and (b) is the three-dimensional shapes of σ-phase.
Coatings 12 01917 g009
Figure 10. Linear regression of (a) nano-hardness and (b) Young’s modulus against the inverse of the displacement.
Coatings 12 01917 g010
Figure 11. Relationship between σy and h of the austenitic phase under different loads.
Coatings 12 01917 g011
Table 1. Mechanical properties of 304H.
MaterialYield Strength (σ0.2)/MPaTensile Strength (σs)/MPaElongation (δ)/%Young’s Modulus (E)
GPa
Impact Energy (Akv)/JHardness (HV200)
Average320 ± 5710 ± 839 ± 2160 ± 1025 ± 3245 ± 12
Data on warranty28062059-258190 (HB180)
ASME A213 standard≥220≥520≥35--≤200
Table 2. Yield strength and hardening index of σ-phase and austenite under different loads.
σ-PhasePmax/μN70008000900010,00011,00012,000
σy/MPa2.962.632.12.262.671.88
n0.570.670.750.740.640.87
AustenitePmax/μN70008000900010,00011,00012,000
σy/GPa575.31559.26543.57519.59500.47495.02
n0.360.370.360.360.370.37
Publisher’s Note: MDPI stays neutral with regard to jurisdictional claims in published maps and institutional affiliations.

