Article

Corrosion Behaviour of an Epoxy Resin Reinforced with Aluminium Nanoparticles

1
Department of Chemistry, Faculty of Mining-Geology-Petroleum Engineering, University of Zagreb, 10110 Zagreb, Croatia
2
Department of Welded Structures, Faculty of Mechanical Engineering and Naval Architecture, University of Zagreb, 10000 Zagreb, Croatia
3
Istrian University of Applied Sciences, Riva 6, 52100 Pula, Croatia
*
Author to whom correspondence should be addressed.
Coatings 2022, 12(10), 1500; https://doi.org/10.3390/coatings12101500
Submission received: 6 September 2022 / Revised: 22 September 2022 / Accepted: 4 October 2022 / Published: 8 October 2022
(This article belongs to the Special Issue Thin Films and Coatings for Anti-corrosion Application)

Abstract

:
During exploitation, the properties of the epoxy coating deteriorate and therefore, it is necessary to modify it with metal particles. In this paper, spherical aluminium nanoparticles (Al NP) of 100 nm with 99.9% purity were used to modify the epoxy coating for the better corrosion protection of grey cast iron. Pure Al has a high corrosion resistance and can form a thin protective film that prevents its further oxidation, thus, becoming inert and environmentally friendly. To examine these facts, different concentrations (0.5, 0.75, 1.0, 3.0, and 6.0 wt.%) of Al nanoparticles were dispersed in the epoxy coating. The surface of the modified nanocomposite coating was analysed using scanning electron microscopy (SEM) and energy dispersive spectrometry (EDS). Furthermore, the physical properties such as colour, thickness, hardness, and adhesion to the cast iron surface were tested as well. The same properties were tested by exposing the sample plates to corrosive conditions in the climate chamber. Their anticorrosion properties were investigated using electrochemical impedance spectroscopy (EIS) by their immersion in 3.5 wt.% NaCl solution as a corrosive medium. The coating with 0.75% Al NP showed the best corrosion resistance after 10 days of exposure in salt water, while the sample with 1.0% Al NP showed the best corrosion resistance after exposure to the icing/deicing process.

1. Introduction

Cast iron is a material that is commonly used for drainage pipe systems as it is resistant to varying and moderately high internal pressures [1]. This material has also a high corrosion resistance [2], but when it is exposed to an aggressive medium, it is subject to electrochemical corrosion and a special form of corrosion known as graphitic corrosion or graphitisation of cast iron [3]. The most effective way of dealing with this issue is to apply a multi-layered coating system. For this purpose, epoxy coatings are used as they have good protective barrier properties, high adhesion to the metal substrate [4], are easy to apply, and are not expensive. During the exploitation process, the properties of the epoxy coating deteriorate and this leads to blistering and the creation of micropores and microcracks [5]. Consequently, these organic coatings need to be modified. Organic coatings consist of pigments that are dispersed in a binder; this is usually epoxy resin. Due to the complex composition of the epoxy coatings, it is not possible to predict what effects the ingredients will have on the coating properties as thinners and solvents for paints and varnish mixtures of organic liquids are used [6].
When looking for a new and efficient anticorrosion system, some promising initial results are given by nanocomposite systems. With the development of nanotechnology, researchers have started using nanoparticles to modify epoxy resins. The epoxy coating containing nanoparticles (nanocomposite) showed great improvements, as the nanoparticles have a large specific surface area, are described by a quantum-mechanical method, and show a tunnelling effect [6,7]. Their small size enables the blocking of the micropores and increases the anticorrosion properties [8]. Compared to traditional micro-sized materials, the nanomaterials can more effectively improve the corrosion resistance of the waterborne coating at lower weight percentages [9]. There are different methods of incorporating nanoparticles into the epoxy matrix. Not only the morphology, arrangements, and volume fractions of the nanomaterials have an important effect on the properties of waterborne nanocomposite coatings, but also the dispersion quality of the nanomaterials in the polymer resins is crucial for the properties of the waterborne nanocomposite coatings [9]. According to the research of Shen and co-authors, light mechanical stirring enables the uniform dispersion of 1.0% of silver(II) oxide nanoparticles in pure epoxy resin [6]. Moreover, the author Xavier successfully dispersed the nickel(II) oxide nanoparticles in the polymer matrix at a stirring speed of 3000 rpm and by using acetone as a solvent [10].
By adding nano aluminium, which is a non-toxic material, environmentally friendly coatings can be developed. Several studies have considered the desirable anti-corrosion properties resulting from the addition of nano Al to water-based coatings [11]. The purpose of the study by Bello and co-authors is to achieve the improvement of the mechanical properties of the epoxy resin by using aluminium nanoparticles (Al NP). The authors showed the improvement of the mechanical properties of it, but did not investigate the impact of Al NPs on the corrosive medium [12]. Penna and co-authors dispersed 2.0% and 3.0% Al NPs in alcohol solutions and obtained an epoxy coating with super-hydrophobic properties [13]. Liang and co-authors claimed that the best corrosion protection is achieved with 5 wt.% Al NP using mixers and solvents [14]. The effectiveness of the anticorrosive nanocomposite depends on the properties of the nanoparticles, the barrier property of the polymer matrix, and the dispersion of the nanoparticles. The influence of mechanical mixing on the dispersion of Al NPs in the polymer matrix is presented in this paper. This research showed that this method of nanocomposite preparation can be used to incorporate Al NPs up to 1.0%.
This paper aims to establish the maximum concentration to which the nanocomposite coating can be developed by mechanical mixing of nano- and micro-particles of aluminium without adding solvents. This study is useful because the nanocomposite that is obtained in such a way shows excellent corrosion resistance and extends the life of a pipe. The high electrochemical reactivity and tendency of the aluminium nanoparticles to react with oxygen and moisture cause an oxide layer to form on their surface that prevents further corrosion [15]. Moreover, by using affordable devices for obtaining the nanocomposites, the epoxy coating is affordable for its use in the industry. To achieve a favourable outcome, in this paper, a combination of micro- and nanoparticles was used. A modified epoxy coating was characterised using a scanning electron microscope (SEM) and energy-dispersive X-ray spectroscopy (EDS), whereas the corrosion behaviour was investigated in a simulated marine solution (3.5% NaCl) and through the icing process at −5 °C in the climate chamber. In this study, grey cast iron was investigated.

2. Materials and Methods

2.1. Material

The chemical composition of cast iron is as follows: 1.54 wt.% Si, 24.52 wt.% C, and 73.94 wt.% Fe. The microstructure of the cast iron that was used in this study is shown in Figure 1.
Figure 1 presents a typical microstructure of cast iron containing graphite. The graphite form in the cast iron is classified according to ISO 945-1:2017 [16]. The view of the cast iron microstructure in Figure 1 shows the flake graphite that, according to the standard, is marked as type IA.
To remove corrosion products from the metal substrate, ethanol (70 wt.%) was used. Aluminium nanoparticles (100 nm in size) whose chemical composition is shown in Figure 2 were obtained from Guangzhou Hongwu Material Technology Co., Ltd. (Guangzhou, China).
The epoxy coating was prepared using epoxy resin (Bisphenol A, Hempel, Croatia) and hardeners (polyamine, Hempel, Zagreb, Croatia). For removing bubbles from epoxy resin, isopropanol was used.

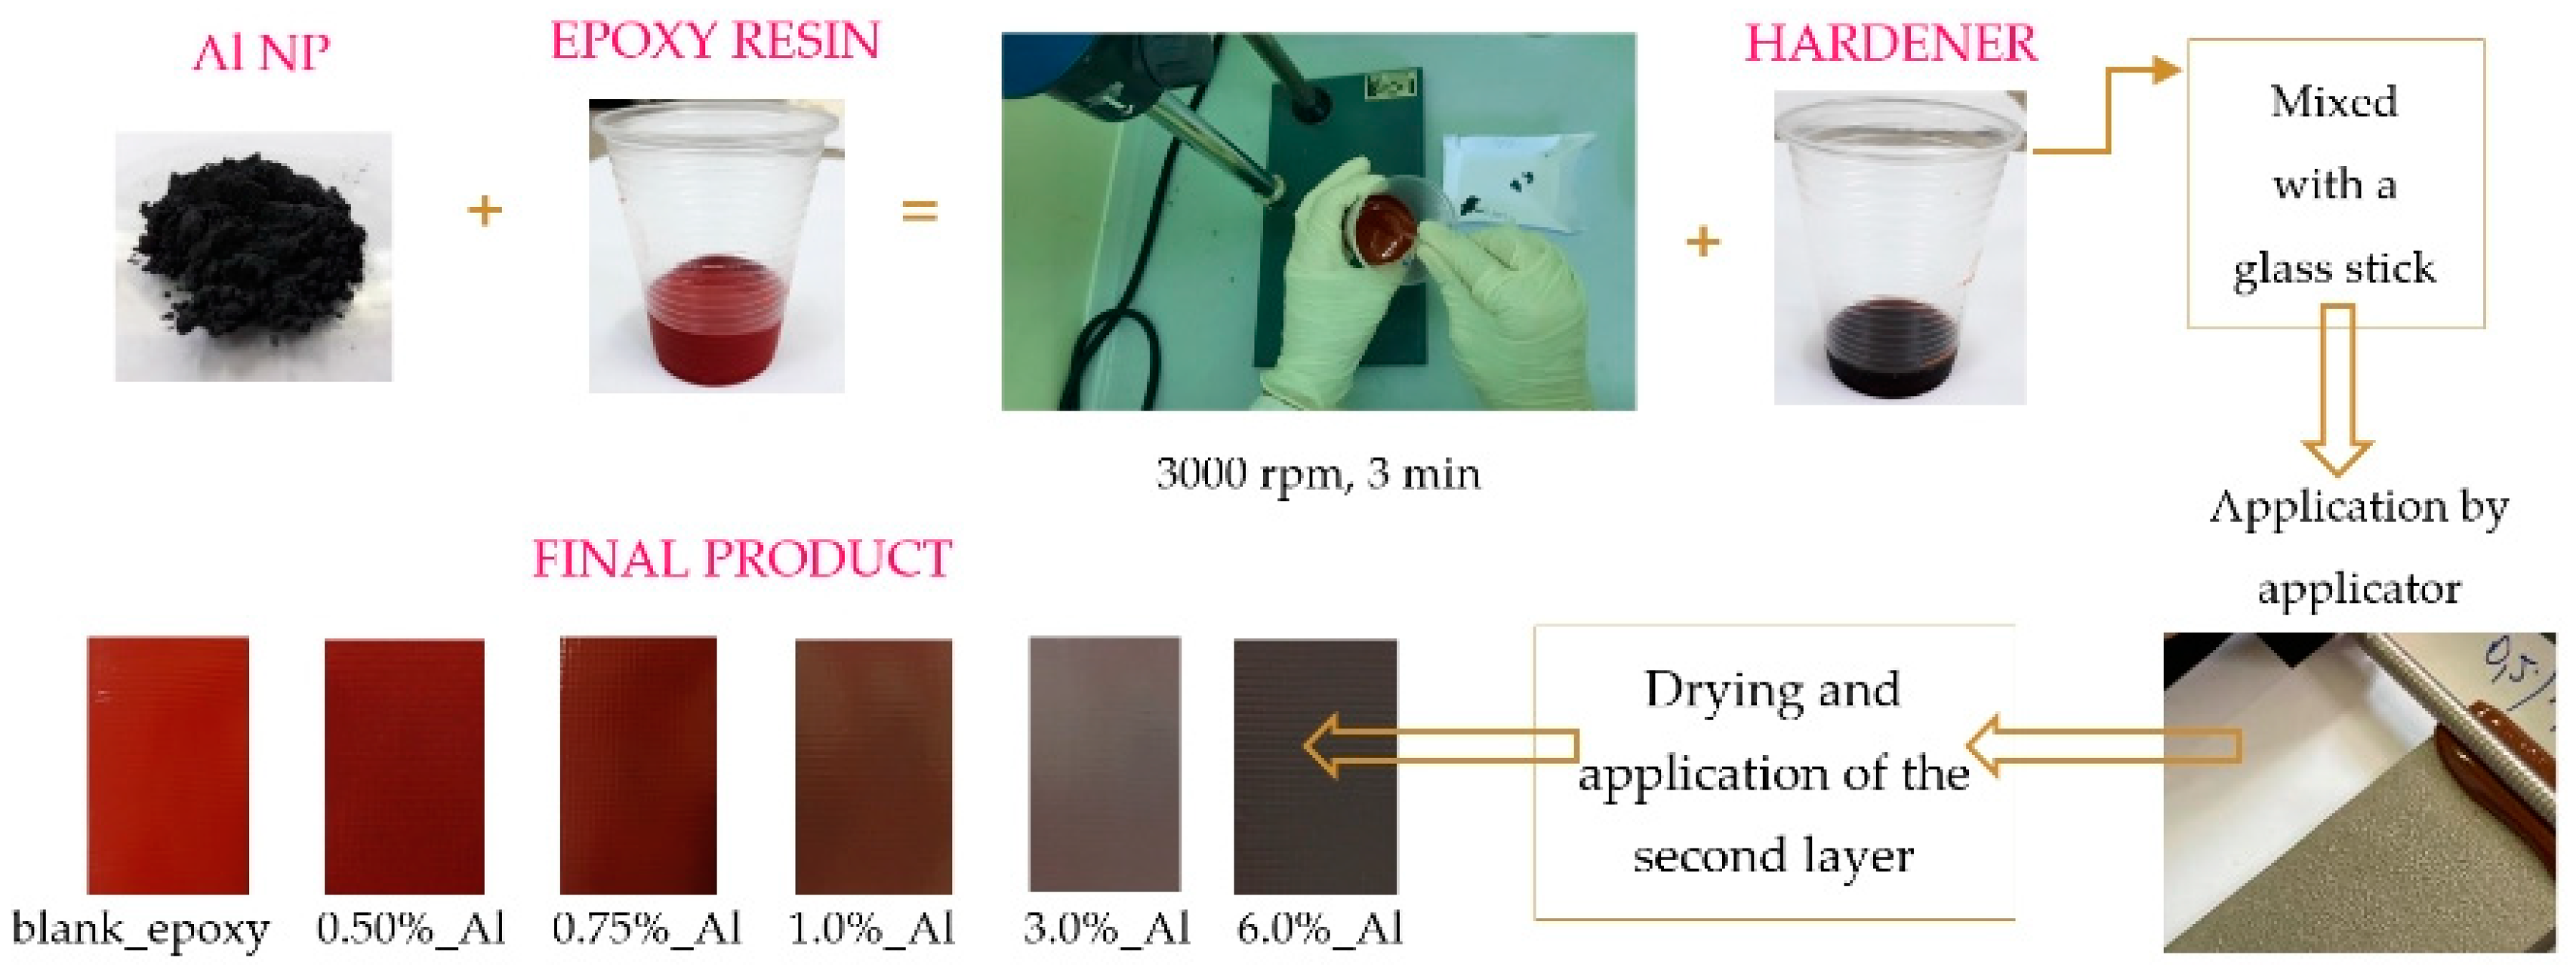
2.2. Preparation of the Epoxy Coatings

Grey cast iron plates with dimensions of 9.5 cm × 0.9 cm × 15 cm were used as substrates. The surfaces of grey cast iron were cleaned with abrasive blasting (Rz of 136.7 μm) and ethanol to remove surface contaminants. To find the best concentration of Al NPs which may improve the anticorrosion protection of the epoxy coating, different weight percentages of Al NPs were dispersed in the epoxy coating. Table 1 shows the composition of the prepared nanocomposites.
Aluminium nanoparticles were added to the epoxy resin and mixed using a glass stick. Thereafter, the nanocomposites were put in a dispersing device (Ika T25, ultra turrax disperser, IKA®-Werke GmbH & Co. KG, Staufen, Germany) at a speed of 3000 rpm for 3 min. After that, the hardener was added, and everything was mixed using a glass stick until a homogeneous mixture was obtained as shown in Figure 3. The epoxy resin and hardener were added in a ratio of 1:4. No solvents were added during the dispersion process. The obtained nanocomposites were applied to a previously degreased grey cast iron substrate using an applicator (150 μm). To remove bubbles in the nanocomposite coating, immediately after the application, the coating was sprayed with isopropanol. Then, the samples were dried at 100 °C for 40 min. After cooling, another layer of nanocomposites was applied in the opposite direction (150 μm applicator). The drying time was the same as for the previous layer. The samples were left at room temperature (25 °C) for 7 days and then tested again (Figure 3).
The homogeneity of the nanocomposite coating layer was investigated using a scanning electron microscope (SEM) (TESCAN Brno, Brno, Czech Republic) at a high vacuum, with 10 kV, a spot size of 3, and a work distance of 6 mm. The size distribution and dispersion of nanoparticles, the homogeneity of the layer, and the occurrence of agglomeration were observed. The microanalysis of the chemical composition of the sample was conducted using the energy-dispersive (EDS, INCA PentaFET, Oxford, United Kingdom) detector.
The change in colour of the nanocomposite coating was determined using RAL colour chart (RAL gGmbH, Siegburger, Germany). Elcometer® 456 (Elcometer Limited, Edge Lane, Manchester, UK) was used to assess the thickness of the nanocoating sample. Measurements were performed on ten different locations per sample. The hardness of the coating was tested according to ISO 868:2003 [17]. The testing was performed using PosiTector SHD Shore Hardness Durometer (DeFlesko Corporation, Ogdensburg, NY, USA). The Elcometer 510 Automatic Pull-Off Adhesion Tester (Elcometer 510, model T, Manchester, UK) was used to measure the strength of the bond between the nanocomposite coating and the grey cast iron substrate. Aluminium dollies (20 mm diameter) were adhered to the topcoat surface using a two-part epoxy adhesive (Araldite resin and Araldite hardener). The coating adhesion was tested after 24 h.
To test the coating stability at low temperatures, the samples were placed in the climatic chamber (Climatic chamber Kambic KK-190 CHLT, CiK Solutions GmbH, Karlsruhe, Germany). The first test cycle lasted 24 h, the samples were placed at 5 °C with 0% humidity. In the second cycle that followed the first one, the temperature was lowered to −5 °C for 2 h. This was followed by an intermediate step where the conditions in the chamber varied from 3 °C/h to 10 °C. The third test cycle at 10 °C and 70% humidity lasted 1440 min. After the icing/deicing process, the physical and chemical properties of samples were tested after they reached room temperature.
Open-circuit potential (OCP) was first obtained over a period of 20 min to study the changes in the corrosion potential of the coatings. Electrochemical Impedance Spectroscopy (EIS) was used to evaluate the resistance of the nanocomposite coating in 3.5% NaCl solution, pH = 7.554, while it was open to the atmosphere. For this purpose, VersaSTAT 3 Potentiostat/Galvanostat (AMETEK Scientific 131 Instruments, Princeton applied research, Berwyn, PA, USA) was used. Measurements were performed in the frequency range from 100 kHz to 0.1 Hz, a potential amplitude of 10 mV at a room temperature of 25 ± 2 °C, while we recorded 10 points per decade. Measurements were conducted using an electrochemical cell with the coated sample as the working electrode of 19.625 cm2. The saturated calomel electrode was used as a reference electrode and the graphite rod as the counter electrode. The ZSimWin software was used to interpret data.
Each measurement was implemented in three replications for checking the repeatability of data.

3. Results and Discussion

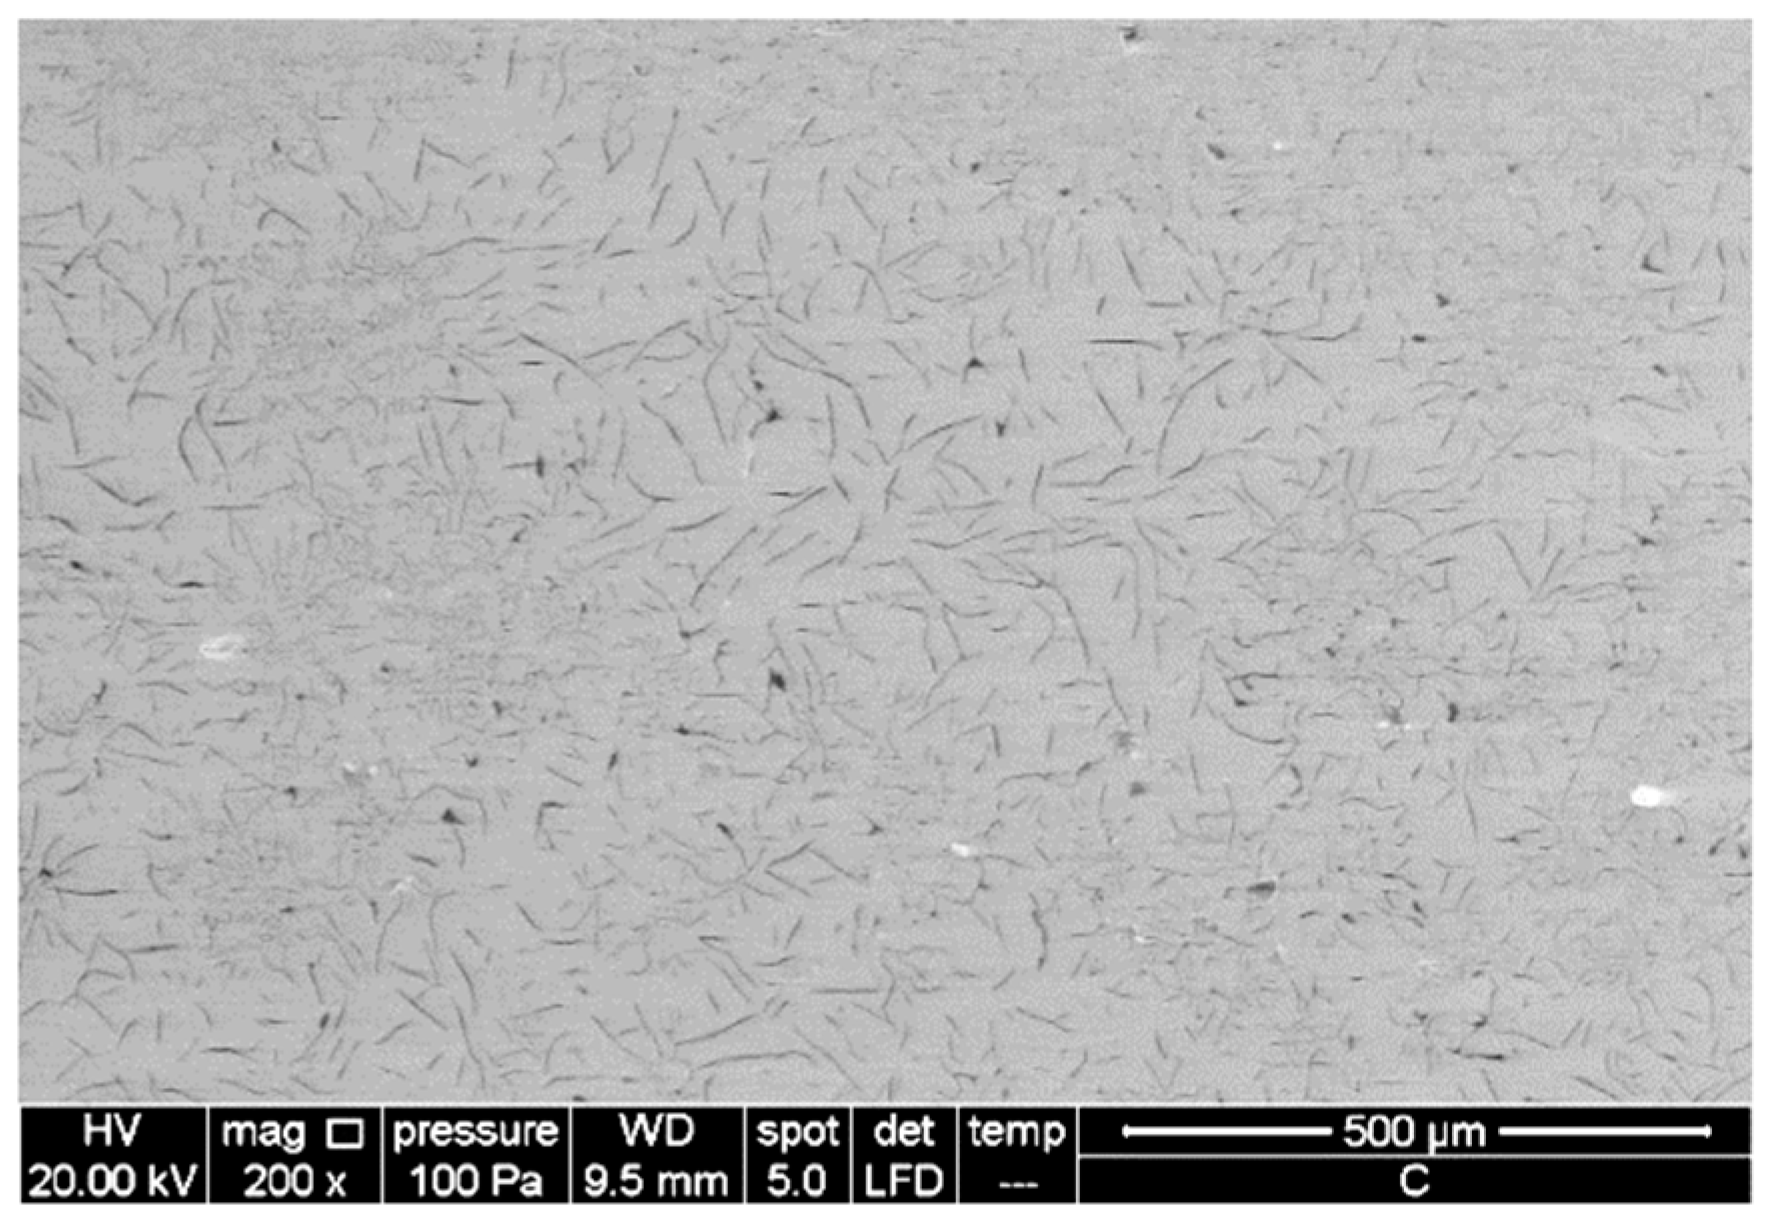
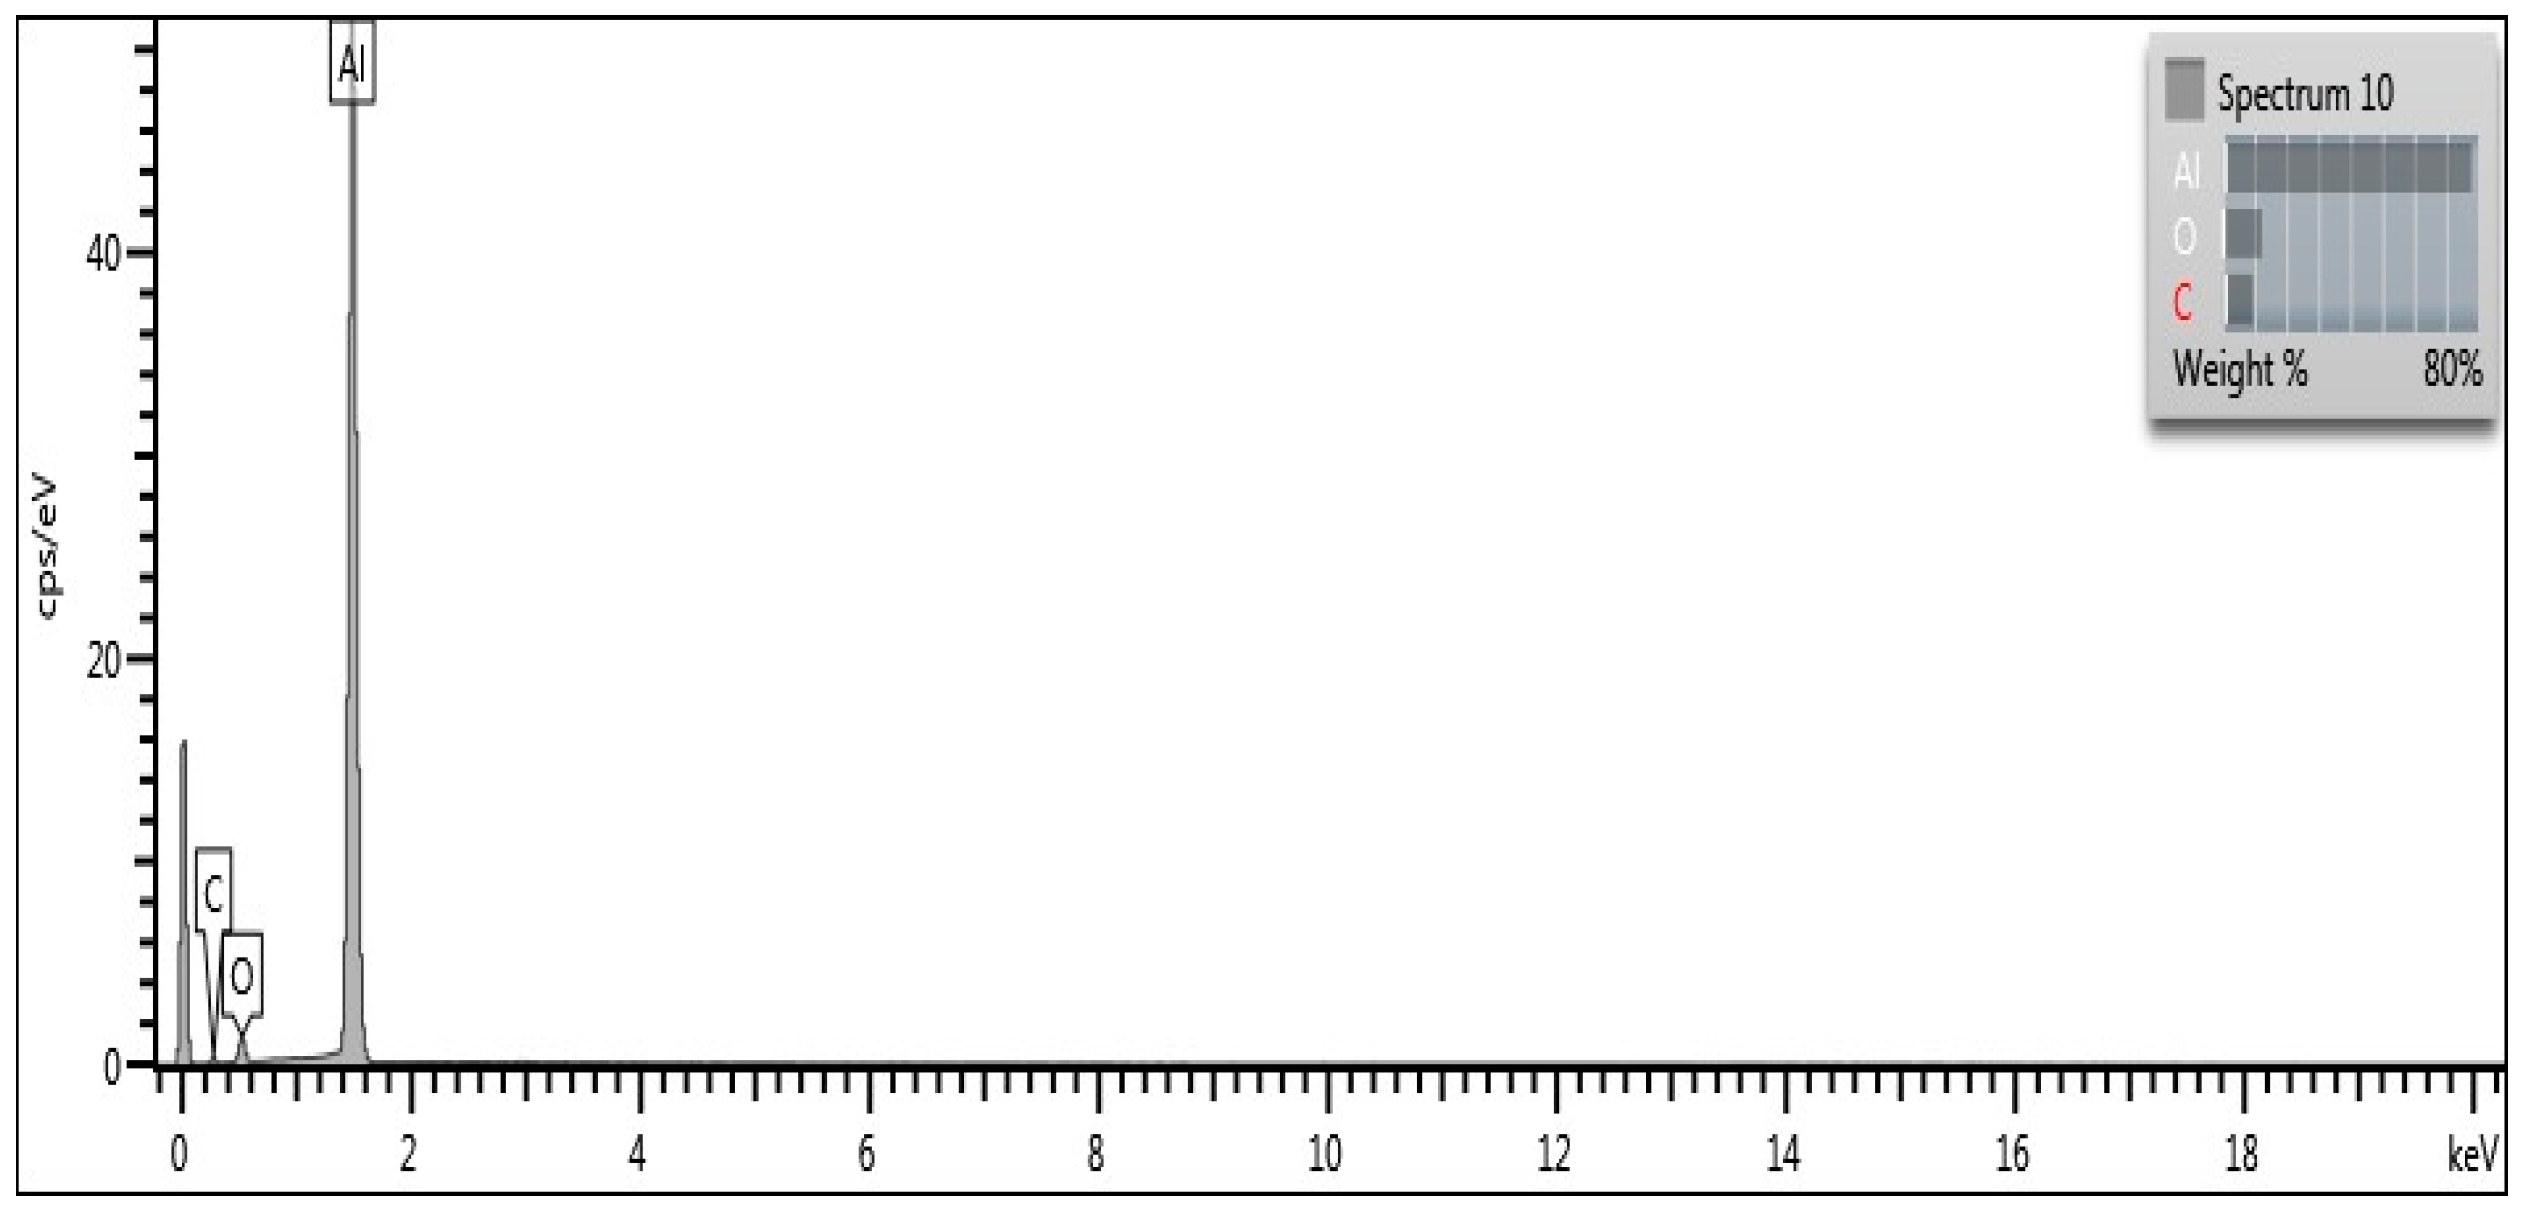
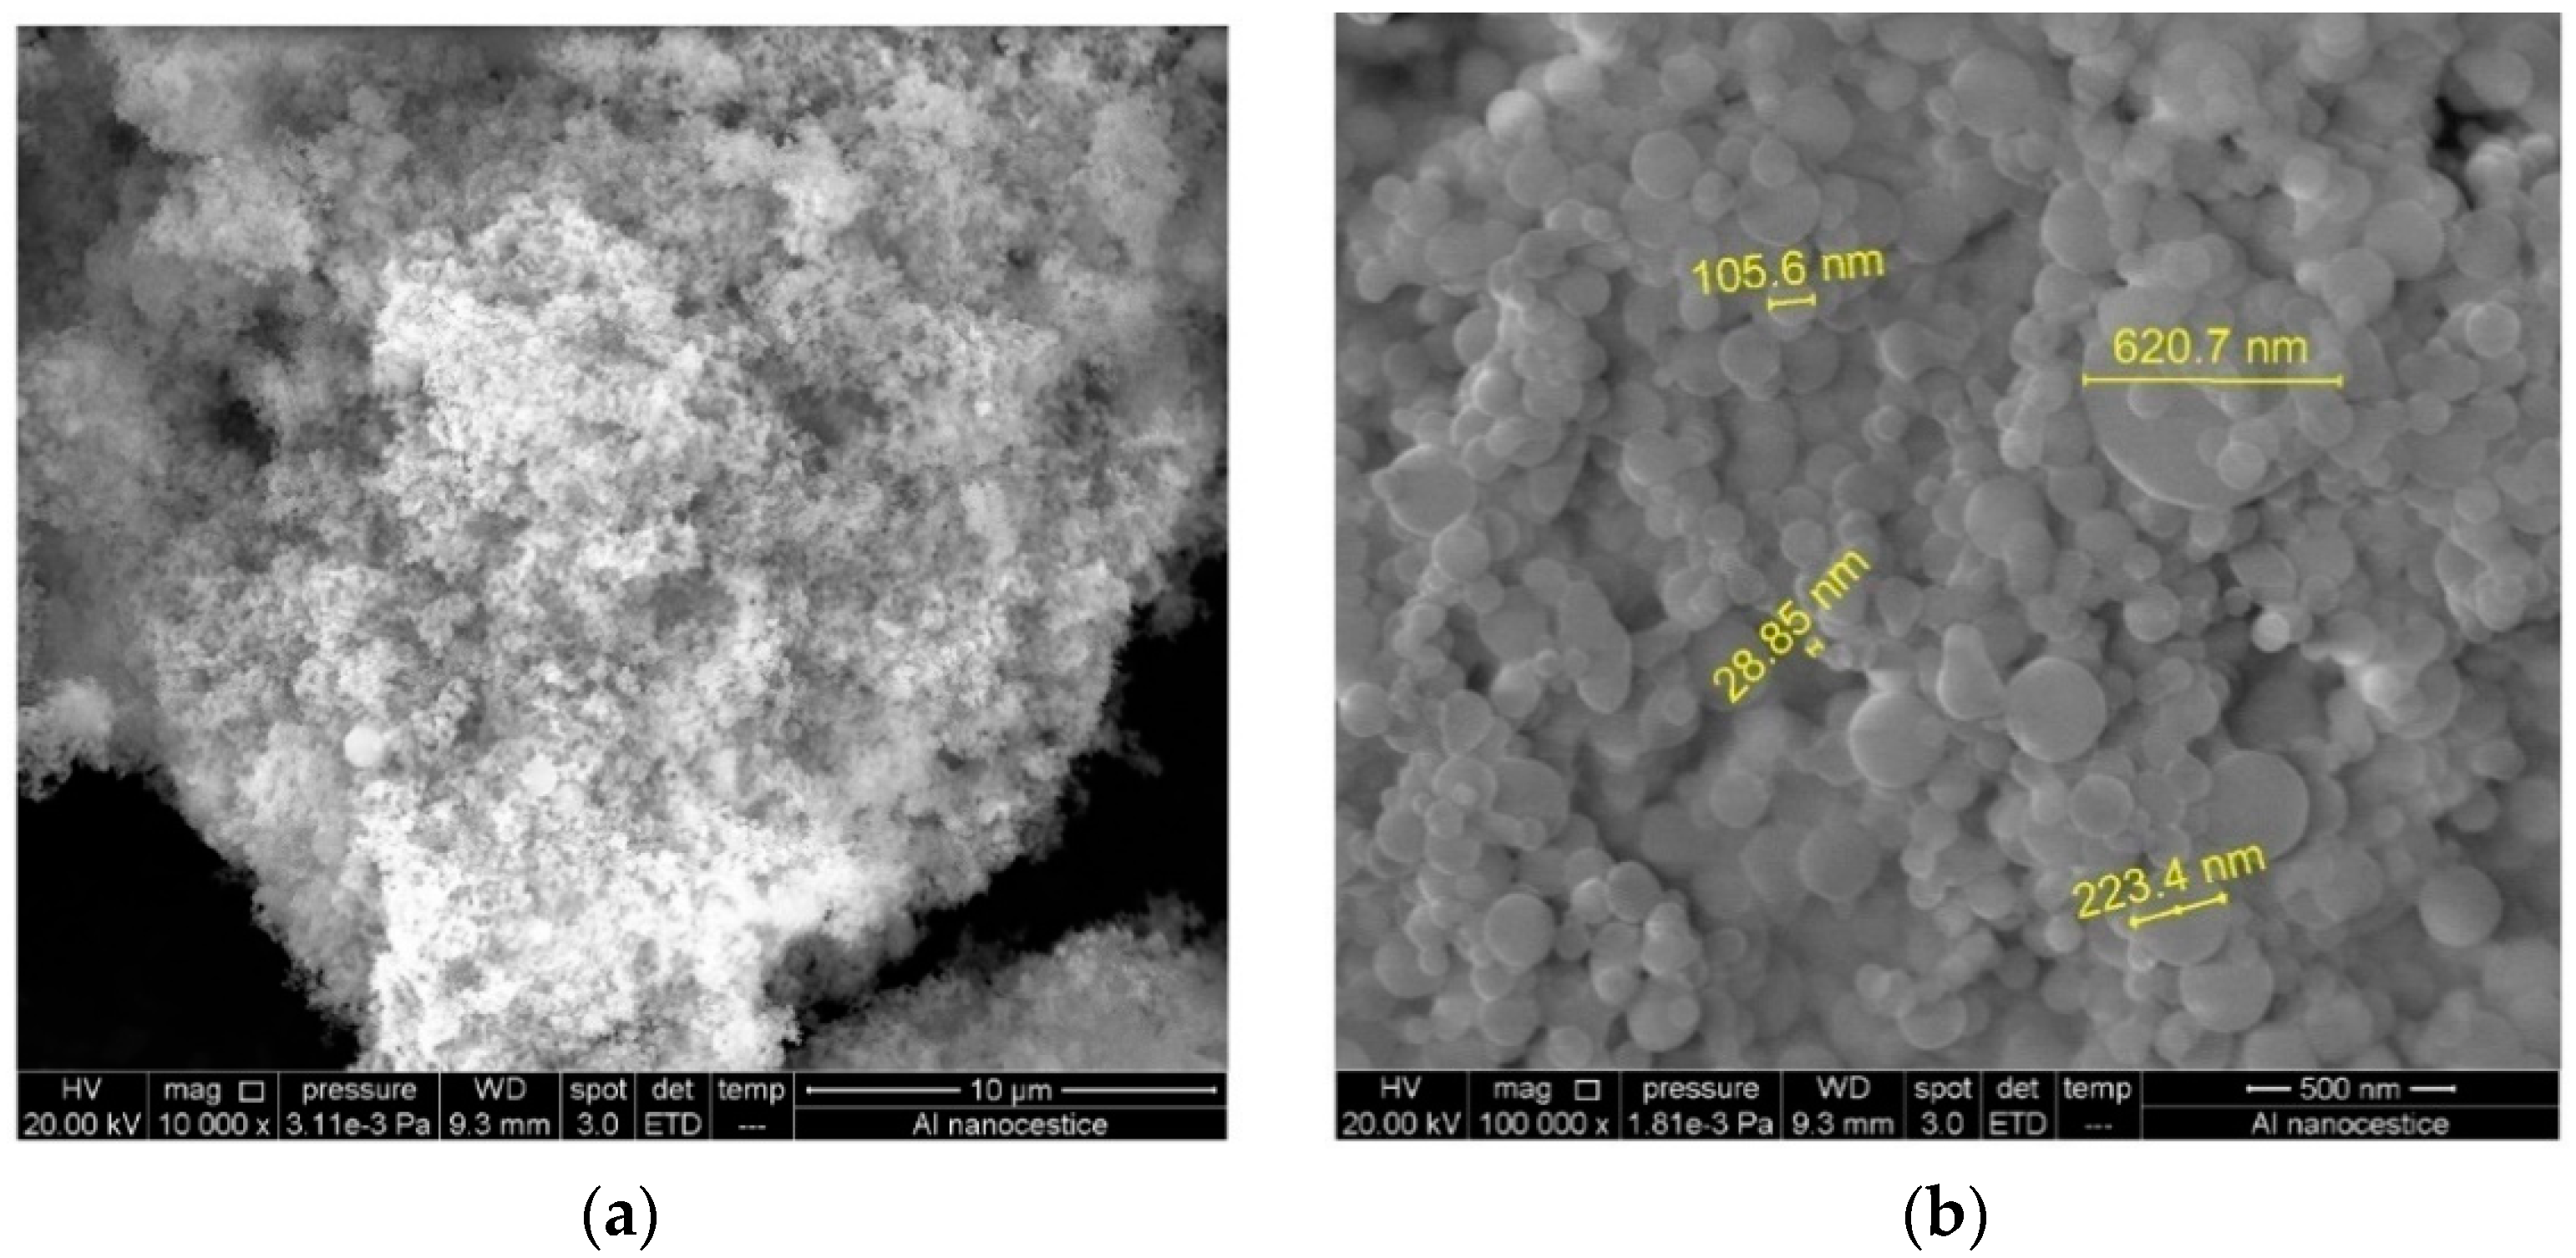
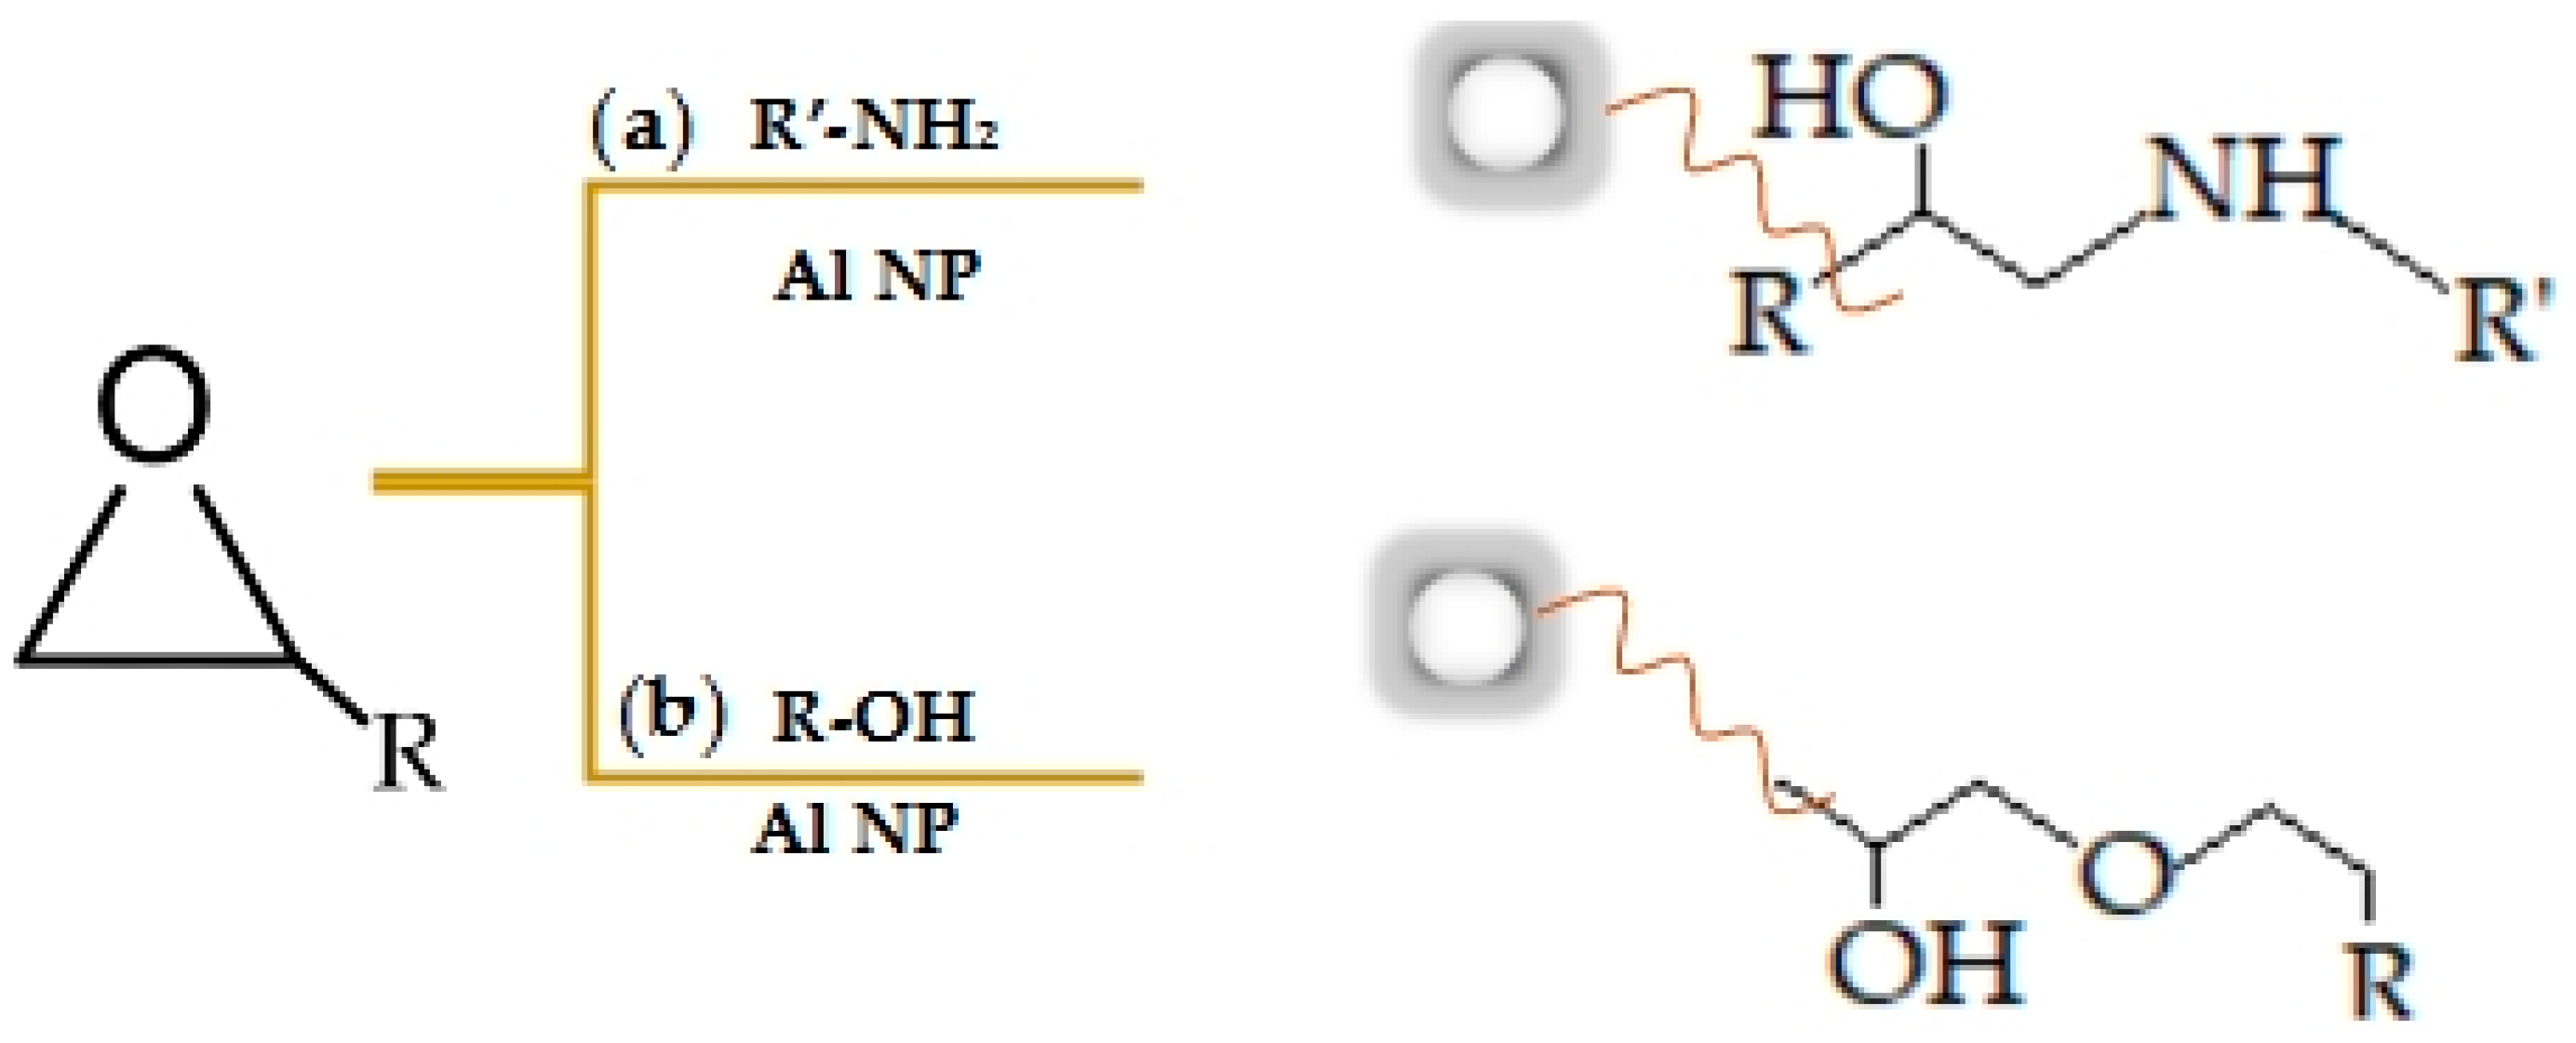
3.1. Characterisation of Aluminium Nanoparticles (Al NP)

The visual analysis showed that the Al NP was dark grey. According to the data that were obtained by the manufacturer (Figure 2), the nanoparticles contained high-purity aluminium (99.92%). The SEM analysis was used to determine the form and the size of Al NPs that were dispersed in the epoxy matrix. The surface morphology of the Al NP is shown in Figure 4.
Figure 4a shows the nanoparticles in the form of a fluffy powder. At a higher magnification (Figure 4b), the spherical particles without pores that formed larger aggregates were visible. The estimated size was around 100 nm. Even though the size of the particles was not evenly distributed, these nanoparticles were characterised by an excellent dispersion and a high degree of hardness. According to the available literature, these nanoparticles belong to the group of zero-dimensional (0D) nanomaterials. Spherical 0D nanoparticles have a tendency for physical or chemical crosslinking with polymer resins, and the high crosslinking density of the water-borne resins is responsible for a high degree of curing. However, the surface activity of 0D nanoparticles is usually high, which leads to their aggregation. The agglomeration of the nanoparticles leads to the creation of new defects in the nanocomposite coating, which not only can damage the performance of the coating barrier, but also lowers its mechanical properties [9]. The tendency of the nanoparticles to form larger agglomerates was observed by adding greater quantities of Al NPs in the epoxy matrix.

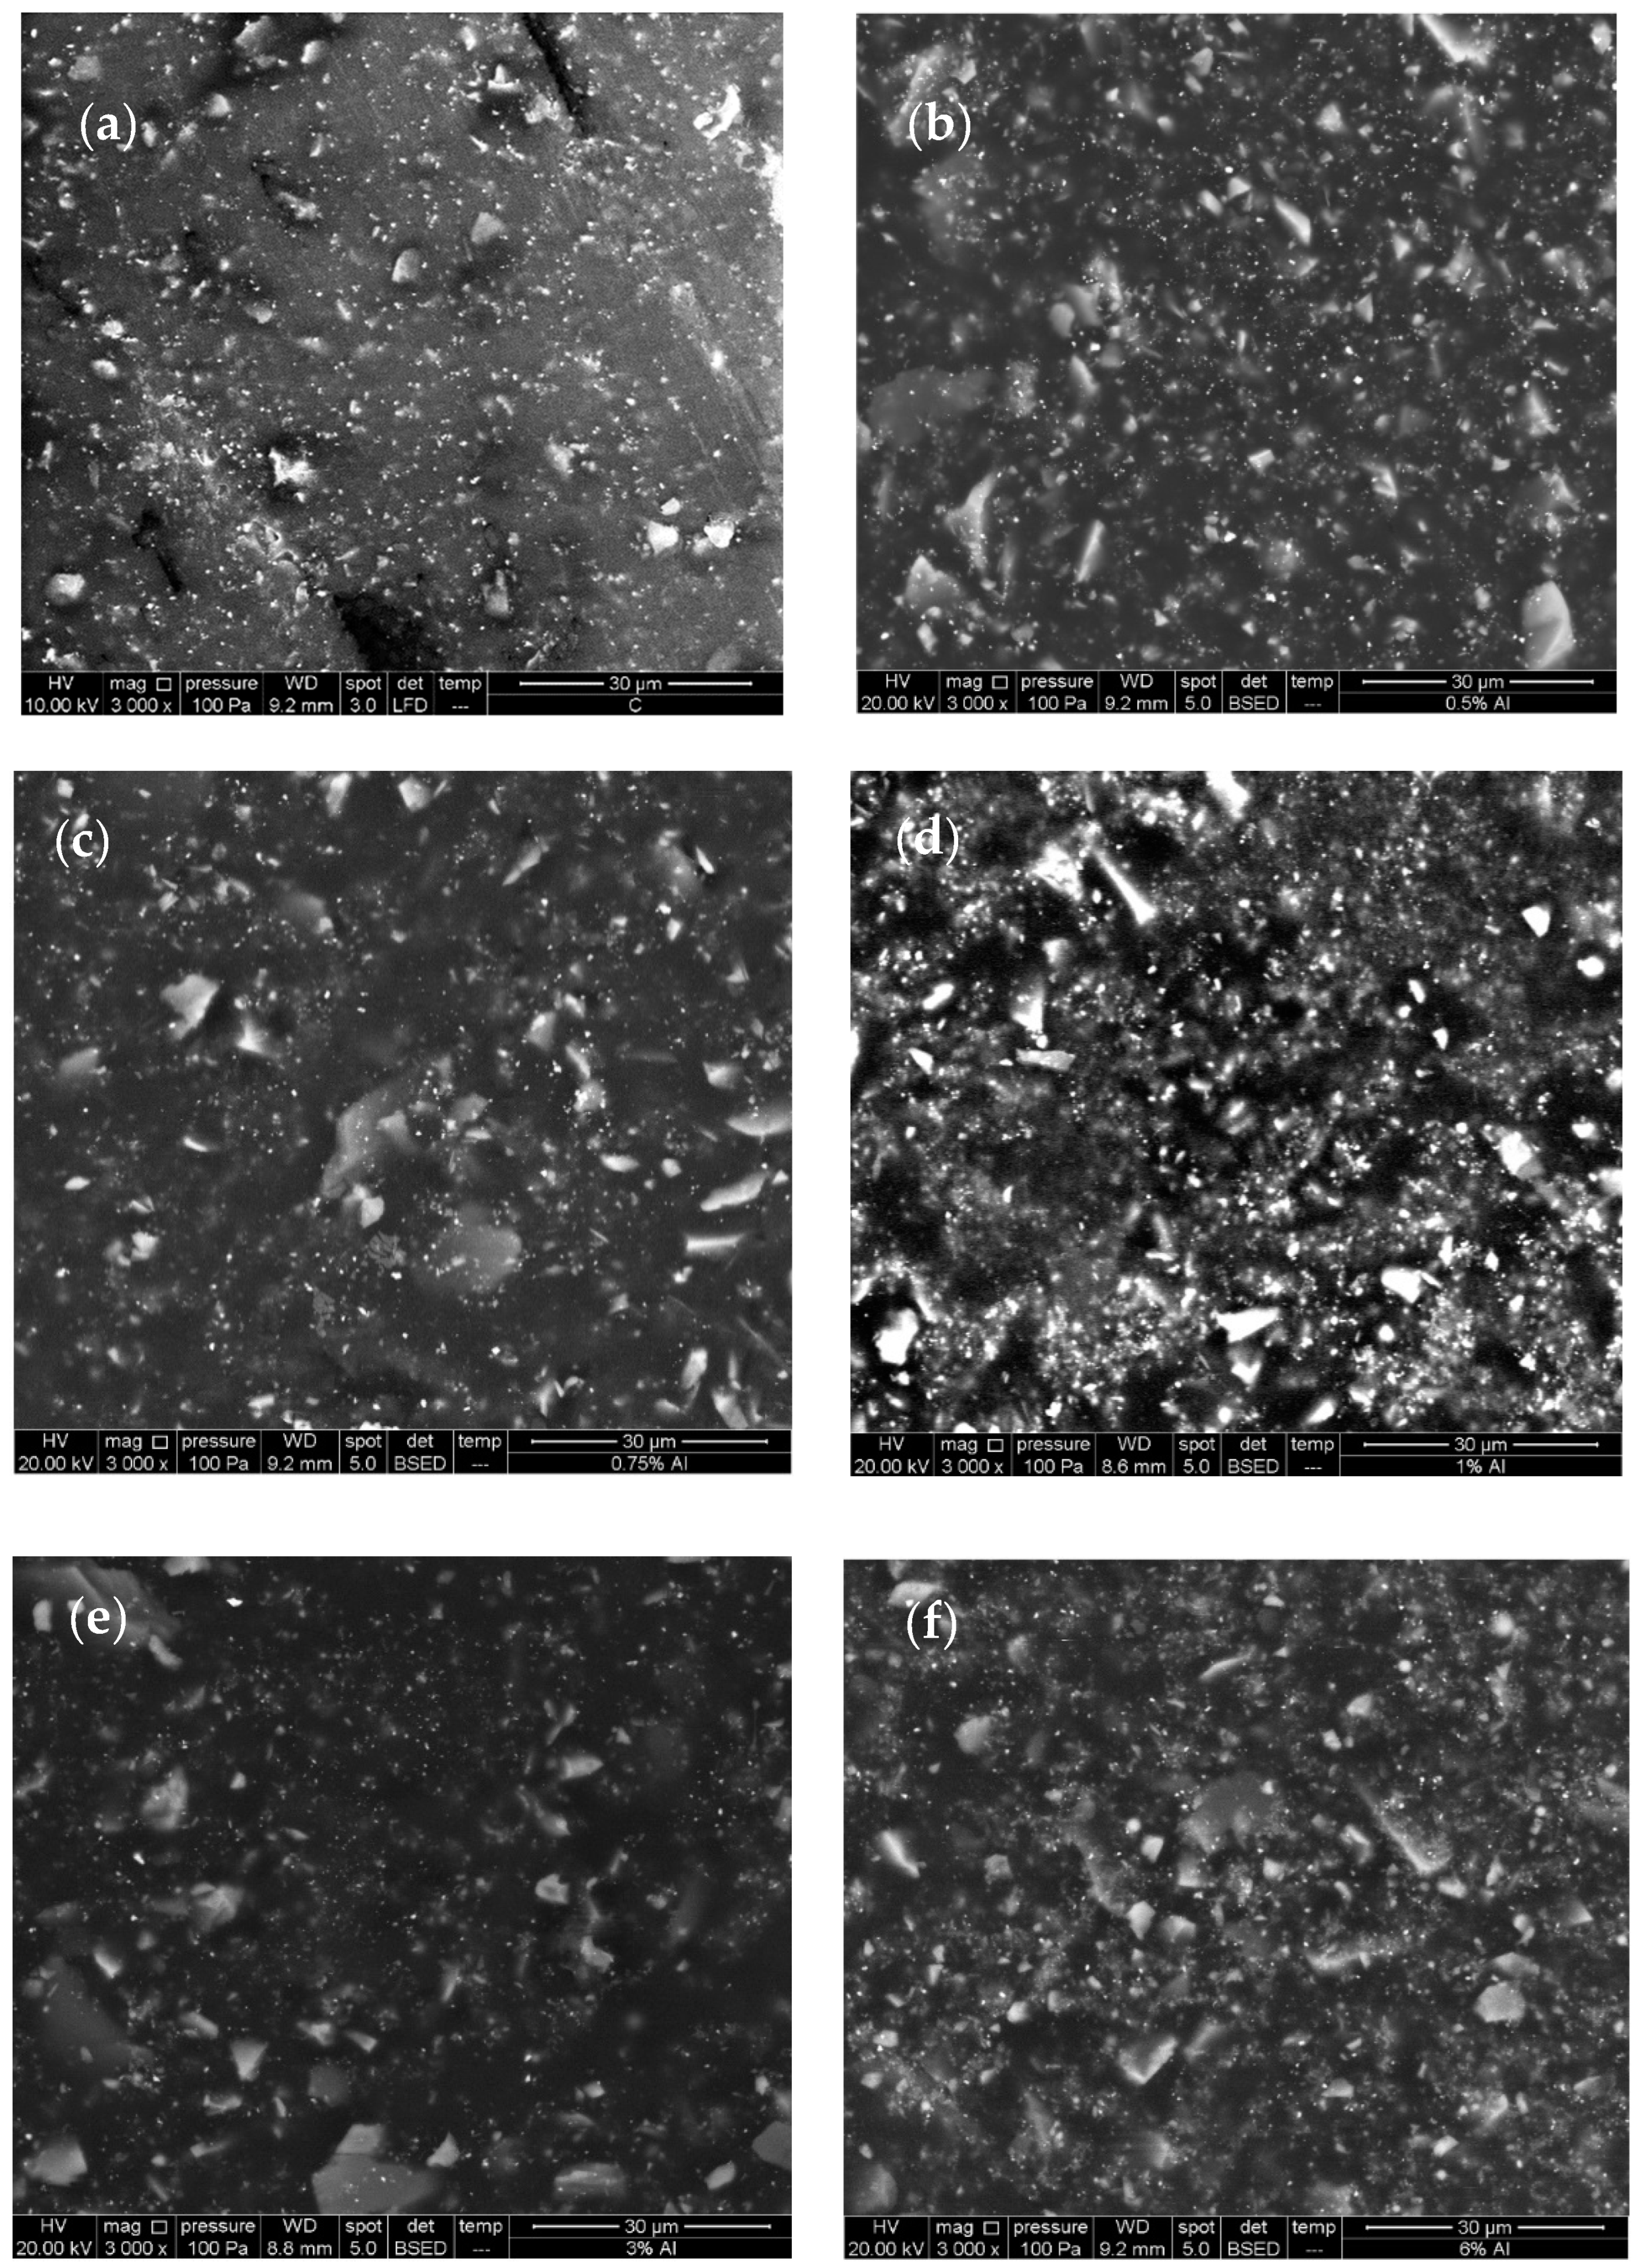
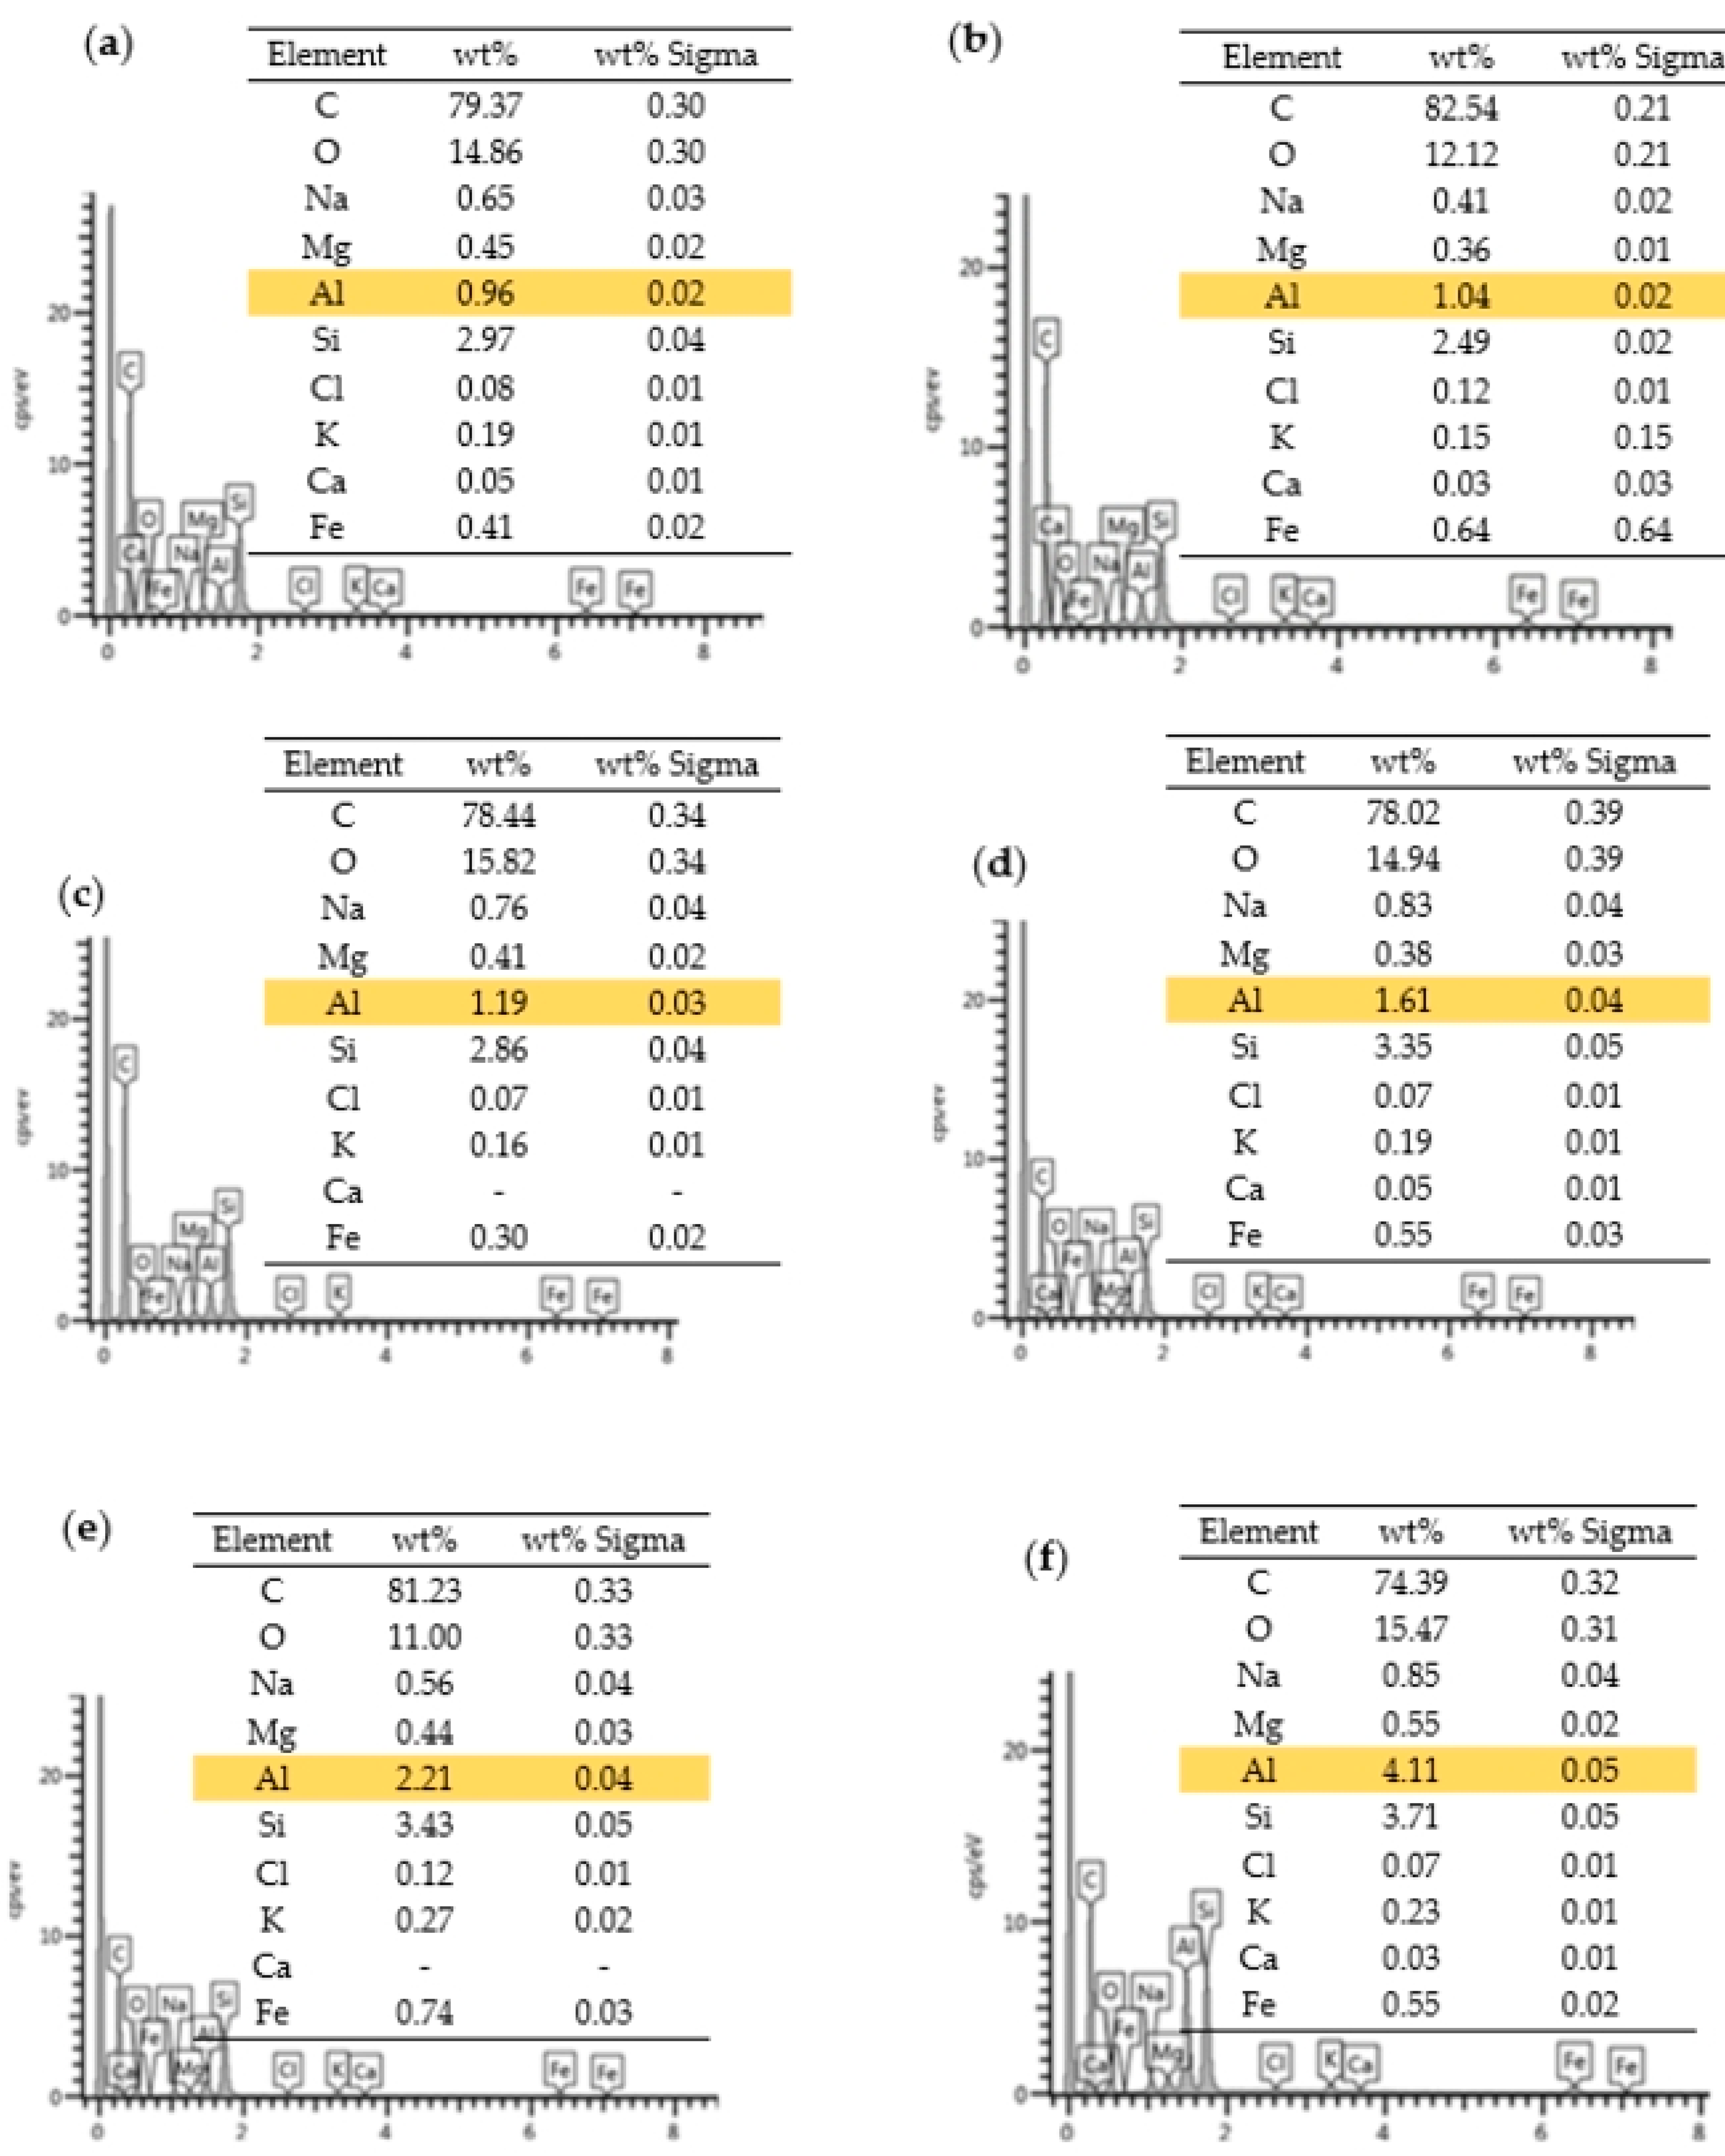
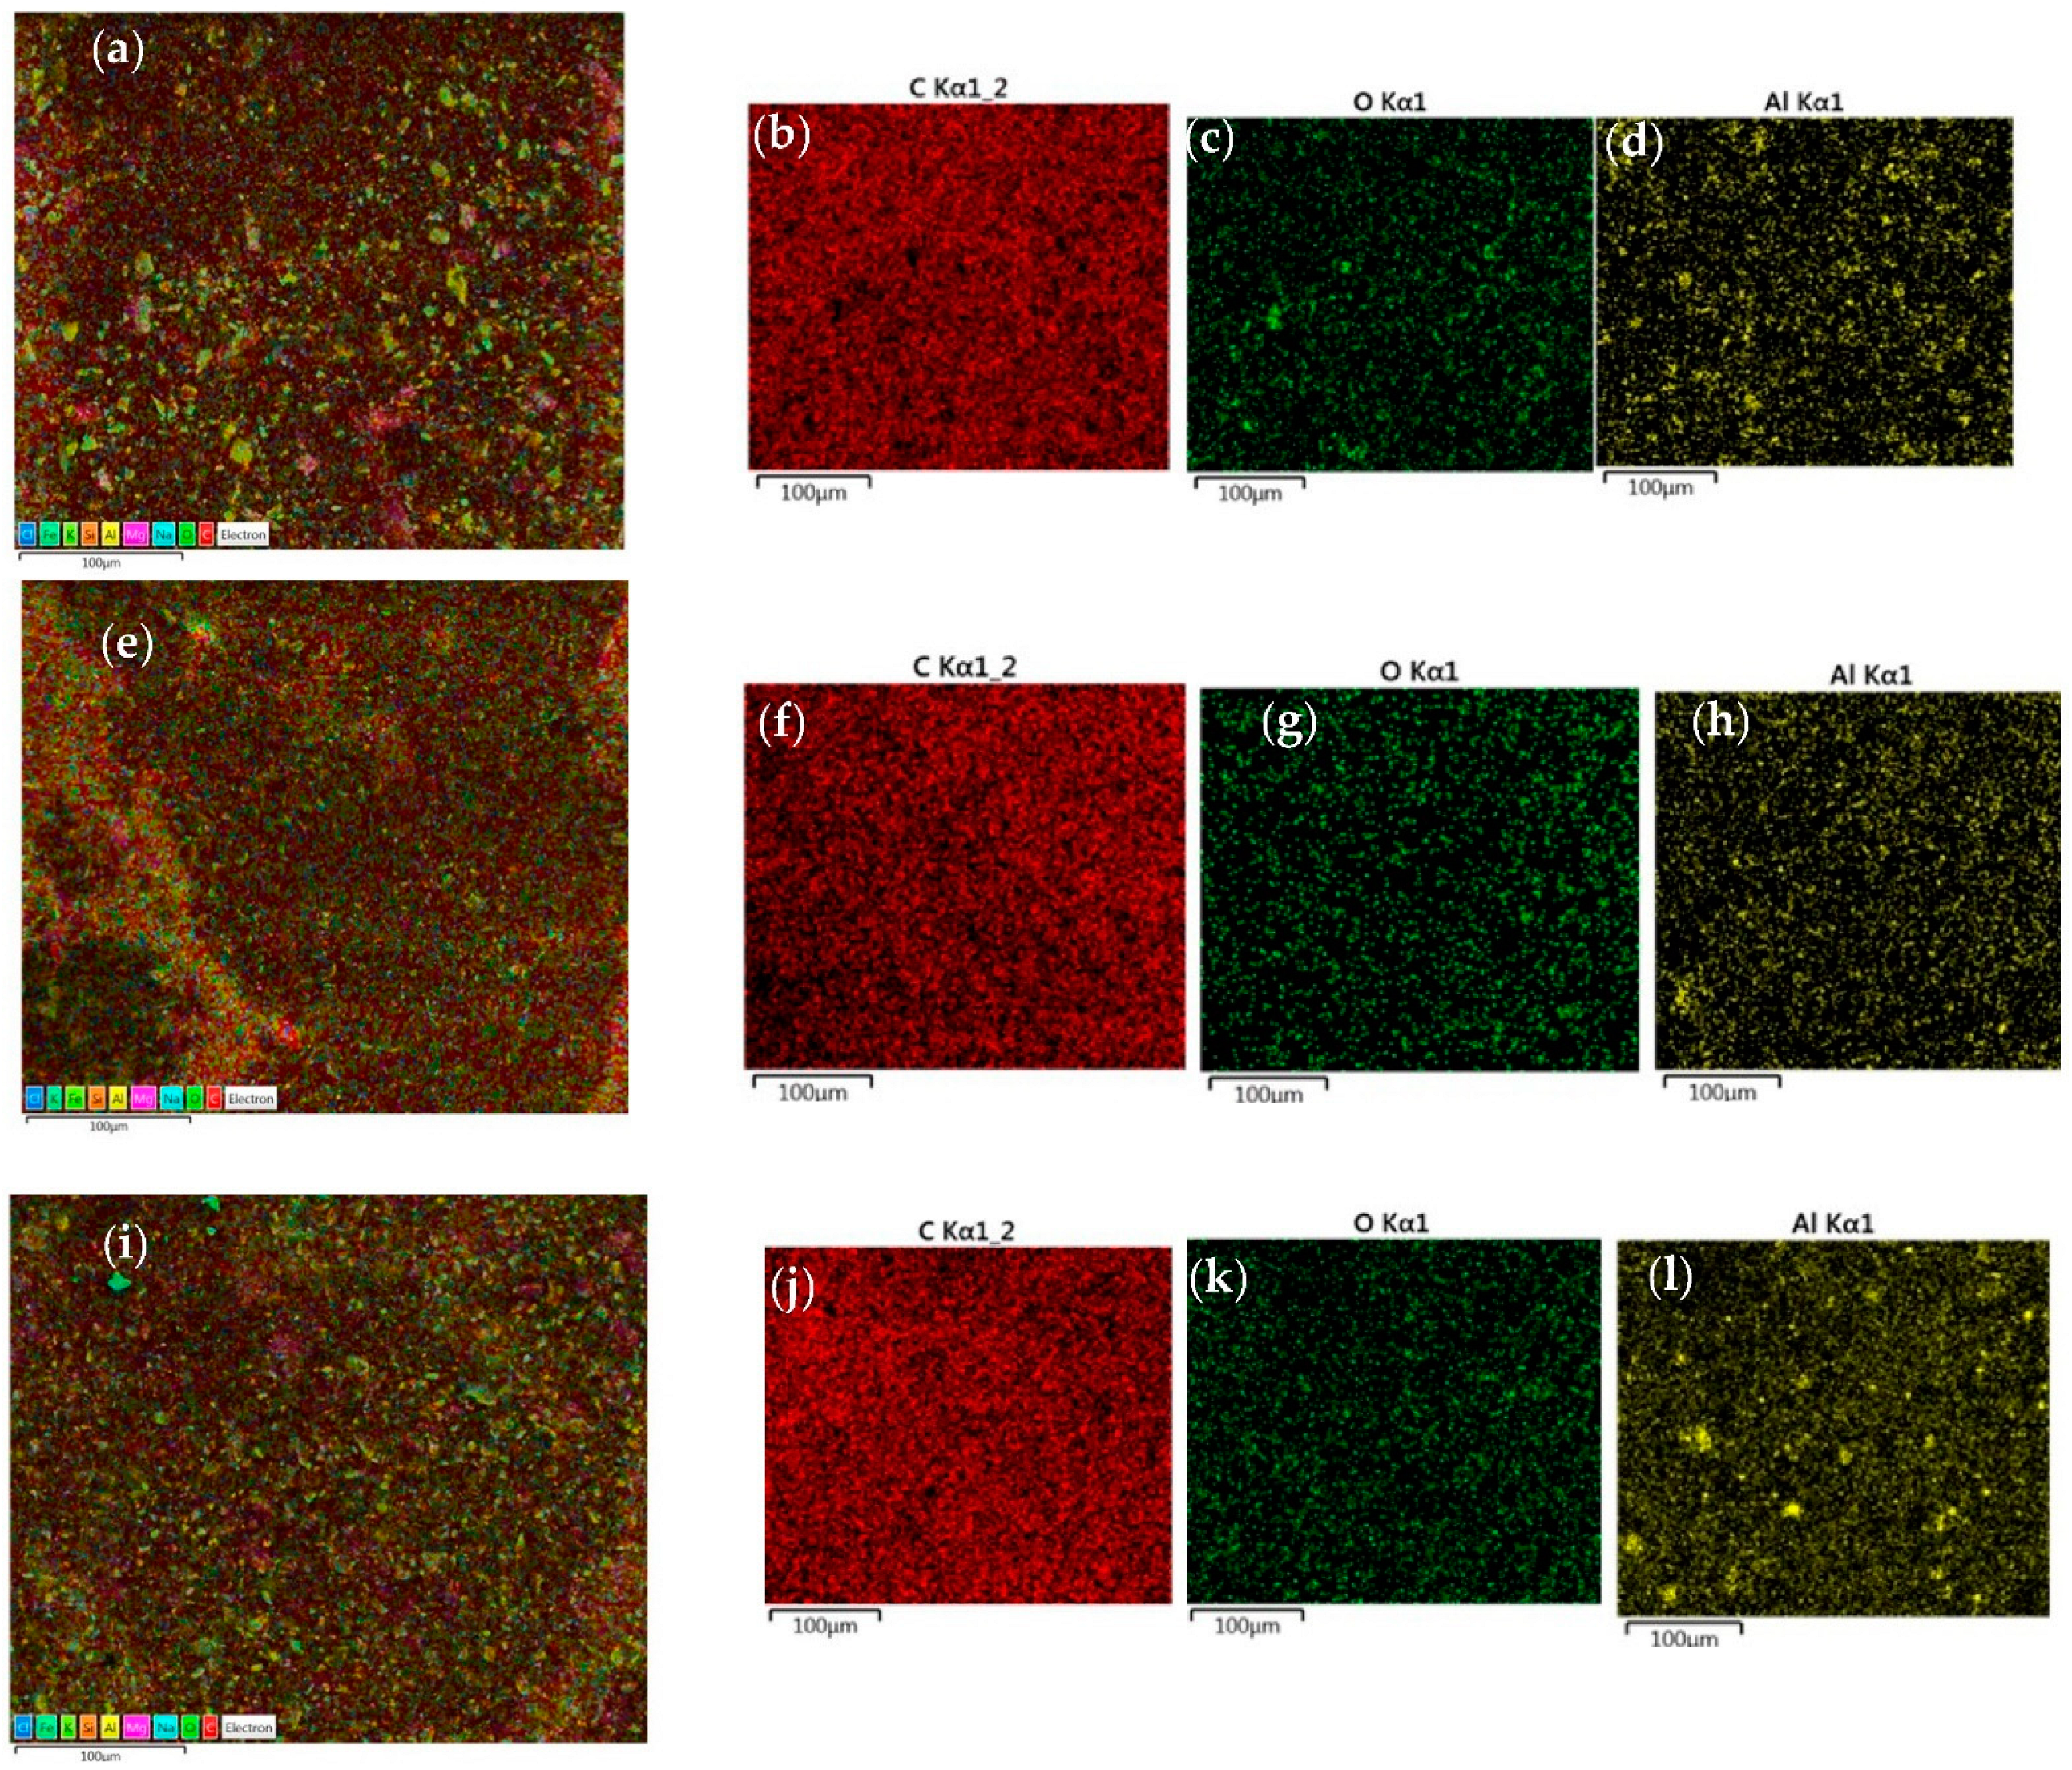
3.2. Characterisation of Nanocomposite

The SEM and EDS analyses established that the initial epoxy coating without the nanoparticles contains Al2O3 microparticles. Thus, by adding the Al NP, the concentration of the aluminium changed, as is shown in Table 2. Table 2 shows the Al NPs’ added masses and results which were obtained by the EDS analysis.
By adding the Al NPs to the epoxy matrix, the content by weight continually increased up to the mass concentration of 1% (Table 2). For samples in which 3.0 and 6.0% Al NP was added, the EDS analysis showed that there was a lower concentration of it. This was probably due to the formation of larger accumulations of nanoparticles and their uneven dispersion. Figure 5 shows the SEM micrographs that were obtained by analysing the cast iron surface that was coated with (a) the epoxy matrix without Al NP, and with (b) 0.50% Al NP, (c) 0.75% Al NP, (d) 1.0% Al NP, (c) 3.0 % Al NP, and (d) 6.0% Al NP before their immersion in an aggressive medium.
The SEM analysis showed that the epoxy matrix without adding the Al NPs had irregularities and alien particles, and the surface was not homogeneous. By adding the Al NP, the surface of the obtained nanocomposite presented many more irregularities and a higher concentration of brighter points. Figure 5b–f shows the slight differences in the surface morphology of the modified samples. The SEM analysis shows that, compared to the epoxy coating without the Al NP, the presence of the Al NP changed the morphology of the epoxy coating, and this effect was visible when we added 0.5% Al NP.
To determine the composition of the epoxy matrix and how the amount of the aluminium in the samples changed, the EDS analysis of each sample was carried out (Figure 6). The EDS analysis of the epoxy matrix without adding the Al NPs (Figure 6a) determined the percentage of the aluminium microparticles, and this was 0.96%. It was assumed that these microparticles of aluminium were used as a pigment in the epoxy paints. The presence of all of these elements in the blank epoxy matrix showed small irregularities as determined by the SEM analysis (Figure 5). By adding the Al NPs, the EDS analysis also detected Al that was already present in the epoxy matrix. This analysis showed a combination of micro- and nanoparticles of aluminium. The concentration of microparticles was constant, and the proportion of the Al NPs increased. A trend of increasing Al NP concentration was observed in the samples up to 1.0% (Figure 6b–d).
The EDS analysis could not detect a trend of increasing Al NP content due to the appearance of agglomerates in the 3% and 6% samples, and a drop in concentration appeared (Figure 6e,f). Inside the agglomerate, there were accumulated nanoparticles that were not well dispersed in the epoxy matrix, thus reducing the proportion over the entire surface.
To determine the homogeneity of the Al NP dispersion in the epoxy matrix, the EDS mapping for the epoxy matrix without adding Al NPs and for the nanocomposite with 1.0% Al NP and 6.0% Al NP was conducted (Figure 7).
The EDS mapping of the epoxy matrix without adding the Al NPs (Figure 7a) showed a rough non-homogeneous distribution of elements. By adding the Al NPs and using a mechanical mixer (Figure 7e,i), the nanocomposite obtained a smoother, homogeneous structure. The distribution of the elements of carbon and oxygen (Figure 7b,c,f,g,j,k) was even throughout the surface of all of the samples. The best aluminium distribution was observed in the sample with 1.0% Al NP (Figure 7h), whereas in the epoxy matrix (Figure 7d) and the sample with 6.0% Al NP (Figure 7l), agglomerates were observed. Microparticles and agglomerates of aluminium that serve as a pigment in the epoxy matrix were present in the epoxy matrix (Figure 7d). However, by adding the Al NPs and using a mechanical mixer at 3000 rpm, these microparticles were broken and the micro and nano aluminium particles were evenly distributed. By adding a higher concentration of Al NPs (Figure 7l), the saturation of the coating with the nanoparticles increased, and the nanoparticles began to interact and agglomerate. For the incorporation of a higher concentration of Al NPs in the epoxy matrix, a different method of sample preparation should be used.

3.3. Physical Properties of Coatings

The nanoparticles that were effectively dispersed in the epoxy matrix improved the mechanical properties of the composite [18] and affected the corrosion resistance of the coating [19]. The physical properties that were tested included discoloration, hardness, and coating adhesion to the metal substrate. Testing in climatic chambers was conducted under conditions that are typical for moderate winter continental climates that prevail in closed, non-heated premises. Table 3 shows the change in colour of the epoxy matrix with and without adding Al NPs and after the icing/deicing process.
By adding a higher concentration of the Al NPs in the epoxy matrix (Table 3), the colour of the nanocomposite became reddish grey to fully grey, as shown in Figure 3. After the samples had been exposed to the icing/deicing process, no discoloration was observed (Table 3). The results of coating hardness tests according to the Shore D scale before and after the icing/deicing process are shown in Table 4.
The figures in Table 4 show that by adding different concentrations of Al NPs the coating hardness remained the same. It can be concluded that the Al NPs do not change the elastic properties of the coating and do not have an effect on the wear and tear resistance of the coating. After exposing the samples to the icing and deicing processes, there was no visible difference in the hardness of coatings compared to those of the non-tested samples. The results of the measurements show a high degree of the surface hardness which was characterised by a durable film with a predicted good wear. The dry adhesion strength of the epoxy matrix and nanocomposite on the surface of the cast iron was tested with the pull-off method. The pull-off adhesion test results for all of the samples are shown in Table 5.
The pull-off adhesion test results show an increased adhesion capability on the base material with the addition of the Al NP (Table 5). The adhesion of the sample containing 1.0% Al NP could not be established because the adhesion bond between the cast iron and the nanocomposite was high, and separation occurred between the glue and the dolly. All of the other samples showed adhesion loss in the nanocomposite layer, which confirms the good properties of the glue that was used [20]. The testing in the climatic chamber did not contribute to the reduction in the adhesion to the base material in either sample.

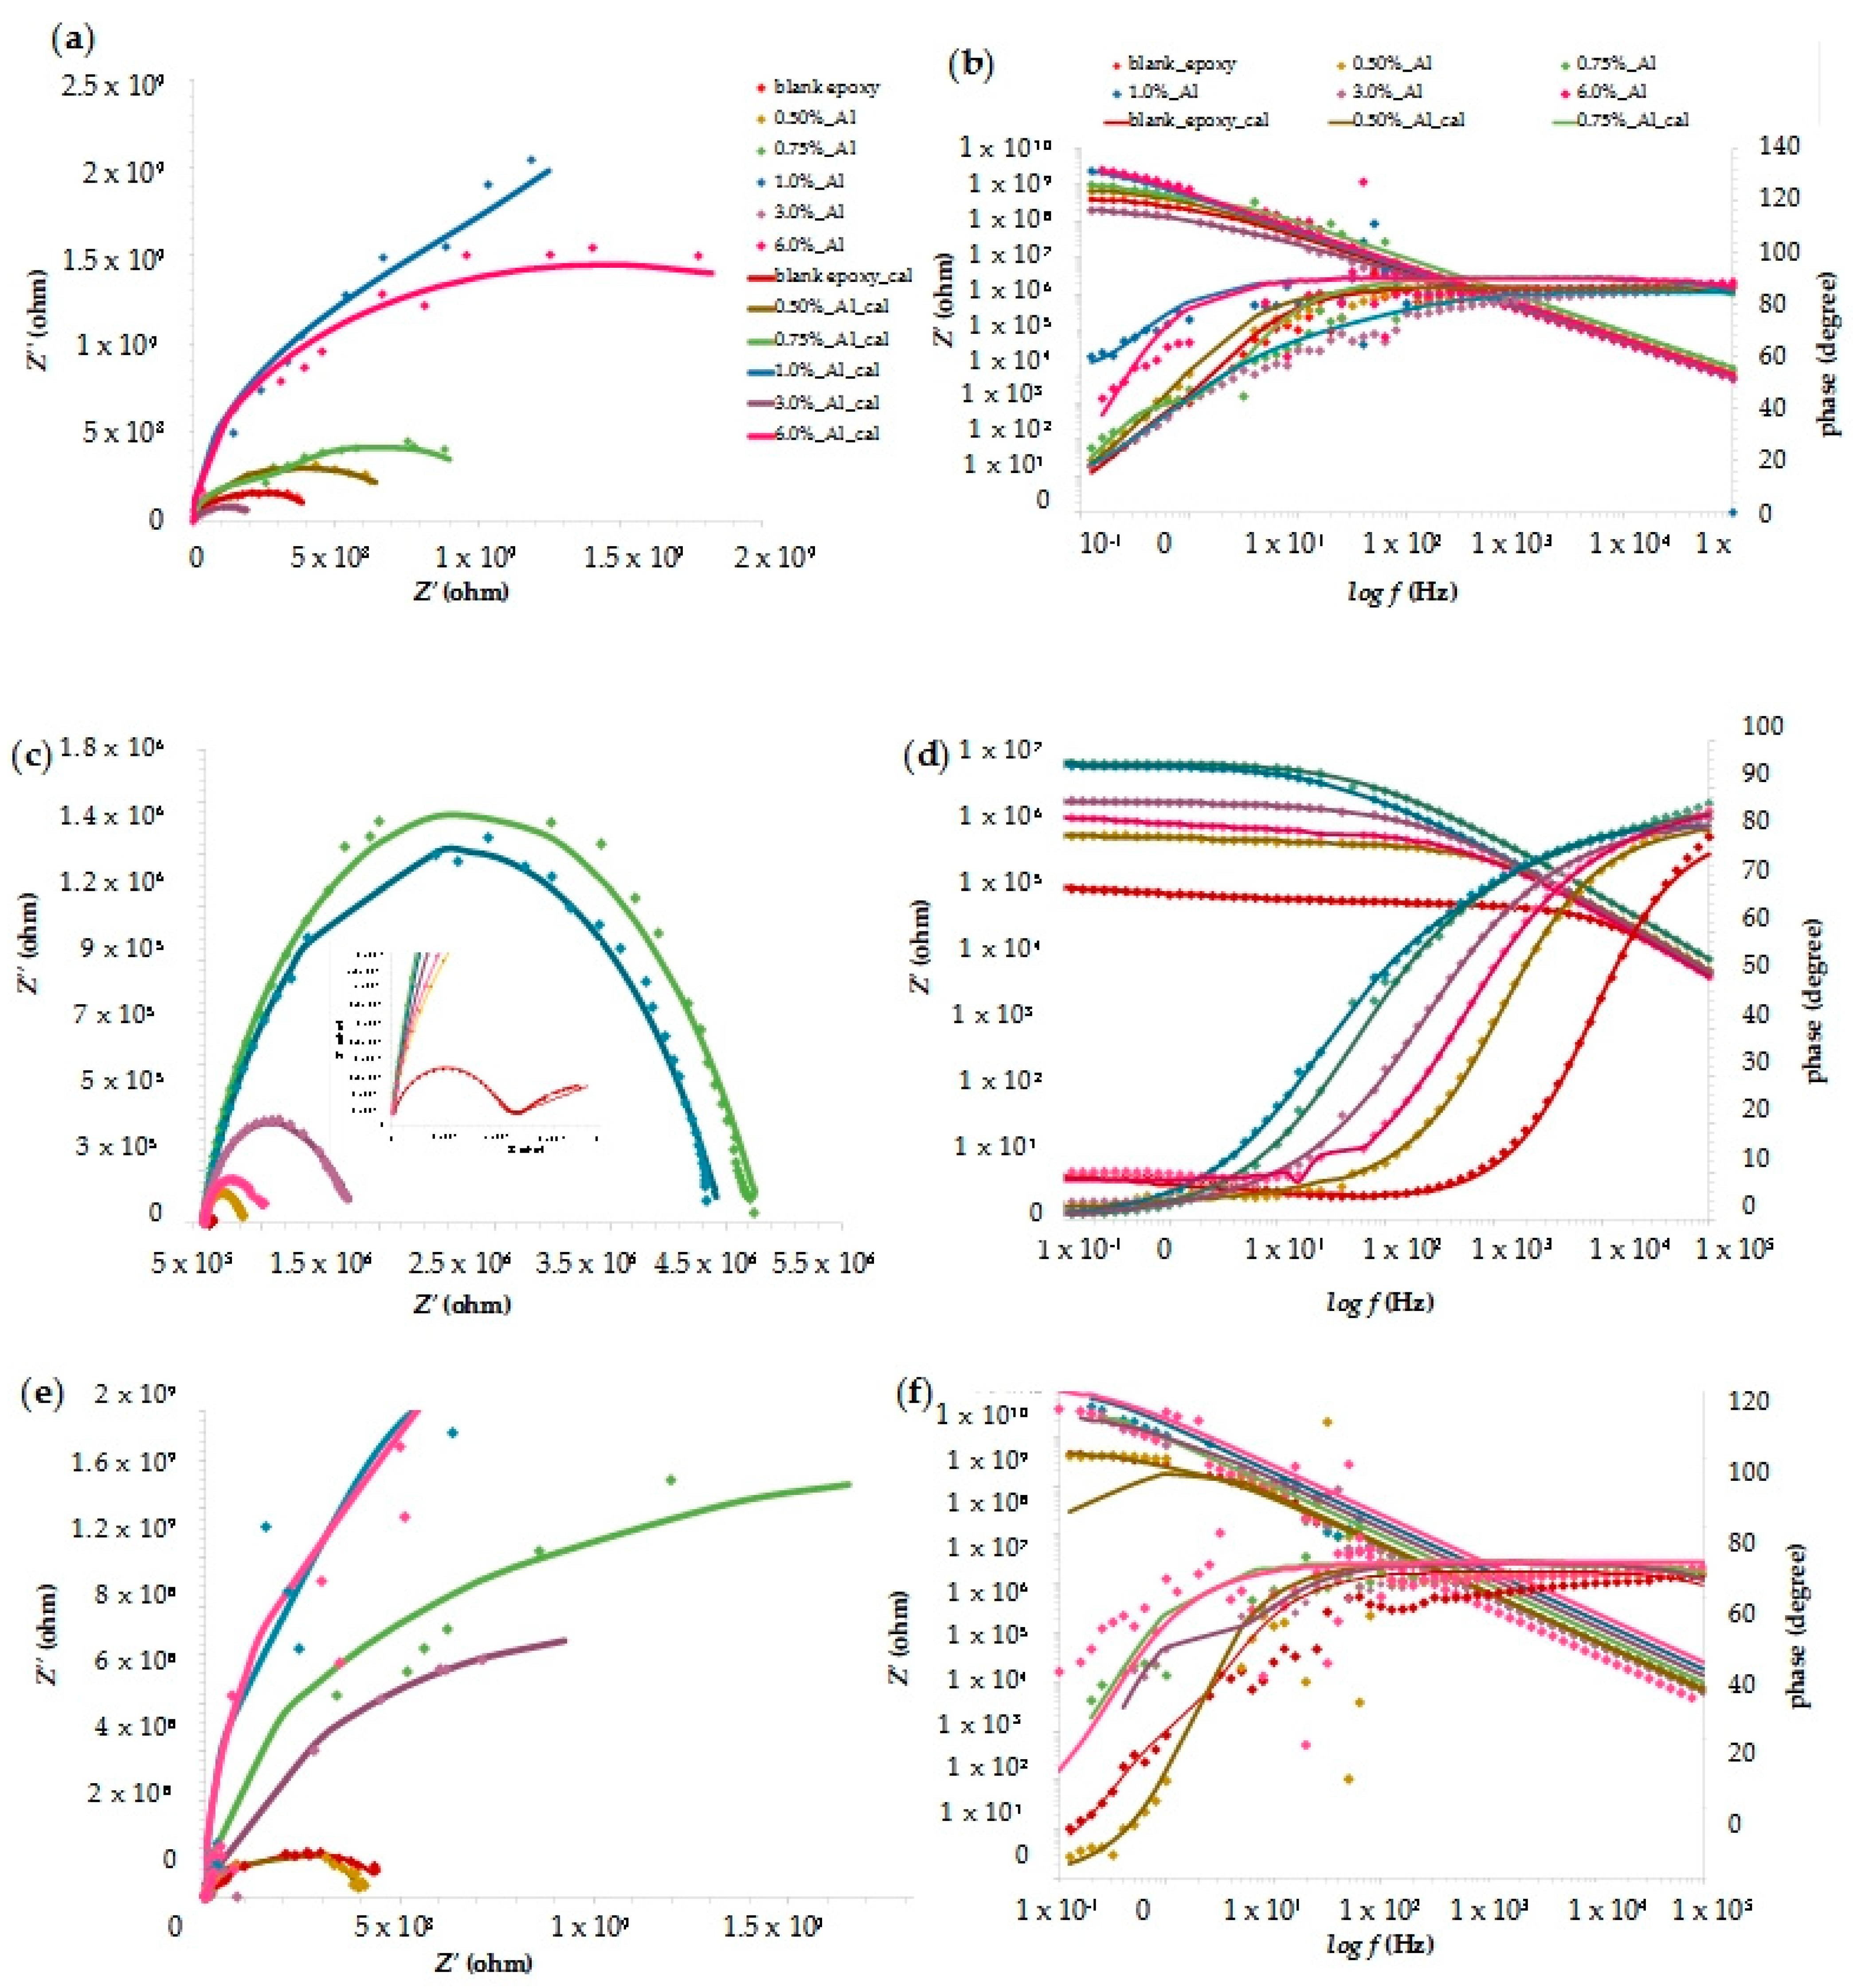
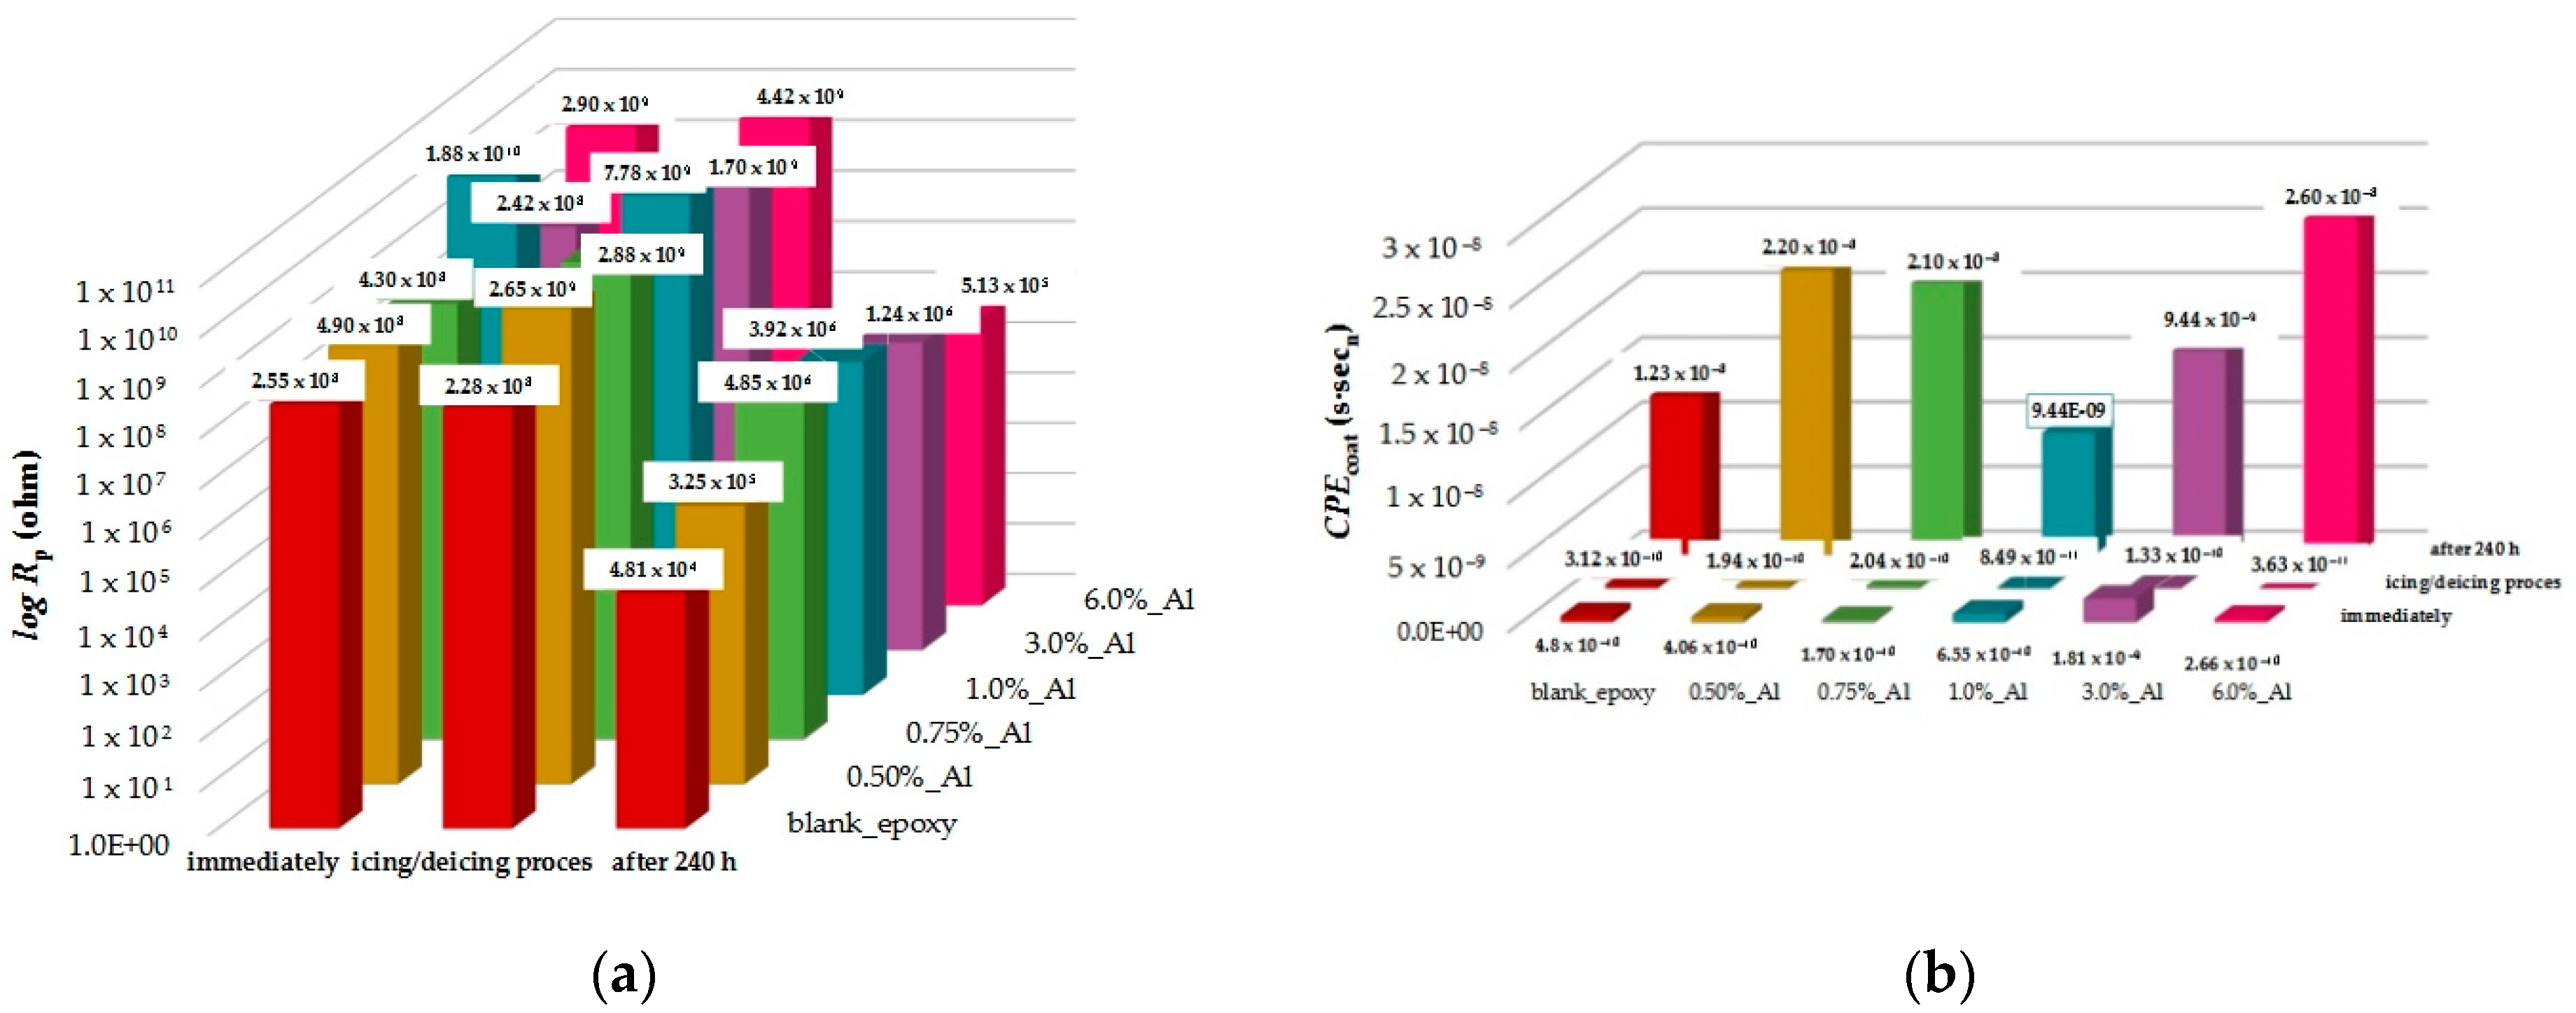
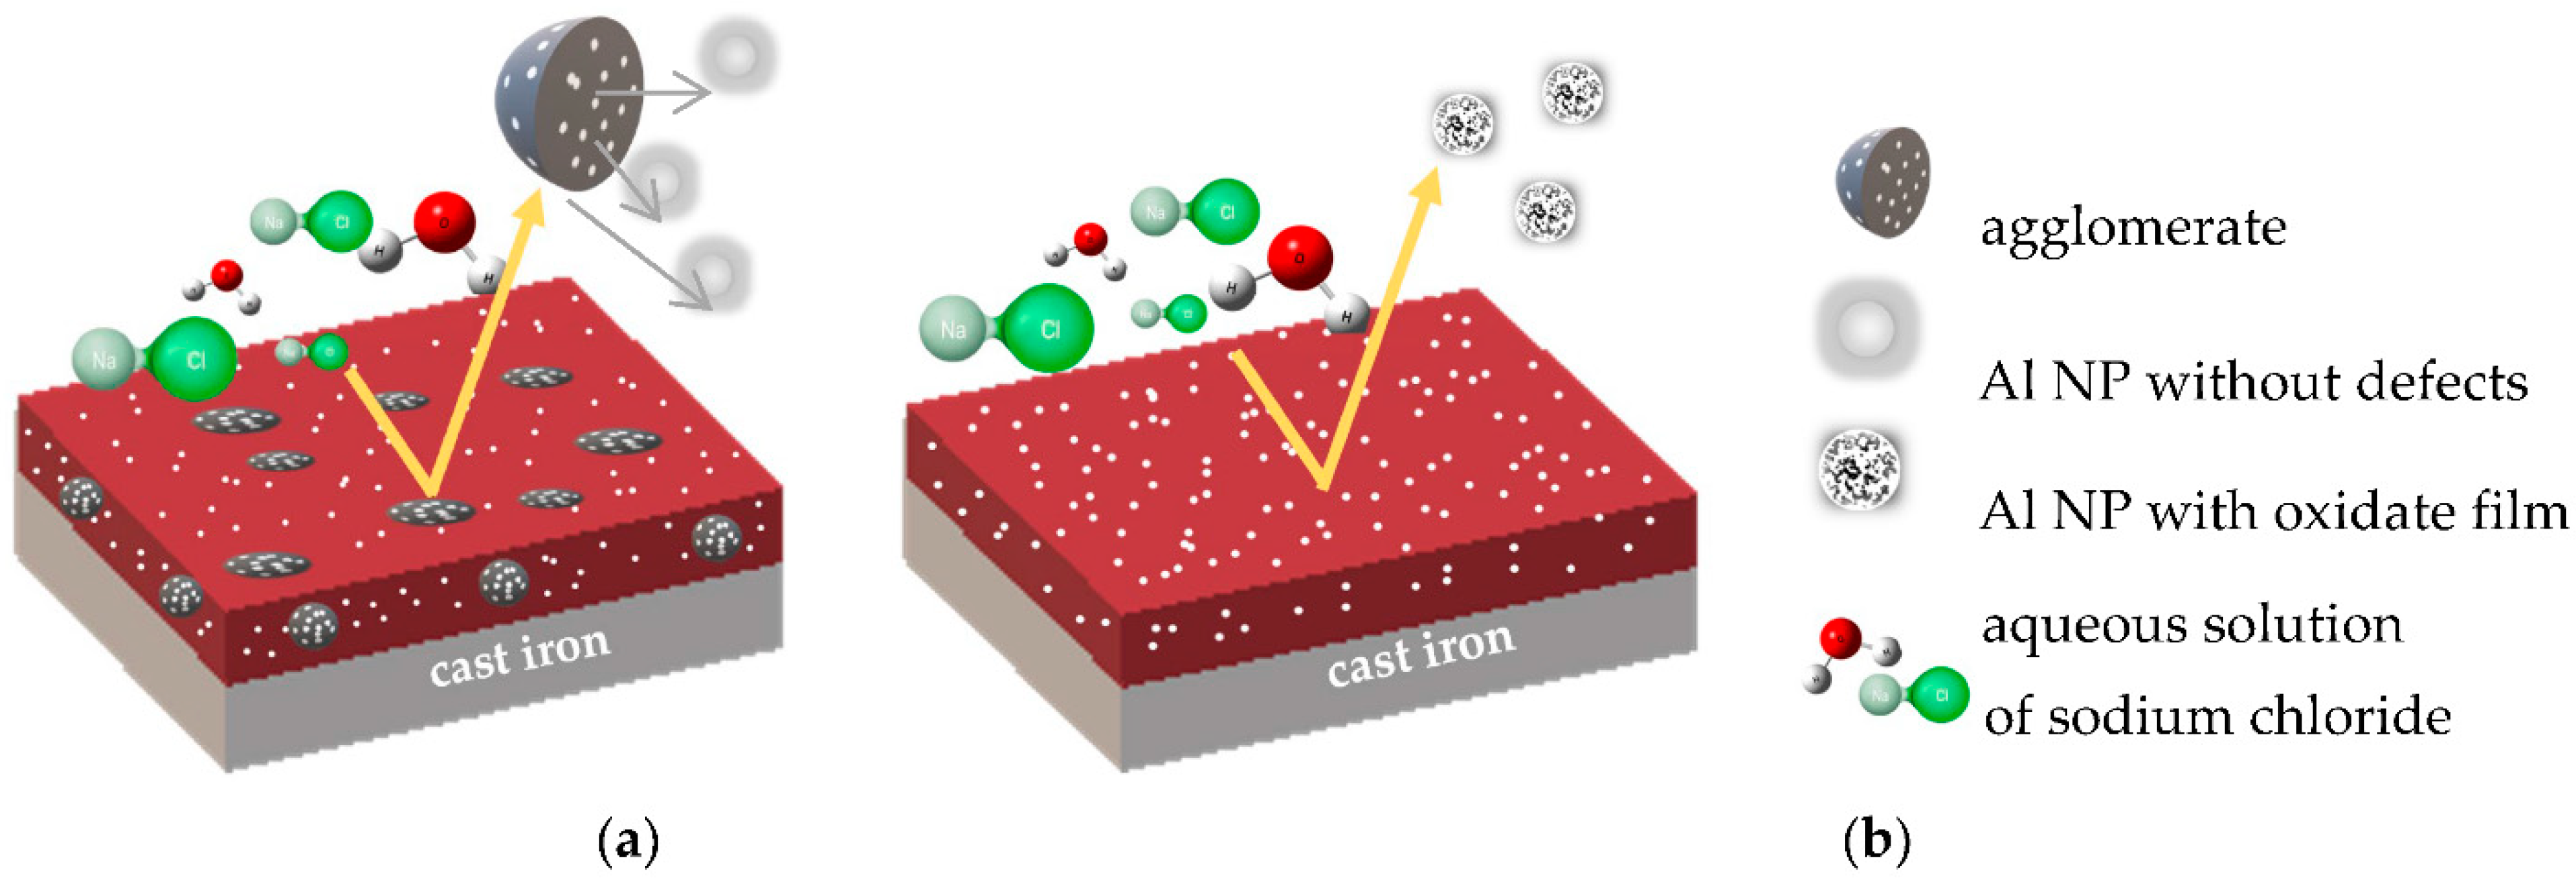
3.4. EIS Measurement

The EIS measurements were carried out to determine the influence of the increase in Al NP content in the epoxy matrix on the corrosion resistance in a 3.5% NaCl solution and in the climatic chamber. In the study of corrosion and corrosion mitigation of several metals in the sodium chloride solutions, the EIS measurements were used to report the kinetic parameters for the electron transfer reactions at the electrode/environment interface [21].
The equivalent electric circuit (EEC) model that is shown in Figure 8 was used to describe the impedance spectra. According to the available literature for organic coatings, a model with three resistors was selected. The model consists of the electrolyte resistance (Rs), coating resistance (Rcoat), and coating capacity (CPEcoat), charge transfer resistance (Rct), and constant phase element which represents a double-layer capacitance between the metal and the electrolyte solution (CPEdl) [22]. The Constant Phase Element (CPE) was used instead of the double-layer capacitance (Cdl) when the capacitive loop deviated from a true semicircle. The CPE represents a real imperfect system that defines the non-heterogeneity of the surface (CPEcoat) and the non-homogeneity of the charge distribution (CPEdl) [23].
The OCP measurement showed an insignificant change in the electrode potential. Compared to the blank epoxy, the OCP value of the nanocomposite was even lower. By increasing the Al NP concentration, the potential decreased to more negative values. After the immersion of the samples in 3.5 wt.% NaCl solution, the OCP values of the blank epoxy and of the samples with 0.5%, 0.75%, 1.0%, 3.0%, and 6.0% Al NP were approximately −36.80 mV, −62.56 mV, −79.74 mV, −94.67 mV, −102.44 mV, and −129.74 V, respectively.
The Nyquist and the Bode plots for the epoxy matrix without the Al NPs and the prepared nanocomposites with 0.5%, 0.75%, 1.0%, 3.0%, and 6.0% Al NPs are shown in Figure 9. The impedance spectrum was recorded immediately after the immersion in 3.5% NaCl solution (Figure 9a,b), and after 10 days or 240 h (Figure 9c,d). For the samples that were exposed to the icing and de-icing processes in the climatic chamber, the impedance spectrum was also recorded (Figure 9e,f).
The EIS spectra for the samples that were immediately immersed in the aggressive media (Figure 9a,b) showed that the sample with 1.0% Al NP had the best resistance. In the beginning, the samples did not achieve a full semicircle, meaning that the coating was very strong, the electrolyte had not damaged the coating’s substrate, and the impressed current could not pass because the coating provided a sufficiently high resistance. By adding the Al NP, the coating resistance increased until it reached a concentration of 1.0% Al NP, whereas by adding 3.0 and 6.0% Al NP, the resistance decreased. This was due to the agglomeration of the nanoparticles that began to appear at concentrations higher than 1.0%. In these cases, the nanoparticles were not well coated with the epoxy matrix. For the incorporation of a higher concentration of the nanoparticles in the epoxy, the coating should be prepared differently, for instance: a longer mixing period with a cooling period or the use of a different type of mixer and/or mixing device. After 240 h (Figure 9c,d), all of the samples took on the shape of a regular semicircle, meaning that the coating became weaker and could not provide satisfactory resistance to the passage of the current. Despite the drop in resistance, the coating still provided satisfactory resistance. The greater the obtained semicircle diameter was, the greater the resistance of the coated surface to corrosion was [24]. The best resistance to the aggressive medium after 240 h was provided by the sample with 0.75% Al NP (Figure 9c,d). After exposing the samples to the conditions in the climatic chamber (Figure 9e,f), the recorded EIS spectra showed an improvement in the electrochemical properties of the coatings, which might be due to the influence of the humid environment and low temperature on the nanoparticles. In all of the samples, only one capacitative loop was visible, which may be attributed to very good coating adhesion to the base material [25] and good barrier properties [26]. The coating resistance (Rp) and the constant phase element (CPEcoat) were calculated according to the shown EEC model (Figure 8) for all of the samples that were immersed immediately and after 240 h in 3.5% NaCl solution and thereafter, exposed in the climatic chamber (Figure 10a,b).
By exposing the samples to the corrosive medium, the Rcoat value decreased, which was accompanied by an increase in the CPEcoat value. After 240 h of immersing the samples in a corrosive medium, the increased values of CPEcoat showed that the coating absorbed water and it may be assumed that the corrosive medium reached the surface of the grey cast iron. Such behaviour was most noticeable in the sample with 6.0% Al NP. For the samples that were placed in the climatic chamber, there was no change in the values for CPEcoat, which would mean that the increase in the resistance was due to the influence of the low temperature on the nanoparticles.
The obtained values which are shown in Figure 10 for coating resistance (Rcoat) were used to calculate the nanocomposite protection efficiency using the following equation [27]:
C o a t i n g   p r o t e c t i o n   e f f i c i e n c y = ( R c o a t   w i t h   A l   N P R c o a t   w i t h o u t   A l   N P ) R c o a t   w i t h   A l   N P · 100 %
The calculated nanocomposite efficiency is shown in Table 6 for each sample that contained Al NPs after 240 h of exposure in the electrolyte solution and after their exposure in the climatic chamber (icing and deicing process).
The sample that contained 1.0% Al NP showed the best efficiency which was continuously maintained after its exposure to the aggressive medium and the climatic chamber. In all of the other samples, the efficiency improved with time. The reason for such behaviour was a high electrochemical reactivity and the tendency of the nanoparticles to react with oxygen. Under the influence of moisture, an oxide layer formed on their surface which prevented their further corrosion [15]. Although the samples with 3.0% and 6.0% Al NP showed a lower resistance due to the effect of agglomeration, their efficiency was very high, and they could be classified into the category of acceptable coatings. The incorporation of higher concentrations of nanoparticles in the epoxy coating should be the subject of future study.
By increasing the concentration of the aluminium nanoparticles (up to 1.0%) in the epoxy matrix, the adhesion of the epoxy coating to the metal substrate increased. The occurrence of an adhesion enhancement implies that there was a good compatibility between the Al NPs and the epoxy matrix. The possible reactions between the nanoparticles (which were well dispersed in the epoxy matrix) and the epoxy resin are shown in Figure 11.
By adding the hardener, the aliphatic amine initiated the curing by the nucleophilic attack of the amine group at the epoxy ring of the monomer (Figure 11a) [28]. Aluminium nanoparticles can enter into a chemical reaction with the hardener that is contained in the epoxy resin due to their small size. According to the chemical reaction in Figure 11b, the epoxy matrix, that is in a chain, contains hydroxyl groups that serve as sites for the creation of strong electromagnetic bonding attraction between the epoxy and metal molecules [29]. In this way, the aluminium nanoparticle is directly incorporated into the epoxy matrix.
The increase in the concentration of the Al NPs in the epoxy matrix (more than 3%) leads to the formation of agglomerates. Agglomeration, which is caused by the poor dispersion of nanomaterials, can cause inhomogeneity in the nanocomposite (Figure 12a). Such a structure will show a significant decrease in the anticorrosive protection of the nanocomposite during its exposure to an aggressive medium (3.5 wt.% NaCl).
Figure 12b shows the behaviour of the nanocomposite where no agglomeration occurred, that is, the figure shows the successful incorporation of the nanoparticles in the organic film which is based on the reactions in Figure 11. Pure aluminium that is in contact with air or moisture is a thermodynamically reactive metal with an extremely negative value of the standard electrode potential (−1.66 V). However, in neutral aqueous solutions, the aluminium showed a positive potential value of −0.6 V, meaning that a thin protective layer was formed on its surface [30]. When it is i contact with the aqueous solution of NaCl and by the influence of the impressed current I, during the measurement of the EIS spectrum, the aluminium nanoparticles will oxidise, which will lead to a reduction in the amount of water according to the following equations:
Al(s) → Al3+(aq) + 3e
2H2O + 2e → H2(g) + 2OH(aq)
The aqueous solution is a weak electrolyte, which means that it consists more of water molecules than it does of ions, and thus the formed aluminium ions can react with water molecules (H2O) and form hydroxide ions (OH). The corrosion reactions that occurred on the Al NP surface in the neutral medium are [15]:
2Al3+ + 3H2O → Al2O3 + 6H+
2Al3+ + 6H2O → 2Al(OH)3 + 6H+
The oxide layer on the nanoparticles provides a certain protection against the electrolyte by inhibiting the reaction of the electrolyte penetration into the structure of the epoxy matrix [31]. The electrolyte penetration is accelerated by the presence of chloride ions (Cl), which are among the most corrosive halogen elements. Due to their relatively small size and high mobility, Cl ions can penetrate the aluminium oxide layer and thus, reduce the corrosion resistance of the nanocomposite [30].

4. Conclusions

This paper investigates the influence of different concentrations of Al NPs in an organic coating to increase its anti-corrosive properties. All of the studies that have been conducted so far have aimed to achieve the desired coating properties. Among these, the most relevant are the increase in the coating resistance against an aggressive media, environmental friendliness, and low production costs that are acceptable for the industry. The research that has been carried out has brought some new findings which will help to improve the incorporation of larger quantities of nanoparticles in the epoxy matrix.
The aluminium nanopowder that was used in this paper consists of high-purity spherical nanoparticles. The SEM and EDS analysis established that by incorporating Al NPs in the epoxy matrix, no agglomeration occurred until the aluminium concentration in the coating reached 1.61%. The addition of Al NPs in the epoxy matrix was accompanied by a change in the colour of the nanocomposite from red to grey. By analysing the hardness of the nanocomposite, it has been established that by adding different concentrations of Al NP, the hardness of the coating remained the same, which also occurred after exposing the sample to the icing/deicing process. The results of testing the adhesion of the nanocomposite to the substrate of the cast iron showed an exceptional increase concerning the epoxy matrix. The recorded EIS spectra indicate that all of the nanocomposite samples showed exceptional resistance to the action of salt water and the icing/deicing process.

Author Contributions

Conceptualisation, M.S. and V.A.; methodology, M.S. and V.A.; software, M.S. and V.Š.; validation, M.S., V.A., V.Š. and I.S.; formal analysis, M.S. and V.Š.; investigation, M.S.; resources, V.A. and I.S.; data curation, M.S.; writing—original draft preparation, M.S.; writing—review and editing, M.S.; visualisation, M.S.; supervision, V.A.; project administration, V.A. and I.S.; funding acquisition, I.S. All authors have read and agreed to the published version of the manuscript.

Funding

This research was funded by “Development of anticorrosion protection system for multipurpose pipe use”, grant number KK.01.1.1.07.0045. This work was supported by the European Regional Development Fund under the Operational Program Competitiveness and Cohesion 2014–2020.

Institutional Review Board Statement

Not applicable.

Informed Consent Statement

Not applicable.

Data Availability Statement

Not applicable.

Conflicts of Interest

The authors declare no conflict of interest.

References

  1. Melchers, R.E. Post-perforation external corrosion of cast iron pressurised water mains. Corros. Eng. Sci. Technol. 2017, 52, 541–546. [Google Scholar] [CrossRef]
  2. Kadhim, L. The Corrosion Behavior and Wear Resistance of Gray Cast Iron. Kufa J. Eng. 2018, 9, 118–132. [Google Scholar] [CrossRef]
  3. Jur, T.; Middleton, J.; Yurko, A.; Windham, R.; Grey, J. Case Studies in Graphitic Corrosion of Cast Iron Pipe. J. Fail. Anal. Prev. 2021, 21, 376–386. [Google Scholar] [CrossRef]
  4. Khodaei, P.; Shabani-Nooshabadi, M.; Behpour, M. Epoxy-Based nanocomposite coating reinforced by a zeolite complex: Its anticorrosion properties on mild steel in 3.5 wt % NaCl media. Prog. Org. Coat. 2019, 136, 105254. [Google Scholar] [CrossRef]
  5. Wang, M.; Wang, J.; Hu, W. Preparation and corrosion behavior of Cu-8-HQ@HNTs/epoxy coating. Prog. Org. Coat. 2020, 139, 105434. [Google Scholar] [CrossRef]
  6. Shen, W.; Zhang, T.; Ge, Y.; Feng, L.; Feng, H.; Li, P. Multifunctional AgO/epoxy nanocomposites with enhanced mechanical, anticorrosion and bactericidal properties. Prog. Org. Coat. 2021, 152, 106130. [Google Scholar] [CrossRef]
  7. Guo, D.; Xie, G.; Luo, J. Mechanical properties of nanoparticles: Basics and applications. J. Phys. D. Appl. Phys. 2014, 47, 013001. [Google Scholar] [CrossRef] [Green Version]
  8. Yuan, H.; Qi, F.; Zhao, N.; Wan, P.; Zhang, B.; Xiong, H.; Liao, B.; Quyang, X. Graphene oxide decorated with titanium nanoparticles to reinforce the anti-corrosion performance of epoxy coating. Coatings 2020, 10, 129. [Google Scholar] [CrossRef] [Green Version]
  9. Yao, H.; Li, L.; Li, W.; Qi, D.; Fu, W.; Wang, N. Application of nanomaterials in waterborne coatings: A review. Resour. Chem. Mater. 2022, 3, 2772–4433. [Google Scholar] [CrossRef]
  10. Xavier, J.R. Electrochemical, mechanical and adhesive properties of surface modified NiO-epoxy nanocomposite coatings on mild steel. Mater. Sci. Eng. B Solid-State Mater. Adv. Technol. 2019, 260, 114639. [Google Scholar] [CrossRef]
  11. Xue, L.; Xu, L.; Li, Q. Effect of nano Al pigment on the anticorrosive performance of waterborne epoxy coatings. J. Mater. Sci. Technol. 2007, 23, 563–567. [Google Scholar]
  12. Bello, S.A.; Agunsoye, J.O.; Adebisi, J.A.; Hassan, S.B. Effect of aluminium particles on mechanical and morphological properties of epoxy nanocomposites. Acta Period. Technol. 2017, 48, 25–38. [Google Scholar] [CrossRef] [Green Version]
  13. Penna, M.O.; Silva, A.A.; Rosário, F.F.; De Souza, C.S.; Soares, B.G. Organophilic nano-alumina for superhydrophobic epoxy coatings. Mater. Chem. Phys. 2020, 255, 123543. [Google Scholar] [CrossRef]
  14. Liang, Y.; Liu, F.C.; Nie, M.; Zhao, S.; Lin, J.; Han, E.H. Influence of Nano-Al Concentrates on the Corrosion Resistance of Epoxy Coatings. J. Mater. Sci. Technol. 2013, 29, 353–358. [Google Scholar] [CrossRef]
  15. Niroumandrad, S.; Rostami, M.; Ramezanzadeh, B. Effects of combined surface treatments of aluminium nanoparticle on its corrosion resistance before and after inclusion into an epoxy coating. Prog. Org. Coat. 2016, 101, 486–501. [Google Scholar] [CrossRef]
  16. ISO 945-1; Microstructure of cast itons—Part 1: Graphite classification by visual analysis. International Organization for Standardization: Geneva, Switzerland, 2017.
  17. ISO 868; Plastic and ebonite—Determination of indentation hardness by means of a durometer (Shore hardness). International Organization for Standardization: Geneva, Switzerland, 2003.
  18. Long, J.; Li, C.; Li, Y. Enhancement of Mechanical and Bond Properties of Epoxy Adhesives Modified by SiO2 Nanoparticles with Active Groups. Polymers 2022, 14, 2052. [Google Scholar] [CrossRef]
  19. Fu, X.; Shen, Z.; Chen, X.; Lin, J.; Cao, H. Influence of element penetration region on adhesion and corrosion performance of Ni-base coatings. Coatings 2020, 10, 895. [Google Scholar] [CrossRef]
  20. Nascimento Silva, M.; Kassab, E.; Ginoble Pandoli, O.; Leite de Oliveira, J.; Pereira Quintela, J.; Bott, I.S. Corrosion behaviour of an epoxy paint reinforced with carbon nanoparticles. Corros. Eng. Sci. Technol. 2020, 55, 603–608. [Google Scholar] [CrossRef]
  21. Alam, M.A.; Samad, U.A.; Sherif, E.-S.M.; Poulose, A.M.; Mohammed, J.A.; Alharthi, N.; Saeed, M.; Al-Zahran, S.M. Influence of SiO2 content and exposure periods on the anticorrosion behavior of epoxy nanocomposite coatings. Coatings 2020, 10, 118. [Google Scholar] [CrossRef] [Green Version]
  22. Njoku, D.I.; Cui, M.; Xiao, H.; Shang, B.; Li, Y. Understanding the anticorrosive protective mechanisms of modified epoxy coatings with improved barrier, active and self-healing functionalities: EIS and spectroscopic techniques. Sci. Rep. 2017, 7, 1–15. [Google Scholar] [CrossRef] [Green Version]
  23. Margarit-Mattos, I.C.P. EIS and organic coatings performance: Revisiting some key points. Electrochim. Acta. 2020, 354, 136725. [Google Scholar] [CrossRef]
  24. Sherif, E.S.M.; Alam, M.A.; Al-Zahrani, S.M. Fabrication of different protective coatings and studying their mechanical properties and corrosion behavior in sodium chloride solutions. Int. J. Electrochem. Sci. 2015, 10, 373–387. [Google Scholar]
  25. Sculy, J.R.; Silverman, D.C.; Kendig, M.W. Electrochemical Impedance: Analysis and Interpretation; ASTM Publication: Philadelphia, PA, USA, 1993. [Google Scholar]
  26. Liu, X.; Xiong, J.; Lv, Y.; Zuo, Y. Study on corrosion electrochemical behavior of several different coating systems by EIS. Prog. Org. Coat. 2009, 64, 497–503. [Google Scholar] [CrossRef]
  27. Chilkoor, G.; Sarder, R.; Islam, J.; Arun Kumar, K.E.; Ratnayake, I.; Star, S.; Bharat, K.J.; Sereda, G.; Koratkar, N.; Meyyappan, M.; et al. Maleic anhydride-functionalized graphene nanofillers render epoxy coatings highly resistant to corrosion and microbial attack. Carbon N. Y. 2020, 159, 586–597. [Google Scholar] [CrossRef]
  28. Feichtenschlager, B.; Pabisch, S.; Svehla, J.; Peterlik, H.; Sajjad, M.; Koch, T.; Kickelbick, G. Epoxy Resin Nanocomposites: The Influence of Interface Modification on the Dispersion Structure—A Small-Angle-X-ray-Scattering Study. Surfaces 2020, 3, 664–682. [Google Scholar] [CrossRef]
  29. Schmidt, R.G.; Bell, J.P. Epoxy Adhesion to Metals. Adv. Polym. 1986, 75, 33–71. [Google Scholar]
  30. Vargel, C. Corrosion of Aluminium, 2nd ed.; Elsevier: Amsterdam, The Netherlands, 2019. [Google Scholar]
  31. Karlsson, P.; Palmqvist, A.E.C.; Holmberg, K. Surface modification for aluminium pigment inhibition. Adv. Colloid Interface Sci. 2006, 128–130, 121–134. [Google Scholar] [CrossRef]
Figure 1. Microstructure of grey cast iron microstructure in the unetched state.
Coatings 12 01500 g001
Figure 2. Chemical composition of Al NP.
Coatings 12 01500 g002
Figure 3. Description of modified nanocomposite coating preparation, application, and drying.
Coatings 12 01500 g003
Figure 4. SEM analysis of (a) Al NP surface morphology and (b) size of aluminium nanoparticles in metal powder.
Coatings 12 01500 g004
Figure 5. SEM micrographs obtained for the surface of (a) blank epoxy and epoxy coating with (b) 0.50% Al nanoparticles, (c) 0.75% Al nanoparticles, (d) 1.0% Al nanoparticles, (e) 3.0% Al nanoparticles, and (f) 6.0% Al nanoparticles.
Coatings 12 01500 g005
Figure 6. EDS spectra and overview of chemical composition of (a) epoxy matrix without Al NP and epoxy matrix with (b) 0.5%, (c) 0.75%, (d) 1.0%, (e) 3.0%, and (f) 6.0% Al NP.
Coatings 12 01500 g006
Figure 7. EDS mapping of the epoxy matrix (a) without adding Al NP, with (e) 1.0% Al NP and (i) 6.0% Al NP. Overview of the distribution of carbon (C), oxygen (O), and aluminium (Al) in epoxy coating (bd) without adding Al NPs and with (fh) 1.0% Al NP and (jl) 6.0% Al NP.
Coatings 12 01500 g007
Figure 8. Equivalent circuit model employed to fit the impedance data.
Coatings 12 01500 g008
Figure 9. Nyquist and Bode plots for samples immersed immediately (a,b), after 10 days (c,d), and samples (e,f) exposed to corrosion conditions in climatic chamber.
Coatings 12 01500 g009
Figure 10. Overview of (a) coating resistance (Rp) and (b) constant phase element (CPEcoat) for epoxy matrix without Al NP, and prepared nanocomposites with 0.50%, 0.75%, 1.0%, 3.0%, and 6.0% Al NP, immediately and after 240 h exposure in aggressive medium (3.5% NaCl), and after testing in climatic chamber.
Coatings 12 01500 g010
Figure 11. Possible reactions of incorporation of Al NP (a) into the added hardener (amine) and (b) directly in the epoxy matrix.
Coatings 12 01500 g011
Figure 12. Graphic image of different influences of the electrolyte om the system (a) with agglomerates and (b) without agglomerates.
Coatings 12 01500 g012
Table 1. Incorporation of aluminium nanoparticles in epoxy resin and thickness of the obtained nanocomposites.
SampleEpoxy Resin (g)Hardener (g)Al NP (%)Thickness (μm)
blank_epoxy307.50207.2
0.50%_Al307.50.50228.1
0.75%_Al307.50.75235.4
1.0%_Al307.51.0229.7
3.0%_Al307.53.0212.3
6.0%_Al307.56.0226.7
Table 2. Obtained chemical composition of aluminium in epoxy coating.
Samplem (Al NP), gEDS(Al), %
blank epoxy0.00000.96
0.50%_Al0.18841.04
0.75%_Al0.29151.19
1.0%_Al0.37941.61
3.0%_Al1.15982.21
6.0%_Al2.39364.11
Table 3. Discoloration testing results for the epoxy matrix without and with adding Al NPs before and after the icing/deicing process.
SamplesBlank-Epoxy0.50%_Al0.75%_Al1.0%_Al3.0%_Al6.0%_Al
non-exposed samples RAL 3013RAL 8015RAL 8016RAL 80178019RAL 7015
icing/deicing
process
RAL 3013RAL 8015RAL 8016RAL 80178019RAL 7015
Table 4. Results of coating hardness testing for epoxy matrix with and without adding Al NPs before and after the icing/deicing process.
SamplesBlank-Epoxy0.50%_Al0.75%_Al1.0%_Al3.0%_Al6.0%_Al
non-exposed samples83.483.083.683.484.483.5
icing/deicing
process
82.083.680.680.882.883.2
Table 5. Adhesion test results for epoxy matrix with and without adding Al NPs as well as before and after the icing/deicing process.
Samples/MPaBlank-Epoxy0.50%_Al0.75%_Al1.0%_Al3.0%_Al6.0%_Al
non-exposed samples8.3413.0015.56-13.9712.14
8.3113.2414.49-13.4510.93
icing/deicing process9.5314.0114.89-12.8410.57
8.9813.5814.47-13.2513.01
Table 6. Calculated coating protection efficiency (CPE, %) for non-modified and modified epoxy coating immersed immediately and after 240 h in 3.5% NaCl and after the icing/deicing process.
Samples0.50%_Al0.75%_Al1.0%_Al3.0%_Al6.0%_Al
immediately47.9640.7098.64-91.21
after 240 h85.2099.0198.7796.1290.62
icing/deicing process91.4092.0897.0786.5994.84
Publisher’s Note: MDPI stays neutral with regard to jurisdictional claims in published maps and institutional affiliations.

