Article

Modeling of the Effect of Carrier Gas Injection on the Laminarity of the Plasma Jet Generated by a Cascaded Spray Gun

1
Institute of Energy and Climate Research, Materials Synthesis and Processing (IEK-1), Forschungszentrum Jülich GmbH, 52425 Jülich, Germany
2
State Key Laboratory for Mechanical Behavior of Materials, School of Materials Science and Engineering, Xi’an Jiaotong University, Xi’an 710049, China
3
School of Mechanical Engineering, Dalian University of Technology, Dalian 116024, China
*
Authors to whom correspondence should be addressed.
Coatings 2022, 12(10), 1416; https://doi.org/10.3390/coatings12101416
Submission received: 13 August 2022 / Revised: 17 September 2022 / Accepted: 21 September 2022 / Published: 27 September 2022
(This article belongs to the Section Surface Characterization, Deposition and Modification)

Abstract

:
In this work, the plasma generated by the cascaded SinplexProTM plasma spray gun was studied by means of numerical simulation. Special attention is given to the laminarity of the plasma flow. The simulation part is divided into two parts: arcing simulation inside the spray gun and plasma jet simulation outside the spray gun. A laminar as well as a turbulent model is used in each case. The results show that, under the investigated conditions, the internal flow of the plasma torch can be considered as laminar with low turbulence and can, hence, be regarded as quasi-laminar flow. If carrier gas is injected into the plasma jet, the ideal laminar plasma jet is often greatly affected. However, the turbulent plasma jet with low turbulence intensity generated by the cascaded SinplexProTM plasma spray gun is less affected and can remain stable, which is beneficial to the plasma-spraying process.

1. Introduction

Thermal spraying is currently a widely used surface treatment method. It can be divided into several processes characterized by different heat and power sources. These processes include plasma spraying, flame spraying, high-velocity oxygen fuel spraying, and others. In plasma spraying, the highest temperature among these heat sources is reached. This feature makes plasma jets able to melt all materials, which leads to a huge selection of materials. For the fast preparation of ceramic coatings, plasma spraying also has a high deposition efficiency and is currently widely used for preparing thermal barrier coatings [1,2,3].
Because thermal plasma jets have high temperatures and are optically thin, it is difficult to directly measure and characterize the temperature and velocity. The current method is to use a plasma probe; however, the environment required for the measurement is very harsh, and it may not be suitable to use it for industrial purposes. Moreover, it is also difficult to measure the inaccessible conditions inside the plasma torch. Therefore, simulation is currently one of the main methods to study the arcing process inside the plasma torch and plasma jet close to the torch nozzle exit. Plasma simulation methods for thermal spray studies focus on either the arc behavior inside the plasma torch or the jet flow outside the plasma torch. For the arcing process inside the plasma torch, not only the fluid flow and heat transfer process but also the electric field and magnetic field should be considered. Therefore, the flow inside the plasma torch requires a multifield coupling method. At present, a common method is to directly use multifield coupling commercial simulation software to simulate the plasma by coupling the electric field, magnetic field, flow, and heat transfer, such as COMSOL Multiphysics software [4,5,6,7]. Alternatively, another method is to simulate the fluid flow based on commercial CFD (computational fluid dynamics) software through user-defined physical parameters, such as using a UDS (user-defined scaler), a UDM (user-defined memory), and source terms, and adjusted macros that are included in the UDF (user-defined function) in the ANSYS Fluent to consider electric and magnetic fields and their coupling with flow and heat transfer [8,9,10,11,12]. With both methods, the flow inside the plasma torch can be modeled.
There are a lot of related studies on the simulation of the internal flow of F4 (Oerlikon Metco, Wohlen, Switzerland) and F6 (GTV) spray guns [13,14,15]. The distance between the cathode and anode of these two plasma torches is very close. During operation, the arc root will frequently move on the anode, which makes the voltage to greatly fluctuate, resulting in instabilities [16,17,18]. In contrast, the SinplexPro™ plasma spray gun (Oerlikon Metco) has a cascaded nozzle, which reduces the length of the anode to restrict the movement of the arc root and reduce the fluctuation of the electric voltage. Moreover, increasing the length of the arc column by intermediate segments electrically insulated from each other also helps to improve the stability of the arc [19,20,21]. So far, studies have indicated that using a constant value or profile for the temperature or velocity at the anode exit of the F4 and F6 spray guns can yield reasonable results of the jet flow [22,23,24]. However, there are relatively few studies on the jet flow of a cascaded plasma spray gun, and there is no research directly indicating whether the mentioned empirical values or profiles can be directly used. Obviously, for a cascaded plasma torch, the plasma jet generated has different characteristics than that of the plasma torch without neutrode segments. There is also a big difference in stability and flow conditions. In recent years, studies have shown that the technology of cascaded nozzles contributes to achieving a stable and even laminar plasma jet [25,26]. In general, turbulence in the plasma jet results in a large amount of air entrainment, which increases the axial energy gradient. In contrast, the laminar plasma jet has a lower energy gradient and a more concentrated energy intensity because of its stable flow state and low entrainment of the ambient air [26,27]. This characteristic makes the high-temperature region of the plasma jet elongated, which improves the controllability of the plasma jet as a heat source [28].
Recently, studies have shown the feasibility of the laminar plasma-spraying process [29,30,31,32,33,34,35,36,37,38,39]. Lower temperature and velocity gradient make the spraying process less sensitive to the spray distance, which means that, in a wider range of spray distance, the plasma properties are similar, and the particle statuses are also similar. Therefore, theoretically, the laminar flow state can help to improve the controllability and reproducibility of the plasma-spraying process. Previous works also proved that the laminar plasma spray is less sensitive to the spray distance. For example, the Ni60 coatings obtained from 300 mm to 400 mm showed almost the same lamellar structures and mechanical properties [34]. In addition, the YSZ coatings also have the same tendency [30,31]. Moreover, the laminar plasma jet is longer and the velocity is lower, which make the dwelling time of the powder in the laminar plasma jet longer so that the feedstock can be sufficiently heated to be melted and even partially vaporized [31,34,37,38]. Therefore, obtaining a laminar plasma jet in the plasma-spraying process can provide improvement to the controllability, reproducibility, and reliability. However, the commercial laminar plasma torch has the characteristic of low stiffness, which makes it very vulnerable to the radial injected carrier gas when the flow rate is high. In most of the previous studies about the laminar plasma spray, a gravity-based powder feeder is applied, which makes it harder to control the feeding rate of the powder. To overcome the problem of the powder feeding and the flow state, a plasma jet with quasi-laminar flow state and higher stiffness can be a good option. Therefore, a plasma torch with a cascaded structure, which has the potential to generate laminar plasma jet, deserves to be studied further on the flow state of the plasma jet generated by itself.
This article intends to study the performance of the SinplexPro™ plasma spray gun during the thermal spraying process, considering the jet flow and the jet flow performance after the feedstock carrier gas is introduced. Empirical values and profiles for the boundary condition at the nozzle exit may be unrealistic as mentioned above. Therefore, it is still necessary to model the flow in the plasma torch as well as to obtain suitable boundary conditions for the plasma jet simulation. Thus, in this study, the first step is to simulate the internal arcing process of the SinplexPro™ plasma torch. Then, the second step is to model the plasma jet to study its characteristics. Particular attention is turned to the laminarity of the plasma jet.
For the internal simulation of the plasma torch, Zhukovskii et al. [19,20,40] used a two-temperature (2-T) model. This model is characterized by distinguishing the temperature of heavy particles (atoms, ions) from those of the electrons. In this model, the equilibrium degree was introduced to deal with the high resistance and highly nonlinear problems caused by the low temperature near the wall. However, in this work, the main purpose was to study the velocity and temperature distribution of the plasma jet, as well as the interaction between the carrier gas and plasma jet. Therefore, the single LTE (local thermal equilibrium) and MHD (magnetohydrodynamics) models are used for simulation so that reasonable results can also be obtained since the equilibrium degree in the jet is high as the pressure is not far from atmospheric conditions. Therefore, COMSOL Multiphysics [41] is used to simulate the internal flow of the plasma torch. The results were coupled with an ANSYS Fluent model [42] to simulate the plasma jet and study the influence of the carrier gas on its characteristics.

2. Simulation Methods and Investigated Torch Conditions

2.1. Assumptions

The simulation is separated into internal and external parts. Due to the high symmetry of the internal structure of the gun, a two-dimensional axis-symmetry model is applied. For the simulation outside the plasma torch, due to the introduction of carrier gas, the density difference between the cold gas and hot plasma will be great enough that the influence of gravity should be considered. Thus, a three-dimensional model is used.
Here are all the assumptions for the two simulation cases:
(1)
The plasma flow is laminar and quasi-steady;
(2)
The plasma operates in a local thermal equilibrium (LTE) state and is optically thin to the extent that the radiation is negligible;
(3)
The heat and mass transfer properties of the plasma jet are temperature-dependent;
(4)
The gravitational effect is negligible inside the plasma torch;
(5)
The process gas flows in the radial direction and without a swirl component;
(6)
The electric and magnetic fields near the nozzle exit are negligible;
(7)
The terms of the viscous dissipation in the energy equation are negligible due to the small Mach number;
(8)
The properties of the mixture of ambient air and plasma gas follow the volume and weight mixing law.
However, not all the assumptions are applied in a single case. Two different simulation cases use different sets of assumptions. Table 1 shows the details of applying the assumptions in the two simulations and also which assumptions are used in the cases of the plasma arcing process and the cases of the plasma jet.

2.2. Governing Equations
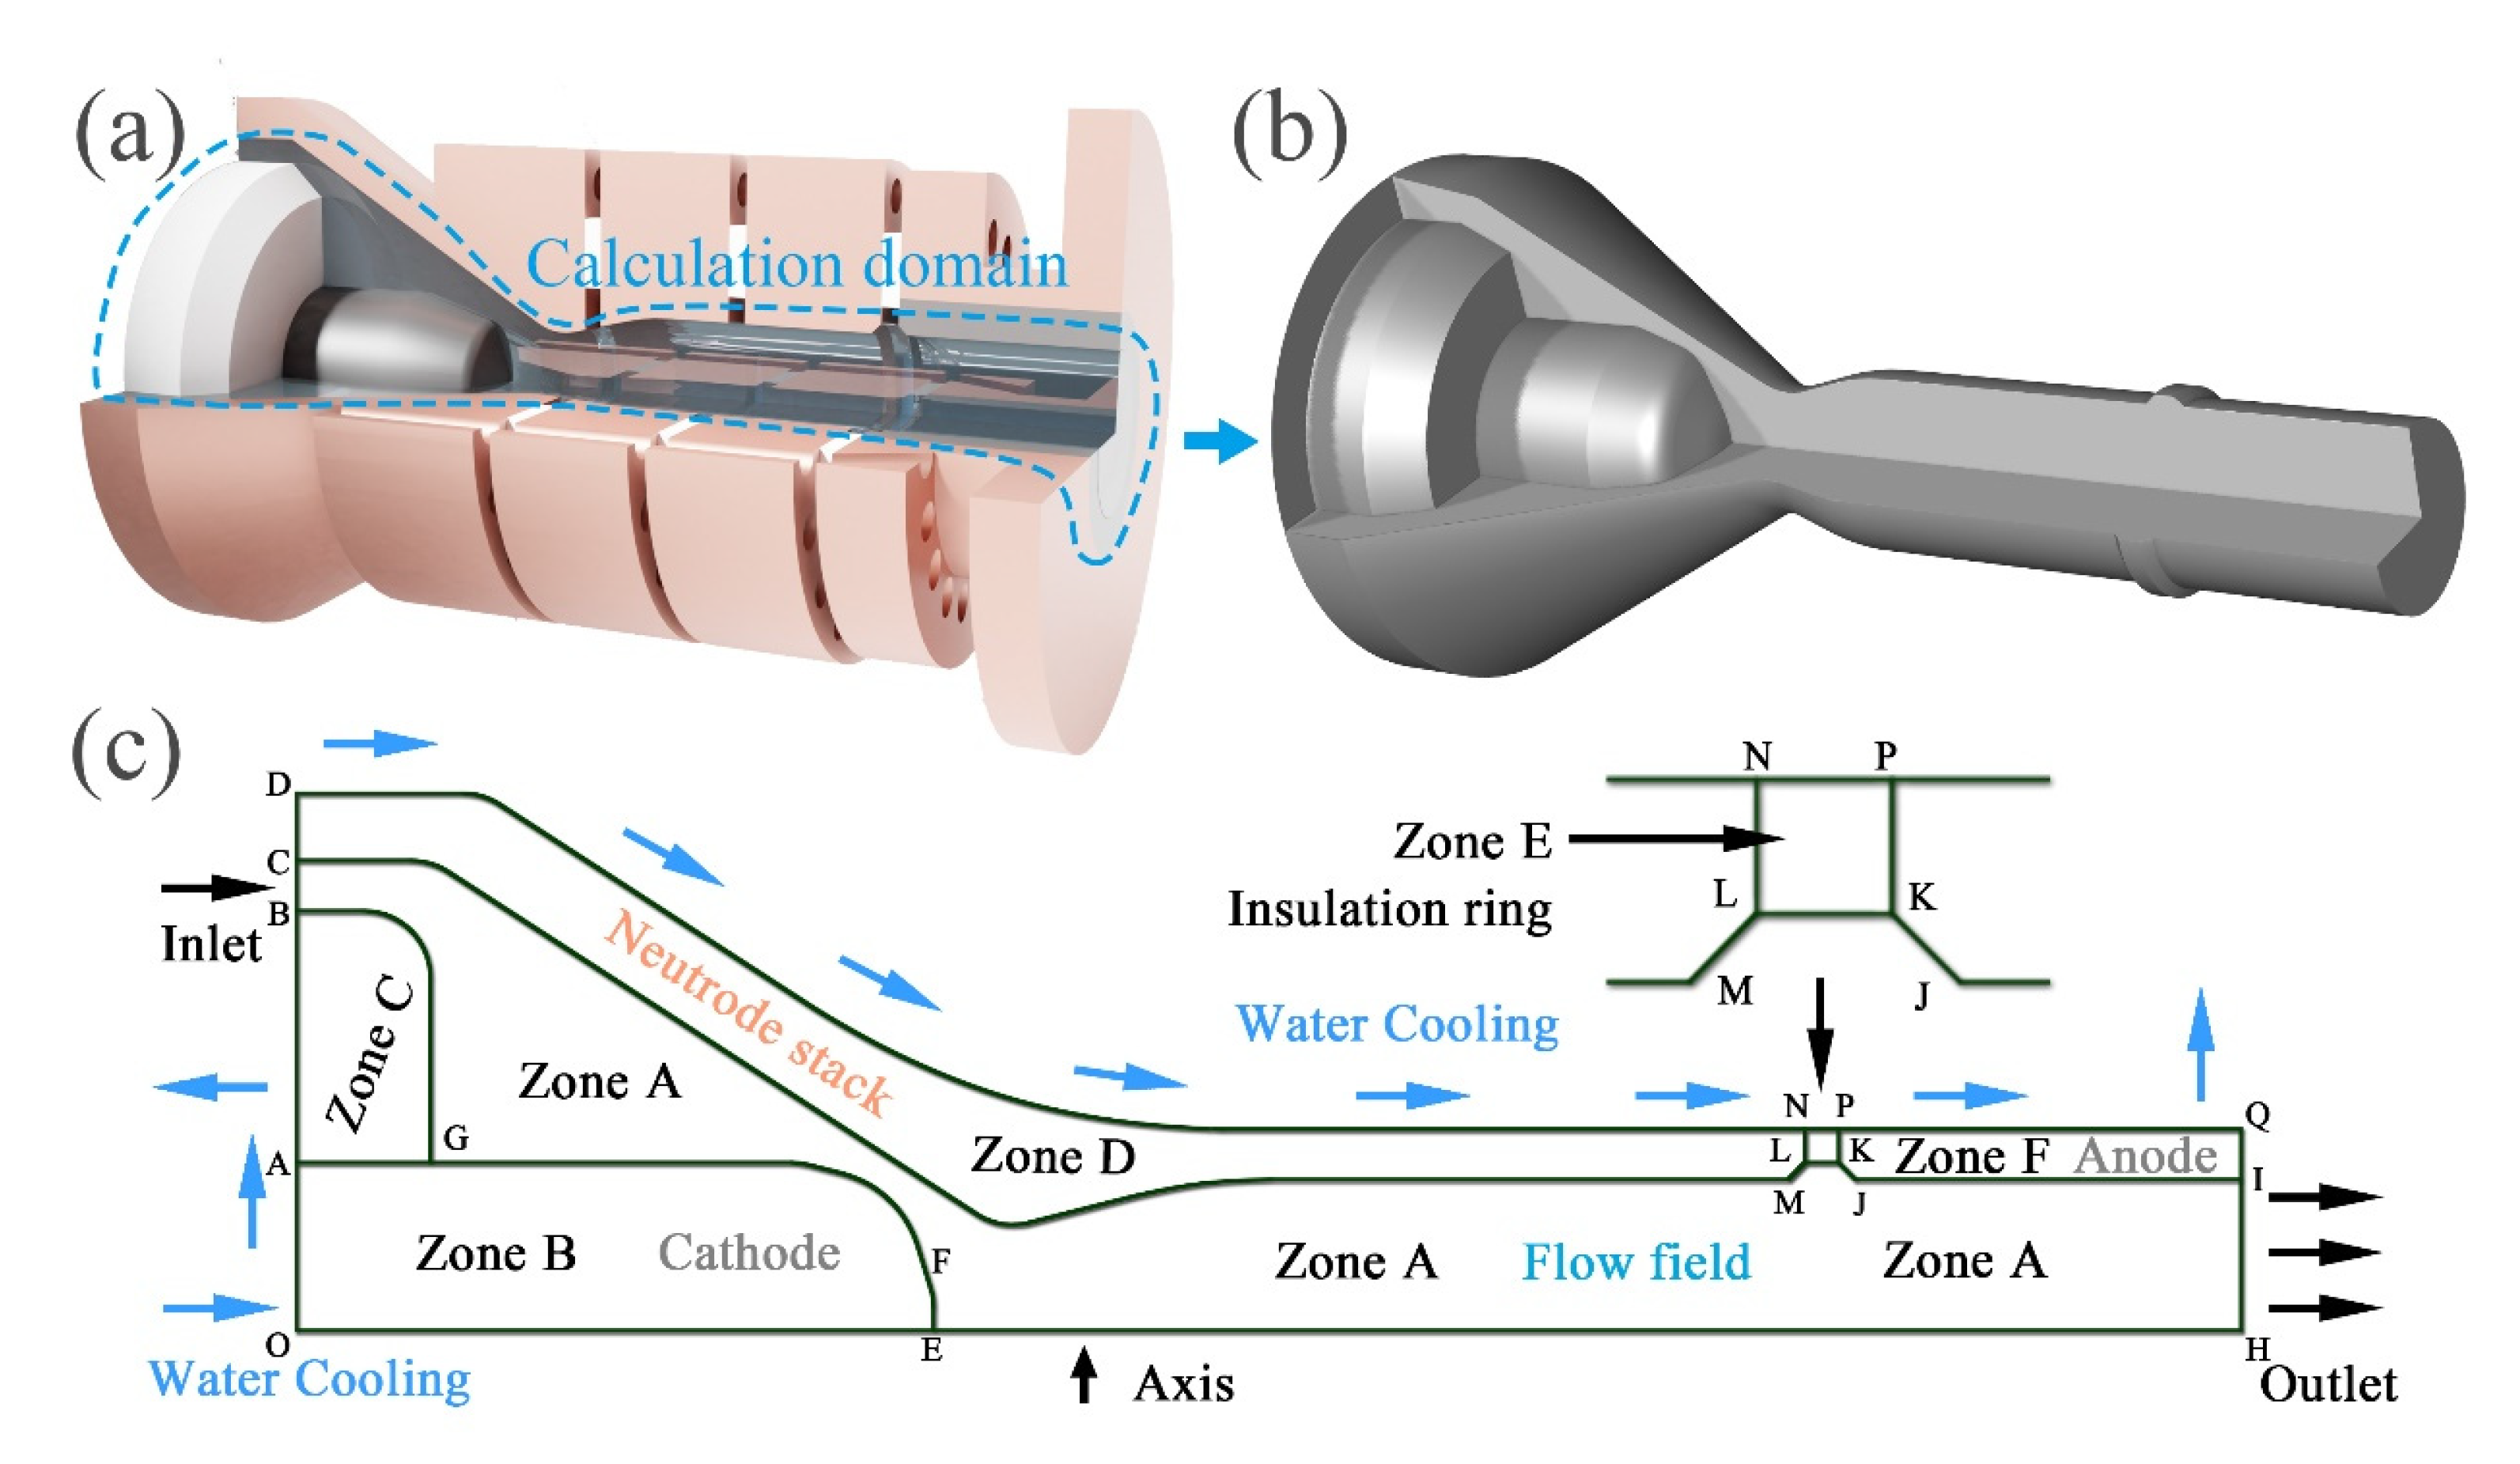
In the simulation, the following equations are used to describe the flow of the gases.
Continuity equation:
ρ t + · ( ρ u ) = 0
Momentum conservation equation:
t ( ρ u ) + ( ρ u · ) u = p + · τ = + S o u r c e m
Energy conservation equation:
( ρ h ) t + · ρ u h = · ( λ c p h ) + S o u r c e E
Here, ρ is the density; t is the time; u is the velocity; p is the pressure; τ = is the viscous stress tensor; h is the enthalpy; c p is the specific heat; and S o u r c e m and S o u r c e E are the source terms for momentum and energy, respectively.
The flow inside the plasma torch and the flow of the plasma jet are separately simulated using laminar flow and turbulent models. Since the cascaded structure inside the SinplexPro™ plasma spray gun can produce a more stable plasma arc, with the shape of the plasma jet more laminar, the turbulent model used has a weak turbulence intensity.
Here, the k-ω SST model is selected as the turbulent model inside the plasma torch as it is more suitable for dealing with fluid simulations with walls. Here, the turbulence kinetic energy, k , and the specific dissipation rate, ω , are obtained from the following transport equations [43]:
t ( ρ k ) + ρ ( u ) k = [ ( μ + μ T σ k ) k ] + P β 0 * ρ ω k
t ( ρ ω ) + ρ ( u ) ω = [ ( μ + μ T σ ω ) ω ] + γ μ T ρ P ρ β 0 ω 2 + 2 ( 1 f v 1 ) σ ω 2 ρ ω k ω
P = m i n ( P k , 10 ρ β 0 * k ω )
For the simulation outside of the plasma torch, since there is no wall around the plasma jet, the standard kω model is used. k and ω are obtained from the following equations [42]:
t ( ρ k ) + x i ( ρ k u i ) = x j ( Γ k k x j ) + G k Y k + S k + G b
and
t ( ρ ω ) + x i ( ρ ω u i ) = x j ( Γ ω ω x j ) + G ω Y ω + G ω b
In these equations, G k represents the generation of turbulence kinetic energy due to mean velocity gradients. G ω represents the generation of ω . Γ k and Γ ω represent the effective diffusivity of k and ω , respectively. Y k and Y ω represent the dissipation of k and ω due to turbulence, respectively. All the above terms are calculated as described in the COMSOL Multiphysics help file [43] and ANSYS Fluent theory guide [42].
For the simulation inside the plasma torch, the momentum source is the Lorentz force:
S o u r c e m = J × B
where J is the current density, and B is the magnetic field.
The energy source term is the heat transport by electric current and Joule heat:
S o u r c e E = 5 2 k B | e | J · h C P + E J
where k B is the Boltzmann constant; e is the elementary charge; and E is the electric field.
For the calculation of the electric field, the following equations are used:
J = σ E = σ φ
where σ is the electric conductivity, and φ is the electric potential.
The magnetic field induced by the electric current is described via the following equations:
B = × A
2 A = × B = μ 0 J
where μ 0 is the permeability constant, and A is the vector potential.
For the simulation of the outer part of the gun, based on the assumption mentioned above, the plasma can be regarded as a uniform gas, neglecting the effects of electric and magnetic fields. However, the effect of gravity must be considered. Therefore, the momentum source term is mainly on the vertical direction.
S o u r c e m = ρ g
where g is the gravity.
The simulation of the inside of the spray gun and the simulation of the external jet of the spray gun are performed by using COMSOL Multiphysics and ANSYS Fluent.

2.3. Torch Geometry

The dimensions of the internal structure of the plasma torch for the arcing simulation are obtained from open-source data and papers [20,40,44]; the specific values are obtained by digital image analysis.
The calculation domain of the arcing process simulation is the part filled by the “transparent fluid” in Figure 1a; the extracted 3D schematic is shown in Figure 1b. The 2D rotationally symmetrical model used is shown in Figure 1c. The whole area is divided into six parts from zones A to F, which are composed of four materials. Zone A is the fluid part, and the material is set as argon. Zone B is the cathode part, and the material is tungsten. Zone C is a ring covering the cathode. Since it does not affect the simulation, the material is regarded as hexagonal boron nitride. Zone D is the cavity formed between the intermediates and the anode of the plasma torch, and the material is copper. Zone E is an insulating ring. The material is hexagonal boron nitride. Zone F is the anode of the plasma torch, and the material is the same as the cathode, tungsten.
The main dimensions are listed in Table 2. BC is the gas inlet, which is annular, with an inner diameter of 11.5 mm and an outer diameter of 14 mm. The extension distance is the same as the AG length, which is 4 mm. The length of the tungsten cathode, OE, is 19 mm, and the diameter is about 5 mm. The overall structure of the flow chamber is a convergent–divergent–parallel structure, with a minimum diameter of about 6.8 mm, and the diameter of the parallel part extending to the nozzle exit is 9 mm. The length from the tip of the cathode to the exit is approximately 39 mm. The length of the anode, PQ, is about 12 mm. The thickness of the cubic boron nitride insulating ring, NP, is about 1 mm. The two slope angles of the insulating ring are set to 45°. The structures of other insulating rings and intermediates are simplified as one part as zone D.
For the jet simulation, the calculation domain is the intercepted part of the atmospheric environment outside the gun, which is also part of the “transparent fluid” in Figure 2a. It should be noted here that to reproduce the expansion phenomenon at the exit, the model is modified. The nozzle exit is extended 0.5 mm into the gun, that is, the horizontal distance of AB is 0.5 mm. At the same time, to improve the convergence of the calculation, a 45° chamfer is made on the original right-angle outlet, that is, OA and AB form an angle of 135°. AO is the plasma inlet boundary, which corresponds to the simulated plasma outlet boundary inside the spray gun. The jet inlet diameter OA is 4.5 mm. The carrier gas is simultaneously injected from the upper and lower directions in the vertical direction. The gas inlet diameter (DI) is 2 mm. The vertical distance between the carrier gas and center of the jet inlet is 12 mm, that is, the CD length is 11 mm; and the horizontal distance from the anode wall is 12 mm, that is, the OC length is 12 mm. OM is the central axis. Due to the chamfer, the length of OM is 100.5 mm. Both KL and ML are free boundaries, which are directly connected to the external environment. See Table 3 for other specific values.

2.4. Boundary Conditions

The current selected for the simulation is 450 A, which is an adequate parameter for plasma spraying with the SinplexPro™ plasma spray gun. Generally, laminar plasma jets are only generated at low gas flow rates. For this cascaded SinplexPro™ plasma spray gun using argon as the working gas, the minimum gas flow rate can reach 40 SLPM. Moreover, the heat and mass transfer properties of argon are more stable compared with the diatomic molecules that dissociate under plasma conditions. The experimental observations also show that the length of the plasma jet and the state of the jet have not been significantly improved and changed due to the addition of other gases within the allowable parameter range of the work (Figure S1). Therefore, the working gas used in the arcing simulation and plasma jet simulation is pure argon. The boundary conditions are listed in Table 4.
The flow boundary condition is only for zone A, which is the fluid part. The working gas enters from the inlet BC, and the boundary condition of the volume flow inlet is set to 40 standard liters per minute (SLPM). IH is the flow outlet connecting to the atmosphere, and the Dirichlet boundary condition is used, V i / n = 0 . All the walls that are in direct contact with the fluid are nonslip walls.
For the heat transfer boundary conditions, all the 6 zones are involved in the heat transfer process. Zone A is the flow area, which mainly involves the temperature of the gas inlet and outlet, and the heat exchange with the wall. The temperature of the inlet gas is room temperature: 300 K. For the exit, the outflow boundary condition is chosen. All internal walls are capable of performing convective heat transfer between the fluid, and the coefficient is the default value of the software according to the material. Zone B is the tungsten cathode. The temperature of the tip of the cathode, EF, is set to 3500 K. OA is in contact with the cooling water and is set to be h w ( T T w ) . In the same way, for areas C, D, E, and F, the walls in contact with the blue arrows in Figure 1 c all use the same boundary condition, where h w = 1000   W / ( m 2 · K ) and T w = 300   K . For the electric boundary conditions, zones A, B, and F are mainly involved. The average current density of the cathode tip EF is 1.36 × 10 8   A / m 2 to achieve 450 A working conditions. The voltage of anode, PQ, is 0 V, and the other walls that contact with area A meet the insulation boundary condition, that is, φ / n = 0 . For magnetic field boundary conditions, all interfaces are magnetically insulated walls.
For the simulation of the plasma jet outside the gun, the magnetic and electric fields are neglected. The main parameters are listed in Table 5. Based on the description in Figure 2, the boundary conditions of flow and heat transfer are mainly used. The velocity and pressure distributions of the working gas from inlet, OA, are from the results of the arcing simulation. For the simulation using the turbulent model, the distributions of k and ω are also from the arcing simulation results. As an open boundary, KLM is connected to the atmosphere with the pressure of 1 atm and Dirichlet boundary condition, V i / n = 0 . The flow rate of the carrier gas at the inlet, FG, is 2 SLPM. For the heat transfer boundary conditions, all walls are water-cooled walls, which are the same as the arcing simulation. Since the open boundary KLM is connected to the atmosphere, the temperature boundary condition is T / n = 0 , and if there is a reverse flow from the outlet boundary, the temperature of the gas will be 300 K.

2.5. Material Properties

The working gas used in the simulation is pure argon. The main parameters used are density, specific heat, viscosity, thermal conductivity, and electrical conductivity. The data for the parameters mentioned above were taken from [45]. Moreover, the characteristic data of the cathode and anode materials, tungsten, and copper, as well as of the cathode carrier, cubic boron nitride, were taken from the built-in material library of the software.

3. Results and Discussions

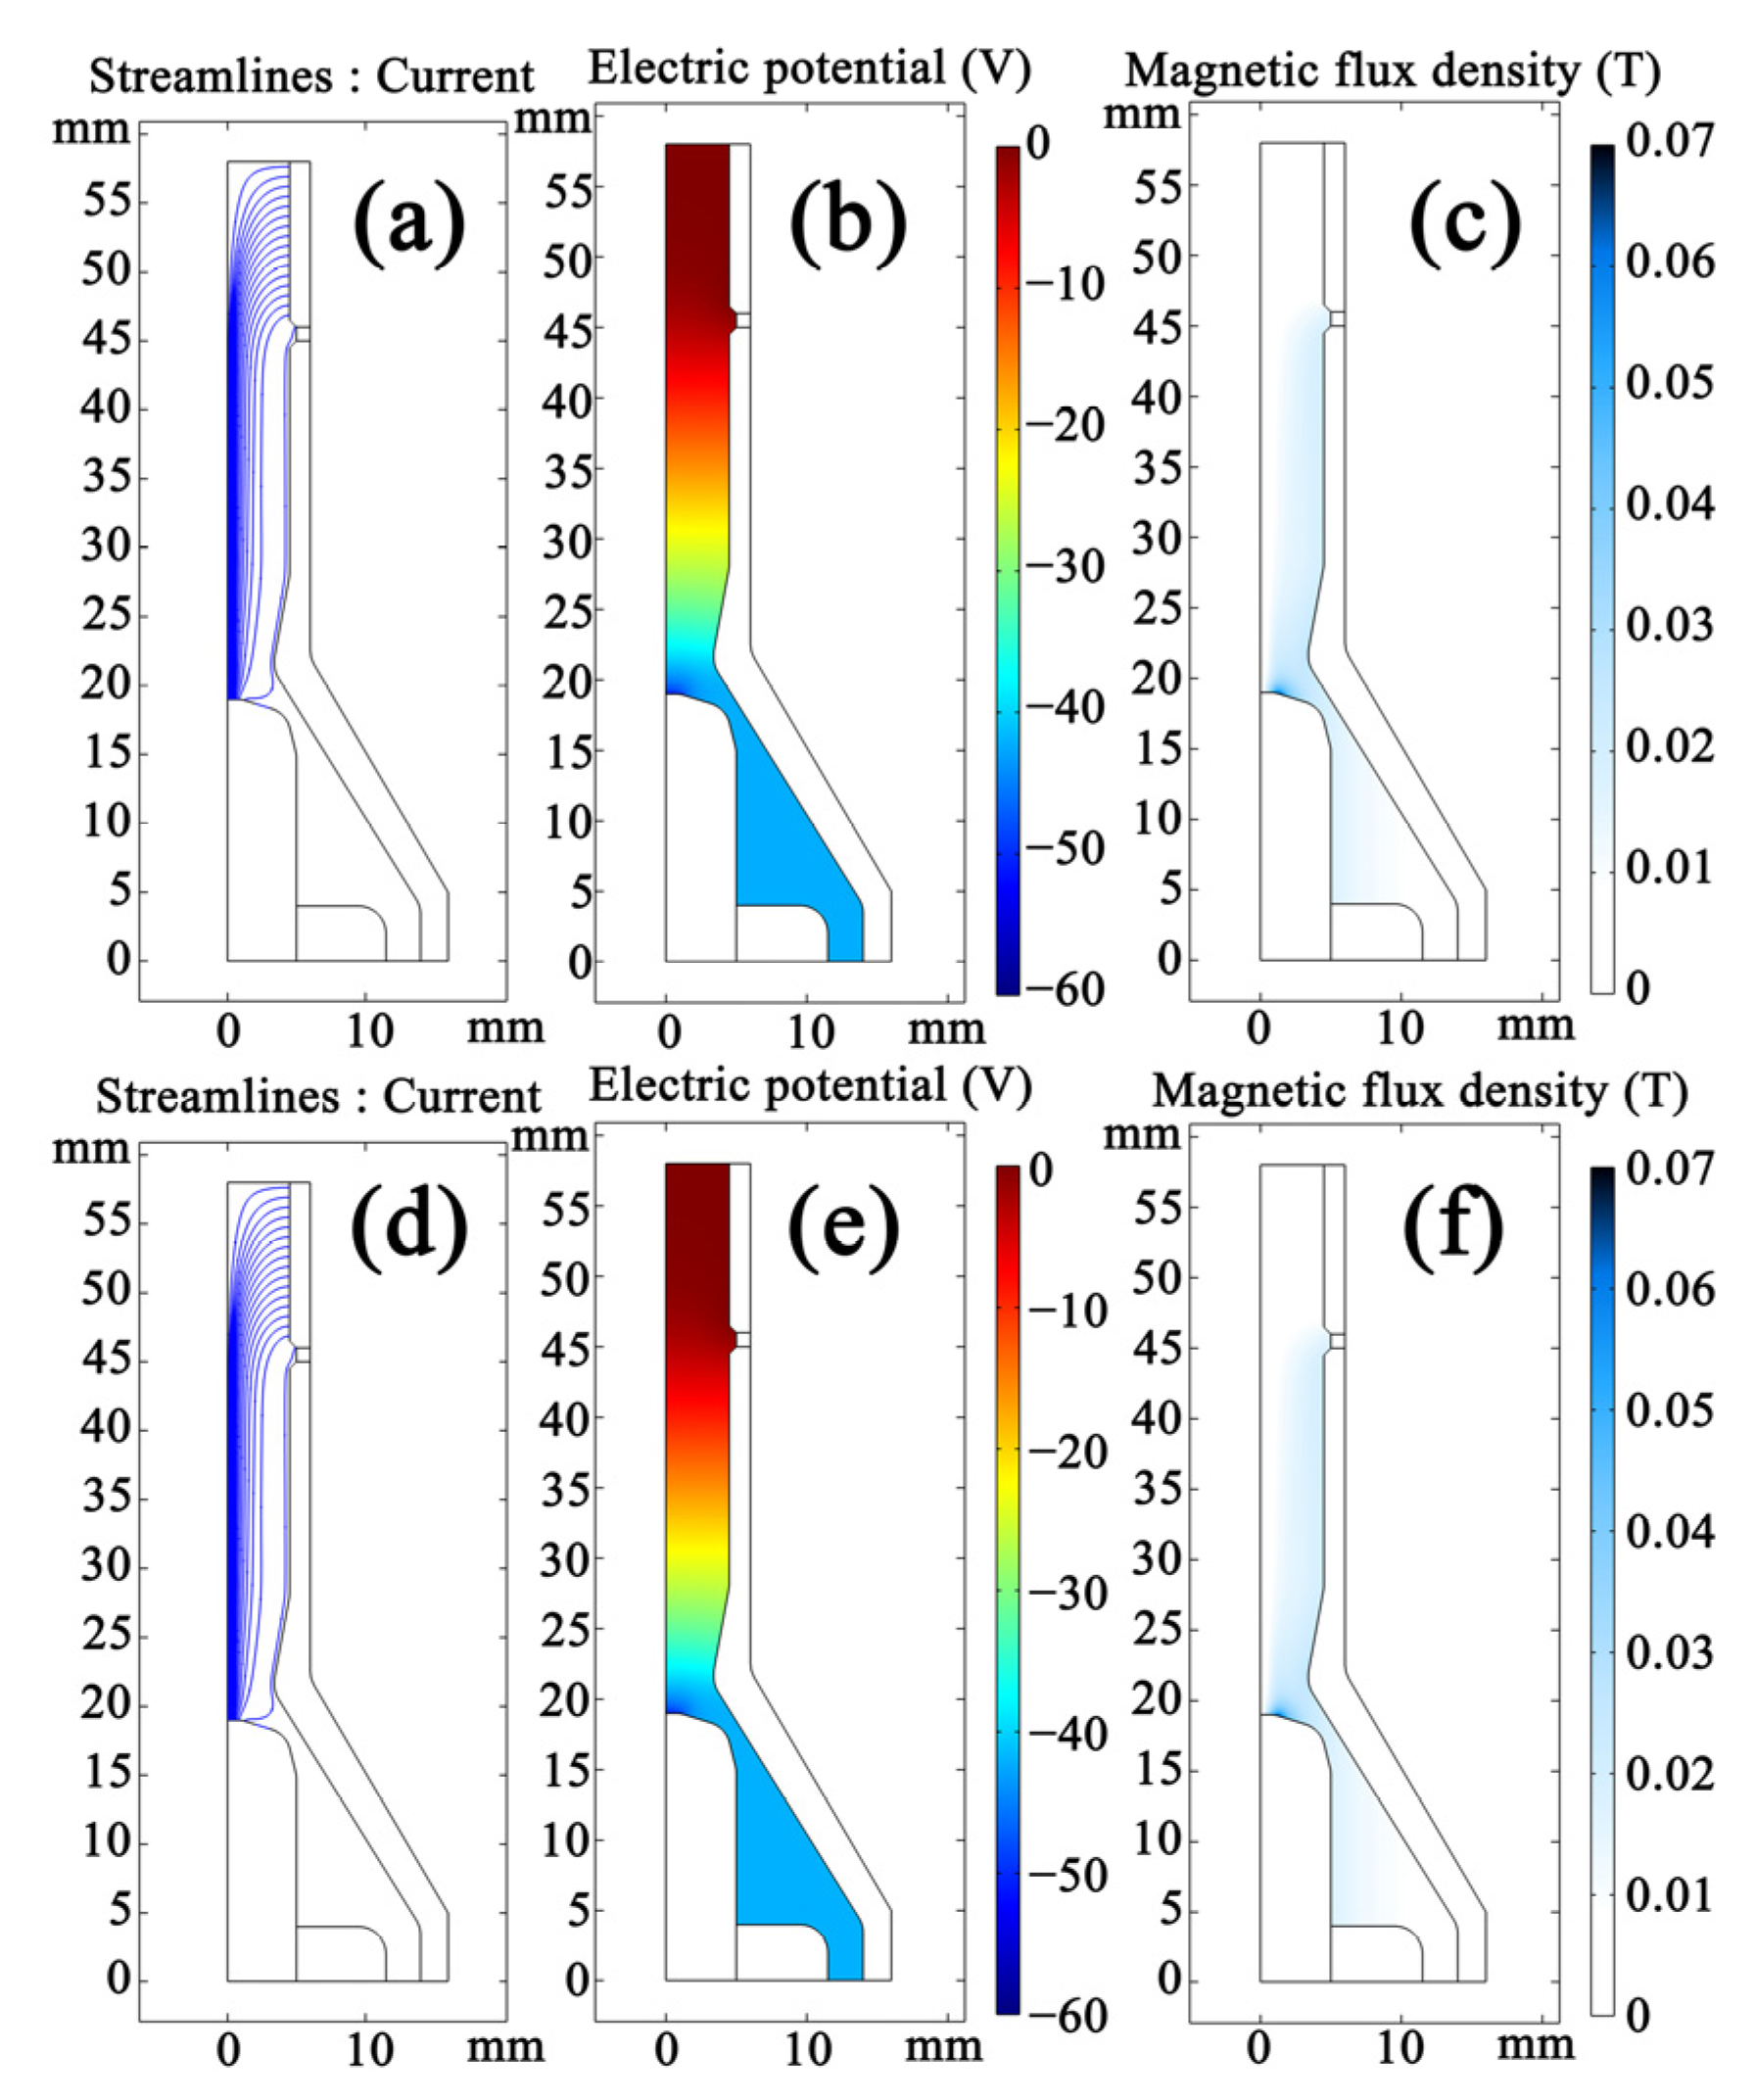
3.1. Simulation of the Arcing Process Inside the SinplexPro™ Plasma Spray Gun

By a stepwise increase of 0.1 times the target current, the current is increased to the final current. The resulting temperature, velocity, and pressure distributions in the SinplexPro™ Plasma spray gun are shown in Figure 3. The corresponding distributions of the plasma at the exit are shown in Figure 4.
Both laminar and turbulent results show that the highest temperature appears near the tip of the cathode. For the laminar model, the maximum temperature is about 24,380 K (Figure 3a), and for the turbulent model, the maximum temperature is about 24,390 K (Figure 3d). The highest temperature at the plasma exit of the laminar model is about 15,413 K, and the counterpart obtained by the turbulent model is about 15,425 K (Figure 4a). When the turbulent model is activated, the dissipation of kinetic energy caused by turbulence was considered, and the dissipation energy is converted into thermal energy, which leads to the higher temperature of the plasma arc. Moreover, at the exit of the plasma torch, the temperature (1403 K) on the wall calculated by the turbulent model is also higher than the temperature calculated by the laminar model (1172 K). During the calculation, a turbulent model is used by solving the RANS (Reynolds average Navier–Stokes) equation. This cannot resolve the small eddies, but a reasonable result based on the average value can be obtained. In reality, there are numerous small eddies inside the plasma torch. These small eddies will convert the kinetic energy into thermal energy and enhance the process of convective heat transfer inside the plasma. Therefore, compared with the laminar model, the temperature calculated by the turbulent model is a little higher. However, the temperature difference at the nozzle exit between the results calculated by the two models is about 200 K near the internal wall of the torch and only 12 K at the center of the exit.
During the arc discharging process, which converts the working gas into a plasma, the volume expansion and Lorentz force lead to the high velocity of the plasma. For the simulation with the laminar model, the maximum velocity is about 1230 m/s (Figure 3b), whereas it is lower at about 1214 m/s for the turbulent model (Figure 3e). As mentioned above, the turbulence state will endure the severe dissipation of kinetic energy, so the velocity is lower. The maximum velocity of the plasma at the exit is above 800 m/s (815 m/s for the laminar and 808 m/s for the turbulent model, shown in Figure 4b). However, the minimum value near the nozzle wall is close to zero. In the case of the laminar model, the boundary condition sets the velocity of the plasma flow next to the wall to zero. For the turbulent model, the flow near the wall still shows a low velocity, 22 m/s, as a result of averaging.
The pressure distribution is shown in Figure 3c (laminar) and Figure 3f (turbulent). The pressure at the contraction near the tip of the cathode is relatively high. The gas flow rate at the inlet is 40 SLPM, about 13 m/s. Due to the relatively low velocity, compared with plasma expansion, the pressure on the cathode side does not significantly change. During the arcing process, the working gas in front of the cathode tip transfers into a plasma by the discharging process and expands. Due to the continuous supply of working gas, the pressure rises around the cathode and finally reaches a balance. Near the nozzle exit, the velocity of the plasma gas close to the wall is lower. Therefore, the pressure is higher near the wall than in the center (Figure 4c).
The turbulent energy distribution inside the plasma torch is shown in Figure 3. Even if the turbulent model is used, the turbulent kinetic energy, k, obtained in the simulation is still very low. The range of the value of k is large, which makes it difficult to observe. Therefore, in Figure 3g, only the part below 1 × 10¹⁰ and, in Figure 3h, the distribution of log(k) are shown. The turbulent kinetic energy reaches the highest value at the inlet and gradually decreases as the flow develops in the plasma torch. Moreover, the turbulent flow energy is lower in the area closer to the center and the wall. Due to the viscous sublayer, the plasma velocity near the wall is low, which makes the flow tend to be laminar and reduce the turbulent kinetic energy. In the central part, the plasma is accelerated, and the velocity does not show a great gradient in the radial direction. Therefore, the viscous shear between the center and wall is the largest, which makes it easier to produce eddies and to intensify the amount of turbulence. However, the turbulent intensity in the chamber is negligible compared with the working gas inlet. Therefore, the flows inside the plasma torch calculated by the laminar and turbulent models are almost the same.
Figure 5 shows the current streamline, electric potential distribution, and magnetic field strength distribution. No matter whether the turbulent model or the laminar model is used, there is almost no difference between these results on the electric and magnetic characteristics. The current streamlines calculated by both models are virtually the same (Figure 5a,d). The voltage experimentally measured is about 60 V. The voltage calculated here is about 52 V (Figure 5b,e), which is a little lower than the measured value. During the calculation of the LTE model, the decrease in the temperature near the anode will cause a low electric conductivity of the plasma, which makes the calculation tend to be divergent. To ensure the convergence of the calculation, a virtual high-conductivity layer is artificially added to the anode boundary by customizing the properties of the plasma gas. Due to the existence of this artificial layer, the voltage calculated is slightly lower than the actual value. The distribution of the magnetic field strength is shown in Figure 5c,f. Since the current has almost no difference under different flow conditions, the self-generated magnetic field hardly changes.
Comparing the temperature and velocity profiles at the nozzle exit with the other work on the SinplexPro™ plasma spray gun [40], the results obtained in this work appear sensible. For both the turbulent and laminar models, the results are nearly the same for the internal flow of the plasma torch. Therefore, the flow inside the SinplexPro™ plasma spray gun can be regarded as laminar for the investigated operation conditions.

3.2. Simulation of the Plasma Jet Generated by the SinplexPro™ Plasma Spray Gun

The simulation of the external jet flow was calculated also by laminar and turbulent models. The laminar model was used to see the ideal results of the laminar plasma jet. The turbulent model should be more realistic to describe the plasma jet since turbulence is inevitable. Here, we used the laminar plasma jet only to represent the plasma jet simulated by the laminar model, and we used the turbulent plasma jet to represent the plasma jet simulated by the low Re corrected SST k–ω model when the simulation results are discussed. Both models are compared to discuss the laminarity of the plasma jet generated by the SinplexPro™ plasma spray gun.
The boundary conditions used in the plasma jet simulation originate from the results of the arcing simulation. For the laminar model, the boundary condition mainly comprises the temperature, velocity, and pressure distribution. For the turbulent model, the distributions of k and ω values are additionally needed. The relevant results about the temperature, velocity, and pressure are given above as shown in Figure 4.
The experimentally observed shapes of the plasma jets using 400 A and 500 A are shown in Figure 6. Generally, in the case of free jet flow, the tail of the jet always tends to be turbulent, and the captured image is an average of many instants during the exposure time. Therefore, the turbulent plasma jet will show a tendency to diverge with a round tail. However, no matter whether it is 400 A or 500 A, the tail of the plasma jet generated by the SinplexProTM plasma spray gun has no obvious divergent tendency or a round tail. This morphology corresponds to a laminar plasma jet [46]. The laminar flow state leads to a stable plasma jet with less fluctuation, which results in less entrainment of ambient air and lower energy gradients [21,38,47,48]. A hypothesis is proposed to explain why the shapes of the plasma jets are different. The photo only shows the area where visible light is emitted. For the turbulent plasma jet, strong turbulent dissipation occurs very close to the nozzle exit, where the plasma jet is still visible. Therefore, due to the strong turbulence, the tail shows a round shape. For the laminar plasma jet or quasi-laminar plasma jet, the turbulent dissipation occurs farther away from the nozzle exit, where there is no visible light that can be observed. Therefore, the round tail cannot be observed. What can be captured by the eyes and camera is that the light is gradually smoothly disappearing along the axial direction. For the plasma jet generated by the SinplexPro™ plasma spray gun, before the flow converts into turbulent, the temperature of the plasma jet has obviously decreased to a brightness level that cannot be observed. Therefore, the shape of the plasma jet shows a sharp tail rather than a round one. In the Figure S2, a comparison between the experimentally observed plasma jets generated by the SinplexPro™ plasma spray gun under normal and abnormal conditions when the ablation of the anode is severe is provided. The plasma jet generated under the normal condition is longer since the flow state is laminar and stable. On the other hand, the plasma jet generated under the abnormal condition shows a round tail, which proves that the turbulent dissipation happens within the visible area. The only difference between the two plasma jets is the internal structure of the plasma spray gun. The ablated anode disturbs the flow stability due to the presence of numerous ablation pits. Therefore, the smaller the disturbance to the flow inside the plasma torch is, the more stable the flow state will be, and the more likely the plasma jet will be kept laminar and longer.
Due to this characteristic of the SinplexPro™ plasma jet, the simulation was performed using both the laminar and k–ω models with low Reynolds number adjustment. The temperature and velocity distributions of the plasma jets are shown in Figure 7 after obtaining stable and converging residuals. Here, for the convenience of comparison, the results about the plasma jet with carrier gas, which will be discussed in the next section, are also included in the same figure. All the parts of temperature and velocity distributions of the pure plasma jet without carrier gas are on the left side of the figure. The plasma jet calculated by the laminar model is described as the laminar plasma jet to make it brief to discuss, and the same wording was used for the turbulent plasma jet.
Without carrier gas injection, the results calculated by the laminar and turbulent models of the plasma jet both show high axial symmetry. From the temperature distribution, the plasma jet maintains a high temperature at a long distance from the nozzle exit, which is consistent with the observed shape of the long plasma jet. However, the laminar plasma jet shows a larger high-temperature zone, which is attributed to the low heat dissipation. The counterpart of the turbulent plasma jet is smaller and shows a sharper triangle shape. However, the medium-temperature zone of the turbulent plasma jet is larger than that in the laminar plasma jet. The shape of the plasma jet generated by the SinplexPro™ plasma spray gun looks like a turbulent plasma jet with a low Re number and low turbulence intensity. It can be regarded as quasi-laminar but still not totally laminar since the gas flow rate and nozzle diameter are much larger than those of the commercial laminar plasma torch, which has a nozzle diameter of only 5 mm [21,26,49].
To discuss the difference, the maximum value of each cross-section of the jet was selected and explored. Figure 8 shows the profiles of the temperature and velocity along the central axis. The density of the plasma is lower than that of the surrounding air. Since the gravity is introduced, the buoyancy of the air causes the plasma jet to slightly float. The code used to grab the maximum temperature and velocity values is provided in the supplementary file. However, the result shows that within 100 mm, the longest distance considered in the simulation, the maximum temperature appears on the axis. Therefore, the temperature development along the axis is used for further discussion.
The node values along the axis prove that the temperature of the turbulent plasma jet is lower. The deviation starts at the 10 mm axial distance. The maximum temperature difference is about 1700 K at the end of the calculation domain. It tends to be greater if the turbulent dissipation has a larger effect on the temperature. In this case, the heat transfer in the laminar plasma jet is dominated by diffusion, and the heat loss is little. The heat transfer in the turbulent plasma jet is dominated by convection, which is faster than diffusion. Therefore, when the air does not completely invade the center of the jet, within 10 mm, the temperature calculated by the turbulent model is close to that calculated by the laminar model. In the turbulent state, the cool ambient air enters the center of the jet faster. Therefore, the temperature of the turbulent plasma jet decreases also faster than that of the laminar plasma jet.
Figure 9 gives the cross-sectional views of the temperature and velocity distributions of the plasma jet. It is obvious that even when the center temperature is very close, the high temperature zone of the turbulent plasma jet has already, at 15 mm, a smaller diameter than the laminar plasma jet. However, if the blush boundary is regarded as the boundary of the jet, the turbulent plasma jet is thicker than the laminar plasma jet, which is also confirmed by the side and top views. In the turbulent case, the temperature tends to expand due to the eddies caused by the engulfment of the cold air. Therefore, based on the conservation of energy, the heat flux in the laminar flow will be more concentrated than that in the turbulent flow. At 100 mm, the central temperature of the turbulent plasma jet is significantly lower compared with that of the laminar model. However, the radius of the plasma jet is larger than that of the laminar plasma jet. Besides the area of the cross-sections of the plasma jet, the symmetry of the plasma jet changes. When the distance is 15 mm, the laminar plasma jet is round and hardly affected by the gravity. The turbulent plasma jet shows an obvious flow-up tendency.
For the velocity of the plasma jet, the results of the laminar and turbulent plasma jets are almost the same (Figure 7, bottom left). Compared with the temperature distribution, the velocity distributions of the plasma jets show a little difference as the laminar plasma jet seems to have a larger medium velocity zone than the turbulent plasma jet. However, near the exit, before the ambient air is entrained into the plasma jet to influence the velocity, the velocities of both laminar and turbulent plasma jets are almost the same and the profiles are not smooth. Figure 8 also shows the pressure distribution along the axis near the nozzle. Within about 2 mm from the nozzle exit, due to the sudden expansion of the cross-sectional area, the pressure drops, and the velocity of the plasma jet very slowly drops. During this drop, the environment pressure is greater than the internal pressure of the plasma jet, resulting in the pressure difference that contributes to a radial velocity, about 60 m/s, toward the center of the jet of the ambient air. As the gas converges toward the center of the plasma, the pressure starts to rise, and the velocity significantly drops, as shown in Figure 8. Due to the high temperature at the plasma outlet, the local speed of sound (2200 m/s) by far exceeds the local velocity (800 m/s), so the flow is subsonic. After an obvious pressure fluctuation, the internal pressure of the plasma and the ambient pressure gradually regionally balance, the radial velocity is almost zero, and the axial velocity steadily drops. No diamond shocks can be observed. This phenomenon also explains that the temperature profiles of both laminar and turbulent plasma jets have the largest gradient at the beginning, and the gradient gradually decreases as the distance increases.
As shown in Figure 8, the velocity of both laminar and turbulent plasma jets steadily decreases when the distance is greater than 20 mm. However, the velocity gradients in the two plasma jets are different. The highest velocity difference value appears at about 60 mm. Within 60 mm, the turbulent plasma jet shows a higher gradient than the laminar plasma jet. However, when the distance exceeds 60 mm, the gradient of the turbulent plasma jet begins to decrease, and the velocity difference between the laminar and turbulent plasma jets becomes smaller. Generally, a laminar plasma jet should have lower temperature and velocity gradients, which makes the result appear abnormal. Observing the velocity distributions on the cross-sections of the plasma jet (Figure 9) reveals that the high-velocity region of the laminar model is larger than that of the turbulent model, which also seems abnormal as the laminar plasma jet should have more focused distributions of both temperature and velocity.
Whatever the model used to simulate the plasma jet, they all proved that the plasma jet generated by the cascaded plasma torch at least can be quasi-laminar, and the temperature and velocity gradient are lower than those of the turbulent plasma jet. This characteristic helps the particles stay longer in the plasma jet during the spraying process. In fact, previous research has shown that the particles in the laminar plasma jet in a certain range of distance have similar temperature and velocity [30,34,39], which helps improve the controllability and reproducibility. For the commercial laminar plasma torch, if the flow rate increases to the same level as the SinplexPro™, the flow state of the plasma jet is likely to be turbulent [25]. For the case in which a high flow rate is needed besides the laminar flow state, a quasi-laminar plasma jet generated by a cascade torch can be an option.

3.3. Simulation of the Plasma Jet with Carrier Gas

The carrier gas plays an important part in the flow state of the laminar plasma jet. In this case, the carrier gas is injected from both the top and bottom sides; it is also argon. The temperature and velocity distribution results are shown in Figure 7 (the right part). The injection of cold carrier gas has a great influence on the temperature distribution of both the laminar and turbulent plasma jets. The plasma jets are compressed by the carrier gas. Both plasma jets appear thinner in the side views. For the laminar plasma jet, the top view shows that a great amount of heat is taken away by the carrier gas. The high-temperature zone also becomes thinner. However, for the turbulent plasma jet, the temperature contour from the top view is not significantly affected.
Figure 8 also shows the temperature of the center of the plasma jet with carrier gas injection. Since the laminar plasma jet still has a larger high-temperature zone and a higher heat flux density, the temperature along the axis is also higher than that of the turbulent plasma jet. However, the carrier gas influence on the laminar plasma jet is much larger than on the turbulent plasma jet. The temperature decrease in the laminar plasma jet is about 900 K at the end of the calculation domain, at 100 mm, while in the turbulent plasma jet, it is less than 100 K. The temperature of the center of the turbulent plasma jet is hardly affected within 60 mm, much less than for the laminar plasma jet.
The cross-sections of the plasma jets show that when the carrier gas is introduced, the effect of gravity on the temperature distributions of the laminar plasma jet is still negligible, but that of the turbulent plasma jet becomes more obvious on the 15 mm cross-section of the temperature distribution of the turbulent plasma jet in Figure 9. As mentioned above, the carrier gas from both top and bottom injectors moves to both sides after compressing the plasma jet. Part of the plasma jet that squeezed to the side continuous to move upward due to the buoyancy of the cold ambient air. Therefore, with the effect of the uneven shear stress caused by the carrier gas from the top part with vertical velocity and steady ambient air beneath the plasma jet, large eddies are formed.
On the section 100 mm away from the nozzle outlet, it can be seen from the temperature distribution that, although the temperature of the laminar plasma jet remains high, the high-temperature area is significantly reduced. This phenomenon can be seen in Figure 7. However, by observing the cross-section, the shape of the plasma jet is not an ideal ellipse (Figure 9, temperature, laminar, 100 mm). Generally, a disturbance will appear around the laminar plasma jet due to the introduction of the entrained gas. Such a disturbance may be attributed to the asymmetry of the mesh or limited accuracy of the computer. However, the ambient air in the actual operating environment is also likely to cause such asymmetric results. For the turbulent plasma jet, no significant change can be observed, but the temperature distribution has changed (Figure 9, temperature, turbulent, 100 mm). Due to the continuous injection of cold entraining gas, the upper part of the turbulent plasma jet is not significantly heated, and the upward tendency is mainly on the sides of the plasma jet.
Compared with the temperature distribution, the effect of carrier gas on the velocity distribution is smaller. It can be seen in Figure 7 that whether it is a laminar plasma jet or a turbulent plasma jet, there is a slight tendency to be compressed in the vertical direction (side view). In the horizontal direction (top view), the velocity distribution hardly changes. It can also be seen in Figure 8 that the change in velocity is much smaller than the change in temperature. For the laminar plasma jet, the velocity decrease due to the carrier gas injection is less than 20 m/s. On the other hand, for the turbulent plasma jet, the velocity decrease is less than 5 m/s. The profiles of the turbulent results almost coincide in Figure 8. As shown in Figure 9, the actual velocity distribution also conforms to the tendency of the temperature distribution. It can be seen from the front view that at the 15 mm cross-section, the injection of the carrier gas reduces the velocity of the small part above and below the plasma jet, and two symmetrical notches can be seen in the contour. At the 100 mm cross-section, the velocity distribution of the laminar plasma jet shows the same rotational tendency as the temperature distribution. The velocity distribution of the turbulent plasma jet also shows a similar trend to that of the temperature distribution, with the sides slightly floating upward.
Regardless of the velocity or temperature distribution, the simulation results show that the turbulent plasma is less affected by the carrier gas. In previous studies, it was also confirmed that the laminar plasma jet is more susceptible to the disturbance and likely transformed into a turbulent plasma jet. In this case, using the RANS turbulence model, it is difficult to discover the effect of the entrained gas on the flow state of the plasma jet only through the temperature and velocity distributions. Figure 10 shows the turbulence intensity distributions of the turbulent plasma jet with and without carrier gas. Comparing the turbulence intensity distribution with the temperature distribution, whether the carrier gas is introduced or not, the turbulence is mainly at the boundary of the plasma jet, lower in the high-temperature regions. Before the introduction of the carrier gas, under the influence of buoyancy, the hot plasma gas floats upward. As the plasma jet continues to develop, the turbulent intensity increases. Therefore, the area of maximum turbulence intensity is above the plasma jet. After the carrier gas injection, the highest turbulence intensity is about 300% right above and below the plasma jet where the carrier gas is injected. However, the area with the highest turbulence intensity is not the part where the plasma jet is in direct contact with the carrier gas, but the sides of the plasma jet. When the carrier gas is injected to the plasma jet, part of the carrier gas directly goes into the plasma jet. Part of the carrier gas from the injectors above will rise due to air buoyancy after being heated. Part of the carrier gas from the lower injector moves sideways and then continues to flow forward with the plasma jet. The lower carrier gas floating up due to heating and the ambient air entrained into the plasma jet are mixed to produce a large number of small eddies, resulting in greater turbulence intensity, close to 800%, 10 times that when no carrier gas is added.
Although the turbulence intensity will affect the flight state of particles and the flow state of droplets to a certain extent, compared with the laminar plasma jet, the overall flow state is not significantly affected by the entrained gas. The temperature and velocity distributions are still similar to those before the carrier gas is injected. Therefore, the controllability of the laminar plasma-spraying process can still be maintained. Due to the characteristics of the laminar flow state, longer heating region and dwelling time result in better melting of the particles. In the laminar plasma-spraying process, it has been proved that the coating obtained at the nearest standoff distance is not the densest. Although the surface temperature of the particles is high, the core temperature is still low, and the gravity-based feeding of the particles cannot guarantee that the particles can enter the center of the plasma jet for heating, which will result in more semimolten particles [39]. In contrast, the plasma jet generated by a cascaded plasma torch such as SinplexProTM can maintain the quasi-laminar flow characteristics, larger high-temperature zone, and feasibility to feed the powder with carrier gas without disturbing the flow state. Under this condition, the particles have a higher initial velocity and can enter the center of the jet, so it is easier for the particles to absorb more heat and melt to form a dense coating [13]. Therefore, this cascade spray gun has the potential to generate quasi-laminar or even laminar plasma jets with higher stiffness, which can improve the heating efficiency of the particles and the flight and flow state of the droplets in the jet.

4. Conclusions

In this work, the arcing process inside the cascaded SinplexPro™ plasma spray gun and the flow characteristics of the generated plasma jet were studied. The following conclusions can be drawn:
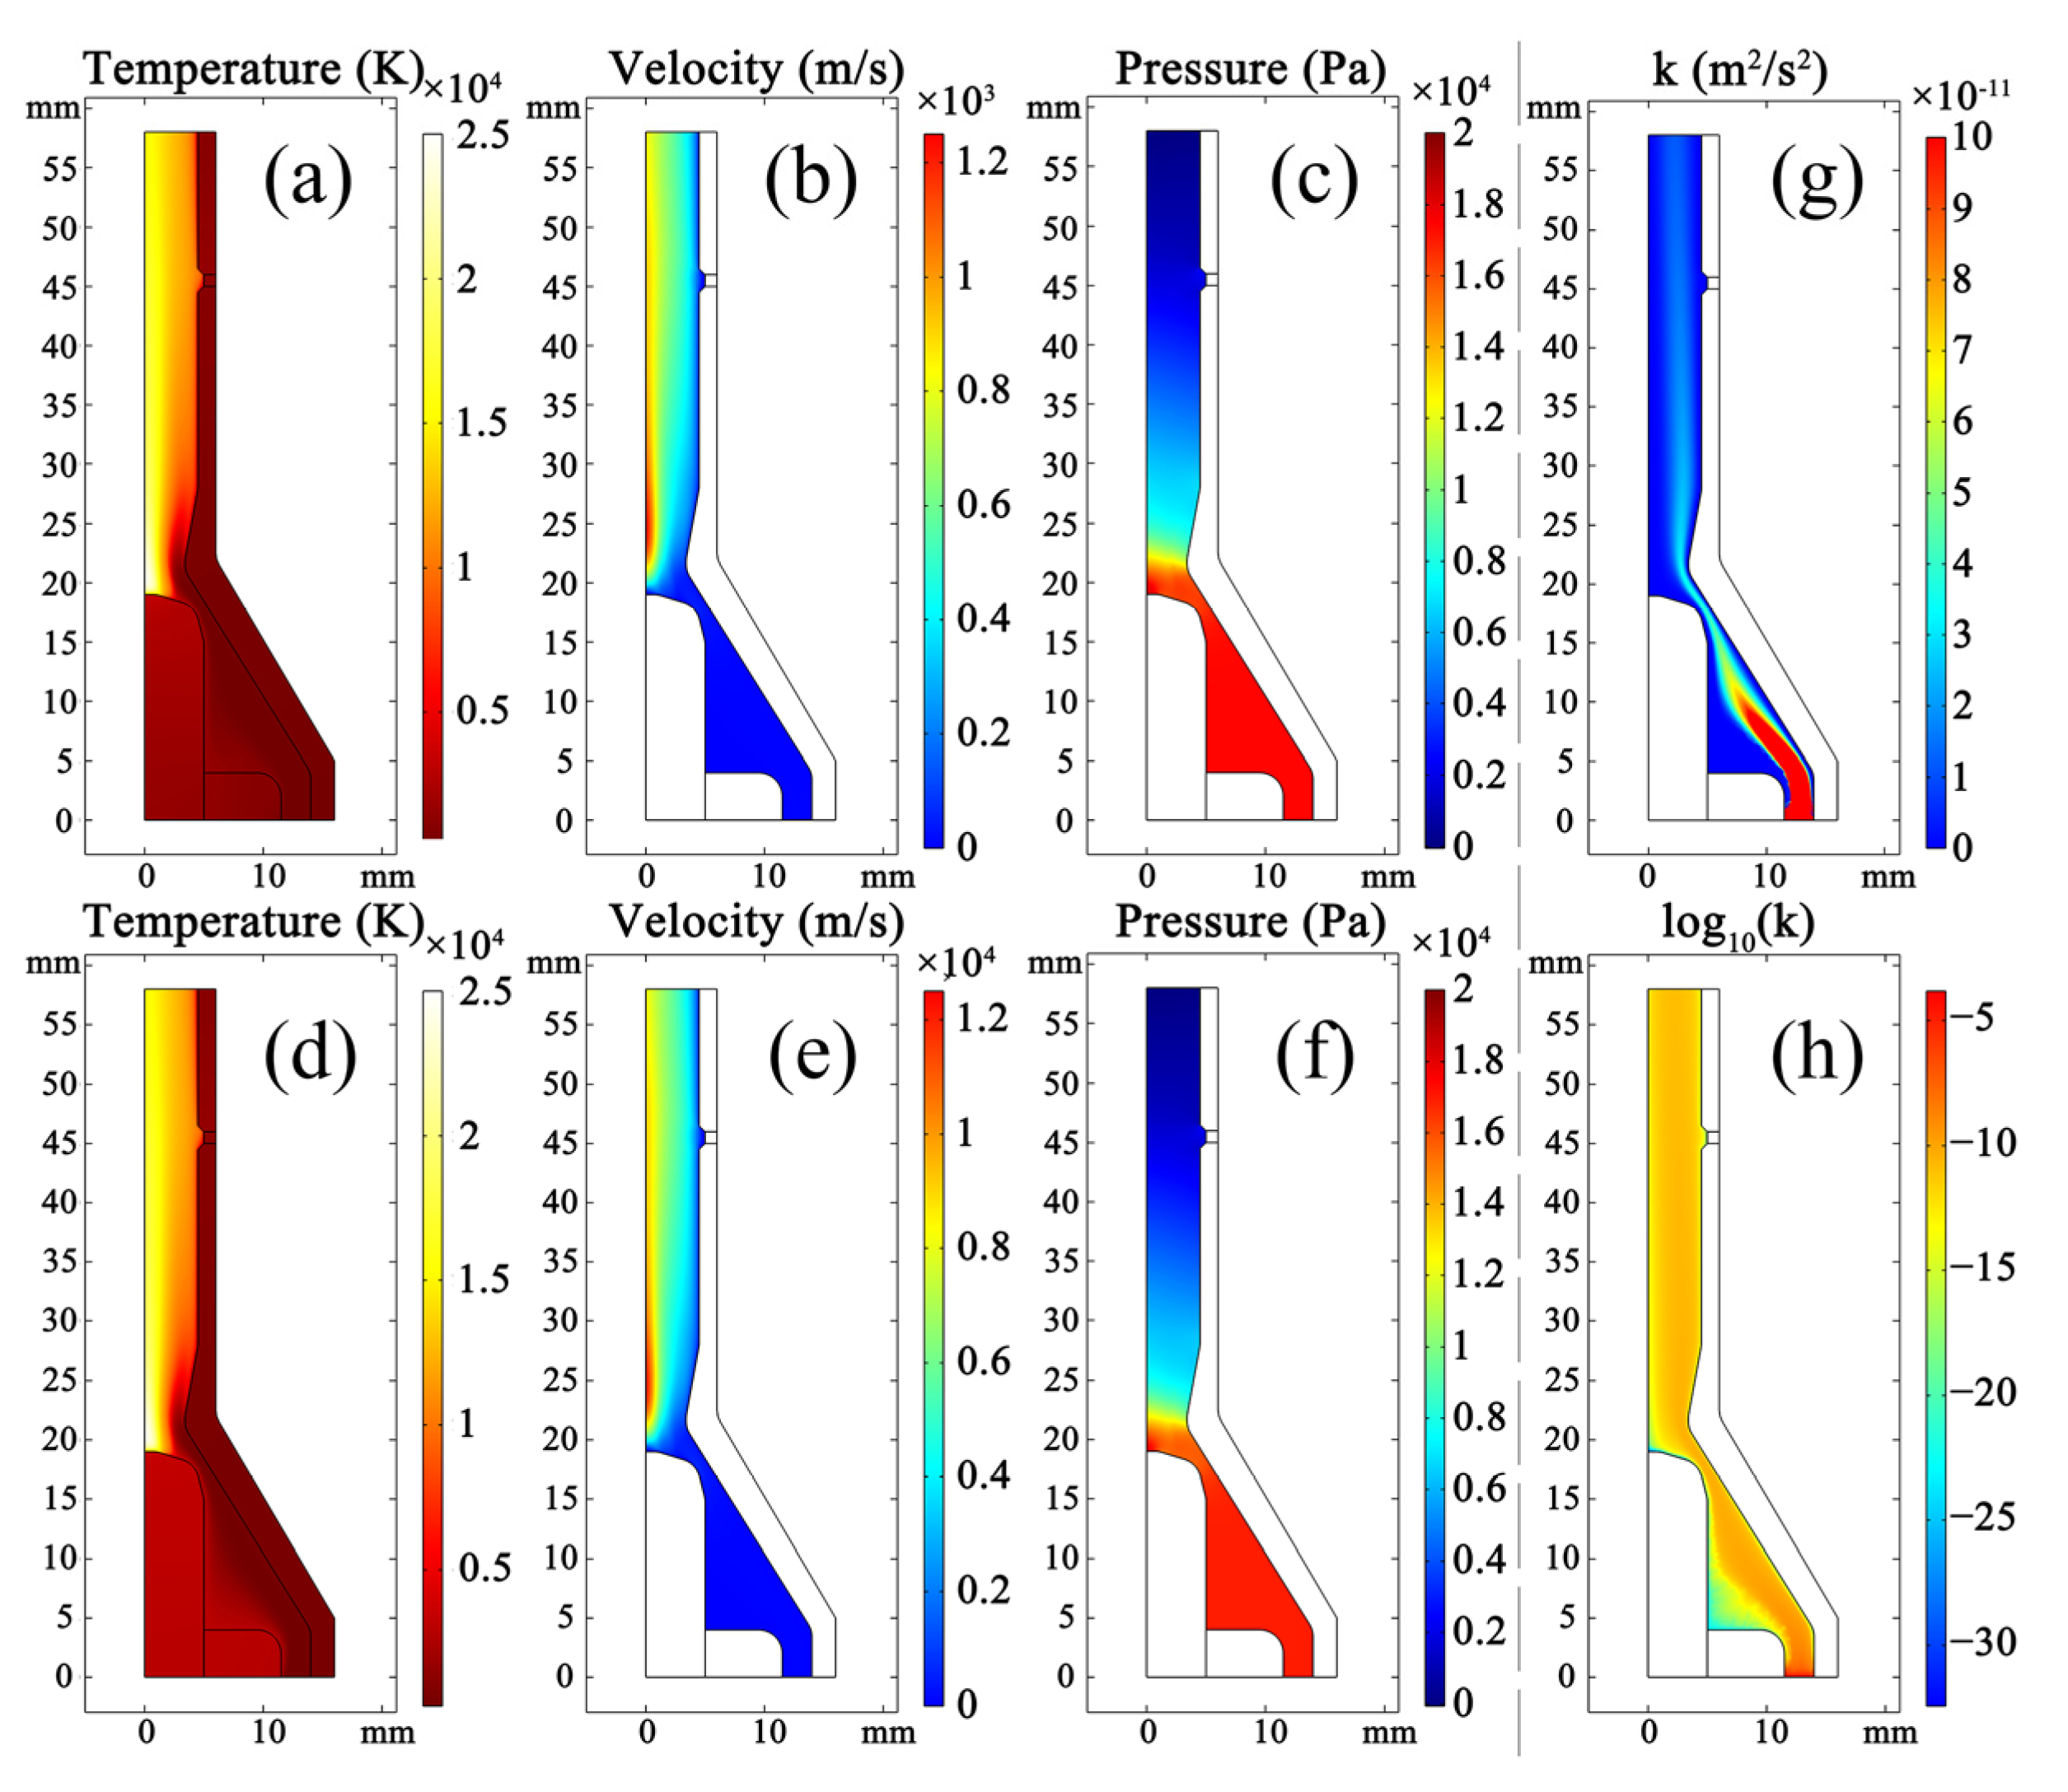
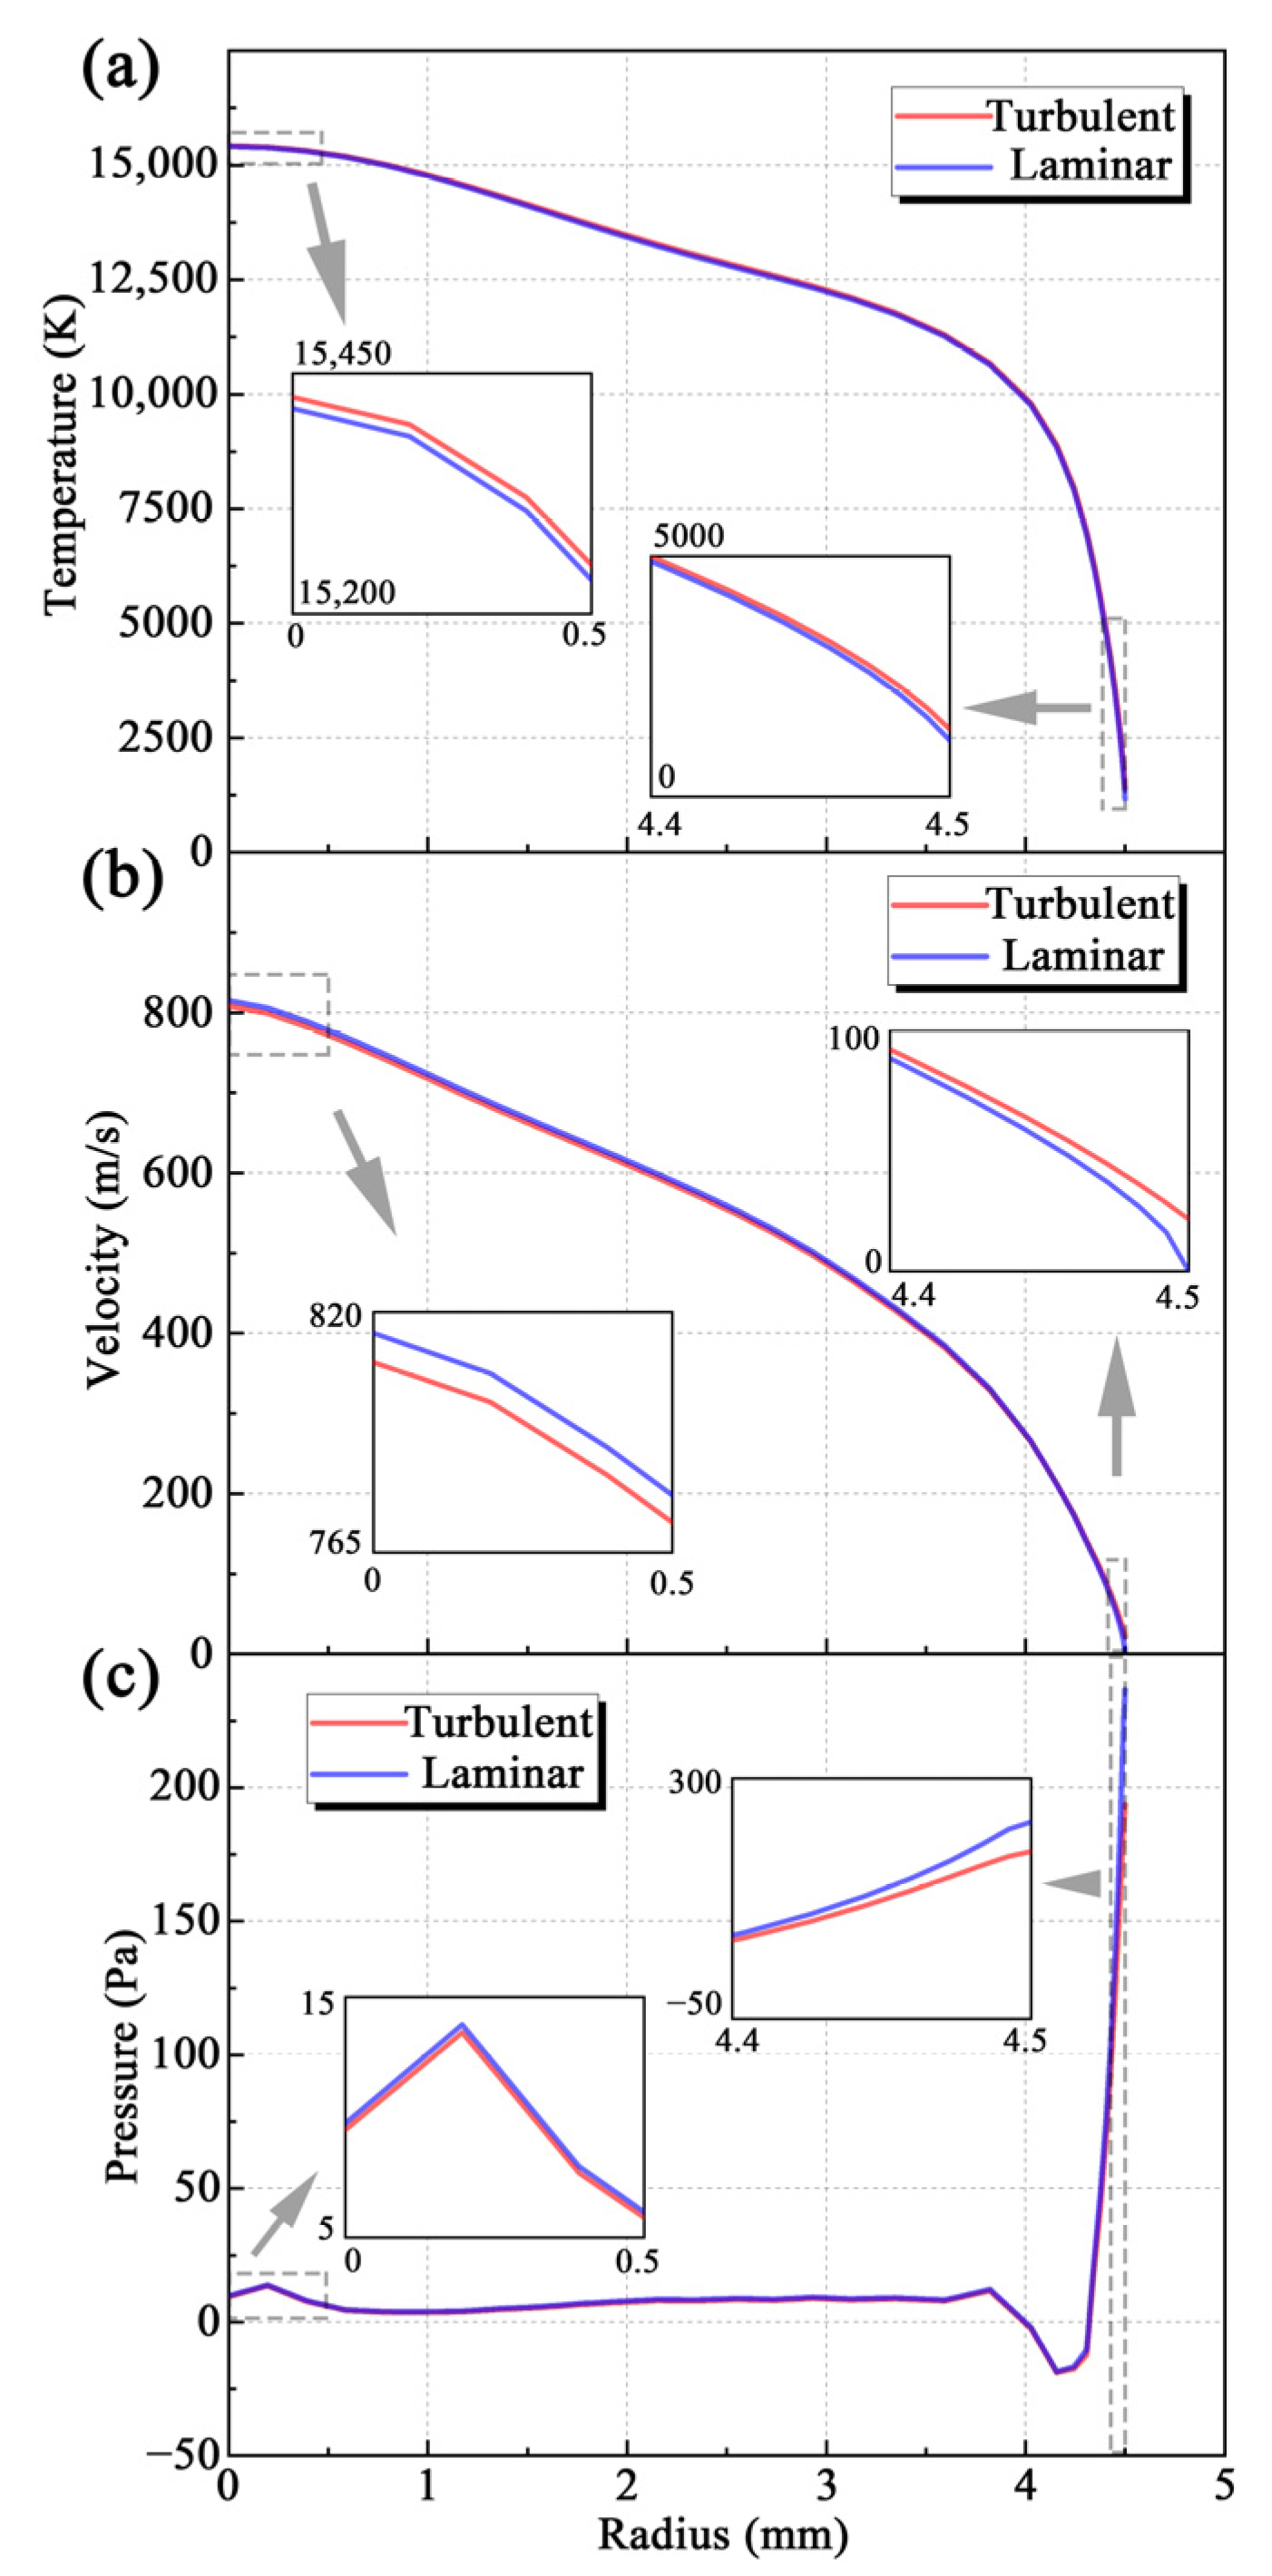
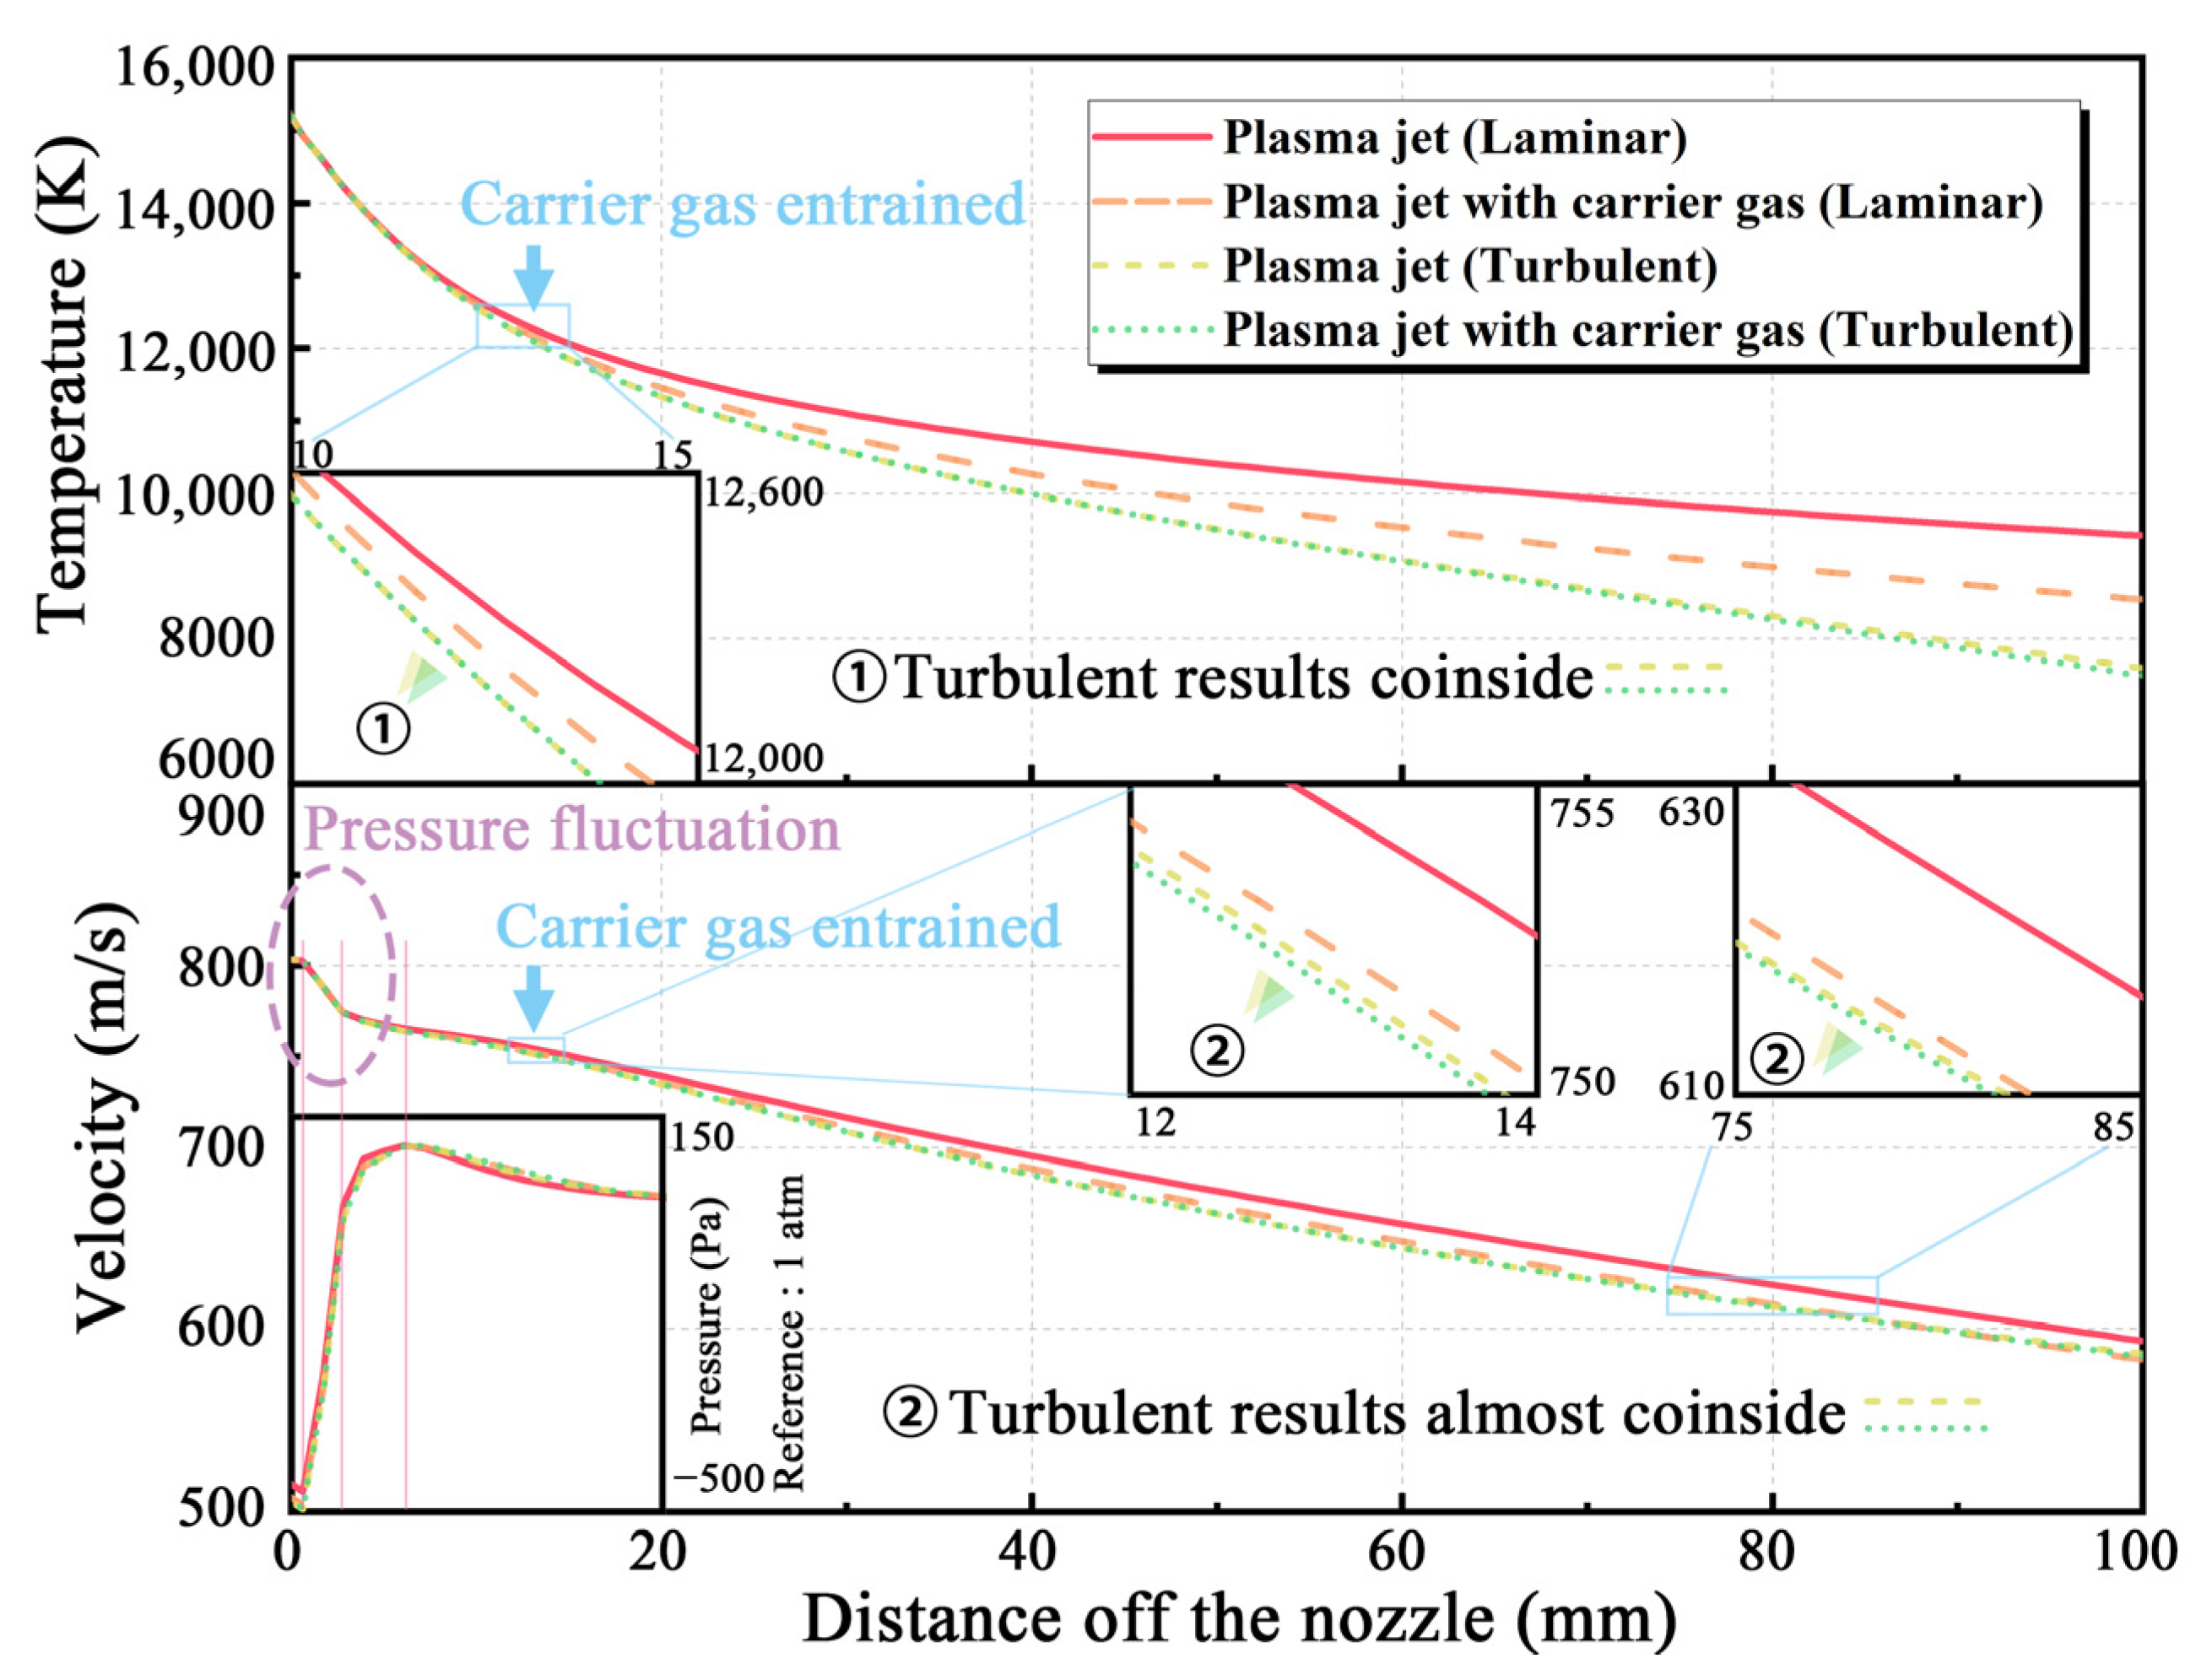
  • The modeling results of the arcing process obtained using the turbulent and laminar models are almost the same. Thus, the plasma flow in the spray gun can be regarded as laminar. The turbulence intensity is the greatest at the gas inlet of the spray gun and gradually decreases to a negligible level in the chamber.
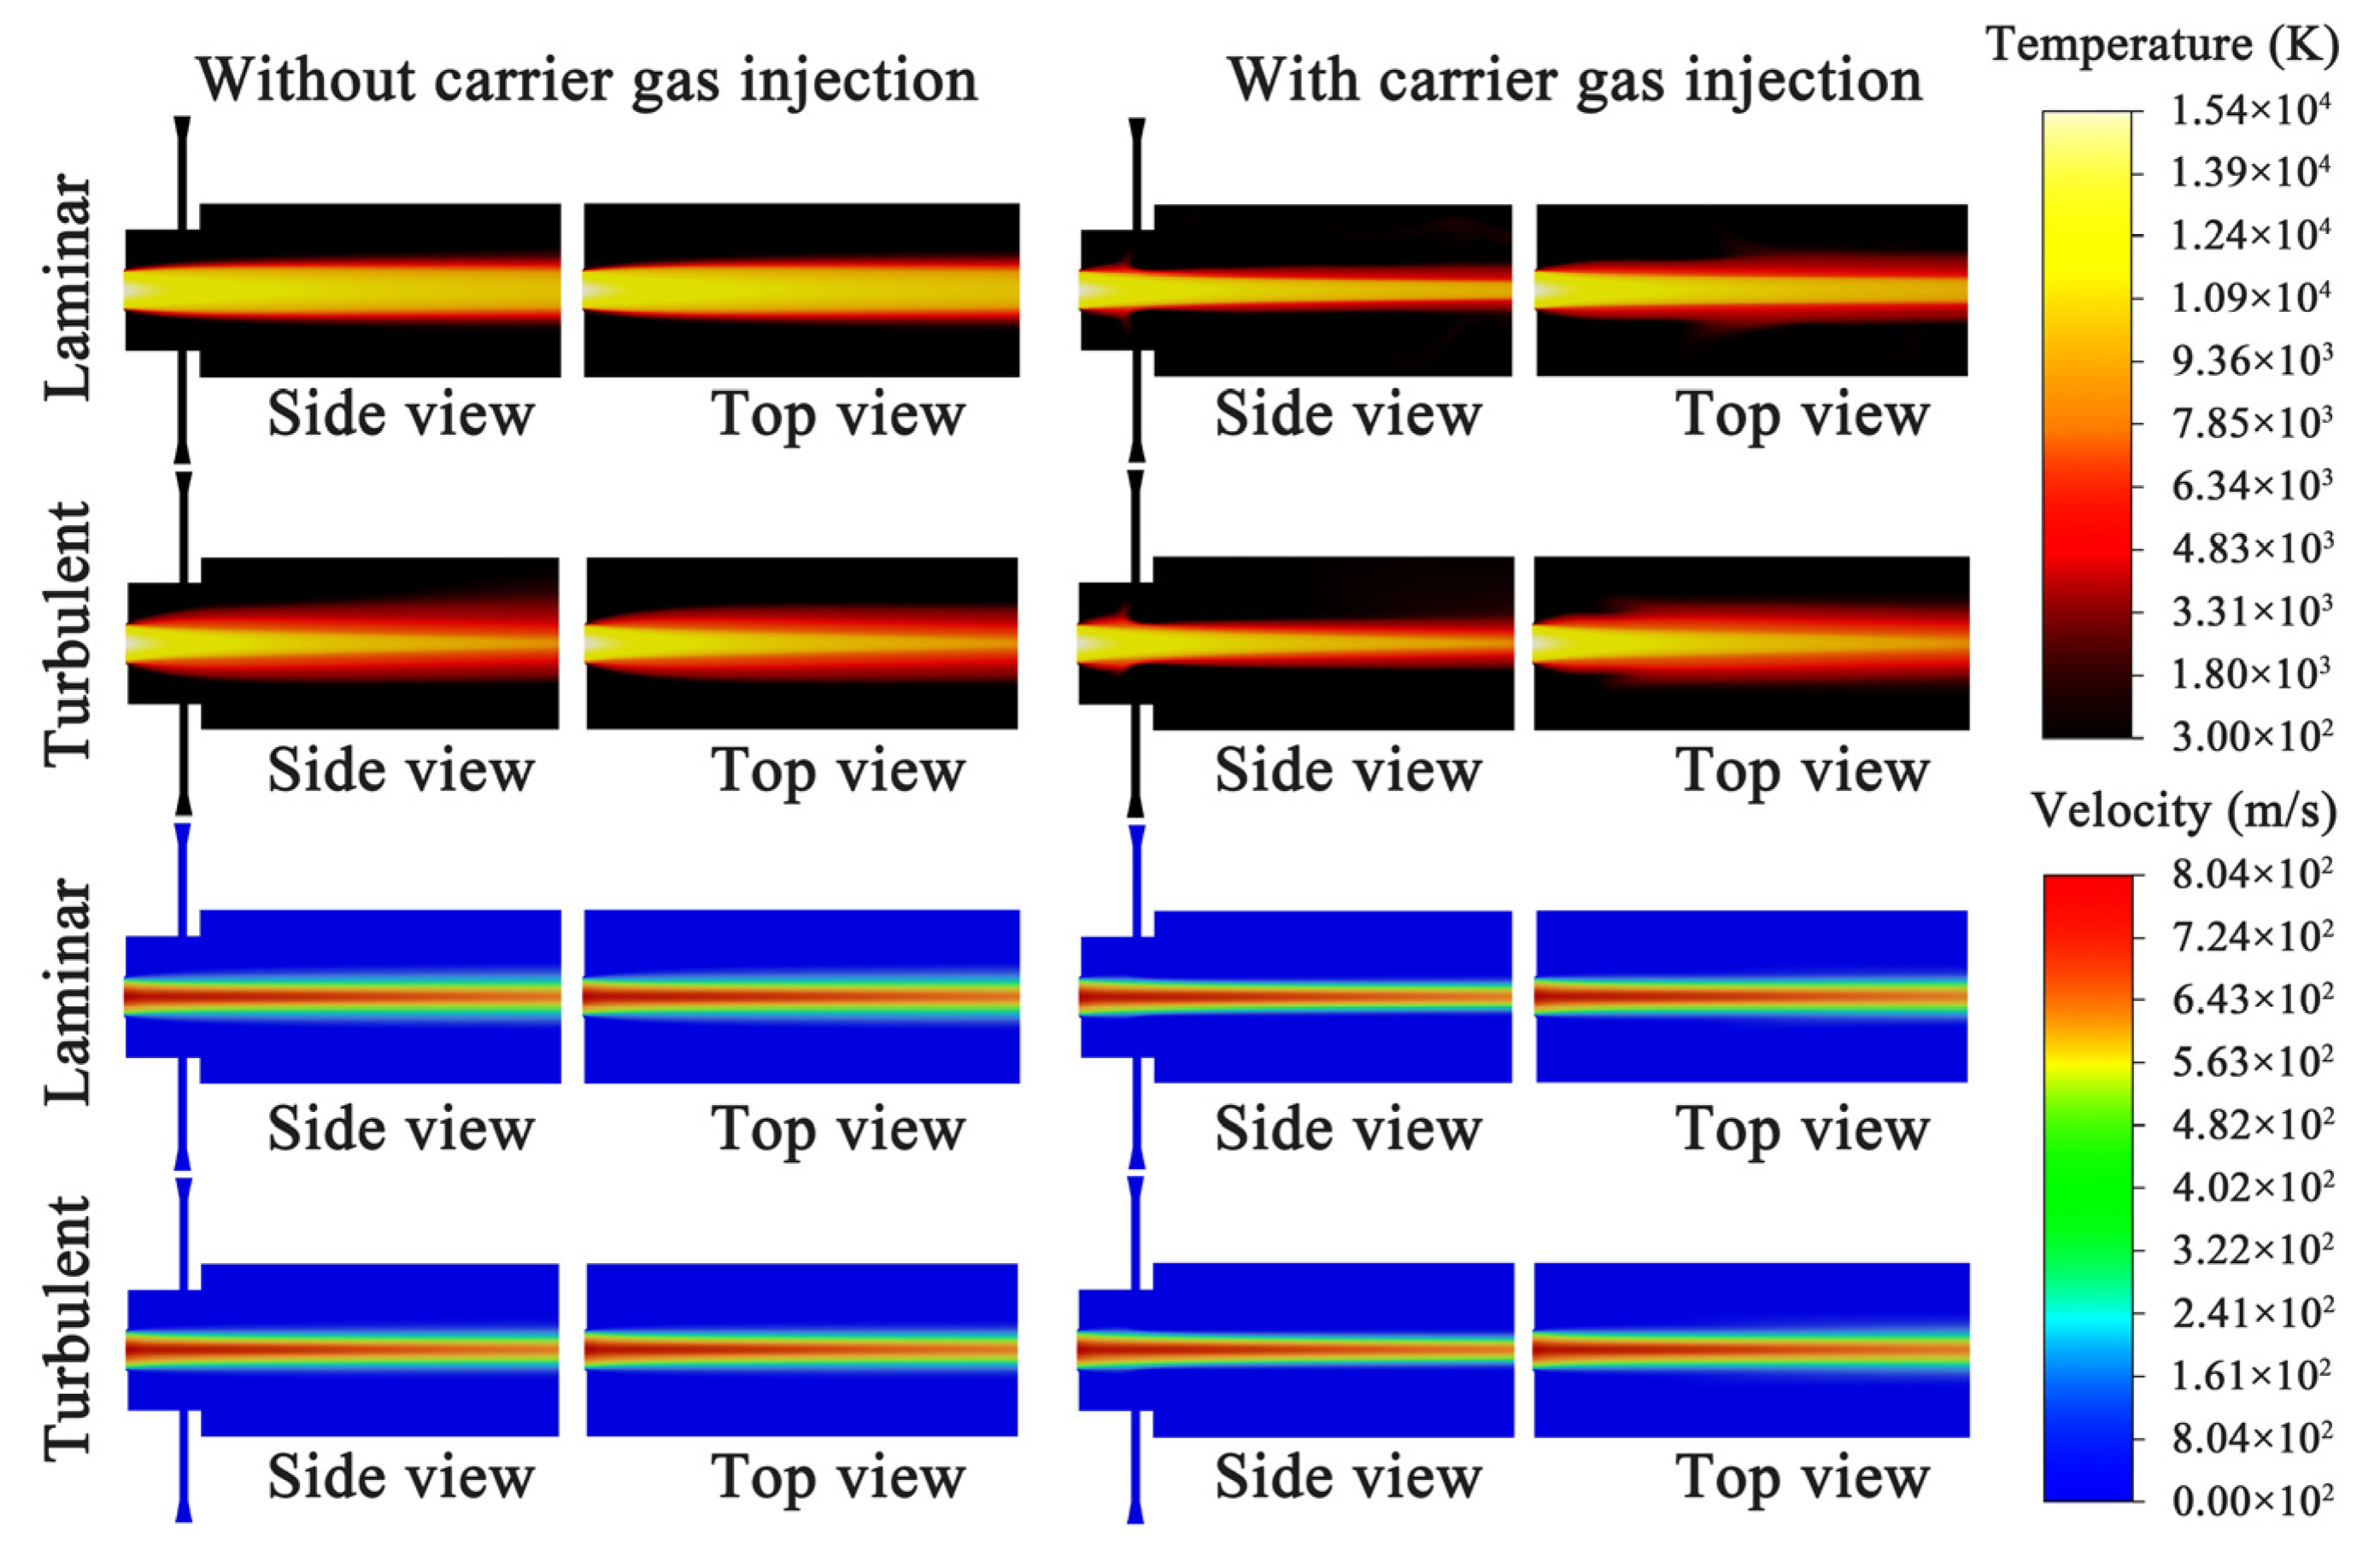
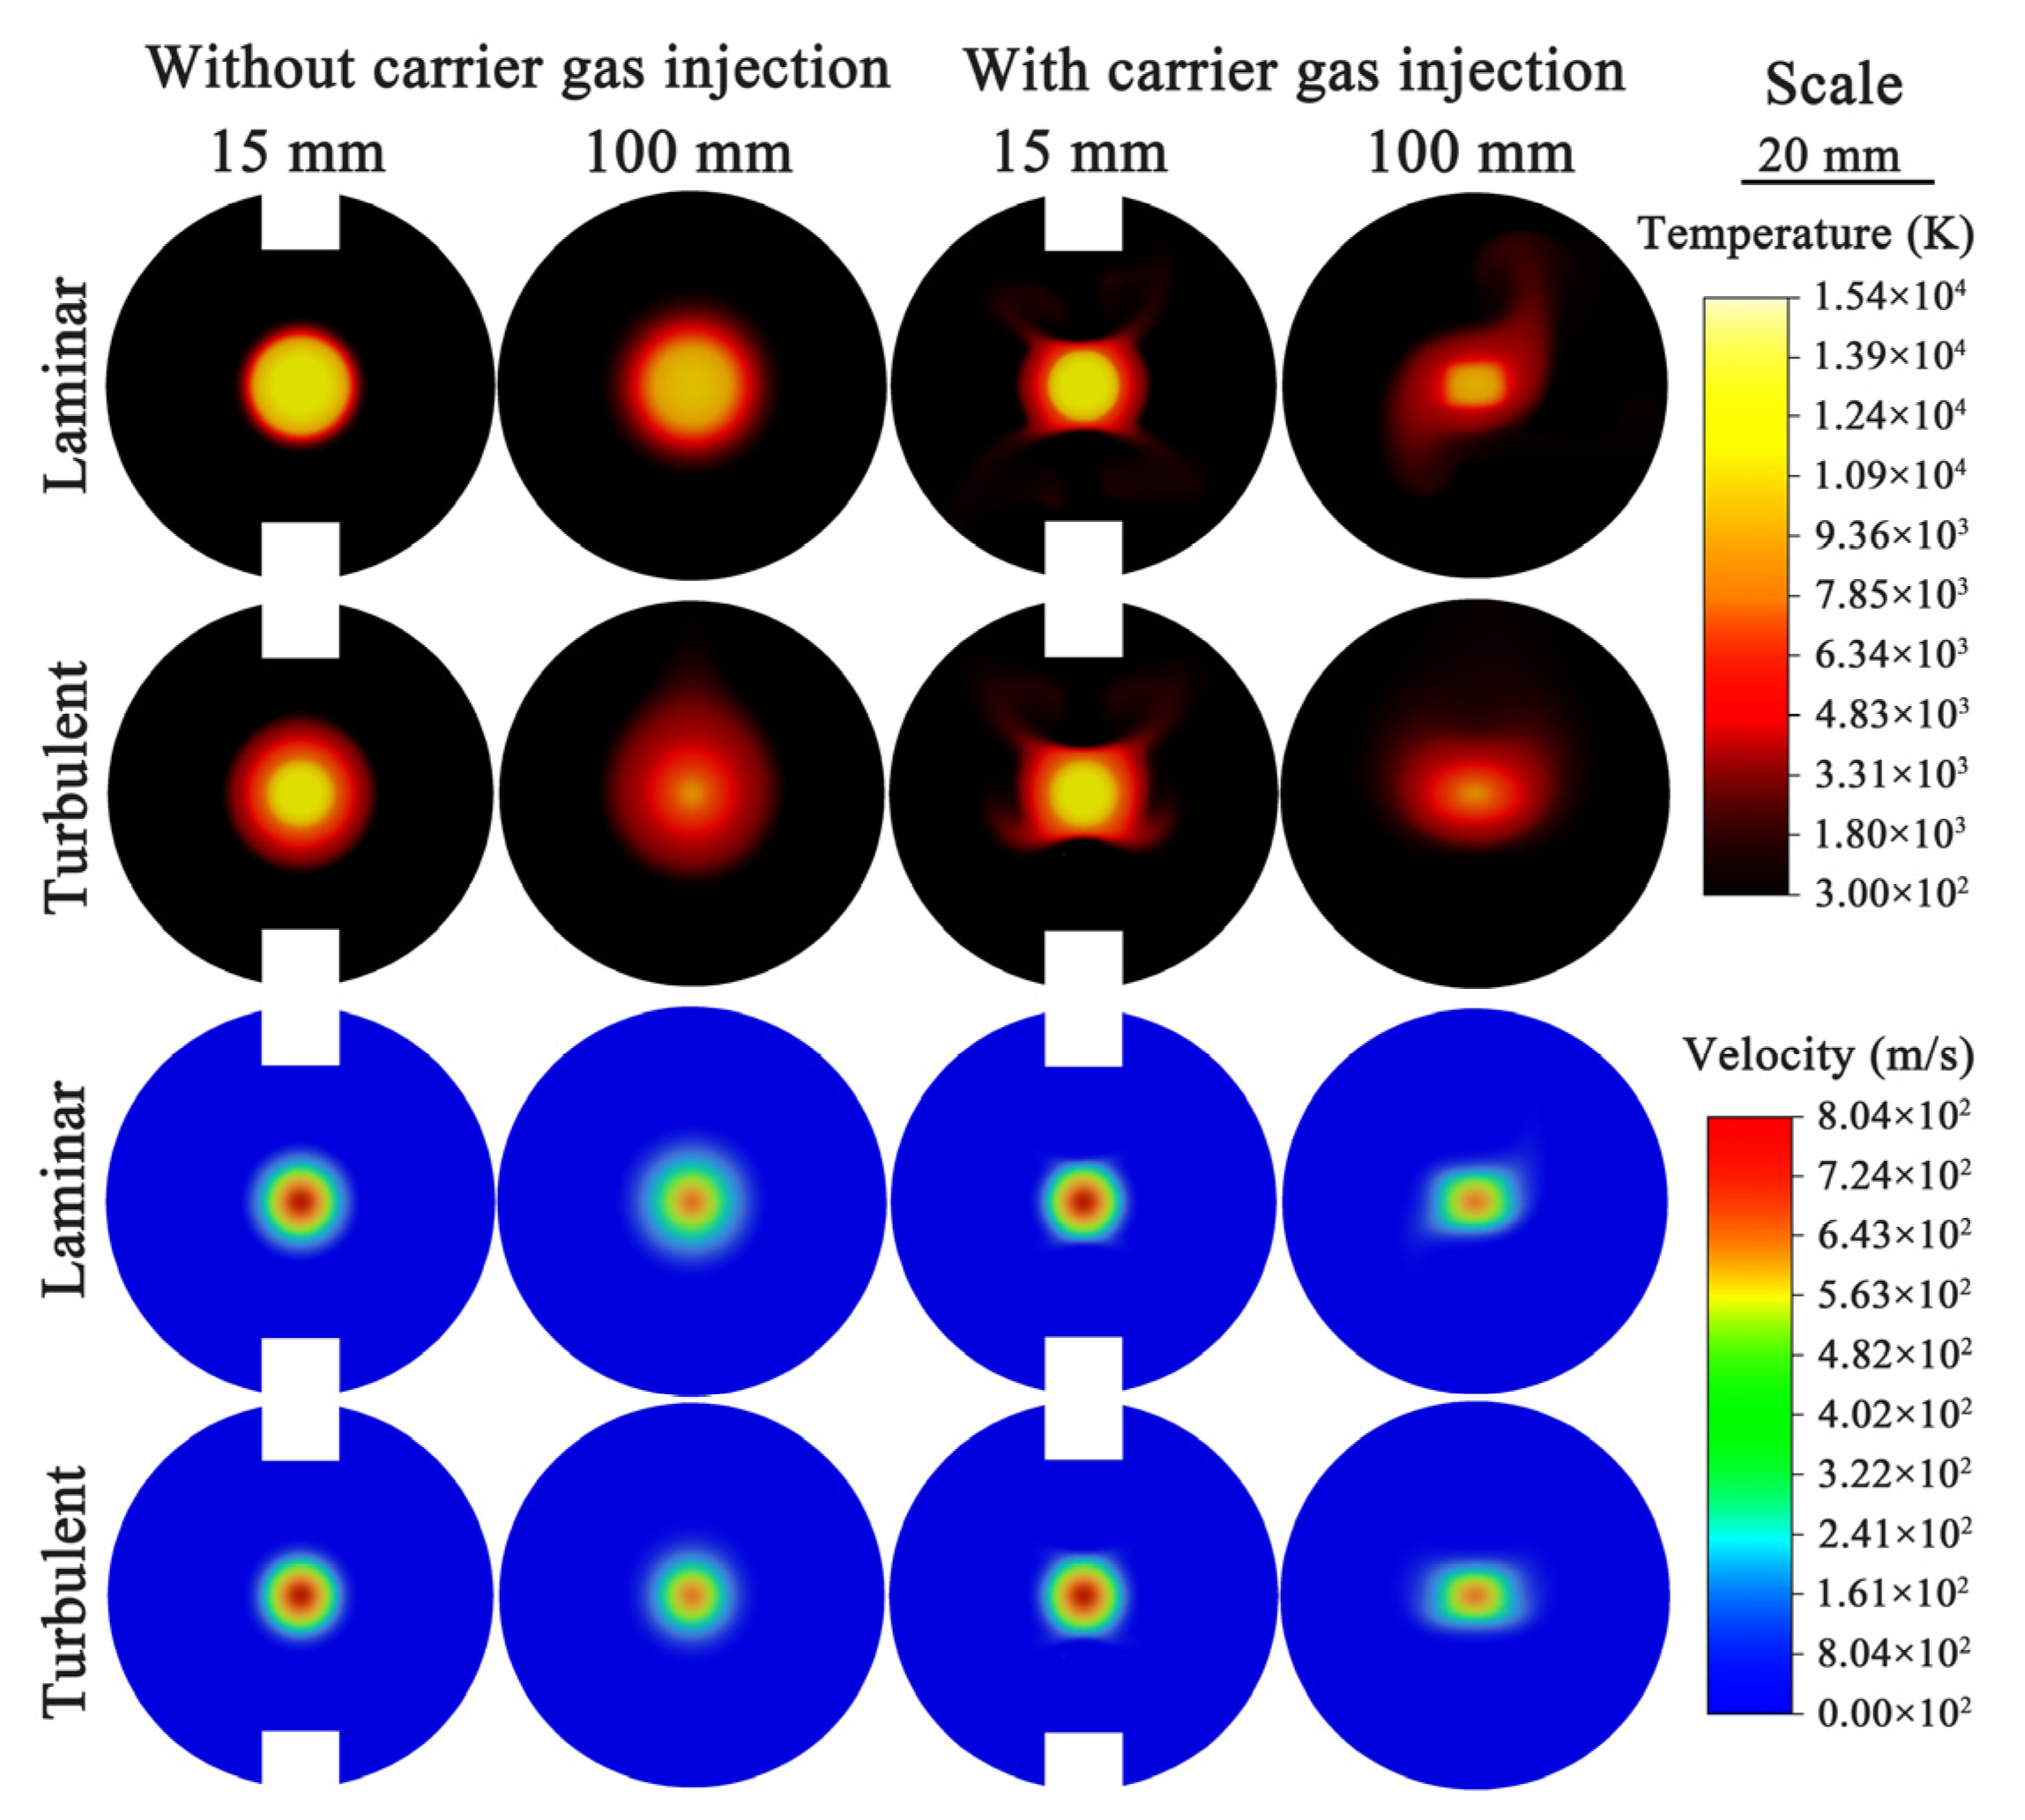
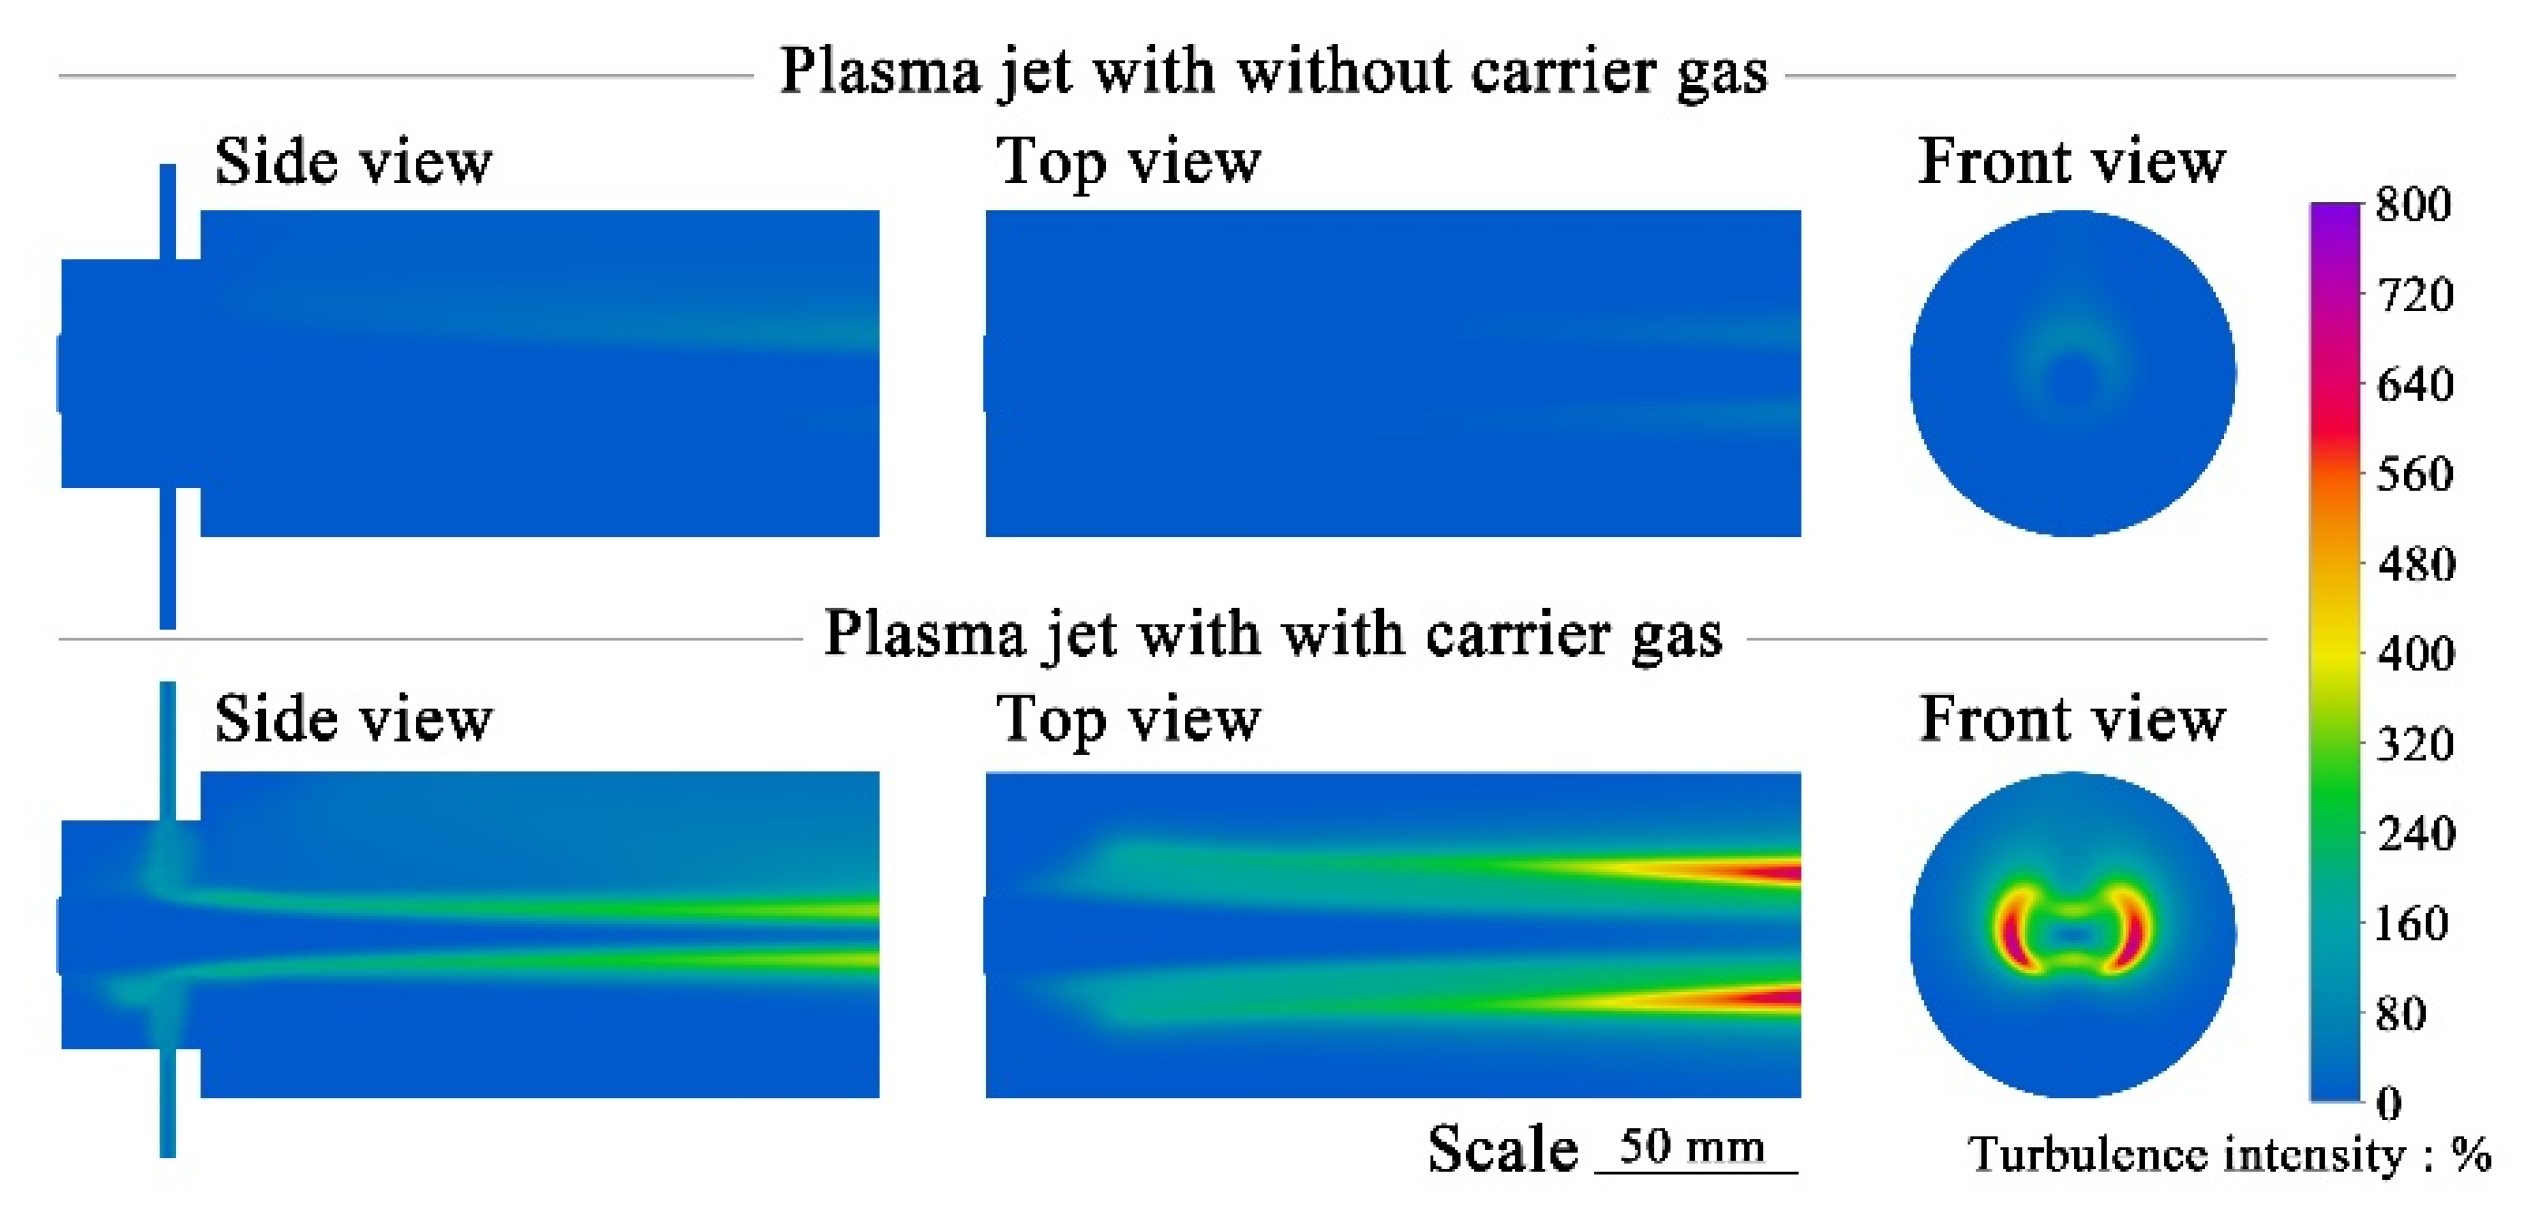
  • The results obtained by the turbulent model are closer to the experimental results. The turbulence of the plasma jet is mainly generated at the edge and gradually gathers toward the center as the plasma jet develops. Affected by air buoyancy, the plasma tends to slightly float upward. The convection with the surrounding air results in the area of maximum turbulence intensity right above the plasma jet.
  • The introduction of carrier gas significantly affects the laminarity of the plasma jet. Turbulence still occurs at the edge of the plasma jet, but the areas of the highest turbulence intensity are on the right and left sides of the plasma jet. This intensity distribution is mainly attributed to the effect of buoyancy on the carrier gas from the bottom injector. Therefore, during the spraying process, the plasma jet will also be affected by the gravity, which may also affect the particles with small diameters.
  • Only a small part of the carrier gas can directly enter the plasma jet. Part of the carrier gas that cannot directly enter the jet leaves the computational domain due to heating and buoyancy. Another part will continue to be entrained from the edge into the plasma jet. This helps to make the particles move toward the center of the plasma jet during the plasma-spraying process.

Supplementary Materials

The following are available online at https://www.mdpi.com/article/10.3390/coatings12101416/s1, Figure S1: Shapes of the plasma jets generated by SinplexProTM plasma spray gun, Figure S2: The influence of flow field and gas flow rate on plasma jet.

Author Contributions

Conceptualization, G.M.; methodology, H.Z.; software, H.Z., M.L. and Y.J.; Resources, C.L. (Changjiu Li); Visualization, S.L.; investigation, S.L.; writing—original draft preparation, H.Z.; writing—review and editing, H.Z., G.M. and R.V.; supervision, R.V. and C.L. (Chengxin Li); funding acquisition, R.V. and C.L. (Chengxin Li). All authors have read and agreed to the published version of the manuscript.

Funding

This work was supported by the National Natural Science Foundation of China (Grant No. 52001017, No. 2021YFB4001400) and Fundamental Research Funds for the Central University. The authors are grateful to the China Scholarship Council (grant No. 202006280182) for financial support. Publication was funded by the Deutsche Forschungsgemeinschaft (DFG, German Research Foundation)—491111487.

Institutional Review Board Statement

Not applicable.

Informed Consent Statement

Not applicable.

Data Availability Statement

The data presented in this study are available on request.

Acknowledgments

The authors would like to thank the support of the China Scholarship Council and Karl-Heinz Rauwald (Forschungszentrum Jülich, IEK-1) for technical support on the experiments.

Conflicts of Interest

The authors declare no conflict of interest.

References

  1. Wang, T.; Wang, N.; Li, Y.; Wang, H.; Tang, J.; Wang, Y. Study on Preparation Technologies of Thermal Barrier Coatings. Surf. Rev. Lett. 2017, 24, 1730004. [Google Scholar] [CrossRef]
  2. Luo, L.; Chen, Y.; Zhou, M.; Shan, X.; Lu, J.; Zhao, X. Progress Update on Extending the Durability of Air Plasma Sprayed Thermal Barrier Coatings. Ceram. Int. 2022, 48, 18021–18034. [Google Scholar] [CrossRef]
  3. Mutter, M.; Mauer, G.; Mücke, R.; Guillon, O.; Vaßen, R. Correlation of Splat Morphologies with Porosity and Residual Stress in Plasma-Sprayed YSZ Coatings. Surf. Coat. Technol. 2017, 318, 157–169. [Google Scholar] [CrossRef]
  4. Xu, C.; Ye, Z.; Xiao, H.; Li, L.; Zhang, J. Numerical Simulation of Temperature Field and Temperature Control of DC Arc Plasma Torch. J. Phys. Conf. Ser. 2021, 2005, 012134. [Google Scholar] [CrossRef]
  5. Tsai, J.H.; Hsu, C.M.; Hsu, C.C. Numerical Simulation of Downstream Kinetics of an Atmospheric Pressure Nitrogen Plasma Jet Using Laminar, Modified Laminar, and Turbulent Models. Plasma Chem. Plasma Process. 2013, 33, 1121–1135. [Google Scholar] [CrossRef]
  6. Sun, J.H.; Sun, S.R.; Zhang, L.H.; Wang, H.X. Two-Temperature Chemical Non-Equilibrium Modeling of Argon DC Arc Plasma Torch. Plasma Chem. Plasma Process. 2020, 40, 1383–1400. [Google Scholar] [CrossRef]
  7. Sun, J.-H.; Sun, S.-R.; Niu, C.; Wang, H.-X. Non-Equilibrium Modeling on the Plasma–Electrode Interaction in an Argon DC Plasma Torch. J. Phys. D Appl. Phys. 2021, 54, 465202. [Google Scholar] [CrossRef]
  8. Trelles, J.P.; Pfender, E.; Heberlein, J. Multiscale Finite Element Modeling of Arc Dynamics in a DC Plasma Torch. Plasma Chem. Plasma Process. 2006, 26, 557–575. [Google Scholar] [CrossRef]
  9. Selvan, B.; Ramachandran, K.; Sreekumar, K.P.; Thiyagarajan, T.K.; Ananthapadmanabhan, P.V. Numerical and Experimental Studies on DC Plasma Spray Torch. Vacuum 2009, 84, 444–452. [Google Scholar] [CrossRef]
  10. Liu, S.H.; Trelles, J.P.; Murphy, A.B.; Li, L.; Zhang, S.L.; Yang, G.J.; Li, C.X.; Li, C.J. Numerical Simulation of the Flow Characteristics inside a Novel Plasma Spray Torch. J. Phys. D Appl. Phys. 2019, 52, 335203. [Google Scholar] [CrossRef]
  11. Huang, R.; Fukanuma, H.; Uesugi, Y.; Tanaka, Y. Comparisons of Two Models for the Simulation of a DC Arc Plasma Torch. J. Therm. Spray Technol. 2013, 22, 183–191. [Google Scholar] [CrossRef]
  12. Deng, J.; Li, Y.; Xu, Y.; Sheng, H. Numerical Simulation of Fluid Flow and Heat Transfer in a DC Non-Transferred Arc Plasma Torch Operating under Laminar and Turbulent Conditions. Plasma Sci. Technol. 2011, 13, 201–207. [Google Scholar] [CrossRef]
  13. Chidambaram Seshadri, R.; Sampath, S. Characteristics of Conventional and Cascaded Arc Plasma Spray-Deposited Ceramic Under Standard and High-Throughput Conditions. J. Therm. Spray Technol. 2019, 28, 690–705. [Google Scholar] [CrossRef]
  14. Trelles, J.P.; Heberlein, J.V.R. Simulation Results of Arc Behavior in Different Plasma Spray Torches. Proc. Int. Therm. Spray Conf. 2006, 15, 563–569. [Google Scholar] [CrossRef]
  15. Ramachandran, K.; Marqués, J.L.; Vaßen, R.; Stöver, D. Modelling of Arc Behaviour inside a F4 APS Torch. J. Phys. D Appl. Phys. 2006, 39, 3323–3331. [Google Scholar] [CrossRef]
  16. Rat, V.; Mavier, F.; Coudert, J.F. Electric Arc Fluctuations in DC Plasma Spray Torch; Springer: New York, NY, USA, 2017; Volume 37, ISBN 1109001797977. [Google Scholar]
  17. Huang, R.; Fukanuma, H.; Uesugi, Y.; Tanaka, Y. Simulation of Arc Root Fluctuation in a DC Non-Transferred Plasma Torch with Three Dimensional Modeling. J. Therm. Spray Technol. 2012, 21, 636–643. [Google Scholar] [CrossRef]
  18. Alaya, M.; Chazelas, C.; Mariaux, G.; Vardelle, A. Arc-Cathode Coupling in the Modeling of a Conventional DC Plasma Spray Torch. J. Therm. Spray Technol. 2014, 24, 3–10. [Google Scholar] [CrossRef]
  19. Zhukovskii, R.; Chazelas, C.; Vardelle, A.; Rat, V. Control of the Arc Motion in DC Plasma Spray Torch with a Cascaded Anode. J. Therm. Spray Technol. 2020, 29, 3–12. [Google Scholar] [CrossRef]
  20. Zhukovskii, R.; Chazelas, C.; Vardelle, A.; Rat, V.; Distler, B. Effect of Electromagnetic Boundary Conditions on Reliability of Plasma Torch Models. J. Therm. Spray Technol. 2020, 29, 894–907. [Google Scholar] [CrossRef]
  21. Cao, X.; Chen, L. Design and Characteristics of a New Type Laminar Plasma Torch for Materials Processing. Plasma Sci. Technol. 2020, 22, 015402. [Google Scholar] [CrossRef]
  22. Chang, C.H.; Ramshaw, J.D. Numerical Simulations of Argon Plasma Jets Flowing into Cold Air. Plasma Chem. Plasma Process. 1993, 13, 189–209. [Google Scholar] [CrossRef]
  23. Chang, C.H.; Ramshaw, J.D. Modeling of Nonequilibrium Effects in a High-Velocity Nitrogen-Hydrogen Plasma Jet. Plasma Chem. Plasma Process. 1995, 16, S5–S17. [Google Scholar] [CrossRef]
  24. El-Hadj, A.A.; Ait-Messaoudene, N. Comparison between Two Turbulence Models and Analysis of the Effect of the Substrate Movement on the Flow Field of a Plasma Jet. Plasma Chem. Plasma Process. 2005, 25, 699–722. [Google Scholar] [CrossRef]
  25. Cao, X.; Yu, D.; Xiao, M.; Miao, J.; Xiang, Y.; Yao, J. Design and Characteristics of a Laminar Plasma Torch for Materials Processing. Plasma Chem. Plasma Process. 2016, 36, 693–710. [Google Scholar] [CrossRef]
  26. Cao, X.; Li, C.; He, R.; Xu, H.; Chen, L.; Huang, B. Study on the Influences of the Anode Structures on the Jet Characteristics of a Laminar Plasma Torch. Plasma Res. Express 2020, 2, 018001. [Google Scholar] [CrossRef]
  27. Cheng, K.; Chen, X.; Wang, H.X.; Pan, W. Modeling Study of Shrouding Gas Effects on a Laminar Argon Plasma Jet Impinging upon a Flat Substrate in Air Surroundings. Thin Solid Film. 2006, 506–507, 724–728. [Google Scholar] [CrossRef]
  28. Pan, W.X.; Meng, X.; Li, G.; Fei, Q.X.; Wu, C.K. Feasibility of Laminar Plasma-Jet Hardening of Cast Iron Surface. Surf. Coat. Technol. 2005, 197, 345–350. [Google Scholar] [CrossRef]
  29. Zhang, H.Y.; Liu, S.H.; Li, C.J.; Li, C.X. In-Situ Heating Effect of Laminar Plasma Jet during Mo Coatings Deposition. Mater. Lett. 2021, 305, 130743. [Google Scholar] [CrossRef]
  30. Liu, S.H.; Zhang, H.Y.; Wang, Y.P.; Ji, G.; Li, L.; Xu, P.; Huang, J.H.; Zhang, S.L.; Li, C.X.; Li, C.J. Microstructural Evolution of Alumina Coatings by a Novel Long Laminar Plasma Spraying Method. Surf. Coat. Technol. 2019, 363, 210–220. [Google Scholar] [CrossRef]
  31. Liu, S.H.; Li, C.X.; Li, L.; Huang, J.H.; Xu, P.; Hu, Y.Z.; Yang, G.J.; Li, C.J. Development of Long Laminar Plasma Jet on Thermal Spraying Process: Microstructures of Zirconia Coatings. Surf. Coat. Technol. 2018, 337, 241–249. [Google Scholar] [CrossRef]
  32. Solonenko, O.P.; Ando, Y.; Nishiyama, H.; Kindole, D.; Smirnov, A.V.; Golovin, A.A.; Uehara, S.; Nakajima, T. Synthesis of Thick Photocatalytic Titania Surface Layers by Solution Plasma Spraying and Subsequent Treatment by Pulsed Laminar Plasma Jet. Surf. Coat. Technol. 2018, 333, 39–51. [Google Scholar] [CrossRef]
  33. Khutsishvili, M.; Kikvadze, L. Spraying Powder Materials by the High-Enthalpy Laminar Plasma Flow. AIP Conf. Proc. 2008, 993, 423–426. [Google Scholar] [CrossRef]
  34. Zhang, H.-Y.; Li, C.-X.; Liu, S.-H.; Li, L.; Yang, G.-J.; Li, C.-J.; Zhang, S.-L. Splash Involved Deposition Behavior and Erosion Mechanism of Long Laminar Plasma Sprayed NiCrBSi Coatings. Surf. Coat. Technol. 2020, 395, 125939. [Google Scholar] [CrossRef]
  35. Wang, Y.P.; Liu, S.H.; Zhang, H.Y.; Li, C.X.; Zhang, S.L.; Yang, G.J.; Li, C.J. Structured La0.6Sr0.4Co0.2Fe0.8O3-δ Cathode with Large-Scale Vertical Cracks by Atmospheric Laminar Plasma Spraying for IT-SOFCs. J. Alloy. Compd. 2020, 825, 153865. [Google Scholar] [CrossRef]
  36. Ma, W.; Pan, W.X.; Wu, C.K. Preliminary Investigations on Low-Pressure Laminar Plasma Spray Processing. Surf. Coat. Technol. 2005, 191, 166–174. [Google Scholar] [CrossRef]
  37. Liu, S.H.; Trelles, J.P.; Li, C.J.; Guo, H.B.; Li, C.X. Numerical Analysis of the Plasma-Induced Self-Shadowing Effect of Impinging Particles and Phase Transformation in a Novel Long Laminar Plasma Jet. J. Phys. D Appl. Phys. 2020, 53, 375202. [Google Scholar] [CrossRef]
  38. Liu, S.H.; Li, C.X.; Zhang, H.Y.; Zhang, S.L.; Li, L.; Xu, P.; Yang, G.J.; Li, C.J. A Novel Structure of YSZ Coatings by Atmospheric Laminar Plasma Spraying Technology. Scr. Mater. 2018, 153, 73–76. [Google Scholar] [CrossRef]
  39. Zhang, H.Y.; Liu, S.H.; Li, C.J.; Li, C.X. Deposition and Oxidation Behavior of Atmospheric Laminar Plasma Sprayed Mo Coatings from 200 Mm to 400 Mm under 20 KW: Numerical and Experimental Analyses. Surf. Coat. Technol. 2020, 400, 126245. [Google Scholar] [CrossRef]
  40. Zhukovskii, R.; Chazelas, C.; Rat, V.; Vardelle, A.; Molz, R. Predicted Anode Arc Attachment by LTE (Local Thermodynamic Equilibrium) and 2-T (Two-Temperature) Arc Models in a Cascaded-Anode DC Plasma Spray Torch. J. Therm. Spray Technol. 2021, 31, 28–45. [Google Scholar] [CrossRef]
  41. Chinè, B. A 2D Model of a Plasma Torch. 2016 COMSOL Conf. 2016, 7, 12–14. [Google Scholar]
  42. ANSYS Inc. ANSYS FLUENT Theory Guide. Available online: https://ansyshelp.ansys.com/account/secured?returnurl=/Views/Secured/corp/v201/en/flu_th/flu_th.html?q=ansysfluenttheoryguide (accessed on 7 January 2022).
  43. COMSOL Inc. The SST Turbulence Model. Available online: https://doc.comsol.com/5.5/doc/com.comsol.help.cfd/cfd_ug_fluidflow_single.06.091.html (accessed on 12 December 2021).
  44. Metco, O. Product Data Sheet SinplexProTM Universal Plasma Spray Guns Oerlikon. Available online: https://www.oerlikon.com/ecomaXL/files/metco/oerlikon_DSE-0061.5_SinplexPro_series_EN.pdf (accessed on 1 September 2015).
  45. Boulos, M.I.; Fauchais, P.; Pfender, E. Thermal Plasmas Fundamentals and Applications; Plenum Press: New York, NY, USA, 1994; Volume 1, ISBN 9781489913395. [Google Scholar]
  46. Ando, Y.; Tobe, S.; Tahara, H. TiO2 Film Deposition by Atmospheric Thermal Plasma CVD Using Laminar and Turbulence Plasma Jets. AIP Conf. Proc. 2008, 982, 612–617. [Google Scholar] [CrossRef]
  47. Pan, W.X.; Li, G.; Meng, X.; Ma, W.; Wu, C.K. Laminar Plasma Jets: Generation, Characterization, and Applications for Materials Surface Processing. Pure Appl. Chem. 2005, 77, 373–378. [Google Scholar] [CrossRef]
  48. Pan, W.; Zhang, W.; Zhang, W.; Wu, C. Generation of Long, Laminar Plasma Jets at Atmospheric Pressure and Effects of Flow Turbulence. Plasma Chem. Plasma Process. 2001, 21, 23–35. [Google Scholar] [CrossRef]
  49. Cao, X.; Yu, D.; Xiang, Y.; Yao, J.; Miao, J. Influence of the Laminar Plasma Torch Construction on the Jet Characteristics. Plasma Sci. Technol. 2016, 18, 740–743. [Google Scholar] [CrossRef]
Figure 1. (a) Internal structure of SinplexPro™ plasma spray gun, (b) schematic of the 3D structure of calculation domain, and (c) 2D schematic of axis symmetric calculation domain.
Coatings 12 01416 g001
Figure 2. (a) General view of plasma torch and calculation domain, (b) 3D schematic for plasma jet simulation, and (c) 3D schematic for plasma jet simulation (cross-sectional view).
Coatings 12 01416 g002
Figure 3. Results of arcing simulation for SinplexPro™ plasma spray gun; laminar model: (a) temperature distribution, (b) velocity distribution, (c) pressure (relative to 101,325 Pa); turbulent model: (d) temperature distribution, (e) velocity distribution, (f) pressure distribution, (g) turbulent kinetic energy (<1 × 10¹⁰), and (h) turbulent kinetic energy distribution (logarithmic scale).
Coatings 12 01416 g003
Figure 4. Calculated (a) temperature, (b) velocity, and (c) pressure (relative to 101,325 Pa) profiles at the nozzle exit of SinplexPro™ plasma spray gun (nozzle radius 4.5 mm).
Coatings 12 01416 g004
Figure 5. Results of the arcing simulation for SinplexPro™ plasma spray gun; laminar model: (a) electric potential distribution, (b) magnetic field strength distribution, and (c) current streamline; turbulent model: (d) electric potential distribution, (e) magnetic field strength distribution, and (f) current streamline.
Coatings 12 01416 g005
Figure 6. Experimentally observed plasma jets generated by SinplexPro™ plasma spray gun.
Coatings 12 01416 g006
Figure 7. Calculated plasma jet temperature and velocity distribution.
Coatings 12 01416 g007
Figure 8. Calculated temperature and velocity distributions of plasma jet along the central axis.
Coatings 12 01416 g008
Figure 9. Temperature distribution and velocity distributions on different cross-sections of plasma jet.
Coatings 12 01416 g009
Figure 10. Turbulence intensity distribution of plasma jet with carrier gas.
Coatings 12 01416 g010
Table 1. Assumptions used in the two simulation cases.
No.(1)(2)(3)(4)(5)(6)(7)(8)
Inside the torch×××××
Outside the torch××× ××××
Table 2. Characteristic lengths of main boundaries of SinplexPro™ gun arcing simulation.
BoundaryDefinitionLength (mm)Note
BCGas inlet2.5Vertical (radius)
HIOutflow4.5Vertical
EFCathode tip≈1.5Vertical
KJIAnode (tungsten)12Horizontal (=PQ)
OBWall (water cooling)11.5Vertical
JKAnode0.5Horizontal (45°) (=LM)
LKInsulation ring1Horizontal (=NP)
AGInterface 4Horizontal
OEAxis (cathode)19Horizontal
OHAxis58Horizontal
Table 3. Main characteristic length for plasma jet simulation domain.
BoundaryDefinitionLength (mm)Note
OANozzle exit4.5Vertical (radius)
ABChamfer0.5Vertical (45°)
BCWall7Vertical
CDAnode12Horizontal
DFWall28Vertical
EFWall5Vertical
FGCarrier gas inlet4Horizontal
CIWall14Horizontal
CJWall18Horizontal
JKWall8Vertical
LMOutlet20Vertical
OMAxis58Horizontal
Table 4. Main boundary conditions for simulation inside SinplexPro™ plasma spray gun.
BoundaryDefinitionHeat TransferFluid FlowElectric Potential
BCGas inlet300 K40 SLPM-
HIOutflow T / n = 0 V i / n -
EFCathode tip3500 K-450 A
KJIAnodeInterface-0 V
OABWall h w ( T T w ) --
DNPQWall h w ( T T w ) --
OEHAxis---
Table 5. Boundary conditions for plasma jet simulation.
BoundaryDefinitionHeat TransferFluid Flow
OAGas inletFrom simulationFrom simulation
KLMOutflow300 K V i / n
FGCathode tip300 K2 SLPM
ABCDEFWall h w ( T T w ) -
GHIJKWall h w ( T T w ) -
OMAxis--
Publisher’s Note: MDPI stays neutral with regard to jurisdictional claims in published maps and institutional affiliations.

