Article

Effect of Intermediate Principal Stress on the Bearing Capacity of Footings in Soft Rock

1
Institute of Geotechnical Engineering, Xi’an University of Technology, Xi’an 710048, China
2
Department of Civil Engineering, Xi’an Jiaotong University, Xi’an 710049, China
*
Author to whom correspondence should be addressed.
Coatings 2021, 11(9), 1019; https://doi.org/10.3390/coatings11091019
Submission received: 3 August 2021 / Revised: 20 August 2021 / Accepted: 21 August 2021 / Published: 25 August 2021
(This article belongs to the Special Issue Corrosion and Degradation of Materials)

Abstract

:
The bearing capacity for footings is a fundamental scientific problem in civil engineering. The evaluation of the bearing capacity of footings usually does not take into account the effect of the intermediate principal stress. In practice, the intermediate principal stress has certain influences on the strength of geomaterials (e.g., rock and soil) or concrete. In this paper, a series of numerical solutions are presented to evaluate the bearing capacity of footings in a soft rock foundation via a two-dimensional finite difference code (FLAC) with a strain hardening/softening constitutive model based on the unified strength theory (UST). The values of the bearing capacity factor Nc and Nγ for strip, circular and square footings in a soft rock foundation were evaluated using the strain hardening/softening constitutive model. The effect of the intermediate principal stress on the bearing capacity of strip, circular and square footings in a soft rock foundation was analyzed. The results of the numerical computation show that the intermediate principal stress has a significant influence on the bearing capacity and failure mechanisms of a soft rock medium. The influence of the intermediate principal stress on the peak and residual values of the bearing capacity for a strip footing is much greater than for circular and square footings. Research works for the reasonable estimation of the bearing capacity of footings in soft rock are facilitated by this study.

1. Introduction

A rock material can be classified as soft rock if the uniaxial compressive strength (USC) is below 30 MPa [1,2]. The deformation process of soft rock often has a remarkable strain-softening characteristic with a peak and residual strength [3,4,5,6]. Many researchers investigate the problems of soft rock in geotechnical engineering. For example, the stability of tunnels constructed in soft rock was analyzed by Zhu and Tokiwa [7,8]. The evaluation of the bearing capacity for footings is an essential problem in geotechnical engineering. In recent years, the bearing capacity of footings in clay or sand is often researched by many investigators using analytical or numerical methods with a linearly elastic-perfectly plastic constitutive model [9,10,11,12,13,14,15]. However, the bearing capacity of footings in strain-softening materials (e.g., soft rock) is seldom studied [16]. Using the linearly elastic, perfectly plastic constitutive model, Ma investigated the influence of the intermediate principal stress on the bearing capacity of strip or circular footings [17]. The intermediate principal stress has more influence on the bearing capacity of a strip footing than that of circular footing, and the intermediate principal stress has much more influence on the bearing capacity factor Nγ than that of factor Nc [17].
Many complex stress tests (e.g., true-triaxial tests, plane strain tests, or torsion shear tests) have verified that the intermediate principal stress has specific influences on the mechanical behavior of geomaterials [18,19,20,21,22,23,24,25,26]. The polyaxial test data of sand obtained by Sutherland and Mesdary suggest that the intermediate principal stress has a marked effect on the strength of sand and that the Mohr–Coulomb theory will therefore underestimate the strength over most of the stress state range [20]. Mogi found that in true triaxial testing of many rock samples, the effect of the intermediate principal stress must be considered for rock [21]. The results of complex stress tests for concrete indicate that the intermediate principal stress also has a marked effect on the strength of concrete [27,28]. We can conclude that the intermediate principal stress effect is an inherent mechanical behavior of many materials. Several strength criteria that take the effect of the intermediate principal stress and nonlinear yield surface into account were proposed for geomaterials [29]. These criteria include the Zienkiewicz–Pande criterion, the Lade–Duncan criterion, and the Matsuoka–Nakai criterion [30,31].
In this study, a numerical solution of the bearing capacity of footings in a soft rock foundation was proposed taking the strain hardening/softening material behavior and the intermediate principal stress effect into account. The influence of the intermediate principal stress on the bearing capacity of strip, circular and square footings in a soft rock foundation will be analyzed.

2. Materials, Theories and Methods

The unified strength theory (UST), which takes the influence of the intermediate principal shear stress (or intermediate principal stress) into account, was proposed by Yu [32]. The expressions of the UST can be written in terms of the principal stresses as follows:
{ f = b σ 2 + σ 3 ( 1 + b ) ( 1 + sin φ ) / ( 1 sin φ ) σ 1 + 2 c ( 1 + sin φ ) / ( 1 sin φ ) ,   when   σ 2 1 + sin φ 2 σ 1 + 1 sin φ 2 σ 3 f = σ 3 ( 1 + sin φ ) / ( 1 sin φ ) σ 1 + b σ 2 1 + b + 2 c ( 1 + sin φ ) / ( 1 sin φ ) ,   when   σ 2 1 + sin φ 2 σ 1 + 1 sin φ 2 σ 3
where b is a coefficient reflecting the effect of the intermediate principal stress on the strength of geomaterials, c and φ are the cohesion and friction angle of geomaterials, respectively. The order of the three principal stresses follows σ1σ2σ3. For the non-associated flow rule, the plastic potential function g can be written as follows:
{ g = b σ 2 + σ 3 ( 1 + b ) ( 1 + sin ψ ) / ( 1 sin ψ ) σ 1 ,   when   σ 2 1 + sin φ 2 σ 1 + 1 sin φ 2 σ 3 g = σ 3 ( 1 + sin ψ ) / ( 1 sin ψ ) σ 1 + b σ 2 1 + b ,   when   σ 2 1 + sin φ 2 σ 1 + 1 sin φ 2 σ 3
where ψ is the dilation angle for geomaterials (the plastic flow rule is non-associated if ψ < φ, and the plastic flow rule is associated if ψ = φ). The limit loci of UST on the deviatoric plane or principal stress space are shown in Figure 1a,b, where θb is the stress angle for the junction of two yield surfaces and depends only on the friction angle of the material. Comparisons between the yield surfaces of the UST and test data for granite, marble, and sand under a complex stress state are plotted in Figure 2, the intermediate principal stress has a substantial influence on the strengths of geomaterials under complex stress states. UST can predict the potential strengths of different geomaterials with various values of the parameter b. The yield surfaces of the UST cover the entire region of convex theory from the lower bound (UST b = 0.0) to the upper bound (UST b = 1.0). The Mohr–Coulomb strength criterion is the special case of the UST when the coefficient b equals zero.
In this study, the vertical bearing capacity solutions for strip, circular and square footings in a soft rock foundation were evaluated using a finite difference code FLAC/FLAC3D and strain hardening/softening constitutive model based on the UST. FLAC/FLAC3D (fast Lagrangian analysis of continua) is a two/three-dimensional (2D/3D) finite-difference code that uses an explicit Lagrangian computation scheme. The behavior of structures built of soil, rock, or other materials that may undergo plastic flow when their yield limits are reached can be simulated easily by FLAC/FLAC3D [33,34]. The derivation and verification of the UST elastoplastic constitutive model in FLAC/FLAC3D were discussed by Ma [35,36]. In this study, the strain hardening/softening constitutive model based on the UST is written in C++ as a user-written constitutive model and compiled as a DLL file (dynamic link library), and it can be loaded into the FLAC/FLAC3D code. The elastic relations between the elastic principal strain increments and principal stress increments in FLAC/FLAC3D are as follows:
Δ σ i = S i ( Δ ε n e )   i = 1 , n   and   n = 1 , 3
where Si is a linear function of the elastic principal strain increments Δ ε n e . The plastic principal strain increments can be written as follows:
Δ ε i p = λ g / σ i
where λ is a non-negative multiplier if plastic loading occurs. The expression of the elastoplastic constitutive model for FLAC/FLAC3D can be formulated as follows:
σ i N = σ i I λ S i ( g σ n )
where Si(∂g/∂σn) is the matrix of the constitutive model composed by the plastic principal strain component, g is the plastic potential function, σ i I are the stress components obtained from the elastic Hooke’s law (elastic trial stress), and σ i N are the new stress components obtained from the plastic flow rule (if the elastic trial stress exceed the Equation (1)). The expression of the plastic multiplier λ can be written as follows:
λ = f ( σ n I ) / [ f ( S n ( g σ n ) ) f ( 0 ) ]
Equation (6) is accurate only for an elastic perfectly plastic material, for which the strength parameters are constant. Theoretically, Equation (6) is non-rigorous for hardening/softening material because it lacks the hardening modulus. In this study, the hardening parameter eps is used to characterize the hardening/softening behavior via the plastic shear strain [37], and eps is defined as follows:
e p s = { 1 2 [ ( ε 1 p s ε m p s ) 2 + ( ε 2 p s ε m p s ) 2 + ( ε 3 p s ε m p s ) 2 ] } 1 / 2
where ε 1 p s , ε 2 p s and ε 3 p s are the three plastic principal strains of the shear strength envelope and ε m p s = ( ε 1 p s + ε 2 p s + ε 3 p s ) / 3 . It is observed from Equation (7) that the hardening parameter eps equals the square root of the second invariant of the strain. For the plastic hardening/softening stage, the plastic potential function g can be written as follows:
g [ σ n ,   c ( e p s ) ,   φ ( e p s ) ] = 0   n = 1 , 3
Liao et al. and Li conducted consolidated-undrained (CU) triaxial shear tests on saturated diatomaceous soft rock and mudstone, respectively [38,39]. The effective stress is used to calculate the shear strength parameters using the test data of the CU test for diatomaceous rock and mudstone. The triaxial test results on the diatomaceous soft rock and mudstone show that the effective strength parameter φ for the two types of soft rock has peak and residual values with the value of axial strain ε1 increased (shown in Figure 3a). The effective strength parameter c (cohesion) of the two types of soft rock remains constant during the deformation progress of the soft rock sample. In this study, the friction angle φ in the plastic potential function g varies with the values of the hardening parameter eps. In contrast, cohesion c does not depend on the hardening parameter eps. The hump curve function is used as the hardening/softening function to simulate the strain-softening behavior of soft rock in this study. The relationship between the friction angle φ and the hardening parameter eps predicted by the hump curve function is shown in Figure 4, and the hump curve function is described as follows:
φ ( e p s ) = e p s ( H + R e p s ) ( H + P e p s ) 2
where the parameter H controls the slope of the hump curve, and the parameters P and R control the peak and residual value of the hump curve. The values of the parameters H, P, and R in Equation (9) can be determined by the variation in the strength parameter φ yielded by a triaxial test of the soft rock. The UST elastoplastic constitutive model can be established via the substitution of Equations (4), (6), and (9) into Equation (5). The plastic shear strain eps are updated by each time step (time increment Δt) in the numerical computation, and the values of friction angle φ will be changed with the variation of the plastic shear strain eps after each time step. Thus, the type of hardening rule is isotropic. The loading surface of the strain hardening/softening model is expanded with the variation of the values of friction angle φ, and the hardening/softening behavior of the soft rock can be predicted.
A 2D axisymmetric element was used to simulate a test sample of soft rock, and the consolidated-undrained triaxial test was simulated using FLAC code. The confining pressure σ3 was applied by the stress boundary condition on all sides of the test sample element to generate the consolidated stress. For the conventional triaxial test situation (simple stress state), the three principal stresses follow σ1σ2 = σ3, a vertical velocity load (1 × 10⁻⁶ m/step) was applied to the top of the test sample element to simulate the maximum principal stress σ1. The bottom of the test sample element was fixed in the vertical direction. The values of the material property parameters for numerical analysis are presented in Table 1. Because the test sample of soft rock had slight volume dilation after the consolidated-undrained triaxial test, the dilation angle ψ was set to zero (non-associated flow rule) throughout the whole calculation process of the triaxial test simulation. Figure 3a,b show the relationship of stress (σ1σ3) versus axial strain (ε1) for diatomaceous soft rock and mudstone, respectively, measured by the consolidated-undrained triaxial test or simulated by FLAC using the hump curve function (Equation (9)). The comparison between the model prediction and measured results shows that the stress–strain relationship of soft rock under the triaxial test state (σ1σ2 = σ3) can be simulated by the elastoplastic model with the hump curve function. Then, the values of the bearing capacity factor Nc and Nγ for strip, circular and square footings in diatomaceous soft rock were evaluated by FLAC/FLAC3D using the strain hardening/softening constitutive model following the UST.

3. Calculations and Results

The 2D problem of the plane strain and axisymmetry is also under the complex stress state; three principal stress are independent and not equals to each other. Thus, the intermediate principal stress will have a specific influence on the 2D problem. Strip and circular footings can be considered as plane strain and axisymmetric problems, respectively. The square footing must be analyzed as a 3D problem. Vesić suggested an equation of the ultimate bearing capacity for a strip footing on a soil foundation. The formula is expressed as follows [40]:
P u = c N c + γ B 2 N γ
N c = cot φ [ 1 + sin φ 1 sin φ exp ( π tan φ ) 1 ]
N γ = 2 [ 1 + sin φ 1 sin φ exp ( π tan φ ) + 1 ] tan φ
P u = c N c + q N q + 0.4 B N γ   ( for   square   foundation )
where Pu is the ultimate bearing capacity of strip footing, Nc is the bearing capacity factor of cohesion c, γ is the soil unit weight, B is the footing width, and Nγ is the soil self-weight bearing capacity. Terzaghi also proposed the formulas of factors Nc and Nγ for rough rigid and strip footings [41]. Circular footings, which belong to the class of axisymmetric problems, were considered by Eason and Shield and Cox et al. using the characteristic method [42,43]. The bearing capacity of a square footing has been investigated by some researchers using numerical and testing methods [44,45,46,47].
In this study, the foundation was considered a strain-softening and homogeneous material (soft rock) and discretized into several finite-difference element meshes. The footings are considered to be perfectly rigid and rough. The influence of the intermediate principal stress on the bearing capacity of strip, circular and square footings was analyzed, taking the strain hardening/softening behavior of soft rock into account. The residual strength of soft rock is practically irrelevant, and it is only of the theoretical value. In this study, the peak and residual bearing capacity of soft rock foundations are both considered for analysis. The values of the factors Nc and Nγ for strip, circular and square footings in diatomaceous soft rock were evaluated by FLAC and FLAC3D code with strain hardening/softening constitutive model following the UST and dilation angle ψ = 0. Because the problem domain is symmetric, only half of the problem domain was considered, and the footing width B was held constant at 20 m. Because the left vertical boundary was the symmetry plane, the horizontal displacement was fixed, and the vertical displacement was free. The right vertical boundary was only constrained in the horizontal direction. The displacement of the bottom boundary was fixed in both the vertical and horizontal directions. The boundary condition and mesh for numerical analysis are shown in Figure 5. The analyses were performed by applying a vertical velocity (1 × 10⁻⁶ m/step) to simulate the load from the rigid footing base. The contact stress P beneath the strip footing was calculated as the sum of the vertical nodal forces beneath the footing divided by the half-width of the footing [10]. The contact stress P beneath the circular footing was calculated by dividing the sum of the vertical footing nodal forces by the footing area, the radius of which is equal to the distance to the center of the first element outside the footing [9]. The horizontal velocity at the surface nodes beneath the footing was set to zero to simulate the rough interface between the footing and soft rock foundation. Previous studies observed that the value of Poisson’s ratio ν and elastic modulus E do not influence the value of the bearing capacity of footings [11]. The tensile failure at the free surface near the footing base has little influence on the ultimate bearing capacity of footings [9,10]. Shear failure is placed in most elements beneath the footing under the limit state, and the ultimate bearing capacity of footing mainly depends on the shear strength parameters (c and φ) of soft rock.
The two bearing capacity factors (Nc and Nγ) can be obtained individually using the numerical method [10,11] and can be expressed by the following equations:
{ N c = P / c ,   when   γ = 0 N γ = 2 P / γ B ,   when   c = 0
where, P is the contact stress beneath the footing base, B is the width of the footing. The initial soil stress state must be established before the numerical computation of the bearing capacity factor Nγ. The initial geostress state for foundation soil is calculated with gravity, and a load of footing base is not applied to the surface of the foundation. Secondly, the vertical load is applied to the nodes underneath the footing base after the initial geostress of the foundation is established. The peak and residual values of bearing capacity factor Nc and Nγ yield by FLAC and UST are shown in Table 2 and Table 3, respectively. Two parameters ξc and ξγ are given to estimate the influence of the intermediate principal stress and are described as follows:
ξ c = N c ( UST ,   b 0 ) N c ( Mohr - Coulomb ) ,   ξ γ = N γ ( UST ,   b 0 ) N γ ( Mohr - Coulomb )
where ξc and ξγ are the efficiency factors of the intermediate principal stress effect for the bearing capacity factors Nc and Nγ, respectively. Figure 6 shows the relationship of Nc = P/c and Nγ = 2P/γB versus vertical displacement s/w for strip, circular and square footings in diatomaceous soft rock as calculated by the finite-difference code FLAC. The relationship of the peak and residual values of the bearing capacity factors Nc and Nγ for strip, circular and square footings versus the parameter b of UST are shown in Figure 7. The results from Figure 6 indicate that the strain-softening characteristic for Nγ is more remarkable than that of Nc. The results from Figure 7 suggest that the peak and residual values of the factors Nc and Nγ for strip, circular and square footings are increased with increasing values of the parameter b in UST. Figure 8 shows the relationship of the efficiency factors ξc and ξγ versus the values of parameter b of UST. The results from Figure 8 indicate that the values of the efficiency factor ξγ for Nγ are generally higher than the efficiency factor ξc with the values of the parameter b increased. The influence of the intermediate principal stress on the peak and residual values of Nγ is more apparent than that of Nc. The influence of the intermediate principal stress on the peak and residual values of the bearing capacity for a strip footing is much more significant than for circular and square footings. The intermediate principal stress has a similar influence on the peak and residual values of the bearing capacity of circular and square footings. The difference between the influence of the intermediate principal stress on the peak and residual values of the bearing capacity of a soft rock foundation appears relatively small. Figure 9 shows the maximum shear strain rate contours for a rough strip footing when the soft rock foundation’s peak or residual bearing capacity has been reached.

4. Discussion

The results of numerical computation show that the influence of the intermediate principal stress on the peak and residual values of Nγ is more apparent than on the bearing capacity factor Nc. The influence of the intermediate principal stress on the peak and residual values of the bearing capacity for a strip footing is much greater than for circular and square footings. The strain-softening behavior of soft rock foundations beneath strip, circular and square footings for factor Nγ evaluations are more apparent than that of the Nc evaluations. The influence of the intermediate principal stress on the peak and residual values of Nγ is more apparent than on the bearing capacity factor Nc. The influence of the intermediate principal stress on the peak and residual values of the bearing capacity for a strip footing is much greater than for circular and square footings. The difference between the influence of the intermediate principal stress on the peak and residual values of the bearing capacity of a soft rock foundation is relatively small. The size of the shear zone in the soft rock foundation increases as the value of the UST parameter b increases. The shear zone of the soft rock foundation under peak values of the bearing capacity is larger than that of the residual values of the bearing capacity.
The results obtained from FLAC/FLAC3D code using the UST indicate that a clear difference exists between the failure mechanisms of the foundation when the influence of the intermediate principal stress is taken into account versus when it is not. The size of the shear zone increases as the value of parameter b increases, and more soft rock beneath the footing contributes to the bearing capacity of the foundation. The size of the shear zone in the peak bearing capacity of soft rock foundations is larger than that of the residual bearing capacity, and the size of the shear zone for Nc evaluation is larger than that of the Nγ.

5. Conclusions

This paper presents a series of numerical solutions for the bearing capacity of strip, circular, and square footings in a soft rock foundation. Based on the results of this study, the following conclusions can be drawn:
(1)
A strain hardening/softening constitutive model which takes the influence of the intermediate principal stress into account was established in this study. The mechanical behavior of the strain-softening material under the complex stress state can be analyzed using this model.
(2)
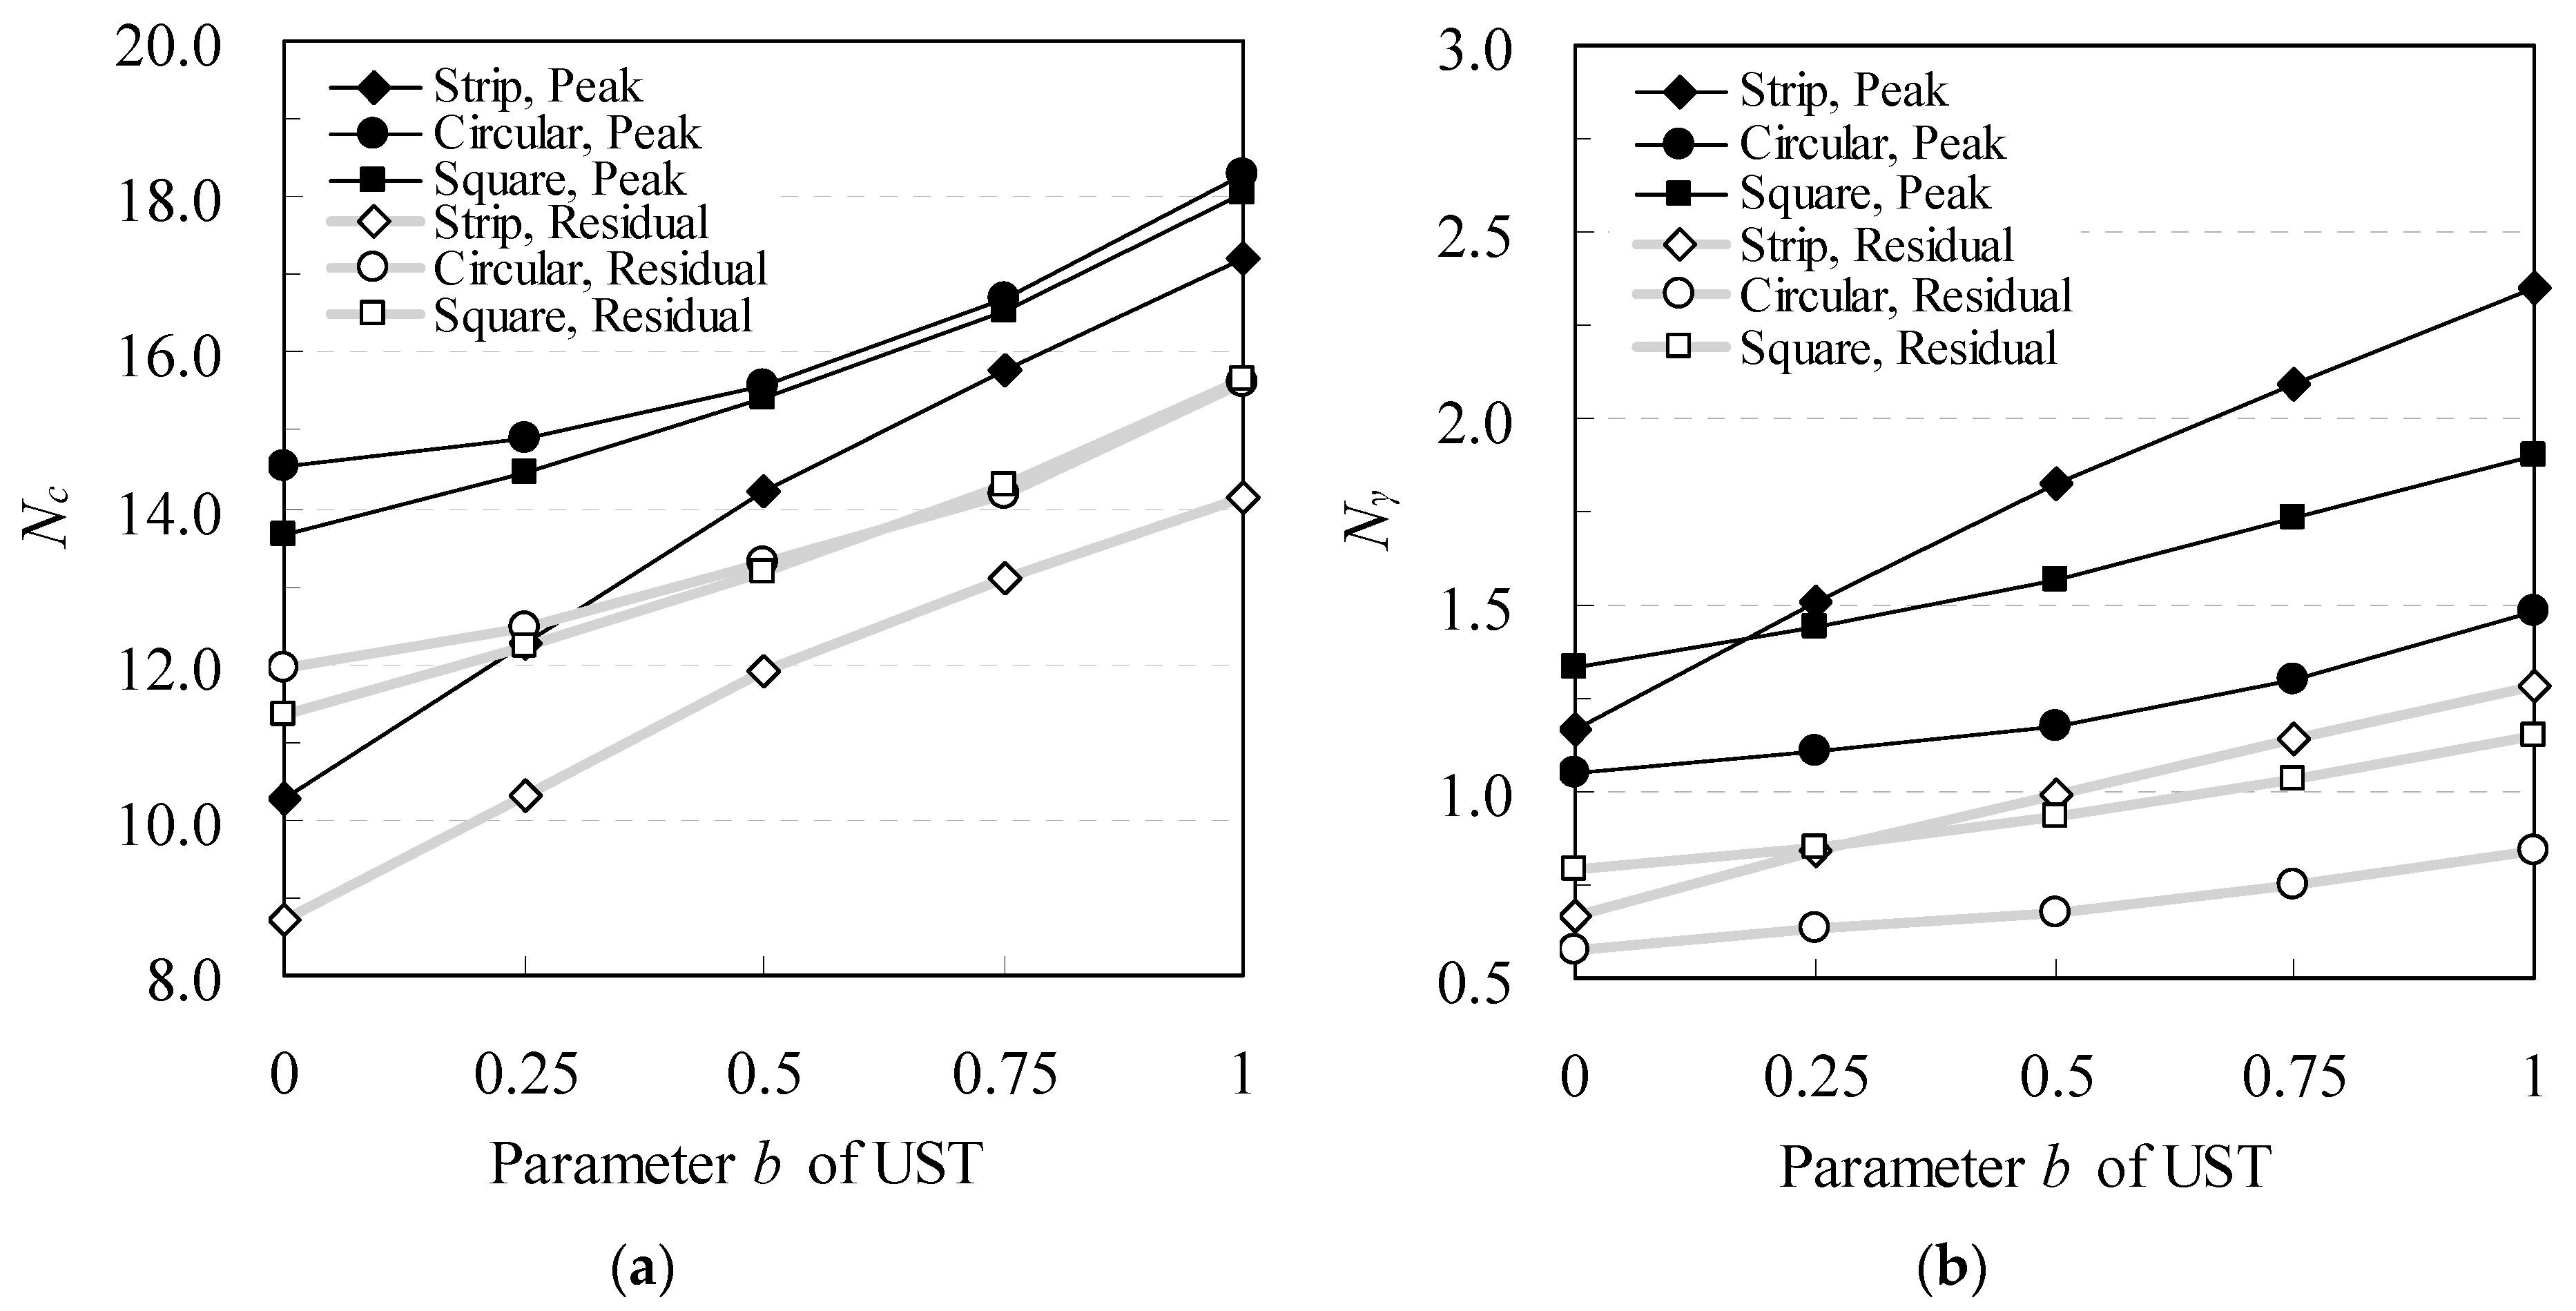
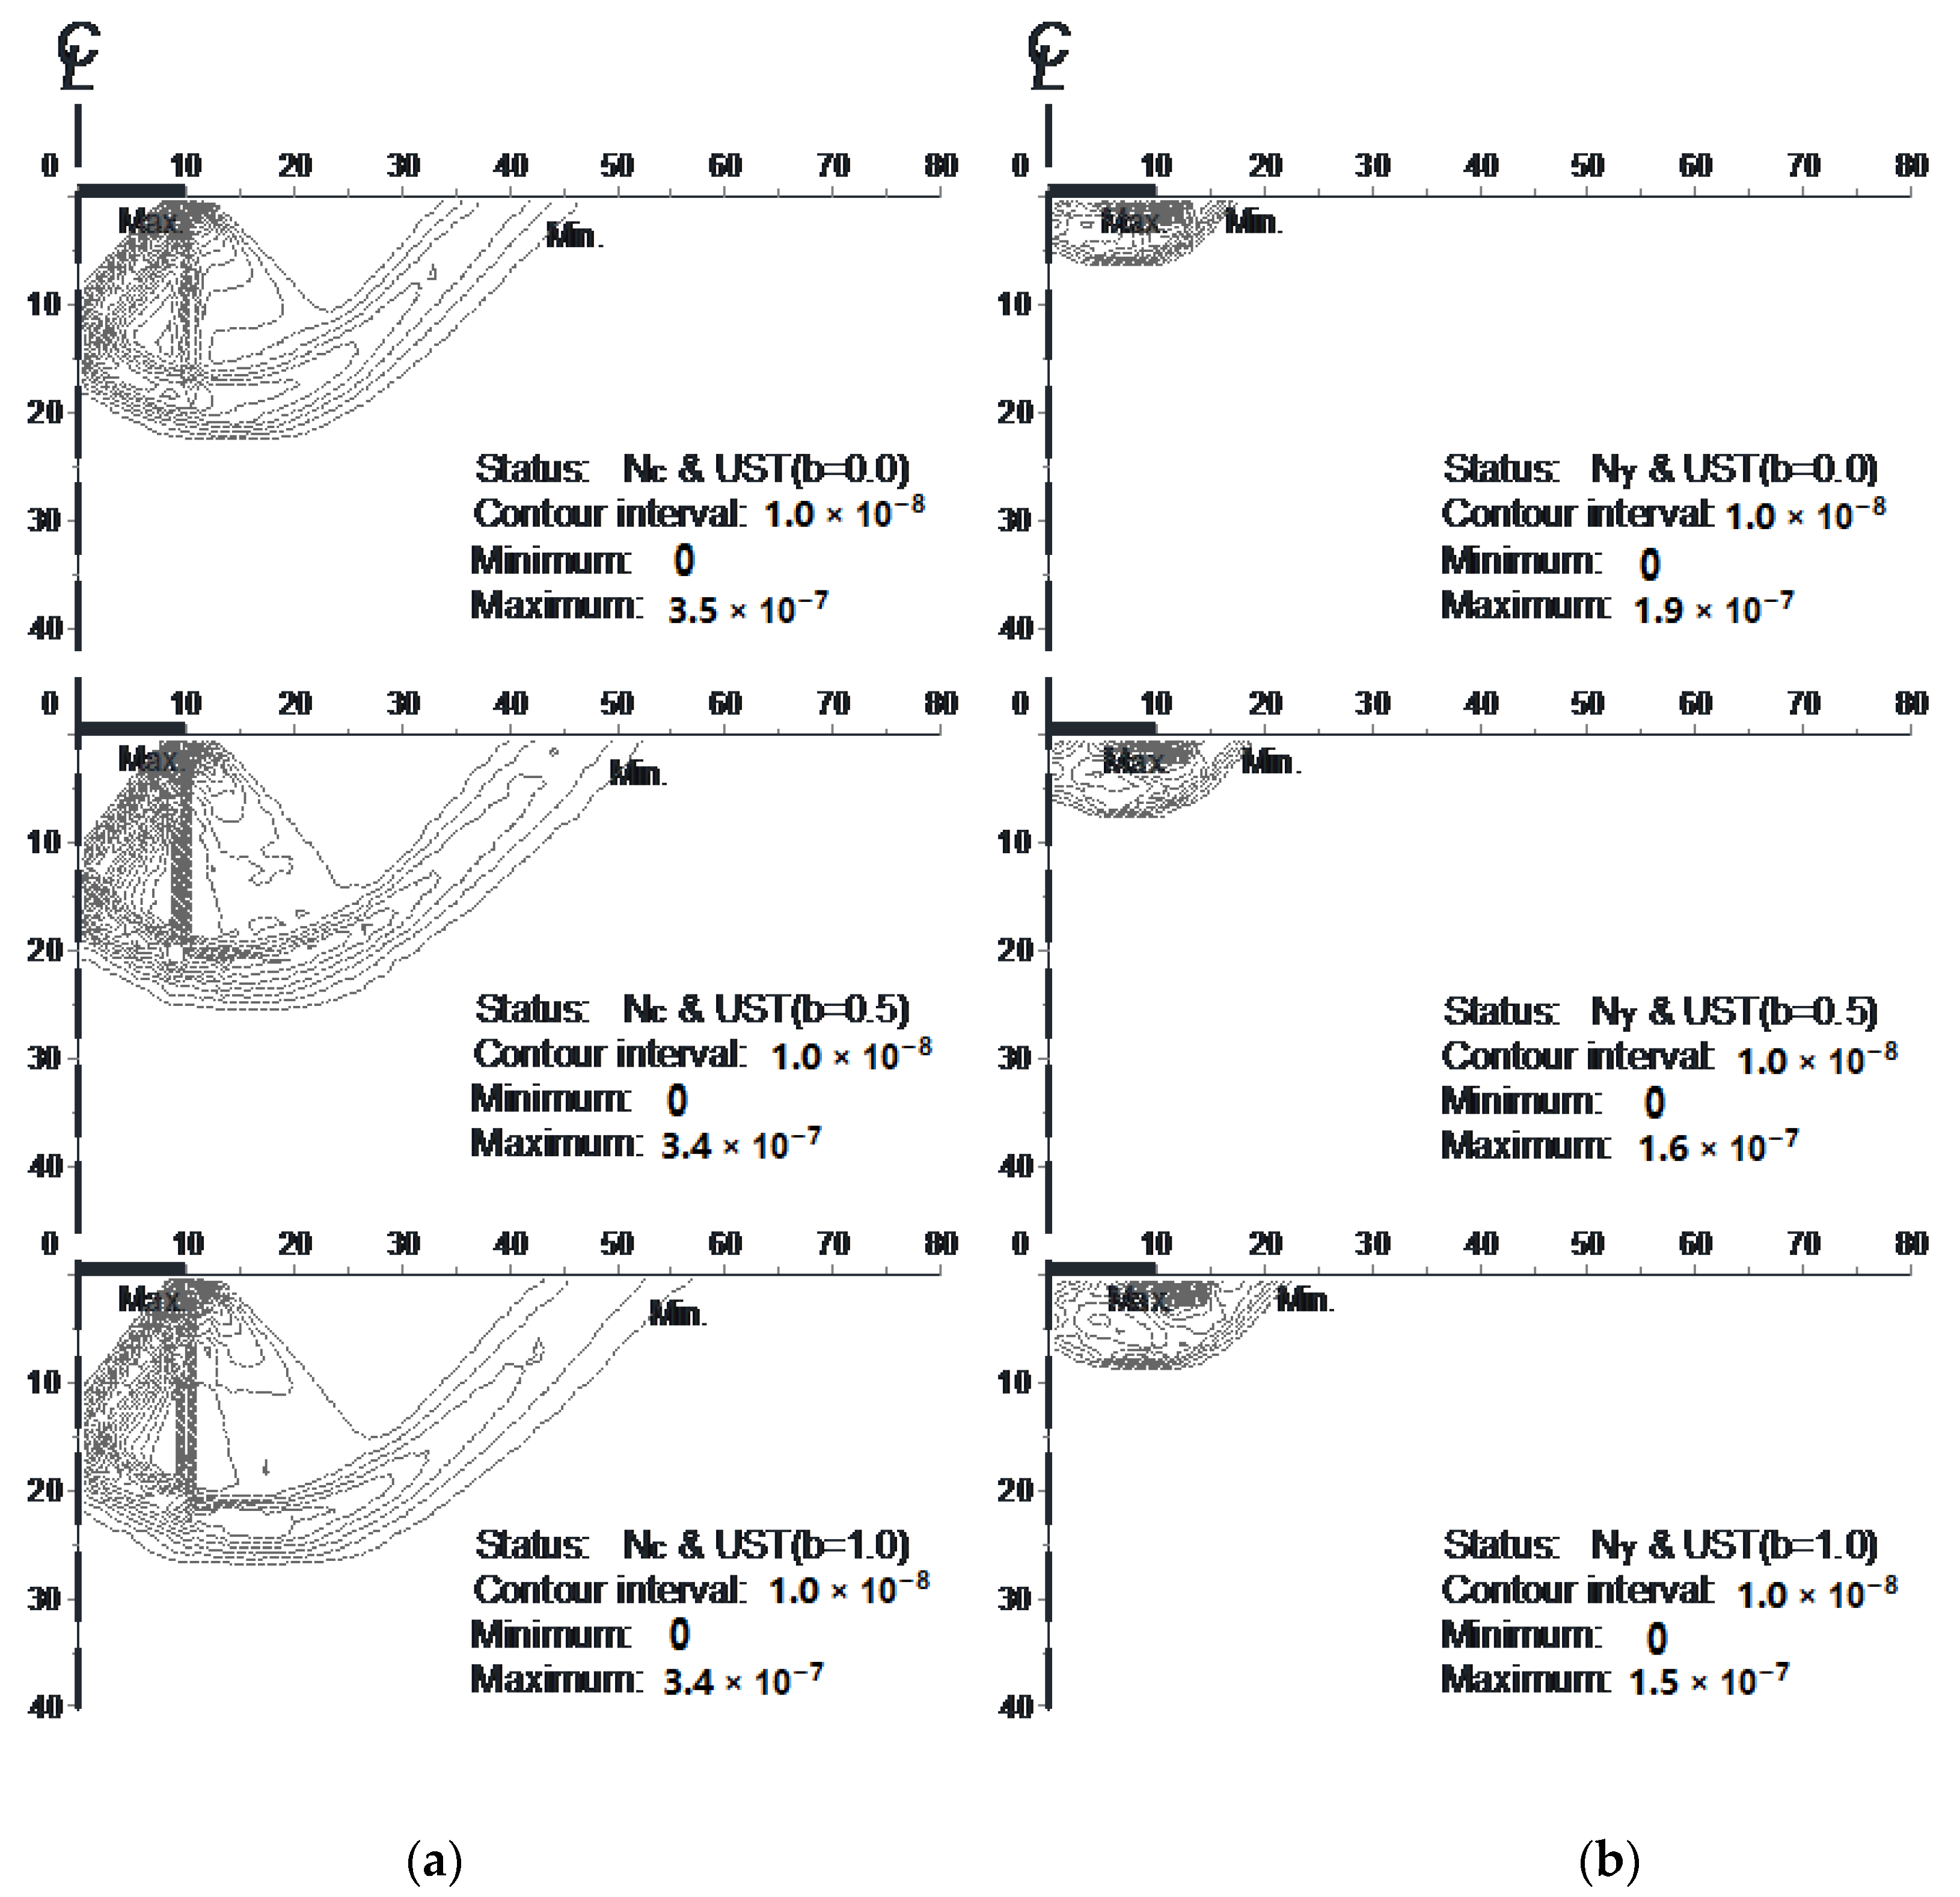
The intermediate principal stress significantly influences a soft rock foundation’s bearing capacity and failure mechanisms. The intermediate principal stress has less influence on the bearing capacity of footing when gravity is neglected. The influence of the intermediate principal stress on the bearing capacity for strip footing is much more significant than that of circular and square footings. The size of the failure area in the soft rock foundation increases with the increased effect of the intermediate principal stress.
(3)
The research works of our study would benefit the reasonable estimation of the bearing capacity of footings in a soft rock medium. In our future research, taking the nonlinear failure envelope on the meridian plane into account, the influence of the intermediate principal stress effect on soft rock material will be investigated.

Author Contributions

Conceptualization, Z.M.; Methodology, Z.M.; Investigation, Z.M.; Resources, H.L.; Data Curation, H.L.; Writing-Original Draft Preparation, Z.M.; Writing-Review and Editing, F.D. All authors have read and agreed to the published version of the manuscript.

Funding

This research received the funding of the National Nature Science Foundation of China (No. 51879212, 51979225).

Institutional Review Board Statement

Not applicable.

Informed Consent Statement

Not applicable.

Data Availability Statement

All data, models, and code generated or used during the study appear in the submitted article.

Conflicts of Interest

The authors declare no conflict of interest.

References

  1. British Standards Institution. Geotechnical Investigation and Testing—Identification and Classification of Rock; ISO14689: 2017; British Standards Institution: London, UK, 2018. [Google Scholar]
  2. International Society for Rock Mechanics (ISRM). The ISRM Suggested Methods for Rock Characterization, Testing and Monitoring: 2007–2014; Ulusay, R., Ed.; Pergamon Press: Oxford, UK, 2015. [Google Scholar]
  3. Berre, T. Triaxial Testing of Soft Rocks. Geotech. Test. J. 2011, 34, 61–75. [Google Scholar] [CrossRef]
  4. Liao, H.J.; Su, L.J.; Pu, W.C.; Yin, J.H. Test and numerical analysis of the constitutive relation of a diatomaceous soft rock. Mar. Geotechnol. 2003, 21, 183–200. [Google Scholar] [CrossRef]
  5. Jovičić, V.; Lapčević, R.; Bogdanović, S. Preservation of Historical Underground Sites in Soft Rock: A Case Example. Geosciences 2020, 10, 256. [Google Scholar] [CrossRef]
  6. Liu, B.; Jiang, X. Consolidation and deformation characteristics of soft rock foundation in hydrological wetland environment. Earth Sci. Res. J. 2020, 24, 183–190. [Google Scholar] [CrossRef]
  7. Zhu, H.; Ye, B.; Cai, Y.; Feng, Z. An elasto-viscoplastic model for soft rock around tunnels considering overconsolidation and structure effects. Comput. Geotech. 2013, 50, 6–16. [Google Scholar] [CrossRef]
  8. Tokiwa, T.; Tsusaka, K.; Matsubara, M.; Ishikawa, T. Fracture characterization around a gallery in soft sedimentary rock in horonobe url of japan. Int. J. Rock Mech. Min. Sci. 2014, 65, 1–7. [Google Scholar] [CrossRef]
  9. Erickson, H.L.; Drescher, A. Bearing capacity of circular footings. J. Geotech. Geoenvironmental Eng. 2002, 128, 38–43. [Google Scholar] [CrossRef]
  10. Frydman, S.; Burd, H. Numerical studies of bearing-capacity factor ngamma. J. Geotech. Geoenvironmental Eng. 1997, 123, 20–29. [Google Scholar] [CrossRef]
  11. Loukidis, D.; Salgado, R. Bearing capacity of strip and circular footings in sand using finite elements. Comput. Geotech. 2009, 36, 871–879. [Google Scholar] [CrossRef]
  12. Salgado, R.; Lyamin, A.V.; Sloan, S.W.; Yu, H.S. Two and three-dimensional bearing capacity of foundations in clay. Géotechnique 2004, 54, 297–306. [Google Scholar] [CrossRef]
  13. Sukmak, G.; Sukmak, P.; Horpibulsuk, S.; Hoy, M.; Arulrajah, A. Load Bearing Capacity of Cohesive-Frictional Soils Reinforced with Full-Wraparound Geotextiles: Experimental and Numerical Investigation. Appl. Sci. 2021, 11, 2973. [Google Scholar] [CrossRef]
  14. Hosamo, H.; Sliteen, I.; Ding, S. Numerical Analysis of Bearing Capacity of a Ring Footing on Geogrid Reinforced Sand. Buildings 2021, 11, 68. [Google Scholar] [CrossRef]
  15. Galindo, R.; Alencar, A.; Isik, N.S.; Olalla Marañón, C. Assessment of the Bearing Capacity of Foundations on Rock Masses Subjected to Seismic and Seepage Loads. Sustainability 2020, 12, 10063. [Google Scholar] [CrossRef]
  16. Ma, Z.Y.; Liao, H.J.; Dang, F.N. Effect of intermediate principal stress on strength of soft rock under complex stress states. J. Cent. South Univ. 2014, 21, 1583–1593. [Google Scholar] [CrossRef]
  17. Ma, Z.Y.; Liao, H.J.; Dang, F.N. Influence of intermediate principal stress on the bearing capacity of strip and circular footings. J. Eng. Mech. ASCE 2014, 140, 04014041. [Google Scholar] [CrossRef]
  18. Lade, P.V. Assessment of test data for selection of 3-d failure criterion for sand. Int. J. Numer. Anal. Methods Geomech. 2006, 30, 307–333. [Google Scholar] [CrossRef]
  19. You, M. True-triaxial strength criteria for rock. Int. J. Rock Mech. Min. Sci. 2009, 46, 115–127. [Google Scholar] [CrossRef]
  20. Sutherland, H.B.; Mesdary, M.S. The influence of the intermediate principal stress on the strength of sand. In Proceedings of the 7th International Conference on Soil Mechanics and Foundation Engineering, Mexico City, Mexico, 12–16 January 1969; pp. 391–399. [Google Scholar]
  21. Mogi, K. Effect of the intermediate principal stress on rock failure. J. Geophys. Res. 1967, 72, 5117–5131. [Google Scholar] [CrossRef]
  22. Xue, Y.; Liu, J.; Ranjith, P.G.; Liang, X.; Wang, S. Investigation of the influence of gas fracturing on fracturing characteristics of coal mass and gas extraction efficiency based on a multi-physical field model. J. Pet. Sci. Eng. 2021, 206, 109018. [Google Scholar] [CrossRef]
  23. Kulatilake, P.H.S.W. 3-D Rock Mass Strength Criteria—A Review of the Current Status. Geotechnics 2021, 1, 7. [Google Scholar] [CrossRef]
  24. Xu, P.; Sun, Z.; Shao, S.; Fang, L. Comparative Analysis of Common Strength Criteria of Soil Materials. Materials 2021, 14, 4302. [Google Scholar] [CrossRef]
  25. Liu, Y.; Liao, X.; Li, L.; Mao, H. Discrete Element Modelling of the Mechanical Behavior of Sand–Rubber Mixtures under True Triaxial Tests. Materials 2020, 13, 5716. [Google Scholar] [CrossRef]
  26. Song, Z.; Li, M.; Yin, G.; Ranjith, P.G.; Zhang, D.; Liu, C. Effect of Intermediate Principal Stress on the Strength, Deformation, and Permeability of Sandstone. Energies 2018, 11, 2694. [Google Scholar] [CrossRef] [Green Version]
  27. Guan, H.-X.; Wang, H.-Q.; Liu, H.; Yan, J.-J.; Lin, M. The Effect of Intermediate Principal Stress on Compressive Strength of Different Cement Content of Cement-Stabilized Macadam and Different Gradation of AC-13 Mixture. Appl. Sci. 2018, 8, 2000. [Google Scholar] [CrossRef] [Green Version]
  28. Rukhaiyar, S.; Sajwan, G.; Samadhiya, N.K. Strength behavior of plain cement concrete subjected to true triaxial compression. Can. J. Civ. Eng. 2018, 45, 179–196. [Google Scholar] [CrossRef] [Green Version]
  29. Yang, Q.; Zan, Y.; Xie, L.G. Comparative analysis of the nonlinear unified strength criterion for rocks and other three-dimensional Hoek–Brown strength criteria. Geomech. Geophys. Geo-Energy Geo-Resour. 2018, 4, 29–37. [Google Scholar] [CrossRef]
  30. Zienkiewicz, O.C.; Pande, G.N. Finite Elements in Geomechanics; Wiley: New York, NY, USA, 1977. [Google Scholar]
  31. Matsuoka, H.; Nakai, T. Relationship among tresca, mises, mohr-coulomb and matsuoka-nakai failure criteria. Soils Found. 1985, 25, 123–128. [Google Scholar] [CrossRef] [Green Version]
  32. Yu, M.H. Unified Strength Theory and Its Applications; Springer: Berlin/Heidelberg, Germany, 2004. [Google Scholar]
  33. Itasca Consulting Group Inc. FLAC-Fast Lagrangian Analysis of Continua (Version 8.1) User’s Manual; Itasca Consulting Group Inc.: Minneapolis, MN, USA, 2019. [Google Scholar]
  34. Itasca Consulting Group Inc. FLAC3D-Fast Lagrangian Analysis of Continua in 3 Dimensions (Version 7.0) User’s Manual; Itasca Consulting Group Inc.: Minneapolis, MN, USA, 2019. [Google Scholar]
  35. Ma, Z.Y.; Liao, H.J.; Dang, F.N. Unified elastoplastic finite difference and its application. Appl. Math. Mech. 2013, 34, 457–474. [Google Scholar] [CrossRef]
  36. Ma, Z.Y.; Dang, F.N.; Liao, H.J. Numerical study of the dynamic compaction of gravel soil ground using the discrete element method. Granul. Matter 2014, 16, 881–889. [Google Scholar] [CrossRef]
  37. Vermeer, P.A.; Borst, D. Non-associated plasticity for soils, concrete and rocks. Heron 1984, 29, 3–64. [Google Scholar] [CrossRef] [Green Version]
  38. Li, H.Z.; Liao, H.J.; Kong, L.W.; Leng, X.L. Experimental study on stress-strain relationship of expansive mud-stone. Yantu Lixue/Rock Soil Mech. 2007, 28, 107–110. (In Chinese) [Google Scholar]
  39. Kang, X.S.; Liao, H.J. A Bounding Surface Plasticity Model Considering Spacing Ratio for Overconsolidated Jointed Soft Rocks. Rock Mech. Rock Eng. 2020, 53, 59–69. [Google Scholar] [CrossRef]
  40. Vesic, A.S. Analysis of ultimate loads of shallow foundations. J. Soil Mech. Found. Div. ASCE 1973, 99, 45–73. [Google Scholar] [CrossRef]
  41. Terzaghi, K. Theoretical Soil Mechanics; Wiley: New York, NY, USA, 1943. [Google Scholar]
  42. Eason, G.; Shield, R.T. The plastic indentation of a semi-infinite solid by a perfectly rough circular punch. Z. Angew. Math. Phys. Zamp 1960, 11, 33–43. [Google Scholar] [CrossRef]
  43. Cox, A.D. Axially-symmetric plastic deformation in soils—II. indentation of ponderable soils. Int. J. Mech. Sci. 1962, 4, 371–380. [Google Scholar] [CrossRef]
  44. Dixit, M.S.; Patil, K.A. Experimental estimate of nγ values and corresponding settlements for square footings on finite layer of sand. Geomech. Eng. 2013, 5, 363–377. [Google Scholar] [CrossRef]
  45. Puzakov, V.; Drescher, A.; Michalowski, R.L. Shape factor for shallow footings. Geomech. Eng. 2009, 1, 113–120. [Google Scholar] [CrossRef]
  46. Long, Y.; Liu, J.; Kong, X.J.; Hu, Y. Three-dimensional large deformation fe analysis of square footings in two-layered clays. J. Geotech. Geoenviron. Eng. ASCE 2011, 137, 52–58. [Google Scholar] [CrossRef]
  47. Zhu, M.; Radoslaw, L.; Michalowski, R.L. Shape factors for limit loads on square and rectangular footings. J. Geotech. Geoenviron. Eng. 2005, 131, 223–231. [Google Scholar] [CrossRef]
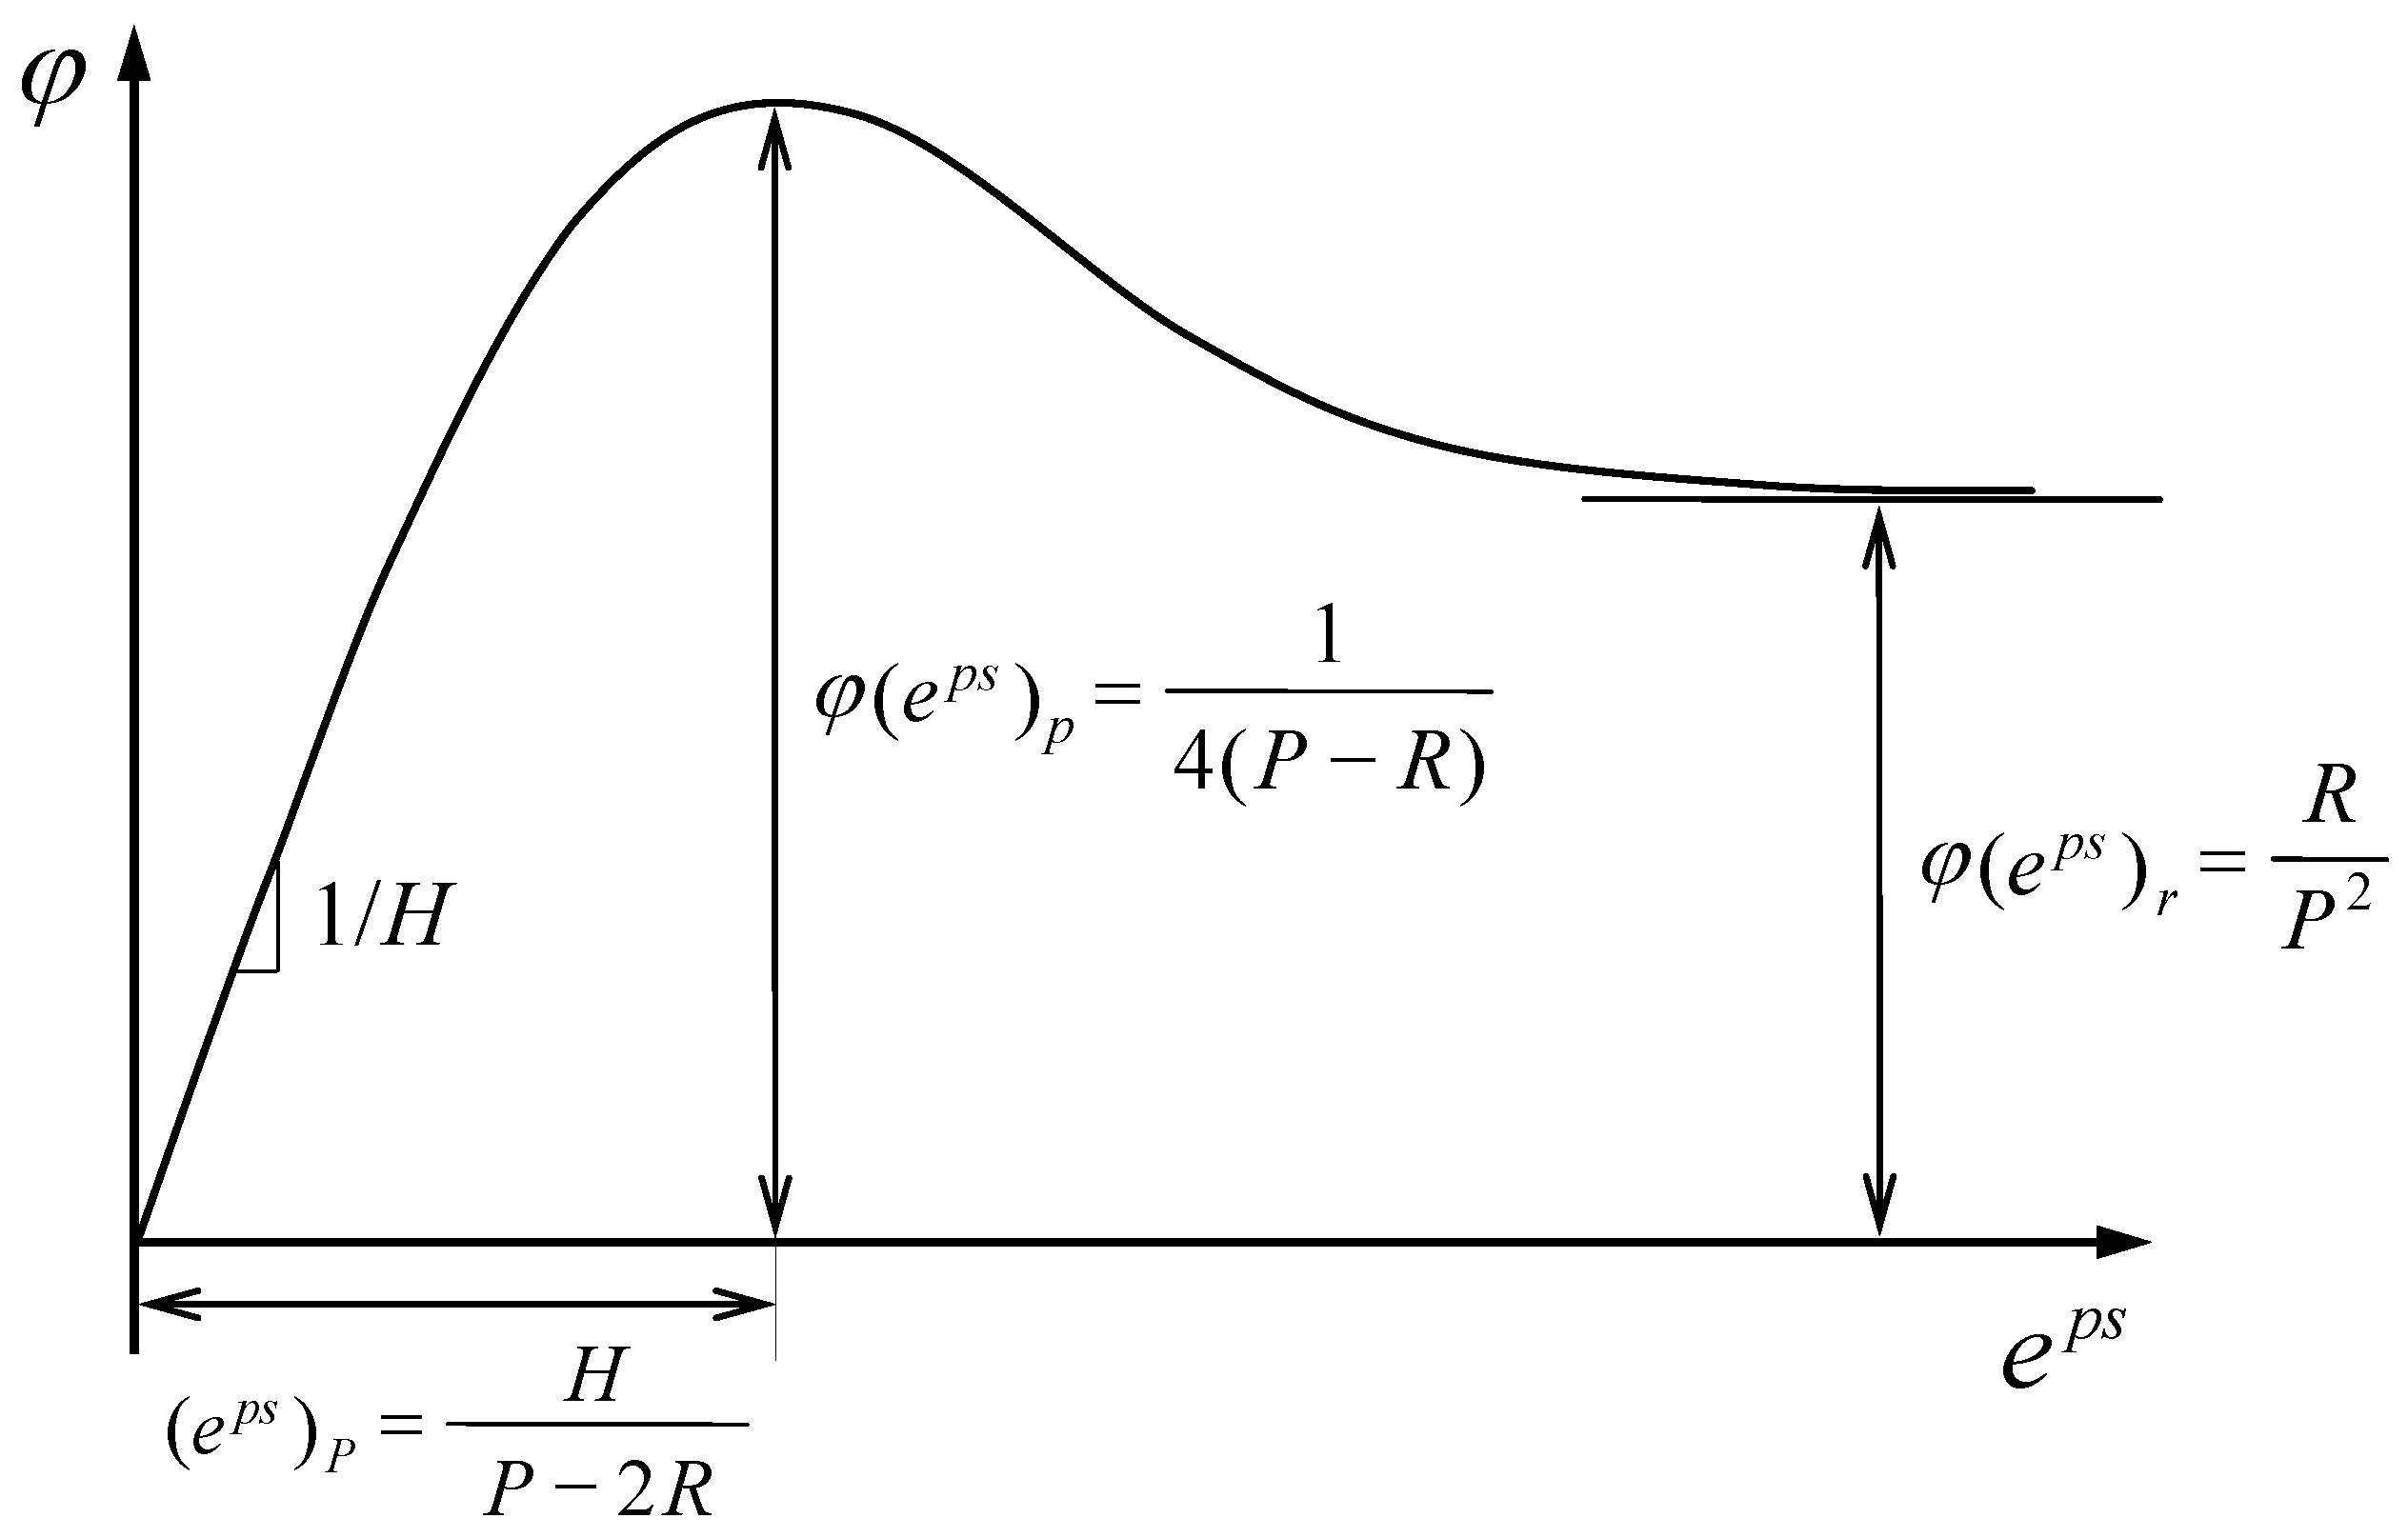
Figure 1. Limit loci of UST: (a) deviatoric plane, (b) principal stress space.
Coatings 11 01019 g001
Figure 2. Limit surfaces of rock and sand under complex stress states: (a) Granite, (b) Marble, (c) Toyoura sand, (d) Loch Aline sand.
Coatings 11 01019 g002
Figure 3. Test and simulated results for soft rock measured by CU triaxial test [38,39] or computed by FLAC: (a) Variation of friction angle φ, (b) Stress–strain behavior for diatomaceous soft rock, (c) Stress–strain behavior for mudstone, (d) Effective stress path for diatomaceous soft rock, (e) Effective stress path for mudstone.
Coatings 11 01019 g003
Figure 4. Determination of parameters for hump curve function.
Coatings 11 01019 g004
Figure 5. Finite difference meshes with boundary conditions used for analysis: (a) Strip or circular footing (symmetrical model), (b) Square footing (quarter model).
Coatings 11 01019 g005
Figure 6. Relationship between bearing capacity factors and vertical displacement: (a) Nc, (b) Nγ.
Coatings 11 01019 g006
Figure 7. Peak and residual values of bearing capacity factor of strip, circular and square footings vary with UST parameter b: (a) Nc, (b) Nγ.
Coatings 11 01019 g007
Figure 8. Efficiency factors of intermediate principal stress effect for bearing capacity of strip, circular and square footing: (a) Nc, (b) Nγ.
Coatings 11 01019 g008
Figure 9. Isolines of maximum shear strain rate of foundation beneath strip footing under ultimate state: (a) Nc, (b) Nγ.
Coatings 11 01019 g009
Table 1. Parameters and values for numerical analysis.
NameDensity ρ (kg/m3)Elastic Modulus E (MPa)Poisson’s Ratio νCohesion c (kPa)Peak Friction Angle (°)Residual Friction Angle (°)PHR
Diatomaceous soft rock21835000.254015.112.80.0210.040.0045
Mudstone20325000.251.28.06.80.0390.090.0079
Table 2. Peak and residual values of bearing capacity factor Nc yield by FLAC and UST.
GeometryStripCircularSquare
USTb = 0.0b = 0.25b = 0.5b = 0.75b = 1.0b = 0.75b = 1.0b = 0.5b = 0.75b = 1.0b = 0.0b = 0.25b = 0.5b = 0.75b = 1.0
Peak values10.2712.2714.2215.7717.2014.5614.8815.5716.6918.2813.6814.4515.4316.5518.05
Residual values8.7210.3011.9013.1014.1611.9412.4613.3214.1715.6011.3412.2113.1714.3115.65
Table 3. Peak and residual values of bearing capacity factor Nγ yield by FLAC and UST.
GeometryStripCircularSquare
USTb = 0.0b = 0.25b = 0.5b = 0.75b = 1.0b = 0.0b = 0.25b = 0.5b = 0.75b = 1.0b = 0.0b = 0.25b = 0.5b = 0.75b = 1.0
Peak values1.171.511.832.092.351.051.111.181.301.491.331.441.571.731.90
Residual values0.670.860.991.141.280.580.630.680.750.840.790.850.941.031.15
Publisher’s Note: MDPI stays neutral with regard to jurisdictional claims in published maps and institutional affiliations.

