Article

Encapsulation of Curcumin in Persian Gum Nanoparticles: An Assessment of Physicochemical, Sensory, and Nutritional Properties

1
Health Research Center, Lifestyle Institute, Baqiyatallah University of Medical Sciences, Tehran 1435916471, Iran
2
Department of Food Science and Nutrition, Faculty of Food Engineering, University of Campinas (UNICAMP), Campinas, São Paulo 13083-862, Brazil
3
Department of Food Technology Research, National Nutrition and Food Technology Research Institute, Faculty of Nutrition Sciences and Food Technology, Shahid Beheshti University of Medical Sciences, Tehran 981619573, Iran
4
Centro Tecnológico de la Carne de Galicia, Rúa Galicia No. 4, Parque Tecnológico de Galicia, San Cibrao das Viñas, 32900 Ourense, Spain
5
Área de Tecnología de los Alimentos, Facultad de Ciencias de Ourense, Universidad de Vigo, 32004 Ourense, Spain
*
Authors to whom correspondence should be addressed.
Coatings 2021, 11(7), 841; https://doi.org/10.3390/coatings11070841
Submission received: 10 June 2021 / Revised: 2 July 2021 / Accepted: 6 July 2021 / Published: 13 July 2021

Abstract

:
Curcumin is the hydrophobic yellow pigment in turmeric with considerable health-promoting effects. However, its low water solubility and stability limit its application. In the current study, curcumin within Persian gum (PG) nanoparticles at 0.5%, 1%, and 1.5% PG concentrations were encapsulated. The size of the nanoparticles was in the range of 326.0–397.4 nm. Based on the TEM images of curcumin-loaded nanoparticles, all samples had a spherical shape and existed in a particular form without aggregation. Encapsulation efficiency was in the range of 86.0–94.0%. Increasing PG concentration enhanced the encapsulation efficiency of curcumin. PG nanoparticles provided good protection on curcumin against light, hydrogen peroxide, and acidic pH. The lowest stability was related to free curcumin, and the highest was related to PG nanoparticles at 1.5% concentration. Curcumin-loaded nanoparticles at 1.5% concentration were added to kefir at 1%, 2%, and 3% concentrations. No significant differences were observed between acidity, pH, apparent viscosity, and consistency index of fortified and unfortified kefir samples. All kefir samples showed non-Newtonian behavior. Feeding rats with fortified kefir samples caused a lower level of low-density lipoprotein (LDL), total cholesterol (TC), and triglycerides (TG) compared to feeding with a standard diet.

1. Introduction

Polyphenols, as the secondary metabolites of some plants such as cereals, vegetables, and fruits have beneficial effects on human health [1]. Curcumin ((E, E)-1, 7-bis (4-hydroxy-3-methoxyphenyl)-1, 6-heptadiene-3, 5-ione) is a low molecular weight yellow pigment in the rhizome of turmeric [2]. It has two ferulic acids bound to carboxyl groups via methylene bridges [1]. Different advantages have been mentioned for curcumin, including anti-carcinogenic, anti-inflammatory, anticoagulant, antioxidant, anti-amyloid, and anti-bacterial effects. It is also used as a coloring and flavoring agent and a preservative compound [2,3]. Although curcumin has the potential to be used in functional foods, the application of this low-toxic compound has been limited due to its low stability and low water solubility (11 mg/L). Encapsulation has been used as an efficient way to overcome these limitations. Biopolymers capsules are good candidates for delivering low-water soluble materials [4]. Sahu, Kasoju and Bora [3] compared the anti-carcinogenic effect of free curcumin and curcumin encapsulated within bovine casein micelles and reported a lower IC50 value (14.85 and 12.69 μm for the encapsulated form. In another research study, loading curcumin into re-assembled casein micelles successfully increased its water solubility and anti-cancer effect against MCF-7 human breast cancer cells [2]. Encapsulation of curcumin by spry drying method using gum Arabic as the encapsulating compound was reported by Bucurescu et al. [5]. Controlled release and increased antioxidant activity were reported for curcumin after encapsulation within chitosan-gum Arabic particles [6]. Researchers also used gum acacia, almond gum, and liposome-guar gum as carriers for curcumin [7,8,9].
Persian gum (PG) or Farsi gum is an arabinogalactan exudate of the wild almond tree [10]. Persian gum along with other biopolymers such as whey protein isolate [11], chitosan [12], alginate [13], and maltodextrin [14] has been used for encapsulation of different bioactive compounds.
Kefir is a traditional milk fermented beverage. Fermentation is carried out by various bacteria and yeasts present in kefir grains. The products of the fermentation process, including lactic acid, acetic acid, ethanol, and carbon dioxide, cause unique taste and organoleptic properties in kefir. Due to containing easily digestible proteins, minerals, and vitamins, kefir is a health-promoting beverage. Moreover, kefir’s anti-bacterial, anti-fungal, and anti-tumor properties have been approved in some research [15]. Different sources of polyphenol compounds have been used to fortify kefir by researchers. Carullo et al. [16] used Sangiovese cv. pomace seed extract to fortify kefir and reported higher antioxidant capacity in fortified samples compared to the unfortified ones. Perna et al. [17] used rosemary essential oil and sulla honey to fortify donkey kefir. They declared that the antioxidant activity of both types of fortified kefir was higher than the unfortified one during the storage time. Pine bud syrup was added to kefir at different concentrations after fermentation as a rich source of polyphenol compound. It was observed that fat and protein contents and pH decreased after the syrup addition, while total solid content decreased. The fortified kefir with 10% pine bud syrup had the highest acceptability by panelists and showed improved consistency and textural properties [18].
There is no report of either using PG individually for encapsulation or enrichment of kefir with curcumin to the best of our knowledge. This study aimed to encapsulate curcumin within PG nanoparticles (at different concentrations of PG) to increase curcumin bioavailability. Particle size, microstructure, encapsulation efficiency, and stability of the loaded curcumin against extreme conditions were investigated. Then, the particles at the optimum PG concentrations were added to kefir at three levels to produce a functional product. Different parameters of the fortified samples, including pH, acidity, rheological properties, and sensory attributes, were examined. The effect of feeding rats with the fortified kefir samples on the serum biochemical parameters was also investigated.

2. Materials and Methods

Curcumin powder (purity ≥ 65%) was purchased from Sigma-Aldrich Co. (St. Louis, MO, USA). PG powder was kindly gifted by Dena Emulsion Co. (Shiraz, Iran). Other chemical substances used in this work were of analytical grades.

2.1. Preparation of Curcumin-Loaded PG Nanoparticles

PG powder was added to distilled water at 0.5%, 1%, and 1.5% (w/v) and stirred for 24 h at room temperature for complete hydration. Curcumin powder was dissolved in absolute ethanol and then added to the PG dispersions to reach 1% (w/v) concentration, and the final ethanol concentration reached 0.5%. The mixtures were vigorously shaken using Ultra Turax homogenizer (T 18 digital ULTRA-TURRAX®, IKA, Germany) at 7000 rpm for 7 min.

2.2. Particle Size Measurement

Dynamic light scattering (DLS, nanoparticle SZ-100, Horiba, Japan) was used to determine samples’ intensity-weighted average particle size at 25 °C. Samples (0.1 g) were diluted with distilled water (5 mL) before measurement and then poured into the DLS cell.

2.3. Morphology

The microstructures of curcumin-loaded nanoparticles were investigated using a transmittance electron microscope (TEM, CM-10, Philips, The Netherlands) at an accelerating voltage of 60 kV. One drop of nanoparticle dispersion was poured onto a copper grid coated with carbon and then quickly dried. Negative staining of the sample was carried out using uranyl acetate (3%). Samples were then examined by TEM in a cold box.

2.4. Encapsulation Efficiency (EE)

Encapsulation efficiency was measured based on the method described by Ghayour et al. [2]. Four milliliters of curcumin-loaded nanoparticle dispersion was poured into an Amicon filter with10 kDa MW cut off (Merck, Millipore, Ltd., Tullagreen, Ireland) and centrifuged at 4000× g for half an hour at ambient temperature. The permeate was mixed with absolute ethanol to reach a 1:1 water-ethanol ratio, and then absorbance was measured at 468 nm using a spectrophotometer (Agilent, Santa Clara, CA, USA). A standard curve was used to determine the concentration of free curcumin based on the measured absorbance value (to draw curcumin standard curve, different concentrations of curcumin in ethanol–water solution (1:1) were prepared, and their absorbance were measured at 468 nm). Encapsulation efficiency was calculated using the below equation:
%EE = (MiMf/Mi) × 100
where Mi is the initial curcumin mass in dispersion and Mf is the free curcumin mass in permeate.

2.5. Stability Measurement

The free curcumin and curcumin-loaded PG nanoparticles were exposed to extreme conditions for 5 days to determine the protective effect of PG nanoparticles on curcumin. For this purpose, dispersions were divided into three groups. The first group of samples was exposed to light radiation at 600 nm with a 40 cm distance. Samples in the second group were subjected to oxidative conditions by adding hydrogen peroxide 3%. The lactic acid was added to the samples in the third group until reaching pH 3 (this pH was chosen because it is close to the pH of kefir) to examine the effect of acidic conditions. Curcumin measurement was carried out after 5 days based on Mirpoor et al. [19] so that the dispersions were added to absolute ethanol at a 1:4 mixing ratio and centrifuged at 10,000× g for 30 min at room temperature. Then, distilled water was added to the supernatant containing curcumin until reaching a 1:1 water to ethanol ratio. The absorbance of samples was measured at 468 nm, and curcumin concentrations were obtained using the standard curve.

2.6. Kefir Production and Addition of Curcumin-Loaded PG Nanoparticles

Cow milk was pasteurized by heating at 80 °C for 30 min and then cooled to 32 °C (incubation temperature). Starter culture was added to milk at 1.5% (w/w) concentration and fermented for 24 h with stirring at 28 °C. When fermentation was completed, curcumin-loaded nanoparticles (at 1.5% PG concentration as the optimum concentration) were added to kefir samples at 1%, 2%, and 3% (w/w) concentrations and named as K-1, K-2, and K-3, respectively. Kefir samples without PG nanoparticles were chosen as the control sample. The kefir samples were kept at 4 °C until use.

2.7. Acidity and pH Measurements

Acidity (calculated as lactic acid) and pH of all kefir samples were measured one day after production based on AOAC International (2005) methods [20].

2.8. Rheological Measurement

K-1, K-2, and K-3 samples measured the viscosity of control using a rotational viscometer (DV1 Digital Viscometer, Brookfield, WI, USA) at 25 °C. Cylindrical LV4 spindle was used, and apparent viscosity was determined at 51 s−1 shear rate.

2.9. Sensory Evaluation

Thirty trained panelists evaluated sensory properties (flavor, color, and consistency) of control, K-1, K-2, and K-3 kefir samples. Each panelist tasted the four types of kefir samples and gave a numerical value between 1 to 5 for the mentioned sensory properties. In the end, they scored the overall acceptance of each product (1: dislike very much, 2: dislike, 3: moderate, 4: like, and 5: like very much).

2.10. Animal Feeding

Twenty 4-week-old male Wistar rats of CL grade (clean animal) and an average weight of 220 g were obtained from Pastor Institute (Iran). The animals were fed a commercial chow (Kangqiao Inc., Beijing, China; containing 59% nitrogen-free extract, 32% protein, 5% fat, 2% fiber, 1.8% Ca, and 1.2% P) over 7 days for adaptation. After that, they were divided into four groups (five rats within each group). The control group was fed with a standard diet, and the second, third, and fourth groups were fed with the standard diet + K-1 (1 g), K-2 (1 g), and K-3 (1 g), respectively. Each rat was kept in an individual metal cage at controlled temperature and humidity of 32 ± 2 °C and 55 ± 5%, respectively. The cycles of light and dark were 12 h. After 14 days of feeding, blood was obtained for analysis of biochemical parameters in serum.

2.11. Serum Biochemical Profile

The collected blood samples were centrifuged at 3500× g for 10 min at 4 °C to obtain serum. Measurements of serum total cholesterol (TC), high-density lipoprotein (HDL), low-density lipoprotein (LDL), triglyceride (TG), total cholesterol (TC), alanine transaminase (ALT), and aspartate transaminase (AST) levels were performed using SYNCHRON Systems (Beckman Coulter Inc., Fullerton, CA, USA).

2.12. Statistical Analysis

The data were reported as the mean of three replicates ± standard deviation. Data were analyzed by SAS software (version 9.1, SAS Institute Inc., Cary, NC, USA) using one-way analysis of variance (ANOVA) at a significance level of 5%. Duncan’s multiple range tests determined significant differences between the results.

3. Results and Discussions

3.1. Particle Size

Particle size affects different aspects of a colloidal system, including stability, rheology, bio-accessibility, and organoleptic properties. Table 1 shows the particle size of curcumin-loaded PG nanoparticles. The particle size for different concentrations of PG was in the range of 326.0–397.4 nm. There were no significant differences between the size of nanoparticles at 0.5% and 1% PG concentrations. However, increasing PG content to 1.5% concentration caused a decrease in particle size. Increasing PG concentration led to more intramolecular interactions between different parts of the PG chains, and therefore, a more compact and denser structure was created.
Similarly, Bucurescu, Blaga, Estevinho and Rocha [5] reported that increasing gum Arabic concentration from 10% to 15% decreased the particle size of curcumin-loaded gum Arabic particles (considering the number distribution) from 0.272 to 0.186 μm. Ghayour, Hosseini, Eskandari, Esteghlal, Nekoei, Gahruie, Tatar and Naghibalhossaini [2] used three different concentrations (0.05%, 0.5%, and 1%) of casein micelles for re-assembling and curcumin encapsulating and reported the most considerable particle size at the lowest concentration. They explained that 0.05% concentration was below the critical micelle concentration.

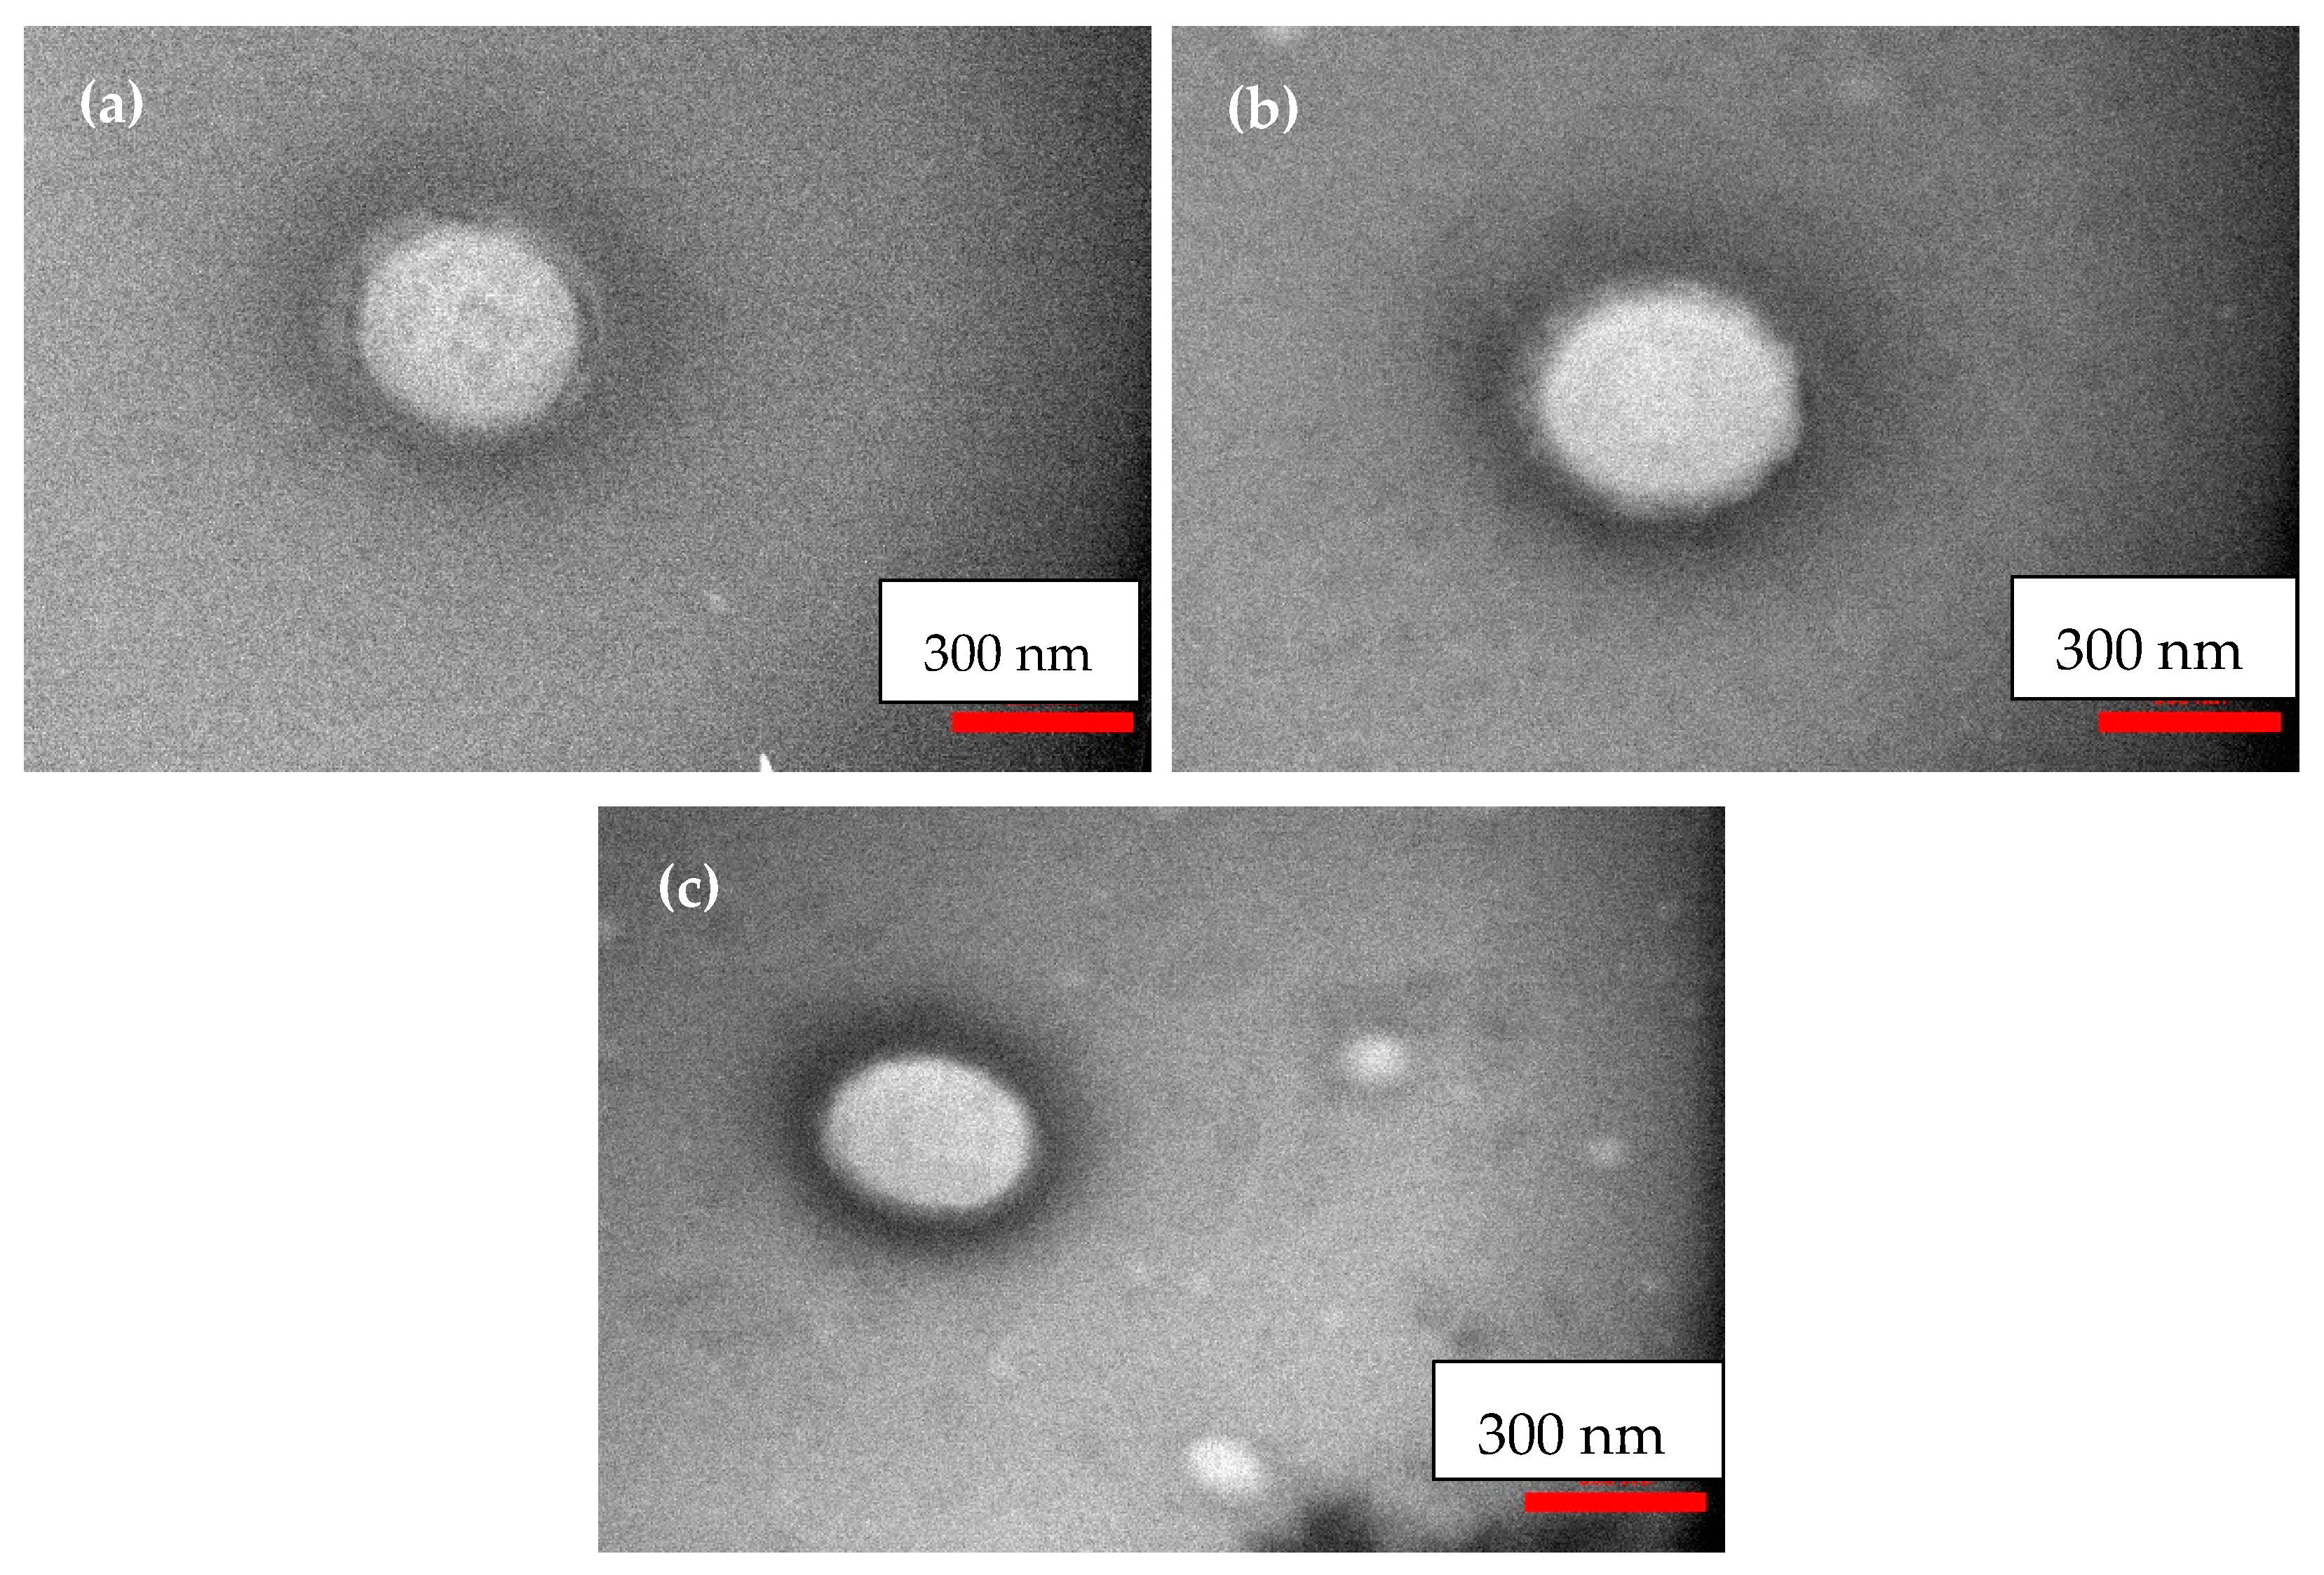
3.2. TEM Micrographs

The TEM micrographs of curcumin-loaded PG nanoparticles at 0.5%, 1%, and 1.5% PG concentrations are presented in Figure 1a–c, respectively. As can be seen, all particles have a spherical shape. Additionally, it can be observed that the particles are separated from each other, and aggregation did not occur. PG has a negative charge, and so, there was a repulsive force between particles. Based on these TEM images, the size of all nanoparticles was in the range of 300–400 nm, which confirms the DLS data.

3.3. Encapsulation Efficiency

The tendency of a ligand to interact with the carrier, the carrier structure, and environmental conditions are factors affecting encapsulation efficiency [21]. Based on Table 1, considerable encapsulation efficiency was observed for all samples, which shows efficient binding between curcumin and PG. At higher concentrations of PG (1% and 1.5%), the encapsulation efficiency increased from 86.0% to 93.0% and 94.0%, respectively. Therefore, increasing the carrier concentration led to more effective entrapment of curcumin. The high encapsulation efficiency of curcumin could result from hydrogen bonding between the carboxyl groups of the hydrocolloid and the hydroxyl groups present in curcumin. Hydrophobic interactions between the aromatic rings of curcumin and hydrophobic regions of PG may also play a role in binding between these two compounds [22].
Similarly, Abreu et al. [23] used chitosan/cashew gum nanogels to encapsulate essential oil and showed that increasing cashew gum concentration increased the encapsulation efficiency. High encapsulation efficiency was reported for curcumin within casein nanoparticles (more than 99%) and re-assembled casein micelles (97.34%) [2]. The small differences between the values of encapsulation efficiency in our work compared to that in the last mentioned one can be attributed to the lower amount of hydrophobic portions in PG than protein, resulting in less hydrophobic interactions between curcumin and the encapsulating material.

3.4. Stability

In addition to low water solubility, the sensitivity of curcumin to different parameters such as heat, pH, ionic strength, radiation, and oxygen can limit its bioavailability [24]. The stability of free curcumin and curcumin loaded in PG particles at 0.5%, 1%, and 1.5% concentrations were investigated against light, hydrogen peroxide, and pH3, and the results are shown in Table 2. In all cases, free curcumin showed the minimum stability (59.0% against light, 22.0% against hydrogen peroxide, and 57.0% at pH3), which means that the PG shell could provide good protection curcumin against environmental condition and destructive agents. Increasing PG concentration led to a better protection effect on curcumin so that the maximum stability was observed at 1.5% concentration (93.0% against light, 89.0% against H2O2, and 92.0% in acidic condition). As mentioned before, at higher PG concentrations, particles with more compact structures were produced. The compactness could limit the diffusion of destructive agents and reduce the effect of environmental factors, imposing a more substantial protective effect on curcumin. In another work, curcumin’s photo-stability and thermal stability were investigated before and after loading in algae. The results showed 2.5-fold higher stability after encapsulation [25]. Liang, Zhou, He, An, Lin, Li, Liu, Chen and Li [24] reported that curcumin stability against UV radiation for 2 h, heating at 60 °C for 30 min, and heating at 80 °C for 60 min was increased 2.5-fold, 3.5-fold, and 2.7-fold, respectively after encapsulation within zein-quaternized chitosan nanoparticles. Enhanced thermal stability [2] and storage stability [6] were also reported for curcumin after encapsulation.

3.5. Acidity and pH of Kefir

Lactic acid is one of the leading products of fermentation. Measuring acidity and pH in acidic fermented products indicates fermentation activity and production of acids. The values of titrable acidity and pH in fermented kefir samples depend on different parameters such as storage time, type of microorganisms in the starter culture, the amount of kefir grains inoculate that were added, and the chemical composition of milk [26,27,28]. Table 3 shows the acidity and pH values of control kefir samples and kefir samples fortified with 1%, 2%, and 3% curcumin-loaded PG nanoparticles (1.5% PG concentration), named K-1 K-2, and K-3, respectively. The acidity of all samples was in the range of 72–79%, and their pH values were around 4. It can be seen that there were no significant differences (p ≤ 0.05) between the acidity and pH of different samples. Although PG is a carbohydrate, it is an unsatisfactory carbon source for the growth of the fermenting microorganisms, so the added particles remain intact. The pH values of kefir samples prepared with two types of honey were 3.78 and 4.52, as reported by Doğan [29]. In another study by Ismaiel, Ghaly, and El-Naggar, 2011, the effect of different carbon sources including glucose, fructose, sucrose, lactose, cellulose, carboxymethyl cellulose, and starch was investigated on the titrable acidity of fermented kefir. It was shown that the kefir starters could not use the added starch, carboxymethyl cellulose, and cellulose as carbon sources, while lactose was the most effective carbon source, which resulted in the highest titrable acidity. This result, which was in agreement with our result, confirmed that microorganisms prefer simple monosaccharides and sugars rather than polysaccharides as carbon sources. Montanuci et al. [30] studied the effect of inulin addition on pH and titrable acidity of kefir. They observed no significant differences between the two mentioned parameters in samples with and without inulin.

3.6. Viscosity

The power-law model (Equation (2)) was used to fit the rheological data in this study.
μ = K γ(n − 1)
where μ shows the viscosity of sample (Pa·s), K shows the consistency index (Pa·sn), γ shows the rotational speed (s−1), and n shows the flow behavior index or power-law index. In acidic dairy products, including kefir, the fat globules and casein micelles interact via van der Waals and electrostatic interactions during fermentation and production of acid and form a layer. This layer of clusters and aggregates can undergo disruption during preparation steps such as homogenizing. However, during storage, the layer can be reformed as the pH of the acidic product is close to the isoelectric point of casein [29]. Based on Table 3, the apparent viscosity and consistency index of control and fortified kefir samples at 51 s−1 shear rates were in the range of 1.91–1.97 Pa·s and 0.062–0.071 Pa·sn, respectively. No significant differences (p ≤ 0.05) were observed between the results. Viscosity is affected by several factors such as solids concentration, particle size, and conformation. Linear structures have a more predominant effect on viscosity than globular or spherical structures. The three levels of nanoparticle concentrations added to kefir samples were not high enough to affect viscosity. The spherical conformation of the particles (Figure 1) is another reason for the ineffective role of PG nanoparticles on viscosity. Table 3 also shows that the value of the power-law index was below 1 for all samples, which indicated the non-Newtonian behavior of kefir samples. Non-Newtonian behavior of kefir and other fermented milk beverages was also reported by other researchers [29,31].

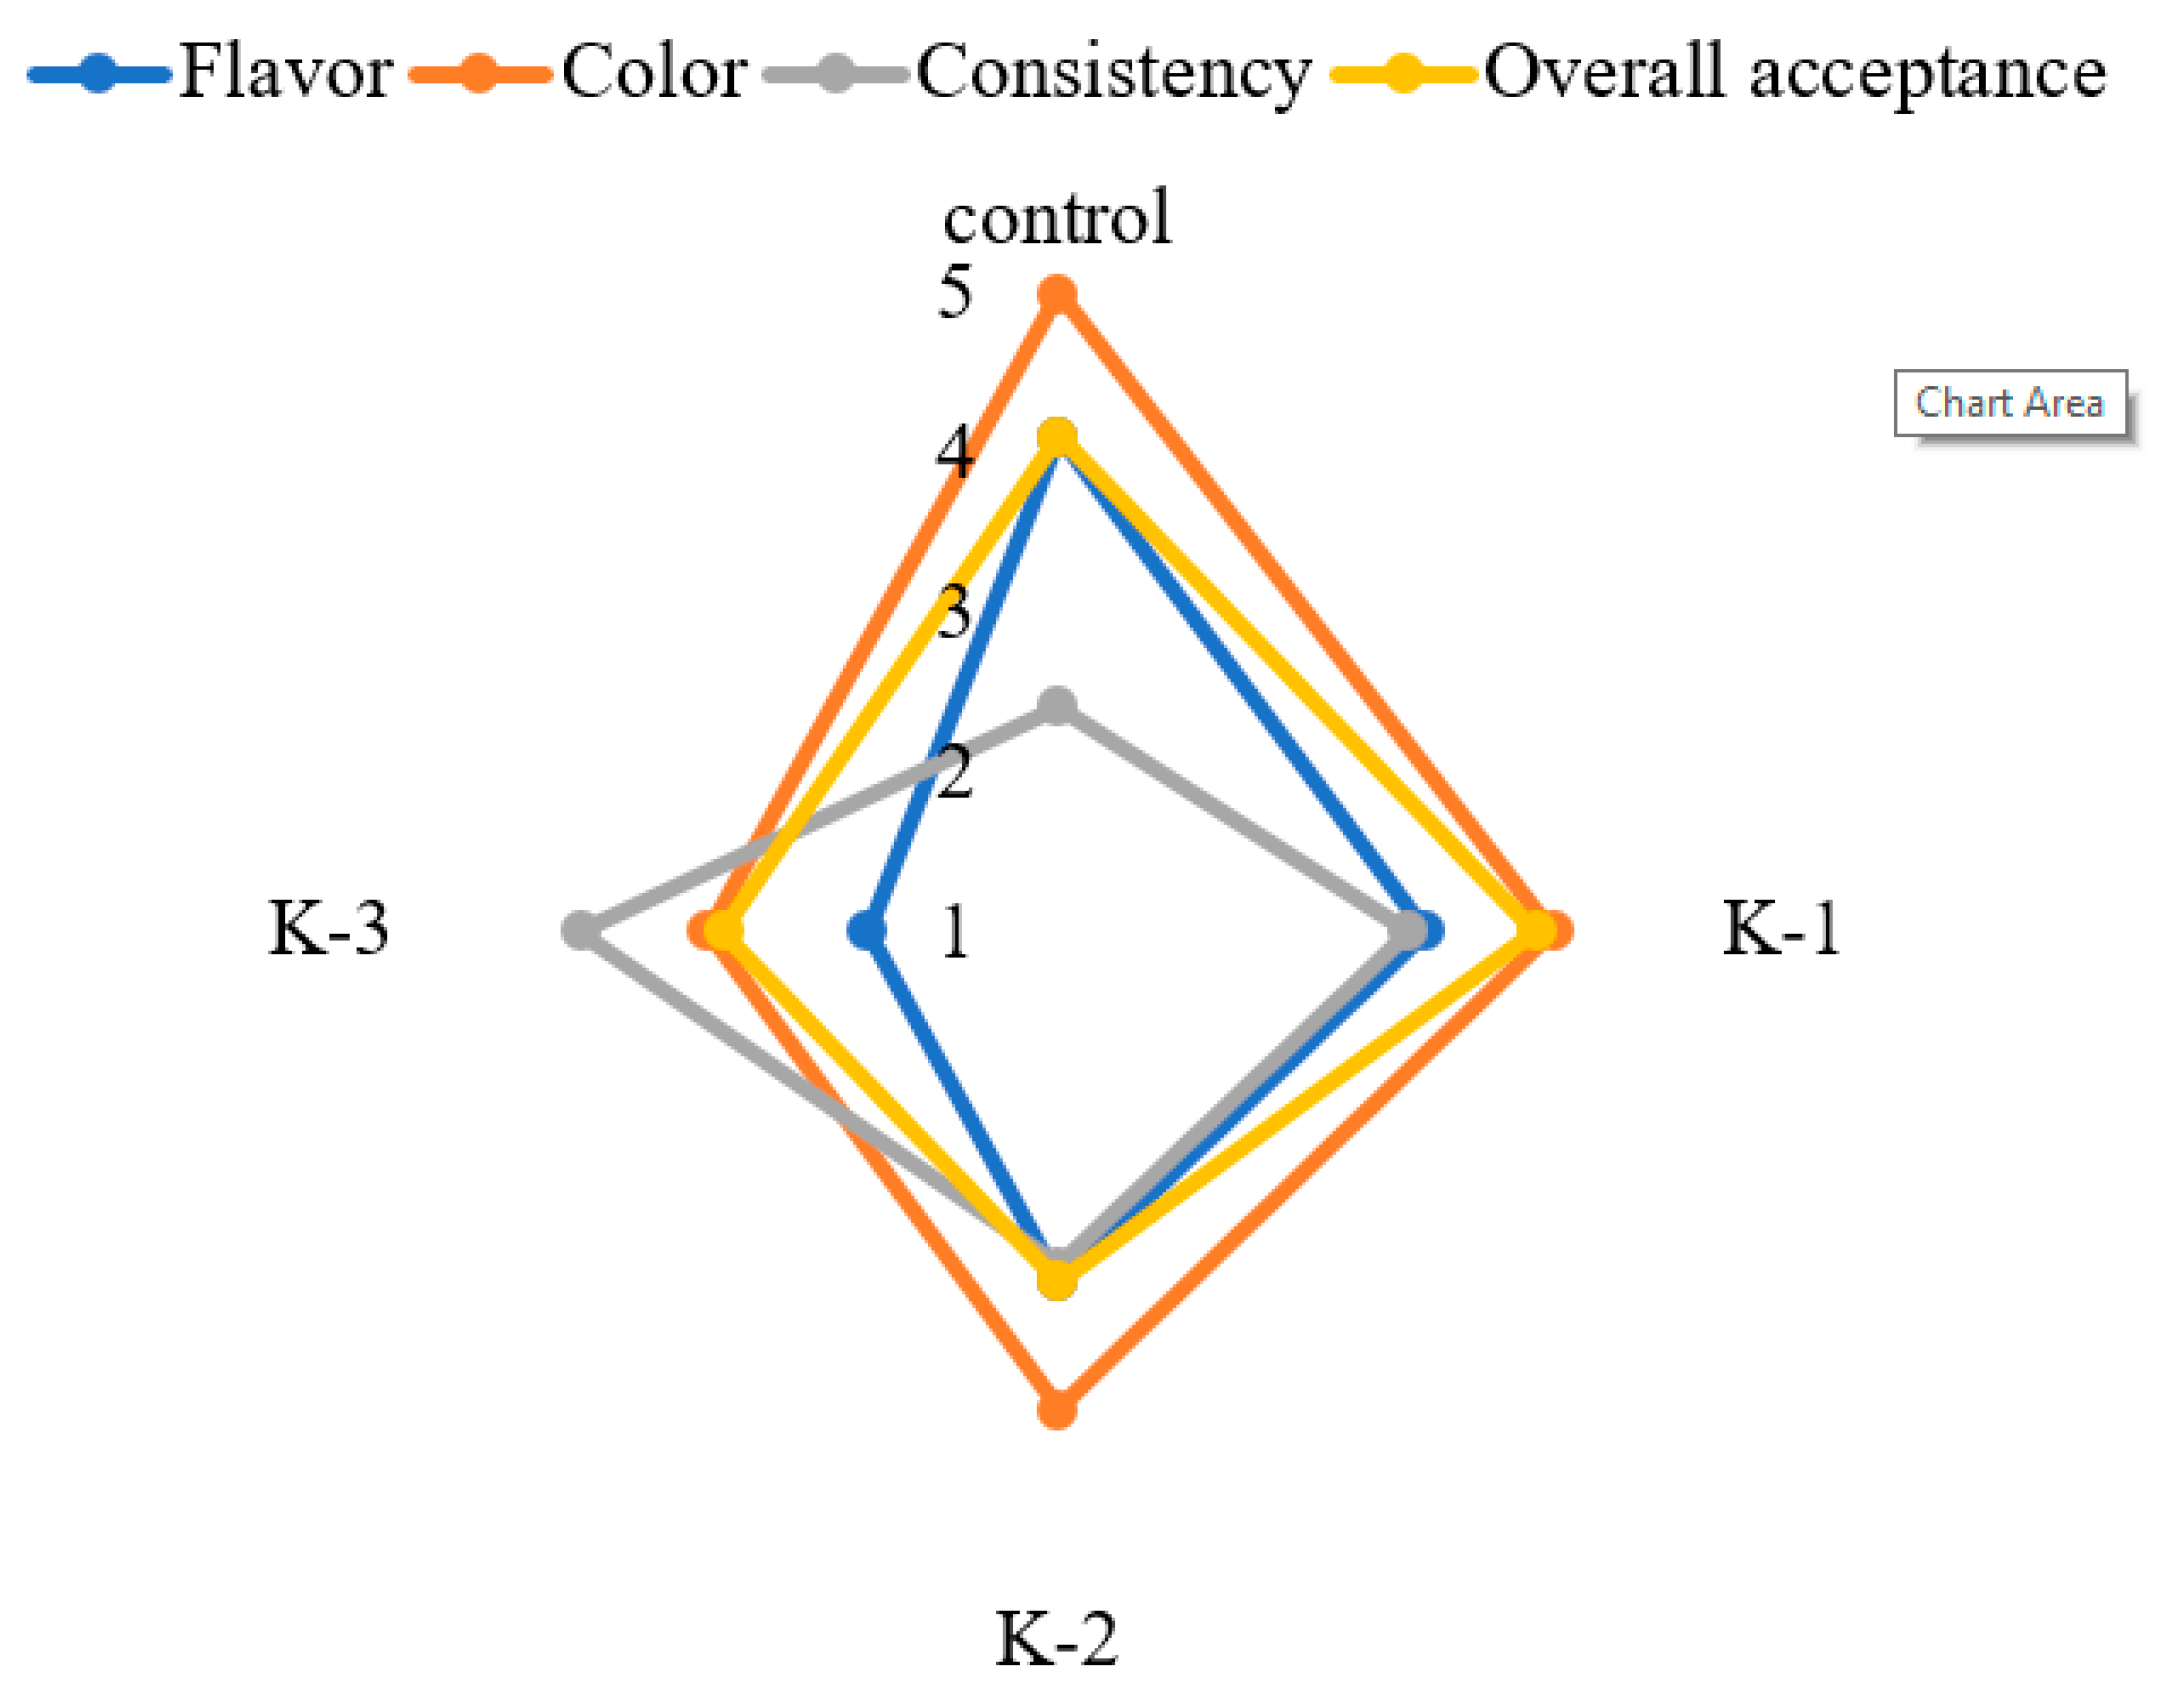
3.7. Sensory Evaluation

The results of evaluated sensory properties, including flavor, color, consistency, and overall acceptance of control and K-1, K-2, and K-3 kefir samples, are shown in Figure 2. The control sample obtained the highest score (4.1) for flavor, and the K-3 sample obtained the lowest (2.1), which means that by increasing the amount of curcumin-loaded PG nanoparticles, flavor acceptance decreased. The color scores were 5, 3, 4.1, and 3.2 for control, K-1, K-2, and K-3 samples, respectively. The lower color scores for the samples containing nanoparticles compared to the control one may be attributed to the light-yellow color of curcumin due to the habit of panelists for kefir with white color. The addition of nanoparticles increased the consistency of kefir beverages while the lowest consistency score was obtained by control (2.4), and the highest was related to K-1 and K-4 (4) mainly due to the role of PG as a hydrocolloid in the water take up and swelling of nanoparticles. The overall acceptance of control and K-1 samples (score 4) was higher than K-2 and K-3 samples (score 3). Tratnik et al. [32] reported that skimmed milk powder, whey protein concentrate, and inulin as supplements did not improve the consistency of fermented kefirs as revealed during sensory evaluation. Irigoyen, Arana, Castiella, Torre and Ibanez [27] reported that panelists such as kefir with a strong milky taste and odor have more specific viscosity and consistency. In another work, sensory evaluation of kefir samples revealed that the best time to consume kefir samples kept at the refrigerator was up to three days after production.

3.8. Serum Biochemical Parameters

The results of biochemical parameters of serum of the rats fed with a standard diet (control) and kefir samples containing different concentrations (1%, 2%, and 3%) of curcumin-loaded PG nanoparticles are presented in Table 4. The amount of TC was higher in the rats fed with a control diet (184.66 mg/dL) than the rats fed with K-1, K-2, and K-3 (168.47, 171.28, 175.62 mg/dL, respectively). The amount of HDL was lower in rats fed with a control diet (43.74 mg/dL) than in the rats fed with K-2 (47.61 mg/dL). There were no significant differences in HDL levels between other treatments. By increasing the curcumin-loaded PG nanoparticles concentration, the amount of LDL and TG decreased significantly (p ≤ 0.05). Transportation of different substances in the blood such as minerals, vitamins, and hormones as well as maintenance of the balance of osmotic pressure in the blood are carried out by proteins. High-density lipoprotein and low-density lipoprotein are the primary cholesterol transporters, and these two lipoproteins carry 40–44% of serum proteins. High levels of cholesterol and triglycerides for a long time are related to atherosclerosis and cardiovascular diseases [33]. As observed, the reduction in LDL was accompanied by a reduction in total cholesterol. The lower amount of cholesterol after feeding with K-1, K-2, and K-3 showed that curcumin could limit the cholesterol absorption in the small intestines. Lower levels of serum cholesterol and TG after long-term treatment with curcumin in mice were also reported by Shin, Ha, McGregor and Choi [33]. They suggested that the obtained results could be related to curcumin’s ability to change the nuclear receptors that are transcriptional regulators for cholesterol and TG metabolism genes.
In another study, the lowering effect of curcumin on the cholesterol level from LDL fraction in rats was reported [34]. Measuring AST and ALT shows the physiological status and their levels in the serum are related to liver damages [35]. Feeding with fortified kefirs (at any concentration of nanoparticles) compared to feeding with a standard diet did not affect ALT level in the serum of the rats, and this parameter was similar in all the rats. These results indicated that PG and curcumin did not impose liver damages in rats. AST level was lower in rats fed with K-2 and sample K-3 than those fed by K-1 and control, which shows the positive effect of curcumin at higher concentrations on the health status of the rats. In another study, a reduction in ALT and AST levels in the serum of rats was reported after feeding with curcumin [35]. Panahi et al. [36] showed decreased ALT and AST levels at the end of the trial compared to pre-trial levels. Additionally, increases in the functionality of bioactive components by encapsulation methods have been reported previously [37,38,39].

4. Conclusions

Curcumin was successfully encapsulated in PG nanoparticles with significant encapsulation efficiency. DLS data indicated that the particle size was in the nanometer range. At the highest concentration of PG, nanoparticles showed the smallest size due to compaction. TEM images showed that the nanoparticles were spherical, and aggregation did not occur between them due to repulsion. The PG shell provided good protection on curcumin against light, hydrogen peroxide, and acidic conditions. The addition of PG nanoparticles to kefir beverages did not change the samples’ viscosity, acidity, and pH compared to the control kefir. Feeding rats with standard diet and kefir samples containing different concentrations of curcumin-loaded PG nanoparticles showed reduced LDL, TG, and TC levels in the serum of rats fed with fortified kefir samples, which confirmed the health-promoting effect of fortified kefir samples. Sensory evaluation of samples indicated that an increase in the concentration of nanoparticles in kefir decreased overall acceptance.

Author Contributions

Conceptualization, A.E. and K.P.; methodology, A.E.; software, K.P.; formal analysis, A.E.; investigation, A.E.; resources, K.P.; data curation, A.E. and K.P.; writing—original draft preparation, A.E., K.P. and Z.H.; writing—review and editing, K.P. and A.M.K.; Additionally, J.M.L.; supervision, A.M.K. All authors have read and agreed to the published version of the manuscript.

Funding

This research did not receive any specific grant from funding agencies in the public, commercial, or not-for-profit sectors.

Institutional Review Board Statement

The IRB approval code of this research is IR.BMSU.REC.1398.314.

Informed Consent Statement

Not applicable.

Data Availability Statement

No new data were created or analyzed in this study. Data sharing is not applicable to this article.

Conflicts of Interest

The authors declare no conflict of interest.

References

  1. Yazdi, S.R.; Corredig, M. Heating of milk alters the binding of curcumin to casein micelles. A fluorescence spectroscopy study. Food Chem. 2012, 132, 1143–1149. [Google Scholar] [CrossRef]
  2. Ghayour, N.; Hosseini, S.M.H.; Eskandari, M.H.; Esteghlal, S.; Nekoei, A.-R.; Gahruie, H.H.; Tatar, M.; Naghibalhossaini, F. Nanoencapsulation of quercetin and curcumin in casein-based delivery systems. Food Hydrocoll. 2019, 87, 394–403. [Google Scholar] [CrossRef]
  3. Sahu, A.; Kasoju, N.; Bora, U. Fluorescence study of the curcumin− casein micelle complexation and its application as a drug nanocarrier to cancer cells. Biomacromolecules 2008, 9, 2905–2912. [Google Scholar] [CrossRef]
  4. Bernardy, N.; Romio, A.P.; Barcelos, E.I.; Pizzol, C.D.; Dora, C.L.; Lemos-Senna, E.; Araujo, P.H.; Sayer, C. Nanoencapsulation of quercetin via miniemulsion polymerization. J. Biomed. Nanotechnol. 2010, 6, 181–186. [Google Scholar] [CrossRef]
  5. Bucurescu, A.; Blaga, A.C.; Estevinho, B.N.; Rocha, F. Microencapsulation of curcumin by a spray-drying technique using gum arabic as encapsulating agent and release studies. Food Bioprocess Technol. 2018, 11, 1795–1806. [Google Scholar] [CrossRef]
  6. Tan, C.; Xie, J.; Zhang, X.; Cai, J.; Xia, S. Polysaccharide-based nanoparticles by chitosan and gum arabic polyelectrolyte complexation as carriers for curcumin. Food Hydrocoll. 2016, 57, 236–245. [Google Scholar] [CrossRef]
  7. Pal, K.; Roy, S.; Parida, P.K.; Dutta, A.; Bardhan, S.; Das, S.; Jana, K.; Karmakar, P. Folic acid conjugated curcumin loaded biopolymeric gum acacia microsphere for triple negative breast cancer therapy in invitro and invivo model. Mater. Sci. Eng. C 2019, 95, 204–216. [Google Scholar] [CrossRef]
  8. Rezaei, A.; Nasirpour, A. Encapsulation of curcumin using electrospun almond gum nanofibers: Fabrication and characterization. Int. J. Food Prop. 2018, 21, 1608–1618. [Google Scholar] [CrossRef] [Green Version]
  9. Pu, C.; Tang, W.; Li, X.; Li, M.; Sun, Q. Stability enhancement efficiency of surface decoration on curcumin-loaded liposomes: Comparison of guar gum and its cationic counterpart. Food Hydrocoll. 2019, 87, 29–37. [Google Scholar] [CrossRef]
  10. Dehghani, P.; Hosseini, S.M.H.; Golmakani, M.-T.; Majdinasab, M.; Esteghlal, S. Shelf-life extension of refrigerated rainbow trout fillets using total farsi gum-based coatings containing clove and thyme essential oils emulsions. Food Hydrocoll. 2018, 77, 677–688. [Google Scholar] [CrossRef]
  11. Bassijeh, A.; Ansari, S.; Hosseini, S.M.H. Astaxanthin encapsulation in multilayer emulsions stabilized by complex coacervates of whey protein isolate and persian gum and its use as a natural colorant in a model beverage. Food Res. Int. 2020, 137, 109689. [Google Scholar] [CrossRef]
  12. Raeisi, S.; Ojagh, S.M.; Quek, S.Y.; Pourashouri, P.; Salaün, F. Nano-encapsulation of fish oil and garlic essential oil by a novel composition of wall material: Persian gum-chitosan. LWT 2019, 116, 108494. [Google Scholar] [CrossRef]
  13. Nami, Y.; Lornezhad, G.; Kiani, A.; Abdullah, N.; Haghshenas, B. Alginate-persian gum-prebiotics microencapsulation impacts on the survival rate of lactococcus lactis abriinw-n19 in orange juice. LWT 2020, 124, 109190. [Google Scholar] [CrossRef]
  14. Noghabi, M.S.; Molaveisi, M. Microencapsulation of persian gum as a novel wall material for the fast-release of cinnamon essential oil in the simulated saliva medium: Characterization of microcapsules and modeling the kinetics of release. Bioact. Carbohydr. Diet. Fibre 2020, 100250. [Google Scholar] [CrossRef]
  15. Otles, S.; Cagindi, O.E. Kefir: A probiotic dairy-composition, nutritional and therapeutic aspects. Pak. J. Nutr. 2003, 2, 54–59. [Google Scholar]
  16. Carullo, G.; Governa, P.; Spizzirri, U.G.; Biagi, M.; Sciubba, F.; Giorgi, G.; Loizzo, M.R.; Di Cocco, M.E.; Aiello, F.; Restuccia, D. Sangiovese cv pomace seeds extract-fortified kefir exerts anti-inflammatory activity in an in vitro model of intestinal epithelium using caco-2 cells. Antioxidants 2020, 9, 54. [Google Scholar] [CrossRef] [PubMed] [Green Version]
  17. Perna, A.; Simonetti, A.; Gambacorta, E. Phenolic content and antioxidant activity of donkey milk kefir fortified with sulla honey and rosemary essential oil during refrigerated storage. Int. J. Dairy Technol. 2019, 72, 74–81. [Google Scholar] [CrossRef] [Green Version]
  18. Semeniuc, C.A.; Rotar, A.; Stan, L.; Pop, C.R.; Socaci, S.; Mireşan, V.; Muste, S. Characterization of pine bud syrup and its effect on physicochemical and sensory properties of kefir. CyTA J. Food 2016, 14, 213–218. [Google Scholar] [CrossRef] [Green Version]
  19. Mirpoor, S.F.; Hosseini, S.M.H.; Yousefi, G.H. Mixed biopolymer nanocomplexes conferred physicochemical stability and sustained release behavior to introduced curcumin. Food Hydrocoll. 2017, 71, 216–224. [Google Scholar] [CrossRef]
  20. AOAC International. Official Methods of Analysis of AOAC International; AOAC International: Gaithersburg, MD, USA, 2005. [Google Scholar]
  21. Gahruie, H.H.; Eskandari, M.H.; Khalesi, M.; Van der Meeren, P.; Hosseini, S.M.H. Rheological and interfacial properties of basil seed gum modified with octenyl succinic anhydride. Food Hydrocoll. 2020, 101, 105489. [Google Scholar] [CrossRef]
  22. Hofmann, T.; Glabasnia, A.; Schwarz, B.; Wisman, K.N.; Gangwer, K.A.; Hagerman, A.E. Protein binding and astringent taste of a polymeric procyanidin, 1, 2, 3, 4, 6-penta-o-galloyl-β-d-glucopyranose, castalagin, and grandinin. J. Agric. Food Chem. 2006, 54, 9503–9509. [Google Scholar] [CrossRef] [PubMed] [Green Version]
  23. Abreu, F.O.; Oliveira, E.F.; Paula, H.C.; de Paula, R.C. Chitosan/cashew gum nanogels for essential oil encapsulation. Carbohydr. Polym. 2012, 89, 1277–1282. [Google Scholar] [CrossRef] [Green Version]
  24. Liang, H.; Zhou, B.; He, L.; An, Y.; Lin, L.; Li, Y.; Liu, S.; Chen, Y.; Li, B. Fabrication of zein/quaternized chitosan nanoparticles for the encapsulation and protection of curcumin. RSC Adv. 2015, 5, 13891–13900. [Google Scholar] [CrossRef]
  25. Jafari, Y.; Sabahi, H.; Rahaie, M. Stability and loading properties of curcumin encapsulated in chlorella vulgaris. Food Chem. 2016, 211, 700–706. [Google Scholar] [CrossRef] [PubMed]
  26. Öner, Z.; Karahan, A.G.; Çakmakçı, M.L. Effects of different milk types and starter cultures on kefir. Gida 2010, 35, 177–182. [Google Scholar]
  27. Irigoyen, A.; Arana, I.; Castiella, M.; Torre, P.; Ibanez, F. Microbiological, physicochemical, and sensory characteristics of kefir during storage. Food Chem. 2005, 90, 613–620. [Google Scholar] [CrossRef]
  28. Demirci, A.S.; Palabiyik, I.; Ozalp, S.; Tirpanci Sivri, G. Effect of using kefir in the formulation of traditional tarhana. Food Sci. Technol. 2019, 39, 358–364. [Google Scholar] [CrossRef] [Green Version]
  29. Doğan, M. Rheological behaviour and physicochemical properties of kefir with honey. J. Verbrauch. Lebensm. 2011, 6, 327–332. [Google Scholar] [CrossRef]
  30. Montanuci, F.D.; Pimentel, T.C.; Garcia, S.; Prudencio, S.H. Effect of starter culture and inulin addition on microbial viability, texture, and chemical characteristics of whole or skim milk kefir. Food Sci. Technol. 2012, 32, 580–865. [Google Scholar] [CrossRef] [Green Version]
  31. Köksoy, A.; Kılıç, M. Effects of water and salt level on rheological properties of ayran, a turkish yoghurt drink. Int. Dairy J. 2003, 13, 835–839. [Google Scholar] [CrossRef]
  32. Tratnik, L.; BOŽANIĆ, R.; Herceg, Z.; Drgalić, I. The quality of plain and supplemented kefir from goat’s and cow’s milk. Int. J. Dairy Technol. 2006, 59, 40–46. [Google Scholar] [CrossRef]
  33. Shin, S.K.; Ha, T.Y.; McGregor, R.A.; Choi, M.S. Long-term curcumin administration protects against atherosclerosis via hepatic regulation of lipoprotein cholesterol metabolism. Mol. Nutr. Food Res. 2011, 55, 1829–1840. [Google Scholar] [CrossRef]
  34. Babu, P.S.; Srinivasan, K. Hypolipidemic action of curcumin, the active principle of turmeric (curcuma longa) in streptozotocin induced diabetic rats. Mol. Cell. Biochem. 1997, 166, 169–175. [Google Scholar] [CrossRef] [PubMed]
  35. Huang, W.-C.; Chiu, W.-C.; Chuang, H.-L.; Tang, D.-W.; Lee, Z.-M.; Wei, L.; Chen, F.-A.; Huang, C.-C. Effect of curcumin supplementation on physiological fatigue and physical performance in mice. Nutrients 2015, 7, 905–921. [Google Scholar] [CrossRef] [PubMed] [Green Version]
  36. Panahi, Y.; Kianpour, P.; Mohtashami, R.; Jafari, R.; Simental-Mendía, L.E.; Sahebkar, A. Efficacy and safety of phytosomal curcumin in non-alcoholic fatty liver disease: A randomized controlled trial. Drug Res. 2017, 67, 244–251. [Google Scholar] [CrossRef] [Green Version]
  37. Tong, S.; Hao, H.; Li, X.; Li, H.; Liao, Z.; Wu, Z.; Chen, H. Safety evaluation on defatted soybean particles after nanofabrication. Qual. Assur. Saf. Crops Foods 2020, 12, 87–101. [Google Scholar] [CrossRef]
  38. Del Carlo, M.; Fusella, G.C.; Pepe, A.; Sergi, M.; Di Martino, M.; Mascini, M.; Martino, G.; Cichelli, A.; Di Natale, C.; Compagnone, D. Novel oligopeptides based e-nose for food quality control: Application to extra-virgin olive samples. Qual. Assur. Saf. Crops Foods 2014, 6, 309–317. [Google Scholar] [CrossRef]
  39. Onat, S.; Savaş, E. Immobilization and characterization of glucosidase from gemlik olive (Olea europea L.) responsible for hydrolization of oleuropein. Ital. J. Food Sci. 2019, 31, 749–763. [Google Scholar]
Figure 1. TEM images of curcumin-loaded PG nanoparticles at 0.5% (a), 1% (b), and 1.5% (c) PG concentrations.
Coatings 11 00841 g001
Figure 2. Sensory evaluation of unfortified kefir (control) and kefir samples fortified with 1% (K-1), 2% (K-2), and 3% (K-3) curcumin-loaded PG nanoparticles.
Coatings 11 00841 g002
Table 1. Particle size and encapsulation efficiency (EE) of curcumin in curcumin-loaded PG nanoparticles at PG concentrations of 0.5% (PG-0.5), 1% (PG-1), and 1.5% (PG-1.5).
SampleSize (nm)EE (%)
PG-0.5397.4 ± 25.11 A86 ± 5.61 B
PG-1389.1 ± 11.42 A93 ± 3.42 A
PG1.5326 ± 24.15 B94 ± 4.55 A
Different capital letters in each column indicate significant differences (p ≤ 0.05).
Table 2. Stability of free curcumin (control) and loaded curcumin in PG nanoparticle at PG concentrations of 0.5% (PG-0.5), 1% (PG-1), and 1.5% (PG-1.5) against light, hydrogen peroxide (H2O2), and acidic pH (pH3).
SampleLightH2O2pH 3
Control59 ± 3.21 C22 ± 1.26 D57 ± 1.56 C
PG-0.582 ± 2.12 B64 ± 2.36 C82 ± 3.51 B
PG-191 ± 1.75 A76 ± 2.76 B87 ± 2.41 A
PG-1.593 ± 2.25 A89 ± 3.65 A92 ± 2.76 A
Different capital letters in each column indicate significant differences (p ≤ 0.05).
Table 3. Acidity, pH, and viscosity parameters of unfortified kefir (control) and kefir samples fortified with 1% (K-1), 2% (K-2), and 3% (K-3) curcumin-loaded PG nanoparticles.
SampleAcidity pHApparent
Viscosity
Consistency CoefficientPower Law
Index
Control76 ± 2.83 A4.05 ± 0.18 A1.91 ± 0.05 A0.062 ± 0.005 A0.044
K-174 ± 3.65 A4.01 ± 0.11 A1.92 ± 0.03 A0.065 ± 0.003 A0.045
K-279 ± 4.11 A3.99 ± 0.12 A1.94 ± 0.01 A0.069 ± 0.001 A0.044
K-372 ± 3.46 A4.02 ± 0.08 A1.97 ± 0.02 A0.071 ± 0.002 A0.046
Different capital letters in each column indicate significant differences (p ≤ 0.05).
Table 4. Effect of diet type including standard diet (control), and standard diet + kefir fortified with curcumin-loaded PG nanoparticles at 1% (K-1), 2% (K-2), and 3% (K-3) concentrations on serum biochemical parameters.
SampleTC (mg/dL)HDL (mg/dL)LDL (mg/dL)TG (mg/dL)ALT(U/L)AST(U/L)
Control184.66 ± 4.82 A43.74 ± 1.76 B120.55 ± 3.11 A48.52 ± 2.52 A31.96 ± 4.16 A94.12 ± 2.34 A
K-1175.62 ± 3.24 B45.34 ± 3.56 AB114.26 ± 2.64 AB46.28 ± 2.49 AB28.72 ± 3.28 A91.65 ± 1.76 A
K-2171.28 ± 4.11 B47.61 ± 2.74 A110.18 ± 4.29 BC42.19 ± 3.23 BC30.41 ± 4.63 A84.25 ± 2.11 B
K-3168.47 ± 3.19 B44.52 ± 2.85 AB107.59 ± 3.75 C41.43 ± 3.95 C28.25 ± 2.96 A82.39 ± 3.15 B
Different capital letters in each column indicate significant differences (p ≤ 0.05).
Publisher’s Note: MDPI stays neutral with regard to jurisdictional claims in published maps and institutional affiliations.

