1. Introduction
The main aim of the present work was to investigate the effect of a water-based coating on chestnut wood (
Castanea sativa Mill.), both normal and thermally treated, in order to evaluate the surface properties in relation to heat treatments and coating application. The chestnut tree (
Castanea sativa Mill.) is widespread throughout the Mediterranean region and has an important economic significance both for fruit and timber. Chestnut wood is widely used in Central Italy for the construction of doors and windows, not only in modern buildings but also in historical palaces and churches. In fact, extractives, which are typical of this wood, give it a pleasant colour and natural durability with regard to biotic agents [
1,
2,
3,
4,
5]. Chestnut wood is considered of medium density and moderate in shrinkage; it has good mechanical performance [
6], as evidenced by the fact that it was used as a structural element in the past [
7]. Chestnut workability is easy, but it is difficult to dry [
8] due to the large heartwood showing tylosis occluding the large vessels of the earlywood. It is worth noting that chestnut wood, which grows in Central Italy, has few sapwood rings, and in larger diameter trees, a large extent of the sapwood area can be removed during processing [
9]. Generally, chestnut forests are managed as coppices [
10], with a rotation that depends on the fertility of the site. Poles are obtained from the sprouts, timber from the standards.
Heat treatment is one of the latest alternative methods of wood protection without the use of biocides. For this reason, it is considered an environmentally friendly process [
11]. Durability is improved by the alteration of hemicelluloses, the relative increase in crystalline cellulose, and the modification of lignin [
12,
13]. Heat treatment reduces the moisture content balance of the wood cell wall, improving dimensional stability. It is also a method of improving the colour of wood, making the colour darker by increasing the treatment temperature [
4]. Thermally modified wood shows homogeneity throughout the thickness of the assortments and additional manufacturing does not compromise the colour of the surface [
14]. Darker colour is also aesthetically appreciated by customers [
15]. Chestnut wood, especially if exposed to weathering, can change in colour and surface characteristics, as occurs for external doors and windows. For this reason, surface protection is essential to prevent damage and excessive colour modification [
3,
16]. In this context, wood modified by thermal treatment seems to be an interesting product for outdoor use due to better dimensional stability and durability, which prolong its service life [
17].
Although studies on heat-treated chestnut wood are still very few compared to other species, the following evidence can be drawn. On mechanical features, namely, compression strength parallel to grain, bending strength, and modulus of elasticity (MOE) in bending, heat treatment provokes a decrease related to the increase in temperature and duration of the process; the hardness shows an increase at the lower temperature and then a decrease [
18]. The effect of heat treatment on chestnut wood’s physical properties results in positive changes, such as reduced shrinkage and swelling, lower equilibrium moisture content, enhanced weather resistance, a decorative darker colour connected to the time and temperature of the heat treatment, and better decay resistance [
18,
19]. Lo Monaco et al. [
4] found that Brinell hardness slightly increased about 5–6% with temperature up to 170 °C, decreasing about 10% with 200 °C treatment, and that the micro density showed a similar trend. These effects on physical and mechanical characteristics have an explanation in the chemical modification that affects both the cell wall components and the extractives. In addition, Ateş et al. [
18] noted that the holocellulose content decreases and lignin increases with rising temperature, while the crystallinity indexes do not change up to 230 °C. Lo Monaco et al. [
4] found that heat treatment causes an increase in the contact angle and consequently the hydrophobicity of the surface, probably due to the degradation of hemicellulose and the reorganisation of amorphous cellulose; they also observed that with treatment at higher temperatures the surface is less hydrophobic, probably due to the macroscopic characteristics of the surface rather than for chemical reasons.
These considerations are important when a coating needs to be selected. The use of wood for outdoor furniture, windows, doors, cladding, façades, terrace floors, and garden furniture often has an aesthetic value as well as a functional one; therefore, even thermally modified wood can demonstrate better performance with an appropriate coating application.
Thermal modification at different temperatures induces changes on the surface properties of wood, which could make coating practice different from that used for untreated wood. In fact, heat-treated wood may be more hydrophobic, certainly adsorbing water more slowly, assuring enhanced dimensional stability and showing darker colour [
15]. The final performance can be conditioned by both the coating and the features of thermally modified wood [
20]. Kesik et al. [
21] found that the adhesion strength of water-based wood varnishes decreased with rising temperature and the duration of heat treatment on chestnut wood.
Starting from this general overview, in this paper, a new water-based protective was tested on chestnut wood, both untreated and thermally treated, by colour measurements, hardness measurements, roughness, contact angle measurements, wearing test and Hyperspectral Imaging (HSI), this last as a non-invasive and highly informative methodology able to study the entire wood surface in the visible and short-wave infrared regions of the electromagnetic spectrum [
22,
23,
24,
25]. HSI, if combined with chemometrics and multivariate analysis, was demonstrated to be a powerful method to evaluate surface variations and to predict possible changes due to ageing and/or treatments [
23,
25]. Diffuse reflectance HSI is a technique enabling the capture of hundreds of images in contiguous narrow spectral bands, typically in the visible (Vis, 400–750 nm) and the near-infrared (NIR, 750–2500 nm) regions [
26]. Specifically, near-infrared diffuse reflectance imaging spectroscopy (1000 to 2500 nm) is particularly useful to identify organic materials, such as those of wood and coating components, being the detected spectra strictly linked to the sample surface chemical characteristics [
24,
25].
2. Materials and Methods
2.1. Specimen Preparation and Coating Application
Twenty four chestnut flat specimens (10 cm length, 5 cm width and 2 cm thickness) were obtained from a quarter sawn board of chestnut in the heartwood. After cutting, the specimens were stored in darkness in a conditioned room at 65% relative humidity and a temperature of 22 °C to reach 12% moisture content. The radial surface was used for the measurements. The specimens’ density had an average value of 0.720 ± 0.017 g/cm2. Four series, each consisting of six specimens, were considered, one intended as control. The other three were heat-treated at 140 °C, 170 °C and 200 °C, for 6 h in a laboratory oven controlled to within ± 2 °C under atmospheric pressure.
To obtain regular surfaces and to satisfy the requirements for subsequent coating application, chestnut specimens were sanded with 120 grit size sandpaper. For each set, three specimens remained uncoated and the other three were coated.
The selected new water-based coating was supplied by Geal srl (Pistoia, Italy) with the commercial name of Idrolinfo. In the technical data sheet, Idrolinfo was declared to be a product free from volatile organic compounds (VOCs), made of an oleoresin in aqueous micro-emulsion based on hard waxes, resins and drying oils. The supplier declares that Idrolinfo guarantees the respect of green building rules, being natural, reversible and transpiring. The characteristics of the coating product are: pH (at 20 °C) 7, density (at 20 °C) 1.074 kg/l, homogeneous milky appearance. By following the indications available in the technical data sheet, Idrolinfo was applied in two coats with a brush by respecting a time interval of 3 h between the two coat applications.
2.2. Colour Measurements
Colour was measured through X-Rite CA22 reflectance spectrophotometer according to the CIELAB colour system [
27]. The characteristics of the colour measuring instrument were the following: light source D65; standard observer 10°; fixed geometry of measurement 45°/0°; spectral range 400–700 nm; spectral resolution 10 nm; aperture size 4 mm.
This parameter was measured before and after the application of the coating in order to evaluate the changes in chromatic coordinates and lightness induced by surface treatment. For each specimen, forty-five measure points were chosen due to the high colour variation in the wood surface, as previously discussed [
28]. In each point, three measurements were performed to have 135 values of L*, a* and b* coordinates for each specimen. Then, the average values and standard deviations were calculated. Data are reported as L*, a* and b* values and total colour variation expressed by ΔE*, which represents the geometric distance of two points in the L*a*b* colour space.
2.3. Roughness Measurements
Roughness measurements were performed by a Taylor-Hobson TalySurf CLI 2000 apparatus, according to the standards [
29,
30].
The detailed procedure for measurements was previously described [
4]. In particular, the following data were obtained: average roughness R
a and ISO10 point height R
z, which represent a measure of the amplitude parameters of the roughness profile; spacing R
Sm, i.e., a measure of the characteristic wavelength of the roughness profile; the hybrid parameters slope R
Δq, R
Sk and R
Ku, which account for the average slope of the roughness profile and for its distribution and symmetry around the centre line. Three-dimensional morphological maps (8 × 8 mm) were also stored, using a resolution of 3 μm.
2.4. Contact Angle Measurement
Contact angle was measured in order to obtain the characteristics of wettability of the untreated and coating-treated chestnut surface. The method of direct observation was used, and the angle in the liquid phase, generated by the tangent to demineralised water drop profile and the wood solid surface, was measured by observing the drop (2 µL) through a FireWire camera with telecentric optics and 55 mm focus length. This allowed for making the measurements separately on earlywood and latewood. The measurements were taken for 120 s because the contact angle varies during the time after drop application. Three replications for each specimen were performed. The software OneAttension directly elaborated the visual data supplying the values of contact angles every 0.72 s.
2.5. Vickers Hardness and Wearing Tests
Micro-hardness, friction coefficient and wear volume were measured on uncoated and coated specimens separately for early- and latewood. The measurements were performed by observing the wood surface and positioning the micro-indenter on earlywood or latewood.
Specifically, depth-sensing micro-indentation (Micro-Combi, CSM Instruments, Peseaux, Switzerland) was used to perform instrumented micro-hardness measurements. Standard micro-hardness test (micro-Vickers indenter) was performed on the substrate by applying a load of 15 N.
Wearing tests were performed with a standard tribometer (Tribometer, C.S.M. Instruments, Peseaux, Switzerland) operating at 25 °C and relative humidity 40%. The ball tip was made of 100Cr6 and the track formed had a length of 6 mm, with a speed equal to 8 cm/min. The applied force has been taken equal to 7 N and the wear length, the distance travelled entirely by the linear tribometer, was equal to 100 m.
2.6. Hyperspectral Imaging Acquisition and Spectral Analysis
2.6.1. Instrumentation and Acquisition
Hyperspectral Imaging (HSI) was performed in the short-wave infrared (SWIR) region of the electromagnetic spectrum (1000–2500 nm). The acquisitions were performed utilising the SISUChema XLTM (Specim, Finland) device, equipped with a 31 mm lens allowing the acquisition of surfaces with a resolution of 300 micron/pixel. The spectral resolution was 6.3 nm. Illumination was obtained by SPECIM’s diffuse line illumination unit. Images were acquired through scanning each investigated specimen line by line. The device is delivered with spectral calibration. Image data are automatically calibrated to reflectance by measuring an internal standard reference target before each specimen scan.
The image correction was thus performed adopting the following equation:
where I is the corrected hyperspectral image, I
0 is the original hyperspectral image, B is the black reference image (~0 reflectance) and W is the white reference image (~0.99 reflectance).
2.6.2. Data Treatment and Statistical Analysis
Spectral data (i.e., hypercube) analysis was carried out adopting chemometric, utilising the PLS Toolbox (Eigenvector Research, Inc., Manson, WA, USA) running inside MATLAB (The Mathworks, Inc., Natick, MA, USA). More in detail, the spectra pre-processing was performed as follows: the raw spectra were preliminary cut at the beginning and the end of the investigated wavelength range, to eliminate unwanted effects due to lighting/background noise [
25]. Principal Component Analysis (PCA) [
31] for exploratory data analysis, Partial Least Square-Discriminant Analysis (PLS-DA) [
32] to build classification models, and Hierarchical Modelling (HM) were applied [
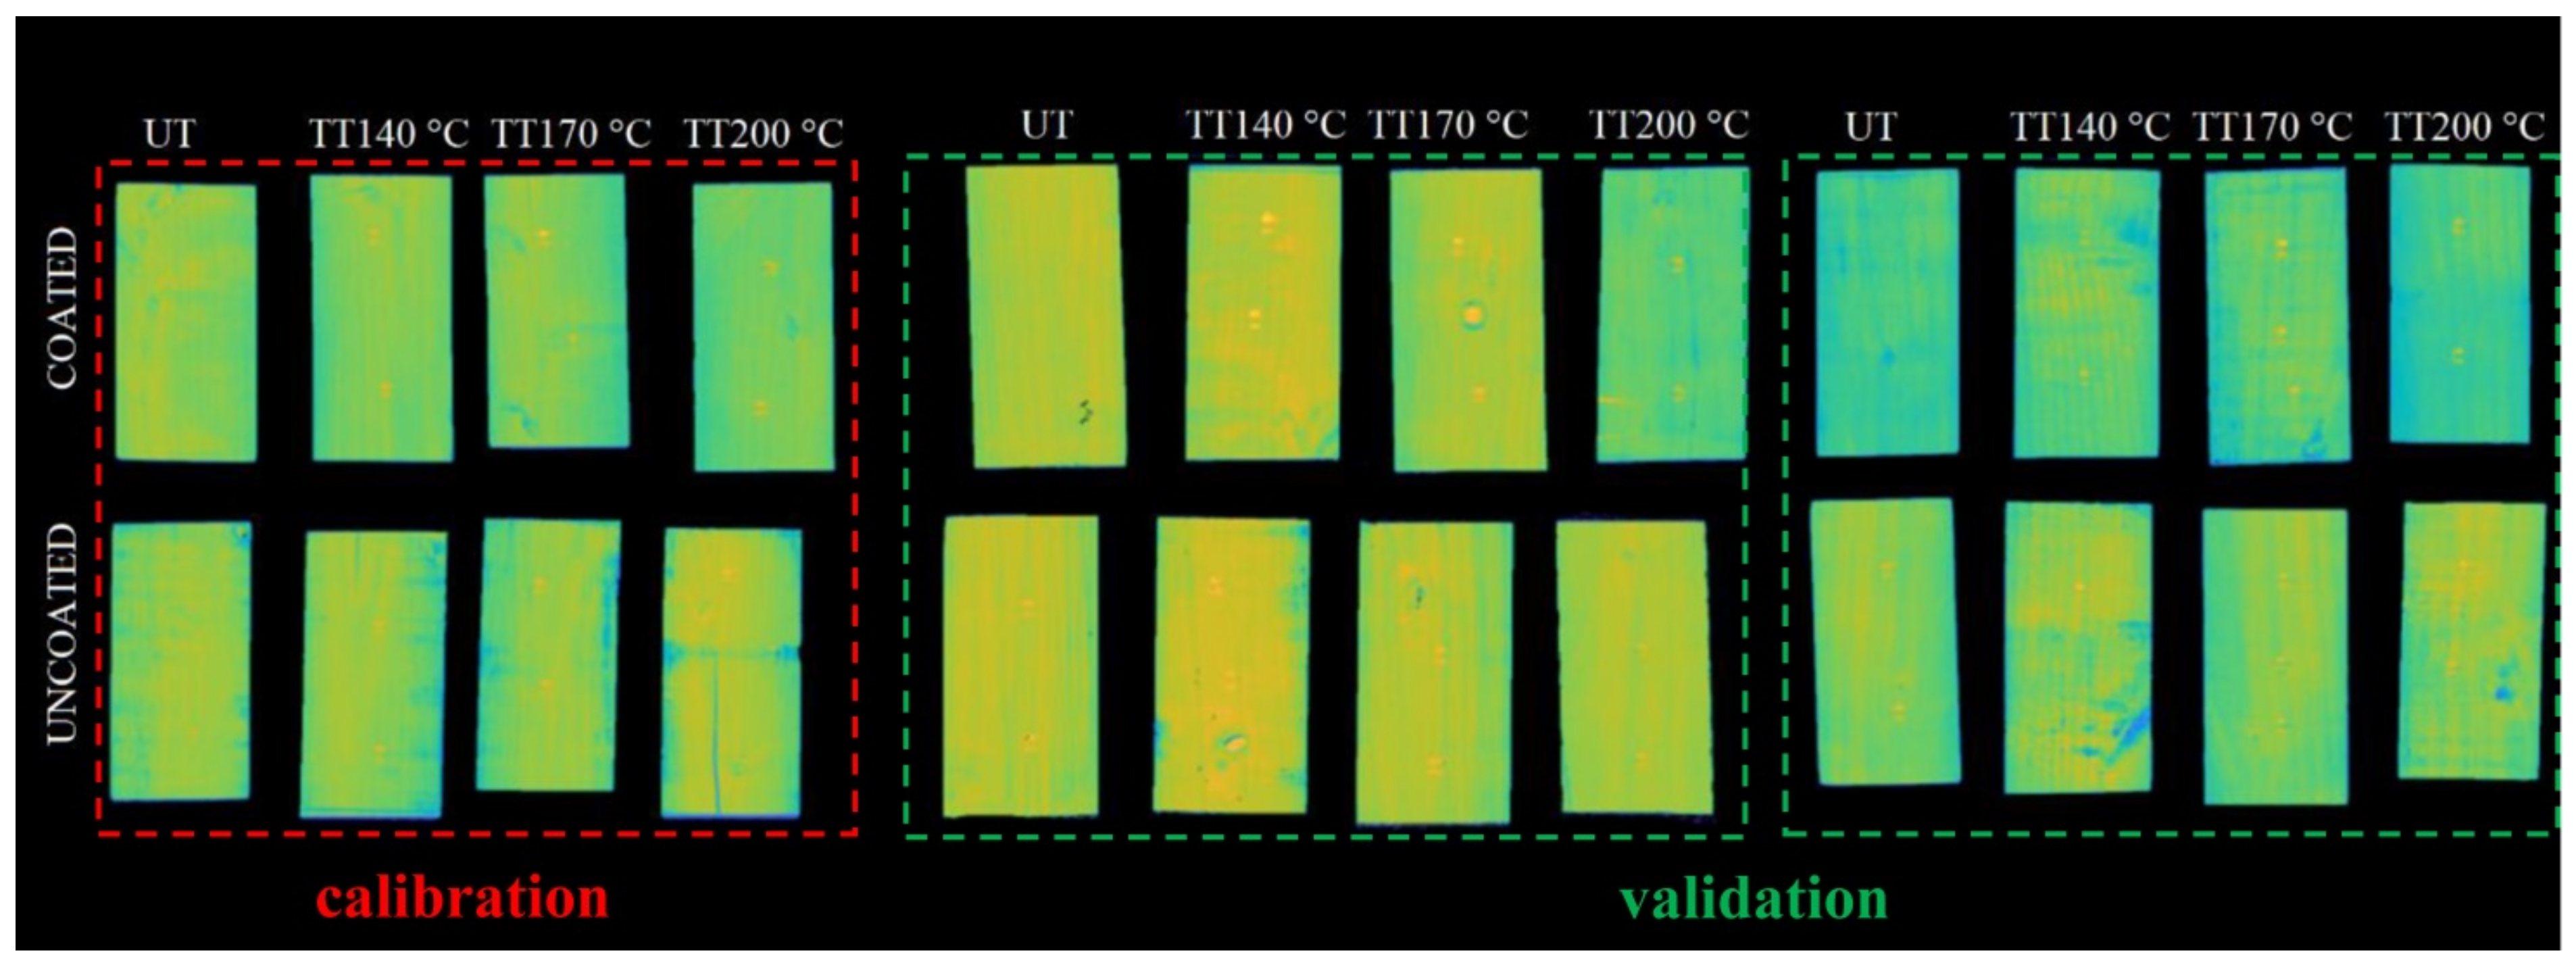
33]. PCA is a useful method capable of providing an overview of complex multivariate data. It was used to decompose the “processed” spectral data into several Principal Components (PCs) (linear combinations of the original spectral data), embedding the spectral variations of each collected spectral dataset. According to this approach, a reduced set of factors is produced. Such a set can be used for discrimination since it provides an accurate description of the entire dataset. The first few PCs are generally used to analyse the common features among specimens and their grouping: in fact, specimens characterised by similar spectral signatures tend to aggregate in the score plot of the first two or three components. For a first data variability exploration, the pre-processing Probabilistic Quotient Normalisation (PQN), Detrend, and Mean Centre (MC) were chosen. Subsequently, the PLS-DA models were created. PLS-DA is a linear classification method combining the properties of PLS regression with the discrimination power of a classification technique. PLS-DA is based on the PLS regression algorithm (PLS1 when dealing with one dependent Y variable and PLS2 in the presence of several dependent Y variables), which searches for latent variables with a maximum covariance with the Y-variables. The main advantage of PLS-DA is that the relevant sources of data variability are modelled by the so-called Latent Variables (LVs), which are a linear combination of the original variables, and, consequently, it allows graphical visualisation and understanding of the different data patterns and relations by LV scores and loadings. Loadings are the coefficients of variables in the linear combinations, which determine the LVs, and therefore they can be interpreted as the influence of each variable on each LV, while scores represent the coordinates of specimens in the LV projection hyperspace. The calibration and validation datasets (
Figure 1) consist of one specimen for each coated and uncoated heat treatment (i.e., with Idrolinfo coating and uncoated untreated and thermally treated at 140 °C, 170 °C, and 200 °C).
Seven PLS-DA models have been created to perform discriminations:
- Rule 1:
TT 200 °C coated + TT 170 °C coated + TT 140 °C coated + UT coated from TT 200 °C uncoated + TT 170 °C uncoated + TT 140 °C uncoated + UT uncoated;
- Rule 2:
TT 200 °C coated from TT 170 °C coated + TT 140 °C coated + UT coated;
- Rule 3:
TT 200 °C uncoated from TT 170 °C uncoated + TT 140 °C uncoated + UT uncoated;
- Rule 4:
TT 170 °C coated from + TT 140 °C coated + UT coated;
- Rule 5:
TT 170 °C uncoated + TT 140 °C uncoated from UT uncoated;
- Rule 6:
TT 140 °C uncoated from UT uncoated;
- Rule 7:
TT 170 °C coated from TT 140 °C uncoated.
Venetian Blinds (VB) was used as a cross-validation method for assessing the optimal complexity of each model and choosing the number of Latent Variables (LVs).
Classification models were then evaluated using the following parameters: Sensitivity and Specificity in calibration (Cal) and cross-validated (CV) and prediction (PRED):
where TP is the true positive and FN the false negative. The best models are reckoned when similar values are obtained for Sensitivity and Specificity in Cal, CV, and PRED, thus demonstrating the soundness of the developed model.
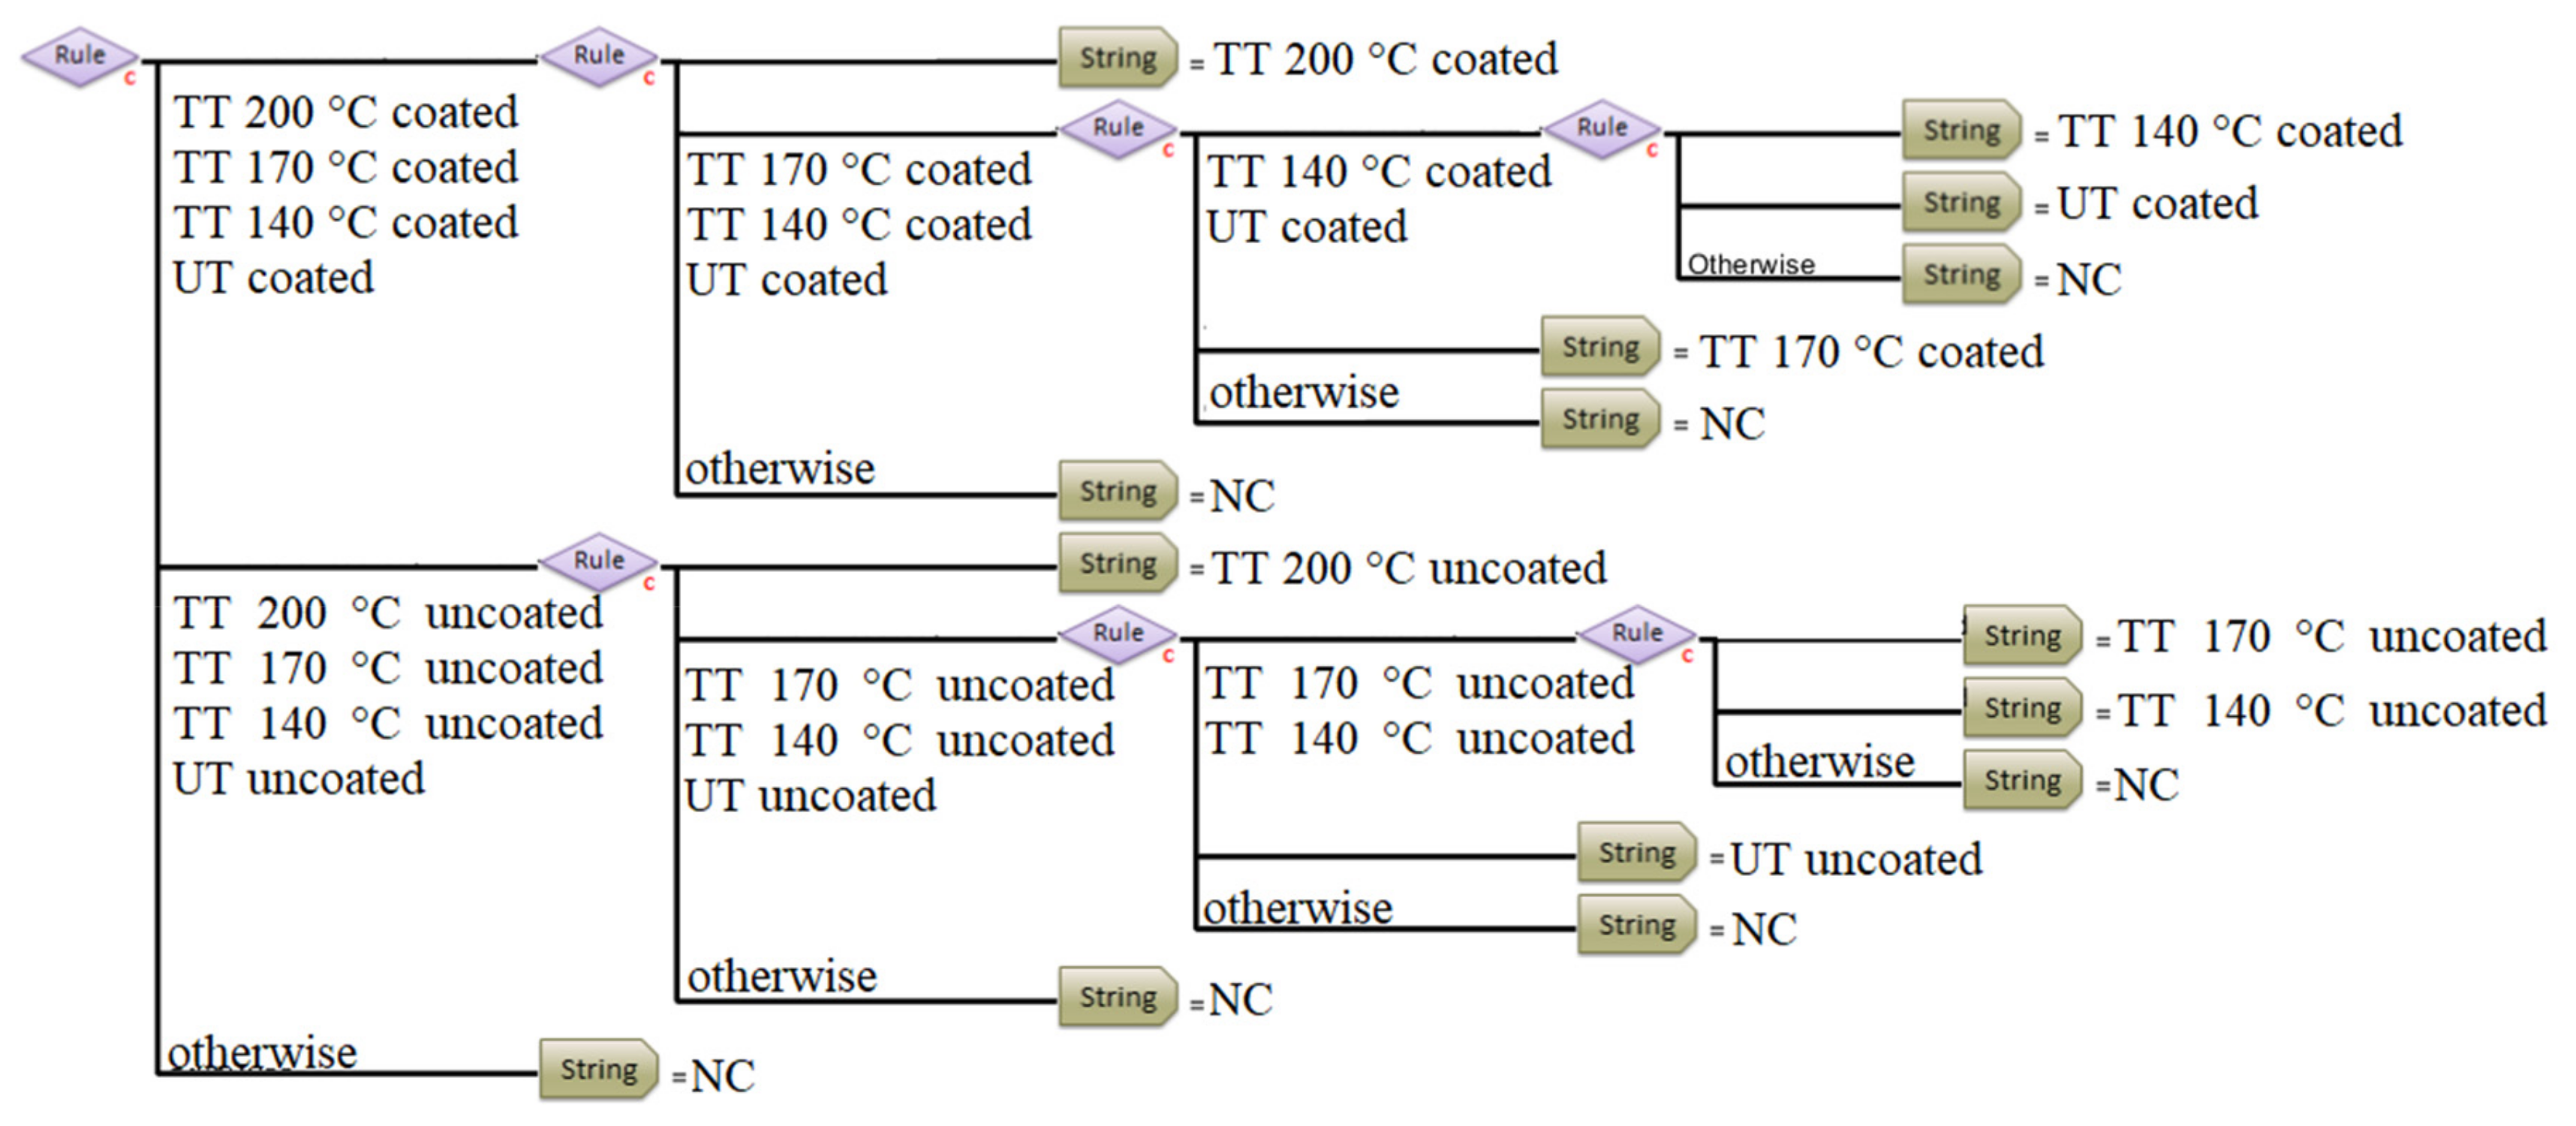
The PLS-DA models created to discriminate the different classes were subsequently hierarchised. Adopting a hierarchical model, objects are preliminarily divided into subsets and are then subdivided into further subsets, until each subset contains a single object. During each step, the most different object to the others is selected and isolated, and a comparison is carried out based on a new PLS-DA classification model, for each object. The results are shown through a dendrogram, allowing for the performance of highly informative visual analysis on the similarities existing among the objects [
34]. The dendrogram, developed for the classification of wood specimens, is reported in
Figure 2.
The adopted and applied pre-processing strategies are summarised in
Table 1. Different pre-processing strategies (i.e., scatter correction methods and spectral derivatives) were selected for each defined rule of the hierarchical classification model to optimise specimen heat treatment recognition and the presence of Idrolinfo coating.
3. Results and Discussion
3.1. Colour Measurements
Wood colour is one of the most relevant properties to be considered when its surface needs to be treated with coatings and protective products [
35,
36,
37], with special regards to cultural heritage objects [
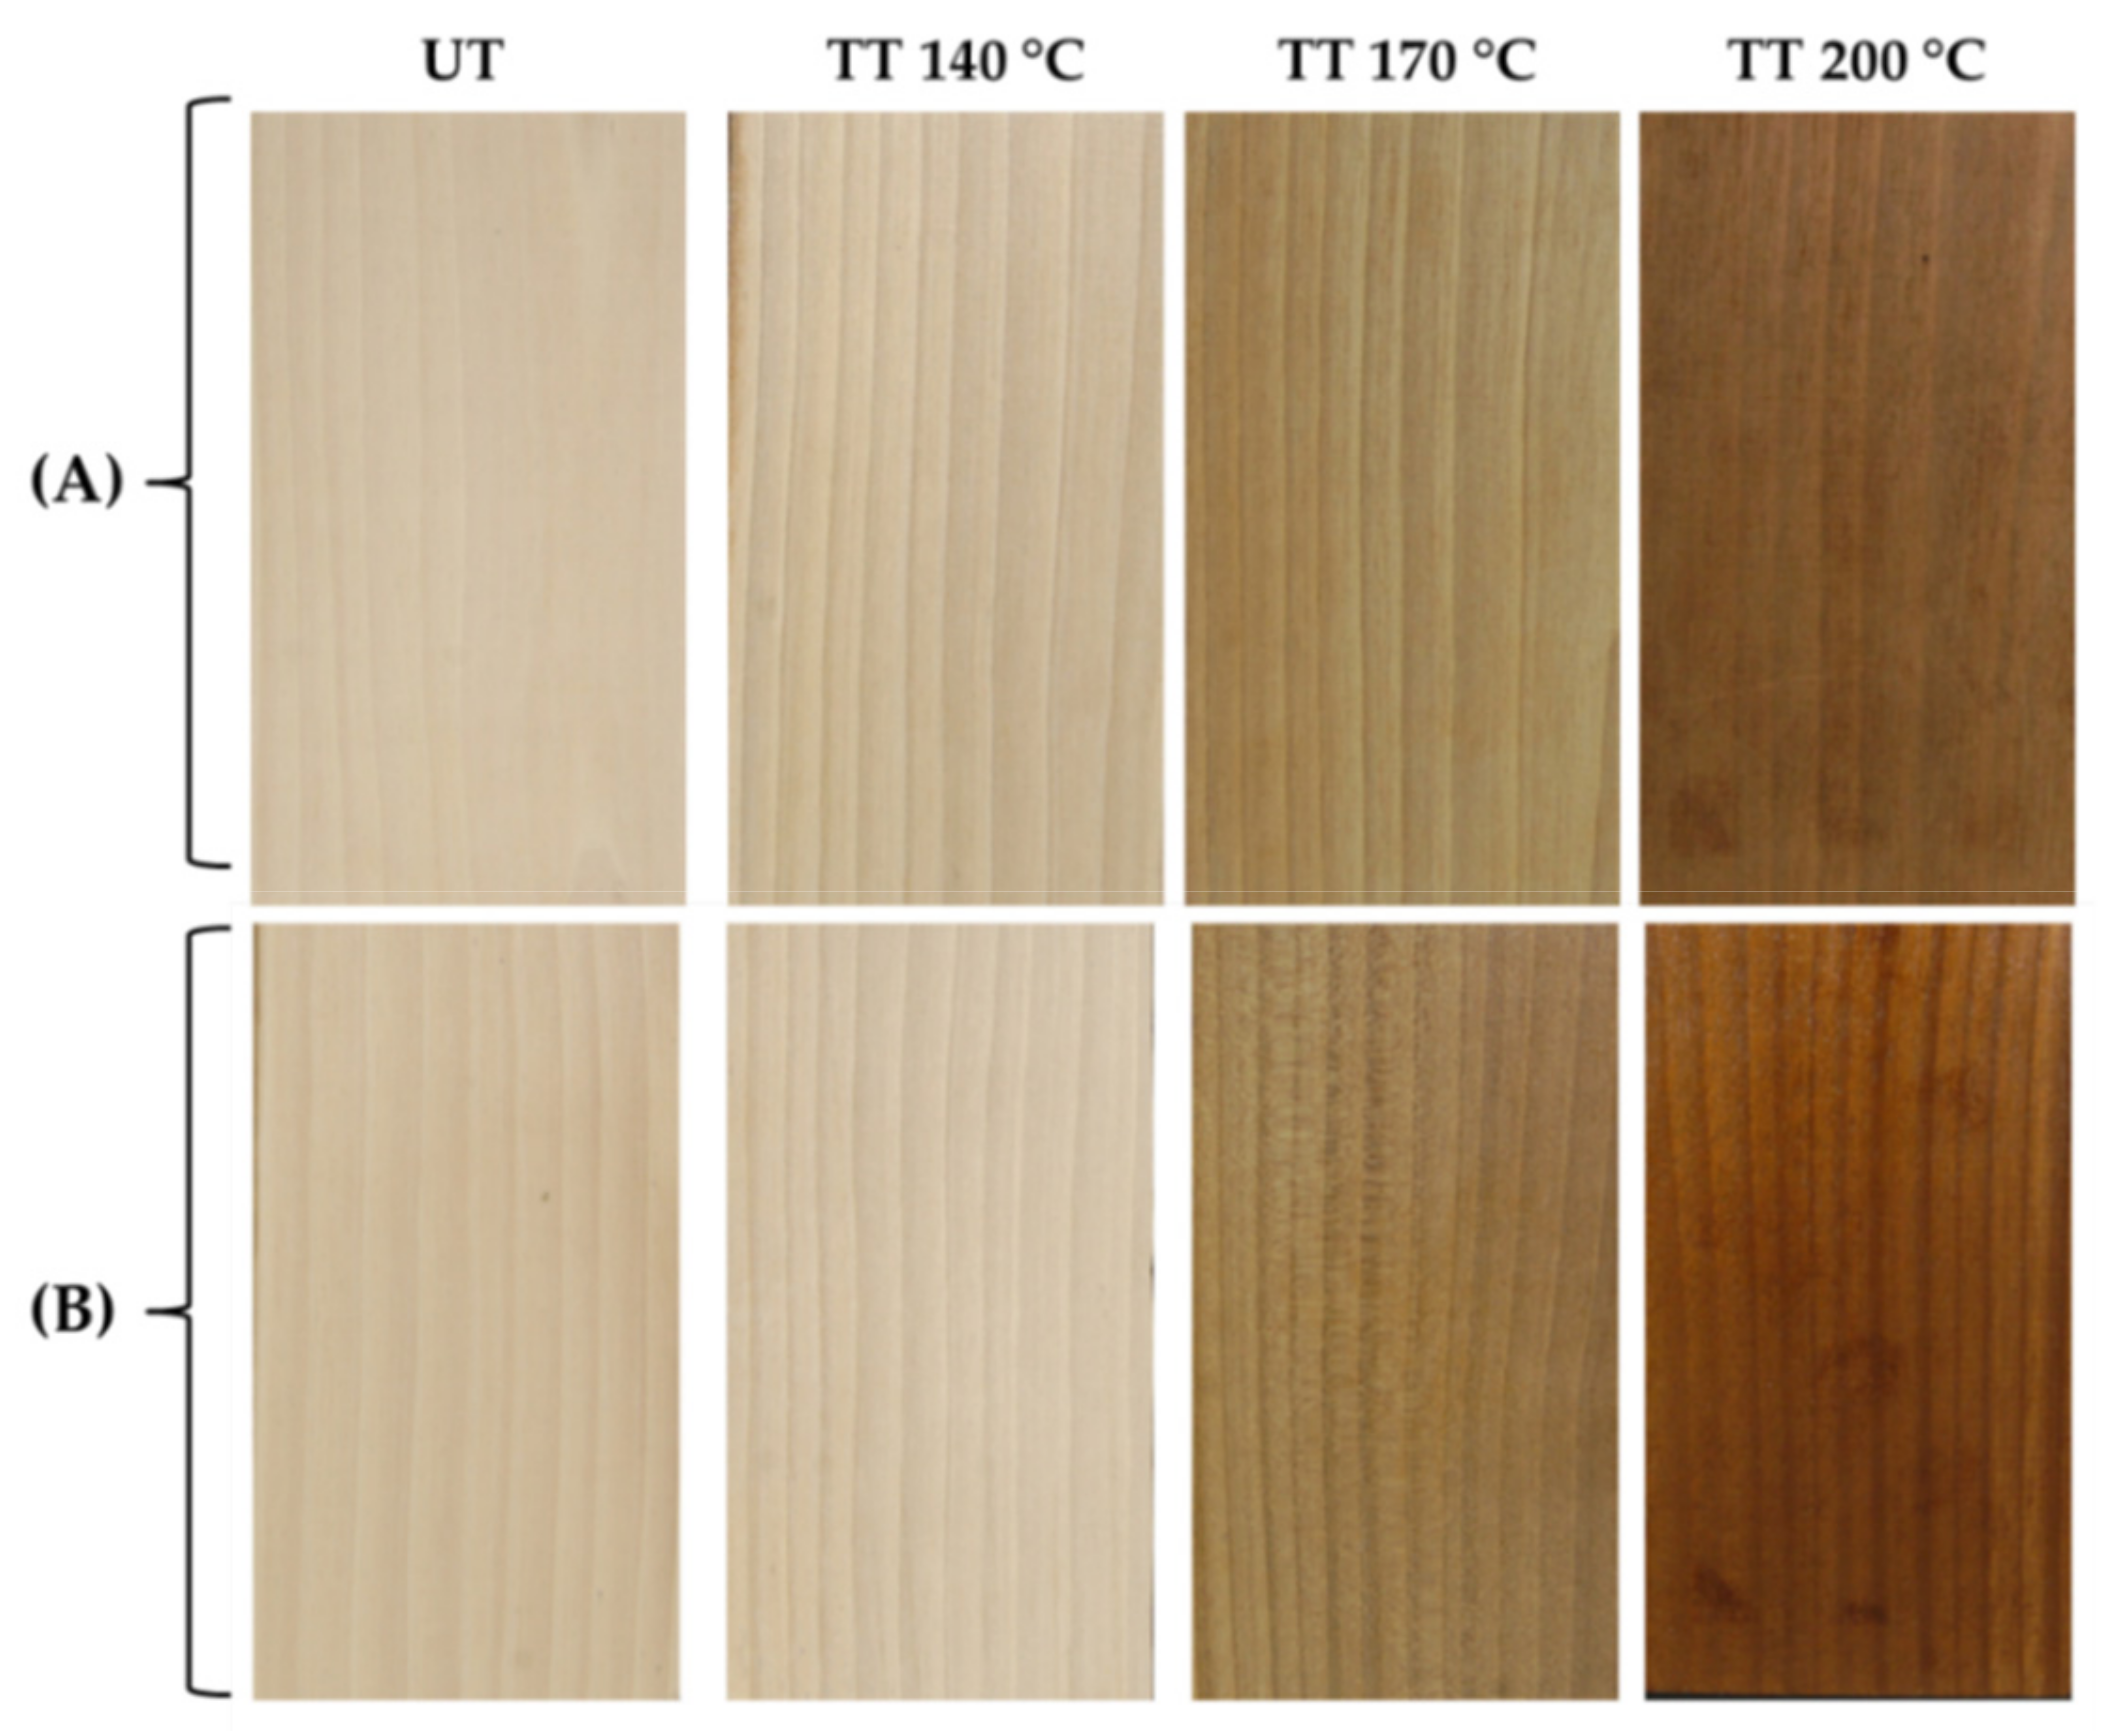
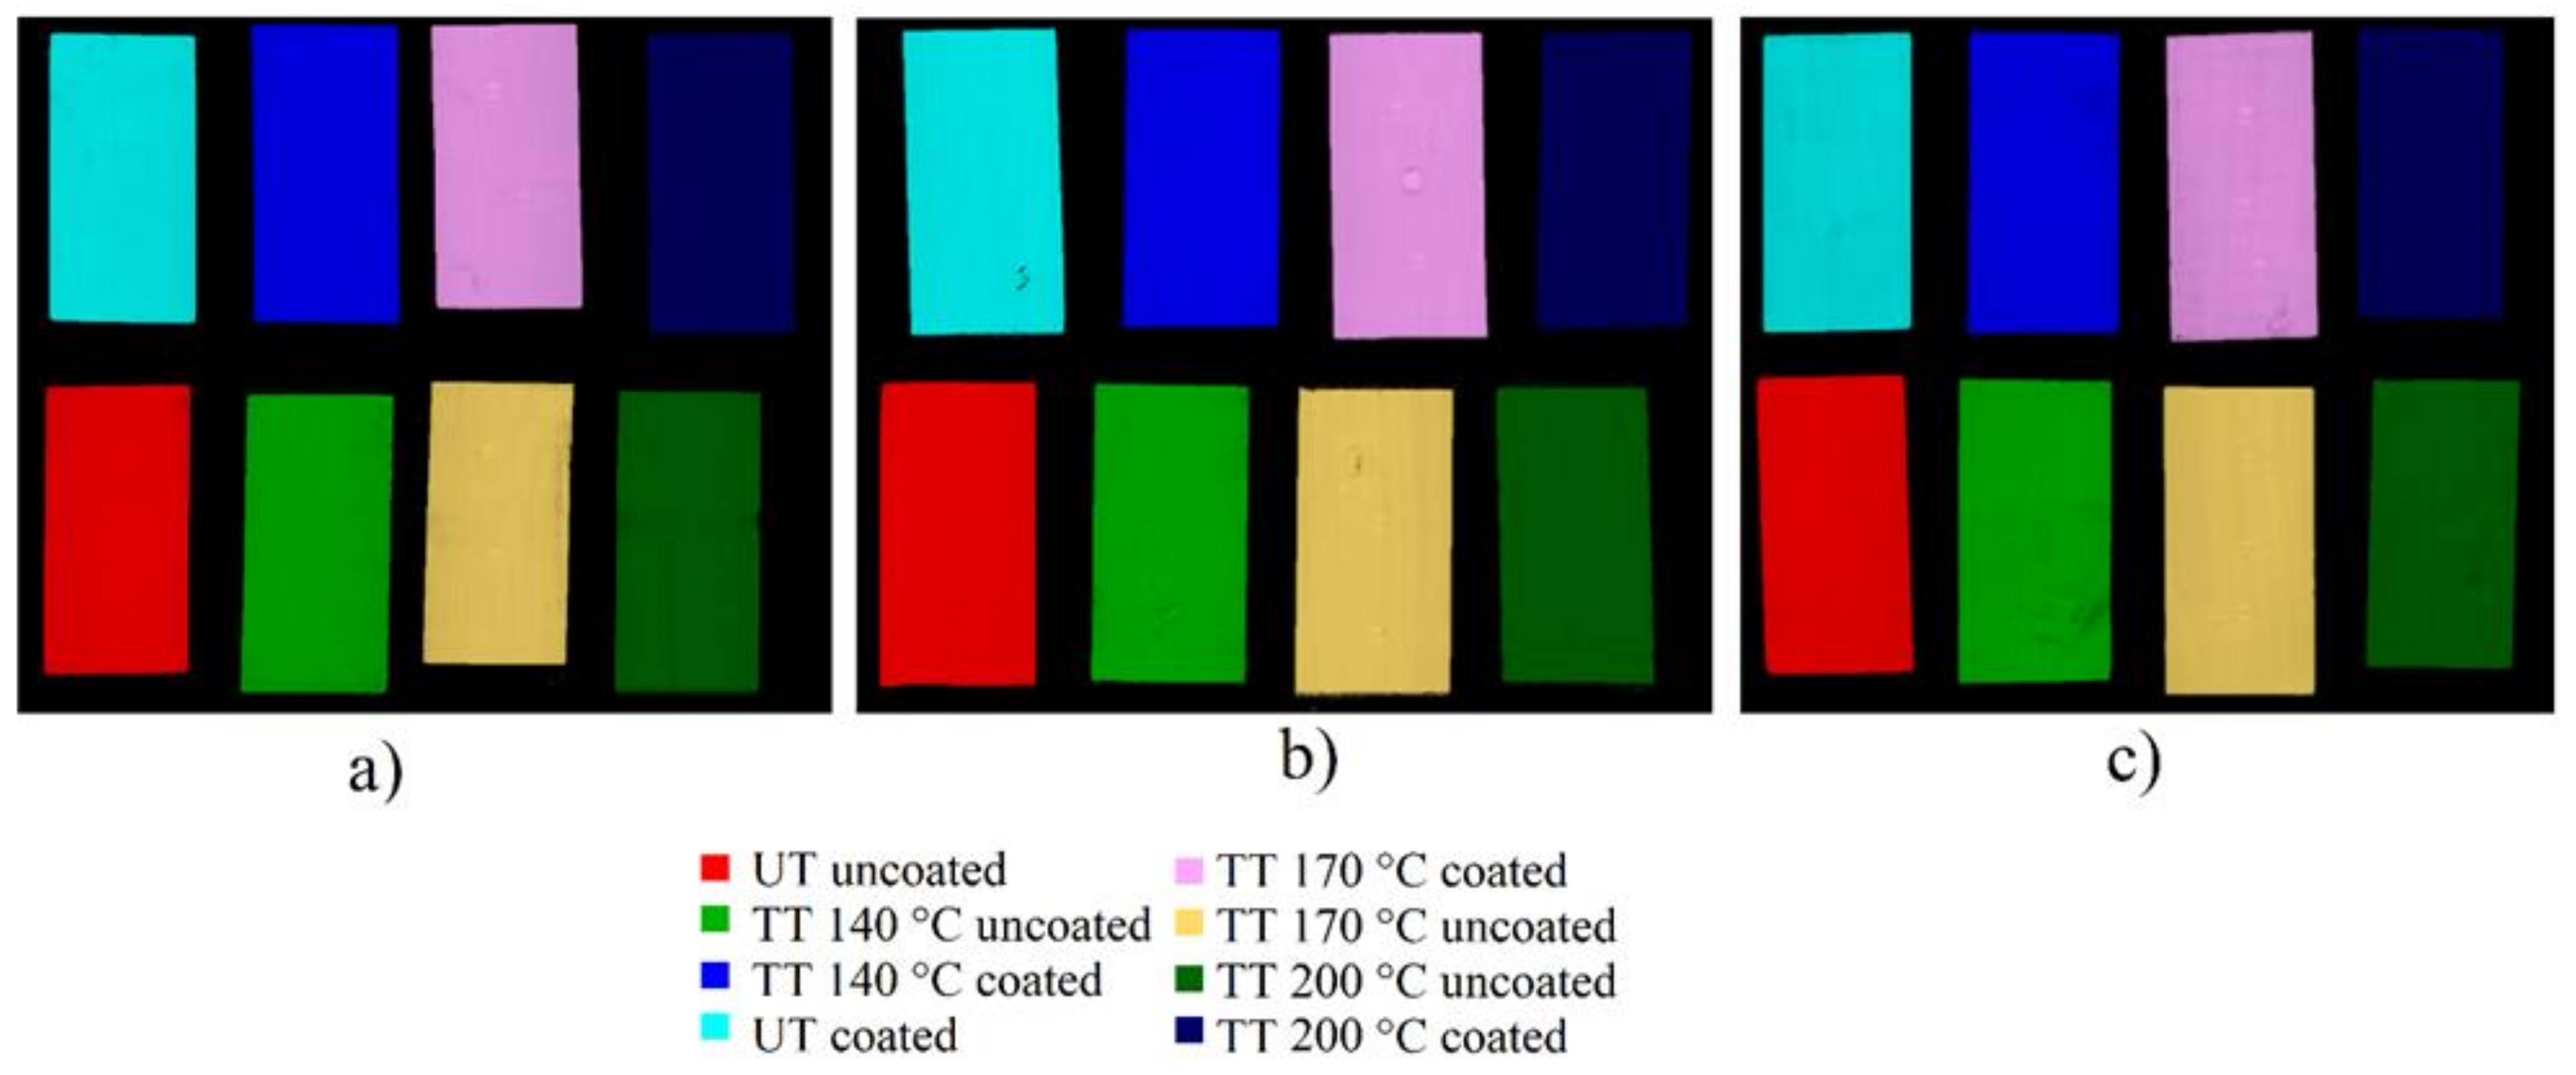
38]. The effect of heat treatment on wood colour consists of a darkening of the surface increasing with the temperature, as visually observed in
Figure 3. The application of the coating causes little colour variation in untreated and 140 °C heat-treated specimens, whereas the differences are higher for 170 °C and above all 200 °C thermally treated wood specimens (
Figure 3 and
Table 2). Specifically, the L* coordinate, representing lightness, in all cases decreases and consequently the values of ΔL* are negative. In the case of untreated and 140 °C thermally treated specimens, the values of chromatic differences are very low and hardly noticeable to the naked eye, confirming the statement of the supplier in the technical data sheet of Idrolinfo.
The darkening of the wood surface as a consequence of the application of different kinds of coating has also been generally observed by other authors [
39], and particularly on chestnut wood [
3].
Concerning the two chromatic coordinates, i.e., a* (red–green axis) and b* (yellow–blue axis), in all cases the differences after and before coating application are positive, indicating an increase in both a* and b*. The coordinate a* exhibits little change for specimens untreated and heat-treated at 140 °C and 170 °C, with the values of Δa* not being appreciable to the naked eye. Only in the case of specimens thermally treated at 200 °C is the change in a* relevant, and it significantly affects the final value of total colour change ΔE*. The variations of the b* coordinate are always higher than those calculated for a* and, also in this case, the most relevant change occurs in specimens treated at 200 °C (Δb* = 5.9). The behaviour of the specimens thermally treated at 200 °C can be explained by considering the high modification of wood caused by the temperature, passivizing the surface. In fact, it has been demonstrated that the thermal treatment at 200 °C has a great impact on colour, mechanical properties and hydrophobicity behaviour [
4].
3.2. Roughness Data
Another relevant parameter to be considered in the evaluation of surface properties and modifications due to coating application is the roughness [
39,
40,
41,
42,
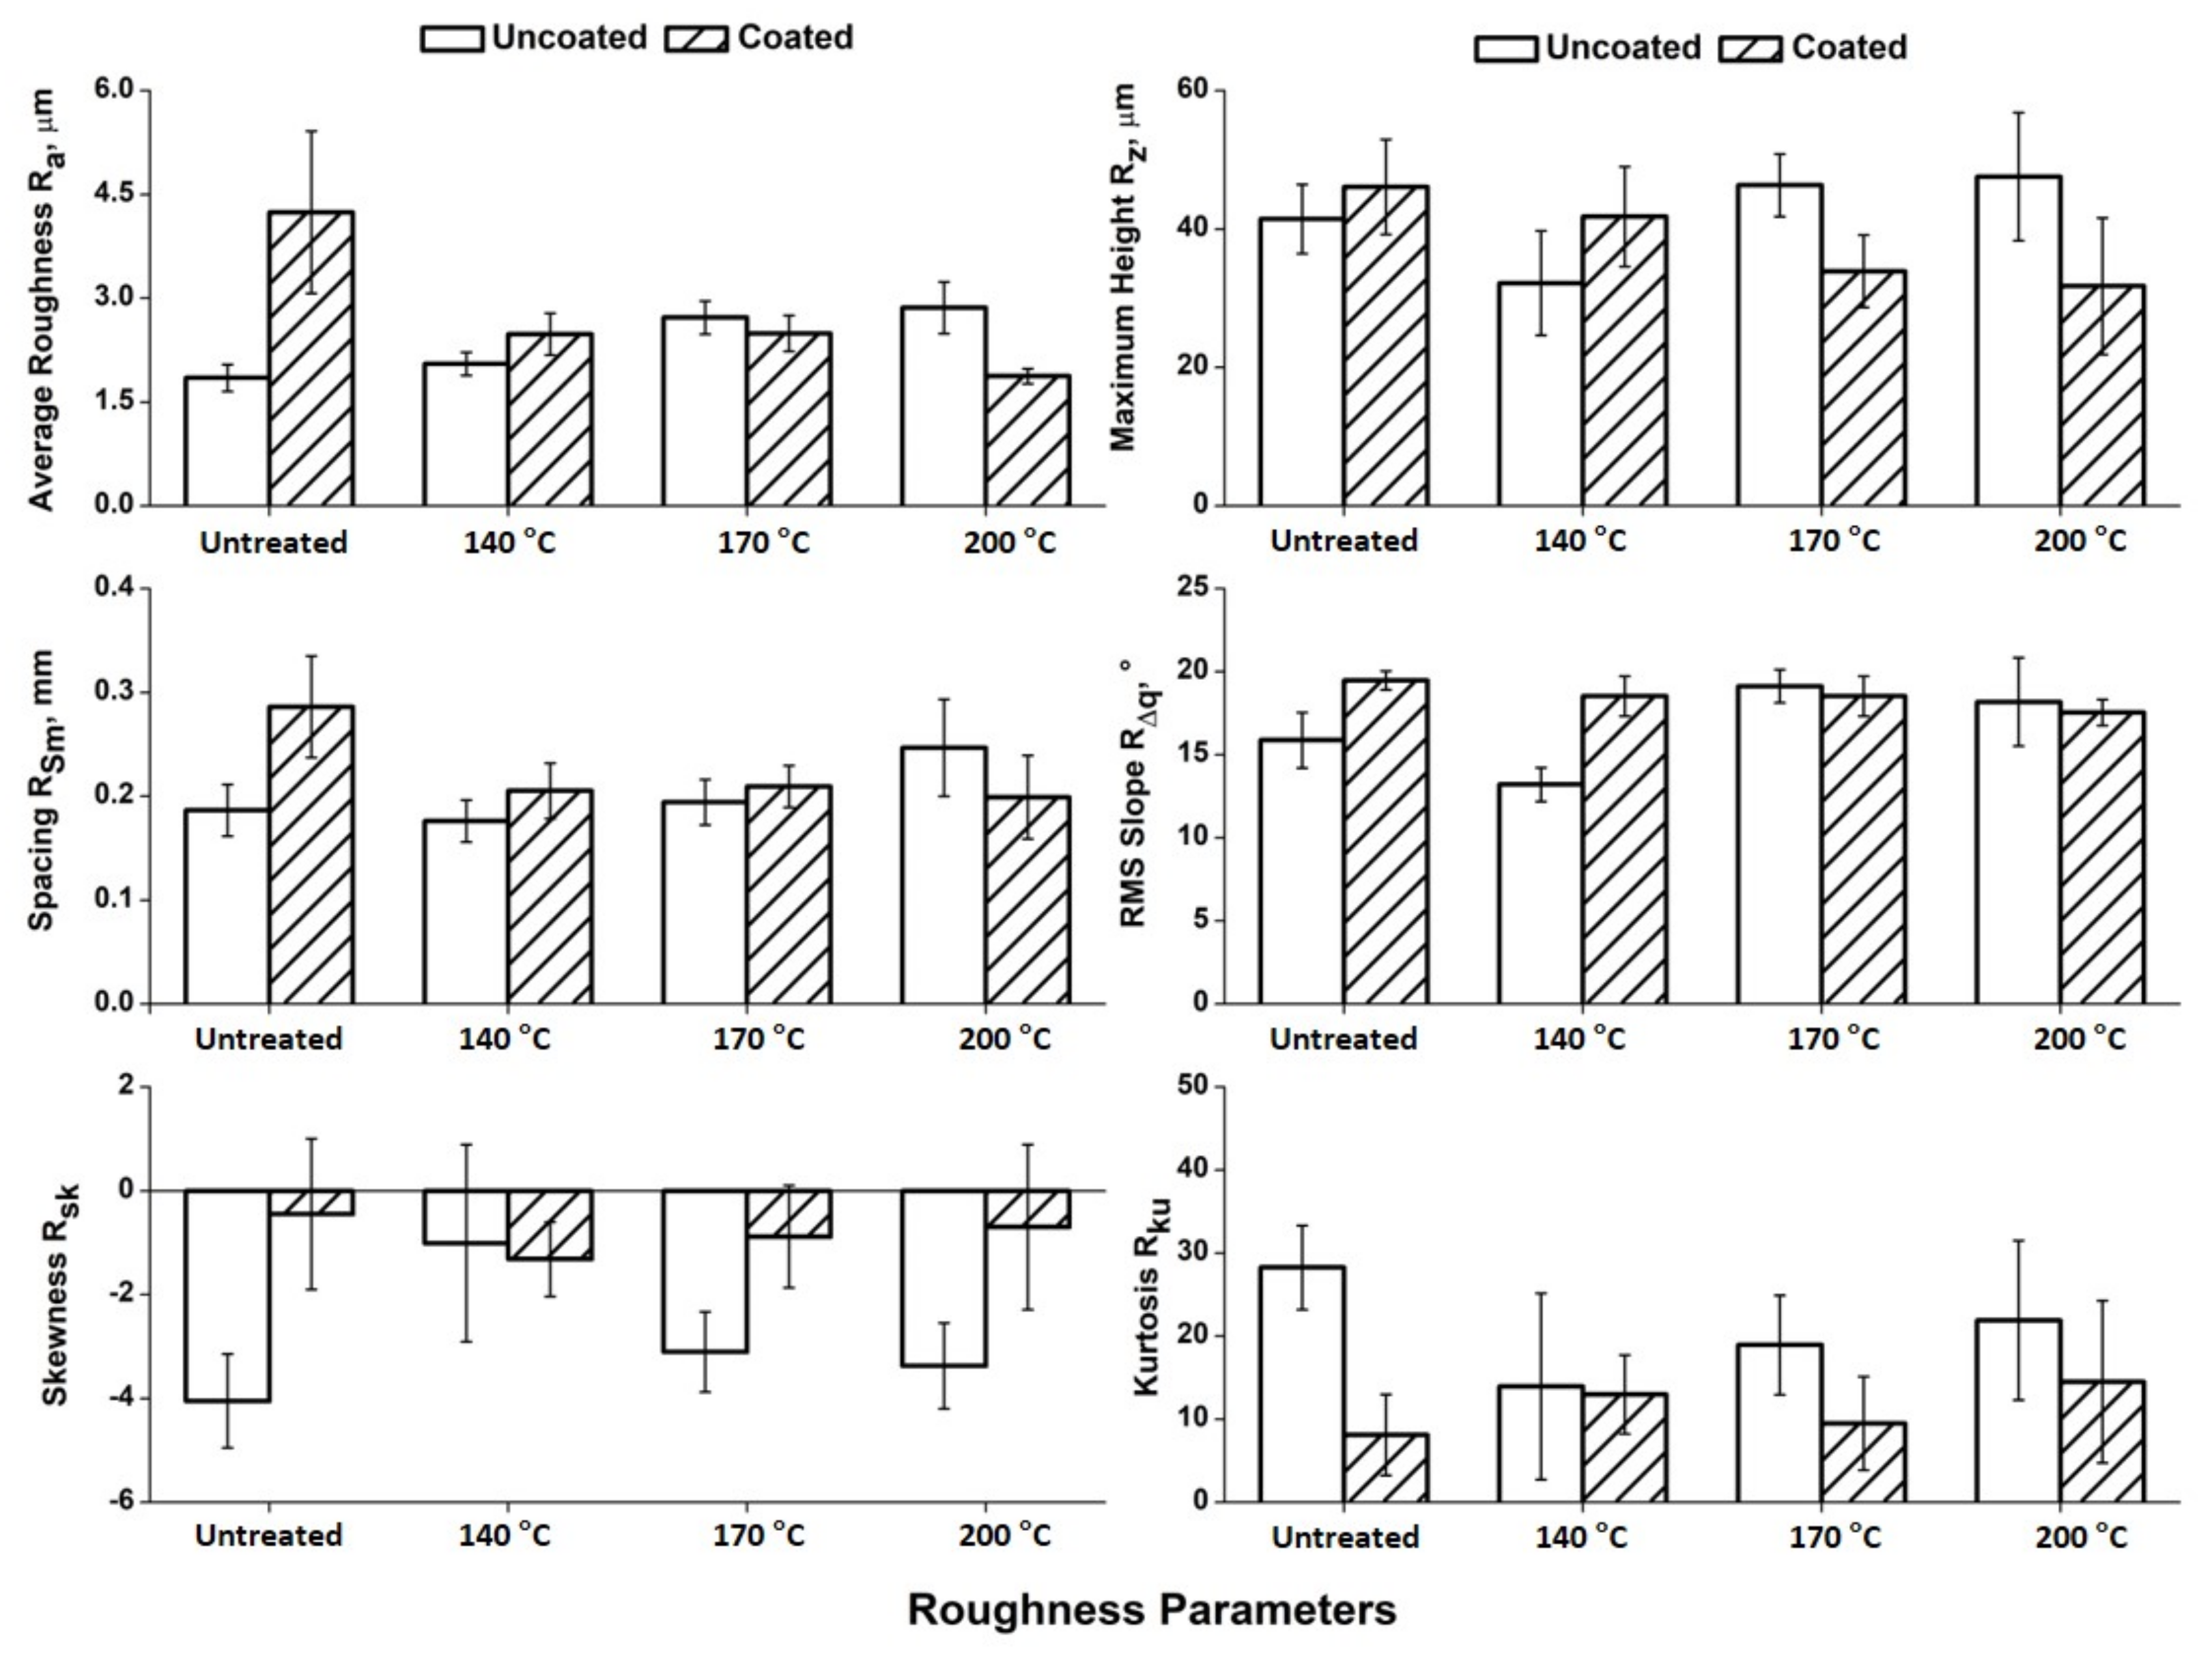
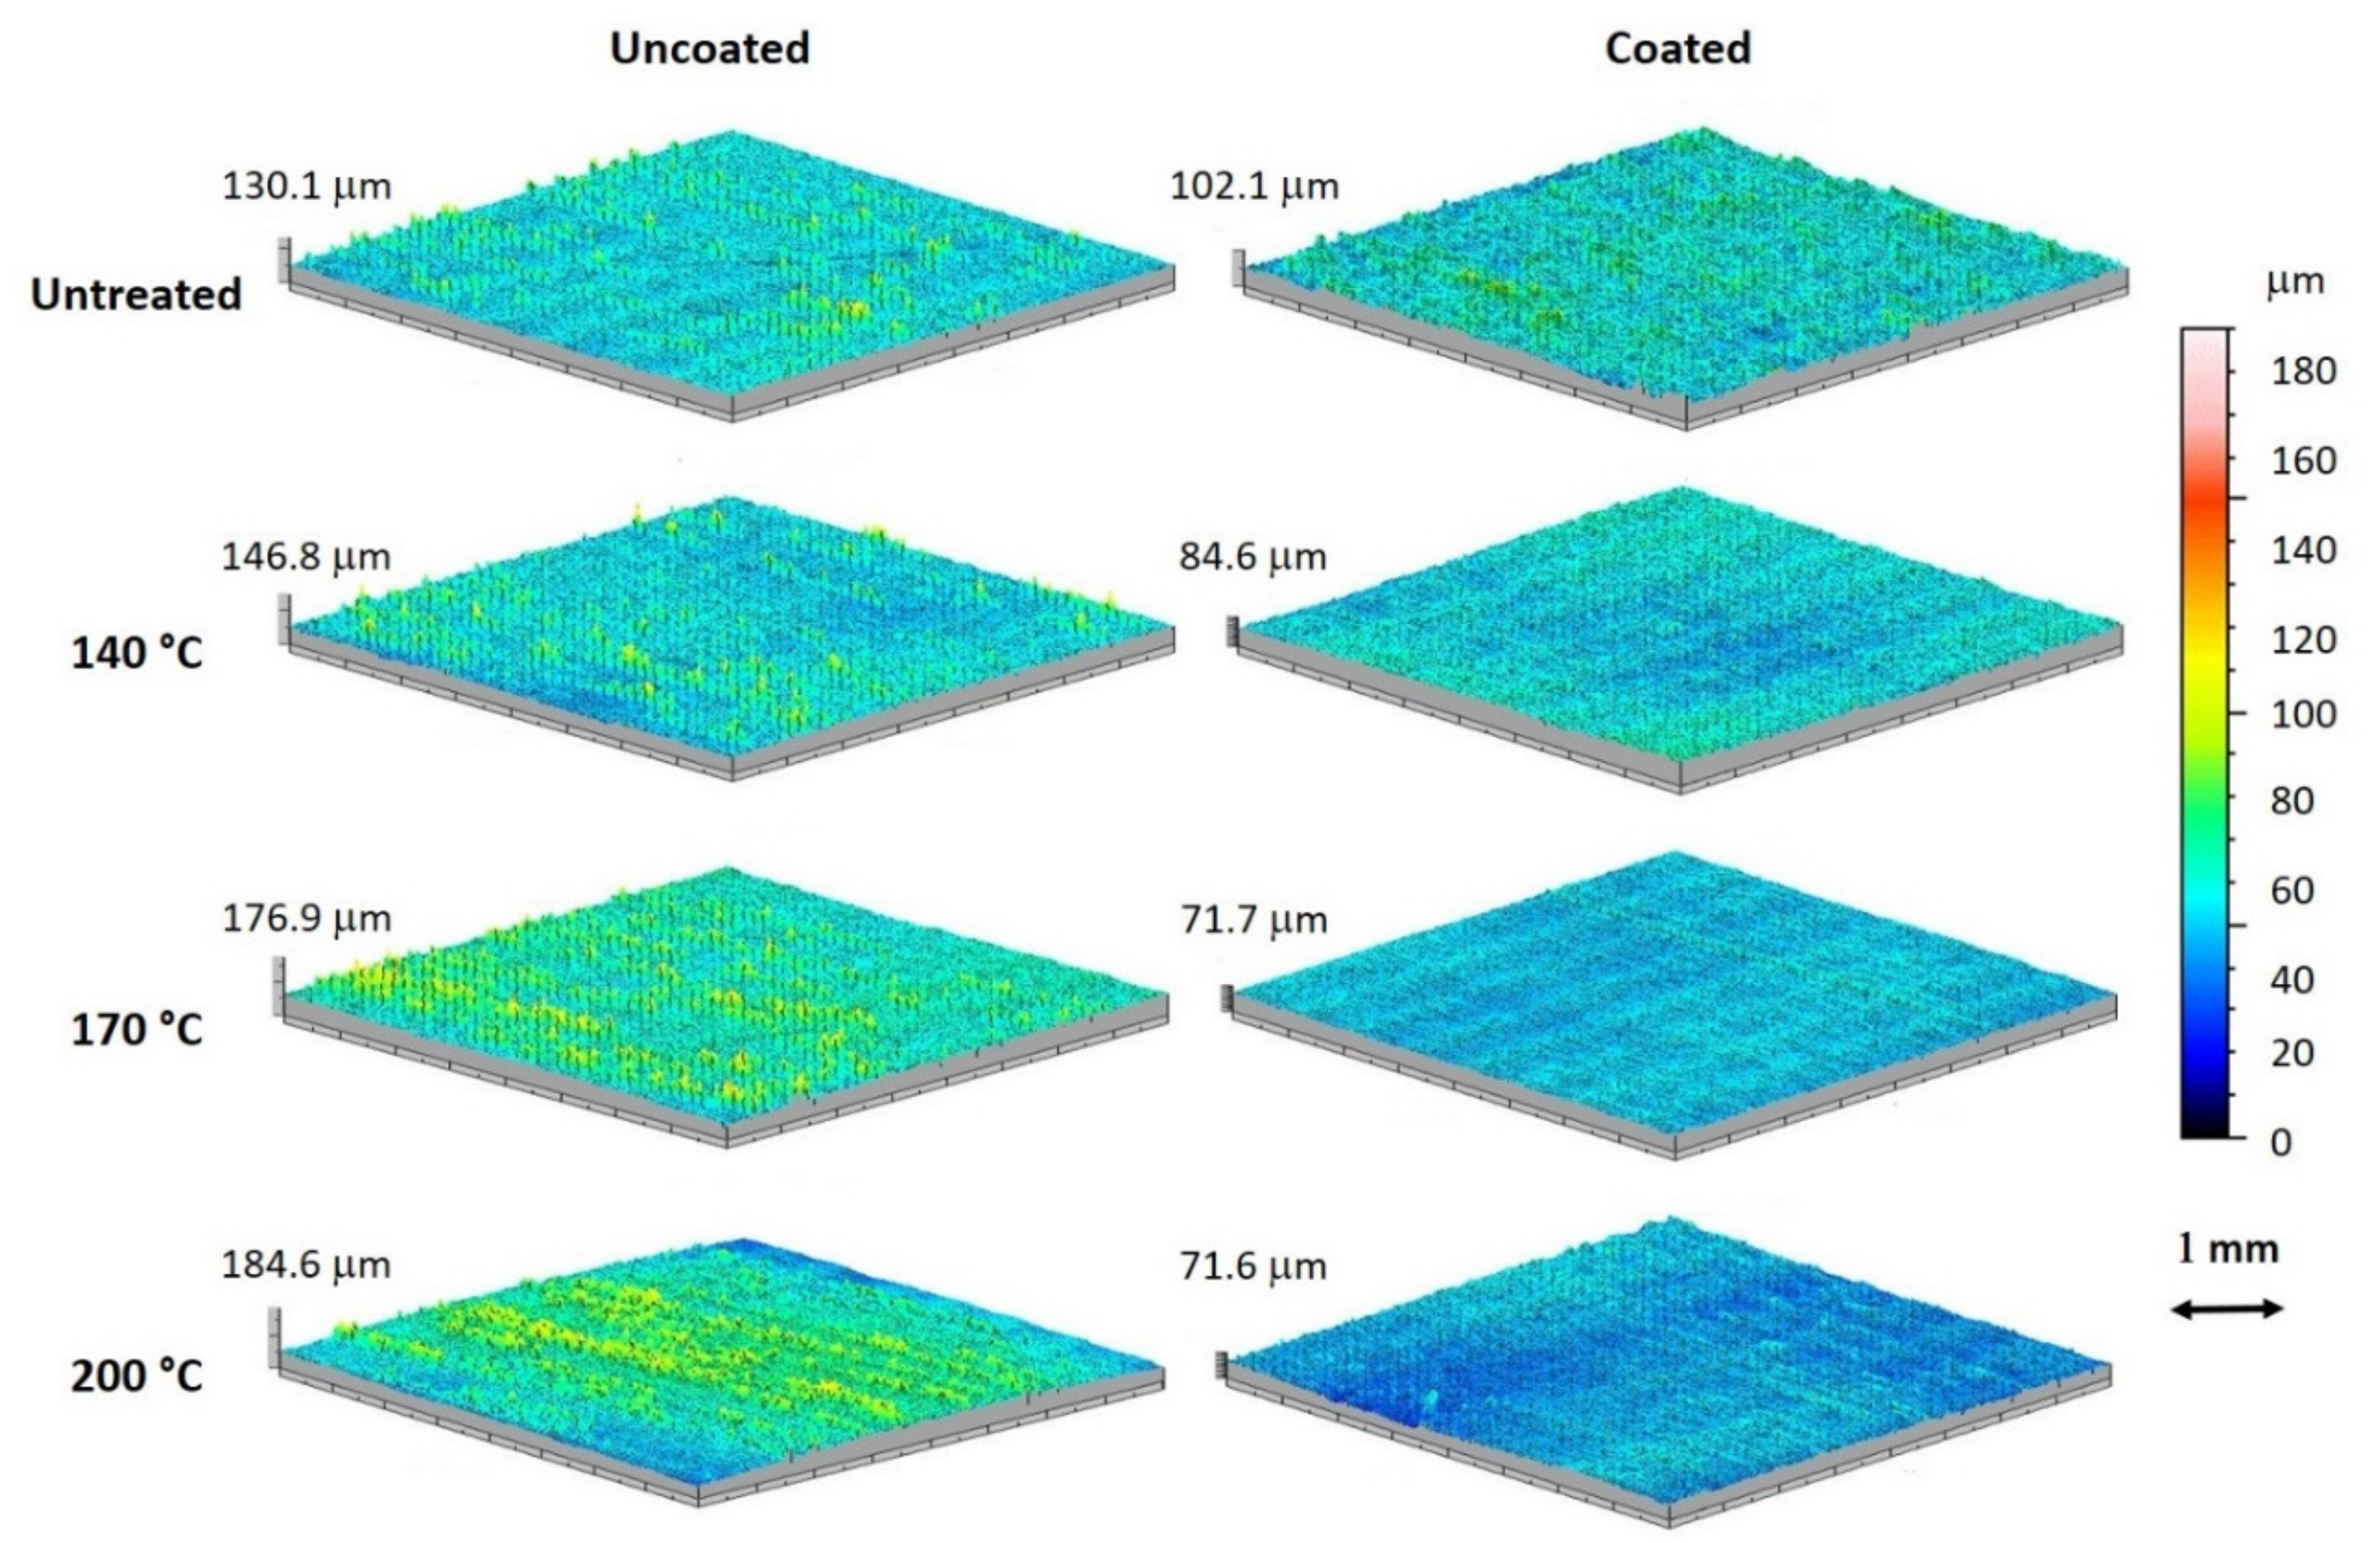
43]. Roughness data and 3D maps are reported in
Figure 4 and
Figure 5 for specimens without coating and with Idrolinfo. Data for untreated and thermally treated specimens are also considered separately.
It can be observed from the data of
Figure 4 and from the maps of
Figure 5 that there is a clear difference between specimens thermally untreated and heat-treated at 140 °C and those treated at 170 °C and 200 °C, showing again that the effect of the lower temperature has little influence on wood surface properties. The effect of heat treatment on the surface roughness of chestnut wood depends on both temperature and the direction of wood fibres [
4]. By adding the surface coating, it can be observed from the data of
Figure 4 and from the maps of
Figure 5 that there is a clear difference between specimens thermally untreated and heat-treated at 140 °C and those treated at 170 °C and 200 °C, showing again that the effect of the lower temperature has little influence on wood surface properties [
4]. R
a and R
z values increase in untreated and 140 °C treated specimens, whereas they decrease in 170 °C and 200 °C treated specimens, as a consequence of coating application. This result could be explained with the different degradation of wood as a consequence of heating. As the untreated and 140 °C treated specimens have no or little degraded surfaces, the water-based coating penetrates rapidly in the wood and the waxy components remain on the surfaces in the form of little grains: this could explain the increase in roughness. In the case of 170 °C and above all 200 °C treated specimens, the surface is more degraded by heat; moreover, the thermal treatment causes an increase in hydrophobicity. The water-based coating may distribute more uniformly on specimen surfaces with the effect of levelling and decreasing the roughness. This is clearly visible in the surface roughness maps (
Figure 5).
3.3. Contact Angle and Wettability of the Wood Surfaces
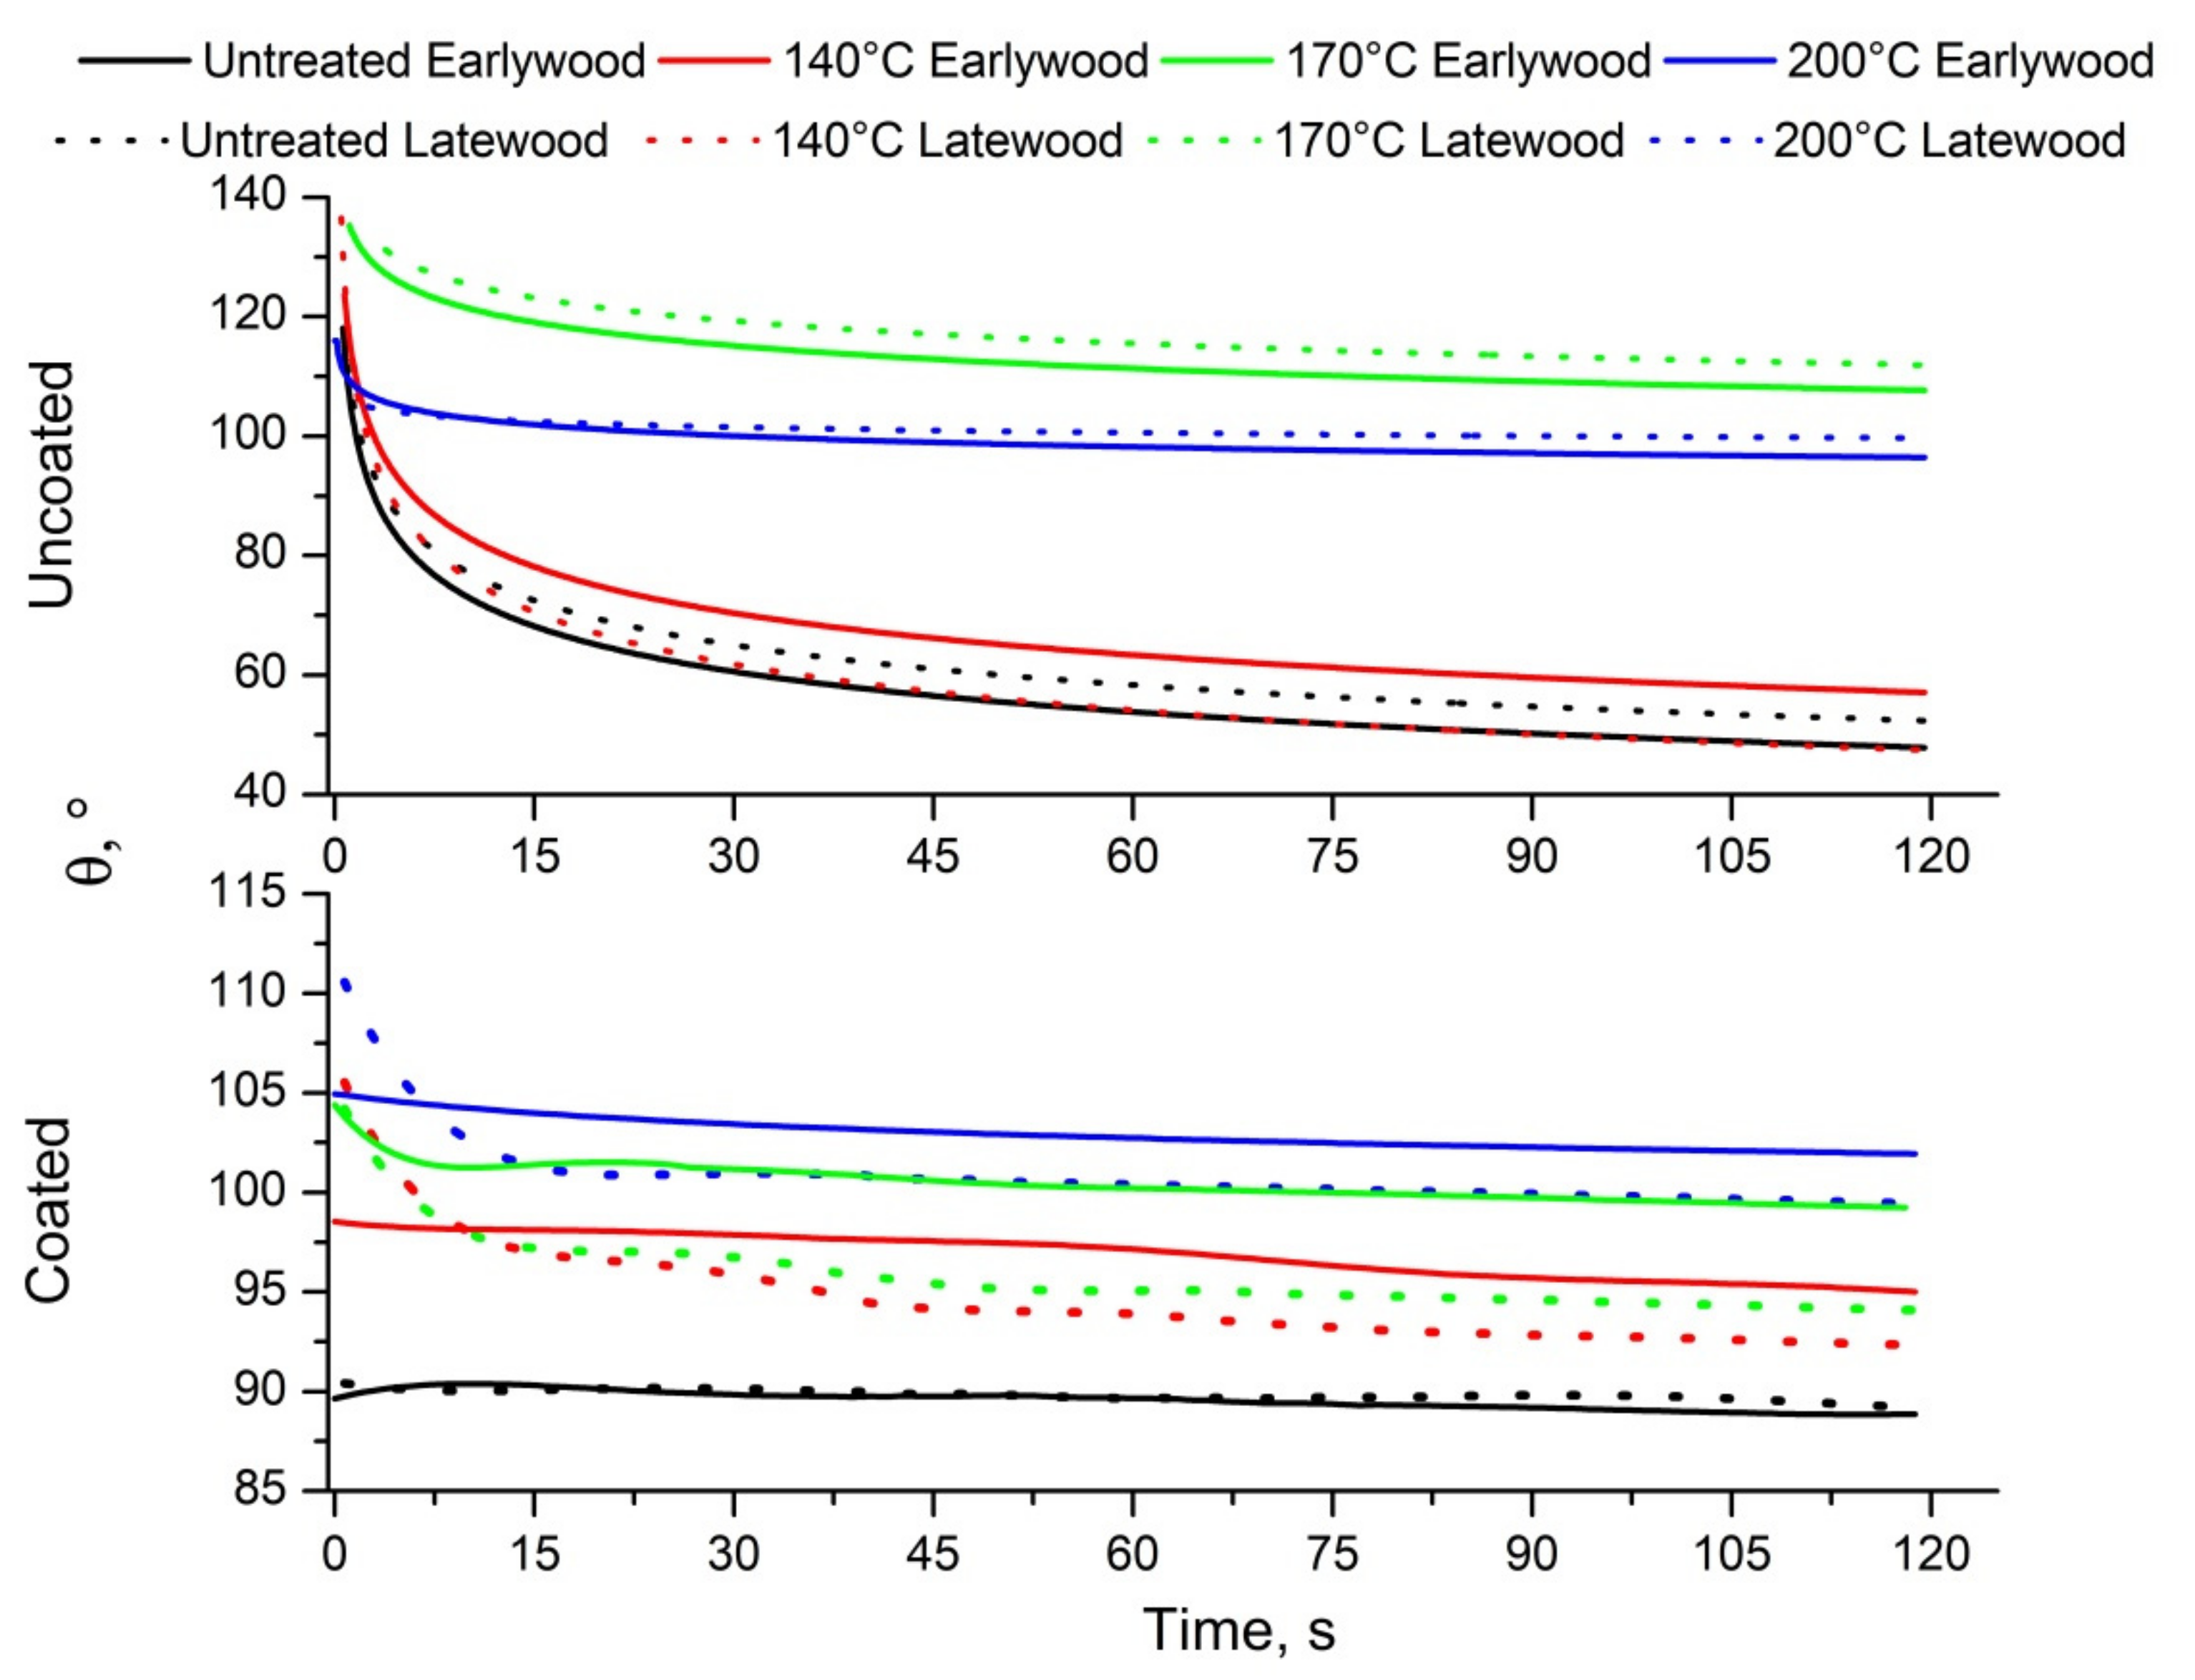
Contact angles as a function of time, until 120 s, are reported in
Figure 6. In this case, data for earlywood and latewood were measured separately, both in uncoated and coated specimens.
In the case of uncoated specimens, both untreated and heat-treated, the thermal treatment reduces the wettability of the chestnut wood surface and contact angles increase with the increasing temperature. Moreover, the behaviour differences between earlywood and latewood are small. In the case of coated specimens, the trends of contact angles as a function of time after water drop application show that Idrolinfo maintains the hydrophobicity of the surfaces quite constant, both in the earlywood and latewood areas, even if the initial values of θ are always lower than those measured without coating. Specifically, in the untreated specimens, the values of contact angles are constant over the 120 s of the measurement. In the heat-treated specimens, latewood shows a decrease in contact angles over time, more evident in those treated at 200 °C. On the other hand, the contact angle remains constant in earlywood treated at 140 °C, whereas it undergoes very little decrease in the specimens treated at 170 °C and 200 °C.
3.4. Hardness and Wearing Tests
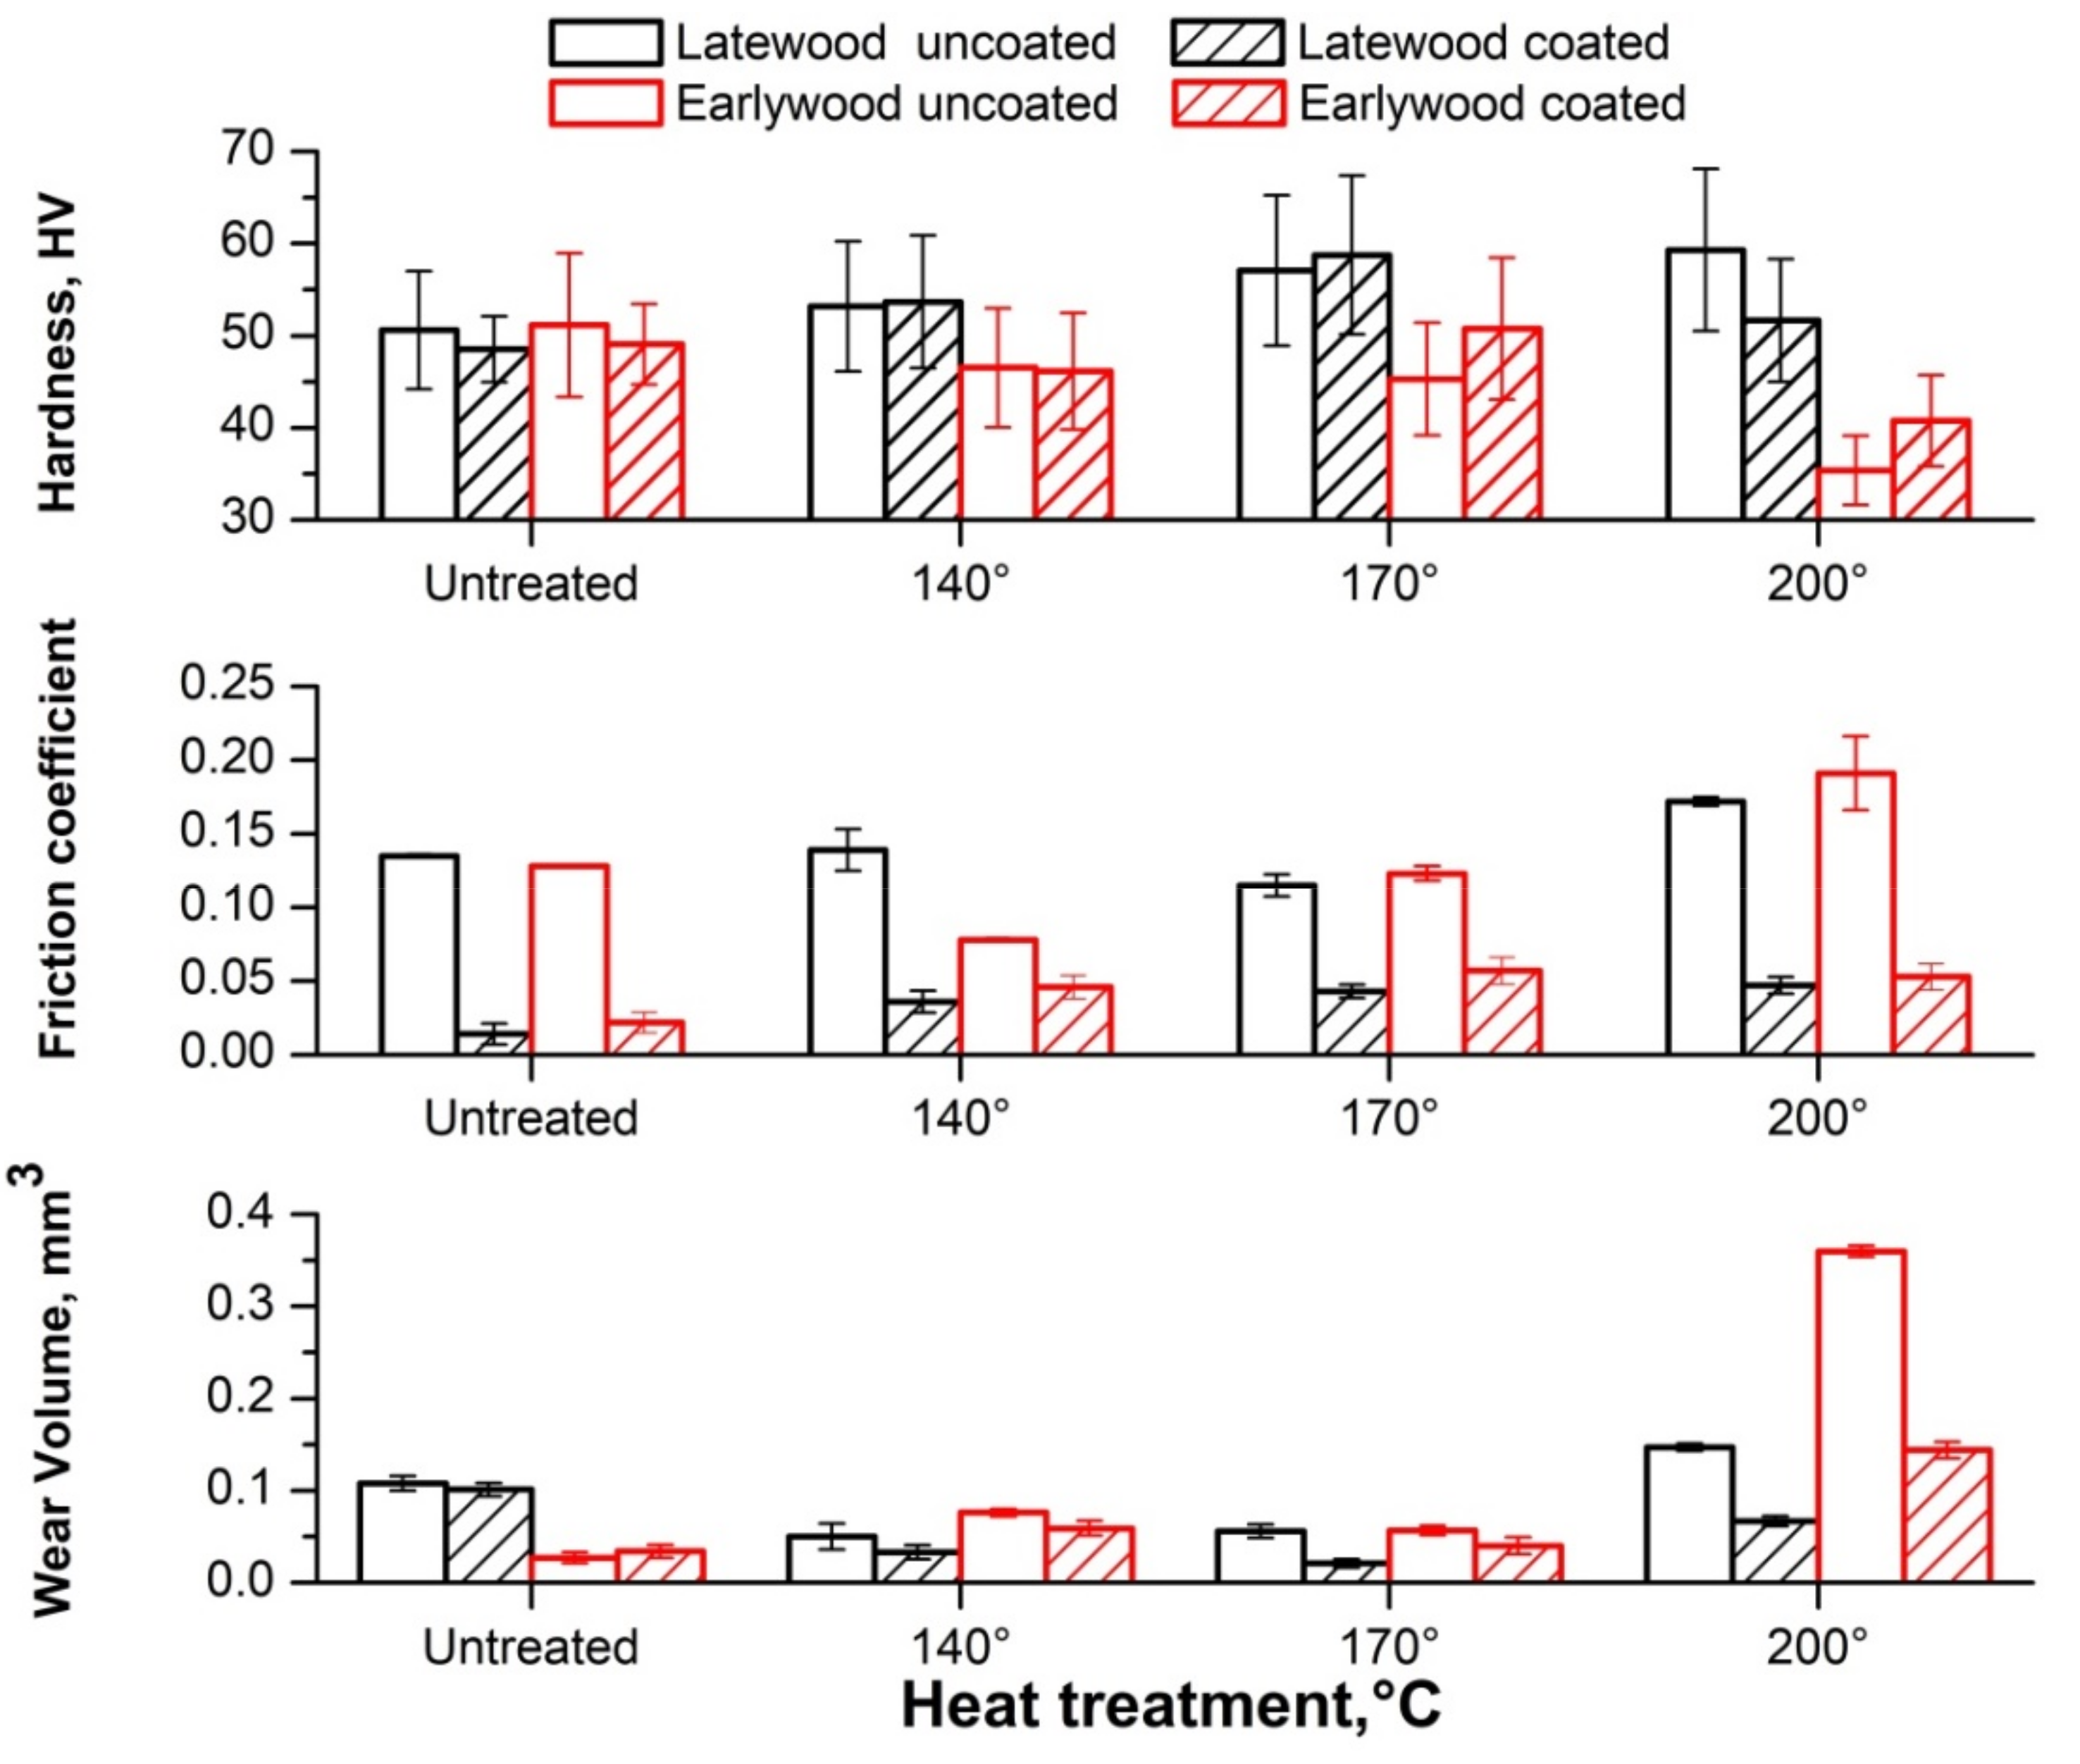
The results of Vickers and wearing tests are synthesised in
Figure 7. Data are reported both for the friction coefficient and wear volume.
Hardness and wearing tests were performed on earlywood and latewood separately. As previously observed, micro-hardness decreased with the increase in heating temperature in the case of earlywood and increased in that of latewood [
4]. This was explained by the higher degradation of earlywood in respect to latewood as a consequence of thermal treatment that caused a decrease in hardness in earlywood. On the other hand, latewood undergoes reorganisation of the lingo-cellulosic polymeric components and this increases the micro-hardness. The application of coating causes a small decrease in both latewood and earlywood micro-hardness in the case of untreated specimens, if compared with uncoated ones. This is probably due to the presence of Idrolinfo that acts as a lubricant, causing the production of greater imprints. This effect of waterborne coating was also observed by other authors who discussed the changes in mechanical properties of wood treated with this kind of coating [
44]. In the other cases, i.e., thermally treated specimens with coating, different behaviour can be observed depending on temperature and wood zones. In fact, for specimens heated at 140 °C, no differences are obtained in the values of micro-hardness between uncoated and coated surfaces, both in early- and latewood. This result could be explained by the consolidation effect of Idrolinfo on thermally degraded wood and consequently the increase in surface hardness. This effect is more visible in earlywood that, as already discussed, underwent major degradation at higher temperatures in respect to latewood. In the case of earlywood, the effect of coating is more relevant for the surface hardness increase. Lastly, the wood specimens treated at 200 °C are highly degraded, mostly in correspondence with earlywood where the micro-hardness underwent an evident decrease (see
Figure 7).
The results of the abrasion test, reported in terms of the friction coefficient and wear volume, show the effect of both thermal treatment and coating application on specimens. The coefficient of friction, µ, is a measure of the amount of friction existing between two surfaces. A low value of the friction coefficient indicates that the force required for sliding to occur is low. A higher force is required when the coefficient of friction is higher. Heat treatment does not significantly affect the friction coefficient in latewood, causing a small decrease at 170 °C and a higher increase at 200 °C. In the case of earlywood, the friction coefficient for uncoated specimens decreases at 140 °C and increases at 170 °C, but above all at 200 °C, probably due to the degradation of this part of the wood. In the coated specimens, the friction coefficient always undergoes a significant decrease due to the presence of the coating.
Wear volume, in latewood, decreases with the increase in temperature until 170 °C, but increases at 200 °C. The wear volume has very low values in latewood heat-treated at 170 °C, both uncoated and coated with Idrolinfo. In earlywood, the wear volume undergoes little variation between untreated and thermally treated specimens until 170 °C, but it increases considerably at 200 °C. This result, associated with the increased value of micro-hardness, especially in coated early- and latewood, further demonstrates that 170 °C is the optimal temperature for the thermal treatment of chestnut. In fact, below this temperature, wood increases or maintains its mechanical properties without suffering a great colour change and also acquiring a good hydrophobicity, both uncoated and coated with Idrolinfo.
3.5. Hypresctral Imaging Data
After the background removal, the classes were selected for the calibration and validation datasets to evaluate the performance metrics. The resulting hypercube image with the classes, set for calibration and validation, is shown in
Figure 8.
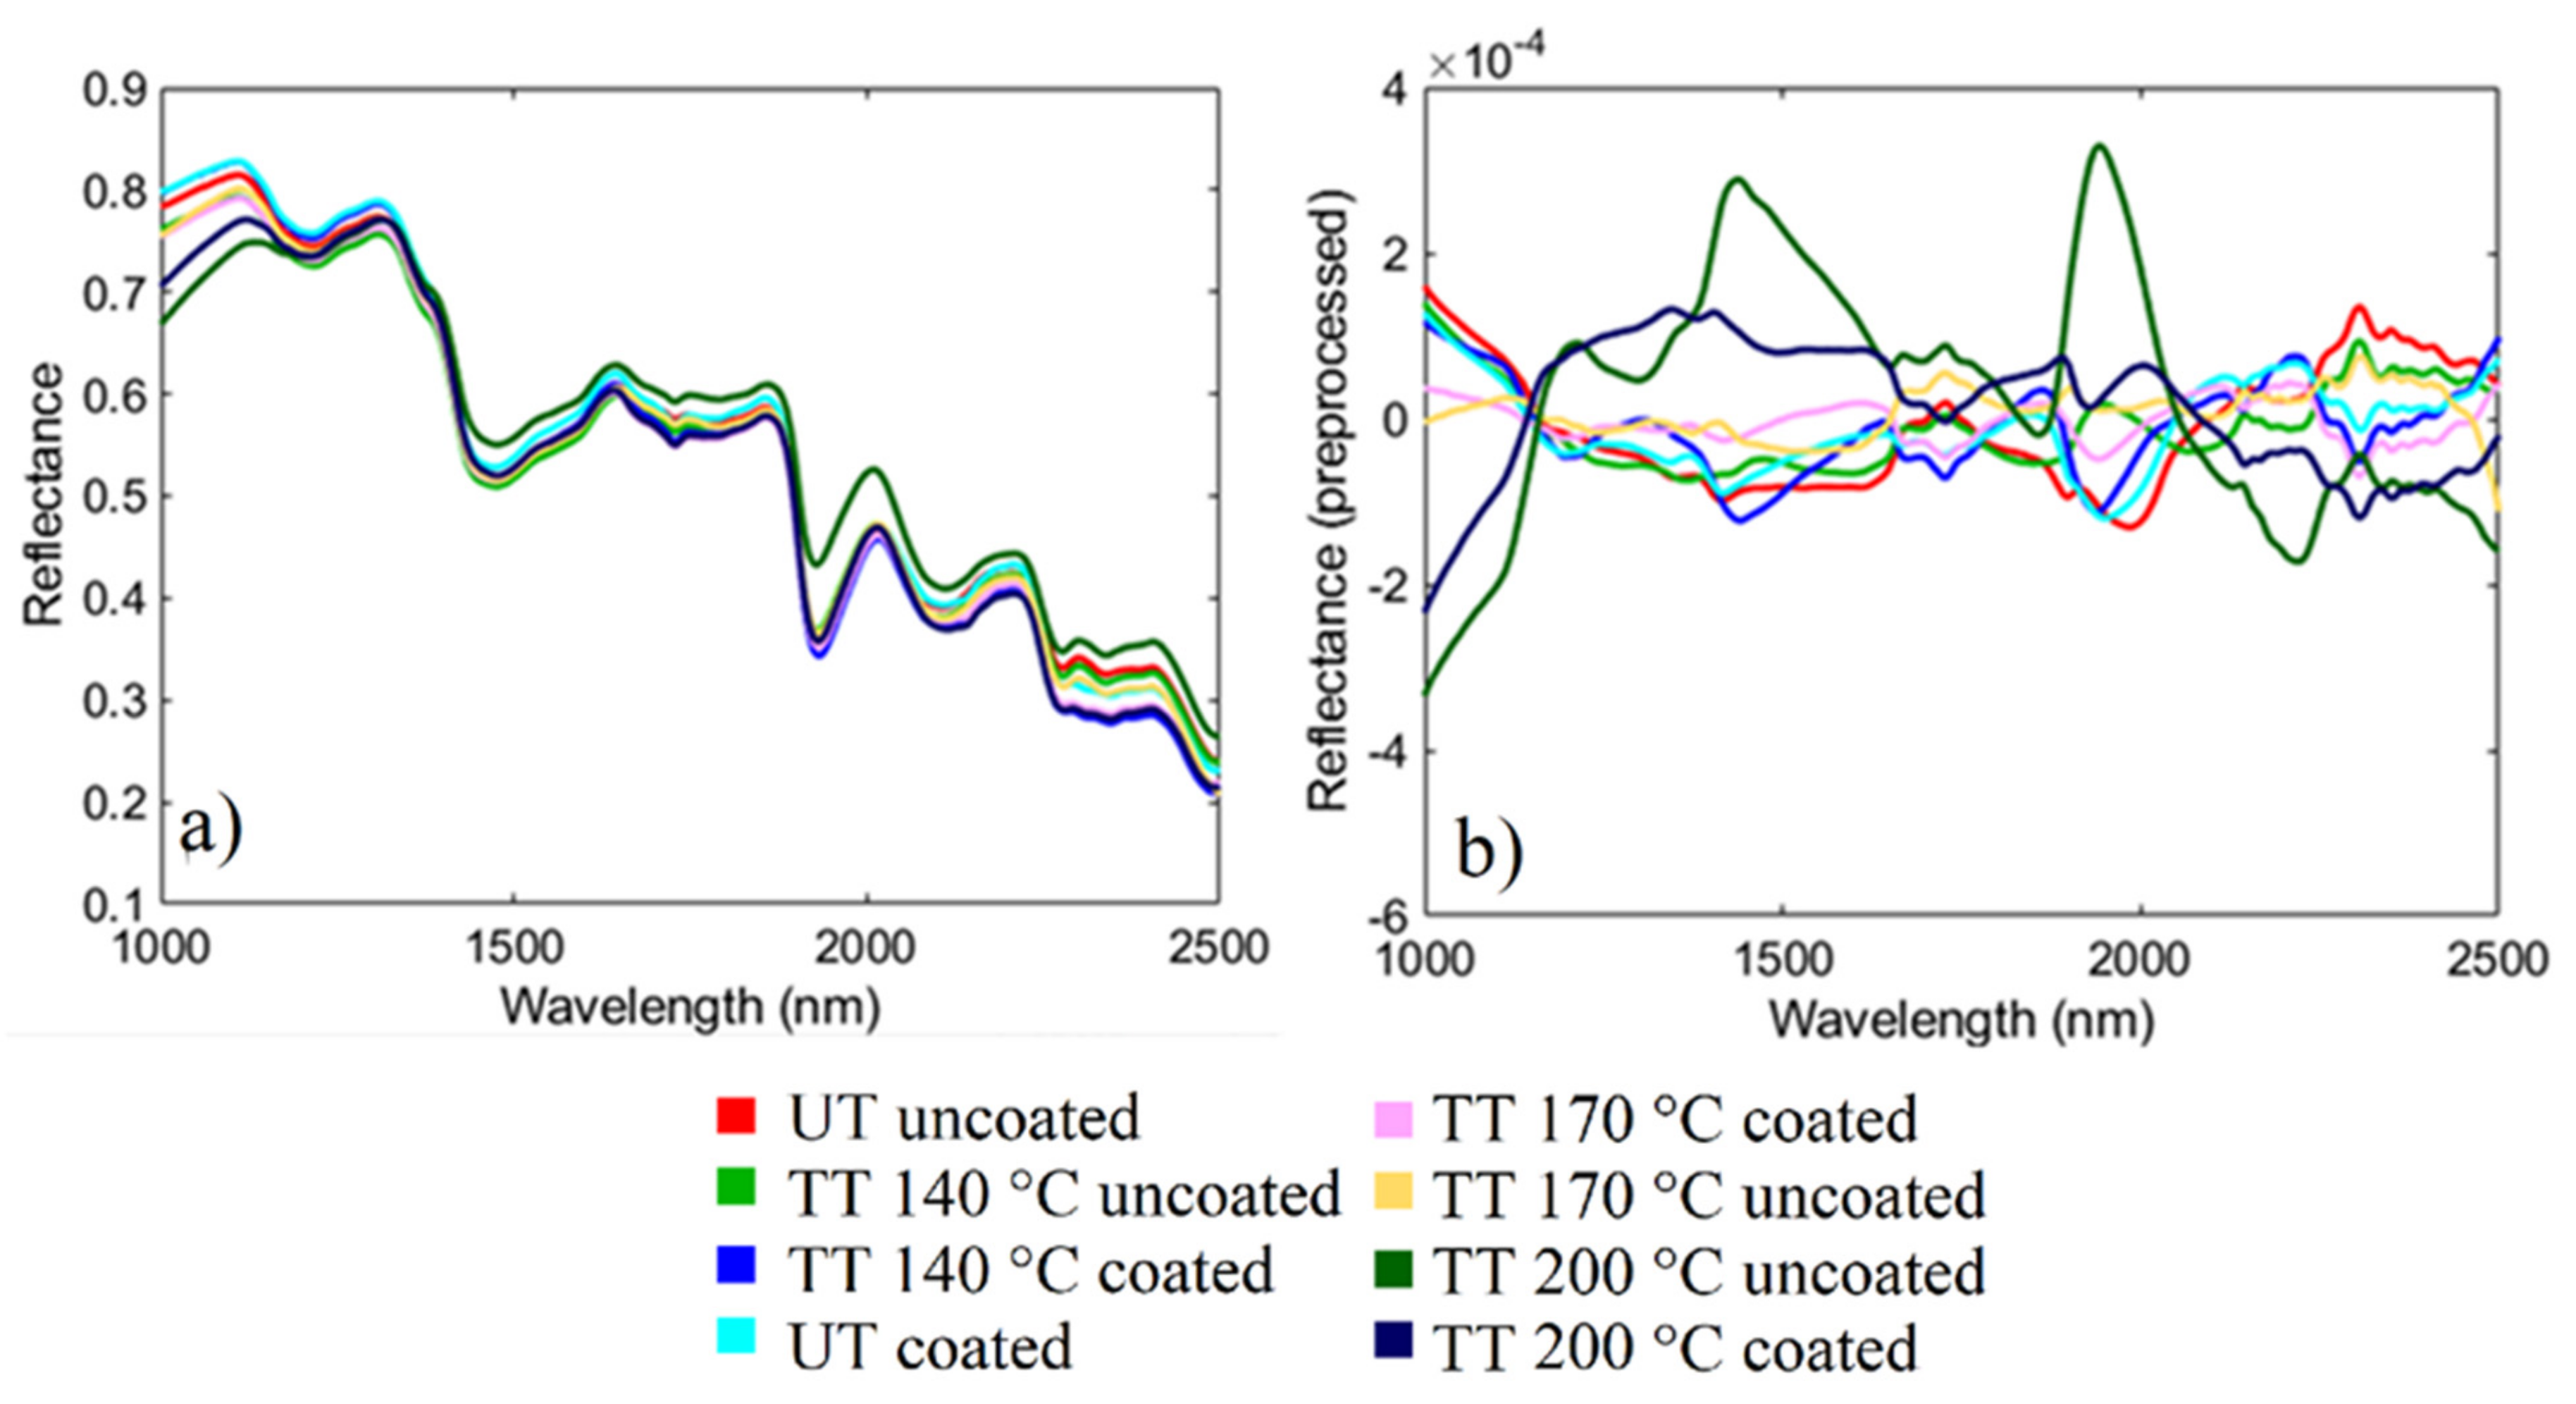
The average and pre-processed spectra of the selected classes are reported in
Figure 9. To highlight the spectral differences related to the different heat treatments, PCA was applied with the following pre-processing: PQN, detrend, and MC, as shown in
Figure 9b.
The absorptions at 1200, 1478, and 1930 nm can be attributed to the stretching vibrations of O–H bonds in water. The 1478 nm band could be overlapped by the absorption of cellulose O–H or lignin–CH
2. The weak bands at 1670 and 1730 nm can be associated with the presence of O–H groups in cellulose/lignin, and those at 2130, 2280, and 2349 nm are due to different configurations of the C–H, C=O, C=C, and COOH groups in cellulose and lignin [
45]. The main spectral differences detected between the Idrolinfo coated and uncoated specimens were around 1700 nm and between 2200 and 2500 nm. The SWIR is very sensitive to these variations because it is dominated by signals from bonds involving hydrogen atoms [
46].
Principal Component Analysis was applied selecting the following cases: (1) UT and TT at 140 °C, uncoated and coated; (2) UT and TT at 170 °C, uncoated and coated; and (3) UT and TT at 200 °C, uncoated and coated, in order to evaluate the effect of Idrolinfo on each thermal treatment separately. The score plots are shown in the
Supplementary Materials (Figures S1–S3). In the case (1), the PCA score plot highlights a low separation between UT and TT 140 °C coated specimens, whereas the pixel clouds of UT uncoated and UT coated appear well separated and distinct. The analysis of the loadings (
Figure S1c) clearly demonstrated that the main variations along the 2nd principal component are in the wavelength interval 1600–1800 nm and around 2300 nm, while the variations along the 3rd principal component are mainly around 1900 nm.
In the case (2), the PCA score plot highlights a low separation between UT and TT 170 °C coated specimens, whereas the pixel clouds of UT uncoated and UT coated appear well separated and distinct. The analysis of the loadings (
Figure S2c) clearly shows that the main variations along the 2nd principal component are in the wavelength interval 1500–1800 nm and around 2300 nm, while the variations along the 3rd principal component are in the wavelength interval 1000–1400 nm and around 1700 and 2000 nm.
In the case (3) again, the pixel clouds of UT uncoated and UT coated are separated and distinct. The analysis of the loadings (
Figure S3c) clearly shows that the main variations along the 1st principal component are around 1400 and 1900 nm, while the variations along the 2nd principal component are around 1200 and 1700 nm.
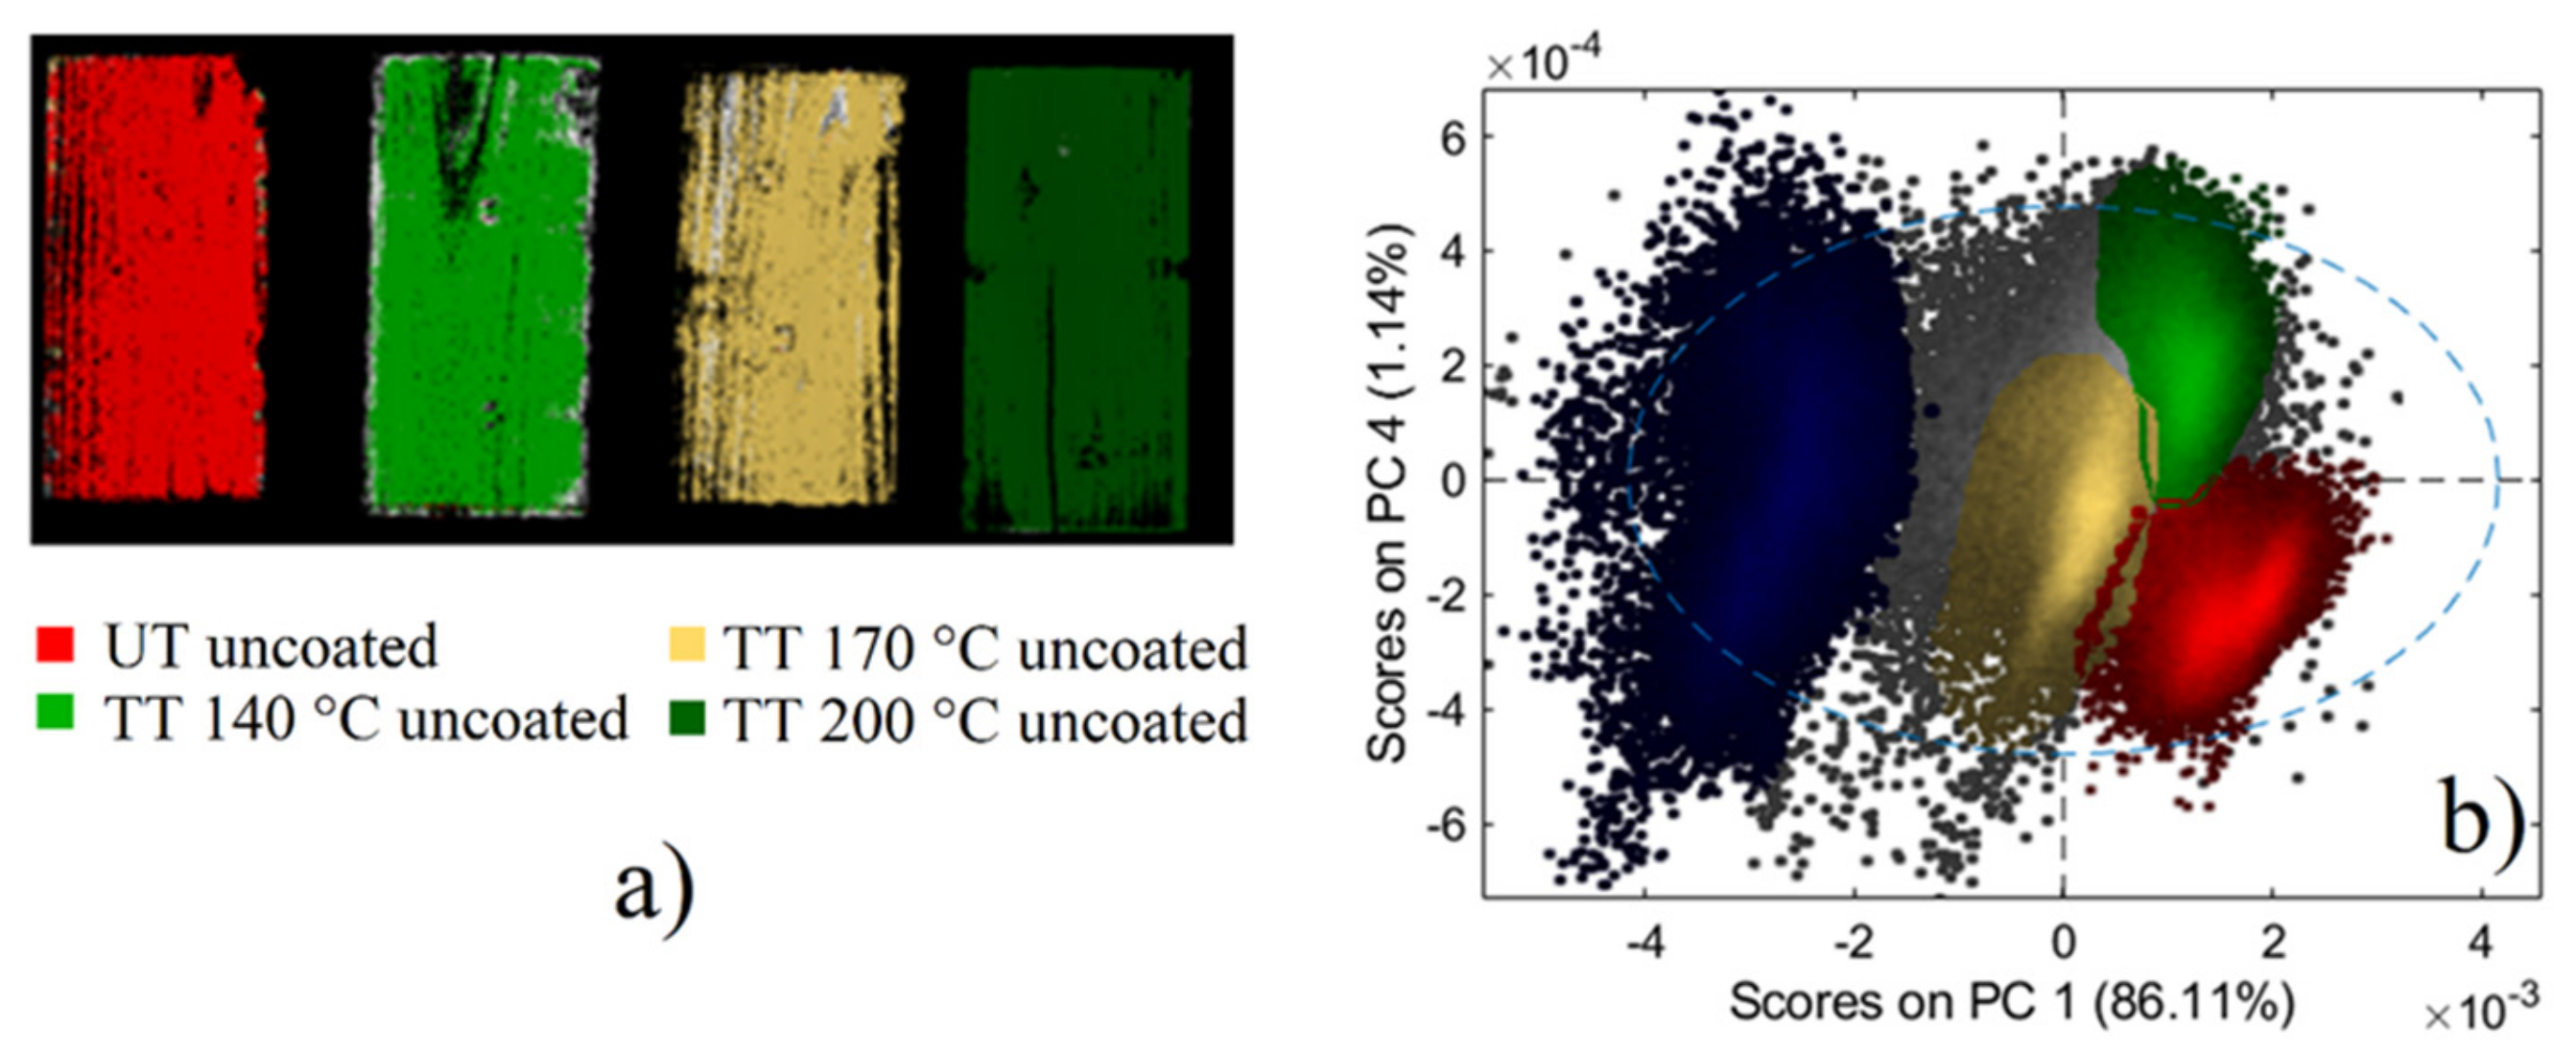
To separately evaluate the differences due to the three thermal treatments on the uncoated and coated specimens, two different PCAs were performed: one comparing uncoated specimens, untreated and thermally treated (
Figure 10), and the other comparing coated specimens, untreated and thermally treated (
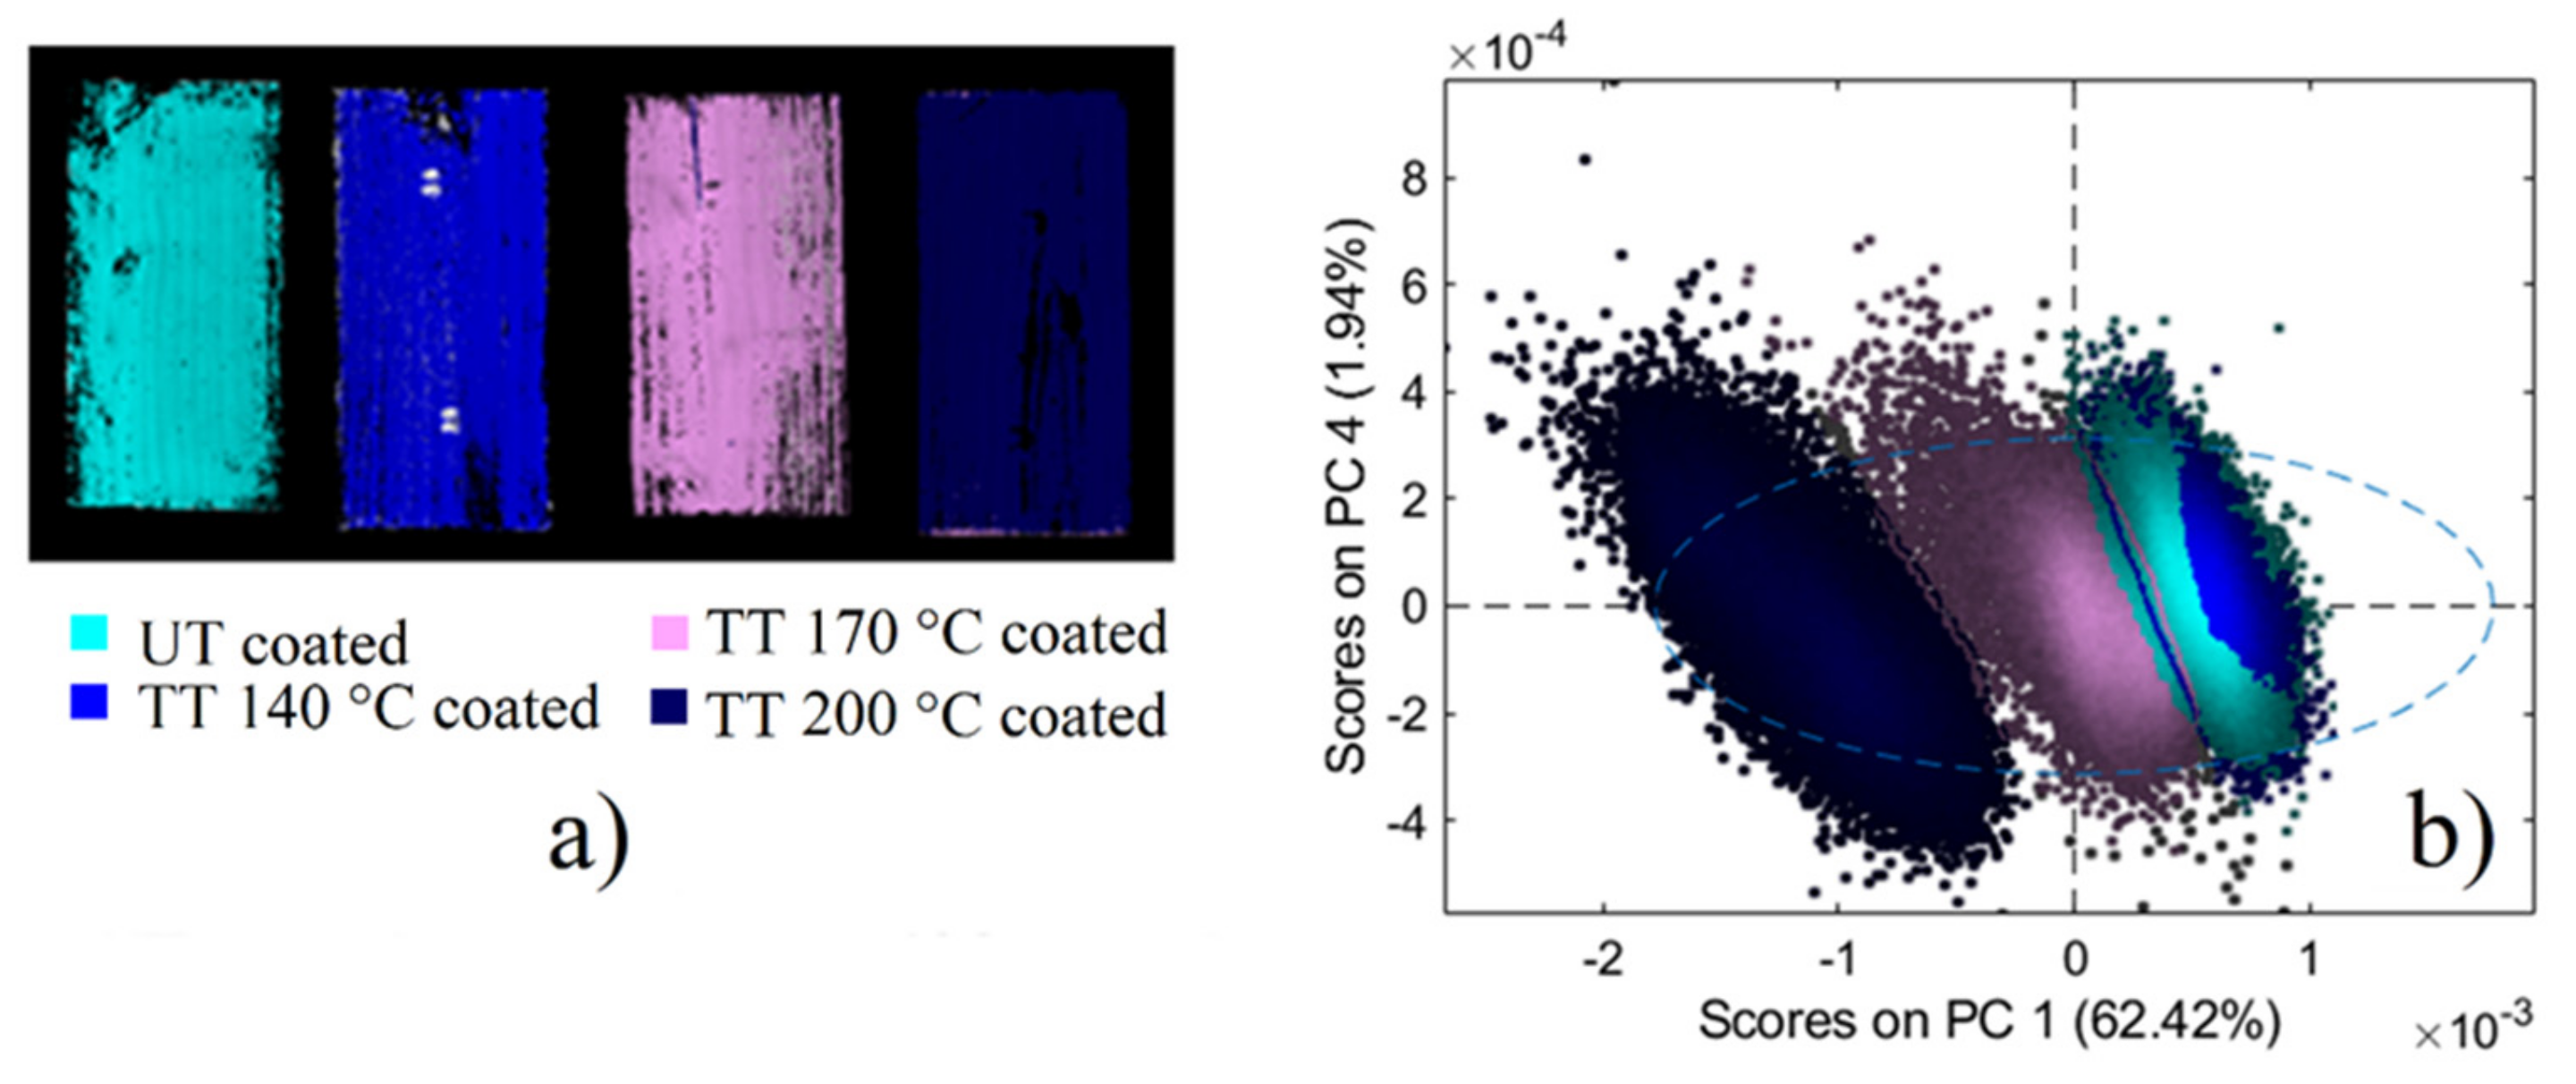
Figure 11). The PCA score plots make evident the separation of both uncoated and coated specimens thermally treated at 200 °C from the other ones. UT and 140 °C TT specimens, coated with Idrolinfo, are not well-separated in the PCA score plot, suggesting the low effect of temperature on wood characteristics: the application of the coating further homogenises the surfaces, making the coated specimens, UT and TT at 140 °C, slightly distinct. The 170 °C treated wood, both uncoated and coated, is separated in the PCA score plot, the point cloud being closer to that of 140 °C TT and UT than to that of 200 °C TT specimens.
In the case of uncoated wood, the variance of all specimens was explained by the first and the fourth principal components (
Figure 10). PC1 highlights the variation between TT 200 °C uncoated from other specimens, while PC4 highlights the spectral variance between TT 140 °C uncoated and TT 170 °C uncoated specimens. In detail, the PCA score plot highlights a low separation between TT 140 °C and TT 170 °C uncoated specimens, whereas the pixel clouds of UT uncoated and TT 200 °C uncoated appear well separated and distinct.
PCA score plots of coated specimens’ data show significant changes regarding the thermal treatments (
Figure 11). The variance of all specimens is explained by the first and the fourth principal components. PC1 highlights the variation between TT 200 °C coated and the other specimens, while PC4 highlights the low spectral variance between TT 140 °C, TT 170 °C, and UT coated specimens. Additionally, in this case, the pixel cloud of TT 200 °C specimens appears well-separated and distinct.
In order to validate the spectral differences detected by PCA and evaluate the possibility of recognising all treatment (heat and coating) specimens, an eighth class hierarchical PLS-DA model was defined. The results in terms of Sensitivity and Specificity confirm the good quality of the model, ranging from 0.925 to 0.999, both in calibration and cross-validation (
Table S1 in Supplementary Materials).
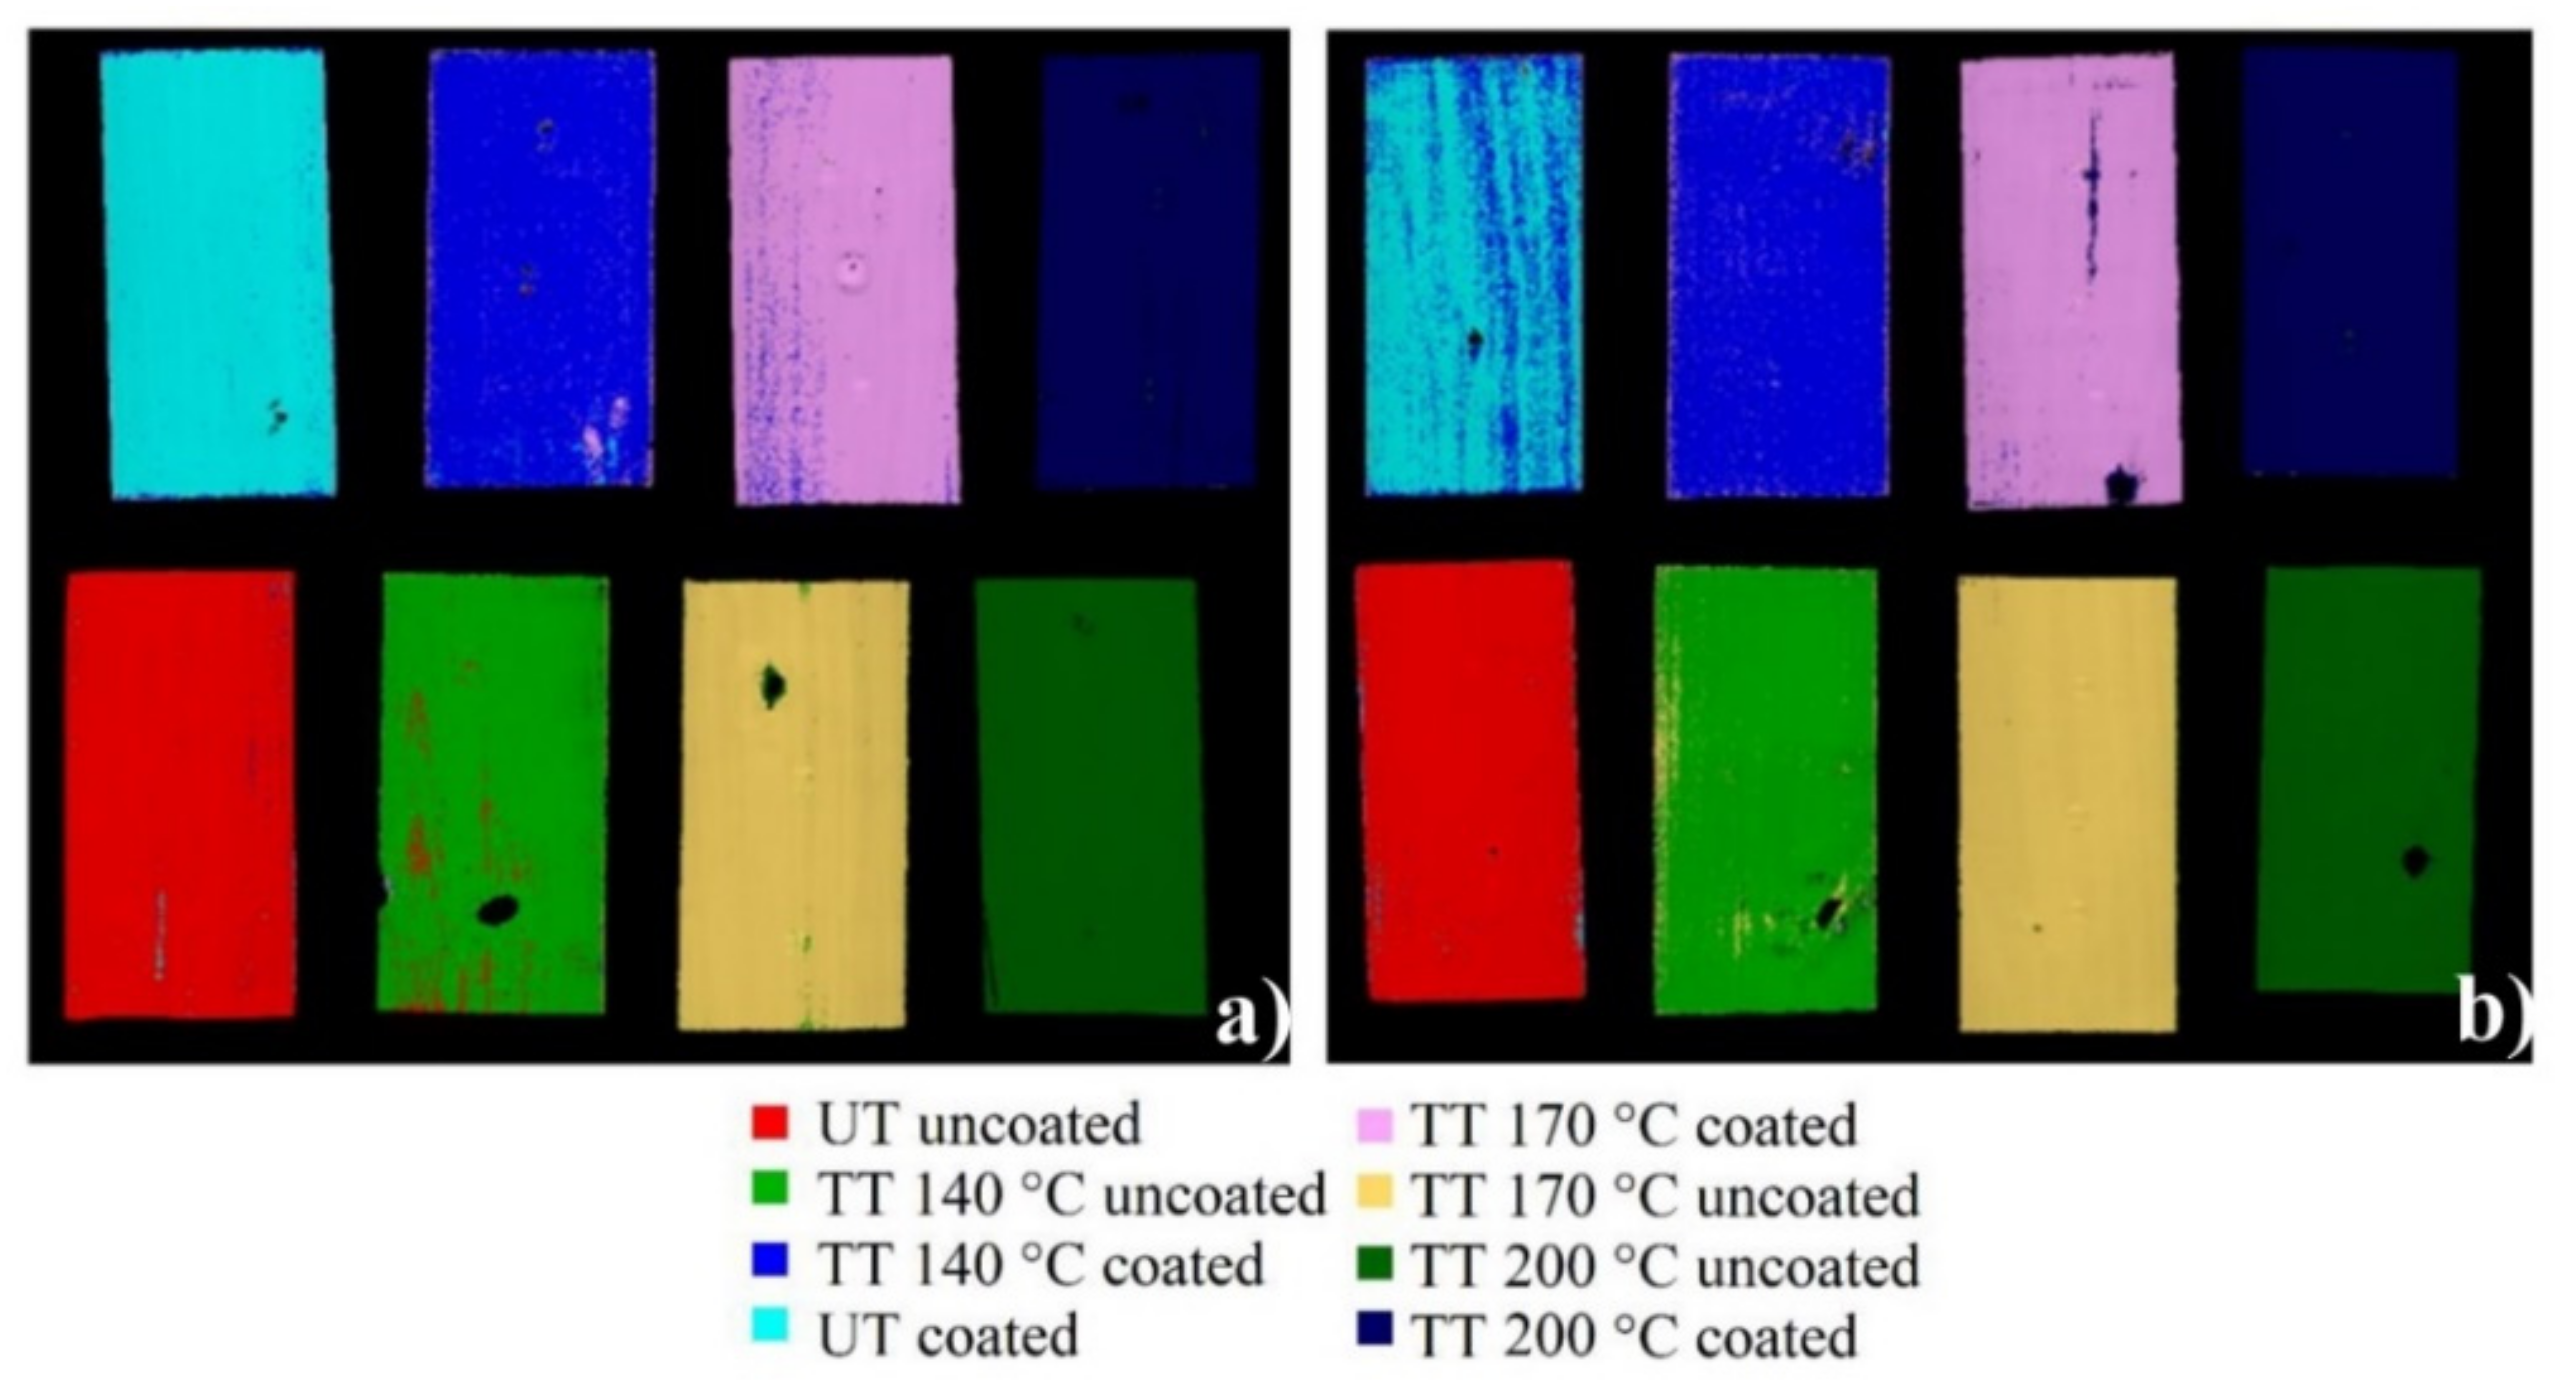
The obtained prediction maps of the validation sets are reported in
Figure 12, whereas the performance metrics of the classification models applied to the validation sets are shown in
Table 3, in terms of Sensitivity and Specificity.
The results in terms of prediction images (
Figure 12) are in agreement with those of the calibration phase, concerning the confusion among classes. Classification results are quite good for all validation sets. In more detail, the UT coated class is properly identified, even if some pixels are not correctly assigned due to the low spectral variation with respect to 140 °C TT coated specimens. This result further confirms the low spectral difference between the untreated specimens and the specimens treated at 140 °C. Besides in the validation test, the main misclassification error was detected in the recognition of the untreated specimen from those treated at 140 °C and coated, confirming that the effect of the lower temperature has little influence on wood surface properties. Concerning the other classes, HI-PLSDA prediction maps were characterised by a few dispersed misclassified pixels, mainly due to the surface defects and to the presence of a border effect among the various analysed specimens. However, the pixels not correctly classified do not affect the correct identification of the class. The performance of the four models in terms of Sensitivity and Specificity (
Table 3) confirms the evaluation based on the prediction images. Sensitivity ranges from 0.970 (“TT 140 °C coated” class) to 1 (UT uncoated and TT 140 °C uncoated), and specificity ranges from 0.781 (“UT coated” class) to 1.00 (“TT 200 °C uncoated” classes).
The results obtained by the different techniques highlighted numerous variations and complex interactions, and for these reasons, in order to summarise in short the main findings, a synthesis is reported in
Table 4.
4. Conclusions
In this work, the effect of a water-based coating on both untreated and thermally treated chestnut wood was investigated and the surface properties were examined.
The multi-technique approach proposed in the present paper allowed for obtaining a complete study of the behaviour of chestnut wood in regard to thermal treatments and coating application. All these techniques were demonstrated to be useful to evaluate the effect of the water-based coating, named Idrolinfo, and the most suitable heat treatment. Each technique supplied specific information on the wood surface: colour, roughness, contact angle, micro-hardness, abrasion and hyperspectral data. Hyperspectral analysis, combined with multivariate classification techniques, allows the identification of protective products on wood surfaces and emphasises, through suited reprocessing methods, the spectral characteristics of the products, making possible their identification on the examined specimens. Specifically, the study showed that the temperature improving wood surface mechanical properties without affecting its characteristics is 170 °C. Idrolinfo demonstrated its validity when applied to untreated and heat-treated wood at 140 °C and 170 °C, causing little change in colour, improving micro-hardness, making the wood surface more homogenous and increasing the hydrophobicity. Concerning the HSI data, the proposed study showed the potentiality of hierarchical models to identify similar spectral elements with low spectral variability.
Further research is needed to monitor over time the behaviour concerning the ageing and weathering of thermally treated and coated chestnut wood.


 ,
, 


