Article

Effect of Edible Carboxymethyl Chitosan-Gelatin Based Coating on the Quality and Nutritional Properties of Different Sweet Cherry Cultivars during Postharvest Storage

1
College of Agricultural Engineering, Shanxi Agricultural University, Taigu 030801, China
2
College of Food Science and Engineering, Shanxi Agricultural University, Taigu 030801, China
3
Experimental Teaching Center, Shanxi Agricultural University, Taigu 030801, China
*
Author to whom correspondence should be addressed.
Coatings 2021, 11(4), 396; https://doi.org/10.3390/coatings11040396
Submission received: 8 March 2021 / Revised: 24 March 2021 / Accepted: 26 March 2021 / Published: 30 March 2021
(This article belongs to the Special Issue Sustainable Films and Coatings for Food Packaging)

Abstract

:
Sweet cherry has many cultivars with different storability and nutritional properties. To reveal the reasons for the differences in storability among cultivars and improve the quality of sweet cherries, the surface microstructure of four representative sweet cherry cultivars (Red Light, Ranier, Red Agate, Friendship) epidermis and peduncle at harvest were examined and the effects of carboxymethyl chitosan-gelatin (CMCS-GL) based edible coating incorporating CaCl2 and ascorbic acid (AA) (AA-CaCl2-CMCS-GL) on the quality and nutritional characteristics of sweet cherry were evaluated. Results showed there were significant differences in the wax distribution of the epidermis and the number of stomata on the peduncle surface between four cultivars of sweet cherries at harvest, which was closely related to fruit decay ratio during storage. AA-CaCl2-CMCS-GL coating delayed the onset of decay and the fruit decay ratio in coated groups (3.0%–15.3%) was significantly lower than in control groups (17.7%–63.0%) after 33 d storage. The coating also helped to maintain the quality and nutritional characteristics of four sweet cherry cultivars, including reducing weight loss, maintaining better skin color, peduncle freshness, higher fruit firmness, titratable acidity, AA, total phenolics content, total anthocyanins concentration, and antioxidant capacity. These results suggested that AA-CaCl2-CMCS-GL coating could be considered as a new preservation method for improving postharvest quality and nutritional properties of different sweet cherry cultivars.

1. Introduction

Sweet cherries (Prunus avium L.) are valued by consumers because of their precocity, bright color, sweet and sour taste, rich nutrition, and antioxidant activity [1,2]. Production and consumption of sweet cherries have increased in recent years as consumers have appreciated their wealth of polyphenols and other substances beneficial to human health [1,2,3]. Sweet cherries are mostly consumed fresh [1] and are highly perishable [4].
Edible coatings are made from natural food-grade materials such as polysaccharides, proteins, lipids, or their complexes, which can be eaten. Chitosan (CS)-based edible coating has been used to improve the quality and shelf life of sweet cherries during storage [5,6,7,8], However, chitosan is insoluble in water and general organic solvents, it can only be dissolved in acidic solutions below pH 6.3, which is not convenient for consumers to clean before eating, and the bad smell produced by acidic solutions may affect the aroma of fruits and vegetables, which limits its application in the preservation of fruits and vegetables [9]. Carboxymethyl chitosan (CMCS) is an amphoteric derivative of CS. Due to its large number of carboxyl groups, it has better water solubility, biocompatibility, and biodegradability than CS [10,11]. CMCS can be dissolved at a wider pH range, including pure water, and, because of its good moisture and oxygen barrier properties, it can be used as a food packaging film [12]. Pure CMCS film is brittle, strongly hydrophilic, and has poor barrier and mechanical properties which limits its application in food packaging [12,13]. Gelatin (GL) is a natural water-soluble protein obtained by partially hydrolyzing collagen. Studies have shown that blending CS and GL improves the properties of edible films [14,15,16], but there is no research on the application of CMCS-GL based edible coating in the preservation of fruits and vegetables.
Edible coatings can be used as carriers of antioxidants, antibacterial agents, anti-browning agents, and nutritional fortifiers [17,18,19]. CaCl2 can be added to CS-based film as a crosslinking agent to improve the performance of edible film, and calcium ions can form an ionic bridge with the residues of the free carboxyl group of pectin galacturonic acid to strengthen the structure of the cell wall, thus improving the quality of fruit during storage [20]. As a safe and inexpensive antioxidant with a good antioxidant effect, ascorbic acid (AA) is an essential vitamin for human health. It can be obtained from fruits and vegetables, and AA has been proved to be effective in controlling the enzymatic browning of fruits and vegetables [21,22]. Studies also have shown that the mixing of CS with CaCl2 or/and AA improved the preservation of strawberries [23,24], pear [25,26], plum [21], papaya [27], litchi [28], fresh-cut honeydew melon [29], fresh-cut apples [22]. Therefore, in this experiment, the CMCS-GL based edible coating incorporating CaCl2 and AA (AA-CaCl2-CMCS-GL) was prepared for the preservation of sweet cherries. Many studies on the preservation of sweet cherries using edible coatings have focused on a single cultivar [5,7,30,31,32,33] with only a few studies investigating two or three cultivars [34,35]. However, different cultivars of sweet cherries have obvious differences in storability and nutritional quality. Therefore, it is necessary to select several representative cultivars for the coating experiment to examine the applicability of an edible coating to different cultivars of sweet cherries.
There are hundreds of sweet cherry cultivars, different genetic determines their differences in harvest time, peel color, fruit size, taste, and storability, etc. [2,36]. Among them, storability is a key factor that determines its commercial value. The epidermis tissue structure of fruits is closely related to its storability. More and more studies have shown that the epidermis wax of the fruit plays an important role in the quality, storability, and pathogen sensitivity of the fruit after harvest. For example, the wax content of the fruit epidermis directly determines the rate of water loss after harvested [37,38]. The stomata on the fruit epidermis are the main channels for its transpiration, and its state and quantity are also closely related to the postharvest water loss of the fruit. Other studies have shown that the stomatal density in the peduncle surface of sweet cherry is 40 times higher than that of the fruit surface, the permeability of the peduncle surface is higher than that of the fruit surface, the wax on the surface of the peduncle is the main rate-limiting barrier for its water loss by transpiration [39], which indicates that although the peduncle is not edible, it plays an important role in the storability during postharvest storage as a part of sweet cherries. However, there is no research on the wax and stomata distribution on the surface of the epidermis and peduncle for different sweet cherry cultivars.
Thus, the present study was to investigate the surface microstructure of the epidermis and peduncle for four sweet cherry cultivars (Red Light, Ranier, Red Agate, Friendship) and the effectiveness of AA-CaCl2-CMCS-GL edible coating on preserving the quality (including the fruit quality and peduncle freshness) and nutritional properties of four sweet cherry cultivars during postharvest storage.

2. Materials and Methods

2.1. Materials

2.1.1. Plant Materials

The four cultivars of sweet cherry with different types of maturity were harvested from 17 years old trees owned by the Pomology Institute, Shanxi Agricultural University (Taigu, Shanxi Province, China; 112°50′ E, 37°34′ N) during 2020 (Figure S1). The cultivar (abbreviation), types of maturity, harvest date, skin color, pulp color, and average fruit weight of sweet cherry are presented in Table 1.
After randomly sampling at the commercial ripening stage, fruit were immediately transported to cold storage (0 ± 0.5 °C, RH 85%–90%) in the laboratory until their core temperature dropped to 0 °C. Fruit were then screened for color, size uniformity, mechanical damage, disease, and insect pests. Finally, each cultivar of cherries was randomly divided into two groups.

2.1.2. Chemicals

CMCS, GL, glycerol, CaCl2, L-AA, 2,2-Diphenyl-1-picrylhydrazyl(DPPH), and glutaraldehyde, all analytical pure, were purchased from Macklin Biotechnology Co. Ltd. (Shanghai, China). Anhydrous ethanol, tween-20, potassium persulfate, calcium carbonate powder, acetone, quartz sand, all analytical pure, purchased from Tianjin Damao Chemical Reagent Factory, Tianjin, China; Methanol, potassium chloride, all analytical pure, purchased from Tianjin Fengchuan Chemical Reagent Technology Co., Ltd., Tianjin, China, 2,6-dichlorophenol indophenol sodium, Folin-Ciocalteu reagent, all analytical pure, purchased from Beijing Solaibao Technology Co., Ltd., Beijing, China; Gallic acid standard product, AA standard product, Beijing Solai bao Technology Co., Ltd. The rest of the chemical reagents were analytical grade.

2.2. Experimental Design

2.2.1. Preparation of AA-CaCl2-CMCS-GL Edible Coating Solution

Solutions of CMCS and GL at 2% (w/v) in distilled water were prepared separately by heating in a 60 °C water bath with continuous stirring until completely dissolved (~30 min), then cooled to 23 ± 1 °C. The solutions were mixed in a mass ratio of 2:1 (CMCS: GL, w:w), then based on the weight of the mixed solution of CMCS and GL, 2% CaCl2 powder, and 2% L-AA were added to the solution as the crosslinking agent and antioxidant with stirring at 23 ± 1 °C for 30 min in the presence of 1% glycerol and 0.1% tween-20 acting as plasticizer and surfactant (improve the wettability of coating solution on the surface of sweet cherry), respectively. After stirring overnight at 23 ± 1 °C, the mixture was centrifuged for 10 min at 4000× g to remove air bubbles and particulates (the impurities and insoluble components), and the supernatant was collected for later use.

2.2.2. Sweet Cherry Treatments and Storage Conditions

The four cultivars of sweet cherries were washed in tap water, dried at 23 ± 1 °C, immersed in AA-CaCl2-CMCS-GL edible coating solution for 2 min (including the fruit and its peduncle), then placed in a tray and dried completely in the air at 23 ± 1 °C. The control group was washed with tap water only. Treated and control samples were packed into 0.2 mm polyethylene terephthalate plastic boxes (157 × 118 × 72 mm3) with mesh holes, then stored at 0 ± 0.5 °C, RH 85%–90% for 30 d. Samples were taken every 6 d to measure the physical and chemical indicators. All determinations were carried out at 23 ± 1 °C, 2–3 h after removal from cold storage. After being refrigerated for 30 d, the remaining samples were stored at 23 ± 1 °C, RH 40%–50%, for 3 d to simulate shelf storage at room temperature, and samples were taken for analysis. As shown in Table 2, there were eight groups including the control.

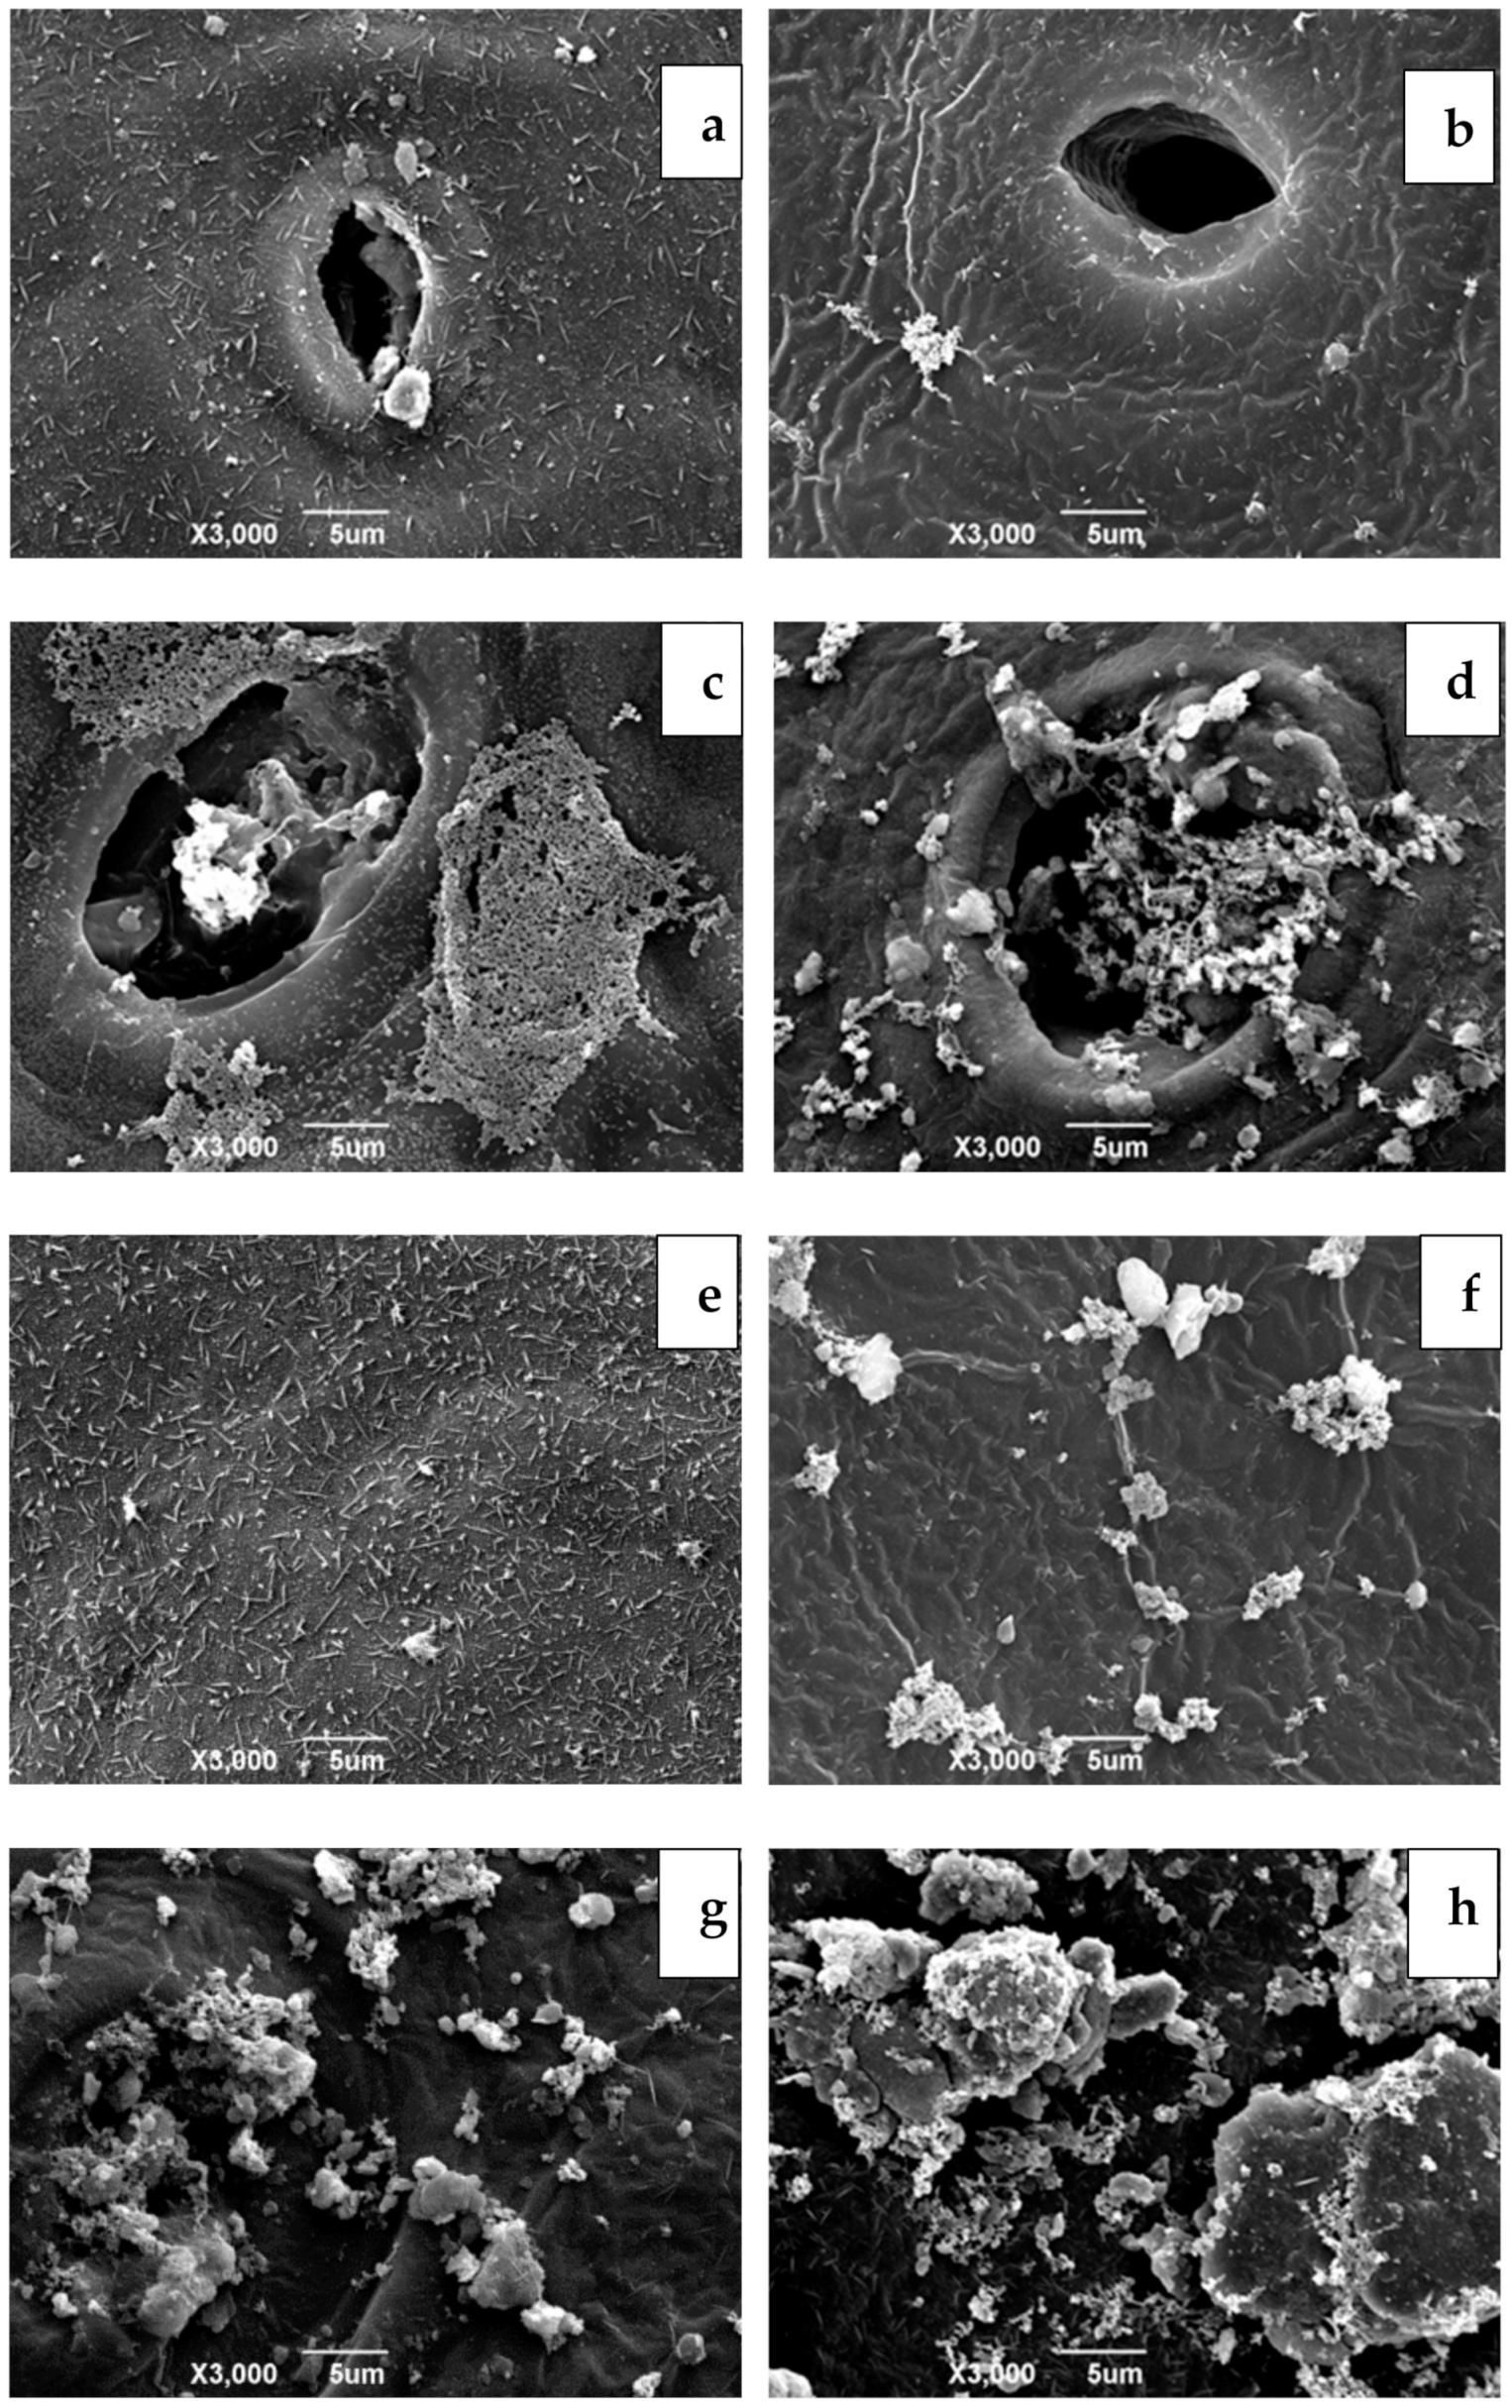
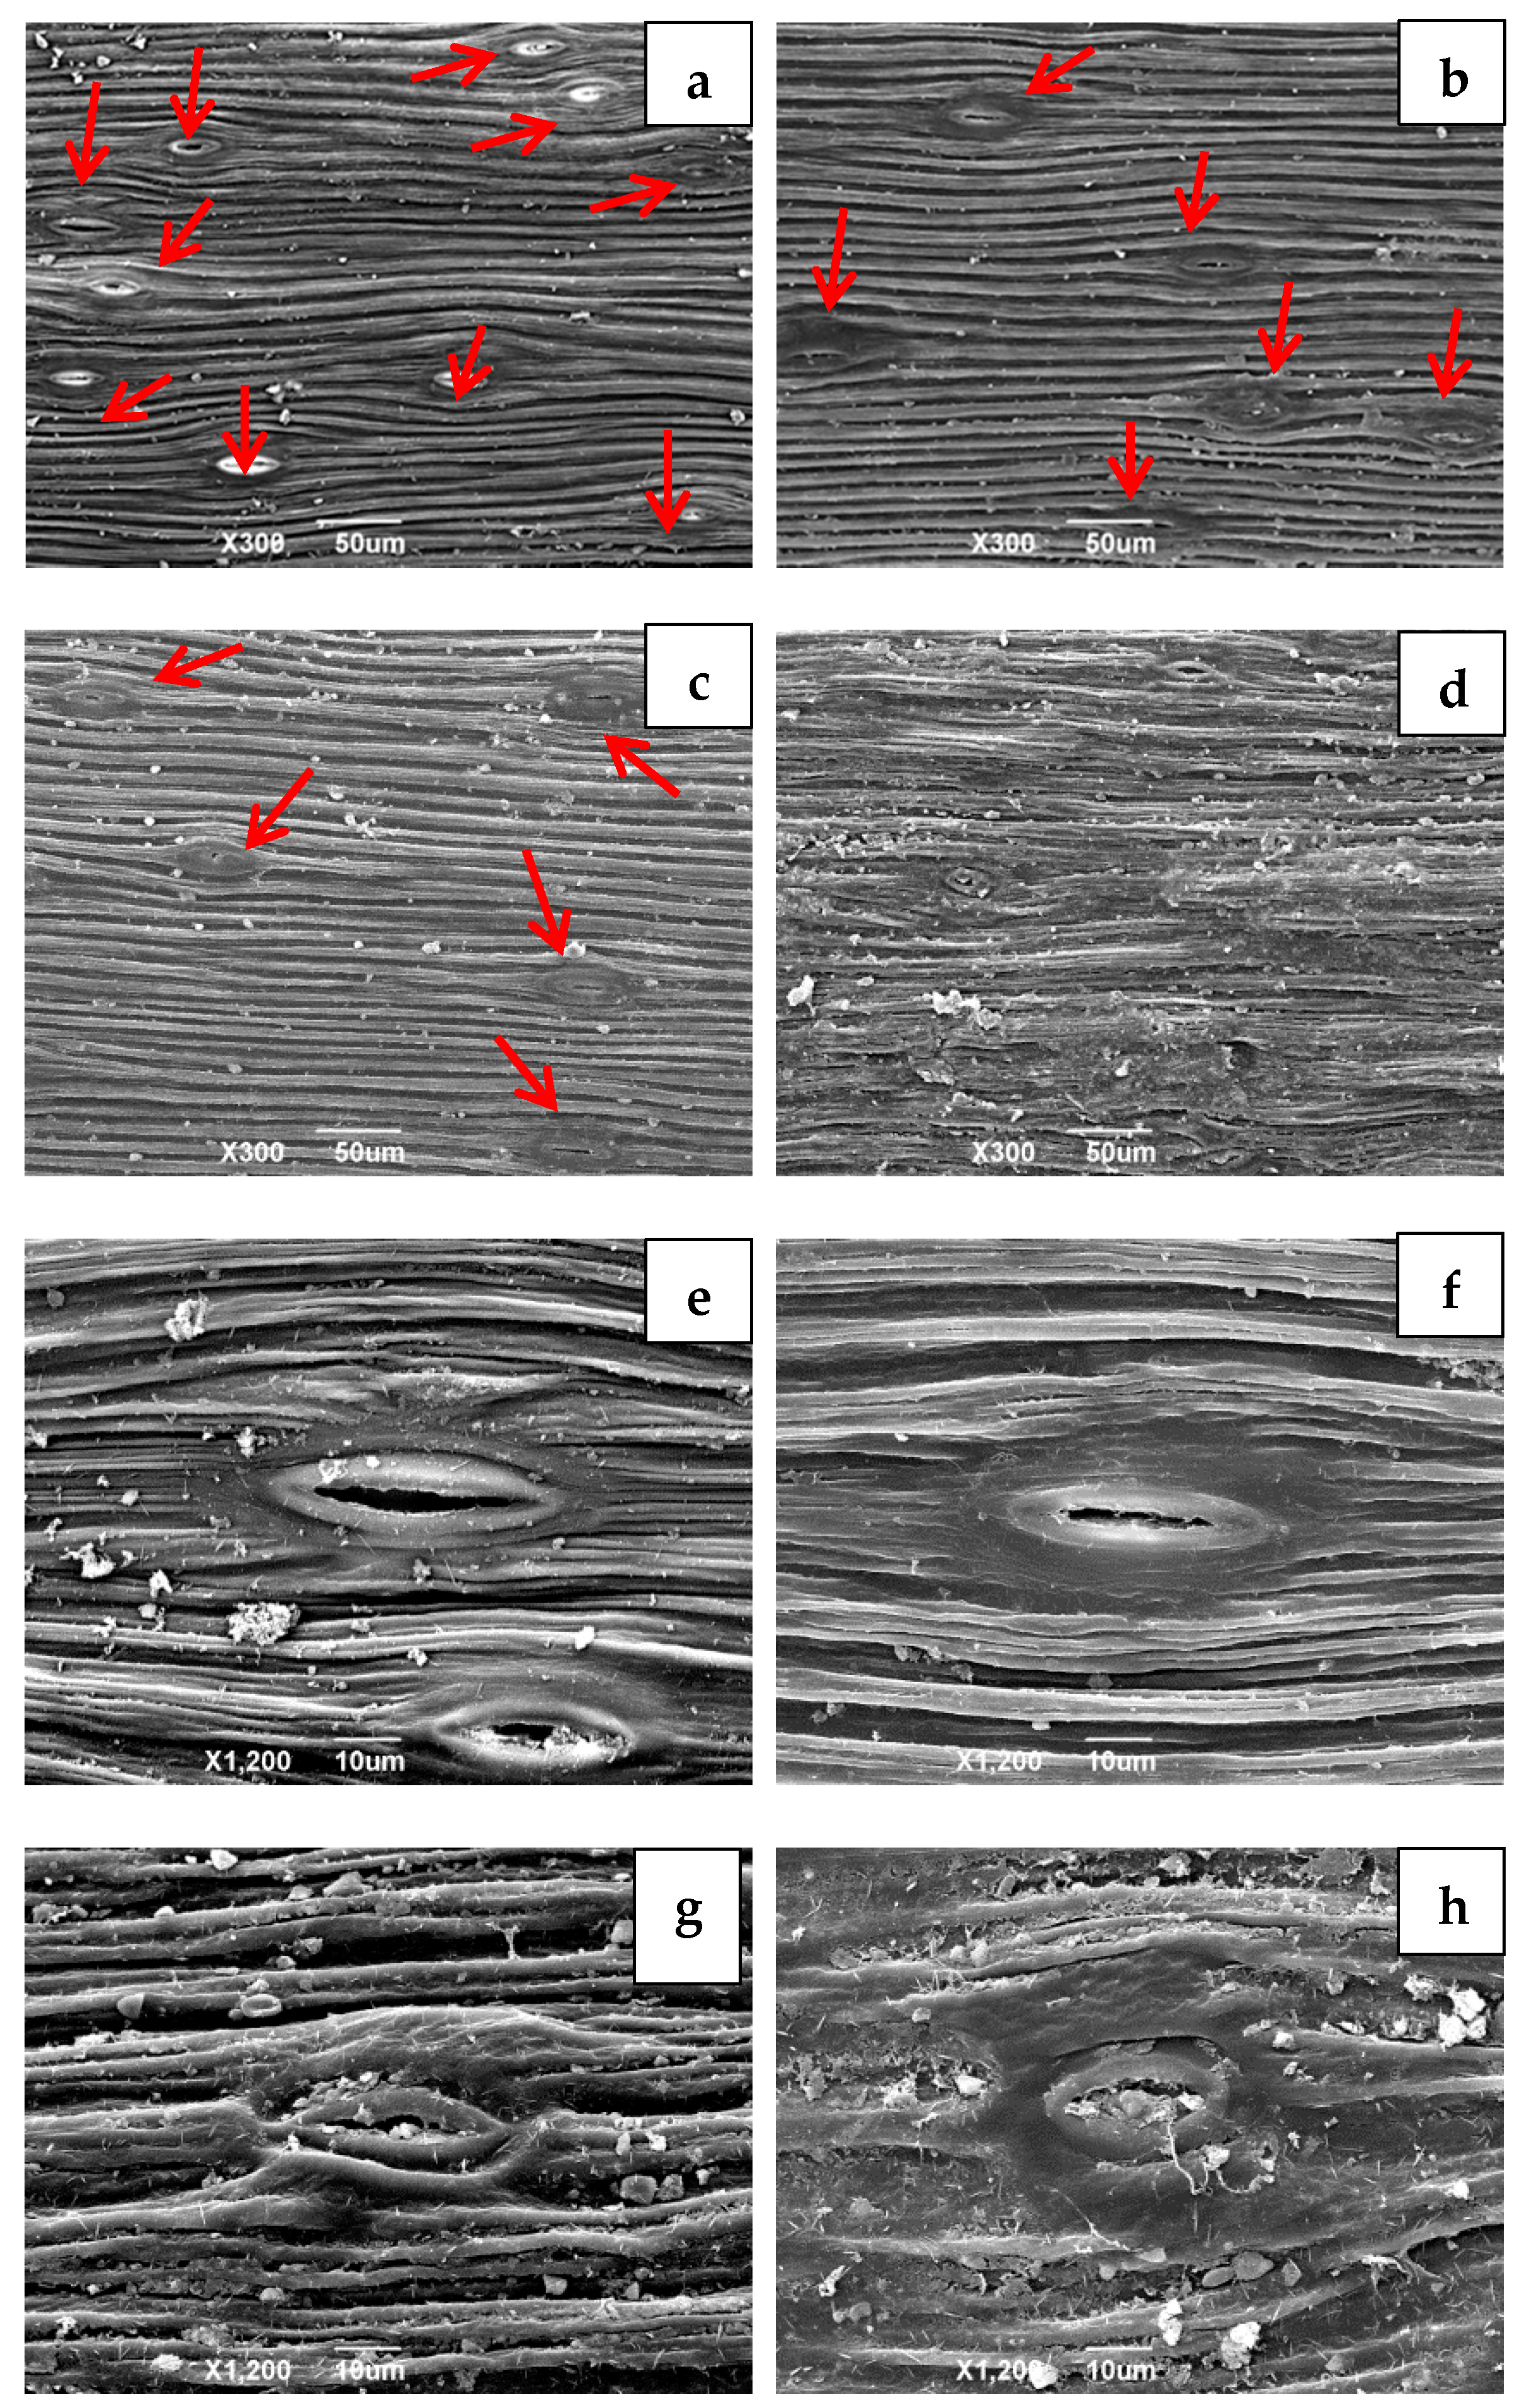
2.3. The Surface Microstructure Observation of Sweet Cherry Epidermis and Peduncle

A scalpel was used at harvest to sample the skin and peduncles of the four cherry cultivars, cutting the skin approximately 5 mm in length and 4 mm in width on the equatorial plane, and the middle of the peduncle approximately 5 mm in length. These were quickly placed in 3% glutaraldehyde fixative solution (0.1 mol·L−1, pH 7.0 phosphate buffer solution) and fixed at 4 °C for 2 d. After fixation, samples were rinsed three times with pH 7.0 (0.1 mol·L−1) phosphate buffer solution for 15 min then dried progressively in alcohol. Step by step dehydration used ethanol at concentrations of 30%, 50%, 70%, 80%, 90%, and 95%, for 15 min each time, followed by 100% ethanol dehydration twice for 20 min, then replacing the solvent with acetone. After critical point drying (model K850; Quorum Technologies Ltd., East Sussex, UK) was completed, the dried material was stuck on a sample stage with conductive tape, sprayed with platinum using an ion sputtering coater (model JFC-1600; JEOL, Tokyo, Japan) then placed under a scanning electron microscope (model JEM-6490 LV; JEOL, Tokyo, Japan) for morphological examination.

2.4. Measurement of Fruit Decay Ratio, Weight Loss, and Fruit Firmness

The fruit decay ratio of sweet cherry was determined by the methods of Wang et al. [40] and Aglar et al. [41]. One hundred randomly selected fruit per replicate were counted and three replicate analyses were carried out.
The decay ratio was evaluated visually and calculated as follows:
Fruit decay ratio (%) = (A1/A2) × 100
where A1 is the number of rotten fruit and A2 the total number of fruit. Rotten fruit were classified as having at least one visible rotten spot on the surface.
Weight loss of sweet cherry was expressed as a percentage of the initial total sample weight. A digital scale (±0.01 g; MAX-C6002; Shenzhen, China) was used to weigh approximately 300 g of fruit from each group, and determinations were performed in triplicate.
A texture analyzer (TA-TX Plus; Stable Microsystems, Godalming, UK), equipped with a cylindrical probe (P/36R), was used to measure fruit firmness. The compression speed was 2 mm/s and the compression depth 5 mm. The maximum force that the fruit endure during the compression process was defined as fruit firmness, and the result was expressed in N. Ten fruit from each group were tested and the mean value was calculated.

2.5. Measurement of Skin Color Characteristics

A colorimeter (model CM–5; Konica-Minolta, Tokyo, Japan) was used to measure the skin color (L*, a*, and b*) of sweet cherry on opposite sides of 30 fruit. The D65 was used as illuminant, and the observation angle was 10°. L*, chroma, and hue angle values were used to describe the skin color characteristics using the following calculations [6,21,41]:
Chroma = (a*2 + b*2)1/2
hue angle = tan−1(b*/a*)

2.6. Measurement of Peduncle Browning Incidence (PBI), Peduncle Moisture Content (PMC), and Peduncle Chlorophyll Content (PCC)

The PBI and PMC of sweet cherry were determined by the methods of Wang et al. [40] and Aglar et al. [41]. One hundred randomly selected fruit were counted, and three replicate analyses were carried out.
The PBI was calculated as follows:
PBI (%) = (A1/A2) × 100
where A1 is the number of fruit with >30% stem surface browned during postharvest storage and A2 is the total number of fruit.
The PMC was calculated as follows:
PMC (%) = [(A1 − A2)/A1] × 100
where A1 is the original weight of the fresh peduncle and A2 is the final peduncle weight after drying at 80 °C.
PCC was determined with the acetone extraction method of Mackinney [42] with some modification. Chlorophyll in the peduncle was extracted with 80% acetone and the absorbance of the extract measured at 645 nm and 663 nm. PCC was calculated as follows:
PCC (mg·kg−1) = 20.29 A645 + 8.05 A663

2.7. Measurement of Soluble Solids Content (SSC), Titratable Acidity (TA), and AA Content

For the measurement of SSC and TA, 30 fruit were randomly selected from each group and weighed after removing the cores. A juicer (model WBL2501B; Midea, Guangdong, China) was used to extract the juice at 2000 g. The juice was centrifuged for 20 min at 10,000× g at 4 °C (model 5804R; Eppendorf, Germany). SSC in the supernatant was measured using a Pocket Refractometer (model PAL-1; Atago, Tokyo, Japan). TA was measured by titrating 20 mL of diluted fruit juice with 0.1 M NaOH solution to pH 8.1. SSC and TA were expressed as % and g malic acid per kg fresh weight (g·kg−1), respectively [7,41].
The AA content of sweet cherry was determined using the 2,6-dichloroindophenol titrimetric method of Zam [8] with a slight modification. To avoid interference from the AA added to the edible film, AA content was only determined in the cherry pulp. Fruit pulp (~10 g) mixed with 20 g/L oxalic acid solution was ground in an ice-cooled mortar. The extract was centrifuged at 4 °C for 20 min at 10,000× g and the supernatant titrated with 2,6-dichloroindophenol to a rose pink color lasting for 15–20 s. AA concentration was expressed as mg per kg fresh weight (mg·kg−1).

2.8. Measurement of Total Phenolics Content (TPC), Total Anthocyanins Concentration (TAC), and Antioxidant Activity

Preparation of extraction solution: fruit tissue (2.0 g) was homogenized with a little precooled 1% HCl-methanol solution in an ice bath, then transferred to a 20 mL graduated, stoppered test tube, and made up to 20 mL with 1% HCl-methanol solution. After extracting for 20 min at 4 °C, the solution was centrifuged at 4 °C for 20 min at 10,000× g. The supernatant was collected and used for the determination of total phenolic and anthocyanin concentrations, and antioxidant activity.
Folin–Ciocalteu reagent was used to determine TPC based on the method described by Abdipour et al. [7]. The absorbance at 725 nm of the solution after the reaction was measured by a UV-visible spectrophotometer (P4; Shanghai Mapada Instruments, Shanghai, China). TPC was expressed as mg gallic acid equivalent (GAE) per g fresh weight (mg·kg−1) (Figure S2).
TAC was determined by the pH differential method described by Aglar et al. [41] and expressed as mg of cyanidin-3-glucoside equivalents (cy-3-glu) per fresh weight (mg·kg−1).
Antioxidant activity was evaluated based on 2,2-diphenyl-1-picrylhidrazyl (DPPH) radical scavenging capacity (RSC) method proposed by Abdipour et al. [7] with some modification. A standard curve was plotted using different concentrations of AA (0–100 μg·mL−1) (Figure S3). The results were expressed as mg ascorbic acid equivalent (AAE) per g FW (g·kg−1). All analyses were performed in triplicate.

2.9. Statistical Analysis

The experiment was performed using a randomized design. Results were expressed as mean ± standard deviation and analyzed by one-way analysis of variance using IBM SPSS Statistics for Windows (SPSS Inc., Chicago, IL, USA). Duncan’s multiple range test was used for mean separations and p < 0.05 was considered significant. Relationships between different parameters were determined by Pearson’s correlation.

3. Results

3.1. Microstructure of Sweet Cherry Epidermis and Peduncle Surface at Harvest

Differences in stomatal morphology, wax distribution, and morphology around the stomata are shown in Figure 1. Stomata on the peel of RL were small with a small amount of granular wax and more filamentous wax scattered around (Figure 1a); stomata on RN were slightly larger with a small amount of granular and filamentous wax around the stomata (Figure 1b); stomata on RA were larger than on RL and RN, with more flaky wax distributed inside the stomata and a large amount of film-like wax distributed around the stomata (Figure 1c); while stomata on FS were larger than the other varieties with a large amount of granular wax distributed in and around the stomata and some of the granular wax connected by filamentous wax (Figure 1d).
Figure 1 also shows the distribution and morphology of epidermal wax on the skin. Most of the RL epidermal wax was filamentous with a small amount of granular wax (Figure 1e); a small amount of uneven granular wax connected by a small amount of filamentous wax was distributed on the epidermis of RN (Figure 1f); RA had more wax than RN on the epidermis and was granular with uneven sizes (Figure 1g); while FS had the most wax, covering almost all of the epidermis with large, waxy particles (Figure 1h).
Figure 2 illustrates the number of stomata, wax distribution, and morphology of the surface of the peduncles at ×300 magnification. There were ten stomata on the surface of the RL peduncle (the most abundant among the four varieties) with a small amount of granular wax distributed on its surface (Figure 2a); there were six stomata on the surface of the RN peduncle with a very small amount of wax (Figure 2b); RA had five stomata and more wax than RL and RN (Figure 2c); while the surface of the FS peduncle had no stomata visible to the naked eye at this magnification and the epidermis was covered with a large number of granular waxes of varying sizes (Figure 2d).
Figure 2 shows the stomata, wax distribution, and morphology of the peduncle epidermis at ×1200 magnification. A small amount of uneven granular wax was distributed on the surface of the RL peduncle with more wax distributed on the edge of the lower stomata (Figure 2e); there was a very small amount of granular wax on the surface of the RN peduncle (Figure 2f); more granular and filamentous wax was evident on the surface of RA peduncle (Figure 2g), while the surface of the FS peduncle showed a large amount of granular and filamentous wax and more wax around the stomata (Figure 2h).

3.2. Fruit Decay Ratio, Weight Loss, and Fruit Firmness

The fruit decay ratio, weight loss, and fruit firmness during storage of control and treated sweet cherries are shown in Table 3. The time and rate of decay of the varieties varied during storage. RL-C was beginning to rot after 12 days of storage while FS-T did not show any rot until day 30. The fruit decay ratio of RL-C was significantly higher than the other varieties from day 12 to 30 and the ratios of RL-C, RN-C, and RA-C were significantly higher than FS-C on day 33. FS-T had the lowest decay ratio (3.0%) which showed that of the four varieties RL was the least suitable for long-term storage, followed by RN and RA, while FS could be used for long-term storage. The AA-CaCl2-CMCS-GL coating treatment delayed the onset of decay and the decay ratio after treatment was significantly lower than the control groups.
Weight loss in all groups continued during storage (Table 3). From day 18 to day 33 of storage the weight loss of FS-C was the highest, followed by RN-C, both being significantly higher than RL-C and RA-C. There was no significant difference between RL-C and RA-C on day 18 and 24. Of the control groups, weight loss in RA-C was the lowest by day 30 and 33 (8.01% and 10.75%, respectively) which were significantly lower than the other controls. From day 12 the weight loss of all the treatment groups was significantly lower than their control groups with RA-T consistently being the lowest. On day 33, the order of weight loss in the treatment group was RA-T < RL-T < RN-T < FS-T.
The fruit firmness of the cultivars was different at the beginning of storage. FS-C was the firmest (23.87 N), RA-C was the next firmest (20.73 N), while there was no significant difference between RL-C (19.49 N) and RN-C (19.65 N). During storage, the firmness in all groups decreased continuously. From day 12 firmness of the coated groups was significantly higher than the control groups. At the end of storage, the order of fruit firmness in the coated groups was RL-T < RN-T < FS-T < RA-T.

3.3. Skin Color Characteristics

The skin color of sweet cherry is used as an indicator of quality and ripeness, and thus determines acceptability by consumers [43]. At the beginning of storage, the four cultivars exhibited significant differences in skin color characteristics (L*, chroma, and hue angle; Table 4). Values of L*, chroma, and hue angle for RN-C were significantly higher than the other control groups. The value of L* in the four coated groups was significantly higher than the control groups.
During storage, the skin color in all groups darkened, with L* values decreasing, although this change was slower in coated groups than control groups. Except for RA, the chroma value tended to increase then decrease (RA showed a continuous downward trend). At the end of storage chroma and hue angle of all coated groups were significantly higher than their control groups.

3.4. PBI, PMC, and PCC

Green and turgid peduncles on sweet cherry are indicative of postharvest freshness, whereas yellow or brown and shriveled peduncles imply an aged fruit (Knoche et al., 2015; Linke et al., 2010). PBI, PMC, and PCC during storage of control and treated sweet cherries are shown in Table 5.
The PBI of all groups was zero at harvest but varied during storage. In the first 18 days of storage, PBI increased faster than from day 24 to day 33. From day 6 to the end of storage PBI in the coated groups was significantly lower than in their control groups, which indicated that the AA-CaCl2-CMCS-GL coating significantly improved PBI. The PBI of RL-C was consistently the highest and FS-T was the lowest. At the end of storage, the order of PBI in treated and control groups was FS-T(FS-C) < RN-T(RN-C) < RA-T(RA-C) < RL-T(RL-C).
The PMC of RN and RA was significantly higher than RL and FS at harvest. During cold storage up to day 30, PMC of all groups showed a slow downward trend. During storage at room temperature (day 30 to 33), PMC in all control groups decreased rapidly. Compared with day 30, the PMC of RL-C, RN-C, RA-C, and FS-C decreased by 31.6%, 26.1%, 31.3%, and 14.2%, while RL-T, RN-T, RA-T, and FS-T decreased by 14.3%, 12.1%, 6.4%, and 11.8%, respectively. This showed that coating treatment could effectively reduce water loss from the peduncle during storage, particularly at room temperature.
The PCC of the four varieties was not significantly different at harvest. In the first six days of storage, there were no significant differences between control and coated groups of each variety. During storage coating treatment had different effects on PCC of different varieties. For example, the PCC of RL-T was significantly higher than RL-C from day 12 onwards. FS-T was significantly higher than FS-C from day 18, and RA-T was significantly higher than RA-C on day 18, 30, and 33. On day 30 and 33 the PCC in the coated groups were significantly higher than their controls, indicating that the AA-CaCl2-CMCS-GL coating could delay the degradation of PCC, but to varying extents depending on the cherry variety.
As shown in Table 6, PBI had a very significant negative correlation with PMC and PCC, while PMC showed a very significant positive correlation with PCC.

3.5. SSC, TA, and AA Content

SSC and TA are key factors affecting the eating quality of sweet cherries [17,44] and AA is one of the most important nutrients in many fruit [45]. Changes in these characteristics during storage are shown in Table 7. At harvest, the order of SSC in the cherries was RA-C < FS-C < RL-C < RN-C. TA order was RA-C < RN-C < FS-C < RL-C, while AA order was RN-C < RA-C < RL-C < FS-C.
SSC showed an upwards trend in all groups during storage. On day 12 there was no significant difference in SSC between the coated and control groups of each cultivar. From day 18 to the end of storage SSC in the control groups was significantly higher than in the coated groups, which indicated that the AA-CaCl2-CMCS-GL coating inhibited the
rise in SSC. At the end of storage the order of SSC was RA-T < RA-C < FS-T < FS-C < RN-T < RN-C < RL-T < RL-C.
The TA and AA contents in all groups showed a downward trend during storage. From day 6 onwards the TA of all coated cherries (and from day 12 for AA content) was significantly higher than their control group, indicating that the coating treatment could inhibit decomposition of TA and AA.

3.6. TPC, TAC, and DPPH RSC

Sweet cherries contain a variety of phenolic substances and high concentrations of anthocyanins which improve antioxidant activity and are beneficial to human health [46]. TPC, TAC, and DPPH RSC during storage of control and treated sweet cherries are shown in Table 8. The varieties exhibited significant differences in all these parameters at harvest and during storage, RL consistently being the highest and RN the lowest.
The phenolics content in all groups showed a downward trend during storage. In the first six days of storage, there was no significant difference in TPC between the control and coated groups. On day 12 there was no significant difference in TPC between the control and coated groups of RL and RA, while the coated groups of RN and FS were significantly higher than their controls. From day 18 to the end of storage TPC of all coated groups was significantly higher than their control group, indicating that coating could sustain TPC during storage. At the end of storage, the order of TPC in the coated groups was RN-T < FS-T < RA-T < RL-T.
TAC showed a downward trend during storage except for RL which increased first then decreased. During storage, there was no significant difference between TAC in RN control and coated groups. However, from day 18 the TAC of the other coated groups was significantly higher than their control groups.
The DPPH RSC of all groups showed a downward trend during storage. On day 6 DPPH RSC of coated groups was higher than their control group, except FS. From day 12 to the end of storage the coated groups were all significantly higher than their control group. At the end of storage, the order of DPPH RSC in the coated groups was FS-T < RN-T < RA-T < RL-T.

3.7. Correlations between Skin Color Characteristics, TPC, TAC, and DPPH RSC

As shown in Table 9, L* had a very significant positive correlation with chroma and hue angle, and a very significant negative correlation with TPC and TAC. Chroma had a very significant positive correlation with hue angle and a very significant negative correlation with TAC. Hue angle had a very significant negative correlation with TPC and TAC, and a significant negative correlation with DPPH RSC. TPC had a very significant positive correlation with TAC and DPPH RSC. TAC had a very significant positive correlation with DPPH RSC. These results indicate that the skin color of sweet cherry correlated with TPC, TAC, and antioxidant to varying degrees.

4. Discussion

In this study, four different sweet cherry cultivars: one precocious cultivar (RL), two medium maturity cultivars with different skin colors (RN, and RA), and one serotinous cultivar (FS) were chosen. To elucidate the reasons for differences in storability we examined the microstructure of the cherry epidermis and the peduncle surface at harvest. The quality and nutritional characteristics of the four sweet cherry cultivars with and without AA-CaCl2-CMCS-GL coating were measured during storage.
Sweet cherries are susceptible to microbial infection and rot during storage, which affects their quality and leads to economic losses due to shortened shelf-life [2,47]. Factors impacting shelf life include pre-harvest (cultivar, harvest time) and post-harvest factors (temperature and relative humidity of the storage environment, microbiological spoilage, packaging, etc.) [48]. Of these, the cultivar is a critical factor affecting quality after harvest because the genetic make-up determines the structural and chemical compositions of the cultivar [49]. In this study, there were differences in the time and rate of decay of the four cultivars during storage. RL-C began to rot from day 12 of storage and its decay rate was significantly higher than the other varieties. FS-T did not produce any rotten fruit until day 30. By the end of storage, RL-C had the highest decay rate (63.0%) and FS-T the lowest (3.0%). This disparity may be related to characteristics of the different cultivars including surface characteristics, storage durability, and fruit chemistry, etc.
The surface characteristics of the four cultivars were examined. As expected, stomata morphology and wax distribution and morphology showed differences. The skin of RL had small amounts of granular wax and filamentous wax, while the skin of FS was almost completely covered in larger waxy particles. The waxy layer is the interface between the plant surface and the environment. When fungus adheres to and colonizes a plant’s surface it contacts the waxy layer first and then spores germinate and produce germination tubes. The completion of these processes often requires a humid environment but water droplets on the wax layer are difficult to aggregate [37]. Thus, wax forms a waterproof layer on the outermost surface which prevents the adhesion, invasion, germination, and reproduction of fungi and pathogenic bacteria. This may explain why FS had the lowest decay rate.
AA-CaCl2-CMCS-GL coating delayed the decay time of all cultivars. The decay rates of the coated groups were significantly lower than their control groups which may be related to the antibacterial properties of CMCS [12] and the addition of calcium to the coating [40,47]. Calcium inhibits decay by making the cell wall less susceptible to the degrading enzymes produced by pathogens, thus improving cell stability [50].
The weight loss of stored fruit and vegetables is mainly caused by water loss through transpiration and respiration [48,51]. Sweet cherries are an extremely perishable fruit due to their high surface/volume ratio and low resistance to epidermal diffusion [6]. In this study weight loss in all groups showed an upward trend which is consistent with the results of Zam [8], Pettricione et al. [6], and Dong and Wang [52]. Studies have shown that the wax on the surface of fruit and vegetables is closely related to water loss after harvest. Wax is a very effective barrier to water loss, its main physiological function being to prevent uncontrolled water loss via transpiration [37,53,54]. In this study, when stored for 30 and 33 days, the lowest weight loss was seen with RA-C, which may be due to its higher epidermal wax content. FS also had a higher epidermal wax content but due to its higher surface/volume ratio, it suffered greater weight loss during storage.
Fruit firmness is an important indicator of ripeness and storage quality [55]. During the ripening and senescence of sweet cherry firmness gradually decreases [6,30,32]. This is a result of protopectin decomposing to soluble pectin under the action of cell wall degrading enzymes such as pectin galactosidase, polygalacturonase, and pectin methylesterase, which reduce adhesion between cells and the mechanical strength of the cell wall, leading to the softening of fruit tissues and decreased firmness [56]. Studies have shown that edible coatings can effectively retain the firmness of sweet cherries during storage [7,30,32,52,57]. In this study, the firmness of the four cultivars differed at the beginning in line with their various characteristics. During storage, firmness in all groups showed a downward trend, and firmness in the coated group of each variety was significantly higher than its control group, which can be explained by the coating reducing respiration rate and ethylene production, thereby reducing the activity of cell wall degrading enzymes [17].
The skin color of the cherries changed because the concentration of anthocyanins changed during storage [1,58]. This result was consistent with other studies showing that edible coatings delayed skin color change in sweet cherries [6,21,30,57]. The L*, chroma, and hue angle values of the skin of the four cultivars showed significant differences at the beginning of storage, which was related to the concentration of anthocyanins. For example, the L*, chroma, and hue angle of RN-C were significantly higher than the other control groups throughout storage and, correspondingly, the anthocyanin concentration in RN-C was the lowest. The L* values of the coated cherries were significantly higher than the control groups at the beginning of storage, which may be related to the brightening of the surface by the coating. The chroma of RT, RN, and FS all initially increased, which may be related to an increase in anthocyanin synthesis during the post-ripening process after harvest. The subsequent decrease in chroma could be attributed to the decomposition of anthocyanins. By the end of storage, the chroma of all the coated groups was significantly higher than their controls. This could be explained by the oxygen barrier properties of the coating film reducing the oxygen concentration inside the fruit, thereby reducing the activity of phenylalanine ammonia-lyase and flavanone synthase—two key enzymes in the synthesis of anthocyanins [59].
The appearance of the peduncle is a good indicator of the freshness of sweet cherries after harvest [60]. Green and watery peduncles indicate fresh fruit while brown and shriveled peduncles indicate stale fruit [39,61]. Browning and shrinkage are caused by dehydration of the peduncles. Transpiration via the peduncles in an unsaturated atmosphere [62] and osmotic dehydration at 100% relative humidity are the causes of dehydration and atrophy [61]. In this study, the surface microstructure of the peduncle was also examined. There were differences in the number of stomata, wax distribution, and morphology of the peduncle surface of the different cultivars. The surface characteristics of the peduncles may be closely related to PMC during storage. For example, there were more stomata and less wax on the surface of the RN peduncle (which may be related to the peduncle losing more water during storage), while there were no stomata and more wax on the surface of the FS peduncle (which may be related to lower water loss). Tissue browning of fruit and vegetables during postharvest storage is caused by the formation of quinones from phenolic substances under the action of polyphenol oxidase (PPO) [63]. PBI is, thus, closely related to PPO activity which is also related to oxygen content. This explains why PBI in the coated groups was significantly lower than their control groups—the oxygen barrier properties of the coating limited oxygen entry to the interior of the peduncle and reduced the activity of PPO, suppressing PBI. The PCC also showed a downward trend during storage but PCC in the coated groups was significantly higher than their control groups at the end of storage, which may be related to chlorophyll decomposition and the oxygen barrier property of the coating.
SSC and TA determine sweetness and acidity which are important parameters determining the quality, taste, and consumer acceptance of sweet cherries [1,17]. AA is one of the most important antioxidant nutrients in fruit and plays a variety of biologically active functions in the human body including the scavenging of free radicals produced in the fruit [45,64]. Starch is hydrolyzed to monosaccharides through respiration and other catabolic processes resulting in an increase in SSC during storage [30]. Loss of water also increases SSC but the decomposition of starch plays a major role [17]. Other reports, consistent with this study, have shown that edible coatings can delay the rise in SSC by inhibiting respiration [6,8,43]. Since organic acids are usually the main substrate for respiration and other metabolic processes, the TA content exhibited a downward trend during postharvest storage [30]. This study observed that TA and AA contents of sweet cherries in all groups showed a downward trend and that coating treatment inhibited the decomposition of TA and AA due to the oxygen barrier effect of the coating reducing oxygen concentration inside the fruit, reducing the intensity of respiration and related enzyme activities, thereby reducing the consumption of TA and the decomposition of AA [65].
Genetic, pre-harvest, post-harvest, and other factors affect the nutrient content of sweet cherries. These nutrients have a variety of biological activities with antioxidant, anti-cancer, and anti-inflammatory effects. Phenolics and anthocyanins are found in the peel of sweet cherries which improves their sensory quality (color) and taste (astringency) [66]. Studies have shown that the TPC in cherry peel is four to five times higher than in the pulp [43]. These compounds also have a strong antioxidant capacity and can capture free radicals generated during oxidative stress [67]. In this study, the TPC, TAC, and DPPH RSC of the cultivars at the beginning of storage differed significantly, as governed by their genetic make-up. These parameters remained highest in RL during storage while RN had the lowest. This also relates to skin color since L* was shown to have a very significant negative correlation with TPC and TAC. The edible coating treatment helped to maintain TPC and TAC (except in RN), probably due to the oxygen barrier properties of the film. The TPC and TAC of RN were significantly lower than the other varieties which may be related to its yellow-red peel color. DPPH RSC correlated positively with TPC and TAC, which was consistent with the results of Carolina Formica-Oliveira et al. [68] and Nair et al. [67].

5. Conclusions

There were significant differences in the surface microstructure of four sweet cherry epidermis and peduncle at harvest which was closely related to fruit decay ratio during storage. The AA-CaCl2-CMCS-GL coating treatment delayed decay and the fruit decay ratio of the coated groups were significantly lower than their controls. The edible coating treatment also helped to maintain quality and nutritional characteristics of four sweet cherry cultivars during storage, including reducing weight loss of the fruit, enabling the sweet cherries to maintain better skin and peduncle color, and higher fruit hardness, TA, AA, TPC, TAC, and DPPH RSC. These results suggested that AA-CaCl2-CMCS-GL coating could be considered as a preservation method for improving postharvest quality and nutritional properties of different sweet cherry cultivars, and when using a coating to preserve sweet cherries, the cultivar should be considered, and an appropriate cultivar should be selected to achieve the best preservation effect.

Supplementary Materials

The following are available online at https://www.mdpi.com/article/10.3390/coatings11040396/s1, Figure S1: the pictures of four cultivars of sweet cherry at harvest. Figure S2: standard curve for the determination of TPC, Figure S3: standard curve for the determination of DPPH RSC.

Author Contributions

Conceptualization, Q.-L.C. and Y.W.; methodology, Q.-L.C., Y.-L.Z., F.S., H.F., Y.-Q.Z., S.-T.L., Z.-H.L., L.L, and Y.-K.S.; formal analysis, Y.-L.Z. and Q.-L.C.; resources, Y.-L.Z., H.F., Y.-Q.Z., S.-T.L., Z.-H.L., L.L. and Y.-K.S.; writing—original draft preparation, Y.-L.Z.; writing—review and editing, Y.-L.Z., Q.-L.C. and F.S.; supervision, Q.-L.C. and Y.W.; project administration, Y.W.; funding acquisition, Y.W. All authors have read and agreed to the published version of the manuscript.

Funding

This research was funded by the Shanxi Provincial Key Research and Development Project (Agricultural sector) (CN), No. 201903D211007-1.

Institutional Review Board Statement

Not applicable.

Informed Consent Statement

Not applicable.

Data Availability Statement

No new data were created or analyzed in this study. Data sharing is not applicable to this article.

Conflicts of Interest

The authors declare no conflict of interest.

References

  1. Blando, F.; Oomah, B.D. Sweet and sour cherries: Origin, distribution, nutritional composition and health benefits. Trends Food Sci. Technol. 2019, 86, 517–529. [Google Scholar] [CrossRef]
  2. Chockchaisawasdee, S.; Golding, J.B.; Vuong, Q.V.; Papoutsis, K.; Stathopoulos, C.E. Sweet cherry: Composition, postharvest preservation, processing and trends for its future use. Trends Food Sci. Technol. 2016, 55, 72–83. [Google Scholar] [CrossRef]
  3. Habib, M.; Bhat, M.; Dar, B.N.; Wani, A.A. Sweet cherries from farm to table: A review. Crit. Rev. Food Sci. 2017, 57, 1638–1649. [Google Scholar] [CrossRef]
  4. Correia, S.; Schouten, R.; Silva, A.P.; Goncalves, B. Factors Affecting Quality and Health Promoting Compounds during Growth and Postharvest Life of Sweet Cherry (Prunus avium L.). Front. Plant Sci. 2017, 8, 2166. [Google Scholar] [CrossRef] [PubMed] [Green Version]
  5. Tokatli, K.; Demirdoven, A. Effects of chitosan edible film coatings on the physicochemical and microbiological qualities of sweet cherry (Prunus avium L.). Sci. Hortic. Amst. 2020, 259, 7. [Google Scholar] [CrossRef]
  6. Petriccione, M.; De Sanctis, F.; Pasquariello, M.S.; Mastrobuoni, F.; Rega, P.; Scortichini, M.; Mencarelli, F. The effect of chitosan coating on the quality and nutraceutical traits of sweet cherry during postharvest life. Food Bioprocess Technol. 2015, 8, 394–408. [Google Scholar] [CrossRef]
  7. Abdipour, M.; Malekhossini, P.S.; Hosseinifarahi, M.; Radi, M. Integration of UV irradiation and chitosan coating: A powerful treatment for maintaining the postharvest quality of sweet cherry fruit. Sci. Hortic. Amst. 2020, 264, 8. [Google Scholar] [CrossRef]
  8. Zam, W. Effect of alginate and chitosan edible coating enriched with olive leaves extract on the shelf life of sweet cherries (Prunus avium L.). J. Food Qual. 2019, 2019, 1–7. [Google Scholar] [CrossRef] [Green Version]
  9. Cazón, P.; Velazquez, G.; Ramírez, J.A.; Vázquez, M. Polysaccharide-based films and coatings for food packaging: A review. Food Hydrocoll. 2017, 68, 136–148. [Google Scholar] [CrossRef]
  10. Zimet, P.; Mombru, A.W.; Mombru, D.; Castro, A.; Pablo Villanueva, J.; Pardo, H.; Rufo, C. Physico-chemical and antilisterial properties of nisin-incorporated chitosan/carboxymethyl chitosan films. Carbohydr. Polym. 2019, 219, 334–343. [Google Scholar] [CrossRef]
  11. Bai, R.Y.; Zhang, X.; Yong, H.M.; Wang, X.C.; Liu, Y.P.; Liu, J. Development and characterization of antioxidant active packaging and intelligent Al3+-sensing films based on carboxymethyl chitosan and quercetin. Int. J. Biol. Macromol. 2019, 126, 1074–1084. [Google Scholar] [CrossRef]
  12. Dayarian, S.; Zamani, A.; Moheb, A.; Masoomi, M. Physico-mechanical properties of films of chitosan, carboxymethyl chitosan, and their blends. J. Polym. Environ. 2014, 22, 409–416. [Google Scholar] [CrossRef]
  13. Zhu, G.Q.; Wang, F.G.; Liu, Y.Y.; Gao, Q.C. Properties of water-soluble carboxymethyl chitosan film modified by hydrophobic poly(propylene glycol). Chem. Pap. 2013, 67, 423–428. [Google Scholar] [CrossRef]
  14. Ahmed, S.; Ikram, S. Chitosan and gelatin based biodegradable packaging films with UV-light protection. J. Photochem. Photobiol. B 2016, 163, 115–124. [Google Scholar] [CrossRef]
  15. Haghighi, H.; De Leo, R.; Bedin, E.; Pfeifer, F.; Siesler, H.W.; Pulvirenti, A. Comparative analysis of blend and bilayer films based on chitosan and gelatin enriched with LAE (lauroyl arginate ethyl) with antimicrobial activity for food packaging applications. Food Packag. Shelf Life 2019, 19, 31–39. [Google Scholar] [CrossRef]
  16. Pereda, M.; Ponce, A.G.; Marcovich, N.E.; Ruseckaite, R.A.; Martucci, J.F. Chitosan-gelatin composites and bi-layer films with potential antimicrobial activity. Food Hydrocoll. 2011, 25, 1372–1381. [Google Scholar] [CrossRef]
  17. Riva, S.C.; Opara, U.O.; Fawole, O.A. Recent developments on postharvest application of edible coatings on stone fruit: A review. Sci. Hortic. Amst. 2020, 262, 10. [Google Scholar] [CrossRef]
  18. Hassan, B.; Chatha, S.A.S.; Hussain, A.I.; Zia, K.M.; Akhtar, N. Recent advances on polysaccharides, lipids and protein based edible films and coatings: A review. Int. J. Biol. Macromol. 2018, 109, 1095–1107. [Google Scholar] [CrossRef]
  19. Anugrah, D.S.B.; Alexander, H.; Pramitasari, R.; Hudiyanti, D.; Sagita, C.P. A Review of Polysaccharide-Zinc Oxide Nanocomposites as Safe Coating for Fruits Preservation. Coatings 2020, 10, 988. [Google Scholar] [CrossRef]
  20. Angeletti, P.; Castagnasso, H.; Miceli, E.; Terminiello, L.; Concellon, A.; Chaves, A.; Vicente, A.R. Effect of preharvest calcium applications on postharvest quality, softening and cell wall degradation of two blueberry (Vaccinium corymbosum) varieties. Postharvest Biol. Technol. 2010, 58, 98–103. [Google Scholar] [CrossRef]
  21. Liu, K.D.; Yuan, C.C.; Chen, Y.; Li, H.L.; Liu, J.X. Combined effects of ascorbic acid and chitosan on the quality maintenance and shelf life of plums. Sci. Hortic. Amst. 2014, 176, 45–53. [Google Scholar] [CrossRef]
  22. Ozdemir, K.S.; Gokmen, V. Effect of chitosan-ascorbic acid coatings on the refrigerated storage stability of fresh-cut apples. Coatings 2019, 9, 503. [Google Scholar] [CrossRef] [Green Version]
  23. Chaiprasart, P.; Hansawasdi, C.; Pipattanawong, N. Effect of chitosan coating and calcium chloride treatment on postharvest qualities of strawberry fruit (Fragaria x ananassa). Acta Hortic. 2006, 337–342. [Google Scholar] [CrossRef]
  24. Nguyen, V.B.; Nguyen, D.H.H.; Nguyen, H.H. Combination effects of calcium chloride and nano-chitosan on the postharvest quality of strawberry (Fragaria x ananassa Duch.). Postharvest Biol. Technol. 2020, 162, 1–8. [Google Scholar] [CrossRef]
  25. Kou, X.H.; Guo, W.L.; Guo, R.Z.; Li, X.Y.; Xue, Z.H. Effects of chitosan, calcium chloride, and pullulan coating treatments on antioxidant activity in pear cv. “Huang guan” during storage. Food Bioprocess Technol. 2014, 7, 671–681. [Google Scholar] [CrossRef]
  26. Lin, L.; Wang, B.; Wang, M.; Cao, J.; Zhang, J.; Wu, Y.; Jiang, W. Effects of a chitosan-based coating with ascorbic acid on post-harvest quality and core browning of ’Yali’ pears (Pyrus bertschneideri Rehd.). J. Ence Food Agric. 2010, 88, 877–884. [Google Scholar] [CrossRef]
  27. Aleryani-Raqeeb, A.; Mahmud, T.M.M.; Omar, S.R.S.; Zaki, A.R.M. Effects of calcium infiltration and chitosan coating on storage life and quality characteristics during storage of papaya (Carica papaya L.). Int. J. Agric. Res. 2008, 3, 296–306. [Google Scholar] [CrossRef]
  28. Sun, D.Q.; Liang, G.B.; Xie, J.H.; Lei, X.T.; Mo, Y.W. Improved preservation effects of litchi fruit by combining chitosan coating with ascorbic acid treatment during postharvest storage. Afr. J. Biotechnol. 2010, 9, 3272–3279. [Google Scholar] [CrossRef]
  29. Chong, J.X.; Lai, S.; Yang, H. Chitosan combined with calcium chloride impacts fresh-cut honeydew melon by stabilising nanostructures of sodium-carbonate-soluble pectin. Food Control 2015, 53, 195–205. [Google Scholar] [CrossRef]
  30. Mahfoudhi, N.; Hamdi, S. Use of almond gum and gum arabic as novel edible coating to delay postharvest ripening and to maitain sweet cherry (Prunus avium) quality during storage. J. Food Process Preserv. 2015, 39, 1499–1508. [Google Scholar] [CrossRef]
  31. Jafari, H.; Pirouzifard, M.; Khaledabad, M.A.; Almasi, H. Effect of chitin nanofiber on the morphological and physical properties of chitosan/silver nanoparticle bionanocomposite films. Int. J. Biol. Macromol. 2016, 92, 461–466. [Google Scholar] [CrossRef]
  32. Aday, M.S.; Caner, C. Understanding the effects of various edible coatings on the storability of fresh cherry. Packag. Technol. Sci. 2010, 23, 441–456. [Google Scholar] [CrossRef]
  33. Martínez-Romero, D.; Alburquerque, N.; Valverde, J.M.; Guillén, F.; Castillo, S.; Valero, D.; Serrano, M. Postharvest sweet cherry quality and safety maintenance by Aloe vera treatment: A new edible coating. Postharvest Biol. Technol. 2006, 39, 93–100. [Google Scholar] [CrossRef]
  34. Li, M.; Wang, Y.; Dong, Y. Pre-harvest application of harpin beta protein improves fruit on-tree and storage quality attributes of ’Lapins’ and ’Regina’ sweet cherry (Prunus avium L.). Sci. Hortic. Amst. 2020, 263. [Google Scholar] [CrossRef]
  35. Pasquariello, M.S.; Di Patre, D.; Mastrobuoni, F.; Zampella, L.; Scortichini, M.; Petriccione, M. Influence of postharvest chitosan treatment on enzymatic browning and antioxidant enzyme activity in sweet cherry fruit. Postharvest Biol. Technol. 2015, 109, 45–56. [Google Scholar] [CrossRef]
  36. Faniadis, D.; Drogoudi, P.D.; Vasilakakis, M. Effects of cultivar, orchard elevation, and storage on fruit quality characters of sweet cherry (Prunus avium L.). Sci. Hortic. Amst. 2010, 125, 301–304. [Google Scholar] [CrossRef]
  37. Lara, I.; Belge, B.; Goulao, L.F. The fruit cuticle as a modulator of postharvest quality. Postharvest Biol. Technol. 2014, 87, 103–112. [Google Scholar] [CrossRef] [Green Version]
  38. Martin, L.B.B.; Rose, J.K.C. There’s more than one way to skin a fruit: Formation and functions of fruit cuticles. J. Exp. Bot. 2014, 65, 4639–4651. [Google Scholar] [CrossRef] [Green Version]
  39. Athoo, T.O.; Winkler, A.; Knoche, M. Pedicel transpiration in sweet cherry fruit: Mechanisms, pathways, and factors. J. Am. Soc. Hortic. Sci. 2015, 140, 136–143. [Google Scholar] [CrossRef]
  40. Wang, Y.; Xie, X.B.; Long, L.E. The effect of postharvest calcium application in hydro-cooling water on tissue calcium content, biochemical changes, and quality attributes of sweet cherry fruit. Food Chem. 2014, 160, 22–30. [Google Scholar] [CrossRef]
  41. Aglar, E.; Ozturk, B.; Guler, S.K.; Karakaya, O.; Uzun, S.; Saracoglu, O. Effect of modified atmosphere packaging and ’Parka’ treatments on fruit quality characteristics of sweet cherry fruits (Prunus avium L. ’0900 Ziraat’) during cold storage and shelf life. Sci. Hortic. Amst. 2017, 222, 162–168. [Google Scholar] [CrossRef]
  42. Mackinney, G. Absorption of light by chlorphyll solutions. J. Biol. Chem. 1941, 140, 315–322. [Google Scholar] [CrossRef]
  43. Diaz-Mula, H.M.; Serrano, M.; Valero, D. Alginate coatings preserve fruit quality and bioactive compounds during storage of sweet cherry fruit. Food Bioprocess Technol. 2012, 5, 2990–2997. [Google Scholar] [CrossRef]
  44. Crisosto, C.H.; Crisosto, G.M.; Metheney, P. Consumer acceptance of ‘Brooks’ and ‘Bing’ cherries is mainly dependent on fruit SSC and visual skin color. Postharvest Biol. Technol. 2003, 28, 159–167. [Google Scholar] [CrossRef]
  45. Lee, S.K.; Kader, A.A. Preharvest and postharvest factors influencing vitamin C content of horticultural crops. Postharvest Biol. Technol. 2000, 20, 207–220. [Google Scholar] [CrossRef] [Green Version]
  46. Tomas-Barberan, F.A.; Andres-Lacueva, C. Polyphenols and health: Current state and progress. J. Agric. Food Chem. 2012, 60, 8773–8775. [Google Scholar] [CrossRef]
  47. Alique, R.; Zamorano, J.P.; Martínez, M.A.; Alonso, J. Effect of heat and cold treatments on respiratory metabolism and shelf-life of sweet cherry, type picota cv “Ambrunés”. Postharvest Biol. Technol. 2005, 35, 153–165. [Google Scholar] [CrossRef]
  48. Wani, A.A.; Singh, P.; Gul, K.; Wani, M.H.; Langowski, H.C. Sweet cherry (Prunus avium): Critical factors affecting the composition and shelf life. Food Packag. Shelf Life 2014, 1, 86–99. [Google Scholar] [CrossRef]
  49. Powrie, W.D.; Skura, B.J. Modified Atmosphere Packaging of Fruits and Vegetables; Springer US: New York City, NY, USA, 1991. [Google Scholar]
  50. Conway, W.S.; Gross, K.C.; Boyer, C.D.; Sams, C.E. Inhibition of Penicillium expansum polygalacturonase activity by increased apple cell wall calcium. Phytopathology 1988, 78, 1052–1055. [Google Scholar] [CrossRef]
  51. Sogvar, O.B.; Koushesh Saba, M.; Emamifar, A. Aloe vera and ascorbic acid coatings maintain postharvest quality and reduce microbial load of strawberry fruit. Postharvest Biol. Technol. 2016, 114, 29–35. [Google Scholar] [CrossRef]
  52. Dong, F.; Wang, X.L. Guar gum and ginseng extract coatings maintain the quality of sweet cherry. Lwt-Food Sci. Technol. 2018, 89, 117–122. [Google Scholar] [CrossRef]
  53. Bhushan, B.; Jung, Y.C. Micro- and nanoscale characterization of hydrophobic and hydrophilic leaf surfaces. Nanotechnology 2006, 17, 2758. [Google Scholar] [CrossRef]
  54. Koch, K.; Ensikat, H.-J. The hydrophobic coatings of plant surfaces: Epicuticular wax crystals and their morphologies, crystallinity and molecular self-assembly. Micron (Oxf. Engl. 1993) 2008, 39, 759–772. [Google Scholar] [CrossRef] [PubMed]
  55. Zhang, L.; Chen, F.; Lai, S.; Wang, H.; Yang, H. Impact of soybean protein isolate-chitosan edible coating on the softening of apricot fruit during storage. Lwt-Food Sci. Technol. 2018, 96, 604–611. [Google Scholar] [CrossRef]
  56. Neda Maftoonazad, H.S.R.M.M. Shelf-life extension of peaches through sodium alginate and methyl cellulose edible coatings. Int. J. Food Sci. Technol. 2008, 43, 951–957. [Google Scholar] [CrossRef]
  57. Chiabrando, V.; Giacalone, G. Effect of alginate edible coating on quality and antioxidant properties in sweet cherry during postharvest storage. Ital. J. Food Sci. 2015, 27, 173–180. [Google Scholar]
  58. Goncalves, B.; Silva, A.P.; Moutinho-Pereira, J.; Bacelar, E.; Rosa, E.; Meyer, A.S. Effect of ripeness and postharvest storage on the evolution of colour and anthocyanins in cherries (Prunus avium L.). Food Chem. 2007, 103, 976–984. [Google Scholar] [CrossRef]
  59. Kumar, P.; Sethi, S.; Sharma, R.R.; Srivastav, M.; Varghese, E. Effect of chitosan coating on postharvest life and quality of plum during storage at low temperature. Sci. Hortic. Amst. 2017, 226, 104–109. [Google Scholar] [CrossRef]
  60. Linke, M.; Herppich, W.B.; Geyer, M. Green peduncles may indicate postharvest freshness of sweet cherries. Postharvest Biol. Technol. 2010, 58, 135–141. [Google Scholar] [CrossRef]
  61. Knoche, M.; Athoo, T.O.; Winkler, A.; Bruggenwirth, M. Postharvest osmotic dehydration of pedicels of sweet cherry fruit. Postharvest Biol. Technol. 2015, 108, 86–90. [Google Scholar] [CrossRef]
  62. Smith, E.D.; Whiting, M.D. The pedicel’s role in pestharvest weight loss of two sweet cherry cultivars. Acta Hortic. 2011, 903, 935–939. [Google Scholar] [CrossRef]
  63. Wallace, G.; Fry, S.C. Action of diverse peroxidases and laccases on six cell wall-related phenolic compounds. Phytochemistry 1999, 52, 769–773. [Google Scholar] [CrossRef]
  64. Adiletta, G.; Zampella, L.; Coletta, C.; Petriccione, M. Chitosan coating to preserve the qualitative traits and improve antioxidant system in fresh figs (Ficus carica L.). Agric. Basel 2019, 9, 84. [Google Scholar] [CrossRef] [Green Version]
  65. Hazrati, S.; Kashkooli, A.B.; Habibzadeh, F.; Tahmasebi-Sarvestani, Z.; Sadeghi, A.R. Evaluation of Aloe vera Gel as an alternative edible coating for peach fruits during cold storage period. Gesunde Pflanz. 2017, 69, 131–137. [Google Scholar] [CrossRef]
  66. Ferretti, G.; Bacchetti, T.; Belleggia, A.; Neri, D. Cherry antioxidants: From farm to table. Molecules 2010, 15, 6993–7005. [Google Scholar] [CrossRef]
  67. Nair, M.S.; Saxena, A.; Kaur, C. Effect of chitosan and alginate based coatings enriched with pomegranate peel extract to extend the postharvest quality of guava (Psidium guajava L.). Food Chem. 2018, 240, 245–252. [Google Scholar] [CrossRef]
  68. Carolina Formica-Oliveira, A.; Benito Martinez-Hernandez, G.; Diaz-Lopez, V.; Artes, F.; Artes-Hernandez, F. Effects of UV-B and UV-C combination on phenolic compounds biosynthesis in fresh-cut carrots. Postharvest Biol. Technol. 2017, 127, 99–104. [Google Scholar] [CrossRef]
Figure 1. SEM micrographs of sweet cherry epidermis: (a) RL, (b) RN, (c) RA, (d) FS show the stomata, wax distribution, and morphology on the epidermis at ×3000 magnification; (e) RL, (f) RN, (g) RA, (h) FS show the wax distribution and morphology in areas other than the stomata at ×3000 magnification.
Coatings 11 00396 g001
Figure 2. SEM micrographs of sweet cherry peduncle surface: (a) RL, (b) RN, (c) RA, (d) FS show the stomata number, wax distribution, and morphology on the peduncle at ×300 magnification; (e) RL, (f) RN, (g) RA, (h) FS show the stomata, wax distribution, and morphology at ×1200 magnification.
Coatings 11 00396 g002
Table 1. The cultivar (abbreviation), types of maturity, harvest date, skin color, pulp color, and average fruit weight of sweet cherry
Cultivar
(Abbreviation)
Types of
Maturity
Harvest DateSkin ColorPulp ColorAverage Fruit Weight (g)
Red Light (RL)Precocious27 MayFuchsiaRed5.16 ± 0.15
Ranier (RN)Mid-ripening6 JuneYellow-redLight yellow4.35 ± 0.12
Red Agate (RA)Mid-ripening6 JuneFuchsiaFuchsia5.98 ± 0.14
Friendship (FS)Serotinous15 JuneCrimsonRed7.86 ± 0.19
Table 2. The four cultivars of sweet cherry with or without the treatment of AA-CaCl2-CMCS-GL coating (2 min).
Serial NumberCultivarTreatmentAbbreviation
1RLTap waterRL-C
2AA-CaCl2-CMCS-GL coatingRL-T
3RNTap waterRN-C
4AA-CaCl2-CMCS-GL coatingRN-T
5RATap waterRA-C
6AA-CaCl2-CMCS-GL coatingRA-T
7FSTap waterFS-C
8AA-CaCl2-CMCS-GL coatingFS-T
Table 3. Mean values for quality parameters: fruit decay ratio, weight loss, and fruit firmness at harvest (0) and after 6, 12, 18, 24, 30, and 33 days storage for control and AA-CaCl2-CMCS-GL coated fruit.
CharacteristicStorage Time (Days)RL-CRL-TRN-CRN-TRA-CRA-TFS-CFS-T
Fruit decay
ratio
(%)
00 ± 0 a0 ± 0 a0 ± 0 a0 ± 0 a0 ± 0 a0 ± 0 a0 ± 0 a0 ± 0 a
60 ± 0 a0 ± 0 a0 ± 0 a0 ± 0 a0 ± 0 a0 ± 0 a0 ± 0 a0 ± 0 a
121.7 ± 0.6 a0 ± 0 b0 ± 0 b0 ± 0 b0 ± 0 b0 ± 0 b0 ± 0 b0 ± 0 b
188.7 ± 1.2 a1.3 ± 0.6 b4.3 ± 1.2 c0 ± 0 d1.3 ± 0.6 b0 ± 0 d0 ± 0 d0 ± 0 d
2416.3 ± 1.5 a4.7 ± 0.6 b10.7 ± 2.5 c4.3 ± 1.5 b10.3 ± 2.1 c1.7 ± 0.6 d1.7 ± 0.6 d0 ± 0 d
3035.0 ± 1.0 a11.3 ± 1.2 b31.7 ± 1.5 c8.7 ± 2.1 bd29.0 ± 4.0 c2.7 ± 0.6 e6.7 ± 1.2 d1.3 ± 0.6 e
3363.0 ± 2.6 a15.3 ± 0.6 b58.7 ± 3.1 a14.3 ± 1.5 b59.7 ± 5.7 a5.3 ± 0.6 c17.7 ± 1.5 b3.0 ± 1.0 c
Weight loss
(%)
00 ± 0 a0 ± 0 a0 ± 0 a0 ± 0 a0 ± 0 a0 ± 0 a0 ± 0 a0 ± 0 a
62.23 ± 0.15 a2.07 ± 0.15 ab2.04 ± 0.13 ab1.58 ± 0.26 c1.81 ± 0.13 bc1.78 ± 0.19 bc2.71 ± 0.14 d1.98 ± 0.31 ab
124.98 ± 0.24 a2.88 ± 0.10 b4.82 ± 0.29 a2.94 ± 0.06 b3.80 ± 0.23 c2.60 ± 0.20 b4.92 ± 0.20 a2.83 ± 0.32 b
185.44 ± 0.26 a3.47 ± 0.25 b6.69 ± 0.14 c4.24 ± 0.14 d5.25 ± 0.24 a3.40 ± 0.18 b7.97 ± 0.21 d5.19 ± 0.20 a
246.82 ± 0.27 a4.85 ± 0.22 b8.84 ± 0.17 c5.62 ± 0.13 d6.47 ± 0.24 a4.17 ± 0.24 e9.86 ± 0.28 f6.42 ± 0.24 a
309.03 ± 0.25 a5.87 ± 0.19 b9.86 ± 0.24 c7.04 ± 0.27 d8.01 ± 0.14 e4.73 ± 0.26 f11.72 ± 0.23 g7.45 ± 0.30 d
3311.51 ± 0.30 a7.39 ± 0.24 b13.14 ± 0.23 c8.50 ± 0.23 d10.75 ± 0.34 e5.46 ± 0.30 f14.89 ± 0.33 g9.44 ± 0.25 h
Fruit firmness
(N)
019.49 ± 0.75 a19.56 ± 0.71 a19.65 ± 0.71 a19.81 ± 0.59 a20.73 ± 0.77 b21.11 ± 0.66 b23.87 ± 0.68 c23.53 ± 0.61 c
618.95 ± 0.62 a19.22 ± 0.68 a19.26 ± 0.64 a19.51 ± 0.69 a20.15 ± 0.77 b20.97 ± 0.69 c22.68 ± 0.71 d23.18 ± 0.64 d
1217.91 ± 0.74 a19.06 ± 0.71 b18.31 ± 0.69 a18.97 ± 0.71 b19.29 ± 0.87 b20.87 ± 0.53 c21.55 ± 0.64 d22.55 ± 0.71 e
1817.04 ± 0.71 a18.56 ± 0.65 b17.70 ± 0.65 c18.59 ± 0.67 b17.65 ± 0.81 c20.64 ± 0.58 d19.83 ± 0.74 e21.35 ± 0.62 f
2415.27 ± 1.57 a16.96 ± 0.62 b17.32 ± 0.61 b17.75 ± 0.56 c15.85 ± 0.54 a20.48 ± 0.87 d19.10 ± 0.57 e20.15 ± 0.59 d
3012.23 ± 0.65 a16.02 ± 0.58 b16.33 ± 0.69 b17.18 ± 0.61 c14.96 ± 0.68 d20.05 ± 0.81 e18.61 ± 0.59 f19.29 ± 0.54 g
3310.39 ± 0.58 a15.25 ± 0.59 b13.82 ± 0.59 c16.49 ± 0.58 d11.89 ± 0.69 e19.69 ± 0.53 f16.22 ± 0.52 d17.97 ± 0.59 g
Data are mean ± standard deviation of three or ten (firmness) replicate samples. Different letters in the same row indicate significantly different values according to one-way ANOVA followed by Duncan’s multiple test range (p < 0.05).
Table 4. Mean values for skin color characteristics: L*, Chroma, Hue angle at harvest (0) and after 6, 12, 18, 24, 30, and 33 days storage for control and AA-CaCl2-CMCS-GL coated fruit.
CharacteristicStorage Time (Days)RL-CRL-TRN-CRN-TRA-CRA-TFS-CFS-T
L*028.76 ± 2.51 a30.23 ± 2.61 b62.95 ± 2.38 c64.12 ± 2.31 d32.29 ± 1.25 e35.64 ± 0.94 f33.72 ± 2.77 g35.96 ± 2.58 f
626.35 ± 2.68 a28.52 ± 2.34 b60.81 ± 2.85 c62.04 ± 2.25 d31.80 ± 1.07 e35.05 ± 0.82 f31.29 ± 2.65 e33.65 ± 2.36 g
1225.19 ± 2.36 a27.83 ± 2.17 b58.23 ± 2.38 c60.28 ± 2.11 d31.29 ± 1.18 e34.65 ± 1.17 f29.32 ± 2.58 g31.22 ± 2.18 e
1823.32 ± 1.96 a26.49 ± 2.28 b56.53 ± 2.18 c59.03 ± 2.08 d30.73 ± 1.14 e33.97 ± 1.09 f26.70 ± 2.33 b30.09 ± 2.11 e
2421.16 ± 1.36 a24.97 ± 2.33 b55.03 ± 2.06 c56.94 ± 2.31 d28.06 ± 1.04 e33.34 ± 1.09 f25.32 ± 2.46 b29.68 ± 2.23 g
3019.62 ± 1.83 a22.78 ± 2.42 b52.42 ± 2.31 c54.52 ± 2.18 d26.54 ± 1.03 e32.98 ± 1.07 f23.28 ± 2.39 b28.26 ± 2.15 g
3316.94 ± 1.21 a20.29 ± 1.96 b50.03 ± 2.15 c52.49 ± 2.22 d22.43 ± 1.05 e31.85 ± 1.03 f21.03 ± 2.12 g26.72 ± 2.33 h
Chroma020.76 ± 1.56 a21.05 ± 1.62 a41.19 ± 1.80 c41.17 ± 1.77 c38.56 ± 1.05 d40.64 ± 0.86 c34.73 ± 2.88 b35.99 ± 2.45 e
621.89 ± 1.75 a21.44 ± 1.58 b40.30 ± 1.53 c40.78 ± 1.61 c36.53 ± 1.07 d38.04 ± 1.02 e35.05 ± 2.39 a36.08 ± 2.08 d
1225.19 ± 2.36 a27.83 ± 2.17 a38.57 ± 1.31 b40.05 ± 1.66 c34.86 ± 0.89 d37.65 ± 0.97 e32.50 ± 2.41 f34.81 ± 2.60 d
1820.96 ± 1.59 a20.52 ± 1.44 a35.34 ± 1.62 b38.58 ± 1.31 c33.79 ± 1.14 d37.97 ± 1.04 e30.35 ± 2.36 f33.44 ± 2.22 d
2419.32 ± 1.78 a19.57 ± 1.36 a32.77 ± 1.49 b36.54 ± 1.43 c32.86 ± 1.04 b37.34 ± 1.19 d29.32 ± 2.17 f31.90 ± 2.11 g
3017.47 ± 1.29 a18.38 ± 1.38 b29.67 ± 1.42 c35.59 ± 1.20 d31.75 ± 0.83 e36.98 ± 0.97 f27.81 ± 2.31 g30.92 ± 1.97 h
3313.66 ± 0.30 a16.99 ± 1.53 b26.37 ± 1.24 c32.17 ± 1.34 d28.45 ± 1.05 e34.85 ± 1.03 f26.65 ± 2.18 c28.92 ± 2.08 e
Hue angle018.47 ± 2.65 a19.06 ± 2.99 a60.73 ± 2.21 b59.97 ± 2.05 b25.48 ± 0.89 c27.37 ± 1.21 d23.46 ± 3.29 e24.19 ± 3.01 e
616.97 ± 2.24 a18.18 ± 2.59 b57.98 ± 1.94 c58.46 ± 2.22 c23.33 ± 0.63 d26.37 ± 1.03 e21.12 ± 3.24 f21.99 ± 3.03 g
1215.83 ± 2.20 a16.57 ± 2.55 a58.48 ± 2.05 b56.86 ± 1.84 c22.56 ± 1.12 d25.93 ± 0.79 e21.14 ± 3.41 f21.40 ± 2.75 f
1814.77 ± 1.89 a16.92 ± 2.32 b58.95 ± 2.94 c57.43 ± 2.15 d20.45 ± 1.03 e25.21 ± 0.91 f20.42 ± 2.86 e20.52 ± 2.64 e
2414.71 ± 1.79 a16.16 ± 2.21 b60.09 ± 3.10 c58.75 ± 1.86 d18.59 ± 0.89 e24.32 ± 1.03 f19.30 ± 3.26 e18.81 ± 2.12 e
3014.25 ± 1.67 a16.52 ± 2.22 b59.11 ± 3.15 c60.26 ± 2.05 d18.17 ± 0.93 e23.74 ± 0.97 f18.09 ± 3.30 e18.26 ± 2.05 e
3314.81 ± 2.24 a15.84 ± 2.13 b60.15 ± 3.23 c61.37 ± 2.55 d16.37 ± 0.86 b22.49 ± 0.84 e16.41 ± 2.96 b17.41 ± 2.02 f
Data are mean ± standard deviation of sixty replicate tests. Different letters in the same row indicate significantly different values according to one-way ANOVA followed by Duncan’s multiple test range (p < 0.05).
Table 5. Mean values for the peduncle freshness parameters: Peduncle Browning Incidence (PBI), Peduncle Moisture Content (PMC), and Peduncle Chlorophyll Content (PCC) at harvest (0) and after 6, 12, 18, 24, 30, and 33 days storage for control and AA-CaCl2-CMCS-GL coated fruit.
CharacteristicStorage Time (Days)RL-CRL-TRN-CRN-TRA-CRA-TFS-CFS-T
PBI
(%)
00 ± 0 a0 ± 0 a0 ± 0 a0 ± 0 a0 ± 0 a0 ± 0 a0 ± 0 a0 ± 0 a
613.7 ± 2.1 a5.3 ± 1.5 bc12.3 ± 2.1 ad0 ± 0 e10.7 ± 1.5 d4.3 ± 1.5 c7.3 ± 1.5 b0 ± 0 e
1229.0 ± 2.6 a12.7 ± 2.1 b24.3 ± 1.5 c3.7 ± 0.6 d24.7 ± 2.5 c9.3 ± 2.5 b19.0 ± 2.0 e2.7 ± 0.6 d
1854.3 ± 2.5 a22.3 ± 3.1 b44.7 ± 2.1 c8.0 ± 1.0 d50.0 ± 2.6 e15.0 ± 2.0 f36.7 ± 2.1 g5.7 ± 1.2 d
2479.7 ± 3.1 a30.3 ± 2.5 b57.3 ± 3.1 c14.3 ± 1.2 d63.0 ± 3.6 e19.0 ± 2.6 f49.3 ± 2.3 g13.7 ± 2.1 d
3085.0 ± 3.6 a48.0 ± 3.0 b74.7 ± 3.8 c21.3 ± 1.5 d85.0 ± 3.0 a25.3 ± 3.1 d69.3 ± 1.5 e20.7 ± 1.5 d
3399.3 ± 1.2 a64.7 ± 2.5 b88.0 ± 3.0 c30.7 ± 1.5 de95.0 ± 2.6 f33.0 ± 2.6 e72.0 ± 2.0 g27.0 ± 2.0 d
PMC
(%)
073.2 ± 0.7 a73.1 ± 0.6 a76.0 ± 0.4 b75.8 ± 0.4 b76.4 ± 1.0 b76.7 ± 1.5 b73.6 ± 1.1 a73.9 ± 0.4 a
668.3 ± 0.9 a71.0 ± 0.2 b70.8 ± 0.6 b74.9 ± 0.6 c73.0 ± 0.6 d76.2 ± 1.8 c70.6 ± 0.8 b72.7 ± 0.4 d
1262.8 ± 0.7 a68.8 ± 0.9 b67.5 ± 1.3 c73.3 ± 0.6 d67.9 ± 0.4 b76.0 ± 0.7 e66.3 ± 0.5 c70.2 ± 0.6 f
1855.9 ± 1.1 a66.6 ± 0.8 b65.6 ± 0.9 b71.1 ± 0.8 c65.5 ± 0.9 b75.7 ± 0.6 d63.4 ± 0.8 e69.0 ± 0.8 f
2449.7 ± 0.7 a63.7 ± 1.0 b62.4 ± 1.1 b69.3 ± 0.5 c58.4 ± 1.2 d74.9 ± 0.5 e58.6 ± 1.1 d67.6 ± 0.6 f
3044.5 ± 1.2 a59.6 ± 0.9 b58.7 ± 0.8 b66.7 ± 0.4 c53.0 ± 1.6 d74.0 ± 0.7 e56.5 ± 0.9 f64.3 ± 0.8 g
3330.5 ± 0.8 a51.1 ± 1.3 b43.4 ± 1.0 c58.6 ± 0.8 d36.4 ± 1.2 e69.3 ± 0.8 f48.5 ± 0.7 g56.7 ± 0.5 h
PCC
(mg g−1)
00.464 ± 0.015 a0.467 ± 0.011 ab0.475 ± 0.015 ab0.479 ± 0.011 ab0.460 ± 0.009 a0.469 ± 0.007 ab0.483 ± 0.004 ab0.490 ± 0.006 b
60.430 ± 0.016 ab0.448 ± 0.019 abc0.440 ± 0.017 abc0.462 ± 0.009 c0.425 ± 0.007 a0.443 ± 0.013 abc0.437 ± 0.013 abc0.458 ± 0.008 bc
120.390 ± 0.012 a0.424 ± 0.019 bc0.418 ± 0.011 bc0.433 ± 0.004 c0.401 ± 0.005 ab0.423 ± 0.007 bc0.414 ± 0.007 bc0.435 ± 0.007 c
180.351 ± 0.007 a0.410 ± 0.014 bc0.394 ± 0.015 bcd0.426 ± 0.007 d0.379 ± 0.011 e0.401 ± 0.004 bcd0.393 ± 0.008 bd0.416 ± 0.008 ce
240.311 ± 0.006 a0.363 ± 0.005 bcd0.356 ± 0.037 bc0.386 ± 0.006 cd0.347 ± 0.003 b0.379 ± 0.006 bcd0.357 ± 0.011 bc0.396 ± 0.011 d
300.264 ± 0.003 a0.302 ± 0.010 bc0.314 ± 0.011 cd0.342 ± 0.003 e0.295 ± 0.007 b0.327 ± 0.007 de0.324 ± 0.007 d0.363 ± 0.006 f
330.219 ± 0.003 a0.277 ± 0.008 b0.259 ± 0.004 c0.309 ± 0.006 d0.247 ± 0.008 c0.296 ± 0.005 e0.286 ± 0.004 be0.335 ± 0.008 f
Data are mean ± standard deviation of three replicate samples. Different letters in the same row indicate significantly different values according to one-way ANOVA followed by Duncan’s multiple test range (p < 0.05).
Table 6. Correlations between Peduncle Browning Incidence (PBI), Peduncle Moisture Content (PMC), and Peduncle Chlorophyll Content (PCC).
CharacteristicPBIPMCPCC
PBI1--
PMC−0.923 **1-
PCC−0.901 **0.875 **1
Note: ** represent an extremely significant correlation at p < 0.01.
Table 7. Mean values for the nutritional parameters: Soluble Solids Content (SSC), Titratable Acidity (TA), and Ascorbic Acid (AA) content at harvest (0) and after 6, 12, 18, 24, 30, and 33 days storage for control and AA-CaCl2-CMCS-GL coated fruit.
CharacteristicStorage Time (Days)RL-CRL-TRN-CRN-TRA-CRA-TFS-CFS-T
SSC
(%)
015.36 ± 0.19 a15.40 ± 0.08 a16.62 ± 0.30 b16.56 ± 0.11 b11.20 ± 0.36 c11.40 ± 0.17 c13.45 ± 0.21 d13.36 ± 0.19 d
618.49 ± 0.23 a17.55 ± 0.19 b17.49 ± 0.16 b17.35 ± 0.22 b12.09 ± 0.23 c11.55 ± 0.13 d13.85 ± 0.11 e13.70 ± 0.12 e
1220.42 ± 0.27 a20.06 ± 0.51 a18.86 ± 0.44 b18.60 ± 0.21 b12.57 ± 0.26 c12.05 ± 0.21 c14.50 ± 0.22 d14.38 ± 0.16 d
1822.36 ± 0.15 a21.39 ± 0.10 b20.81 ± 0.23 c19.94 ± 0.19 d13.58 ± 0.27 e12.55 ± 0.20 f14.97 ± 0.15 g14.81 ± 0.14 g
2425.57 ± 0.24 a24.57 ± 0.24 b22.73 ± 0.35 c20.85 ± 0.09 d14.17 ± 0.14 e12.99 ± 0.26 f15.68 ± 0.31 g15.21 ± 0.18 h
3027.48 ± 0.27 a25.98 ± 0.26 b23.88 ± 0.06 c21.98 ± 0.14 d14.97 ± 0.15 e13.75 ± 0.01 f16.27 ± 0.22 g15.61 ± 0.22 h
3329.48 ± 0.21 a27.25 ± 0.38 b24.67 ± 0.14 c23.05 ± 0.18 d15.46 ± 0.41 e13.83 ± 0.19 f16.77 ± 0.22 g16.33 ± 0.20 h
TA
(g·kg−1)
022.64 ± 0.24 a22.94 ± 0.27 a17.75 ± 0.12 b17.88 ± 0.14 b15.20 ± 0.14 c15.00 ± 0.12 c20.27 ± 0.24 d20.48 ± 0.21 d
618.65 ± 0.11 a20.59 ± 0.12 b14.15 ± 0.20 c15.79 ± 0.13 d12.15 ± 0.28 e14.64 ± 0.21 f16.27 ± 0.13 g19.76 ± 0.17 h
1216.26 ± 0. 18 a19.31 ± 0.15 b12.98 ± 0.12 c14.76 ± 0.12 d10.49 ± 0.07 e13.77 ± 0.27 f14.32 ± 0.21 g17.12 ± 0.15 h
1815.75 ± 0. 20 a17.25 ± 0.12 b9.38 ± 0.22 c12.56 ± 0.18 d10.20 ± 0.31 e12.89 ± 0.21 d11.17 ± 0.11 f13.95 ± 0.18 g
2413.70 ± 0.14 a14.86 ± 0.14 b8.73 ± 0.13 c11.31 ± 0.10 d8.74 ± 0.10 c12.02 ± 0.17 e9.79 ± 0.14 f12.71 ± 0.27 g
3012.40 ± 0.18 a13.57 ± 0.19 b8.58 ± 0.14 c10.01 ± 0.14 d7.93 ± 0.11 e11.15 ± 0.20 f9.03 ± 0.11 g11.79 ± 0.13 h
3311.00 ± 0.08 a12.40 ± 0.24 b8.19 ± 0.15 c9.66 ± 0.19 d5.73 ± 0.10 e9.96 ± 0.27 d8.28 ± 0.16 c11.03 ± 0.33 a
AA
(mg·kg−1)
0175.4 ± 1.0 a175.1 ± 1.3 a130.0 ± 1.5 b127.3 ± 1.3 c142.5 ± 1.1 d146.5 ± 1.4 e201.4 ± 1.5 f198.5 ± 1.7 g
6152.1 ± 1.3 a152.3 ± 1.8 a111.4 ± 1.4 b118.7 ± 1.9 c125.8 ± 1.3 d129.9 ± 1.2 e181.7 ± 1.4 f184.0 ± 1.4 f
12137.5 ± 1.3 a144.9 ± 1.8 b98.6 ± 2.0 c115.6 ± 1.9 d118.1 ± 1.2 d127.2 ± 1.8 e161.1 ± 1.3 f175.2 ± 1.3 g
18117.4 ± 1.1 a132.4 ± 1.5 b91.8 ± 1.6 c102.5 ± 1.3 d120.8 ± 1.1 d120.8 ± 1.5 e145.0 ± 1.5 f164.4 ± 1.3 g
24104.4 ± 1.0 a124.3 ± 1.4 b81.6 ± 1.7 c96.1 ± 1.5 d96.7 ± 0.9 d116.6 ± 1.5 e122.4 ± 1.4 b153.2 ± 1.2 f
3093.9 ± 1.4 a112.0 ± 1.1 b70.8 ± 1.1 c84.1 ± 1.9 d80.8 ± 1.7 e107.9 ± 1.7 f114.2 ± 1.4 b144.6 ± 1.6 g
3370.4 ± 1.6 a93.9 ± 1.5 b55.0 ± 1.2 c69.2 ± 1.5 a62.1 ± 2.0 d94.4 ± 1.1 b93.3 ± 1.2 b118.6 ± 1.8 e
Data are mean ± standard deviation of three (SSC) or four (TA and AA) replicate tests. Different letters in the same row indicate significantly different values according to one-way ANOVA followed by Duncan’s multiple test range (p < 0.05).
Table 8. Mean values for the nutritional parameters: Total Phenolics Content (TPC), Total Anthocyanins Concentration (TAC), and DPPH Radical Scavenging Capacity (RSC) at harvest (0) and after 6, 12, 18, 24, 30, and 33 days storage for control and AA-CaCl2-CMCS-GL coated fruit.
CharacteristicStorage Time (Days)RL-CRL-TRN-CRN-TRA-CRA-TFS-CFS-T
TPC
(mg·g−1)
022.03 ± 0.54 a22.23 ± 0.30 a12.20 ± 0.33 b12.11 ± 0.14 b20.56 ± 0.46 c20.55 ± 0.26 c18.07 ± 0.31 d18.14 ± 0.21 d
621.06 ± 0.23 a21.16 ± 0.41 a11.69 ± 0.17 b11.89 ± 0.27 b19.17 ± 0.55 c19.90 ± 0.57 c16.79 ± 0.32 d17.19 ± 0.36 d
1219.75 ± 0.33 a20.28 ± 0.38 a10.39 ± 0.31 b11.18 ± 0.26 c17.83 ± 0.52 d18.56 ± 0.36 d15.18 ± 0.26 e16.19 ± 0.28 f
1817.68 ± 0.34 a19.53 ± 0.40 b9.14 ± 0.18 c10.69 ± 0.29 d16.46 ± 0.48 e18.38 ± 0.30 f13.97 ± 0.22 g15.26 ± 0.29 h
2415.47 ± 0.54 a19.08 ± 0.28 b8.41 ± 0.25 c10.09 ± 0.22 d14.63 ± 0.51 e17.48 ± 0.10 f12.18 ± 0.25 g14.15 ± 0.24 e
3013.61 ± 0.34 a18.44 ± 0.21 b7.20 ± 0.24 c9.21 ± 0.25 d13.87 ± 0.48 a17.00 ± 0.35 e10.93 ± 0.28 f12.86 ± 0.22 g
3311.56 ± 0.29 a17.40 ± 0.22 b5.74 ± 0.30 c7.86 ± 0.25 d11.20 ± 0.35 a16.59 ± 0.46 e9.60 ± 0.29 f11.46 ± 0.29 a
TAC
(mg·g−1)
01.85 ± 0.02 a1.84 ± 0.01 a0.06 ± 0.00 b0.06 ± 0.01 b1.05 ± 0.04 c1.05 ± 0.02 c0.97 ± 0.02 d0.97 ± 0.02 d
62.06 ± 0.02 a2.06 ± 0.02 a0.05 ± 0.01 b0.06 ± 0.01 b0.95 ± 0.02 c1.03 ± 0.02 d0.84 ± 0.01 e0.87 ± 0.00 f
121.77 ± 0.02 a1.82 ± 0.02 b0.04 ± 0.00 c0.05 ± 0.00 c0.76 ± 0.00 d0.99 ± 0.02 e0.76 ± 0.01 d0.79 ± 0.01 d
181.56 ± 0.01 a1.70 ± 0.02 b0.03 ± 0.00 c0.04 ± 0.01 c0.70 ± 0.01 d0.92 ± 0.03 e0.67 ± 0.02 d0.71 ± 0.01 f
241.36 ± 0.02 a1.50 ± 0.02 b0.02 ± 0.00 c0.04 ± 0.00 c0.65 ± 0.03 d0.92 ± 0.01 e0.62 ± 0.01 d0.70 ± 0.01 f
301.21 ± 0.02 a1.34 ± 0.01 b0.02 ± 0.00 c0.03 ± 0.00 c0.57 ± 0.02 d0.90 ± 0.01 e0.56 ± 0.01 d0.62 ± 0.01 f
331.07 ± 0.02 a1.26 ± 0.02 b0.01 ± 0.00 c0.02 ± 0.00 c0.47 ± 0.03 d0.90 ± 0.01 e0.50 ± 0.01 f0.54 ± 0.01 g
DPPH RSC
(mg·g−1)
041.17 ± 0.23 a41.09 ± 0.18 a26.06 ± 0.38 b26.24 ± 0.29 b39.83 ± 0.73 c38.86 ± 0.25 d33.66 ± 0.13 e33.53 ± 0.25 e
638.57 ± 0.21 a39.50 ± 0.28 b23.36 ± 0.39 c25.63 ± 0.41 d34.47 ± 0.48 e37.52 ± 0.18 f30.50 ± 0.27 g31.15 ± 0.40 g
1233.42 ± 0.30 a38.59 ± 0.14 b20.20 ± 0.53 c24.11 ± 0.42 d29.78 ± 0.48 e36.32 ± 0.43 f25.73 ± 0.31 g28.70 ± 0.35 h
1826.76 ± 0.55 a37.60 ± 0.35 b15.66 ± 0.57 c23.16 ± 0.26 d23.39 ± 0.60 d34.26 ± 0.15 e19.76 ± 0.34 f24.78 ± 0.36 g
2420.03 ± 0.24 a36.28 ± 0.24 b12.32 ± 0.46 c22.40 ± 0.57 d19.89 ± 0.32 e31.54 ± 0.21 f15.88 ± 0.32 g22.69 ± 0.41 h
3015.54 ± 0.39 a35.50 ± 0.33 b8.61 ± 0.15 c21.10 ± 0.43 d15.79 ± 0.55 a30.31 ± 0.62 e10.24 ± 0.42 f19.37 ± 0.42 g
339.95 ± 0.46 a34.32 ± 0.38 b3.48 ± 0.19 c19.29 ± 0.41 d6.06 ± 0.32 e28.38 ± 0.37 f5.55 ± 0.23 e14.75 ± 0.50 g
Data are mean ± standard deviation of three replicate samples. Different letters in the same row indicate significantly different values according to one-way ANOVA followed by Duncan’s multiple test range (p < 0.05).
Table 9. Correlations between skin color characteristics (L*, Chroma, Hue angle), TPC, TAC, and DPPH RSC.
CharacteristicL*ChromaHue AngleTPCTACDPPH RSC
L*1-----
Chroma0.655 **1----
Hue angle0.972 **0.536 **1---
TPC−0.533 **−0.195−0.661 **1--
TAC−0.730 **−0.622 **−0.775 **0.866 **1-
DPPH RSC−0.1540.041−0.301 *0.893 **0.661 **1
Note: ** represent an extremely significant correlation at p < 0.01; * represent a significant correlation at p < 0.05.
Publisher’s Note: MDPI stays neutral with regard to jurisdictional claims in published maps and institutional affiliations.

