Article

Wettability, Microhardness, Wear and Corrosion Resistance of Ni–Co–P–BN(h)–Al2O3 Binary Nanocomposite Coatings Surface with Varying Long-Pulse Laser Parameters

1
College of Engineering, Nanjing Agricultural University, Nanjing 210031, China
2
Guanyun Research Institute for Modern Agricultural Equipment, Nanjing Agricultural University, Lianyungang 222200, China
3
Nanjing Institute of Agricultural Mechanization, Ministry of Agriculture and Rural Affairs, Nanjing 210008, China
*
Author to whom correspondence should be addressed.
Coatings 2021, 11(12), 1467; https://doi.org/10.3390/coatings11121467
Submission received: 11 November 2021 / Revised: 27 November 2021 / Accepted: 28 November 2021 / Published: 29 November 2021
(This article belongs to the Special Issue Multifunctional Coatings and Lubrication)

Abstract

:
In this study, Ni–Co–P–BN(h)–Al2O3 binary nanocomposite coatings were fabricated on steel C1045 substrates by jet electrodeposition. The samples were then processed using self-made laser processing equipment to investigate the influence of long-pulse laser processing parameters variation on samples’ surface morphology, roughness and wettability. Additionally, the properties of samples before and after laser processing were analyzed and characterized. The results showed that the surface morphologies, surface roughness and wettability of samples were affected by laser output power, pulse width and spot-to-spot distance variation. A convex dome was formed on the samples’ surface at a low laser output power and a suitable pulse width, while a dimple was formed on the samples’ surface at a high laser output power. The surface roughness and water contact angle of samples increased with the rise in laser output power or pulse width. The water contact angle decreased with the rise in the spot-to-spot distance, and the water contact angle reached a maximum value of 139.8° with a laser output power of 50 W, a pulse width of 100 µs and a spot-to-spot distance of 150 µm. The samples after laser processing exhibited a higher wettability, microhardness and wear resistance compared to those of the normal samples. The microhardness of the heat-affected zone reached a maximum value of 812.1 HV0.1, and the wear scar width of the samples reached a minimum value of 360.5 µm. However, after laser processing, the samples’ seawater corrosion resistance decreased slightly.

1. Introduction

It is worth noting that steel C1045 has been widely applied in industries such as aviation, communication, electronics, and automobile due to its low cost as well as good combination of mechanical properties [1,2]. However, the lifetime and performance of steel C1045 components are determined by surface wear and corrosion phenomena. As a result, industries incur a lot of cost in form of labor, materials and financial resources to repair or replace the worn-out steel C1045 parts every year [3], which poses a serious threat to rapid economic development. Therefore, it is fundamental to develop effective protection against wear and corrosion phenomena by developing materials that can meet the industries’ high operation requirements and extreme conditions.
Jet electrodeposition has several advantages such as low processing costs, high deposition current density, high selectivity, high velocity, high efficiency and ability to plate thick composite coatings with fine grains [4,5,6], which can be used to prepare excellent properties with composite coating and enhance the local surface of metallic parts. Shen et al. [7] found that the multilayered structure nickel coating using jet electrodeposition can further improve corrosion resistance and better protect the NdFeB material. Zhang et al. [8,9] studied the influence of jet voltages, temperatures of plating solution, reciprocating sweep speed and jet gap on the properties of the deposited Ni–Co–P alloy coatings. The results indicated that the suitable parameters of jet electrodeposition were conducive to the wear resistance as well as seawater corrosion resistance of coatings. Tang et al. [10] found that increase in the bath flow of jet electrodeposited lead to a decrease in the grains of Co–Ni alloy coating. Li et al. [11,12] found that the contents of Co and BN(h) nanoparticles in the Ni–Co–BN(h) coatings changed with the variation of jet voltages, jet speed, pulse frequency and duty cycle, which had an obvious effect on the microhardness and corrosion resistance of the coatings. Jiang et al. [13] reported that the flatness and corrosion resistance of Ni–SiC composite coatings prepared by magnetic field-enhanced jet electrodeposition were further obviously improved. Tian et al. [14] concluded that the adhesion of Ni–Co–SiC composite coatings deposited using magnetic field-induced jet electrodeposition were higher than that of Ni–Co alloy coating. Wang et al. [15] developed a new method involving interlaced deposition and reported that the corrosion resistance of Ni–CeO2 nanocomposite coatings was clearly improved with the introduction of interlacing jet electrodeposition. Wang et al. [16] proposed a laser texturing and laser cleaning pretreatment method instead of the traditional pretreatment technology. It was revealed that the adhesive force and the microhardness of coating were improved after the laser thermal effect changed the topography of the substrate. Kang et al. [17] prepared the Ni–Co–P/BN(h) composite coatings using jet electrodeposition and found that the wear and corrosion resistance properties of deposited coatings can be further improved after the heat treatment.
The above research works demonstrate that the microhardness, wear and corrosion resistance of samples can be enhanced by developing new preparation processes, adding different nanoparticles and varying the particle concentration, varying deposition process parameters, changing traditional pretreatment method of the substrate and heating treatment coatings in the furnace. Moreover, scholars from home and abroad have conducted many studies involving process parameters, nanoparticles and especially heating the coatings in the furnace. However, the traditional furnace crystallization has defects of the complex annealing process, low efficiency and inconvenience, difficulty to process large parts and substrate material thermal deformation. Therefore, there is a need to provide gh selectivity and a short processing cycle method for heating treatment coatings in order to improve processing efficiency, create economic value and promote jet electrodeposition development.
Over the past few decades, interest in laser processing has been continuously growing due to its advantages such as high energy density, high processing efficiency, high precision, easy to control machined region and little environmental pollution. In addition, not only can the samples achieve performance objectives of traditional annealing and crystallization in the furnace, but will also not affect the excellent characteristics of the substrate material itself. Kang et al. [18] concluded that the bump and dimple microstructure on 304 L stainless steel was processed by modulating the laser power and pulse duration of the long-pulse laser. Wang et al. [19,20] reported that the laser surface texturing (LST) using a long-pulse laser was used to create micro-convex-domes on 304 L stainless steel, and it was found that the laser power had a direct impact on the height and diameter of the created convex dome. Li et al. [21] developed a two-dimensional transient model to simulate the laser micromachining process of 304 L stainless steel. Additionally, based on the numerical results and the experimental results, the evolution law of surface topography from the bump to the crater was analyzed and investigated. Zhang et al. [22] found that long-pulse laser-induced melt ejection and reported the influence of fluence and pulse duration on the laser drilling process. It was found that the laser power density had a major impact on the average velocity of melt ejecta, and the quality of the keyhole got worse and worse in the cases of longer pulse duration. Moreover, Ji et al. [23] further proposed that the pulse energy density and pulse number of long-pulse laser had an influence on the microstructure of Ni-Co-Si3N4 composite coating. It was reported that the surface microstructure changed from bump to pit with an increase in pulse energy density. The bump edge height and pit depth of surface microstructure increased with the rise in pulse number.
In general, the surface microstructure has a significant influence on the roughness of samples. The results collected from the above experiments indicated that long-pulse laser can change the surface microstructure of steel material and composite coating. However, they did not further study the laser output power and pulse width variation of long-pulse laser on the surface roughness and wettability. In addition, the wear and corrosion resistance of micro-convex-domes were not considered. Thus, the studies on the surface microstructure of nanocomposite coatings with varying long-pulse laser parameters have important significance as well as value in the improvement of metals’ surface properties.
In this work, the Ni–Co–P–BN(h)–Al2O3 binary nanocomposite coatings were fabricated on steel C1045 substrates using jet electrodeposition. The samples were then further processed with self-made laser processing equipment to investigate the influence of laser processing parameters variation on samples’ surface morphologies, surface roughness and wettability. Finally, the properties of samples before and after laser processing were analyzed and characterized. Additionally, the samples’ surface morphologies and surface roughness were investigated using laser scanning confocal microscopy. The wettability, microhardness, wear and seawater corrosion resistance of samples were investigated and characterized using an optical contact angle measurement instrument, microhardness tester, friction wear tester and electrochemical workstation, respectively. The above tests and analysis results may be useful to provide a theoretical framework for the application of Ni-based nanocomposite coatings and promote the further development of jet electrodeposition.

2. Experimental Device and Procedure

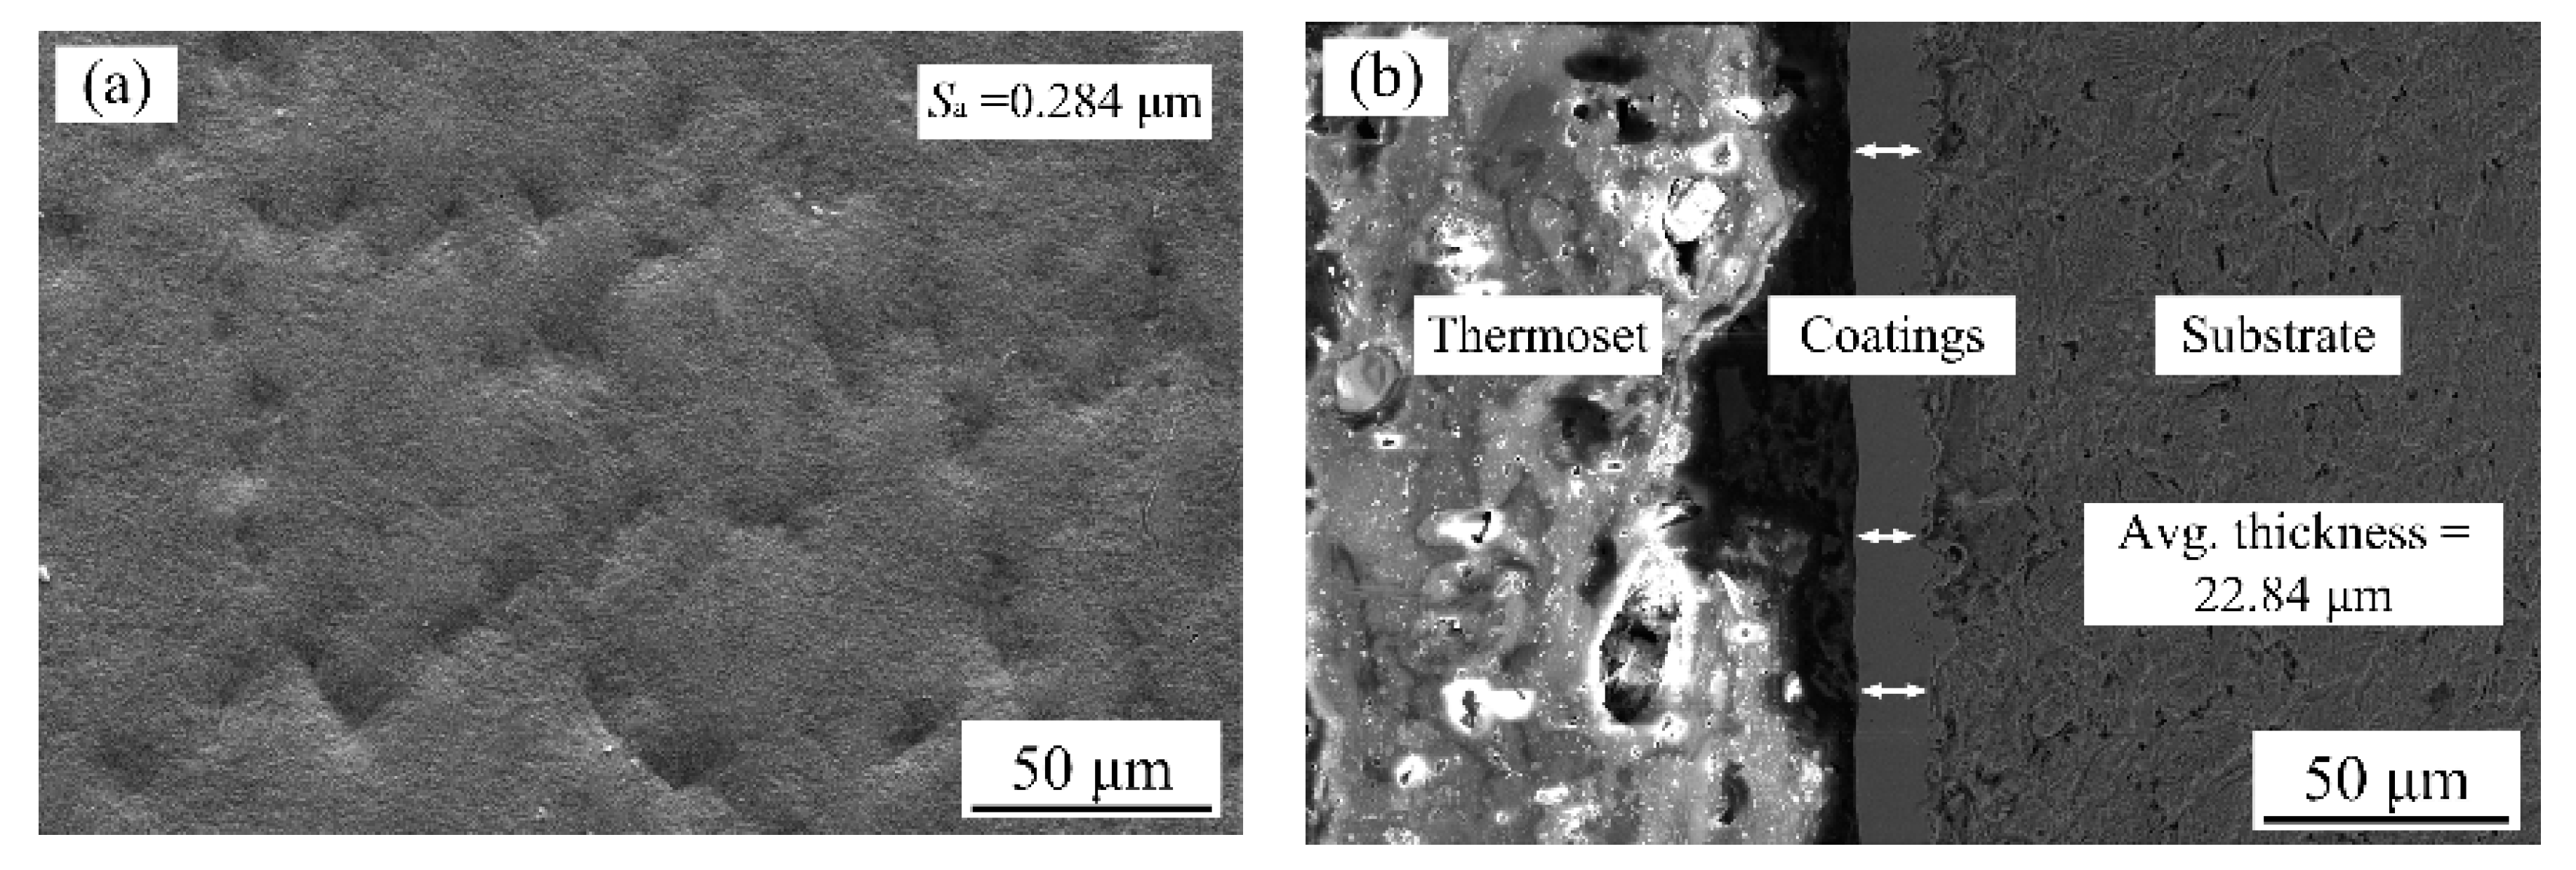
2.1. Materials and Pretreatment

Steel C1045 samples with a size of 30 mm × 8 mm × 7 mm were purchased from Suzhou Co. (Jiangsu, China) with the following composition: 0.46 wt.% C, 0.27 wt.% Si, 0.05 wt.% Cr, 0.04 wt.% Ni, 0.59 wt.% Mn, 0.02 wt.% P, 0.05 wt.% Cu and 0.02 wt.% S, which were used as the substrate materials throughout the experiment. The substrates were taken through a series of pretreatment processes to obtain a stronger bond between the substrate surface and the coating, in conformance to past research. In this study, firstly, different grades of abrasive emery papers (320→800→1500→2000) were used to mechanically polish and clean the steel C1045 substrate’s surface to ensure a smooth and bright surface. Secondly, 1# (electric cleaning solution) was used to degrease the substrates. The steel C1045 substrates were connected to the cathode electrode with a processing time of 30 s and a current of 1 A. Thirdly, 2# (strong activation solution) was used to remove the substrate surface’s oxide film, whereby steel C1045 substrates were connected to the positive electrode with a processing time of 35 s and a current of 1 A. Finally, to remove the substrate surfaces’ carbon black, the steel C1045 samples were connected to the positive electrode and immersed into a weak activation solution (3#) with a processing time of 35 s and a current of 1 A. The solutions’ composition (1#→2#→3#) and pretreatment operating conditions in the pretreatment experiment are listed in Table 1.

2.2. Preparation of Binary Nanocomposite Coatings

Ni–Co–P–BN(h)–Al2O3 binary nanocomposite coatings were fabricated on steel C1045 substrates using jet electrodeposition. The solution composition and preparation parameters used for the coatings experiment are shown in Table 2 [8,9]. It can be seen that all the nanocomposite coatings preparation operations were performed at a constant jet voltage of 12 V, a plating solution temperature of 60 °C, a reciprocating sweep speed of 175 mm·s−1, a jet gap of 2.0 mm, an injection speed of 1.5 m·s−1, an electrodeposition time of 20 min, a pulse frequency of 4 kHz and a duty cycle of 0.8. Moreover, steel C1045 substrates were connected to the negative pole of power supply and the high-purity nickel plate was connected to the positive pole of the power supply throughout the jet electrodeposition process. The BN(h) nanoparticles, with an average particle size of 100 nm and Al2O3 nanoparticles with an average particle size of 30 nm, were dispersed in an aqueous nickel–cobaltous–phosphorous electrolyte, and the concentration of each nanoparticle was 4 g·L−1 as shown in Table 2. Deionized water was used to clean the samples in an ultrasonic cleaner for 5 min after the deposition process.
Figure 1 shows the roughness and thickness of binary nanocomposite coatings using jet electrodeposition. It is evident that deposited coatings were uniform and had dense structures. Moreover, the surface roughness (Sa) of coatings was 0.284 µm and the thickness of the coating was 22.84 µm before laser processing.

2.3. Experimental Device and Laser Processing Parameters

Laser processing is a simple operation with high precision, low environmental pollution and ideal processing efficiency without a limit in sample size. Figure 2 shows the experimental setup used for laser surface micro-structuring. It can be seen that the experimental device consisted mainly of a personal computer (PC), a control system, a commercial fiber laser (YLR-200-SM-AC), a beam delivery system and a motion stage (X, Y). The experimental device was operated in modulation mode with a maximum power of 200 W, a wavelength of 1070 nm, a pulse duration adjusted from 2 µs to 20 ms and a pulse repetition rate varied from 50 Hz to 500 kHz. During the laser surface micro-structuring experiment, the commercial fiber laser was controlled using a personal computer (PC) via a control system. The laser beam from the fiber laser was passed through a beam delivery system and focused lens via the fiber coupled with a collimator so that the final laser beam acting on the surface of the sample had a diameter of 15 µm (1/e2).
Table 3 lists the laser-processing parameters used in the experiment. It can be seen that laser surface micro-structuring processing was carried out (i) with varying laser output power (50, 60, 70, 80, 90, 100, 110 and 120 W) at a constant pulse width of 50 µs and a spot-to-spot distance of 300 µm, (ii) with varying pulse width (50, 75, 100, 125 and 150 µs) at a laser output power of 50 W and a spot-to-spot distance of 300 µm and (iii) with varying spot-to-spot distance (150, 200, 250 and 300 µm) at a constant laser output power of 50 W and a pulse width of 100 µs. The effects of laser power, pulse duration and spot-to-spot distance on the sample morphology of microstructure were obtained at a feed rate of 5 mm·s−1.

2.4. Characterization and Tests

The OLS4000 laser scanning confocal microscopy (LSCM, OLYMPUS, Tokyo, Japan) was used to characterize surface topographies (two-dimensional, 2D ↔ three-dimensional, 3D) and surface roughness of samples. Additionally, the roughness of samples uses surface roughness (Sa) as an evaluation parameter. The wear scar width of samples’ surface after wear tests were measured using LSCM as well. A Quanta 250 scanning electron microscope (SEM, FEI, Hillsboro, OR, USA) was used to characterize the images of the textured surface after laser processing, and an X Flash Detector 5030 energy dispersive spectrometer (EDS, BRUKER, Karlsruhe, Germany) was used to measure elemental mapping images of the textured surface. The phase composition of samples was determined using X-ray diffraction (XRD, X’Pert Powder, PANalytical B.V., Almelo, The Netherlands) with monochromatic CuKα radiation. Diffraction patterns were operated at 40 kV and 40 mA, which were recorded at a scanning rate of 4 °/min and ranged from 2θ = 20° to 2θ = 90°.
The water contact angle of samples was characterized using an optical contact angle measurement instrument (OCA15EC, Dataphysics, Germany) with a water droplet velocity of 1 μL·s−1 and a water droplet of 3 μL. The contact angle value of samples corresponded to the average value measured at five different positions. Figure 3 shows the schematic diagram of the contact angle for an ideal smooth surface. The θ1 and θ2 are the left and right water contact angles of a liquid droplet on a solid surface, respectively.
The samples’ microhardness was measured using a Duramin-40A1 microhardness tester (Struers, Ballerup, Copenhagen, Denmark) with a loading time of 15 s and an applied load of 100 g, which corresponded to the average value measured at ten separate points. The samples wear resistance test was carried out using a CFT-1 material surface performance comprehensive tester (Zhongke Kaihua, Lanzhou, China) with an applied test load of 3.2 N, a wear time of 30 min, a GCr15 bearing steel ball (3 mm diameter) and a speed of the main shaft of 500 r·min−1.
The corrosion potentiodynamic polarization curves, Nyquist and Bode plots of steel C1045 substrate material and samples were investigated using a CS350 three-electrode electrochemical workstation (Wuhan Corrtest Instruments Corp., Ltd., Wuhan, China). Typically, the samples, platinum plate and saturated calomel electrode were considered as working electrode counter electrode and reference electrode, respectively. The working electrode exposed surface area of every sample was 1 cm2, and all the corrosive tests environment were performed at room temperature (25 ± 1 °C) in an artificial seawater prepared according to Standard ASTM D 1141–98 [8,9] as shown in Table 4. In addition, the potentiodynamic polarization curves and samples were recorded at a sweeping rate of 0.5 mV·s−1 and ranged from −0.6 V to +0.6 V with respect to the Eocp. The Nyquist and Bode plots of samples were recorded at a frequency varying from 105 Hz to 10−2 Hz.

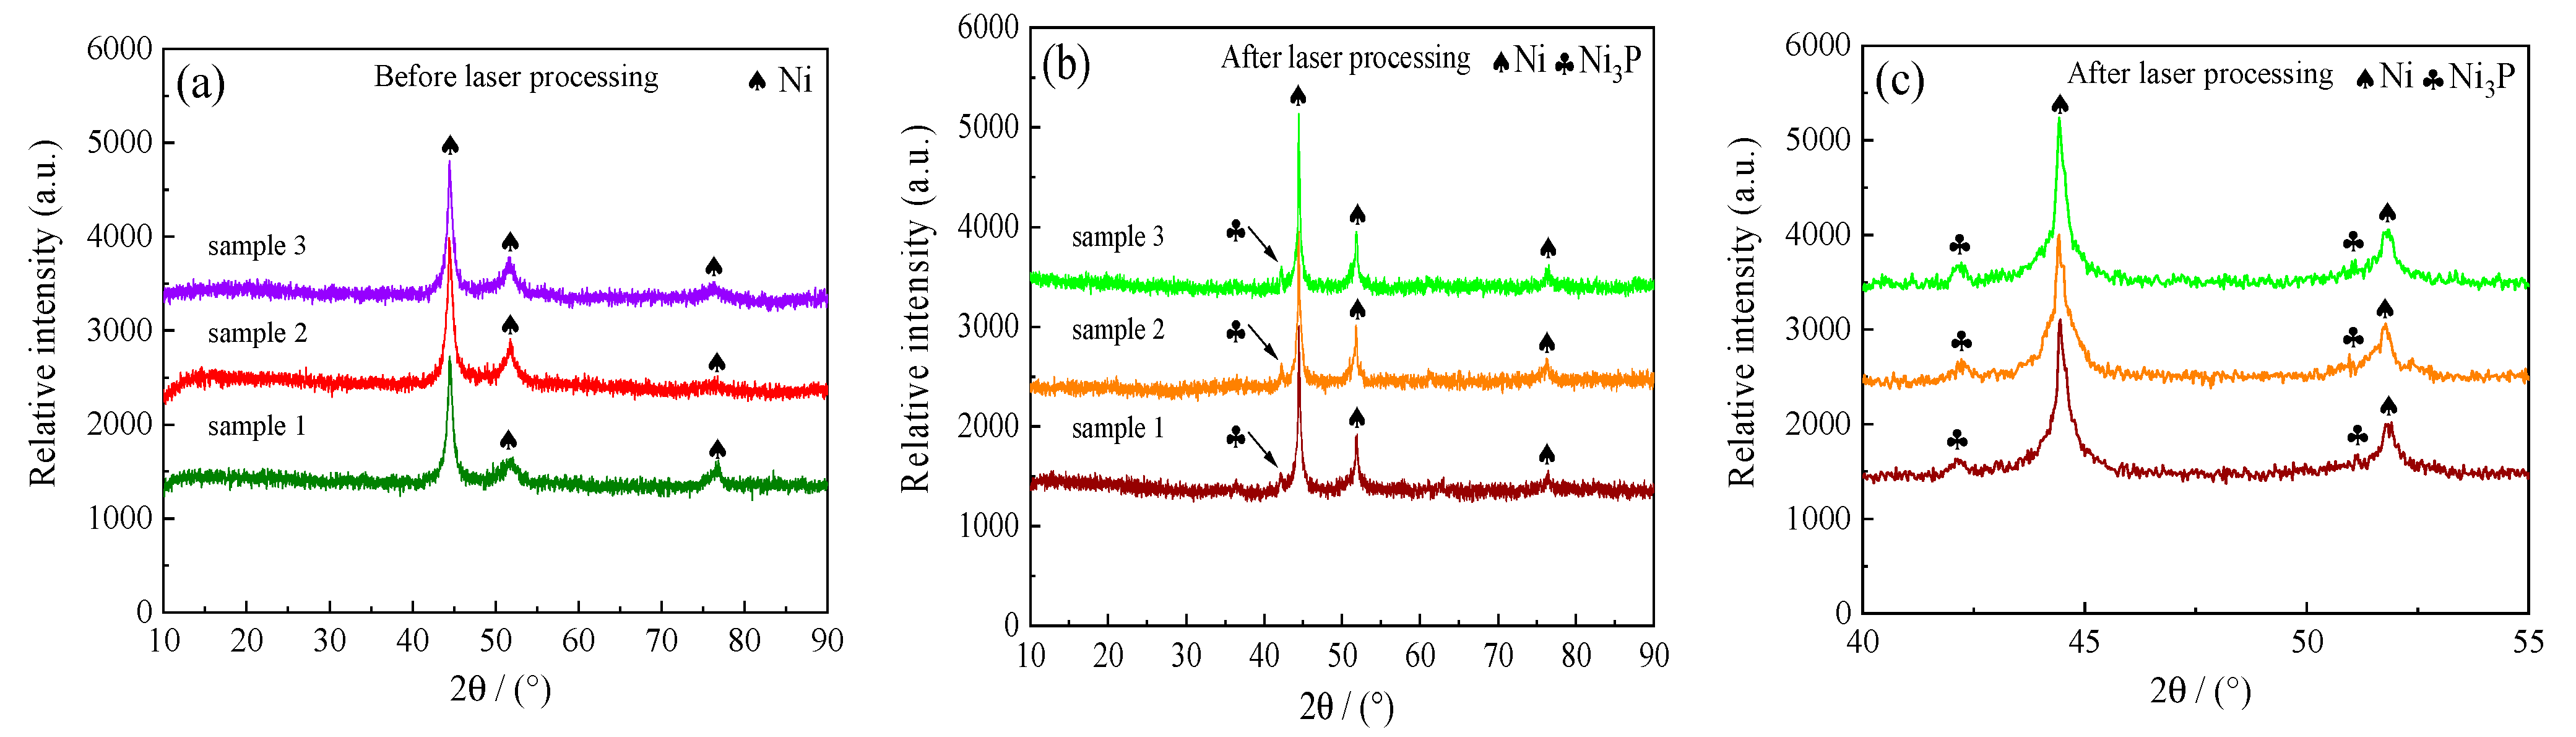
3. Results and Discussion

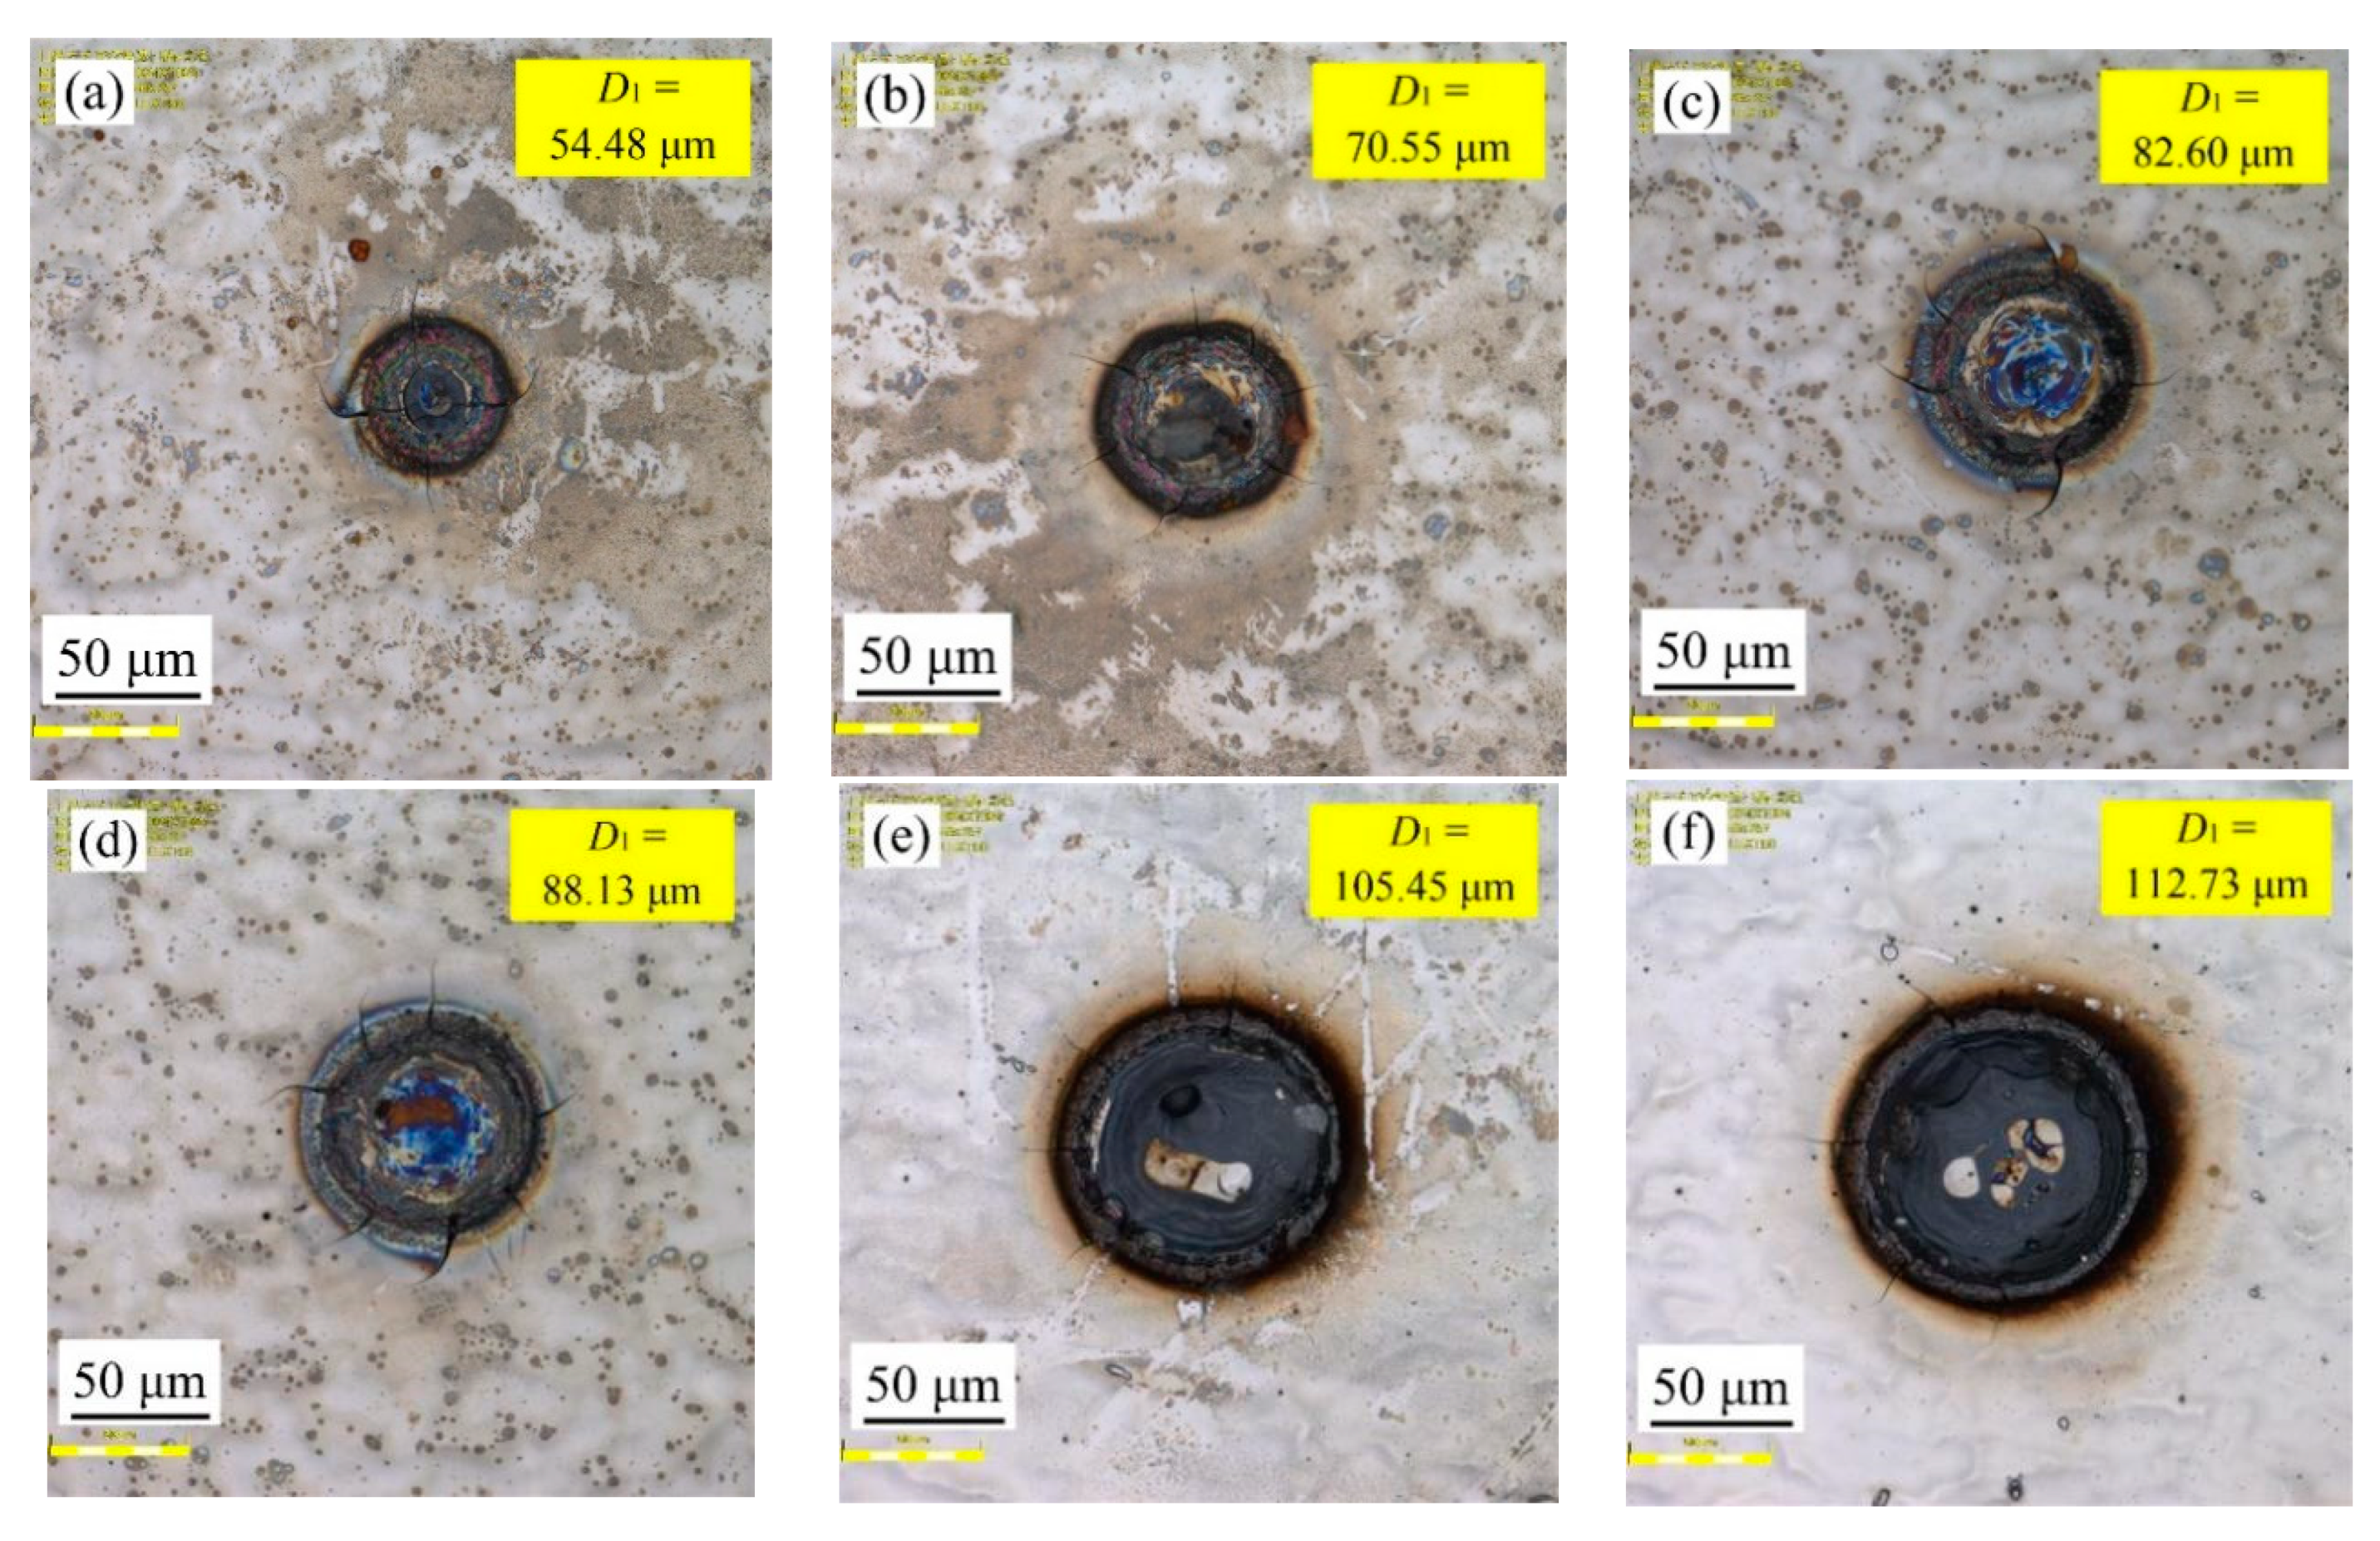
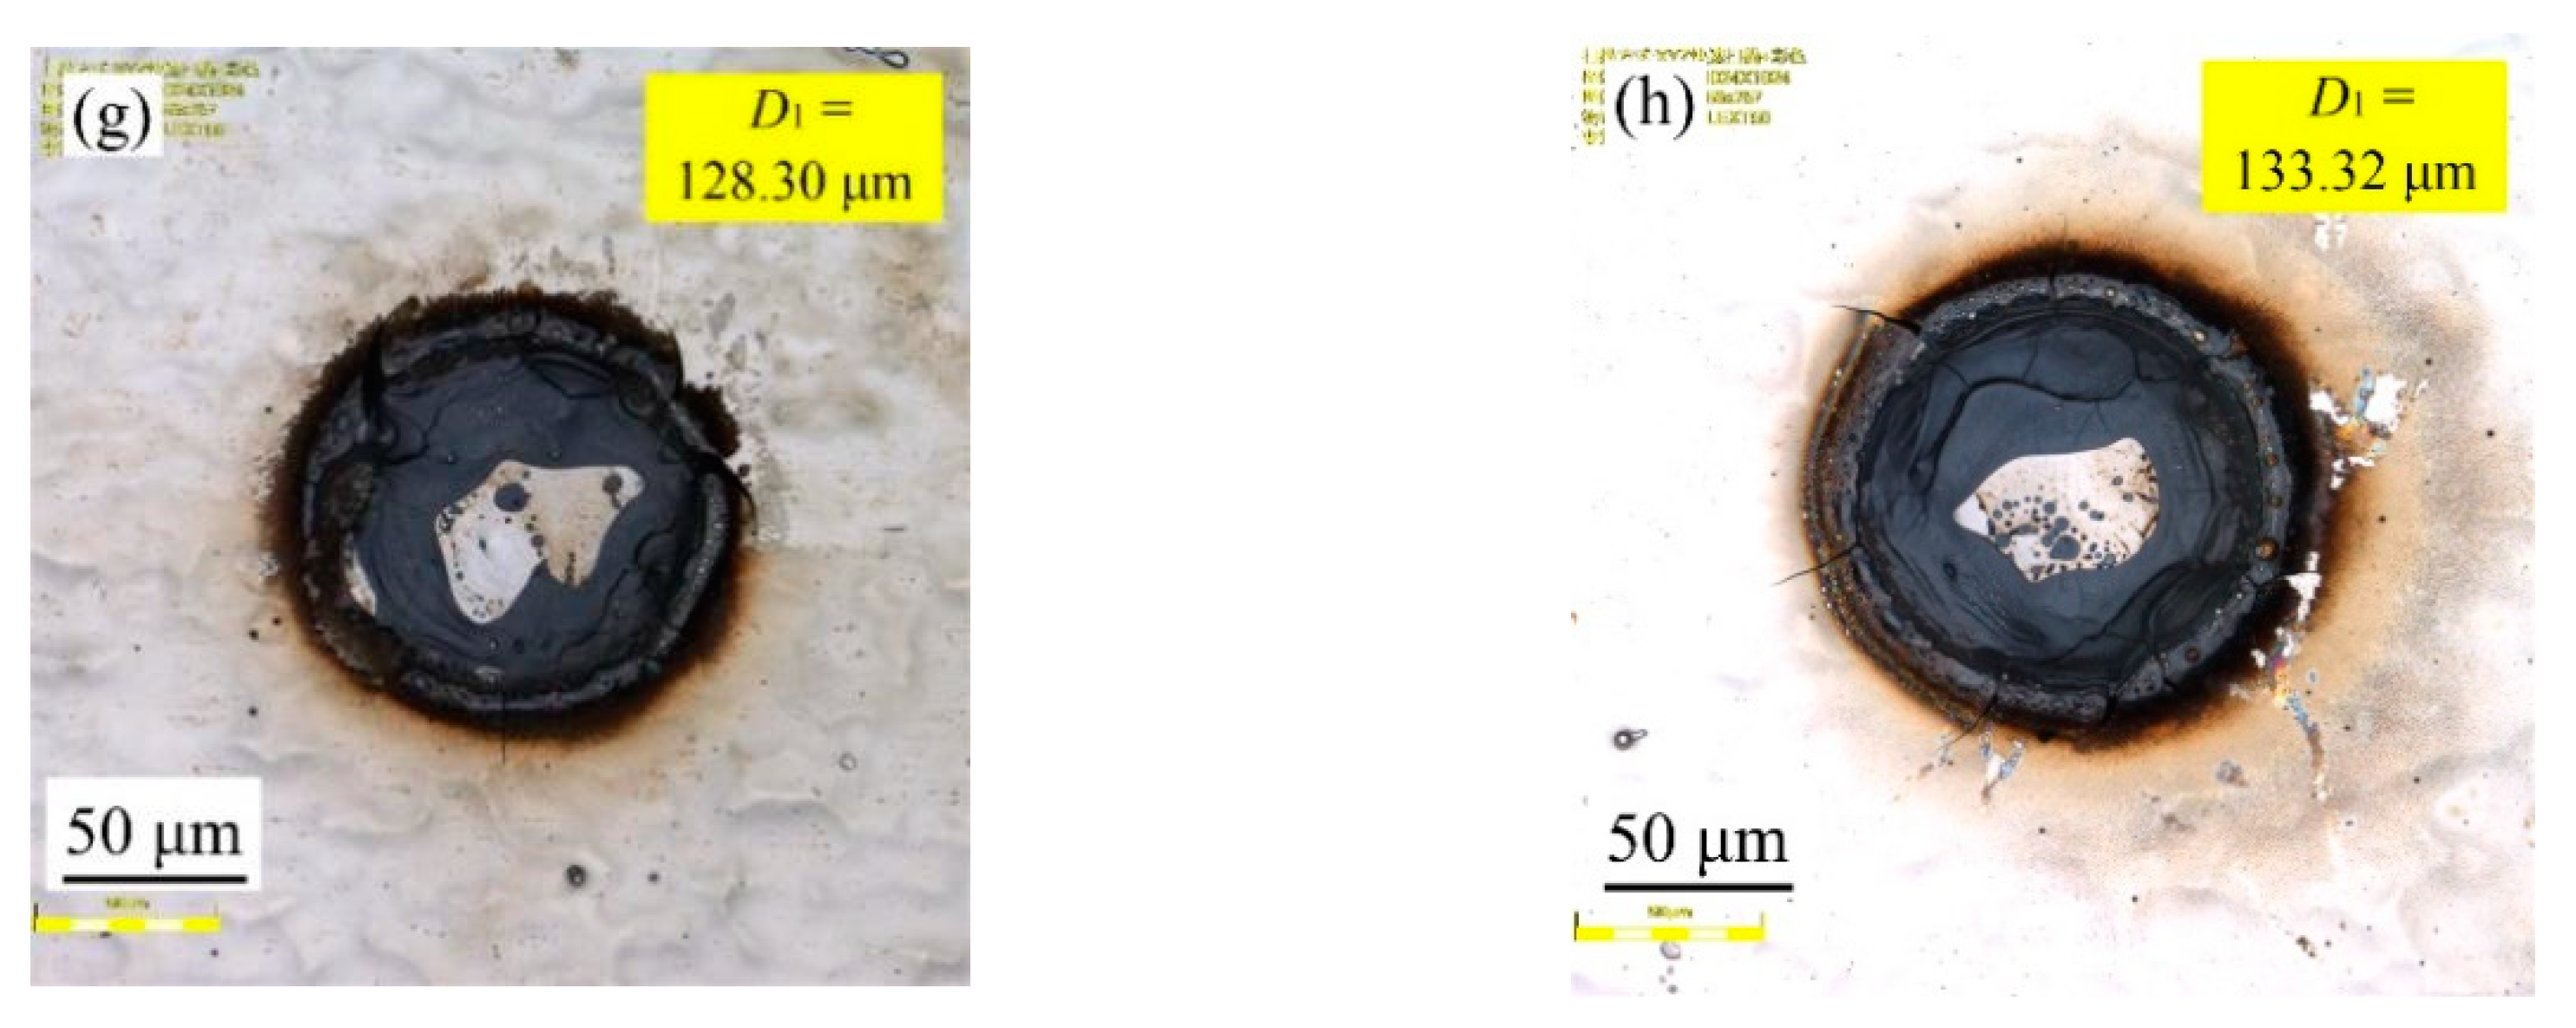
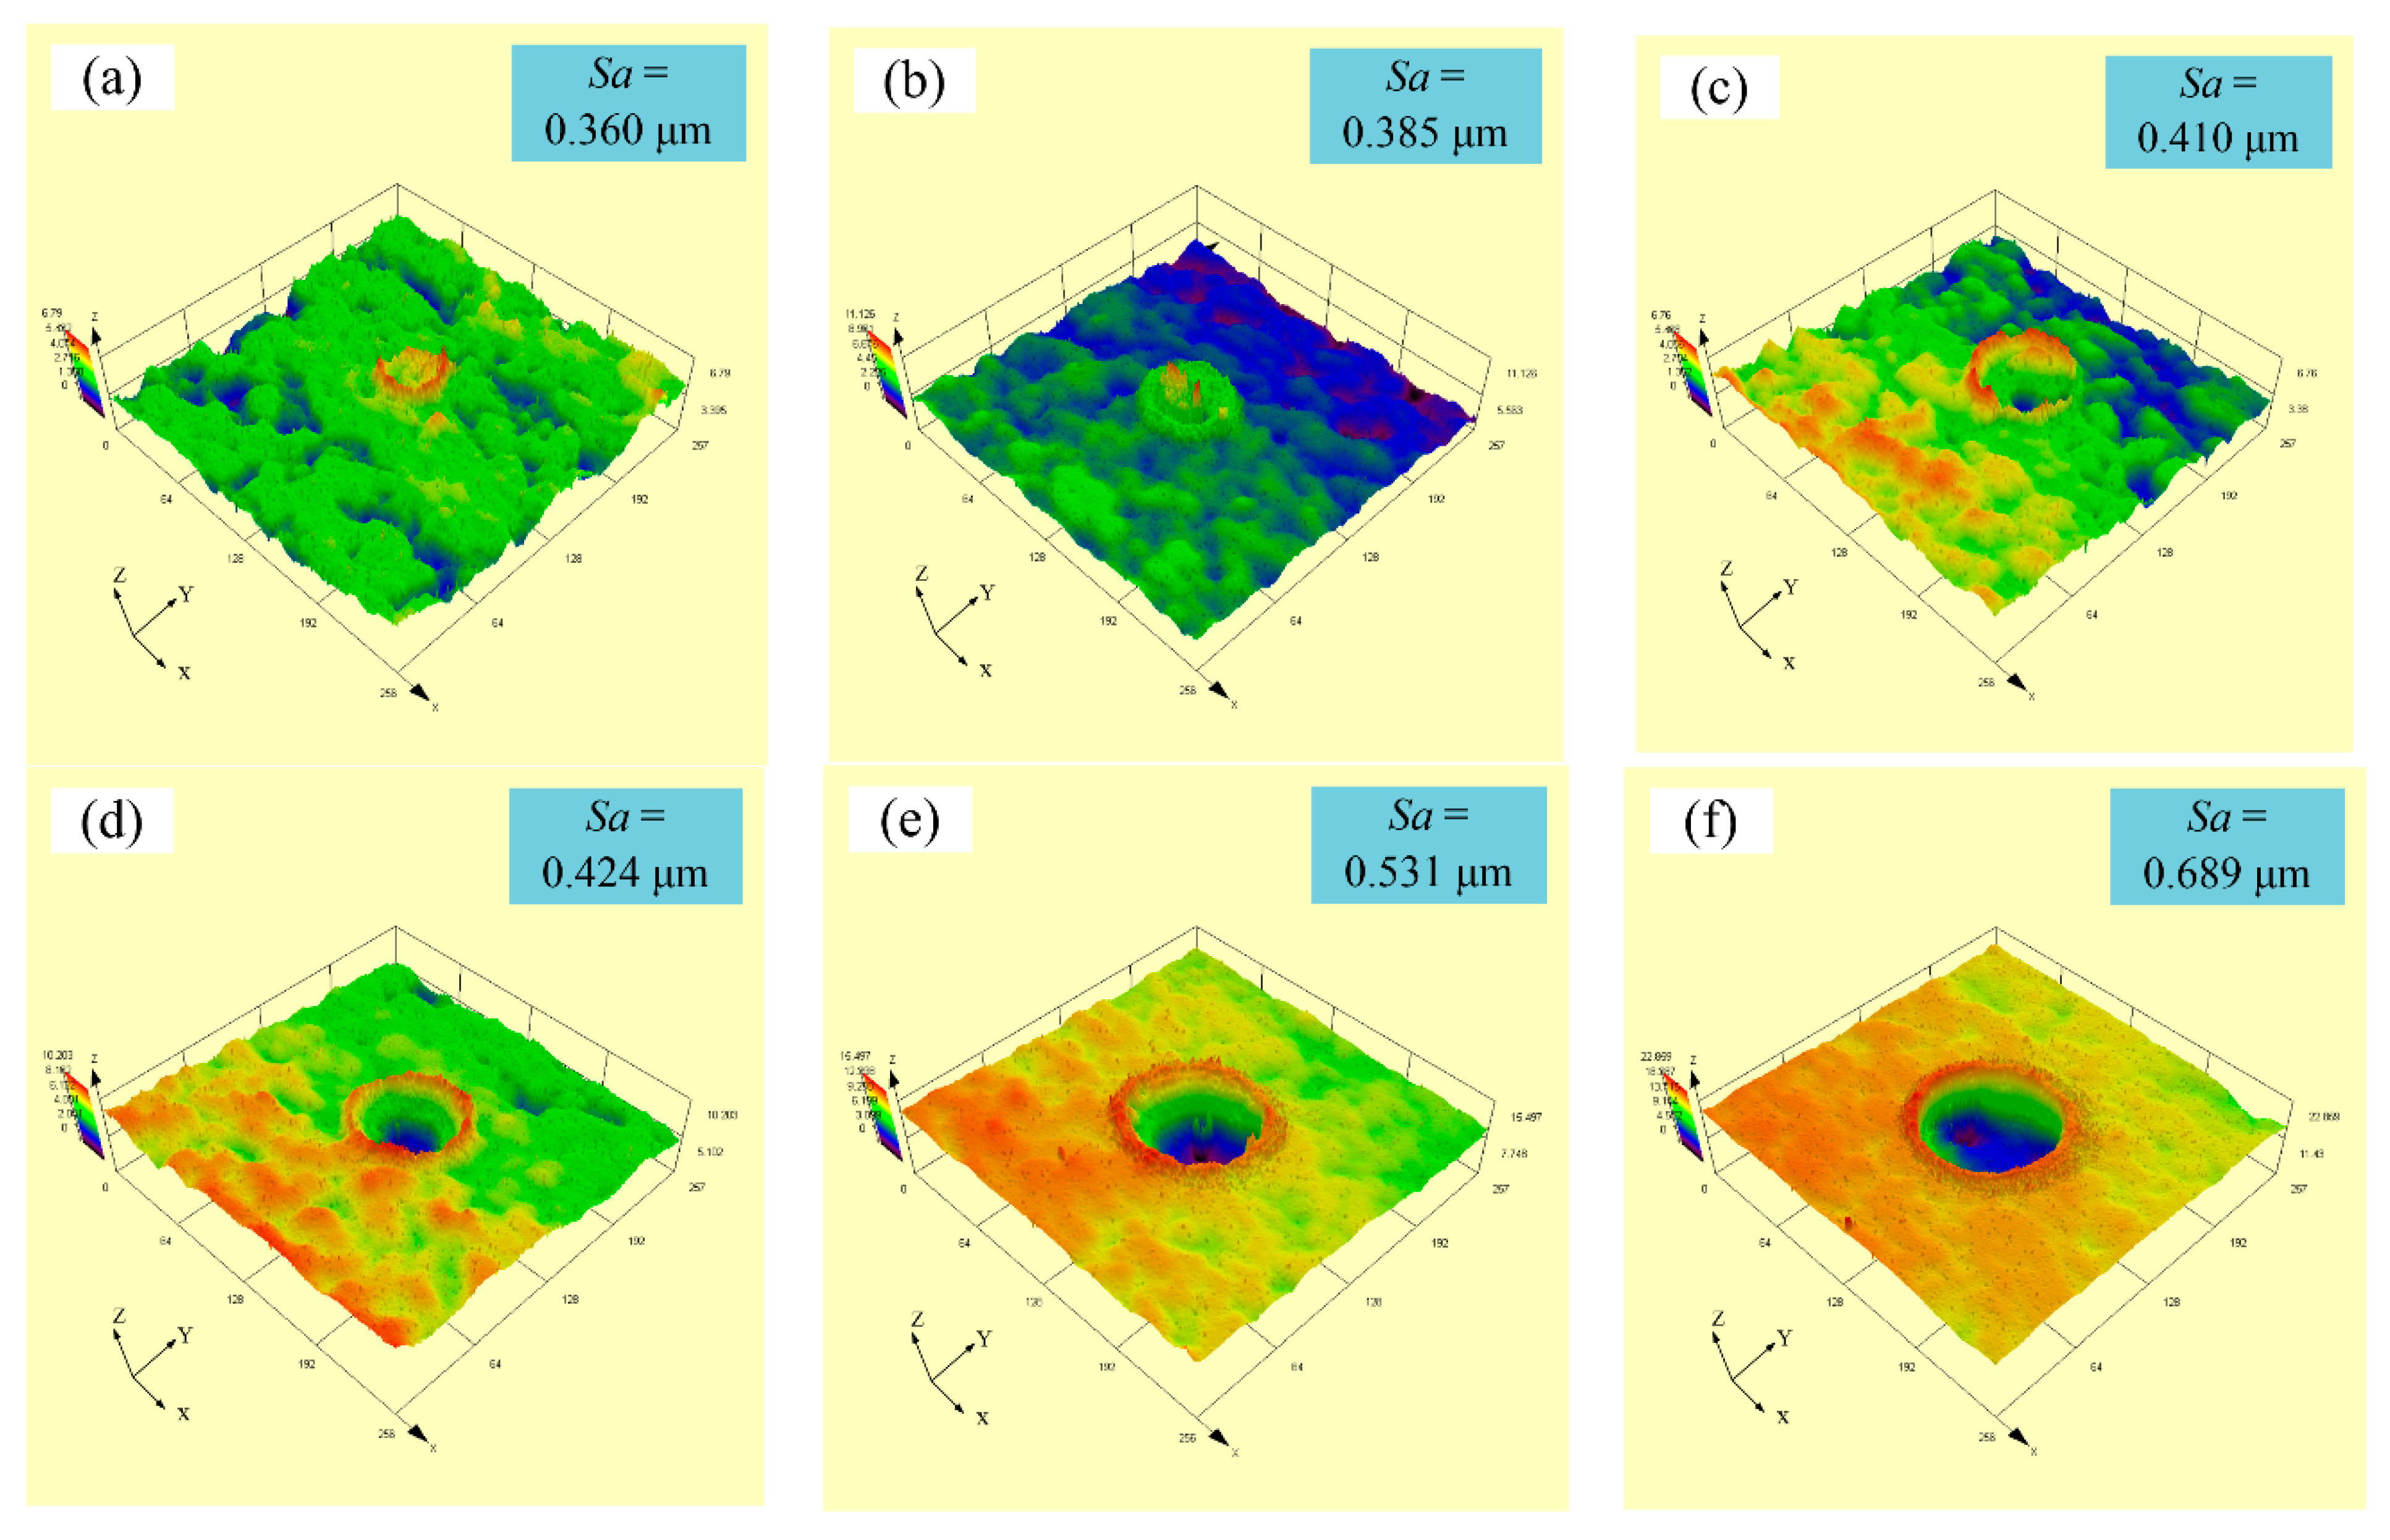
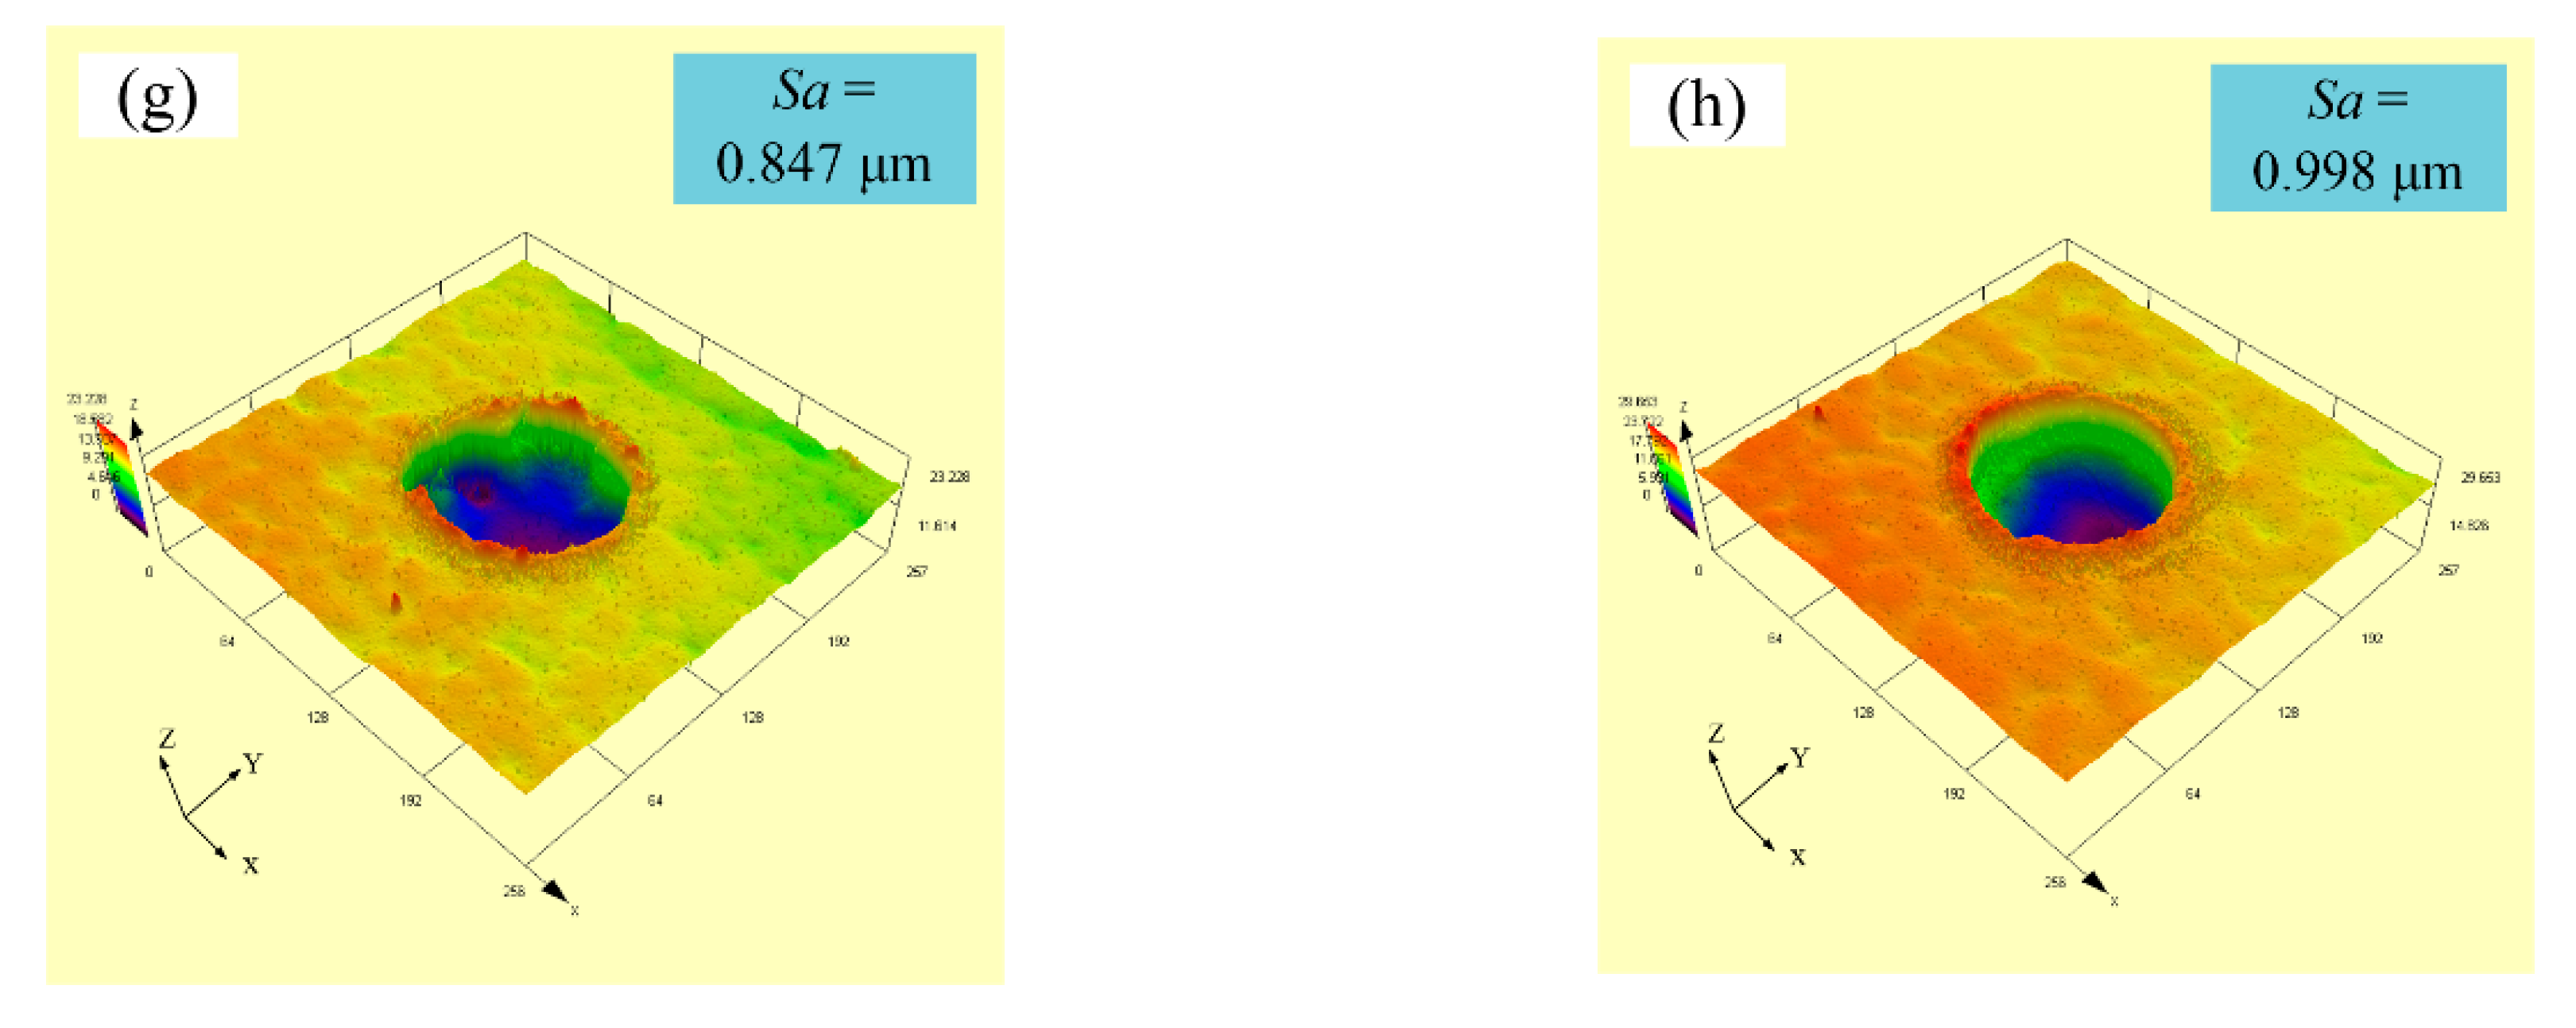
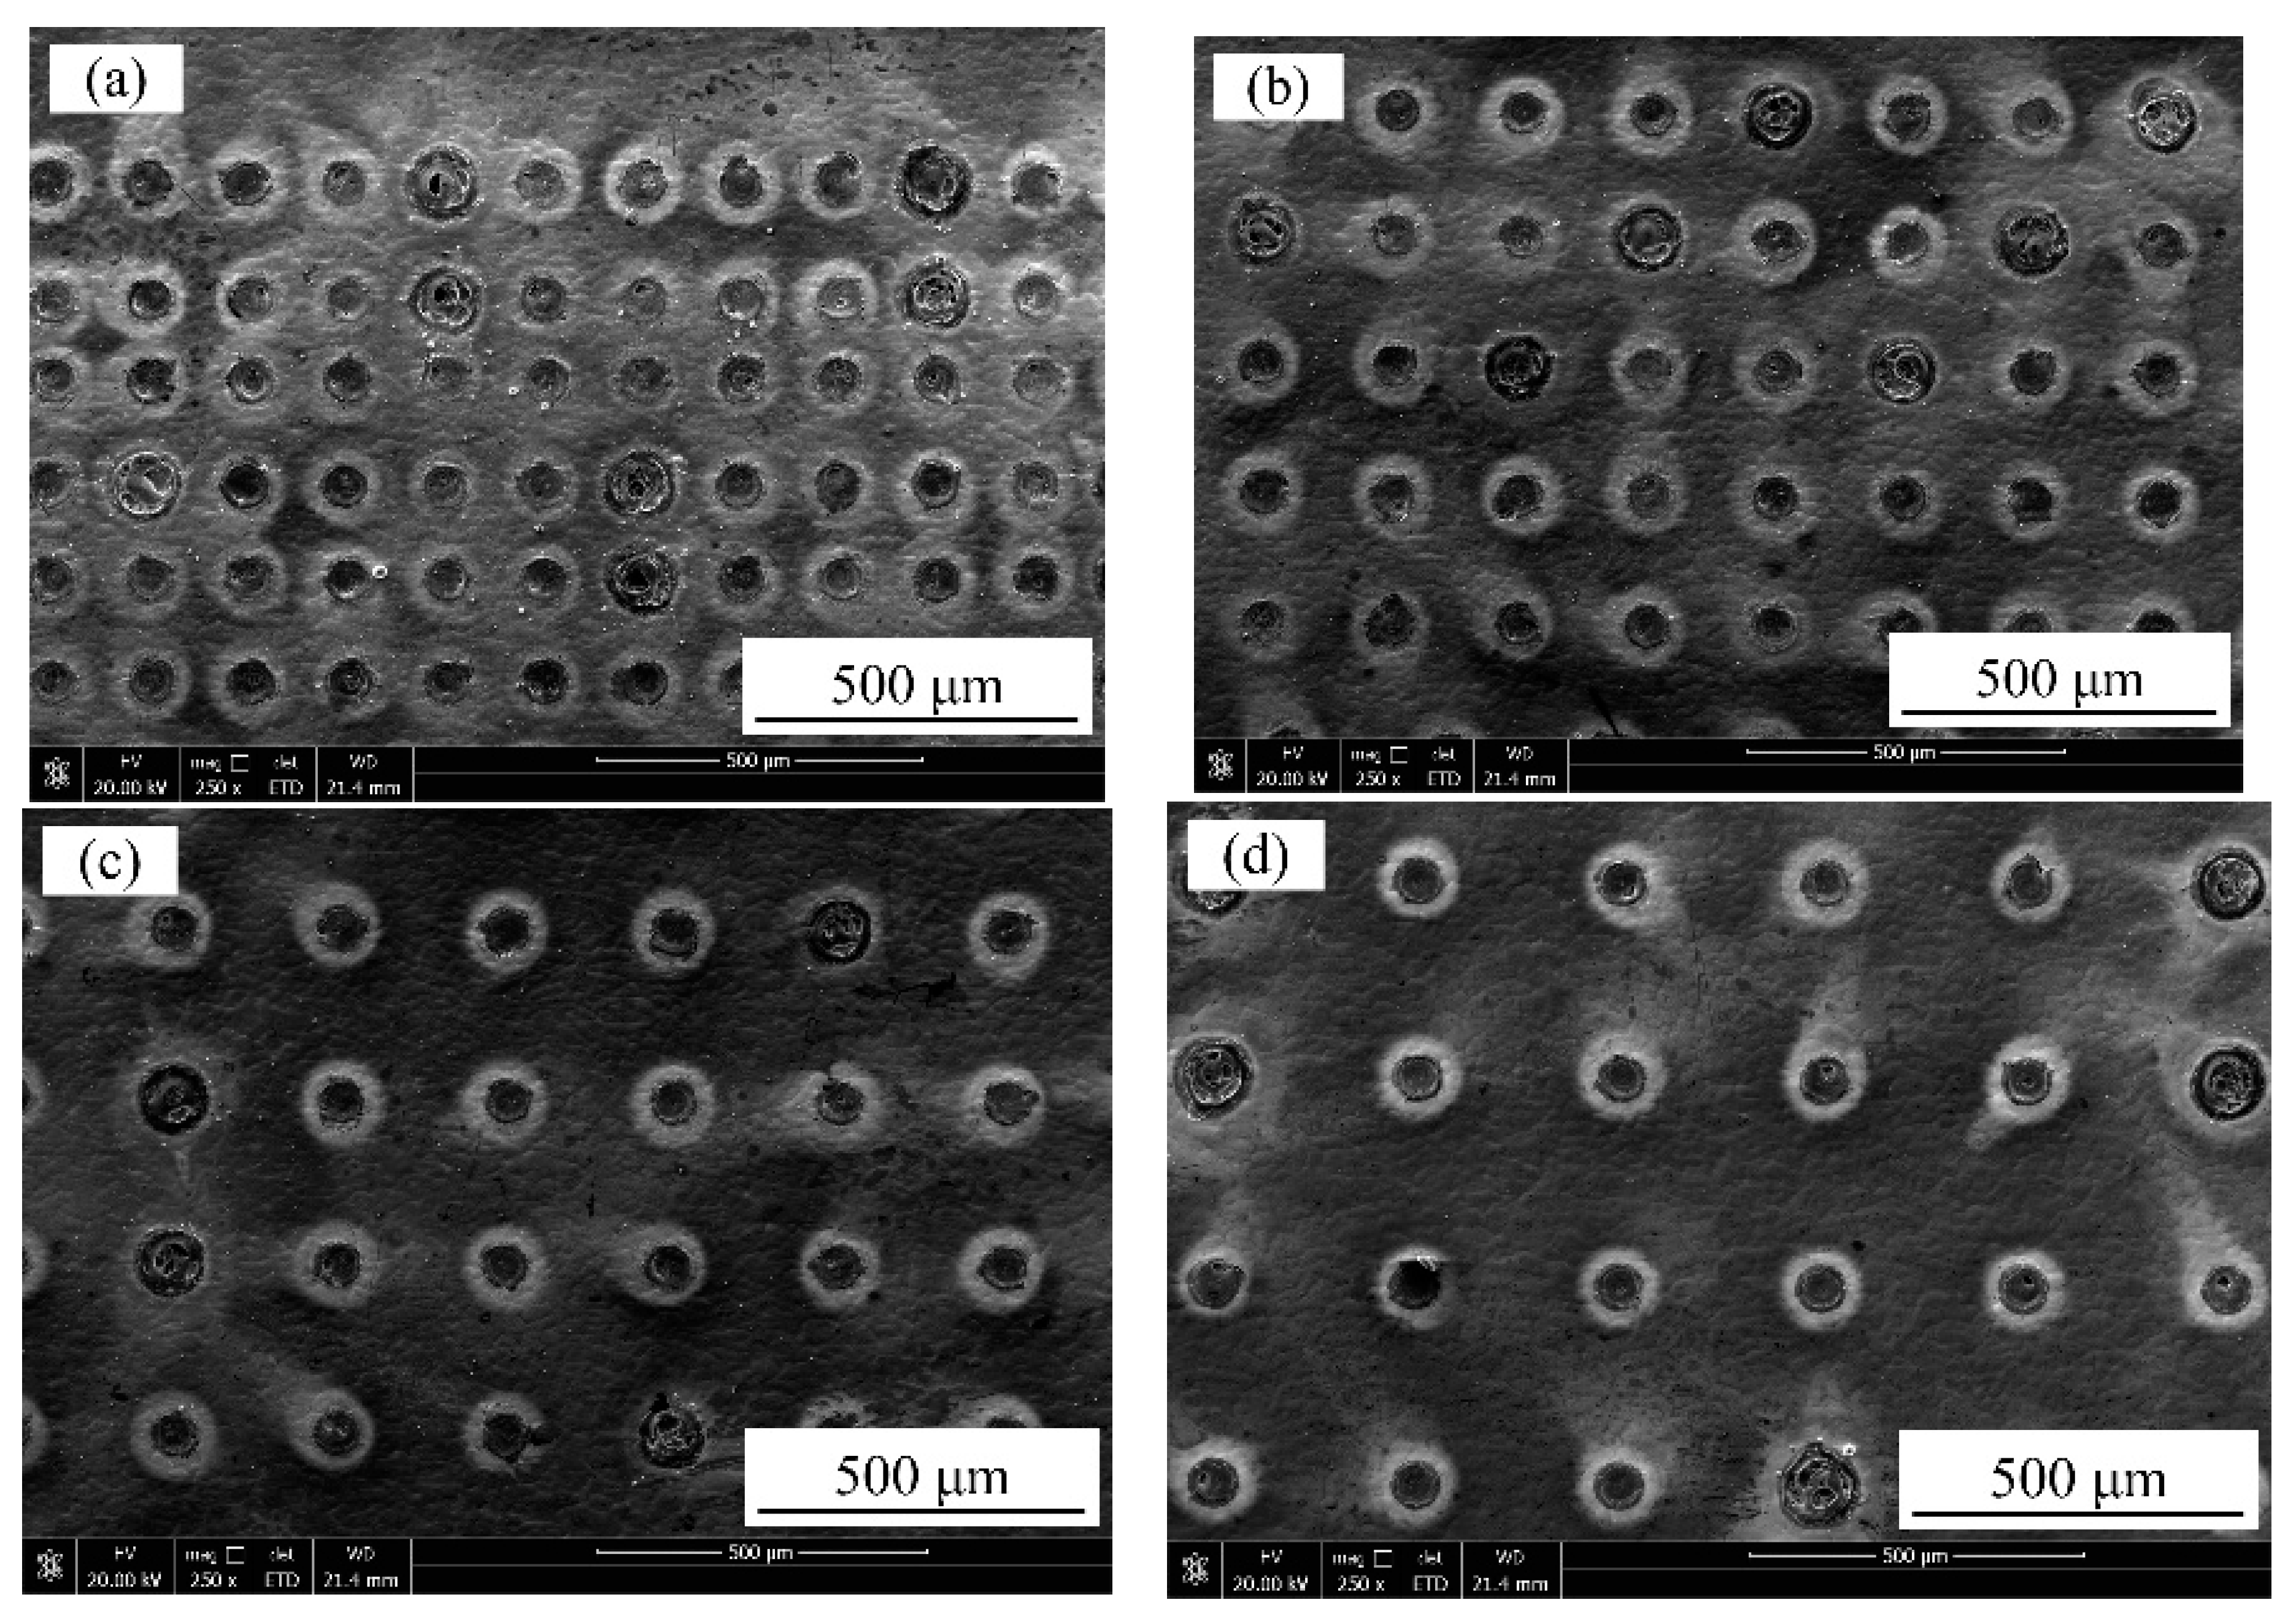
3.1. Effects of Laser Output Power on Samples’ Surface Morphologies and Surface Roughness

Figure 4 shows the effect of varying laser output power on samples’ surface morphologies with a constant pulse width of 50 µs and a spot-to-spot distance of 300 µm. It can be seen that the laser output power had a great influence on the surface morphologies of the samples. When the laser output power corresponded to 50 W, the textured surface diameter (D1) corresponded to 54.48 µm. When the laser output power corresponded to 120 W, the textured surface diameter (D1) corresponded to 133.32 µm. Therefore, it is evident that the textured surface diameter (D1) of samples increased with the rise in laser output power. The above phenomena may be associated with the fact that increasing the laser output power irradiated on the surface caused a high temperature and a serious ablation, thereby making the instantaneous gasification phenomenon become more obvious, which in turn lead to a stronger inward Marangoni flow in the molten pool [20]. On the other hand, it was also observed that the cracks irradiated on the surface gradually increased or widened with increased laser output power.
Figure 5 displays the experimental three-dimensional (3D) images with varying laser output power at a constant pulse width of 50 µs and a spot-to-spot distance of 300 µm. It can be seen from Figure 5a,b that convex domes were formed on the samples’ surface when the laser output power was 50 or 60 W. Meanwhile, the surface roughness (Sa) of samples with a laser output power of 50 and 60 W were 0.360 and 0.385 µm, respectively. A further increase in the laser output power to 70 W caused the surface roughness (Sa) of samples to increase to 0.410 µm. It is clear that the dimple was formed on the samples’ surface instead of the convex dome. In addition, the dimple depth of samples gradually grew with the rise in laser output power. It is evident that the surface roughness (Sa) of samples increased from 0.410 µm to 0.998 µm when the laser output power increased from 70 W to 120 W, respectively.
To further have better comparison and analysis, the experimental two-dimensional (2D) cross-sectional profiles obtained from Figure 5 were shown in Figure 6. It can be seen from Figure 6 that the average bump height of the convex dome on the samples’ surface with a laser output power of 50 and 60 W was 1.39 and 1.74 µm, respectively. However, it was noted that there was a small dimple with a depth of 4.81 µm when the laser output power was 70 W. Additionally, further increase in the laser output power caused the dimple depth to increase, reaching a maximum value of 23.87 µm at 120 W, which penetrated through the coatings and reached the steel C1045 substrate’s surface.
The above phenomena may be explained as follows. When the fiber laser beam acted on the surface of samples, the irradiated surface went through three-phase transformation processes: thermoelastic expansion, melting and gasification. In the beginning, the Ni and Co elements both formed oxide layers (NiO and CoO) on the surface’s irradiated zone with a low laser output power. A higher temperature, coupled with a thicker oxide layer, produced a convex dome on the samples’ surface. Then, the temperature at the center of the convex dome increased with the increase in laser output power. Moreover, the temperature at the surface center of the bump exceeded the melting point with an increase in the irradiation time. The surface tension became negative, and the Marangoni flow drove the molten metal outward to form a dimple. As a result, the recoil pressure was large and the instantaneous gasification phenomenon was obvious, which led to the formation of the dimple on the samples’ surface.
Similar morphology was obtained by Wang et al. [18]. It was observed that an increase in laser output power further increased the diameter (D1) and depth of the dimple. The research done by Wang et al. [24] also showed that the depth of the cavity increased with the energy density of the laser, and the development trend of the diameter (D1) was consistent with that of the depth. Zhou et al. [25] reported that the surface tension was dominant for the bump shape and also analyzed the mechanism of the microstructure produced by using the long-pulse laser from the bump to the dimple in detail.

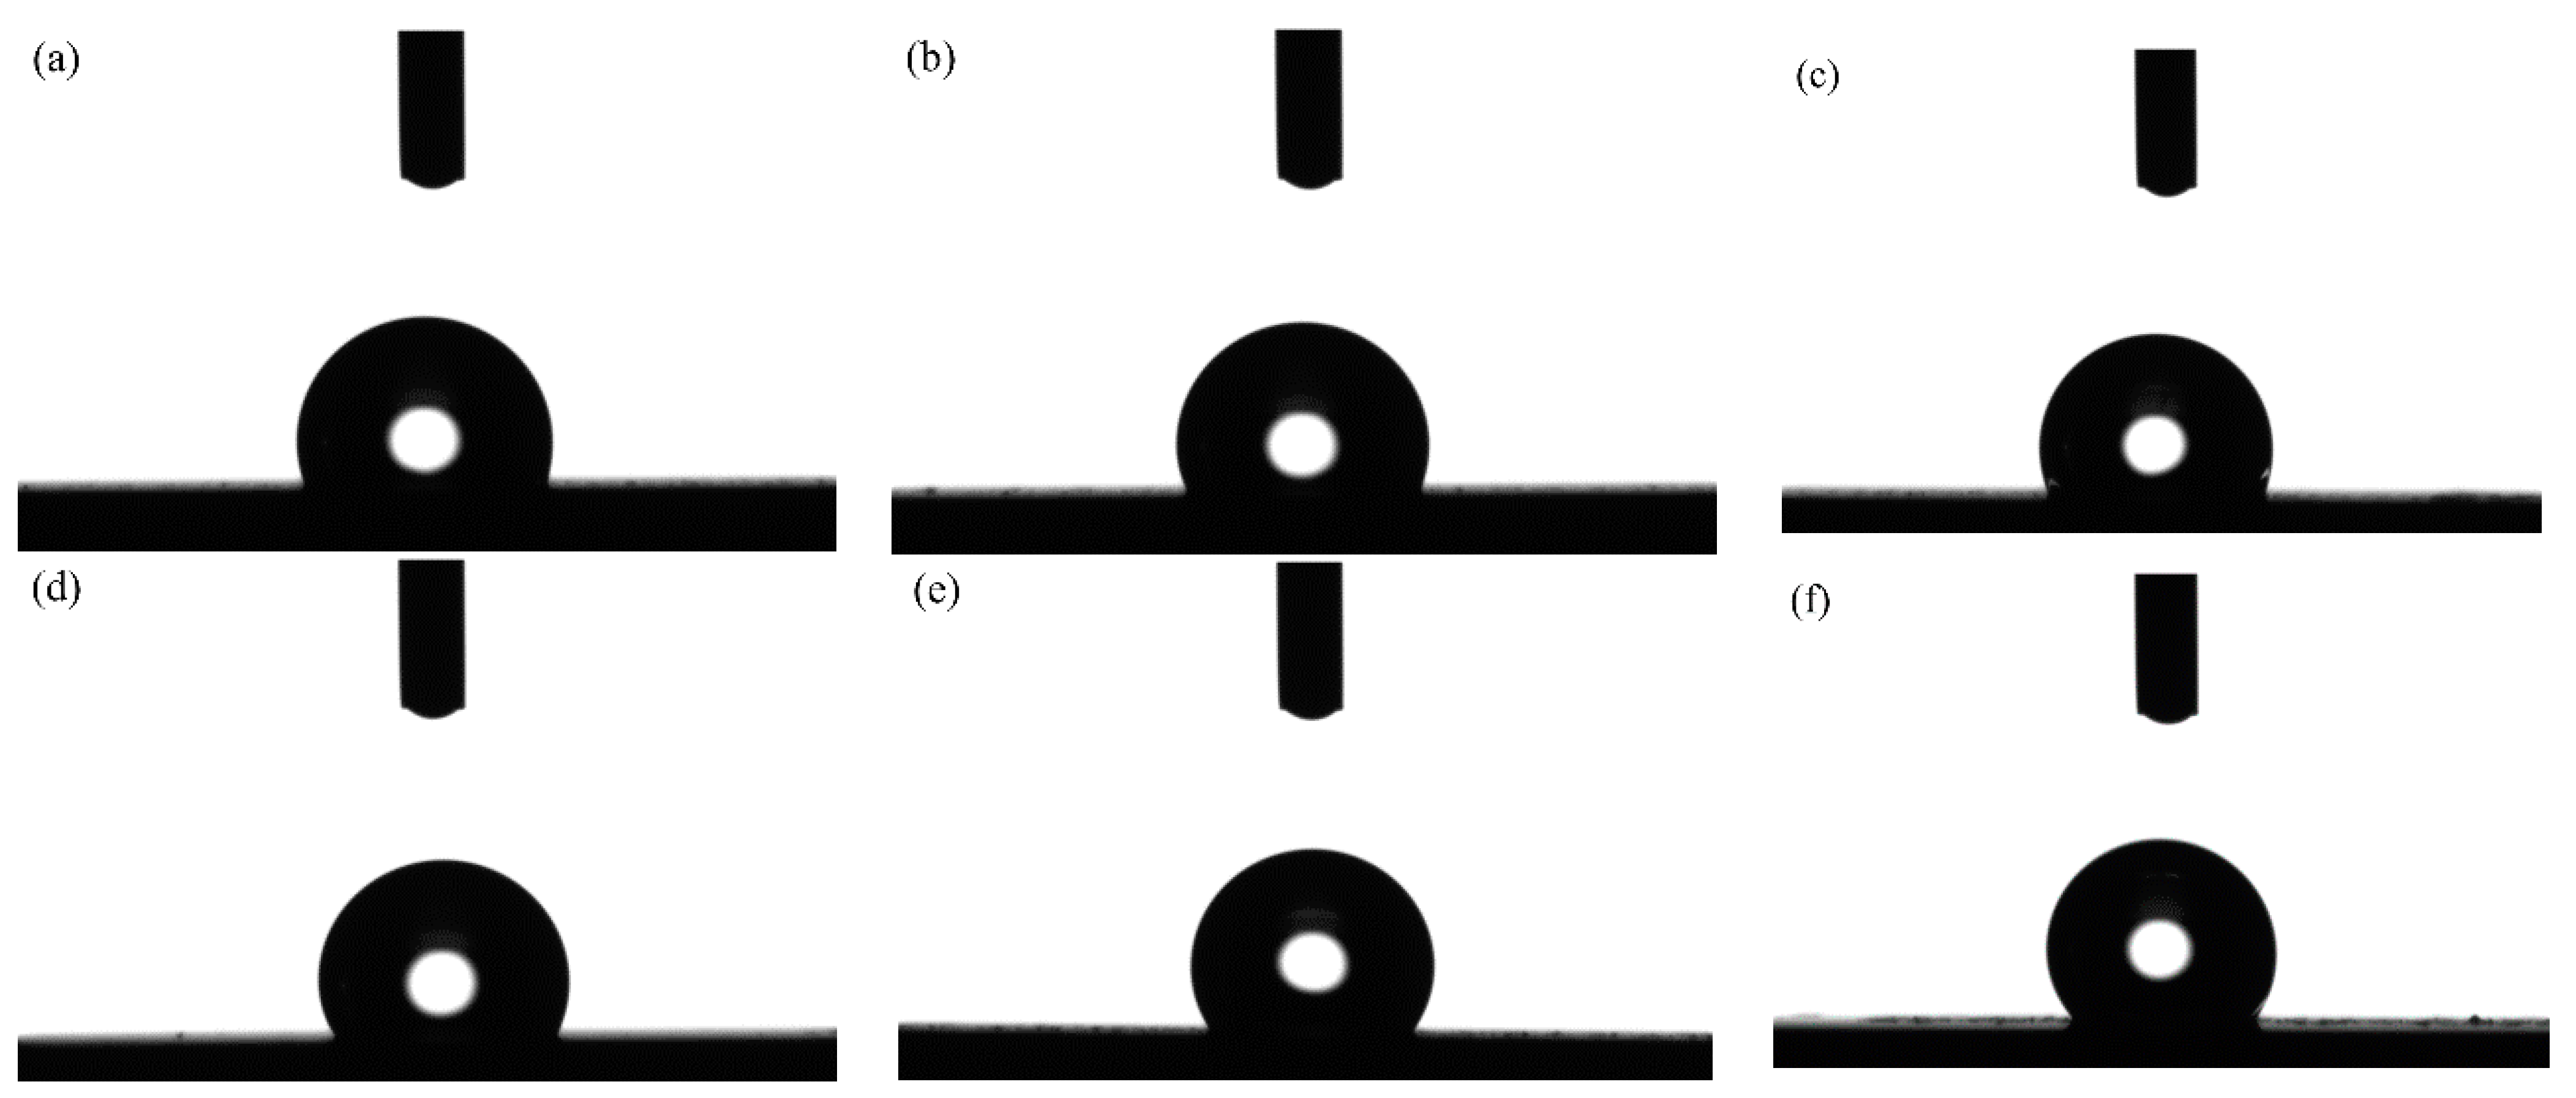
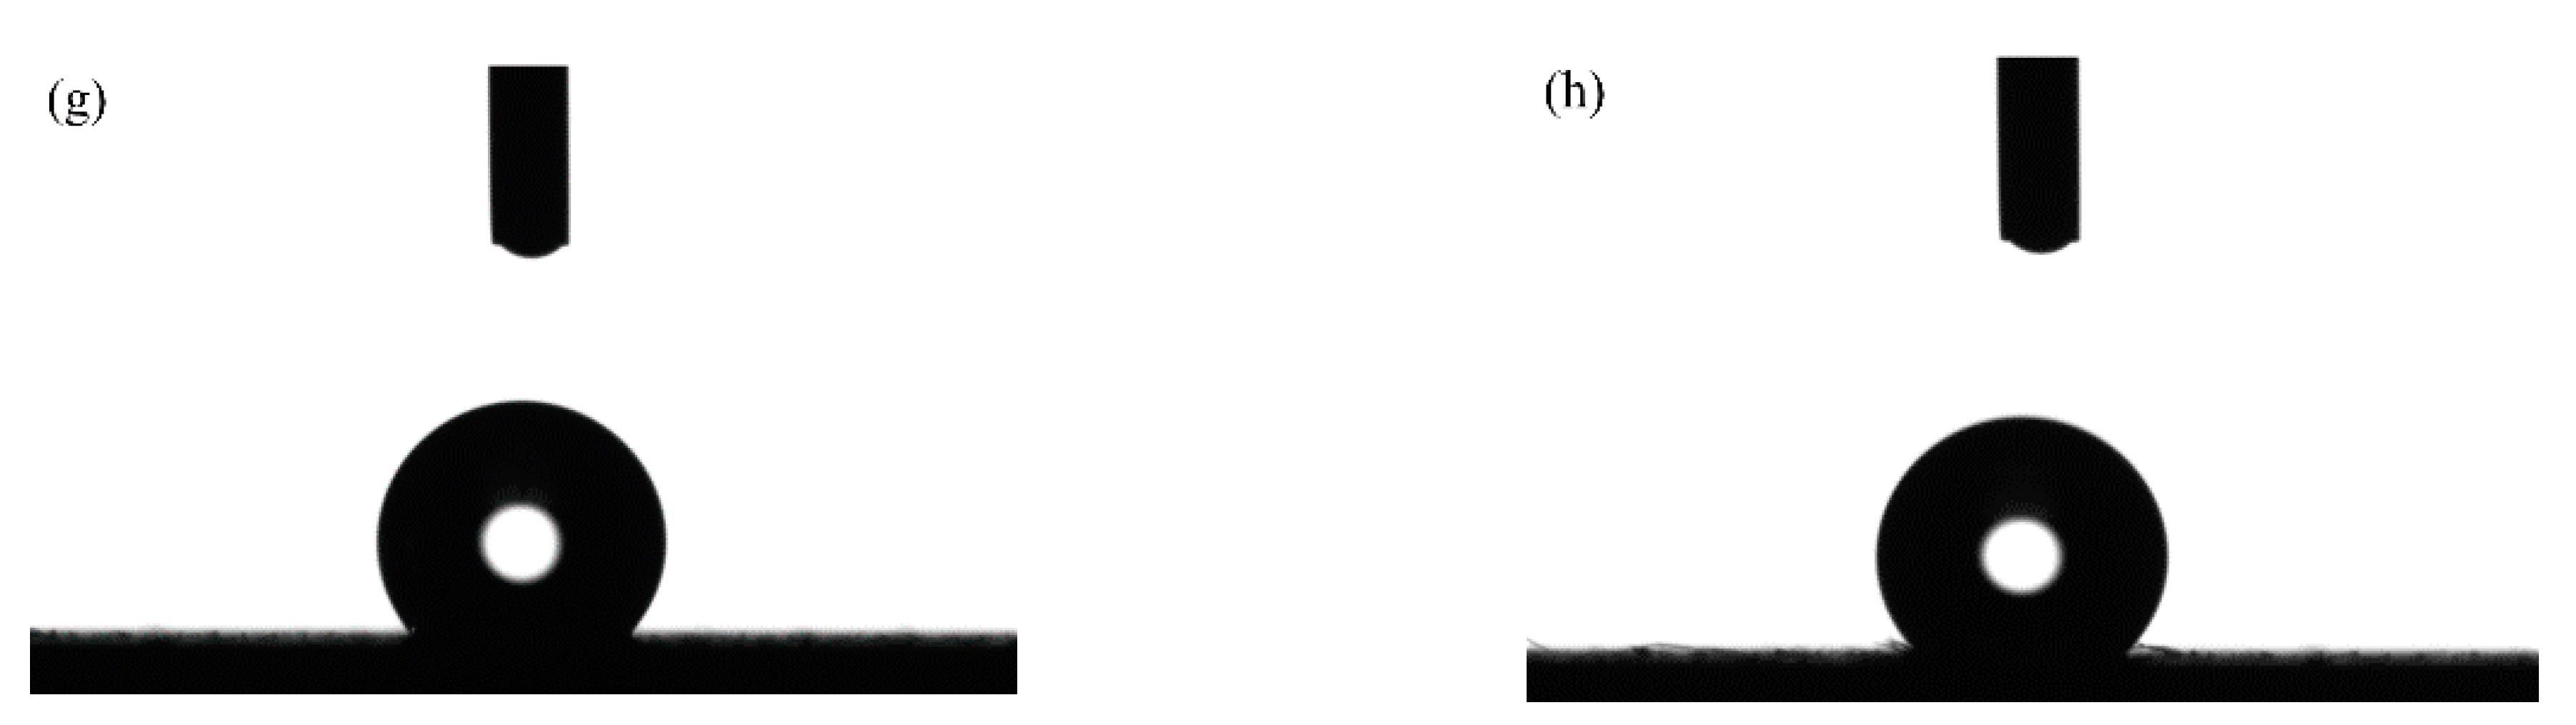
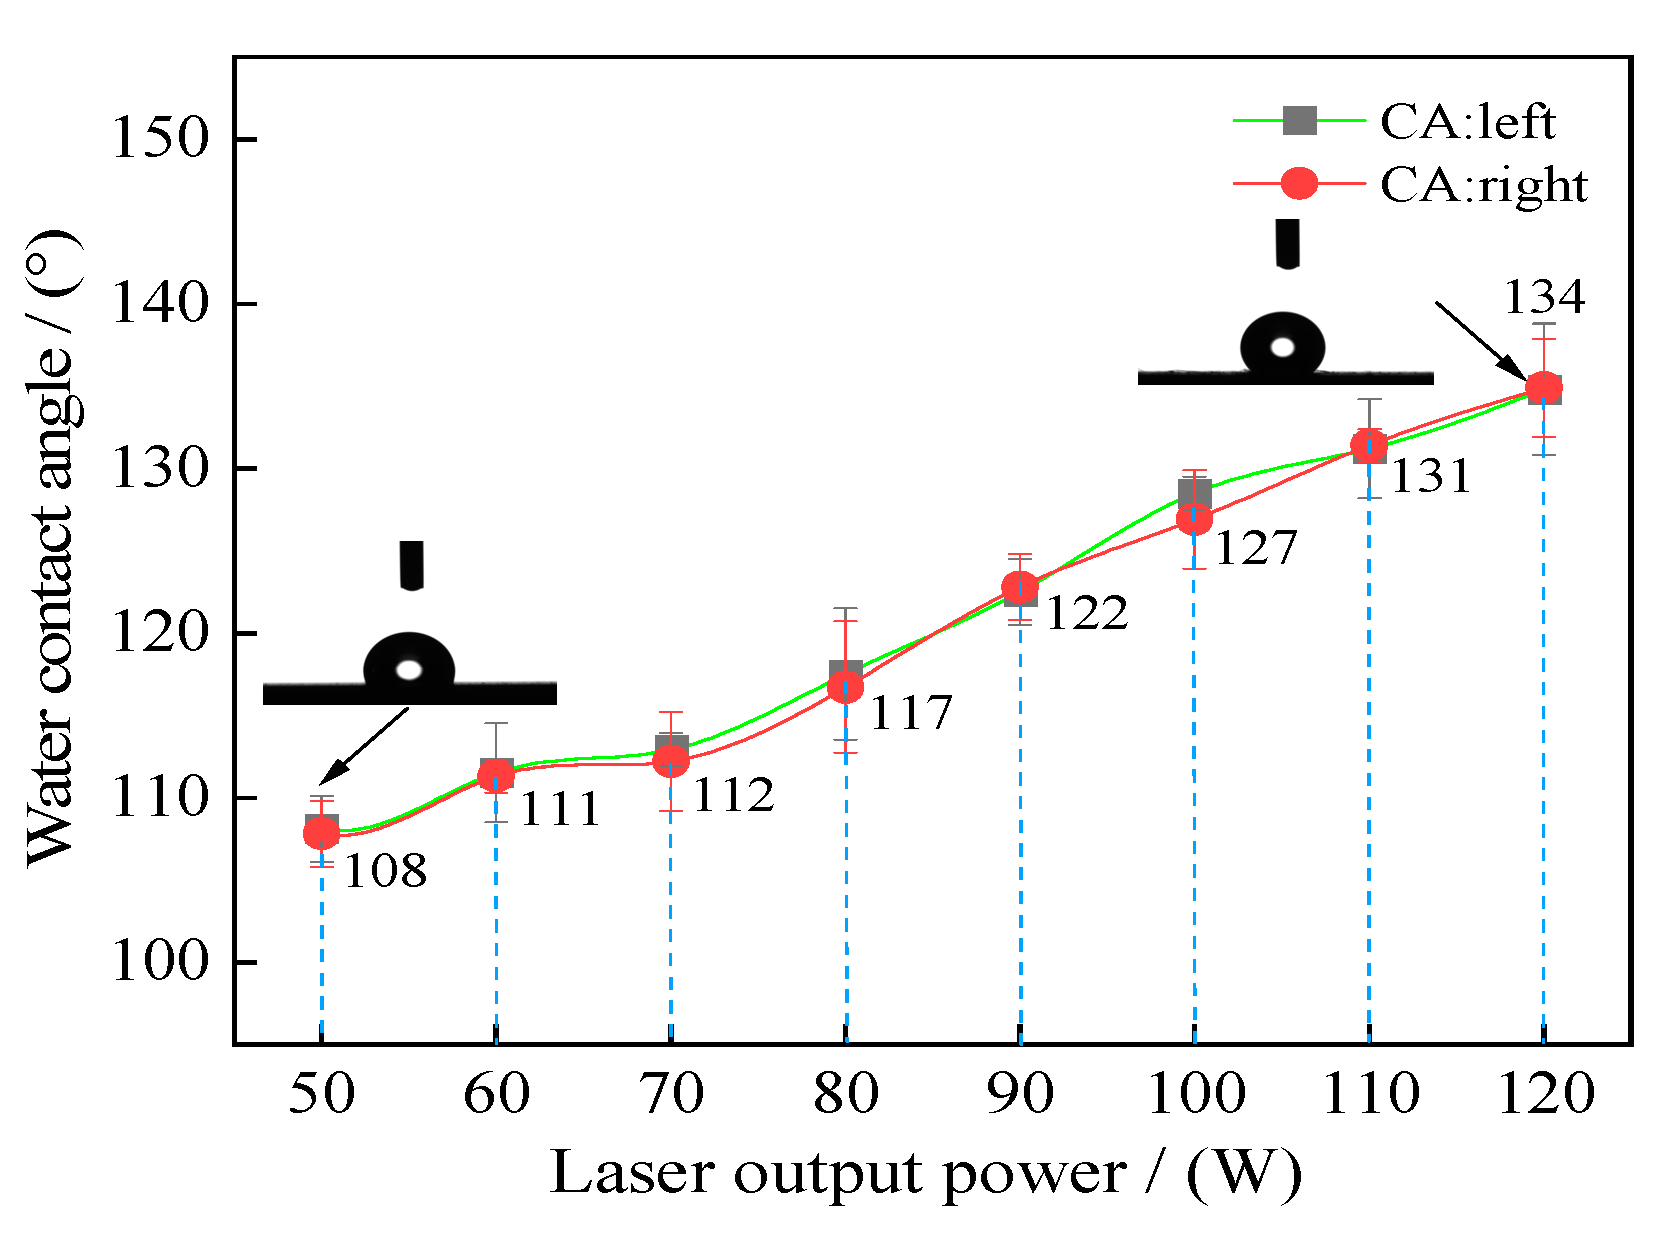
3.2. Effects of Laser Output Power on Samples’ Surface Wettability

Based on the previous experimental results and reported research conclusions, it was difficult to prepare the superhydrophobic surface only by constructing the surface’s micro–nano composite structure or simply treating the surface with low surface energy. Therefore, all the samples after the laser processing were modified using a fluoroalkyl silane. Figure 7 shows the optical profiles of the water drop of the textured surface with varying laser output power at a constant pulse width of 50 µs and a spot-to-spot distance of 300 µm. It is worth noting that the laser output power significantly influenced wettability. At the same time, the samples’ surface showed weak hydrophobicity when the laser output power was 50 W. Moreover, the apparent solid–liquid (SL) contact surface area between the samples and water droplets decreased with the rise in laser output power. At a laser output power of 120 W, the water contact surface was smaller, thereby improving the hydrophobicity of the samples’ surface.
In order to analyze the effects of laser output power on the wettability of the samples’ surface, the water contact angles of the textured surface with varying laser output power were recorded as shown in Figure 8. As shown in the figure, when the laser output power corresponded to 50 W, the water contact angle of samples corresponded to 108.4°. The water contact angle of samples increased with the rise in laser output power. Moreover, when the laser output power corresponded to 120 W, the water contact angle of samples reached a maximum value of 134.3°. Additionally, lower surface energy and a higher surface roughness indicate better hydrophobicity. During this research, all the samples using laser processing were soaked in the fluoroalkyl silane alcohol solution for 2 h without stirring. Thus, the above phenomena can be mainly explained by surface roughness.
According to the samples’ surface morphologies and surface roughness (see Figure 4 and Figure 5), the appearance of the convex dome and dimple on the surface changed the original samples’ micro-structures and surface roughness, which improved the water contact angle and influenced wettability. Additionally, when the laser output power corresponded to 50 W, a convex dome was formed on the samples’ surface, which corresponded to a surface roughness of 0.360 µm. When the laser output power increased to 120 W, a dimple was formed on the samples’ surface with a corresponding surface roughness of 0.998 µm, which increased the samples’ surface water contact angle and further improved hydrophobicity. A similar result was reported by Yung et al. [26]. It was found that the water contact angle increased with an increase in surface roughness on a hydrophobic surface. Jing et al. [27] studied that the effect of laser power and scanning velocity on wettability. It was reported that the samples’ water contact angles generally increased with an increase in laser power.

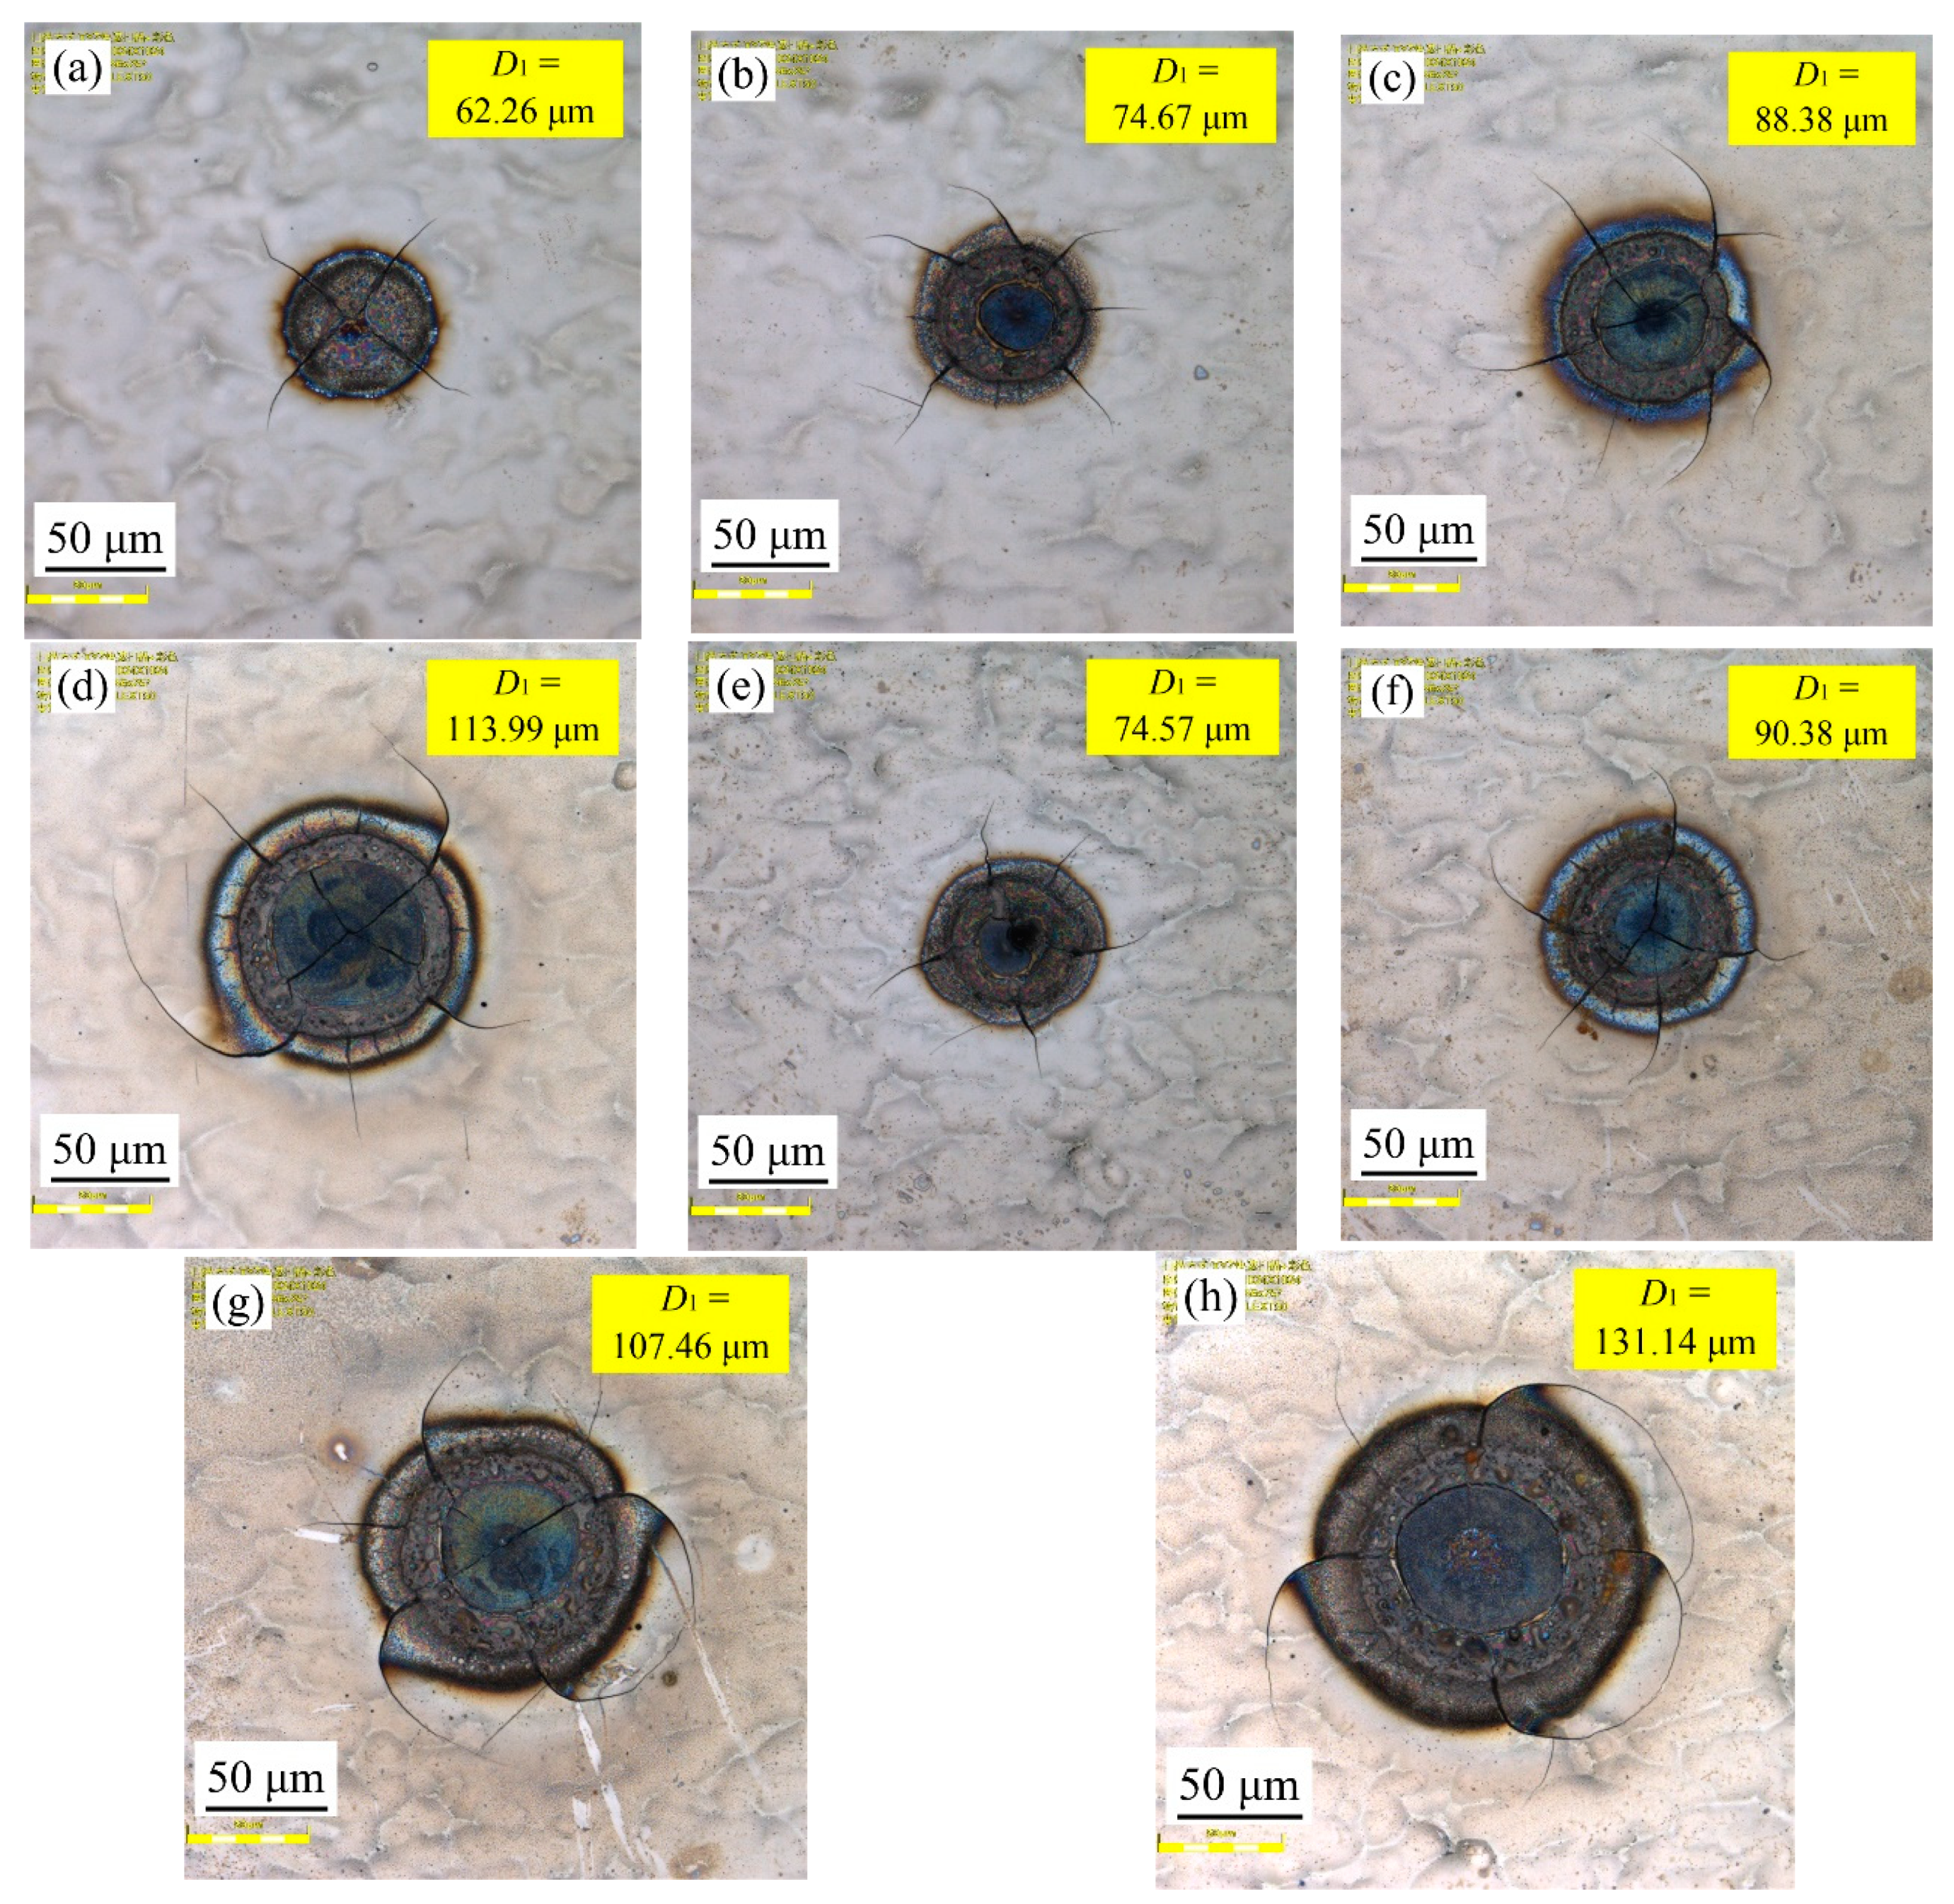
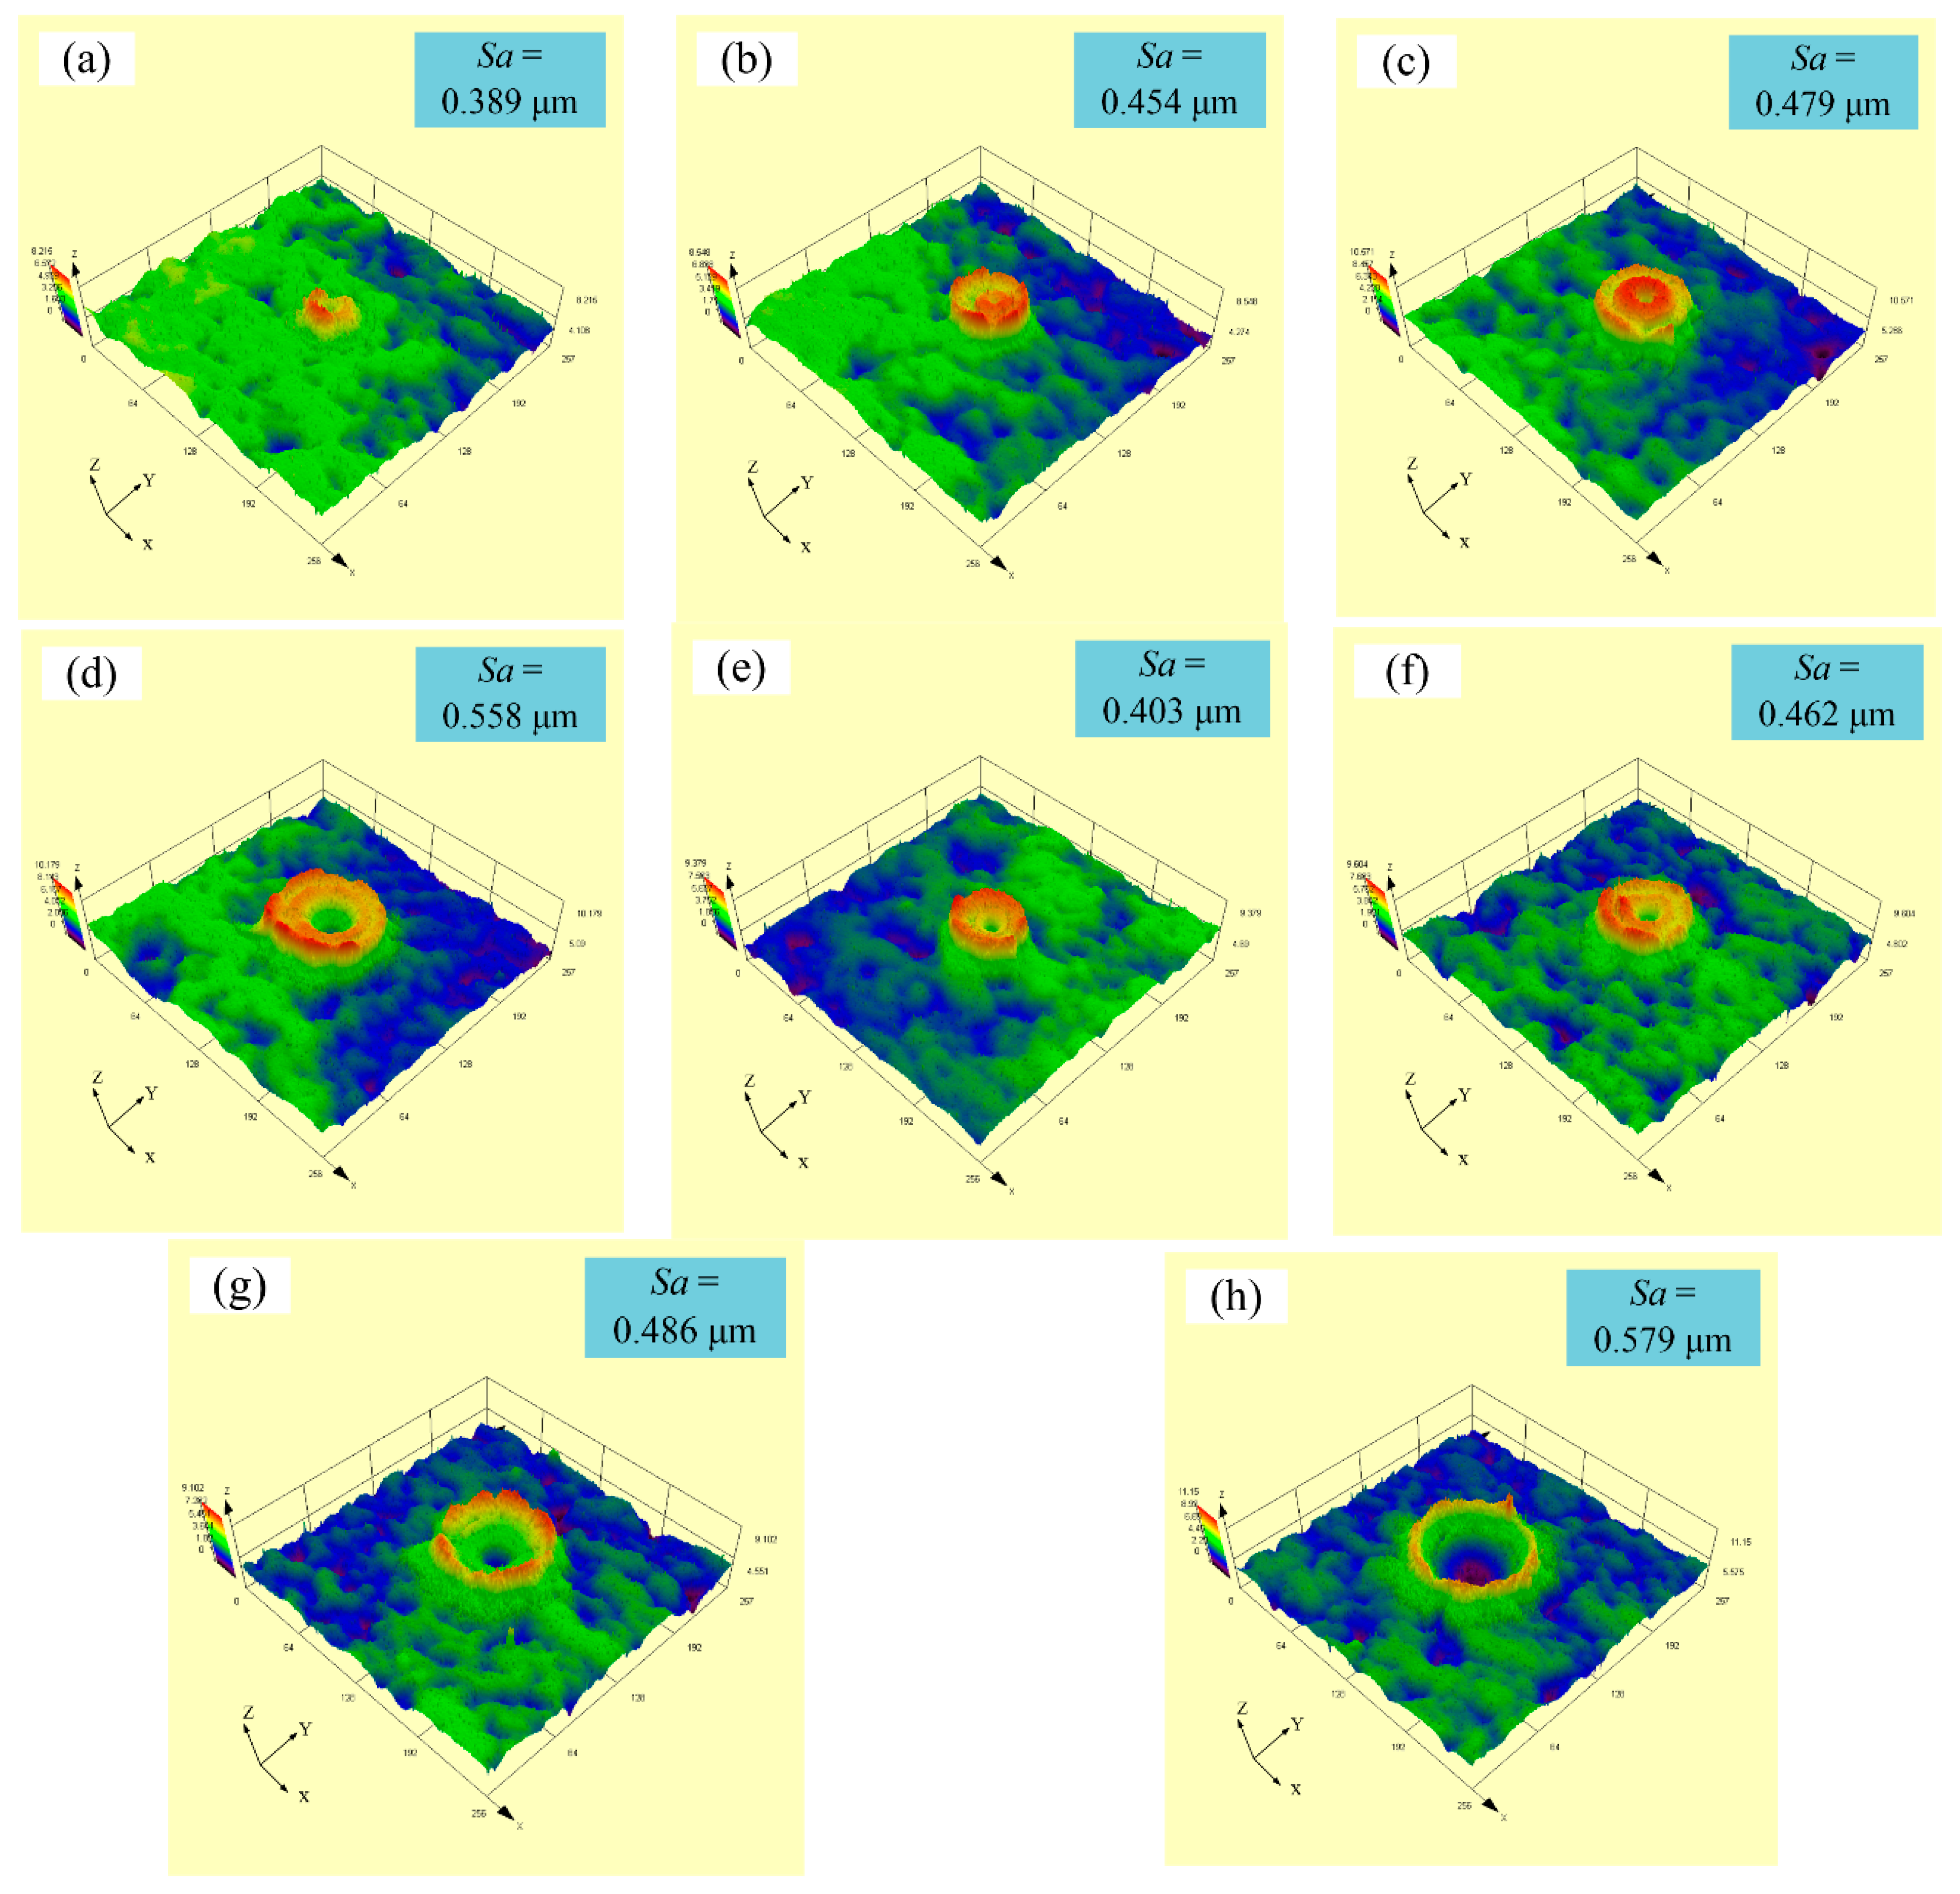
3.3. Effects of Pulse Width on Samples’ Surface Morphologies and Surface Roughness

Figure 9 shows the effect of varying pulse width on samples’ surface morphologies at a spot-to-spot distance of 300 µm. It can be seen from Figure 9 that pulse width had a great influence on the surface morphologies of the samples. Where the laser output power was constant at 50 W, it is observed in Figure 9a–d that the textured surface diameter (D1) increased from 62.26 to 113.99 µm with an increase in the pulse width from 75 to 150 µs. Additionally, with a constant laser output power of 60 W, it was observed from Figure 9e–h that the textured surface diameter (D1) increased from 74.57 to 131.14 µm with an increase in the pulse width from 75 to 150 µs. It was found that the textured surface diameter (D1) increased with the increase in pulse width at a constant laser output power, and the cracks irradiated on the surface also increased or widened gradually with increased pulse width.
Figure 10 shows experimental three-dimensional (3D) images with a varying pulse width, ranging from 75 to 150 µs at a spot-to-spot distance of 300 µm. With a constant laser output power of 50 W, it was observed from Figure 10a–d that the surface roughness (Sa) of samples increased from 0.389 to 0.558 µm with an increase in the pulse width from 75 to 150 µs. Meanwhile, with a constant laser output power of 60 W, it was observed from Figure 10e–h that the surface roughness (Sa) of samples increased from 0.403 to 0.579 µm with the increase in the pulse width from 75 to 150 µs. It is clear that the surface roughness (Sa) of samples increased with the rise in pulse width at a constant laser output power of 50 or 60 W. In addition, it can be seen from Figure 10a–d that the convex dome was formed on the samples’ surfaces with a varying pulse width ranging from 75 to 150 µs. Furthermore, the diameter of the created convex dome became larger with the rise in pulse width. However, with a further increase in the pulse width, it was found that a small dimple was formed at the center of the created convex dome (see Figure 10d). Moreover, combined with Figure 10e–h, a convex dome was formed on the samples’ surfaces as the pulse width increased from 75 to 100 µs. Further increase in the pulse width up to 150 µs accelerated the dimple depth of samples. Therefore, the experiments show that the suitable pulse width with a constant laser output power was 100 µs. Similar results were reported by Wang et al. [18]. It was found that the convex dome could be obtained under a low laser output power. Moreover, Li et al. [21] studied the influences of ambient air on surface topographies for different laser fluences and reported the irradiated zone presented the ‘‘flat-topped” bump around the microstructure edge with the increase of laser fluence.
The experimental two-dimensional (2D) cross-sectional profiles obtained from Figure 10 were shown in Figure 11. It can be seen from Figure 11a–d that the average bump height of convex dome on the samples’ surface increased from 2.18 µm at 75 µs to 5.76 µm at 150 µs. The average bump height of the convex dome on the samples’ surface increased with the rise in pulse width at a constant laser output power of 50 W. However, it is clear that the dimple (4.35 µm) was formed at the center of the created convex dome at 125 µs. Additionally, further increase in the pulse width caused the dimple depth to increase, reaching a value of 7.04 µm at 150 µs and a power of 50 W. It can be seen from Figure 11e–h that the dimple was formed at the center of the created convex dome with a varying pulse width ranging from 75 to 150 µs. The maximum dimple depth of convex dome on the samples’ surface at a power of 60 W coupled with the pulse width increased from 2.72 µm at 75 µs to 7.65 µm at 150 µs.
The above phenomena may be associated with the Marangoni effect driven by a surface tension gradient. The time required for the samples’ surface temperature to reach the melting point may decrease with the rise in pulse width. The molten liquid flowed outward from the center of the created convex dome to the edge, which formed the small dimple on the center of the created convex dome. According to Wang et al. [20], the diameter and height of the created convex dome became larger with increasing laser power. In addition, there was a tiny dimple at the center of the convex dome. Similar results were reported in previous studies [19]. Therefore, the experimental two-dimensional (2D) cross-sectional profiles show that the suitable pulse width with a constant laser output power of 50 W was 100 µs, which was beneficial for creating the convex dome on the samples’ surface.

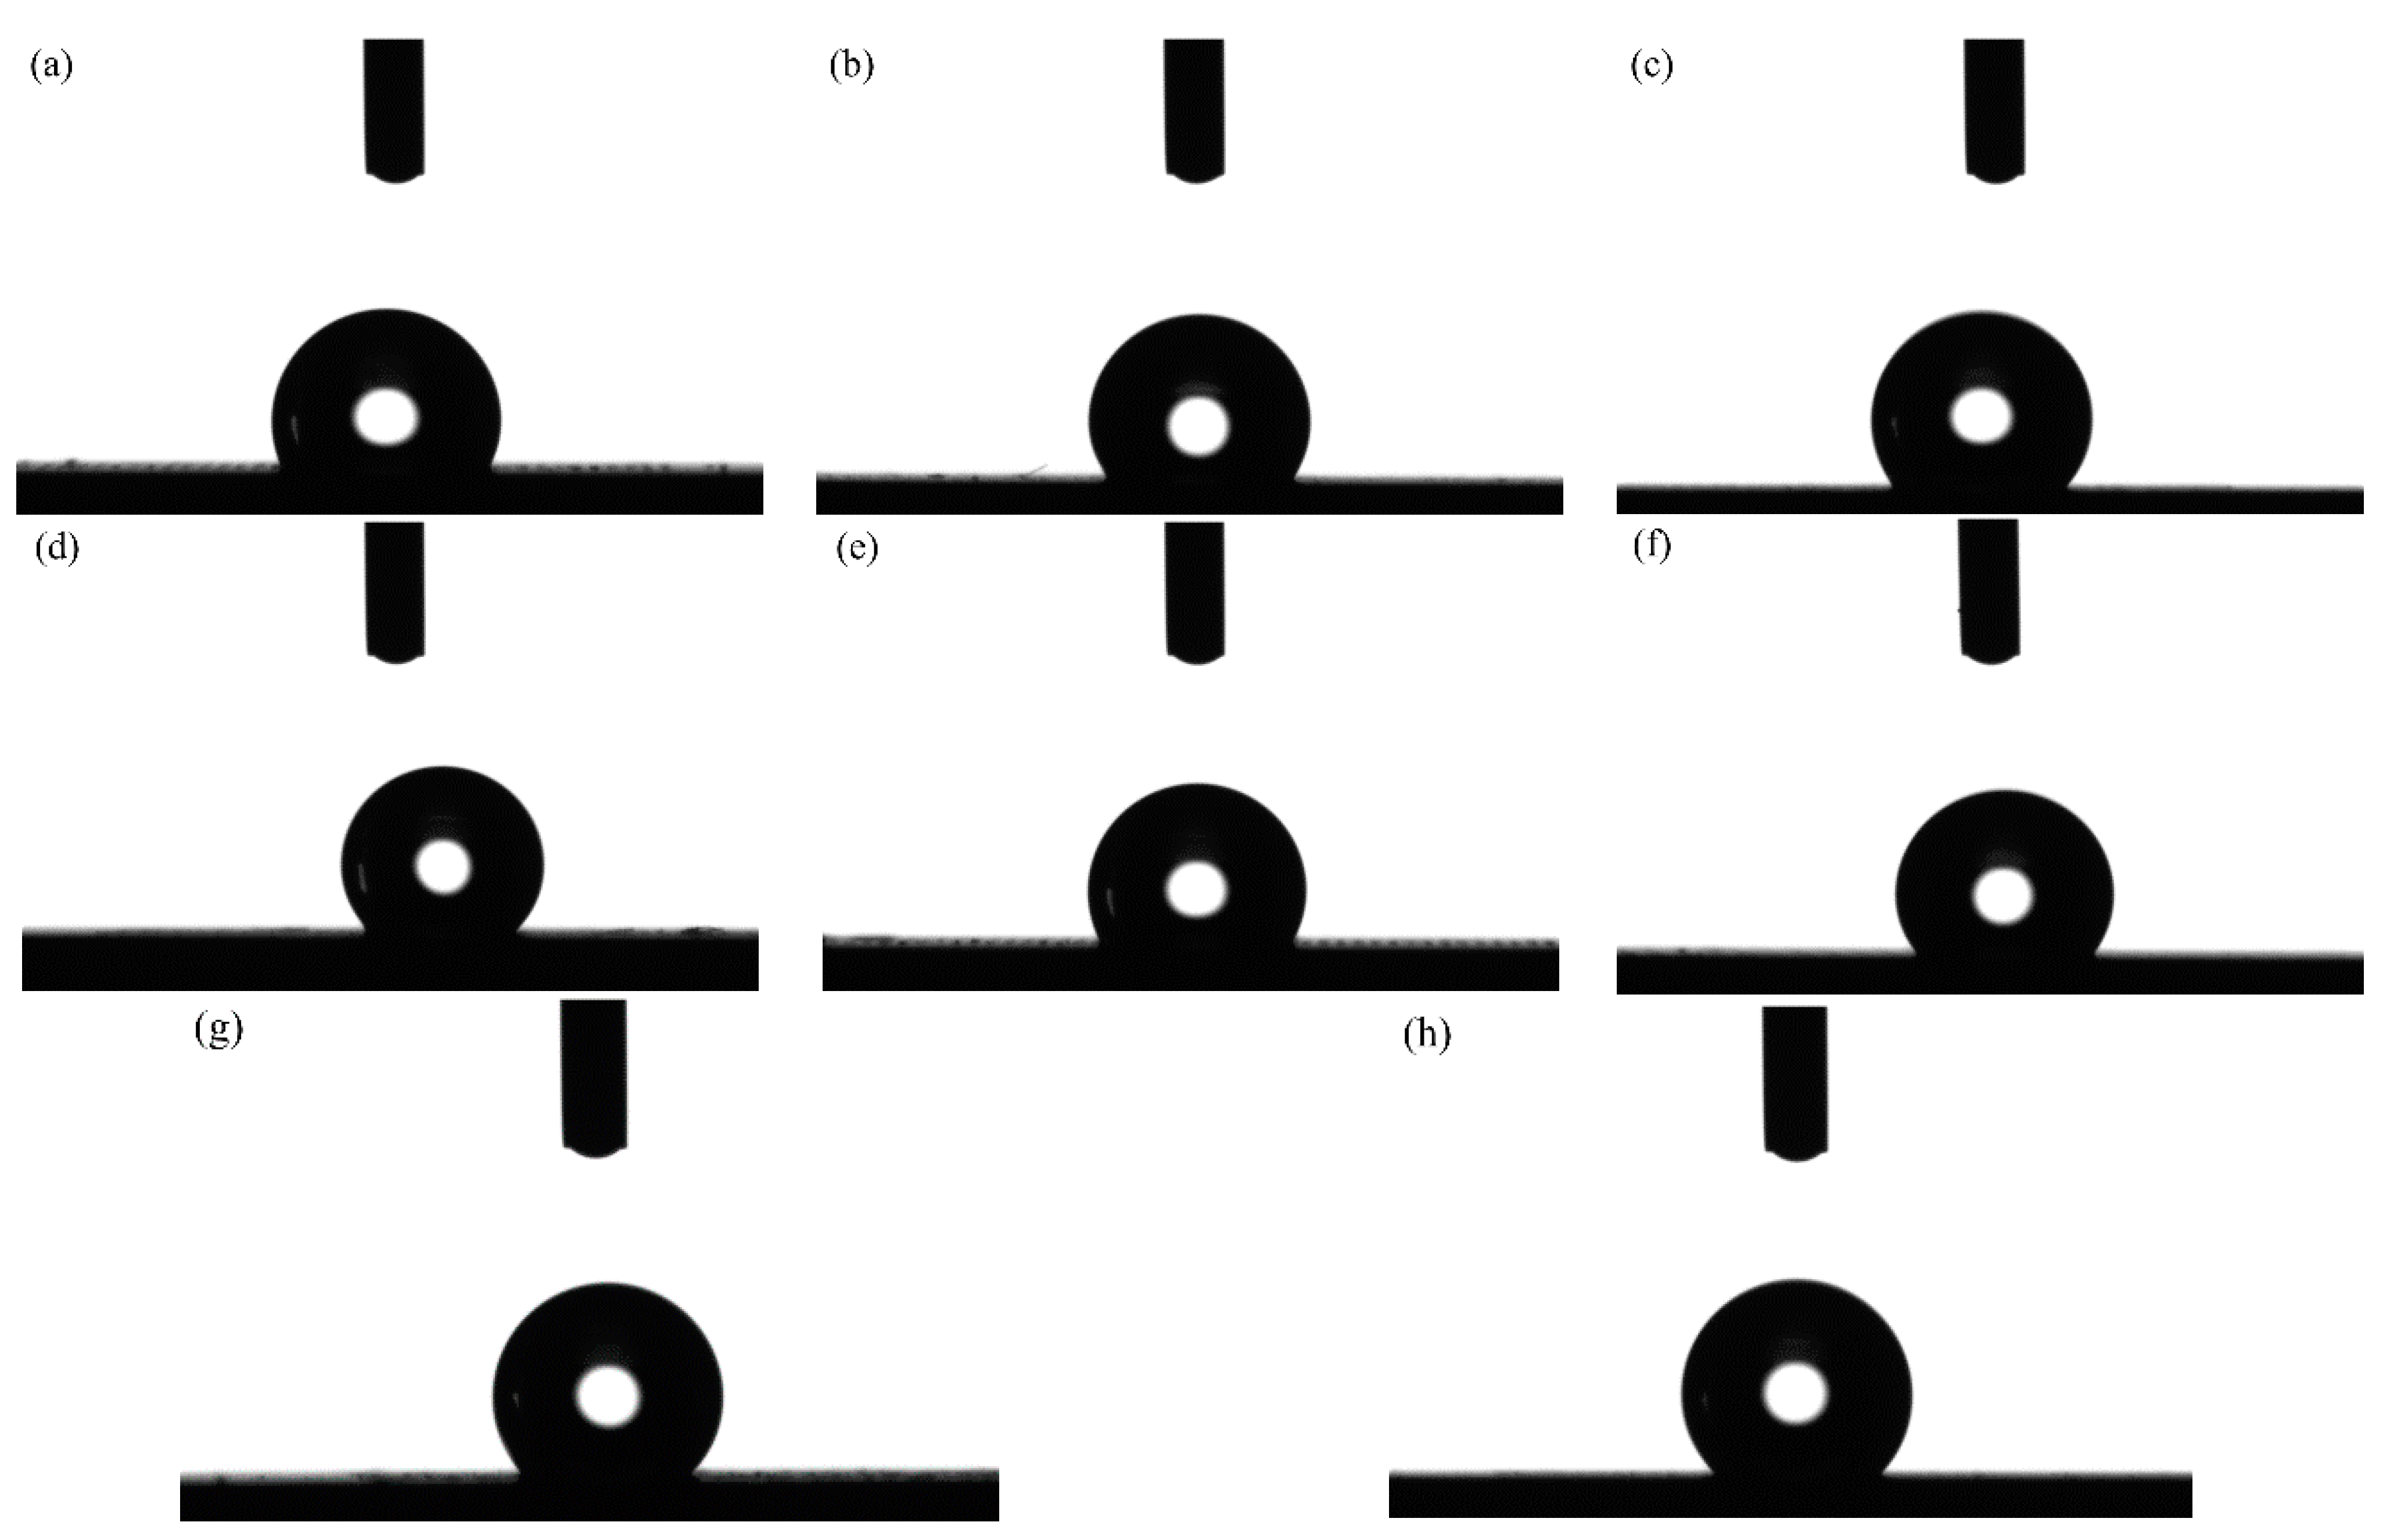
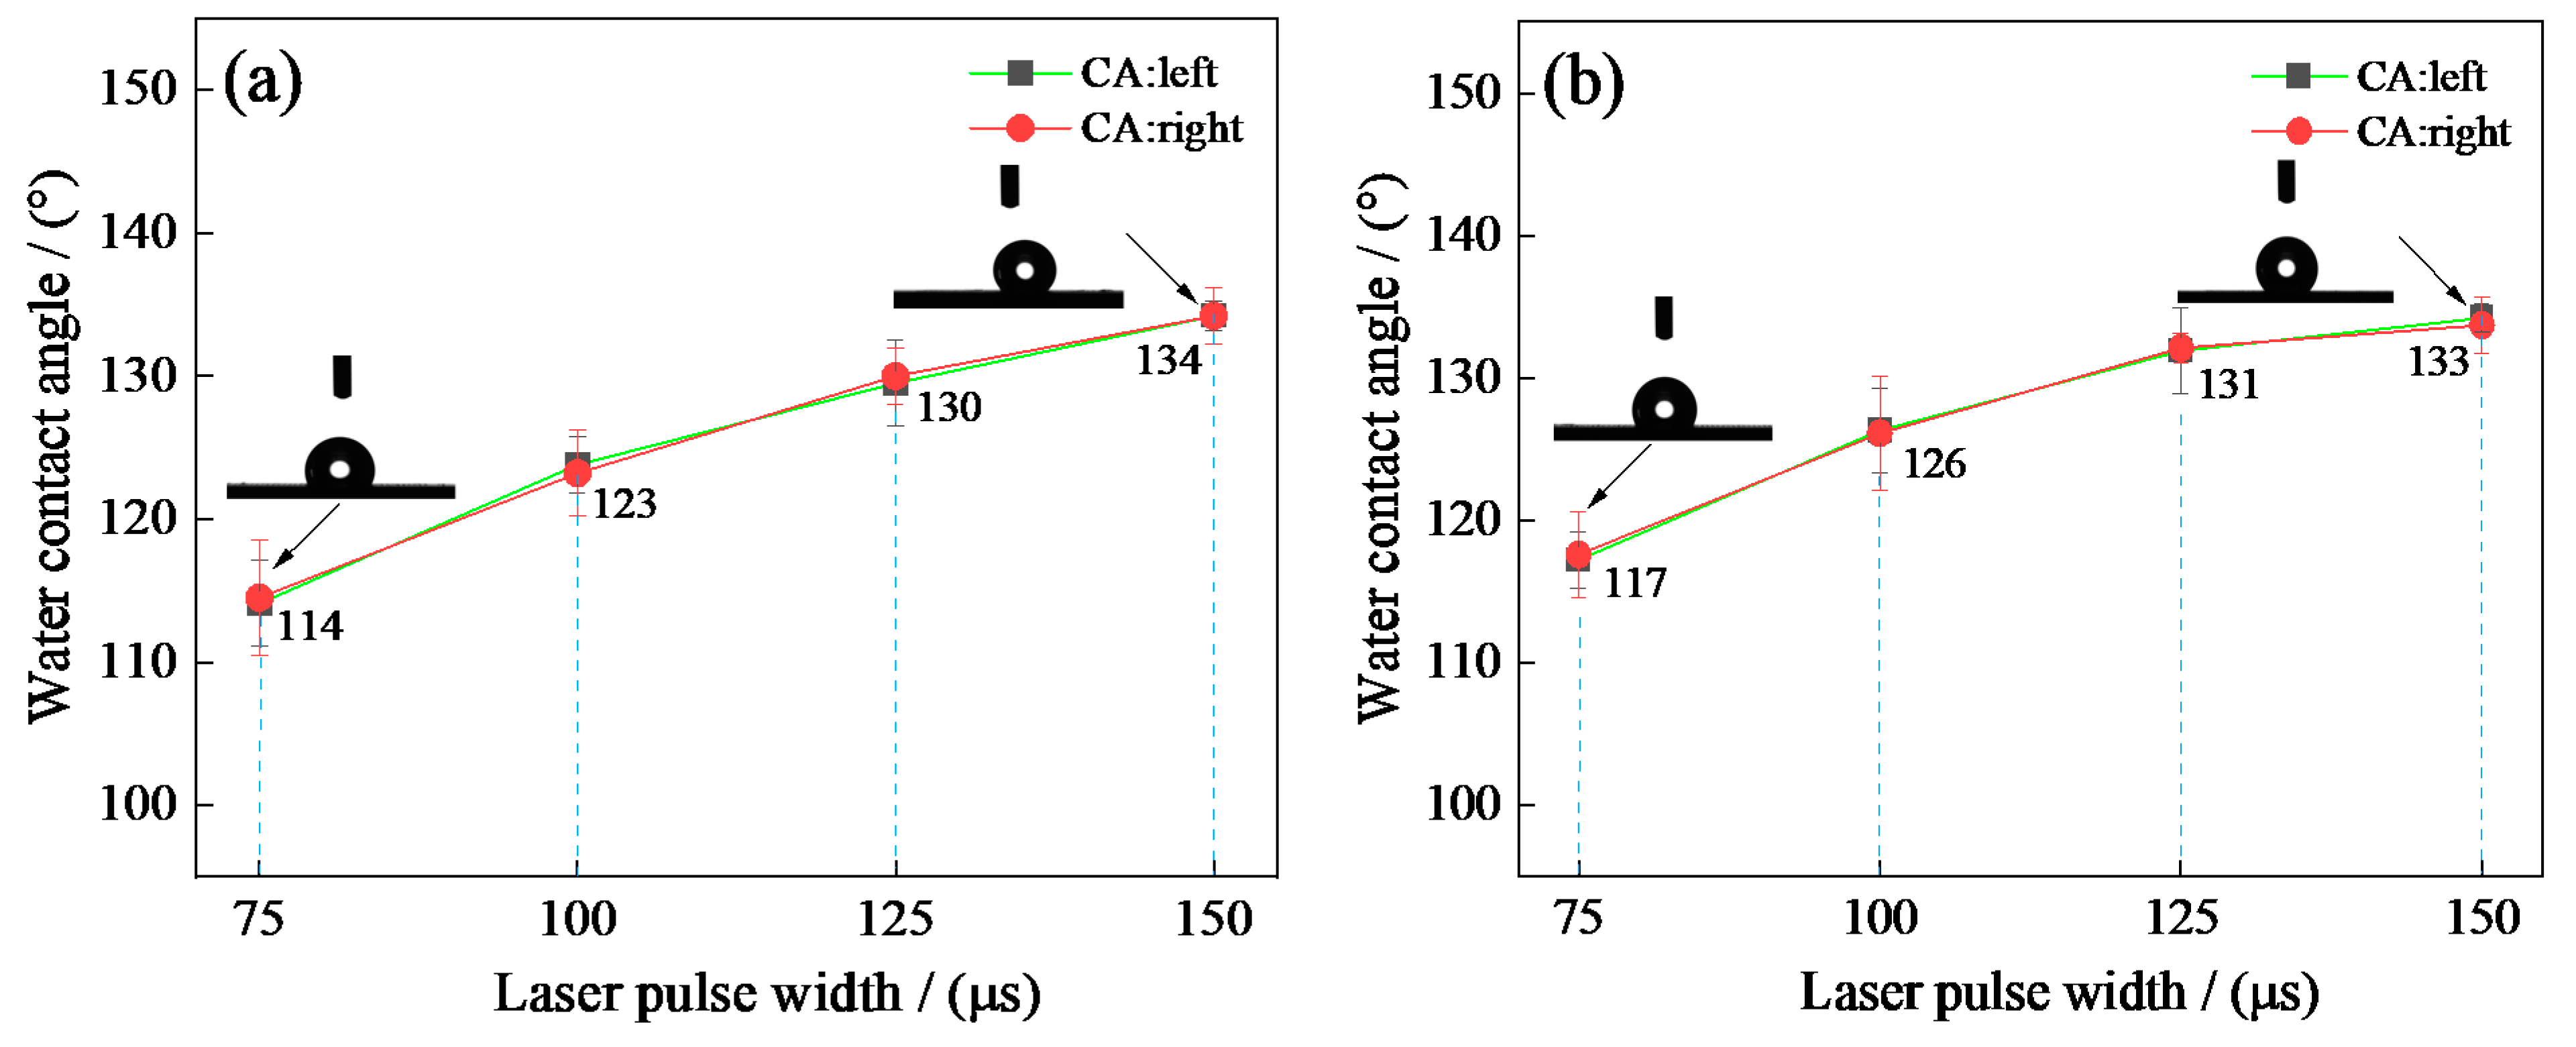
3.4. Effects of Pulse Width on Samples’ Surface Wettability

The optical profile of water drops of the textured surface with varying pulse width were shown in Figure 12. Figure 12a–d displays the optical profile of water drops with a pulse width of 75, 100, 125 and 150 µs at a constant laser output power of 50 W. Additionally, Figure 12e–h displays the optical profile of water drops with a pulse width ranging from 75 to 150 µs at a constant laser output power of 60 W. It can be seen from Figure 12 that the pulse width in laser processing significantly influenced samples’ wettability. At the same time, the samples’ surface showed weak hydrophobicity when the pulse width was 75 µs. Moreover, the apparent solid–liquid (SL) contact surface area between the samples and water droplets decreased with the rise in pulse width. At a pulse width of 150 µs, the more three-dimensional water droplets and the better the hydrophobicity of samples surface.
In order to analyze the effects of pulse width on the wettability of samples’ surface, the water contact angle of the textured surface with varying pulse width was recorded, as shown in Figure 13. As shown in Figure 13a, when the pulse width corresponded to 75 µs, the water contact angle corresponded to 114.3°. The water contact angle increased with the rise in pulse width at a constant laser output power of 50 W. When the pulse width corresponded to 150 µs, the water contact angle reached a maximum value of 134.4°. As shown in Figure 13b, when the pulse width corresponded to 75 µs, the water contact angle corresponded to 117.2°. The water contact angle increased with the rise in pulse width at a constant laser output power of 60 W. When the pulse width corresponded to 150 µs, the water contact angle reached a maximum value of 133.5°. During this research, all the samples were soaked in the fluoroalkyl silane alcohol solution for 2 h without stirring. Therefore, the above phenomena can be mainly explained by the samples’ surface roughness.
According to Figure 10 (3D images) and Figure 11 (2D cross-sectional profiles), the diameter (D1) of the created convex dome became larger with the rise in pulse width. Furthermore, it is evident that the surface roughness (Sa) of samples increased from 0.389 µm at 75 µs to 0.558 µm at 150 µs at a constant laser output power of 50 W. Additionally, the surface roughness (Sa) of the samples increased from 0.403 µm at 75 µs to 0.579 µm at 150 µs at a constant laser output power of 60 W. Additionally, Li et al. [28] demonstrated that the increase in the original surface roughness improved the water contact angle, which influenced the samples’ wettability. Zhang et al. [29] also reported that the surface roughness of samples plays a key role in the regulation of wettability. Moreover, it is evident that the apparent equilibrium contact angle increased from 121.5° to 153.3° when the surface roughness (Sa) of samples changed from 0.406 µm to 0.974 µm. Therefore, the appearance of the convex dome and dimple on the surface changed the original samples’ micro-structures and surface roughness (Sa), which improved the water contact angle and influenced the wettability.

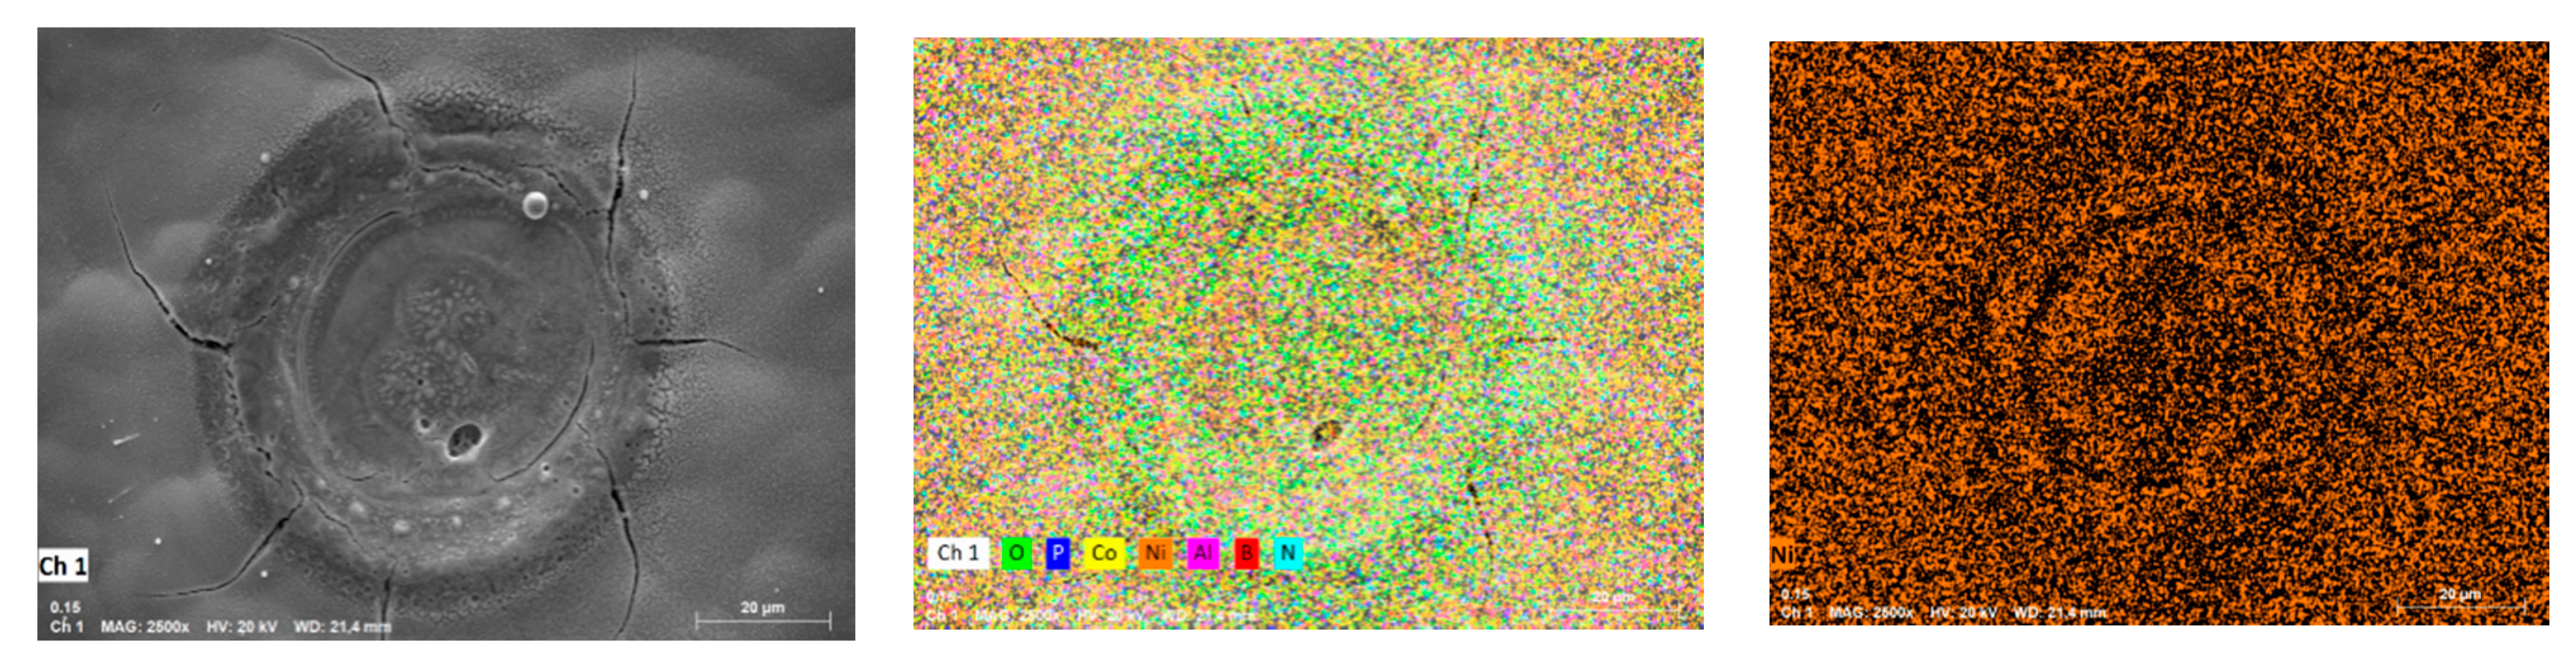
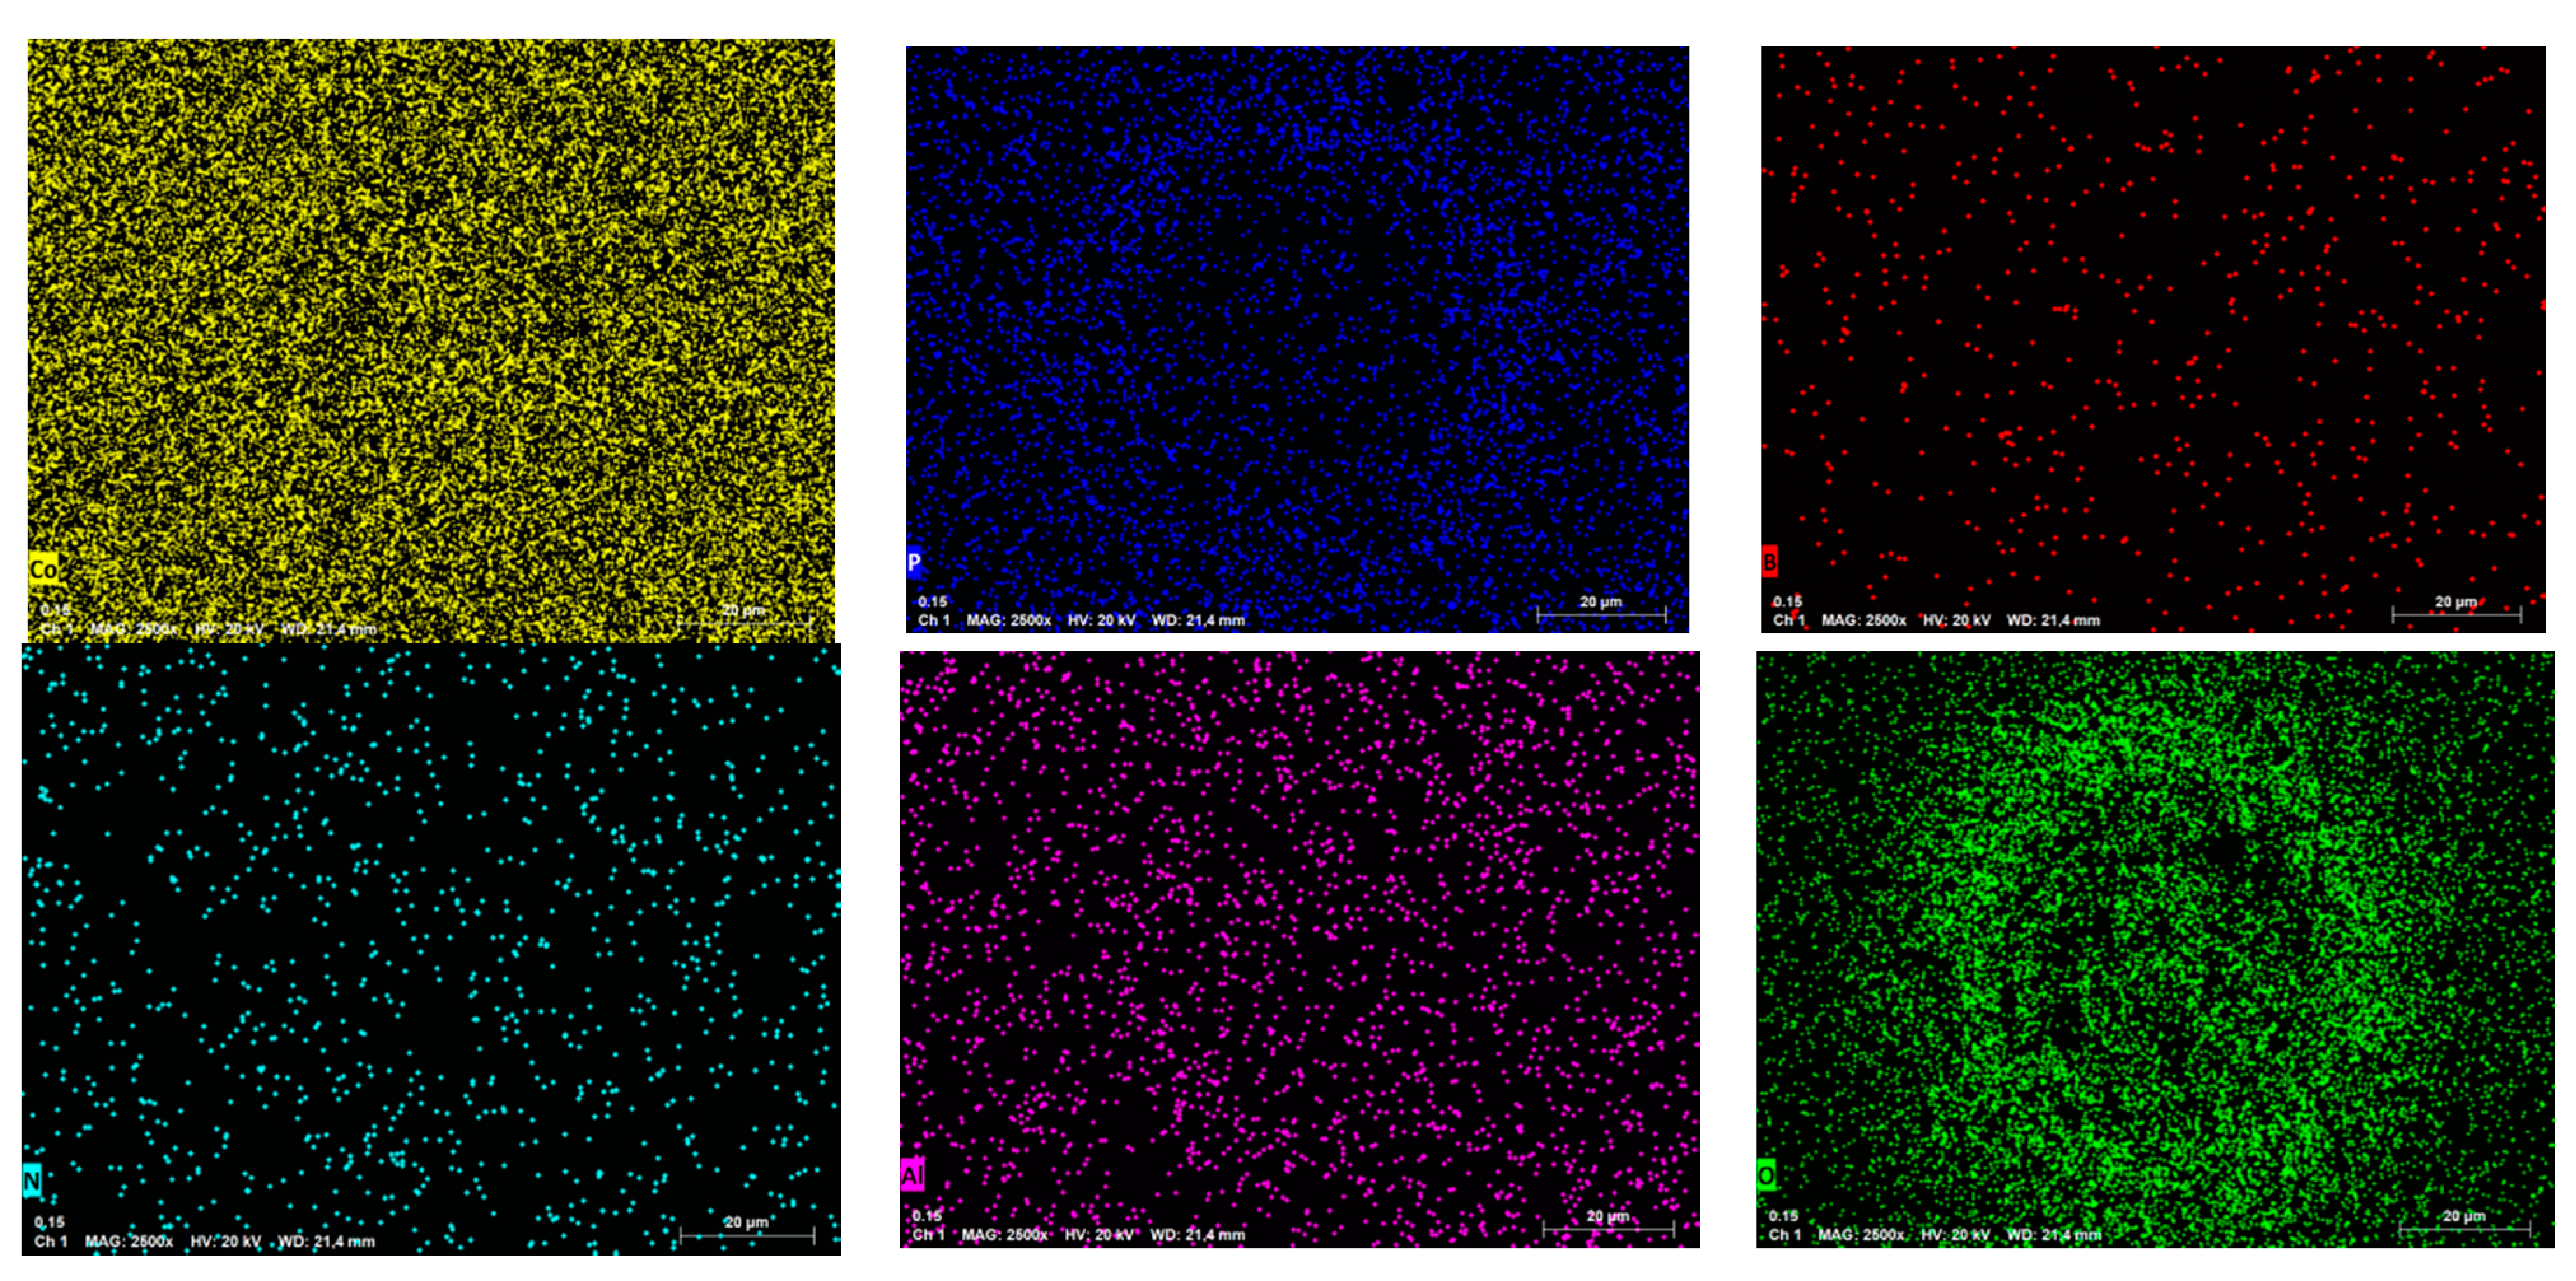
3.5. Effects of Spot-to-Spot Distance on Samples’ Surface Morphologies and Elemental Mapping Images

It is worth noting that the laser output power and pulse width of long-pulse laser processing played a key role in the regulation of wettability. In this work, when the laser output power was 120 W with a constant pulse width of 50 µs, the water contact angle of the samples reached a maximum value of 134.3°. Additionally, when the pulse width was 150 µs with a constant laser output power of 60 W, the water contact angle of samples reached a maximum value of 133.5°. However, further increase in the laser output power (120 W) caused the dimple depth to increase. Moreover, the cracks irradiated on the surface also increased or widened gradually with the increased pulse width (150 µs). With a constant laser output power of 50 W and a pulse width of 100 µs, Figure 14 shows the effect of varying spot-to-spot distance on samples’ surface morphologies. It is observed from Figure 14a that the samples’ surface exhibited dense structures, and the number of spots increased significantly per unit area. Additionally, the textured surface diameter and bump height of the convex dome on the samples’ surface exhibited minor differences. As shown in Figure 14b–d, it can be seen that the amount of spot decreased gradually per unit area with the rise in the spot-to-spot distance. The edge heat-affected zones of the textured surface became detached with the increase in the spot-to-spot distance such that they were no longer connected for the 300-micrometer samples. Therefore, the spot-to-spot distance variation exhibited a significant influence on samples’ surface densities, which lead to an increase in the surface roughness (Sa) of samples.
Figure 15 shows the elemental mapping images of samples’ textured surfaces. Table 5 shows the chemical composition of samples before and after laser treatment. According to the SEM images of the samples in secondary electrons mode, it can be seen that the samples’ surfaces made by jet electrodeposition were uniform and had dense structures without cracks, while the cracks appeared on the textured surface after laser processing. On the other hand, it was observed from the elemental mapping images of the samples that Ni, Co, P, B, N, Al and O were uniformly distributed throughout the deposited samples. It was found that the content of O on the textured surface after laser processing increased significantly from 2.60 wt.% to 9.30 wt.%, but the content of the other samples’ surfaces was not as obvious obtained from Table 5. Moreover, it further suggests that the high-temperature oxidation reaction occurred on the samples’ surface after laser processing. The Ni and Co elements both formed oxide layers (NiO and CoO).

3.6. Effects of Spot-to-Spot Distance on Samples’ Surface Wettability

Figure 16 shows the optical profile of the water drop on the textured surface with varying spot-to-spot distances ranging from 150, 200 and 250 to 300 μm at a constant laser output power of 50 W and a pulse width of 100 µs. Figure 17 shows the water contact angle of the textured surface with varying spot-to-spot distance to analyze the effects of spot-to-spot distance on the wettability of samples’ surface.
From Figure 16 and Figure 17, it is worth noting that the spot-to-spot distance in laser processing significantly influenced wettability. When the spot-to-spot distance of the samples’ surface was 150 μm, the textured surface showed strong hydrophobicity. Moreover, the apparent solid–liquid (SL) contact surface area between the samples and water droplets decreased with the rise in the spot-to-spot distance. As shown in Figure 17, when the spot-to-spot distance corresponded to 150 μm, the water contact angle corresponded to 139.8°. The water contact angle decreased with the rise in spot-to-spot distance. When the spot-to-spot distance corresponded to 300 μm, the water contact angle corresponded to 123.5°. The above phenomena may be due to the fact that the amount of spot influenced the samples’ surface roughness. When the spot-to-spot distance corresponded to 150 μm, the surface roughness (Sa) of samples was high per unit area (see Figure 14a), which increased the water contact angle and improved the wettability. Additionally, when the spot-to-spot distance corresponded to 300 μm, the surface roughness (Sa) of samples was low per unit area, which decreased the water contact angle.

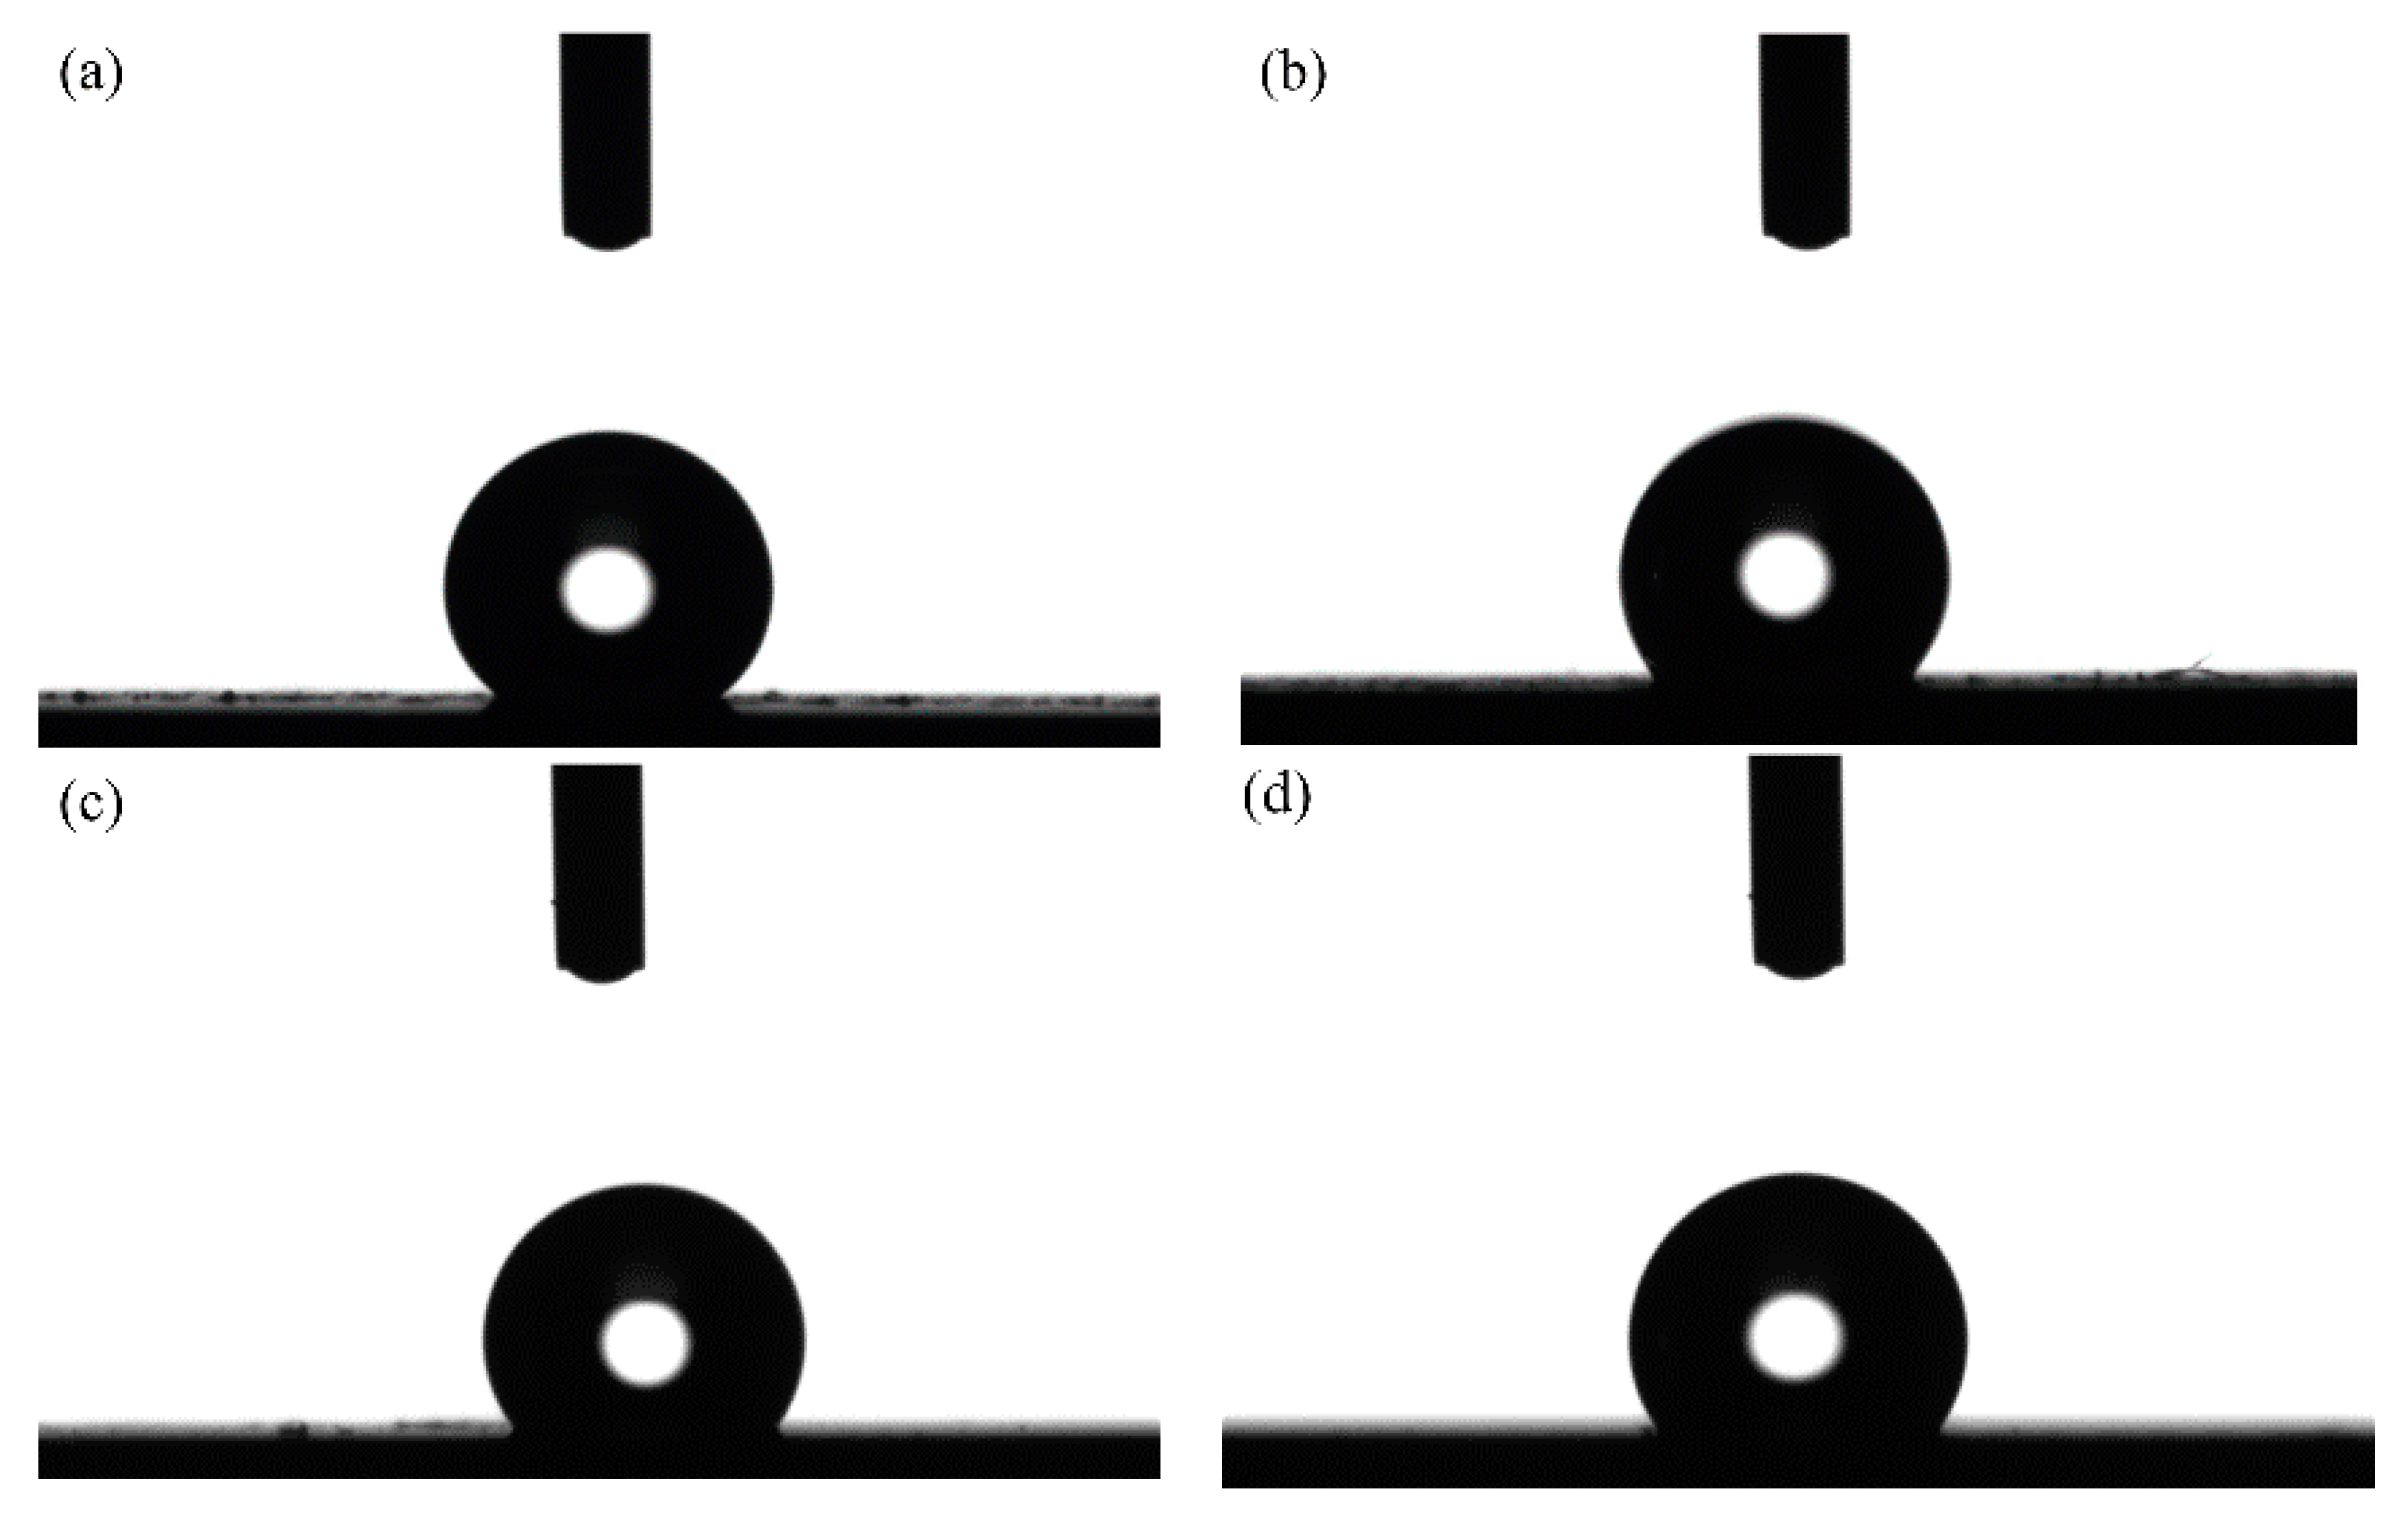
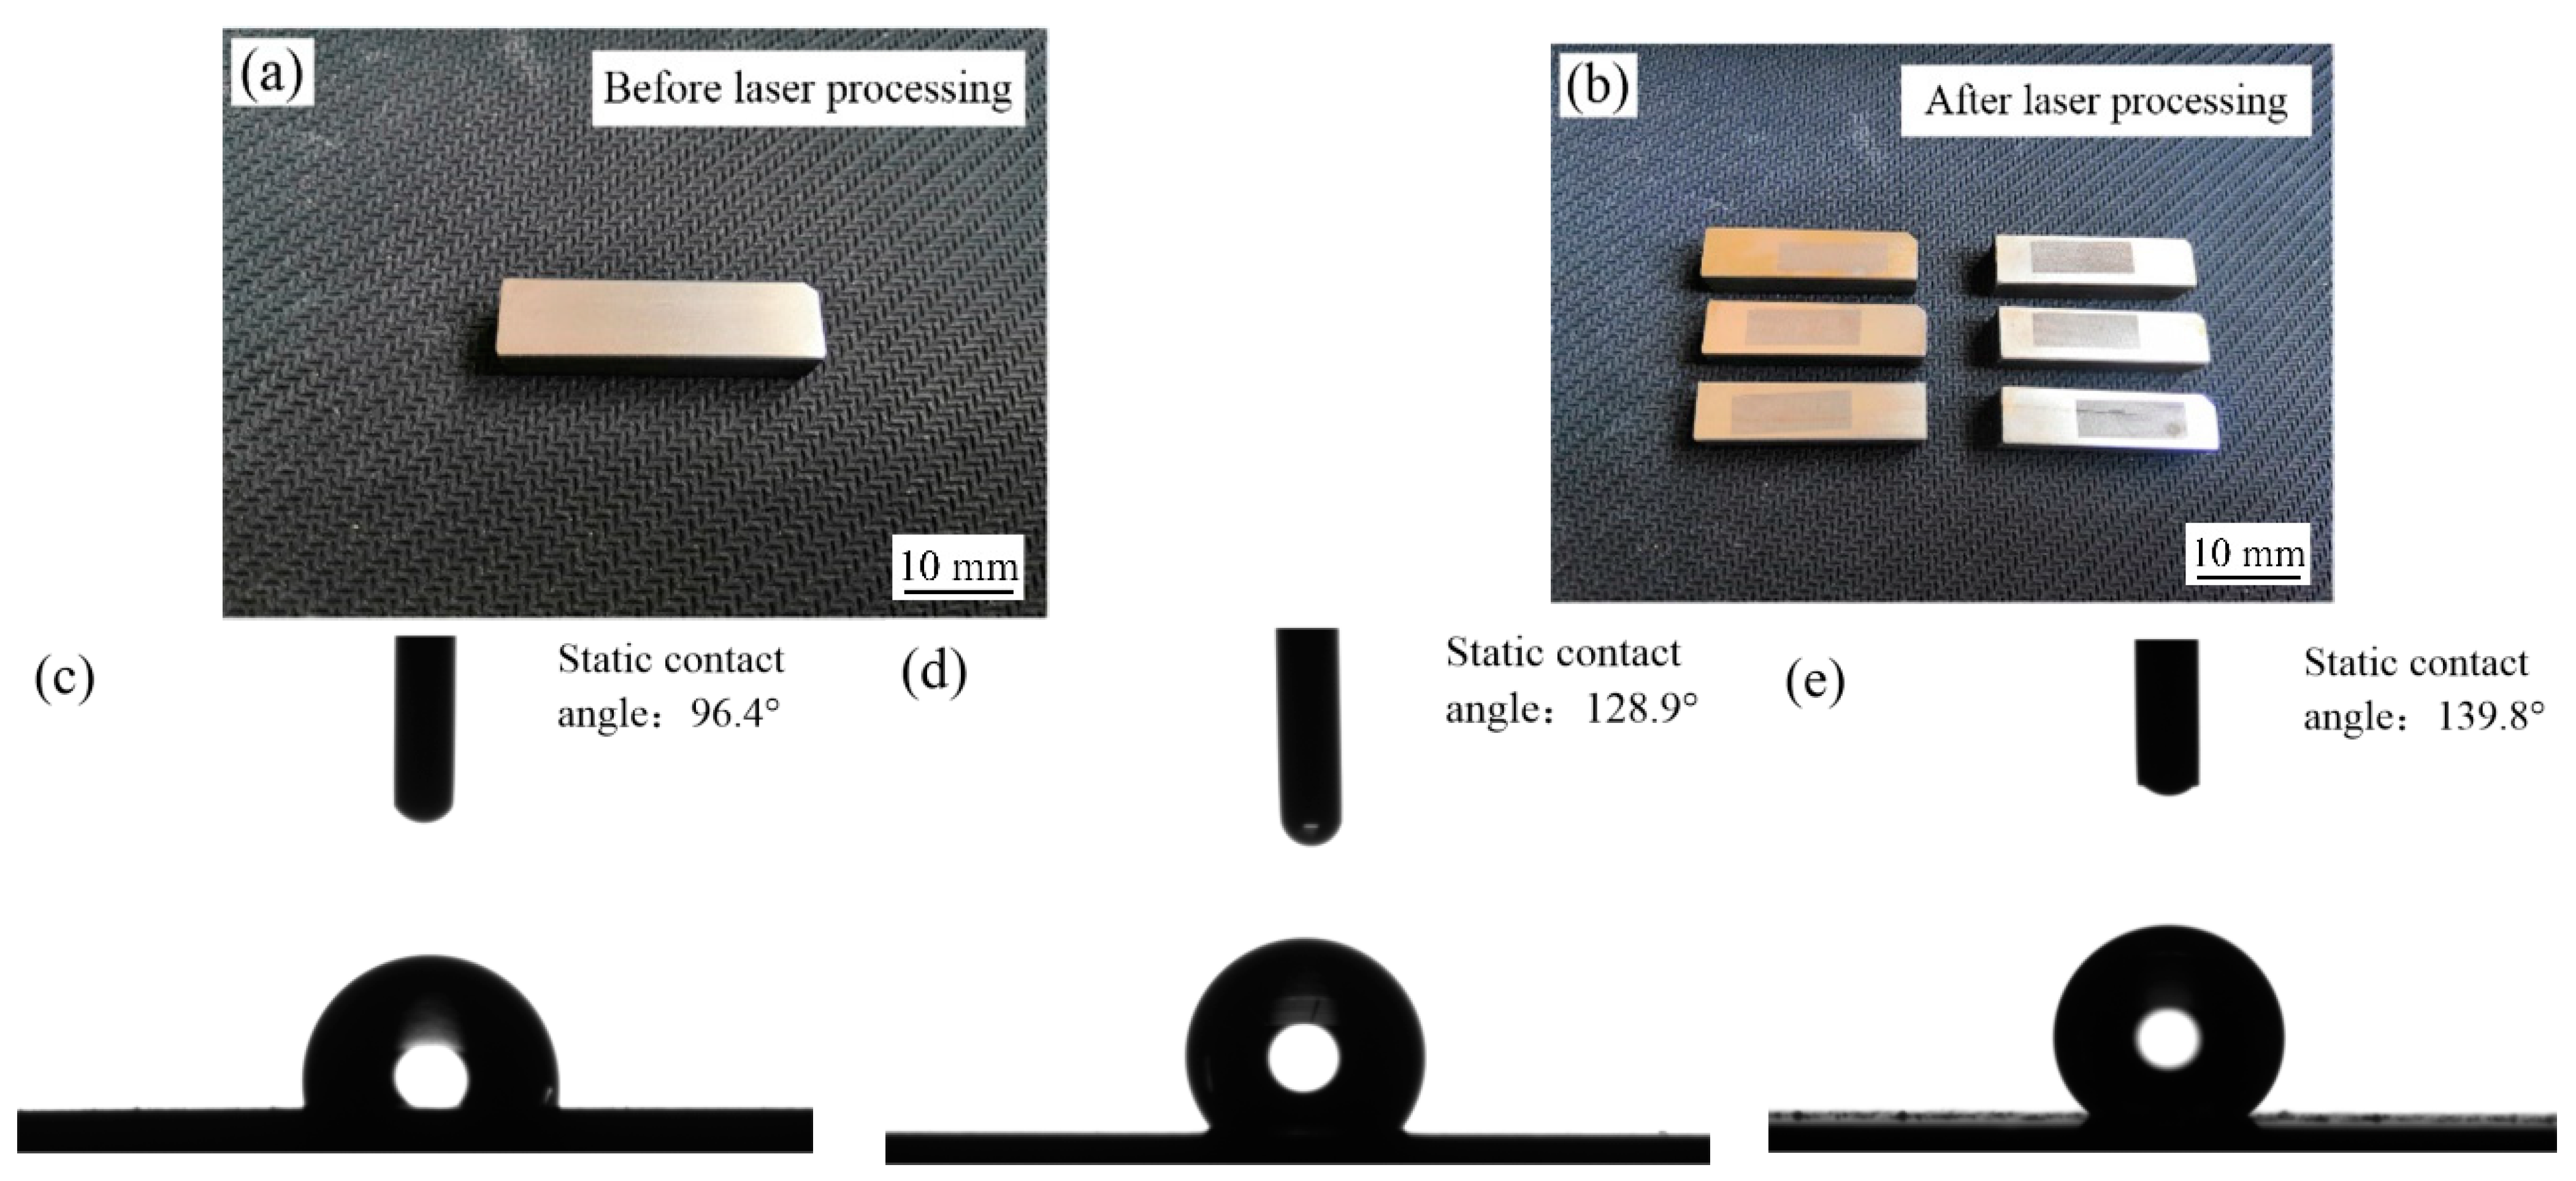
3.7. Wettability of Samples before and after Laser-Processing

Figure 18 shows the images and water contact angle of samples before and after laser processing at a laser output power of 50 W, a pulse width of 100 µs and a spot-to-spot distance of 150 µm. The images of samples before laser processing are shown in Figure 18a. It can be seen that a bright and silvery-white binary nanocomposite coating was successfully fabricated on steel C1045 substrates by jet electrodeposition, which matched the expected appearance test requirement. The images of samples after laser processing are presented in Figure 18b. It is obvious that the surface roughness (Sa) of the Ni–Co–P–BN(h)–Al2O3 binary nanocomposite coating was greatly increased, as compared to those of the untreated samples. Figure 18c–e shows the water drop optical profile of steel C1045 and samples before and after laser processing. As observed, the static water contact angle of steel C1045 substrates was 96.4° (CA > 90°), which showed weak hydrophobicity. The maximum static water contact angle of the Ni–Co–P–BN(h)–Al2O3 binary nanocomposite coating using jet electrodeposition corresponded to 128.9°, which increased by 32.5° compared to those of the steel C1045 substrates. Meanwhile, the contact surface of water droplets on the samples’ surface became less and less, and the surface area solid–liquid (SL) interface between the water droplets and the samples was further reduced, which indicates that a better hydrophobic property was obtained. In addition, the static water contact angle of samples after laser processing reached 139.8°. It indicates that its hydrophobic property was further improved after laser processing.

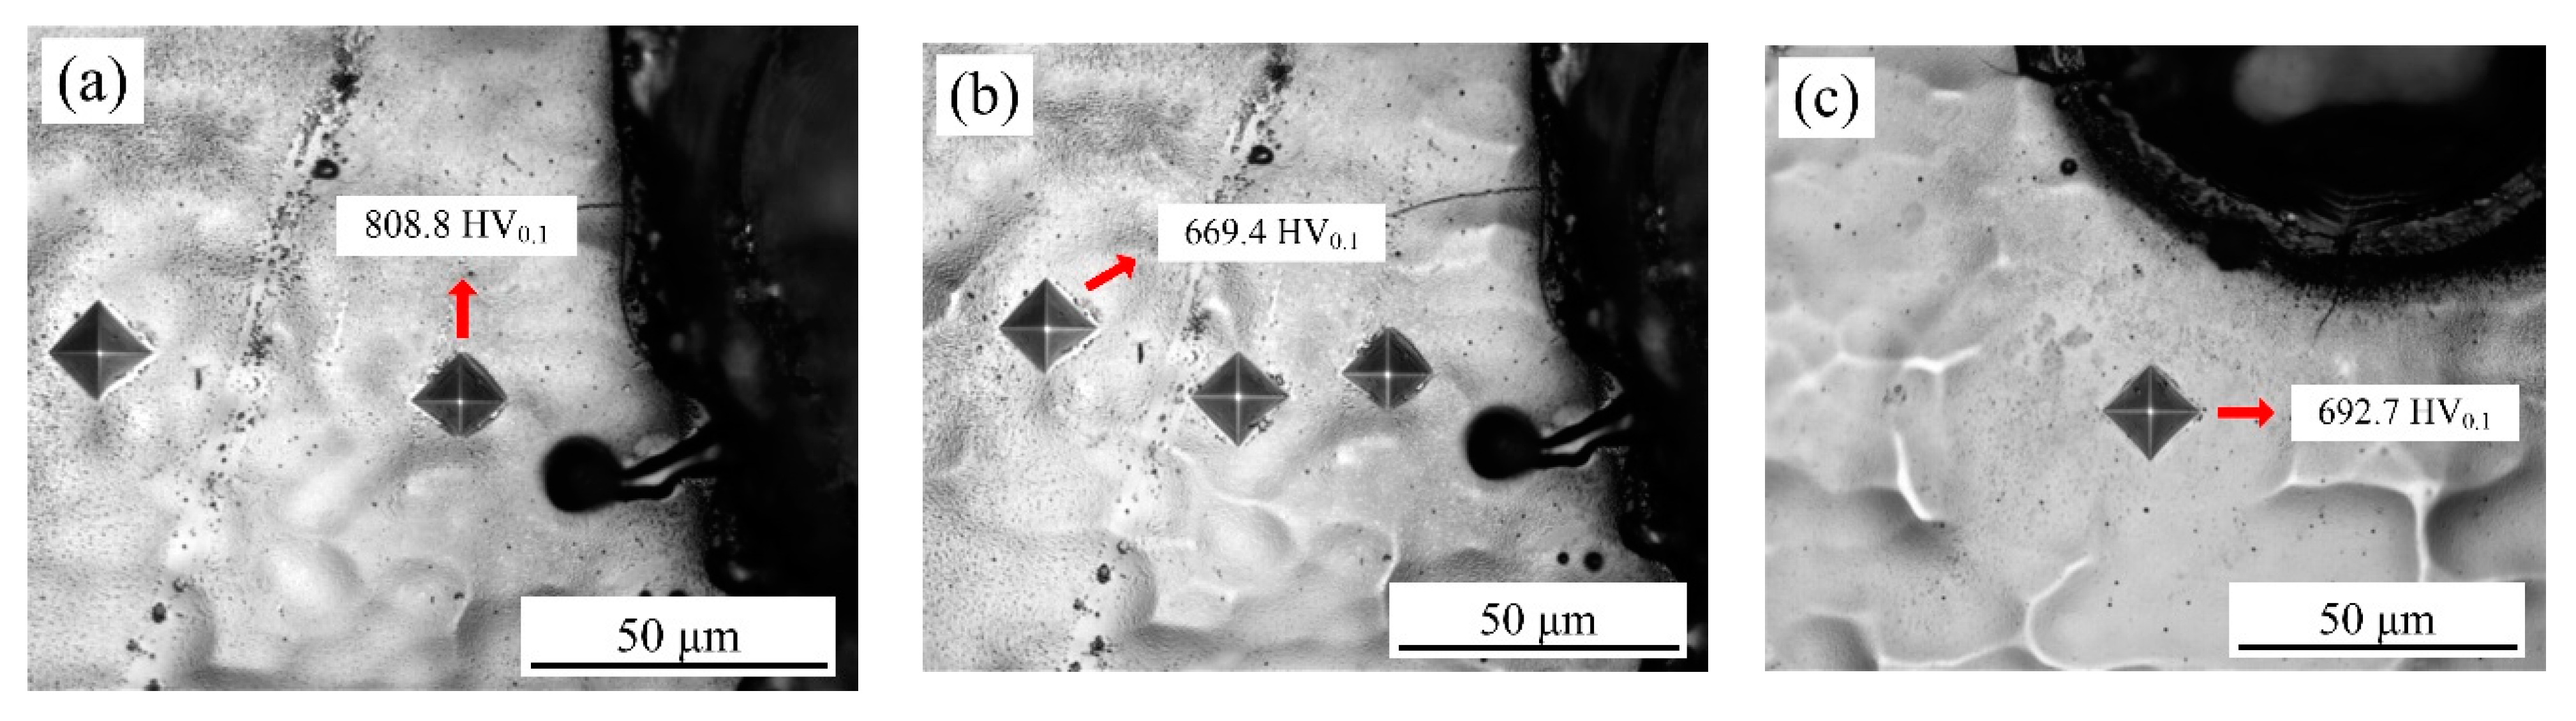
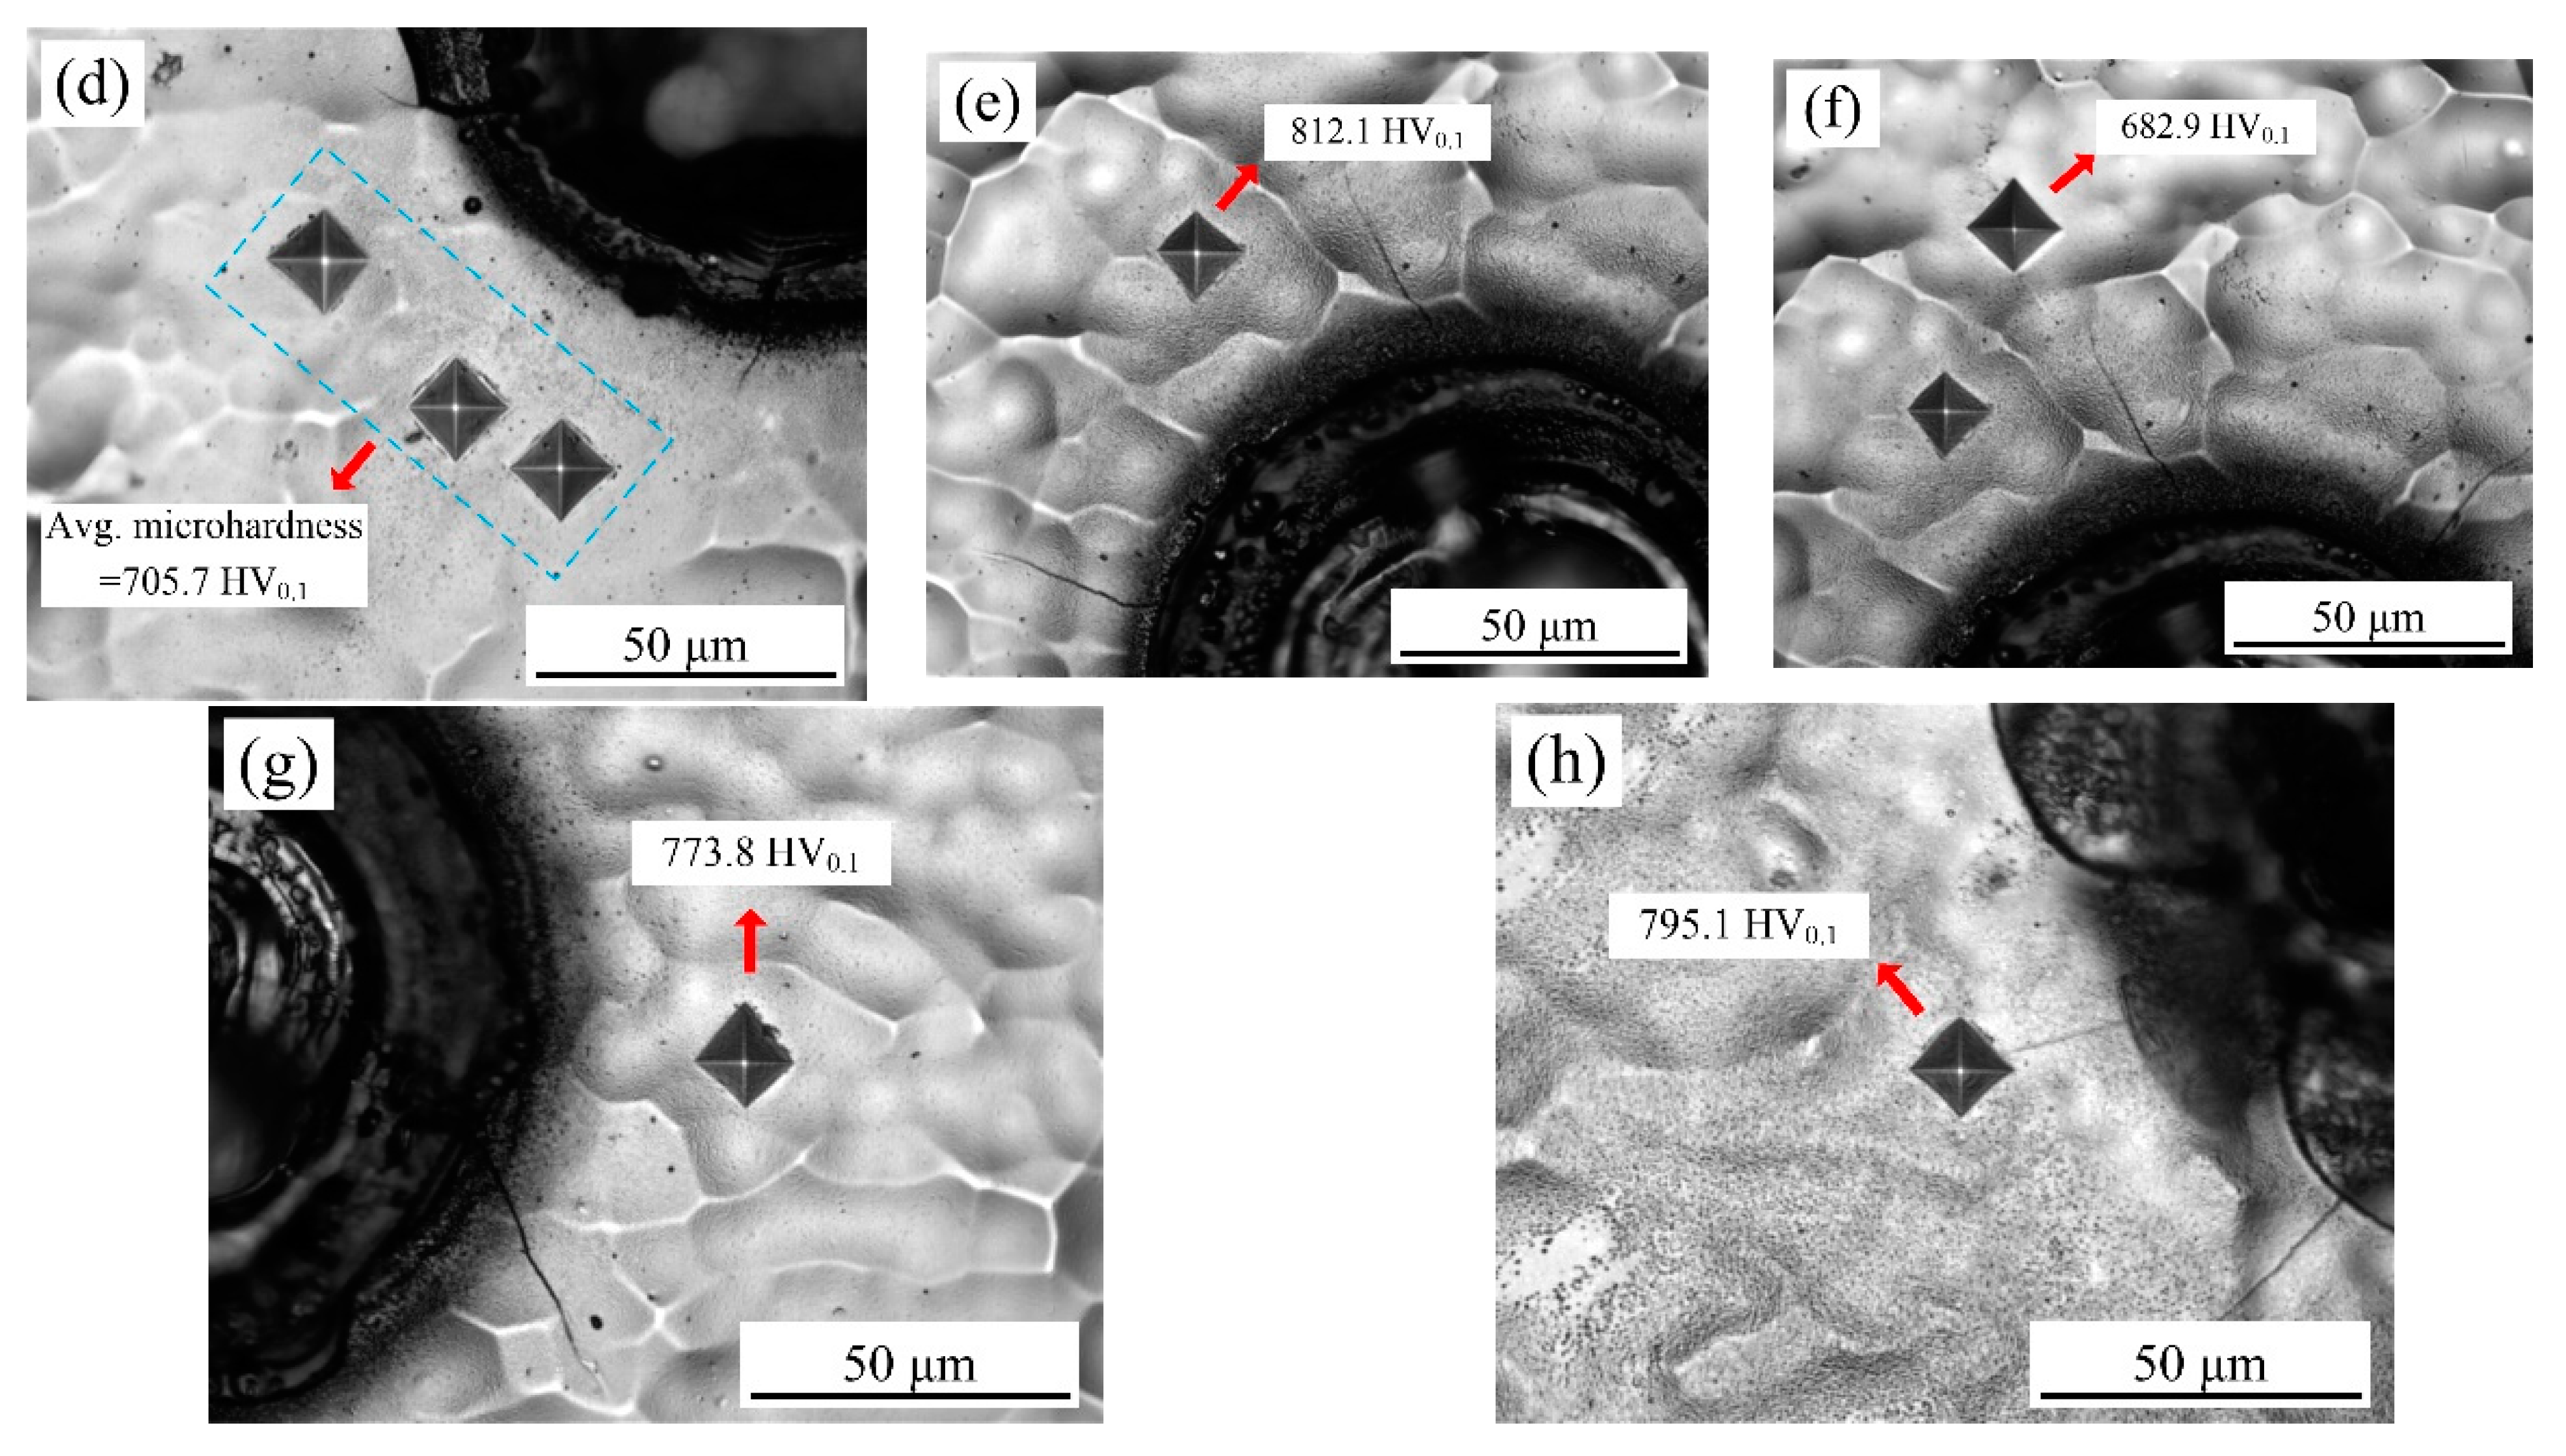
3.8. Microhardness of Samples before and after Laser-Processing

The optical microscopy image of the Vickers indent for samples with varying laser output power and pulse width is illustrated in Figure 19. It can be seen that the absence of microcracks after the indenting indicated that all the deposited coatings were compact. As shown in Figure 19a,b at a laser output power of 50 W, the microhardness of samples before laser processing corresponded to 669.4 HV0.1, while the microhardness of the heat-affected zone corresponded to 808.8 HV0.1, which increased by 139.4 HV0.1. Figure 19c,d shows the average microhardness of the heat-affected zone was 705.7 HV0.1 at a laser output power of 120 W. It was found that the high laser output power was unfavorable for the improvement of microhardness, which may have been caused when the cracks irradiated on the samples’ surface increased or widened gradually with increased laser output power.
With a constant pulse width of 100 µs and a laser output power of 50 W, it can be seen from Figure 19e,f that the microhardness of samples before laser processing corresponded to 682.9 HV0.1, while the microhardness of the heat-affected zone reached a maximum value of 812.1 HV0.1. On the other hand, when the pulse width was 75 µs, the microhardness of heat affected zone corresponded to 773.8 HV0.1. Additionally, when the pulse width was 125 µs, the microhardness of the heat-affected zone corresponded to 795.1 HV0.1. A combination of Figure 19g,h indicated that the pulse width significantly influenced the microhardness of the heat-affected zone. Therefore, the microhardness of the samples improved enormously under suitable laser-processing parameters.
To further have a better explanation and analysis, XRD patterns of samples before and after laser processing were shown in Figure 20. Figure 20c shows a part area of Figure 20b ranging from 40° to 55°. It can be seen that the diffraction peaks of samples were Ni (111), (200), and (220) before laser processing. However, it was found that there comprised Ni and Ni3P phase after laser processing, which was the root reason that microhardness improved. Moreover, a previous study by Zheng et al. [30] showed that the laser heat treatment conducted the microstructure from the amorphous to the crystalline structure, which comprised of the Ni3P and Ni phase. Furthermore, the microhardness of coatings increased obviously for the phase transformation. Dun et al. [31] reported that the strengthened Ni–P–A12O3 composite coatings had uniform components and fined structure. It was found that the microhardness of laser strengthened Ni–P–A12O3 composite coatings was three times that of the substrate materials. Luo et al. [32] studied the effect of laser processing parameters on surface morphology and microhardness. Additionally, the microhardness of the nano–SiO2 composite coating increased with the rise in laser power at a constant laser-scanning velocity.

3.9. Wear Resistance of Samples before and after Laser-Processing

Figure 21 illustrates the frictional coefficient of samples before and after laser processing with a laser output power of 50 W, a pulse width of 100 µs and a spot-to-spot distance of 150 µm. It is well known that the size, quantity and uniformity of composite hard particles have a great influence on the samples’ frictional coefficient. As shown in Figure 21, it can be seen that the frictional coefficient of samples before laser processing first increased and then gradually stabilized (0.723). Additionally, it was found that the frictional coefficient of samples after laser processing increased sharply at the beginning of friction and then gradually stabilized (0.185). It is obvious that the frictional coefficient of samples was greatly decreased, as compared to those of the normal samples.
The above phenomena may be explained by samples’ surface morphologies. When the laser output power was low coupled with a suitable pulse width, it was found that a convex dome was formed on the samples’ surfaces and a small dimple was formed at the center of the created convex dome, which could have reduced the friction coefficient of samples. It is worth noting that the micro-texture (convex dome and small dimple at the center of created convex dome) were gradually destroyed with the extension of friction and wear time, seeing as the wear debris was increasing, which resulted in a large change in the friction coefficient. In addition, Mohazzab et al. [33] used a simple laser surface treatment method to enhance the wear resistance of Titanium. It was found that the friction coefficient values of laser-treated Ti samples decreased dramatically from 0.35 to below 0.269.
Figure 22a,b shows the wear grooves for the samples before and after laser processing. It is evident that the wear scar width of the samples before laser processing corresponded to 382.8 µm, and the wear scar width of the samples after laser processing reached a minimum value of 360.5 µm. It can be seen that the wear was obviously narrow and shallow. In general, the wear resistance of samples is mainly determined by the friction coefficient and the microhardness. A lower coefficient of friction and a higher microhardness means better wear resistance. From a combination of Figure 19 and Figure 21, it can be found that the microhardness of samples significantly improved and the frictional coefficient of samples was greatly decreased after laser processing, which indicates that a better wear resistance was obtained. Similar results were reported in previous studies, such as Liu et al. [34], who reported that the wear resistance of laser-treated Ni−P/Ni−W−P duplex coatings was superior to the as-plated ones. Zhang et al. [35] reported that the scratch depth of the coating decreased obviously and the furrow was hardly observed after laser beam texture treatment, while the coating without laser beam treatment was badly worn and the furrows were deeper. Additionally, Lou et al. [36] found that the NiAl/nano Al2O3 composite coatings had a higher microhardness and a lower coefficient of friction after laser strengthening, which improved the wear resistance of coatings.

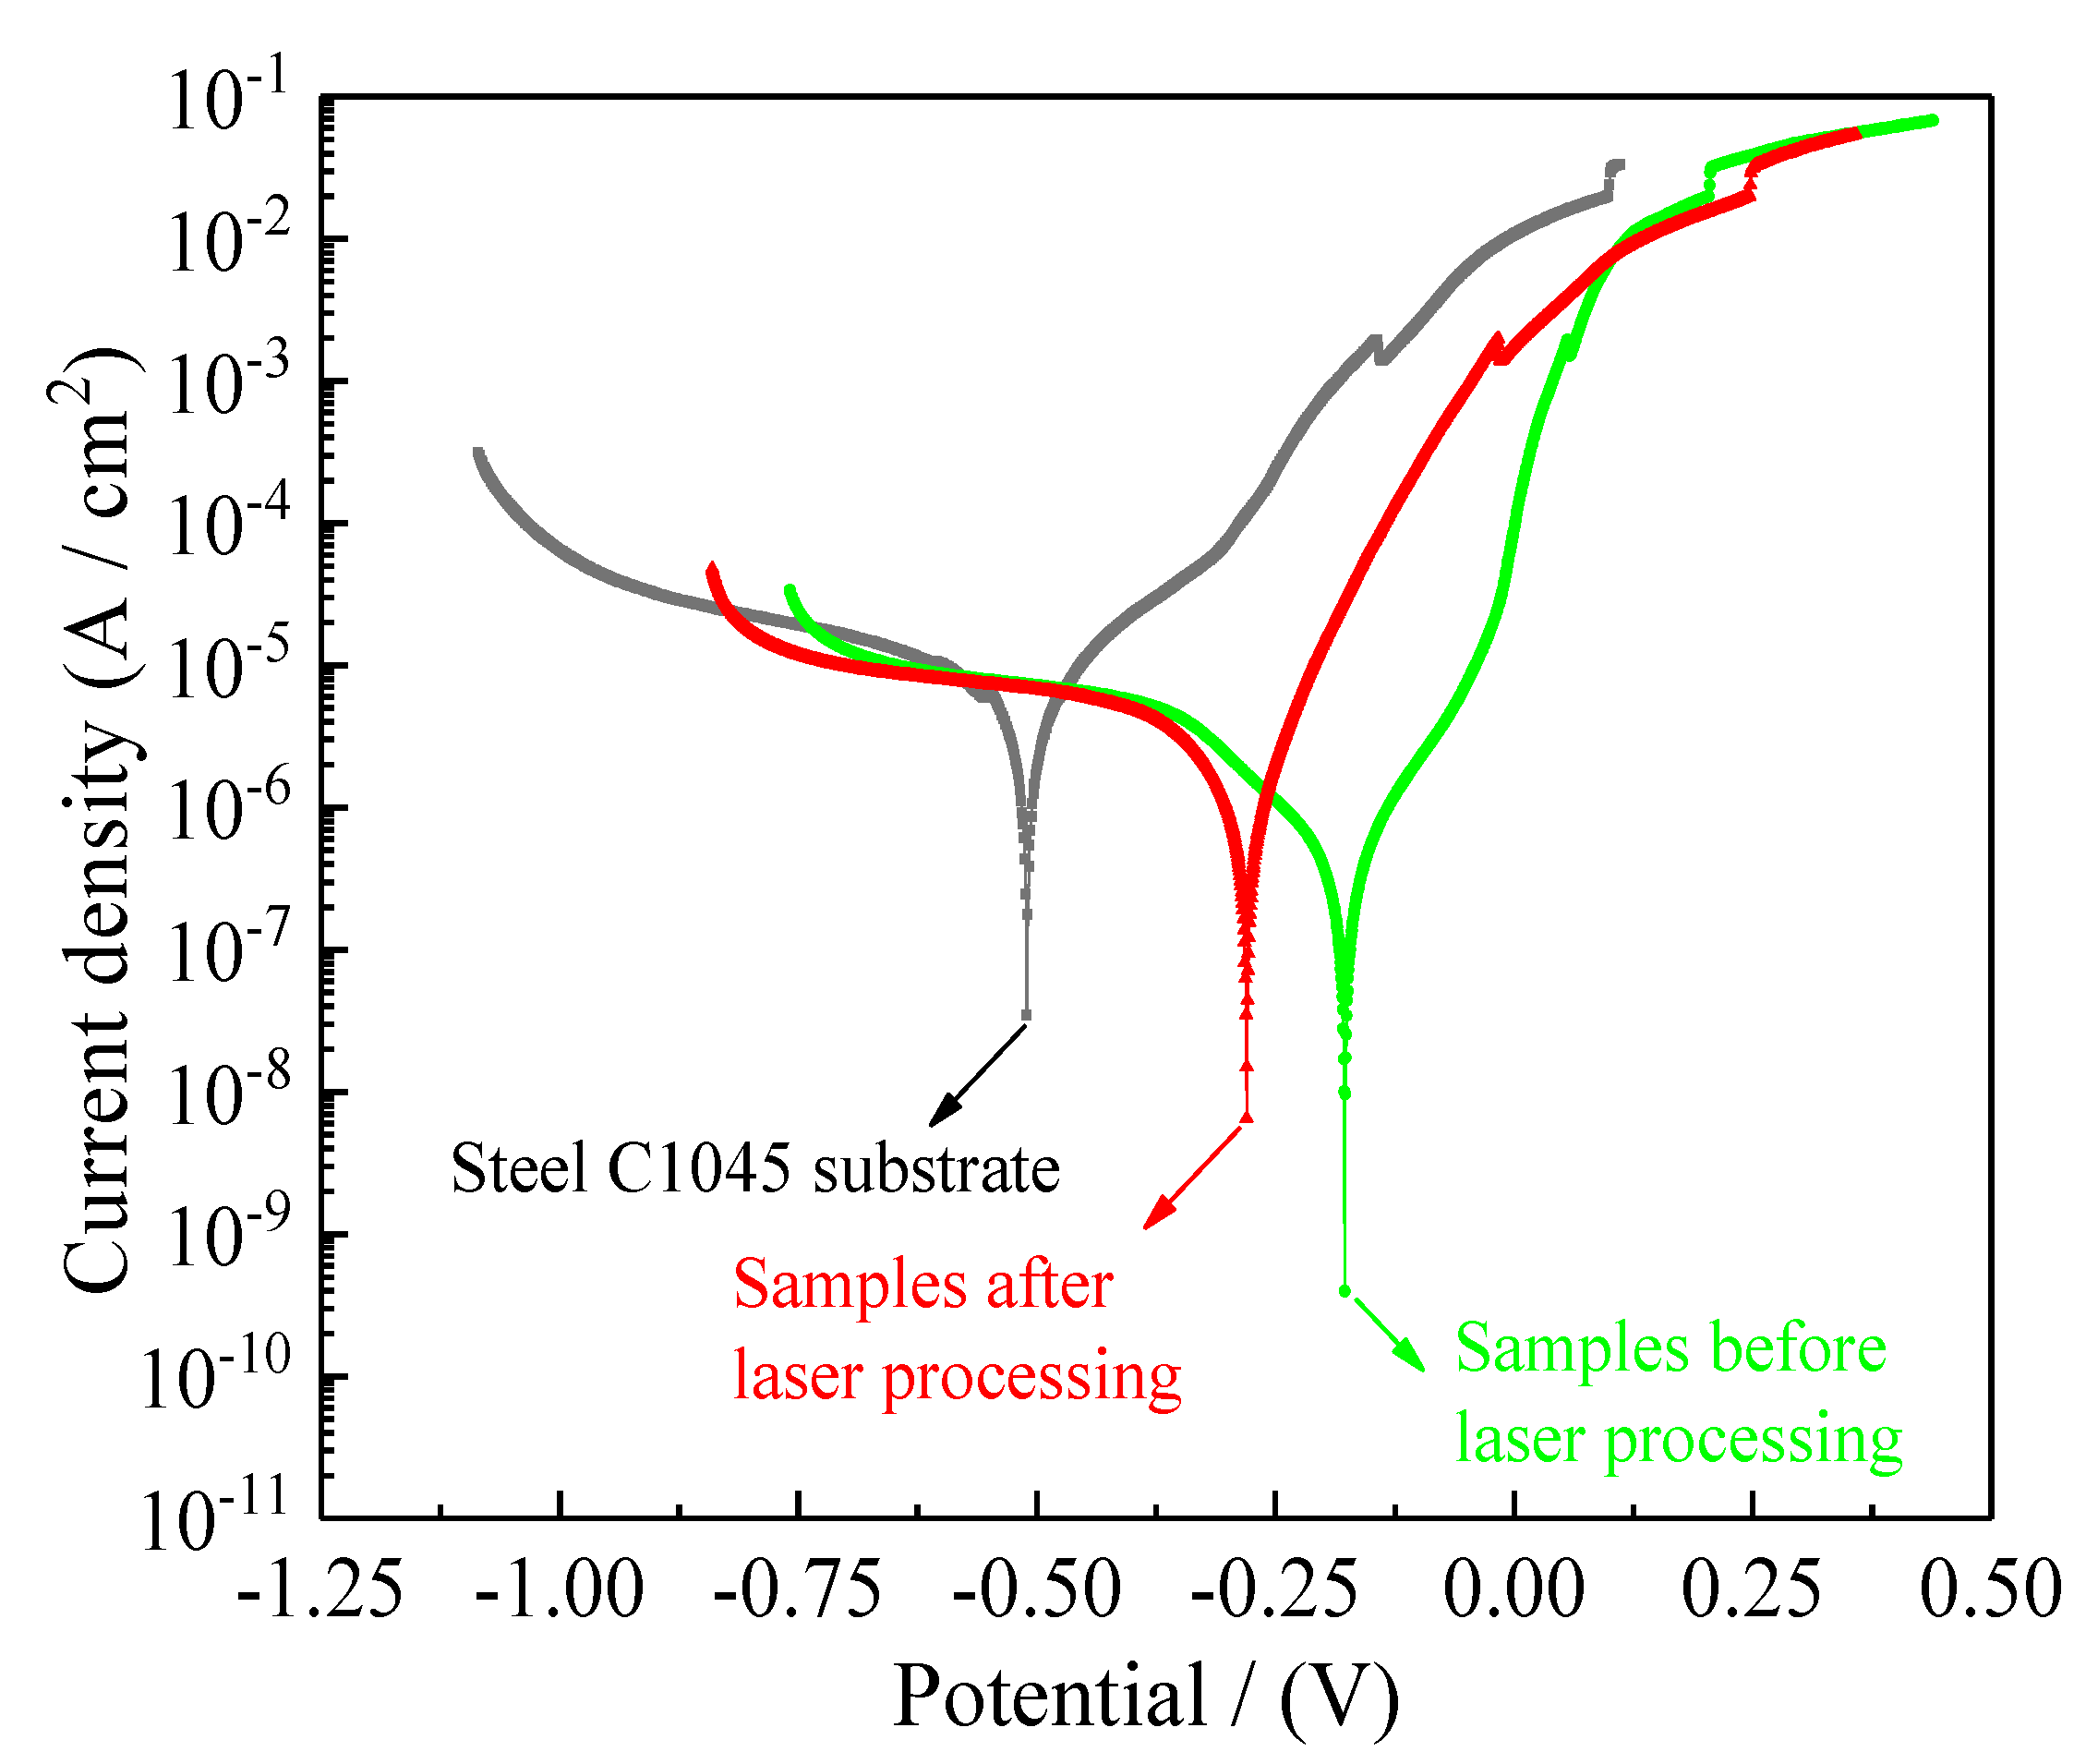
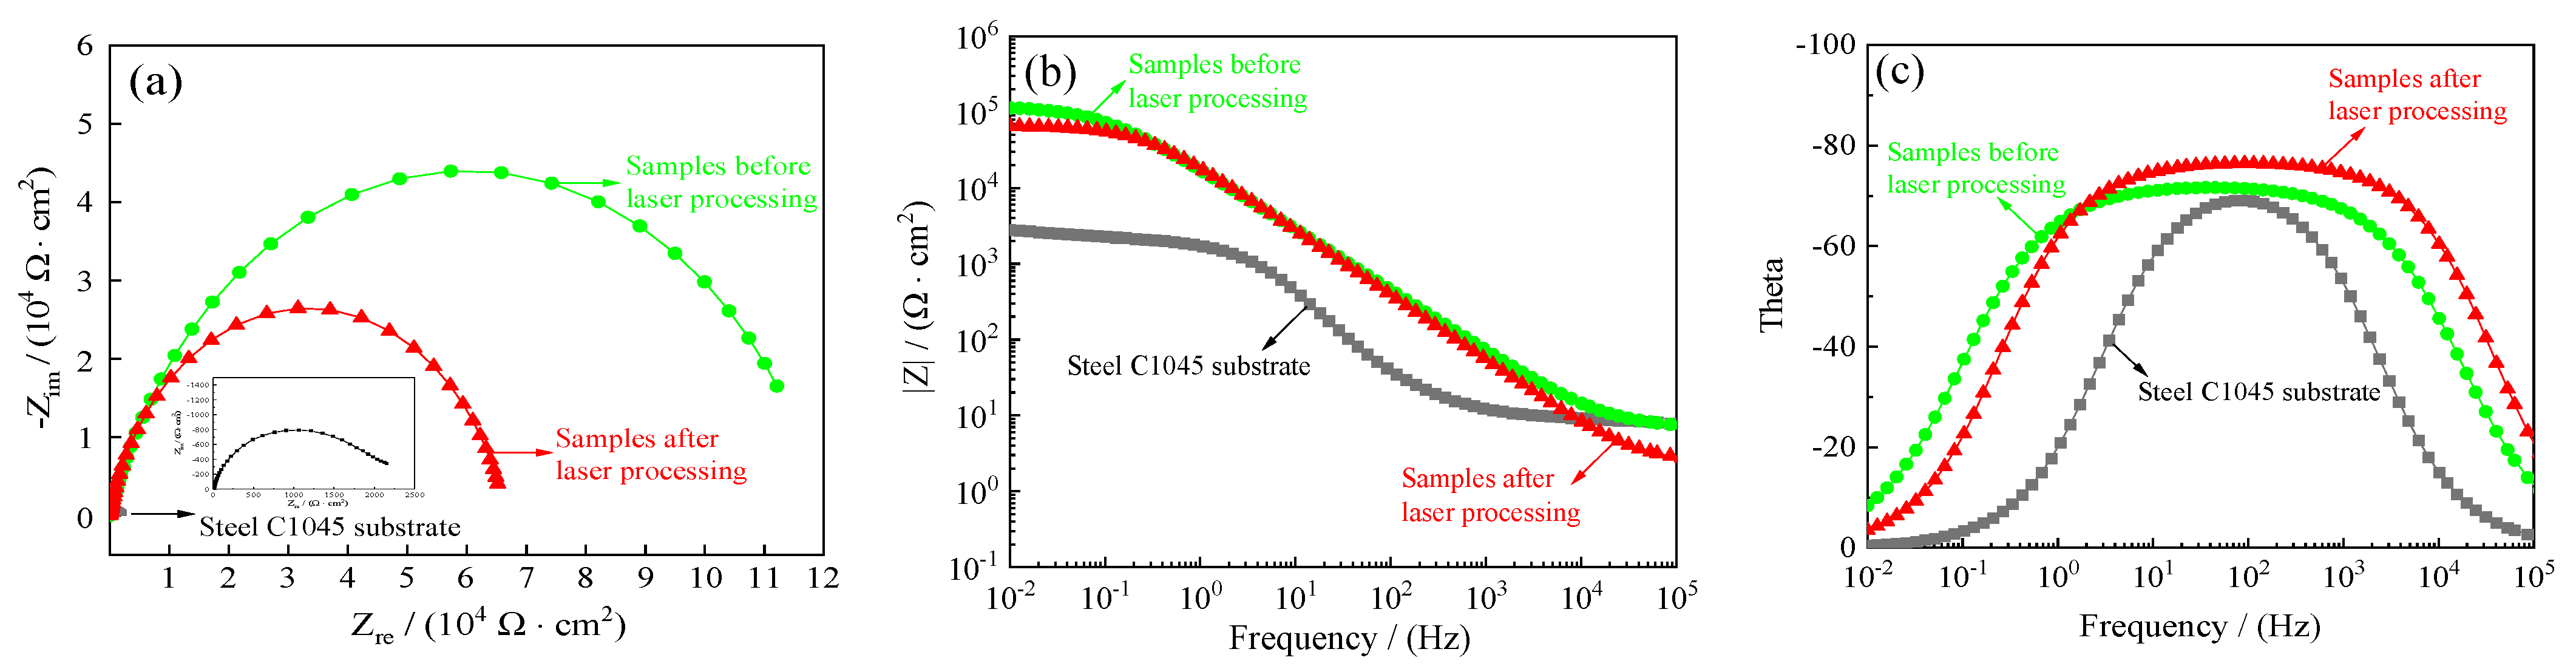
3.10. Corrosion Resistance of Samples before and after Laser-Processing

Figure 23 presents the potentiodynamic polarization curves of steel C1045 substrates and samples before and after laser processing. Table 6 shows corresponding values for corrosion potentials (Ecorr), corrosion current densities (Icorr), anodic Tafel slopes (βa), cathodic Tafel slopes (βc), corrosion rates (Rcorr) and polarization resistance (Rp). In general, a lower corrosion current density (Icorr) corresponds to a lower corrosion rate (Rcorr) which translates to better corrosion resistance [4,37]. A higher polarization resistance (Rp) shows that corrosion resistance is greatly improved. It is evident from Figure 23 and Table 6 that the corrosion potentials (Ecorr), corrosion current densities (Icorr), corrosion rates (Rcorr) and polarization resistance (Rp) of steel C1045 substrates were −508 mV, 19.86 µA·cm−2, 275.3 µm·year−1, and 4.05 kΩ cm−2, respectively. Additionally, the corrosion potentials (Ecorr), corrosion current densities (Icorr), corrosion rates (Rcorr) and polarization resistance (Rp) of samples using jet electrodeposition were −177 mV, 0.29 µA·cm−2, 3.5 µm·year−1, and 57.28 kΩ cm−2, respectively. It is noted that compared to the steel C1045 substrates, such low corrosion current densities and corrosion rates indicate greatly improved seawater corrosion resistance of nanocomposite coatings.
However, after laser processing, it was found that the corrosion potentials (Ecorr) of samples decreased from −177 mV to −280 mV, corrosion current densities (Icorr) increased from 0.29 µA·cm−2 to 1.47 µA·cm−2, corrosion rates (Rcorr) increased from 3.5 µm·year−1 to 15.9 µm·year−1 and polarization resistances (Rp) decreased from 57.28 kΩ cm−2 to 16.08 kΩ cm−2. It was observed that the seawater corrosion resistance of samples was greatly decreased, as compared to those of the untreated samples. The above phenomena may be associated with the cracks irradiated on the surface. It was evident that the cracks irradiated on the surface also increased or widened gradually with increased laser output power or pulse width in laser processing. Additionally, all the experiments were carried out at a low laser output power and a suitable pulse width, while the micro-texture (convex dome and small dimple at the center of created convex dome) exhibited small cracks due to the big brittleness of nanocomposite coatings. When the samples were introduced to artificial seawater corrosive environment, it became easier for Cl to get close to the steel C1045 substrates. Therefore, the samples’ seawater corrosion resistance decreased, as compared to those of the normal samples.
As a powerful complement to the Tafel curves, additional electrochemical impedance spectroscopy (EIS) was relied on to further demonstrate the improvement of steel C1045 substrates and samples’ seawater corrosion resistance. Figure 24 shows the electrochemical impedance spectra of samples before and after laser processing. Figure 24a–c depicts the Nyquist plots, the Bode plots (impedance modulus |Z| as a function of frequency) and Bode plots (theta as a function of frequency) recorded for the steel C1045 substrates and samples before and after laser processing, respectively.
Generally, a larger impedance semicircle diameter and a higher impedance modulus mean better corrosion resistance [38,39]. It is evident that the impedance semicircle diameter of steel C1045 substrates was the smallest, and the impedance semicircle diameter of samples before laser processing was the largest. Additionally, the impedance modulus (|Z|) for samples before laser processing was largest at low frequency in the Bode plots. Such a large impedance semicircle diameter and a high impedance modulus indicate better seawater corrosion protection performance.
On the other hand, the equivalent circuit models used for the samples were presented in Figure 25, where Rs, Cc, Rc, Cdl and Rct represent the solution resistance, resistance, capacitance, double-layer capacitance and charge-transfer resistance of the samples, respectively [40]. A previous study [41,42] showed that a higher value of Rct implied more inefficient charge transfer across the electrode/electrolyte interface, which could increase the possibility of charge recombination and thus improve the corrosion resistance. Table 7 lists the well-fitting results obtained from Figure 24 using ZVIEW software. As shown in Figure 25 and Table 7, it is evident that the charge transfer resistance (Rct) of samples before laser processing reached a value of 11.82 × 10⁴ Ω·cm−2. Further laser processing samples caused the charge transfer resistance (Rct) to decrease, reaching a value of 6.25 × 10⁴ Ω·cm−2, which concurred with the polarization curves. Similar results were reported by Ren et al. [43], it was found that the corrosion resistance of the laser-treated coating decreased with the increase in laser power. In addition, the corrosion resistance of laser-treated Ni-P-nano-Al2O3 was worse than the as-plated ones.

4. Conclusions

In this study, the Ni–Co–P–BN(h)–Al2O3 binary nanocomposite coatings were fabricated on steel C1045 substrates using jet electrodeposition. Then, the samples were processed with self-made long-pulse laser processing equipment to investigate the influence of laser output power, pulse width and spot-to-spot distance variation on samples’ surface morphologies, roughness and wettability. Finally, the wettability, microhardness, wear and corrosion resistance of samples before and after laser processing were compared. From the experimental testing and results obtained, the following conclusions were made:
  • Laser output power and pulse width had a strong effect on the morphologies of the created convex dome and small dimple. The convex dome was formed easily on the samples’ surface at a low laser output power and a suitable pulse width, and the dimple was formed on the samples’ surface at a high laser output power or pulse width.
  • The surface roughness and water contact angle of the samples increased with the rise in laser output power or pulse width. Additionally, the influence of laser output power on the surface roughness was greater than that of the pulse width. The water contact angle decreased with the rise in the spot-to-spot distance, and the water contact angle reached a maximum value of 139.8° with a laser output power of 50 W, a pulse width of 100 µs and a spot-to-spot distance of 150 µm, which indicated better hydrophobicity.
  • The samples after laser processing exhibited a higher wettability, microhardness and wear resistance compared to those of the normal samples. The microhardness of the heat-affected zone reached a maximum value of 812.1 HV0.1, and the wear scar width of the samples reached a minimum value of 360.5 µm. However, after laser processing, samples’ seawater corrosion resistance decreased slightly.

Author Contributions

Conceptualization, Y.Z. and M.K.; methodology, Y.Z., N.S.M. and B.V.G.; validation, Y.Z. and B.V.G.; formal analysis, Y.Z. and N.S.M.; investigation, M.J. and B.V.G.; resources, M.K.; writing—original draft preparation, Y.Z., B.V.G. and N.S.M.; writing—review and editing, Y.Z., N.S.M. and M.K.; visualization, Y.Z.; supervision, M.K.; project administration, M.K. and J.Z.; funding acquisition, M.K. All authors have read and agreed to the published version of the manuscript.

Funding

This research was funded by the Jiangsu Province Modern Agricultural Machinery Equipment and Technology Demonstration and Promotion Project, Grant number (NJ2019-22); Jiangsu Province Key Research and Development (Modern Agriculture), Grant number (BE2020311); and Research and Innovation Program for Graduate Students in Jiangsu, Grant No. KYCX19_0607.

Institutional Review Board Statement

Not applicable.

Informed Consent Statement

Not applicable.

Data Availability Statement

The data that support the findings of this study are available from the corresponding author, upon reasonable demand.

Conflicts of Interest

The authors declare no conflict of interest. The funders had no role in the design of the study; in the collection, analyses, or interpretation of data; in the writing of the manuscript; or in the decision to publish the results.

References

  1. Cai, W.; Meng, F.; Gao, X.; Hu, J. Effect of QPQ nitriding time on wear and corrosion behavior of 45 carbon steel. Appl. Surf. Sci. 2012, 261, 411–414. [Google Scholar] [CrossRef]
  2. Liu, H.; Wang, C.; Zhang, X.; Jiang, Y.; Cai, C.; Tang, S. Improving the corrosion resistance and mechanical property of steel C1045 surface by laser cladding with Ni60CuMoW alloy powder. Surf. Coat. Technol. 2013, 228, S296–S300. [Google Scholar] [CrossRef]
  3. Huang, G.; Qu, L.; Lu, Y.; Wang, Y.; Li, H.; Qin, Z.; Lu, X. Corrosion resistance improvement of steel C1045 by Fe-Based amorphous coating. Vacuum 2018, 153, 39–42. [Google Scholar] [CrossRef]
  4. Qiao, G.; Jing, T.; Wang, N.; Gao, Y.; Zhao, X.; Zhou, J.; Wang, W. High-speed jet electrodeposition and microstructure of nanocrystalline Ni-Co alloys. Electrochim. Acta 2006, 51, 85–92. [Google Scholar] [CrossRef]
  5. Wang, G.F.; Shen, L.D.; Huang, Y.H. Jet electrodeposition of bulk nanocrystalline nickel with real-time polishing. Int. J. Electrochem. Sci. 2012, 7, 10818–10824. [Google Scholar]
  6. Rajput, M.S.; Pandey, P.M.; Jha, S. Experimental investigations into ultrasonic-assisted jet electrodeposition process. J. Eng. Manuf. 2013, 228, 682–694. [Google Scholar] [CrossRef]
  7. Shen, L.; Wang, Y.; Jiang, W.; Liu, X.; Wang, C.; Tian, Z. Jet electrodeposition multilayer nickel on the surface of sintered NdFeB and corrosion behaviors. Corros. Eng. Sci. Technol. 2017, 52, 311–316. [Google Scholar] [CrossRef]
  8. Zhang, Y.; Kang, M.; Yao, L.; Mbugua, N.S.; Jin, M.; Zhu, J. Study on the wear and seawater corrosion resistance of Ni-Co-P alloy coatings with jet electrodeposition in different jet voltages and temperatures of plating solution. Coatings 2020, 10, 639. [Google Scholar] [CrossRef]
  9. Zhang, Y.; Kang, M.; Mbugua, N.S.; Yao, L.; Jin, M.; Zhu, J. Fabrication of Ni–Co–P alloy coatings using jet electrodeposition with varying reciprocating sweep speed and jet gap to improve wear and seawater corrosion resistance. Coatings 2020, 10, 924. [Google Scholar] [CrossRef]
  10. Tang, Z.; Ye, X.; Tan, J.; Zhang, Q. Effect of flow of bath on properties of Co-Ni alloy coating prepared by jet electrodeposition. Electroplat. Pollut. Control 2020, 3, 11–14. (In Chinese) [Google Scholar]
  11. Li, H.; Kang, M.; Zhang, Y.; Niu, X.; Liu, C.; Jin, M. Influences of jet parameters on structure and wear resistance of Ni-Co-BN (h) nanocomposite coatings. China Surf. Eng. 2018, 2, 103–112. (In Chinese) [Google Scholar]
  12. Li, H.; Kang, M.; Zhang, Y.; Liu, Y.; Jin, M.; Mbugua, N.S.; Zhu, G.; Liu, C. Fabrication of Ni-Co-BN (h) nanocomposite coatings with jet electrodeposition in different pulse parameters. Coatings 2019, 9, 50. [Google Scholar] [CrossRef] [Green Version]
  13. Jiang, W.; Shen, L.; Qiu, M.; Wang, X.; Fan, M.; Tian, Z. Preparation of Ni-SiC composite coatings by magnetic field-enhanced jet electrodeposition. J. Alloys Compd. 2018, 762, 115–124. [Google Scholar] [CrossRef]
  14. Jiang, W.; Shen, L.; Xu, M.; Wang, Z.; Tian, Z. Mechanical properties and corrosion resistance of Ni-Co-SiC composite coatings by magnetic field-induced jet electrodeposition. J. Alloys Compd. 2019, 791, 847–855. [Google Scholar] [CrossRef]
  15. Wang, C.; Shen, L.; Qiu, M.; Tian, Z.; Jiang, W. Characterizations of Ni-CeO2 nanocomposite coating by interlaced jet electrodeposition. J. Alloys Compd. 2017, 727, 269–277. [Google Scholar] [CrossRef]
  16. Wang, Y.; Shen, L.; Jiang, W.; Wang, X.; Fan, M.; Tian, Z.; Han, X. Laser processing as an alternative electrodeposition pretreatment. Surf. Coat. Technol. 2019, 357, 957–964. [Google Scholar] [CrossRef]
  17. Kang, M.; Zhang, Y.; Li, H. Study on the performances of Ni-Co-P/BN (h) nanocomposite coatings made by jet electrodeposition. Procedia Cirp. 2018, 68, 221–226. [Google Scholar] [CrossRef]
  18. Wang, L.; Wang, X.; Li, N.; Kang, M. Processing of microstructures on 304 L stainless steel surface based on long pulse laser. Laser Optoelectron. Prog. 2017, 54, 176–183. (In Chinese) [Google Scholar]
  19. Wang, X.; Zhang, Y.; Wang, L.; Xian, J.; Jin, M.; Kang, M. Fabrication of micro-convex domes using long pulse laser. Appl. Phys. A Mater. 2017, 123, 51–59. [Google Scholar] [CrossRef]
  20. Wang, X.; Xu, W.; Liu, L.; Zhang, Z.; Jin, M.; Kang, M. Magnetic-field-assisted fabrication of micro-convex domes using long pulse laser. Appl. Phys. A Mater. 2017, 123, 592–600. [Google Scholar] [CrossRef]
  21. Li, N.; Li, Z.; Kang, M.; Zhang, J. Numerical simulation and experimental study on laser micromachining of 304 L stainless steel in ambient air. Int. J. Mass Transf. 2019, 140, 978–991. [Google Scholar] [CrossRef]
  22. Zhang, Y.; Shen, Z.; Ni, X. Modeling and simulation on long pulse laser drilling processing. Int. J. Mass Transf. 2014, 73, 429–437. [Google Scholar] [CrossRef]
  23. Ji, L.; Li, N.; Kang, M. Evolution law of laser-textured microstructure on Ni-Co-Si3N4 composite coating surface. Laser Optoelectron. Prog. 2021, 58, 264–273. (In Chinese) [Google Scholar]
  24. Wang, B.; Dai, G.; Zhang, H.; Ni, X.; Shen, Z.; Lu, J. Damage performance of TiO2/SiO2 thin film components induced by a long-pulsed laser. Appl. Surf. Sci. 2011, 23, 9977–9981. [Google Scholar] [CrossRef]
  25. Zhou, J.; Shen, H.; Pan, Y.; Ding, X. Experimental study on laser microstructures using long pulse. Opt. Lasers Eng. 2016, 78, 113–120. [Google Scholar] [CrossRef]
  26. Yung, K.C.; Wang, W.J.; Xiao, T.Y.; Choy, H.S.; Mo, X.Y.; Zhang, S.S.; Cai, Z.X. Laser polishing of additive manufactured CoCr components for controlling their wettability characteristics. Appl. Surf. Sci. 2018, 351, 89–98. [Google Scholar] [CrossRef]
  27. Jing, X.; Pu, Z.; Zheng, S.; Wang, F.; Qi, H. Nanosecond laser induced microstructure features and effects thereof on the wettability in zirconia. Ceram. Int. 2020, 15, 24173–24182. [Google Scholar] [CrossRef]
  28. Li, H.; Kang, M.; Zhang, Y.; Liu, Y.; Jin, M.; Mbugua, N.S.; Zhu, G.; Liu, C. Fabrication of superhydrophobic Ni-Co alloy coatings via electrochemical machining to improve corrosion resistance. Nanosci. Nanotechnol. Lett. 2019, 1, 47–55. [Google Scholar] [CrossRef]
  29. Zhang, Y.; Kang, M.; Jin, M.; Mbugua, N.S.; Zhu, J. Study on the corrosion resistance of superhydrophobic Ni-CoP-BN (h) nanocomposite coatings prepared by electrochemical machining and fluorosilane modification. Int. J. Electrochem. Sci. 2020, 15, 2052–2069. [Google Scholar] [CrossRef]
  30. Zheng, X.; Song, R.; Yao, J. Laser heat treatment and wear resistance of electroless plating. Chin. J. Laser 2008, 35, 610–614. (In Chinese) [Google Scholar] [CrossRef]
  31. Dun, A.; Yao, J.; Kong, F.; Zhang, W. Microstructure characterization of Ni-P-A12O3 electroless composite plating on Fe-C alloy treated by laser beam. Chin. J. Laser 2008, 35, 1609–1614. (In Chinese) [Google Scholar]
  32. Luo, F.; Chen, Z.; Dong, S. The effect of laser processing parameters on microstructure and performance of nano-SiO2. China Surf. Eng. 2008, 21, 17–21. (In Chinese) [Google Scholar]
  33. Mohazzab, B.F.; Jaleh, B.; Fattah-alhosseini, A.; Mahmoudi, F.; Momeni, A. Laser surface treatment of pure titanium: Microstructural analysis, wear properties, and corrosion behavior of titanium carbide coatings in Hank’s physiological solution. Surf. Interfaces 2020, 20, 100597. [Google Scholar] [CrossRef]
  34. Liu, H.; Guo, R.; Liu, Z. Characteristics of microstructure and performance of laser-treated electroless Ni−P/Ni−W−P duplex coatings. Trans. Nonferrous Met. Soc. China 2012, 22, 3012–3020. (In Chinese) [Google Scholar] [CrossRef]
  35. Zhang, J.; Deng, L. Analysis on microstructure and friction properties of laser texture coatings on the surface of cylinder liner/piston friction pair. Mater. Prot. 2019, 52, 47–50. (In Chinese) [Google Scholar]
  36. Lou, D.; Ding, Q.; Lou, C.; Yao, J. Influences of laser surface treatment on microstructure and wear resistance of electroless composite plated NiAl/nano Al2O3 coatings. Laser Optoelectron. Prog. 2010, 47, 91–96. (In Chinese) [Google Scholar]
  37. Ma, Q.; Wang, W.; Dong, G. Facile fabrication of biomimetic liquid-infused slippery surface on carbon steel and its self-cleaning, anti-corrosion, anti-frosting and tribological properties. Colloids Surf. A 2019, 577, 17–26. [Google Scholar] [CrossRef]
  38. Li, B.; Zhang, W.; Huan, Y.; Zhang, W. Effect of SiC on corrosion and wear resistance of Ni-W coatings. Rare Met. Mater. Eng. 2017, 10, 381–386. [Google Scholar]
  39. Gu, Z.; Mao, P.; Gou, Y.; Chao, Y.; Xi, S. Microstructure and properties of MgMoNbFeTi2Yx high entropy alloy coatings by laser cladding. Surf. Coat. Technol. 2020, 402, 126303. [Google Scholar] [CrossRef]
  40. Yu, D.; Tian, J.; Dai, J.; Wang, X. Corrosion resistance of three-layer superhydrophobic composite coating on carbon steel in seawater. Electrochim. Acta 2013, 97, 409–419. [Google Scholar] [CrossRef]
  41. Jayaraj, J.; Raj, A.S.; Srinivasan, A.; Ananthakumar, S.; Pillai, U.T.S.; Dhaipule, N.G.K.; Mudali, U.K. Composite magnesium phosphate coatings for improved corrosion resistance of magnesium AZ31 alloy. Corros. Sci. 2016, 113, 104–115. [Google Scholar] [CrossRef]
  42. Ji, X.J.; Luan, G.F.; Lyu, J.C.; Cui, L.Y.; Li, S.Q.; Zeng, R.C.; Wang, Z.L. Corrosion resistance and tunable release of ciproflfloxacin-loaded multilayers on magnesium alloy: Effects of SiO2 nanoparticles. Appl. Surf. Sci. 2020, 508, 145240. [Google Scholar] [CrossRef]
  43. Ren, X.; Zhu, H.; Zhang, R.; Wang, F.; Gu, Y. Laser modification of Ni-P-nano-Al2O3 electroless composite coating on 45 carbon steel. Corros. Sci. Prot. Technol. 2013, 25, 393–397. (In Chinese) [Google Scholar]
Figure 1. (a) Surface morphology and (b) cross-section images of binary nanocomposite coatings deposited using jet electrodeposition.
Coatings 11 01467 g001
Figure 2. Experimental device of laser surface micro-structuring.
Coatings 11 01467 g002
Figure 3. Schematic diagram of contact angle for an ideal smooth surface.
Coatings 11 01467 g003
Figure 4. Effect of varying laser output power on samples’ surface morphologies: (a) 50 W; (b) 60 W; (c) 70 W; (d) 80 W; (e) 90 W; (f) 100 W; (g) 110 W; (h) 120 W.
Coatings 11 01467 g004aCoatings 11 01467 g004b
Figure 5. Experimental three-dimensional images with varying laser output power: (a) 50 W; (b) 60 W; (c) 70 W; (d) 80 W; (e) 90 W; (f) 100 W; (g) 110 W; (h) 120 W.
Coatings 11 01467 g005aCoatings 11 01467 g005b
Figure 6. Experimental 2D cross-sectional profiles obtained from Figure 5: (a) 50 W; (b) 60 W; (c) 70 W; (d) 80 W; (e) 90 W; (f) 100 W; (g) 110 W; (h) 120 W.
Coatings 11 01467 g006
Figure 7. Optical profile of water drops of textured surface with varying laser output power: (a) 50 W; (b) 60 W; (c) 70 W; (d) 80 W; (e) 90 W; (f) 100 W; (g) 110 W; (h) 120 W.
Coatings 11 01467 g007aCoatings 11 01467 g007b
Figure 8. Water contact angle of textured surface with varying laser output power: 50 W; 60 W; 70 W; 80 W; 90 W; 100 W; 110 W; 120 W.
Coatings 11 01467 g008
Figure 9. Effect of varying pulse width on samples’ surface morphologies: (a) 75 µs, 50 W; (b) 100 µs, 50 W; (c) 125 µs, 50 W; (d) 150 µs, 50 W; (e) 75 µs, 60 W; (f) 100 µs, 60 W; (g) 125 µs, 60 W; (h) 150 µs, 60 W.
Coatings 11 01467 g009
Figure 10. Experimental three-dimensional images with varying pulse width: (a) 75 µs, 50 W; (b) 100 µs, 50 W; (c) 125 µs, 50 W; (d) 150 µs, 50 W; (e) 75 µs, 60 W; (f) 100 µs, 60 W; (g) 125 µs, 60 W; (h) 150 µs, 60 W.
Coatings 11 01467 g010
Figure 11. Experimental 2D cross-sectional profiles obtained from Figure 10: (a) 75 µs, 50 W; (b) 100 µs, 50 W; (c) 125 µs, 50 W; (d) 150 µs, 50 W; (e) 75 µs, 60 W; (f) 100 µs, 60 W; (g) 125 µs, 60 W; (h) 150 µs, 60 W.
Coatings 11 01467 g011
Figure 12. Optical profile of water drops of textured surface with varying pulse width: (a) 75 µs, 50 W; (b) 100 µs, 50 W; (c) 125 µs, 50 W; (d) 150 µs, 50 W; (e) 75 µs, 60 W; (f) 100 µs, 60 W; (g) 125 µs, 60 W; (h) 150 µs, 60 W.
Coatings 11 01467 g012
Figure 13. Effect of laser pulse width on textured surface water contact angle: (a) P = 50 W; (b) P = 60 W.
Coatings 11 01467 g013
Figure 14. SEM images of textured surface with varying spot-to-spot distance: (a) 150 μm; (b) 200 μm; (c) 250 μm; (d) 300 μm.
Coatings 11 01467 g014
Figure 15. Elemental mapping images of sample textured surface.
Coatings 11 01467 g015aCoatings 11 01467 g015b
Figure 16. Optical profile of water drops of textured surface with varying spot-to-spot distance: (a) 150 μm; (b) 200 μm; (c) 250 μm; (d) 300 μm.
Coatings 11 01467 g016
Figure 17. Effect of spot-to-spot distance on textured surface water contact angle.
Coatings 11 01467 g017
Figure 18. Images and water contact angle of samples before and after laser processing: (a) image before laser processing; (b) image after laser processing; (c) water contact angle of steel C1045 substrates; (d) water contact angle of samples before laser processing; (e) water contact angle of samples after laser processing.
Coatings 11 01467 g018
Figure 19. Optical microscopy images of the Vickers indent: (a,b) P = 50 W, τ = 50 μs; (c,d) P = 120 W, τ = 50 μs; (e,f) τ = 100 μs, P = 50 W; (g) τ = 75 μs, P = 50 W; (h) τ = 125 μs, P = 50 W.
Coatings 11 01467 g019aCoatings 11 01467 g019b
Figure 20. XRD patterns of samples before and after laser processing: (a) before laser processing; (b,c) after laser processing.
Coatings 11 01467 g020
Figure 21. Frictional coefficient of samples before and after laser processing.
Coatings 11 01467 g021
Figure 22. Wear scar width of samples before and after laser processing: (a) before laser processing; (b) after laser processing.
Coatings 11 01467 g022
Figure 23. Potentiodynamic polarization curves of samples before and after laser processing.
Coatings 11 01467 g023
Figure 24. Electrochemical impedance spectra of samples before and after laser processing: (a) Nyquist plots (Zre–Zim), (b) Bode plots (F–|Z|), (c) Bode plots (F–Theta).
Coatings 11 01467 g024
Figure 25. Samples equivalent circuit model in artificial seawater.
Coatings 11 01467 g025
Table 1. Pretreatment solutions compositions, concentrations, and operating conditions.
CompositionConcentration (g·L−1)Operating Conditions
1#NaOH25.0Processing time 30 s,
Treatment current 1 A in electric cleaning
Na2CO321.7
Na3PO450.0
NaCl2.4
2#HCl25.0Processing time 35 s,
Treatment current 1 A in strong activation
NaCl140.1
3#H3C6H5O7·H2O94.3Processing time 35 s,
Treatment current 1 A in weak activation
NiCl2·6H2O3.0
Na3C6H5O7·2H2O141.2
Table 2. Solution composition and preparation parameters used for the coatings experiment.
Solution CompositionConcentration (g·L−1)Preparation Parameters
Nickel sulfate (NiSO4·6H2O)200.0Jet voltage12 V
Nickel chloride hexahydrate
(NiCl2·6H2O)
30.0Temperatures of the plating solution60 °C
Cobaltous sulfate heptahydrate
(CoSO4·7H2O)
20.0Reciprocating sweep speeds175 mm·s−1
Boric acid (H3BO3)30.0Jet gap2.0 mm
Phosphorous acid (H3PO3)20.0Injection speed1.5 m·s−1
Citric acid monohydrate
(C6H8O7·H2O)
60.0Electrodeposition time20 min
Sodium dodecyl sulfate
(CH3(CH2)11SO4Na)
0.08Pulse frequency4 kHz
Sulfourea (H2NCSNH2)0.02Duty cycle0.8
BN(h) nanoparticles 4.0 g·L−1 and Al2O3 nanoparticles 4.0 g·L−1
Table 3. Laser-processing parameters used in the experiment.
Processing ParametersValues
Laser output power/(W)50, 60, 70, 80, 90, 100, 110, 120
Pulse width/(µs)50, 75, 100, 125, 150
Pulse repetition/(Hz)2000
Pulse number1
Feed rate/(mm·s−1)5
Spot-to-spot distance/(µm)150, 200, 250, 300
Table 4. Chemical composition of artificial seawater.
Constituent NaCl MgCl2Na2SO4CaCl2KCl NaHCO3KBr H3BO3SrCl2NaF
Concentration (g·L−1)24.5305.2004.0901.1600.6950.2010.1010.0270.0250.003
Table 5. The chemical composition of samples before and after laser treatment.
SamplesNiCoPBNAlO
Before laser processing/(wt.%)56.0236.641.082.960.190.512.60
After laser processing/(wt.%)54.4333.080.602.110.150.339.30
Table 6. Analyzing results of potentiodynamic polarization curves of samples.
SamplesEcorr/
mV
Icorr/
(µA·cm2)
βa
(mV/dec)
βc
(mV/dec)
Rcorr/
(µm·year1)
Rp/
(kΩ·cm2)
steel C1045 substrates−50819.86390352275.34.05
Before laser processing−1770.2974793.557.28
After laser processing−2801.479213315.916.08
Table 7. Analyzing results of potentiodynamic polarization curves of samples.
SamplesRs/
(Ω·cm−2)
Cc/
(μF·cm−2)
Rc/
(KΩ·cm−2)
Cdl/
(μF·cm−2)
Rct/
(104 Ω·cm2)
Steel C1045 substrates8.233.670.185.490.24
Before laser processing6.828.641.2736.7311.82
After laser processing6.946.371.0224.166.25
Publisher’s Note: MDPI stays neutral with regard to jurisdictional claims in published maps and institutional affiliations.

