
Microfluidic Simulation and Optimization of Blood Coagulation Factors and Anticoagulants in Polymethyl Methacrylate Microchannels


Abstract
:1. Introduction
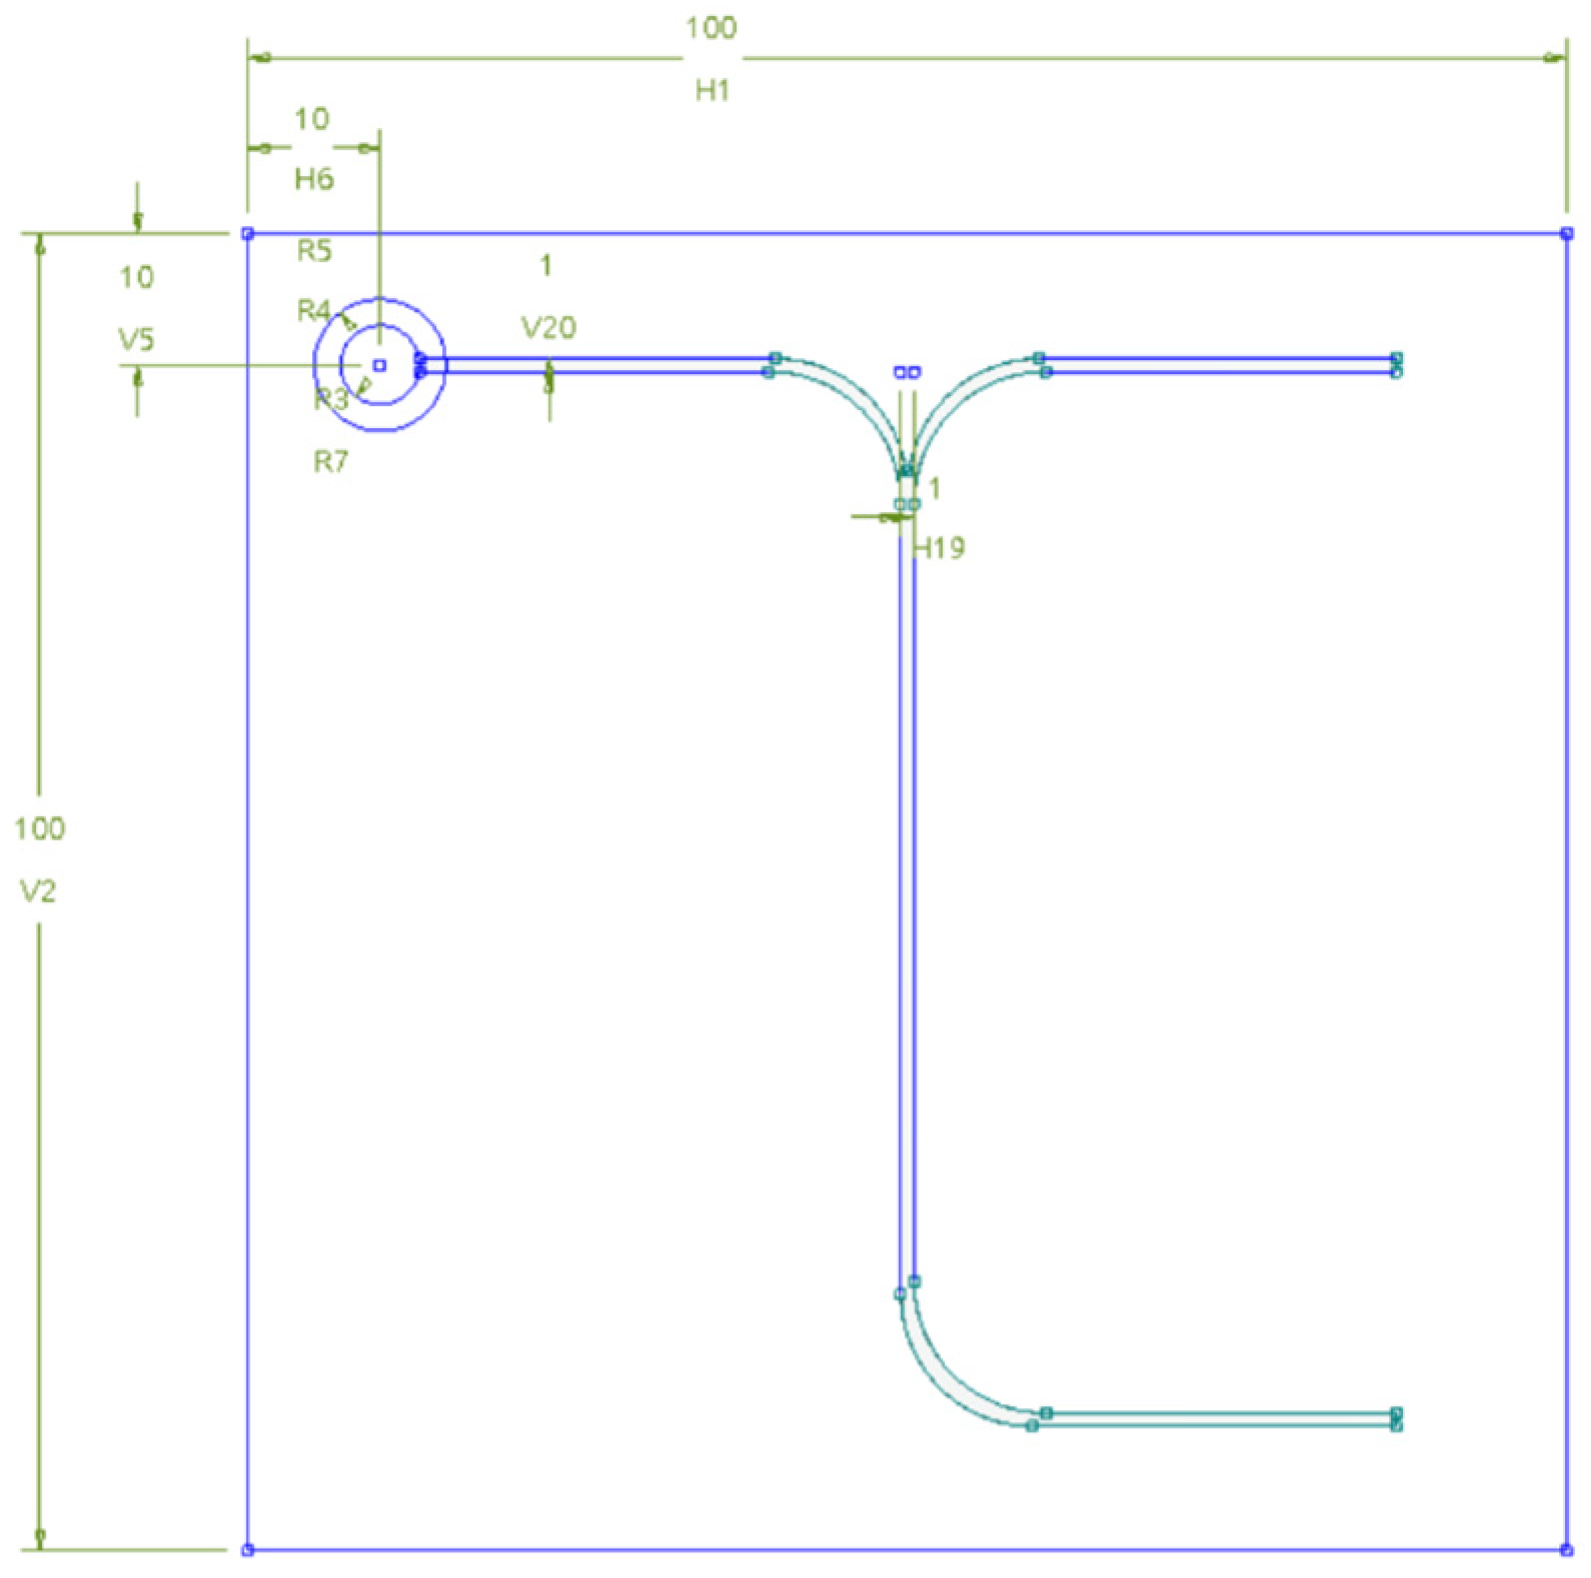
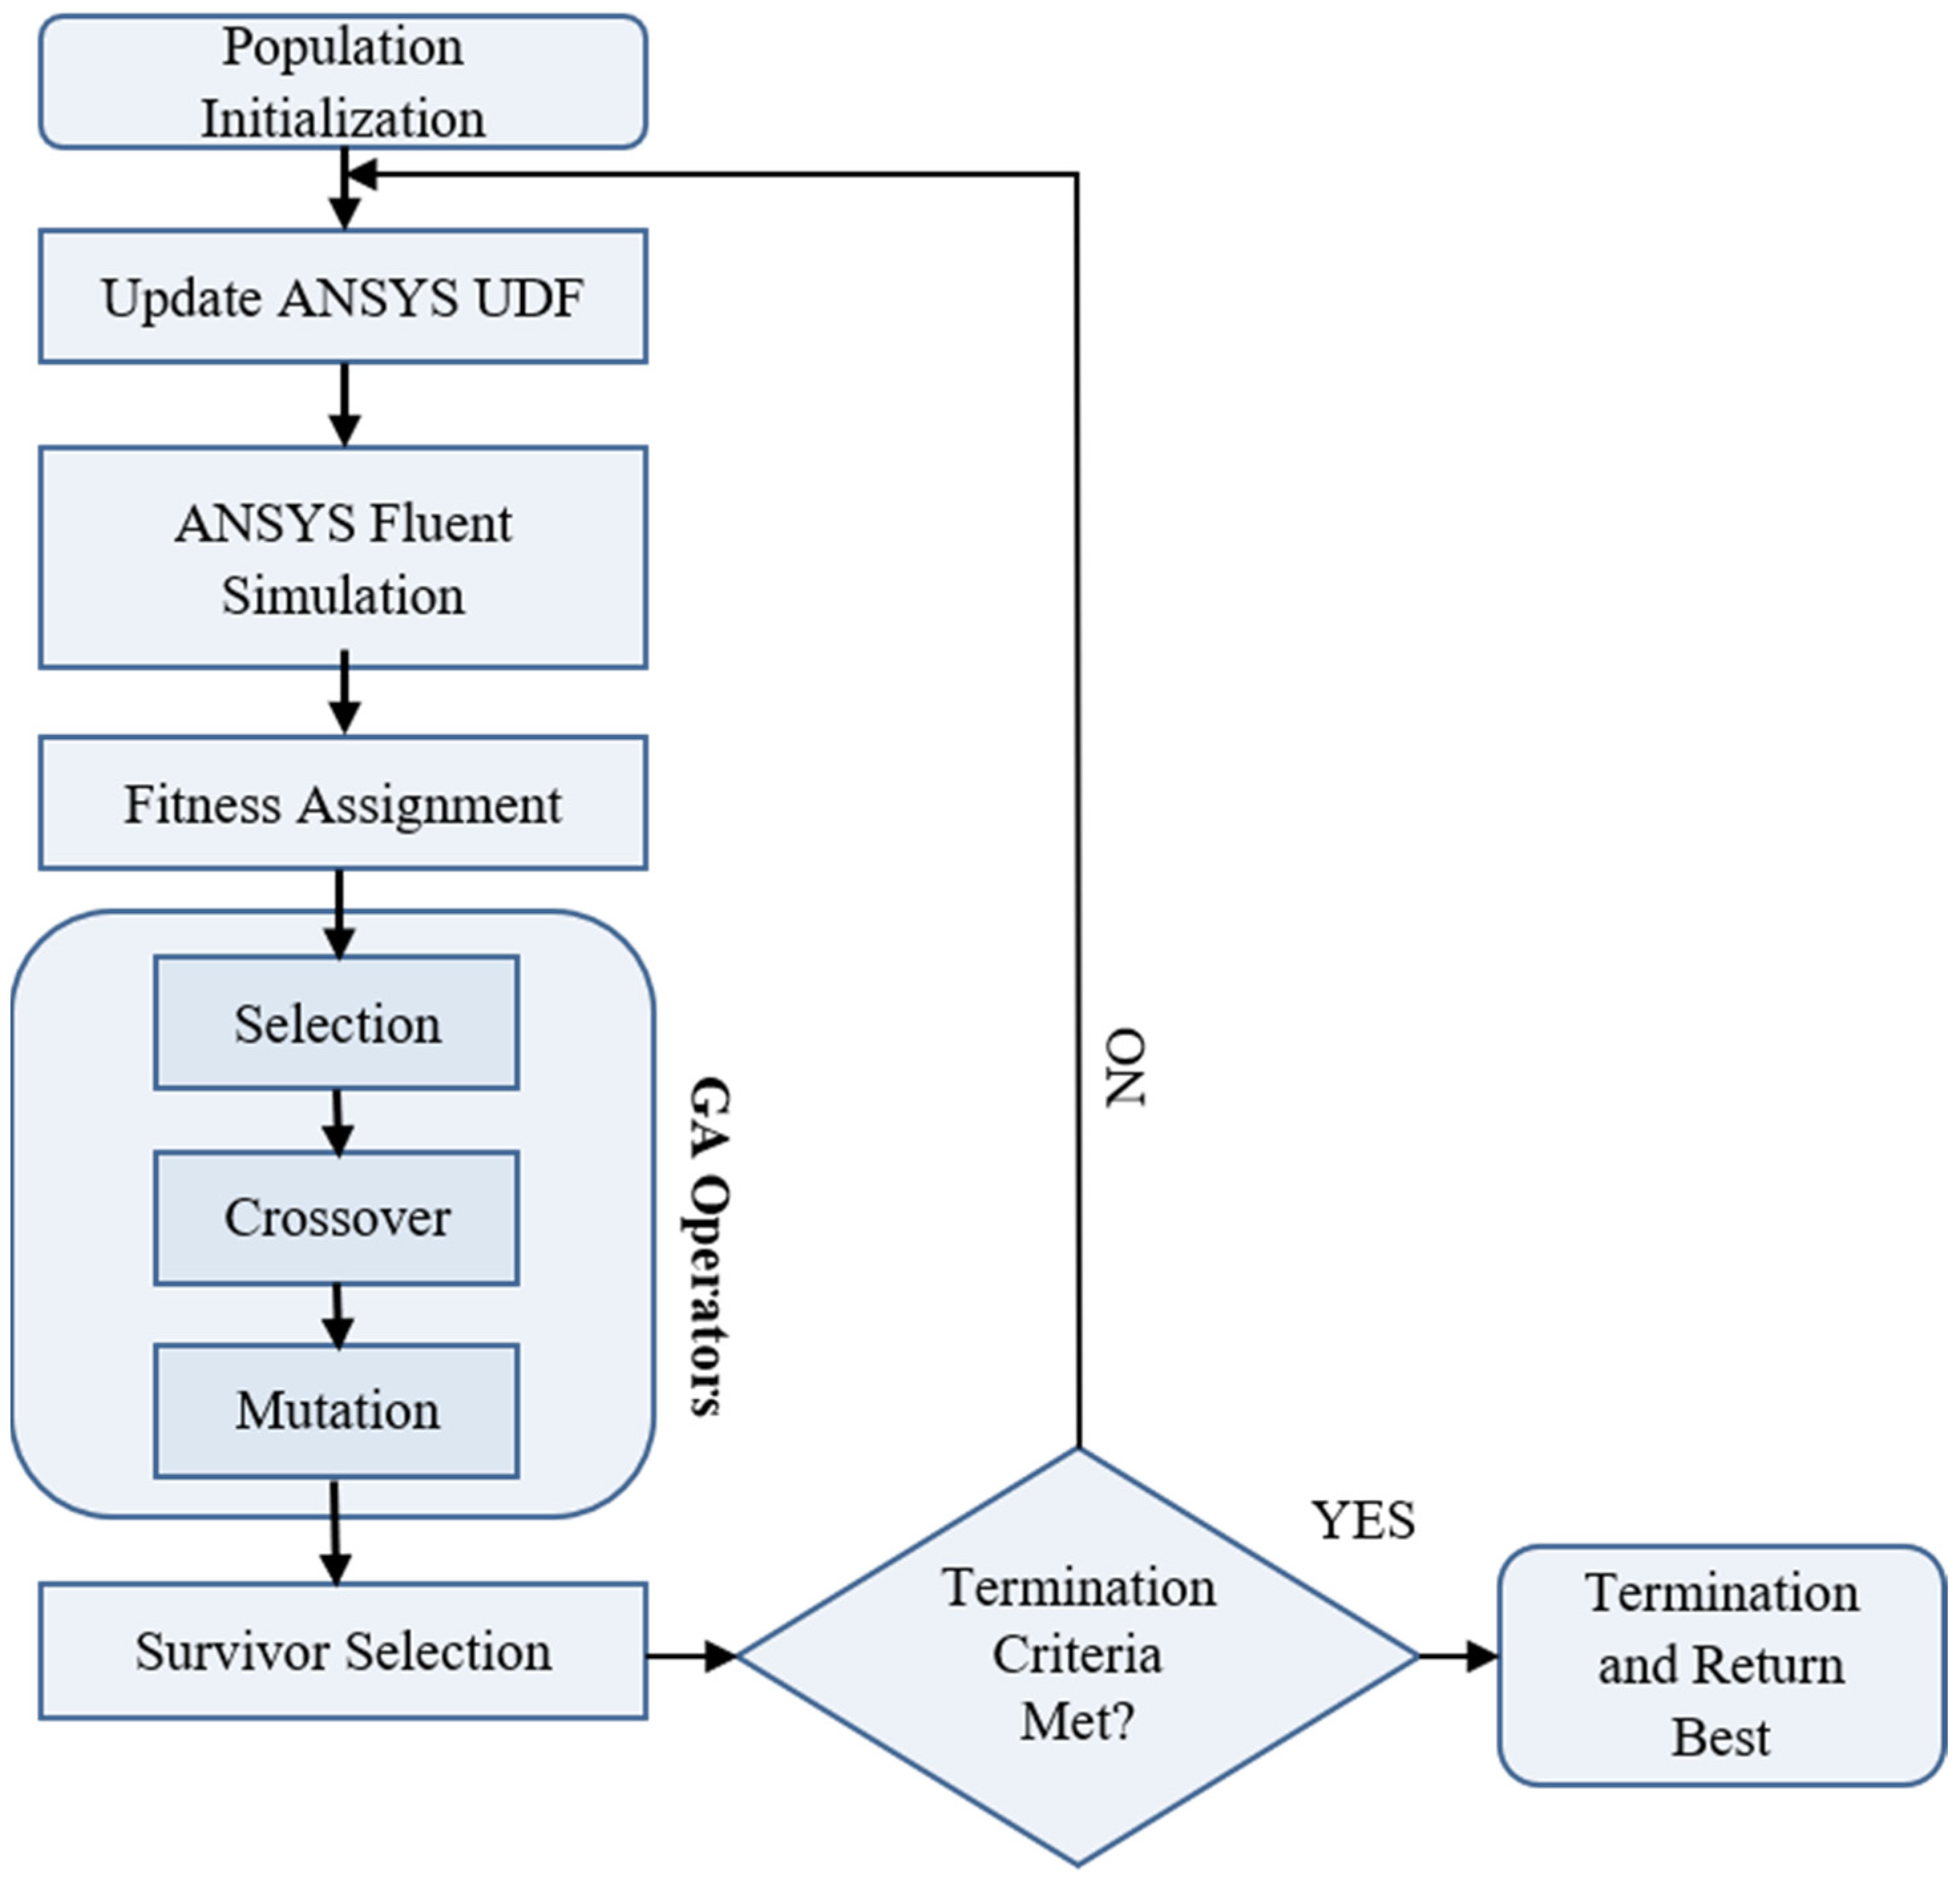
2. Methodology
3. Governing Equations and Boundary Conditions
3.1. Equation of Continuity
3.2. Momentum Equation
3.3. Species Transport Equations
3.4. Boundary Equations
4. Results and Discussion
5. Conclusions
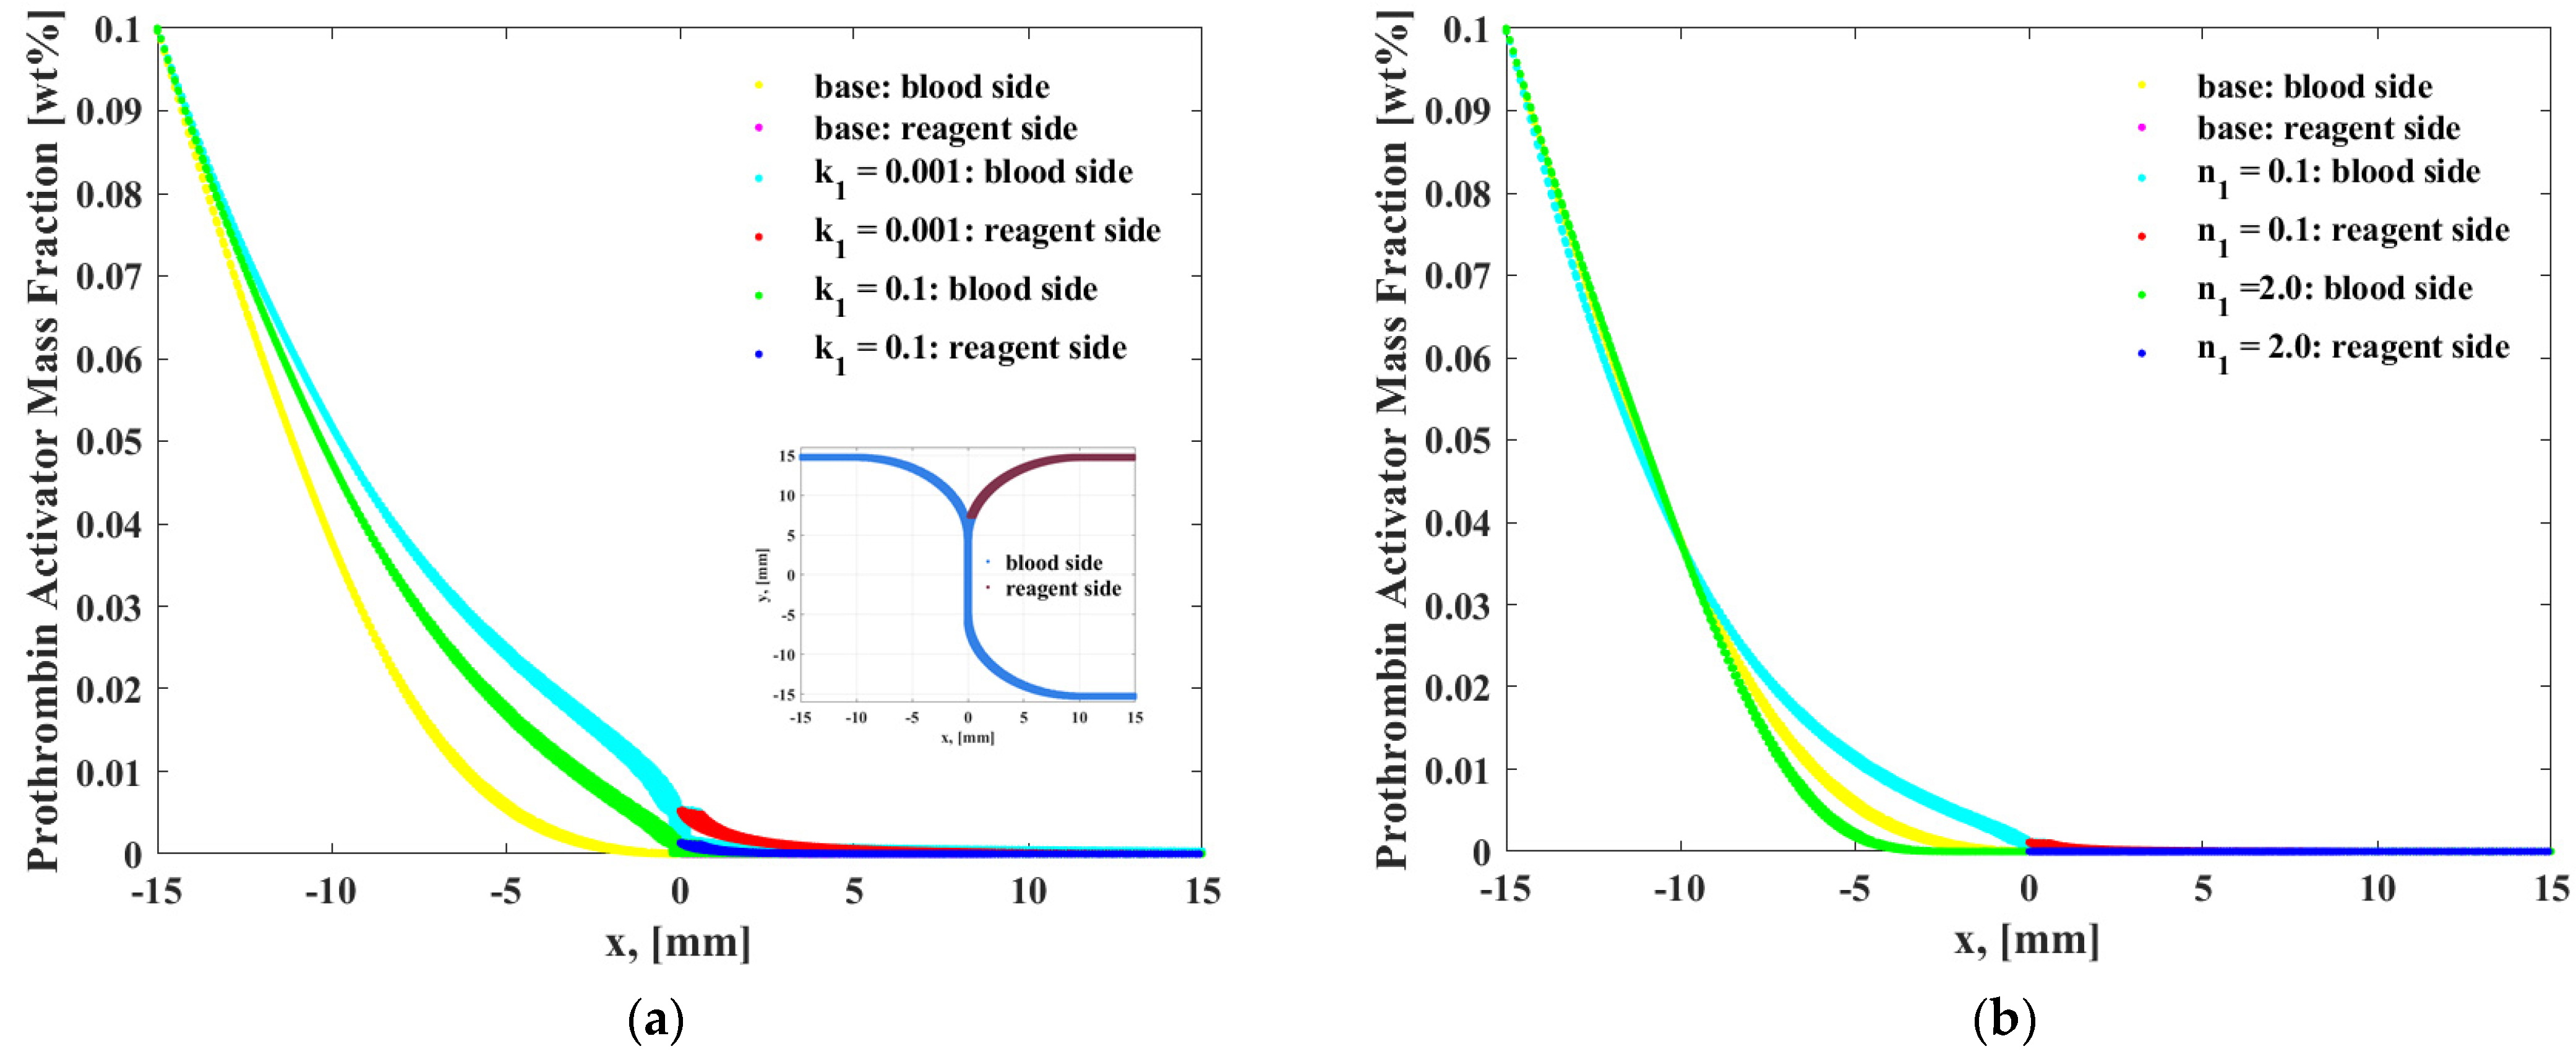
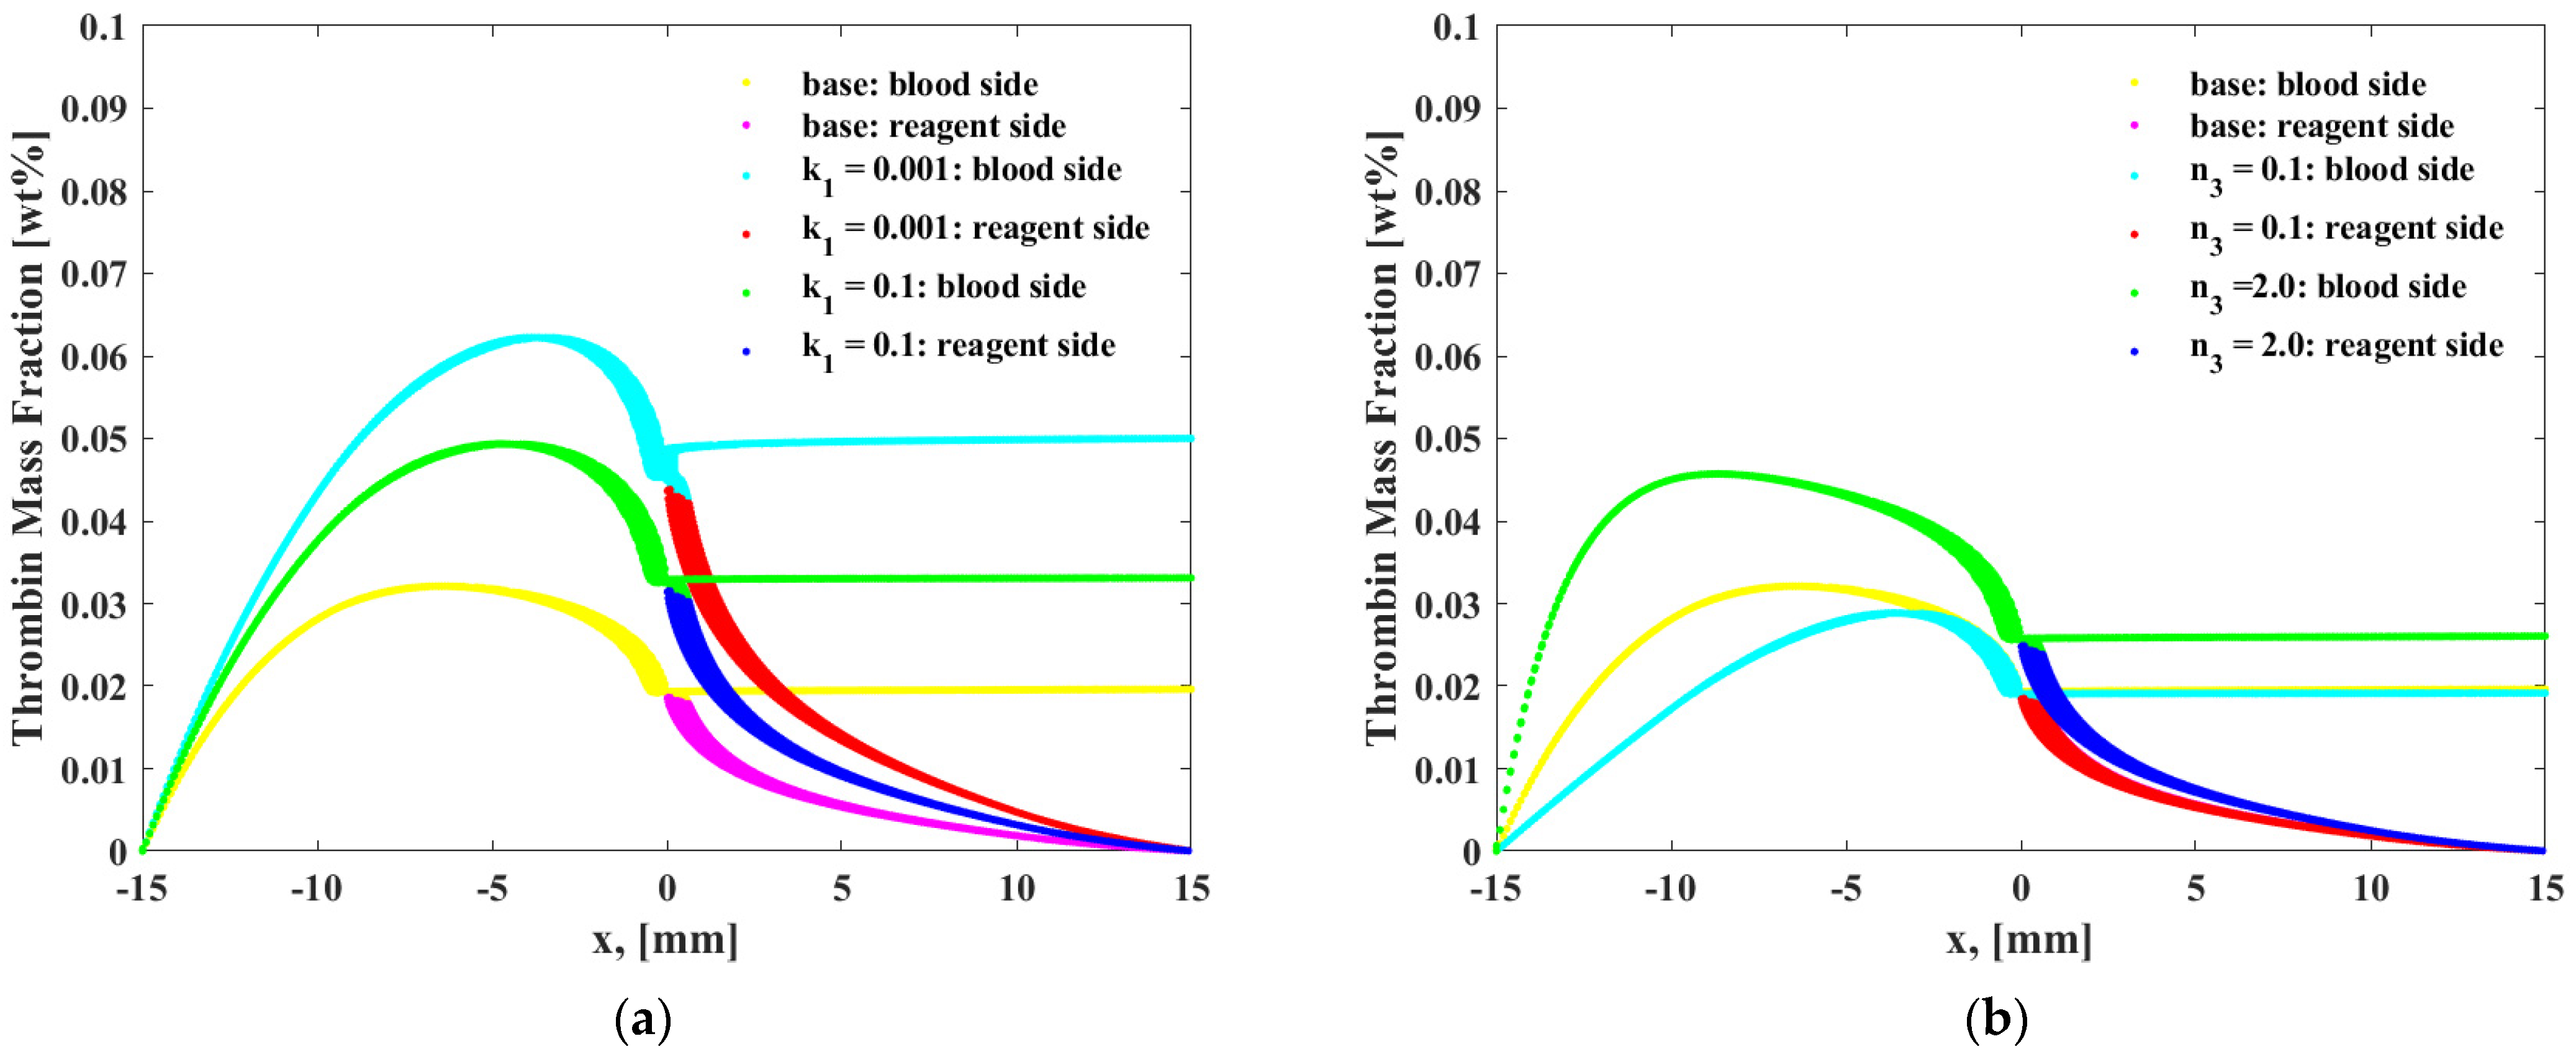
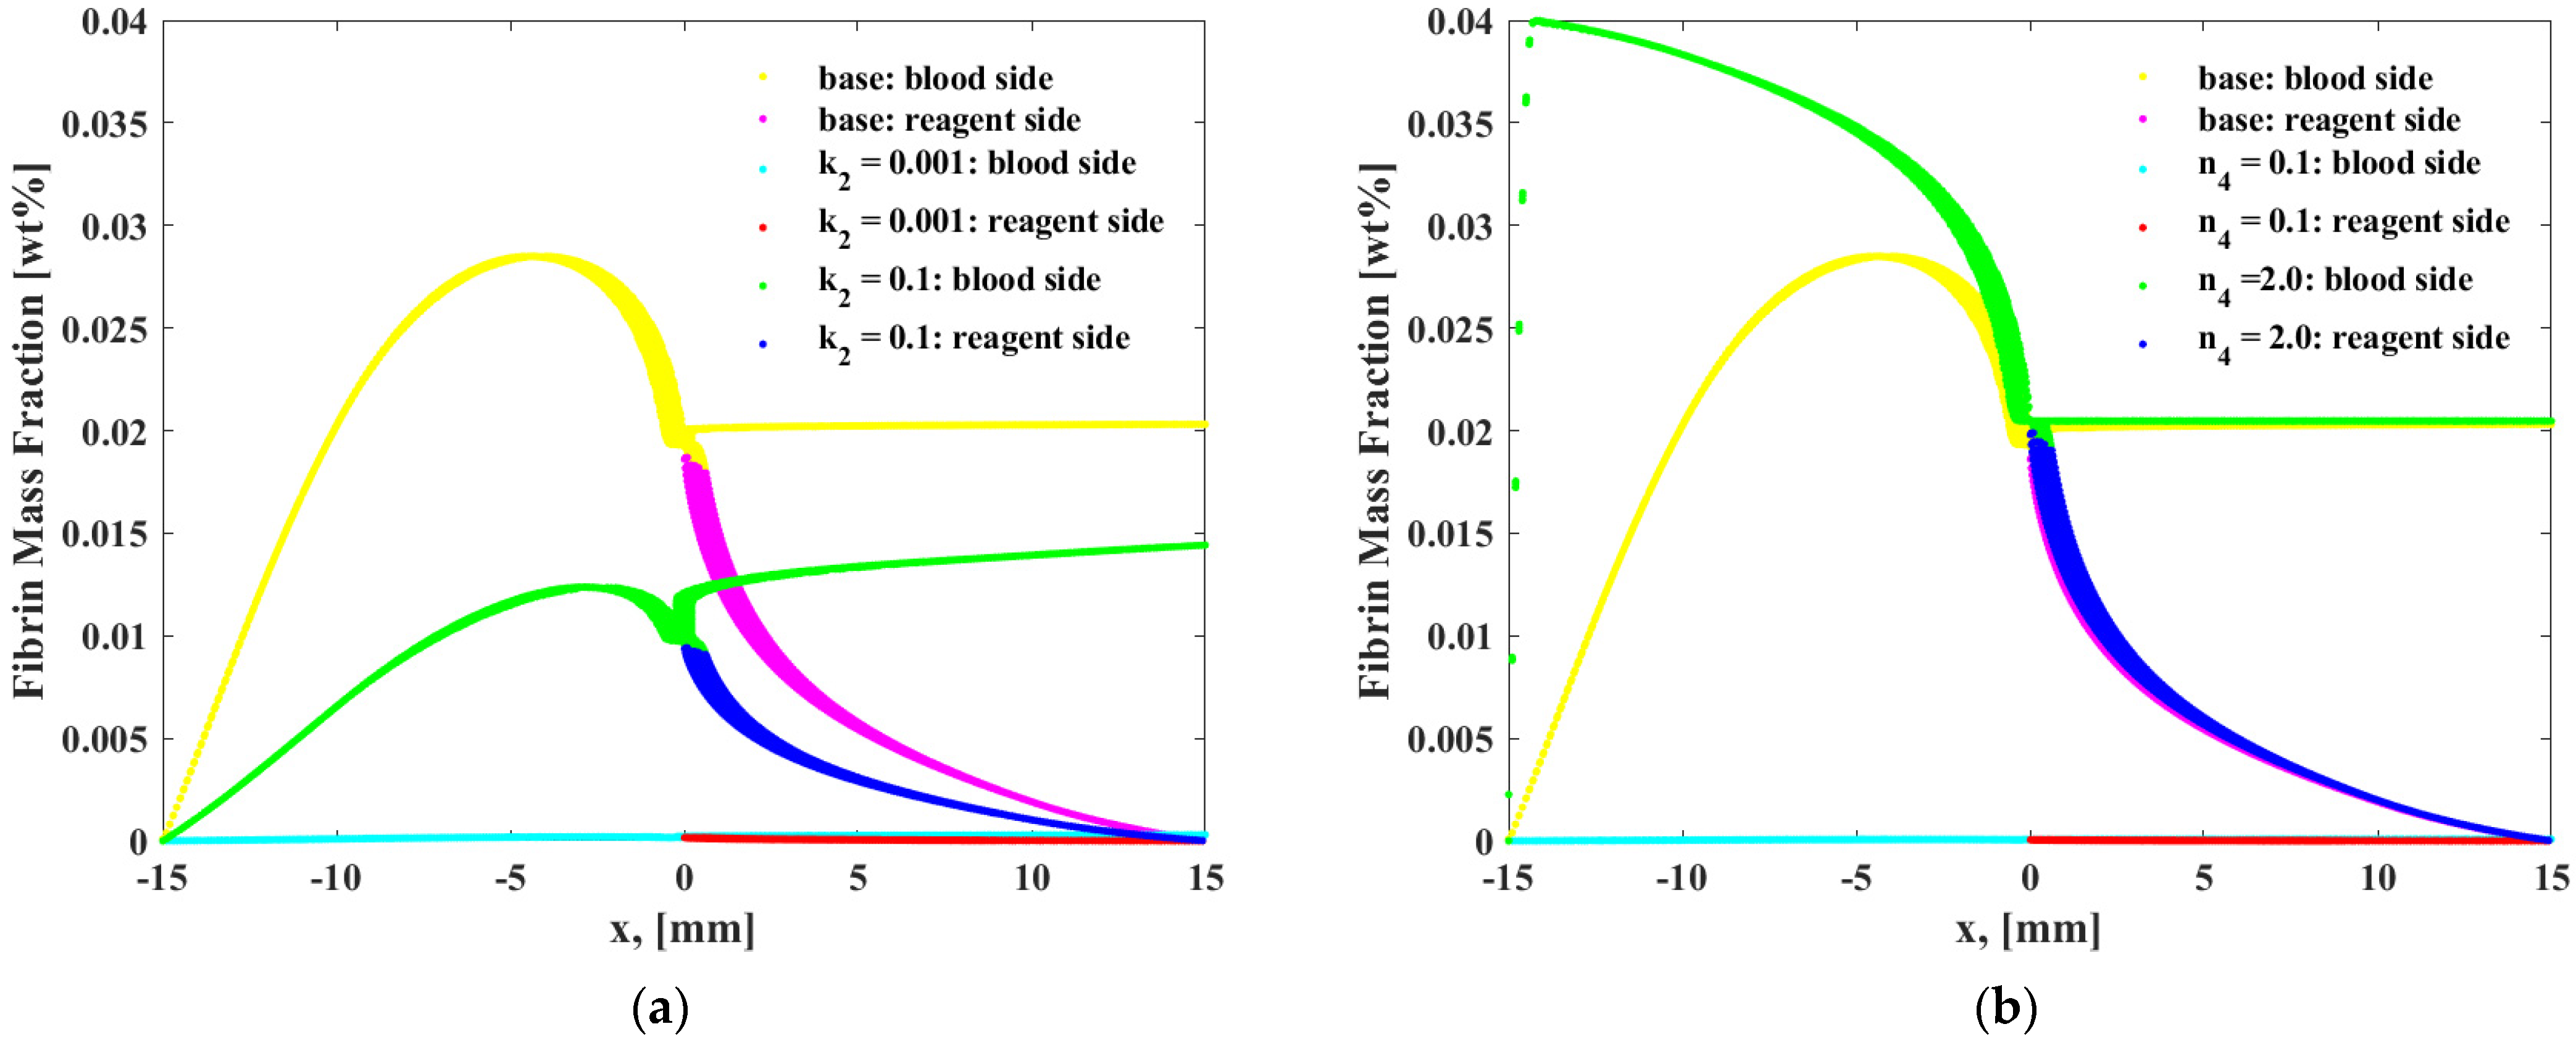
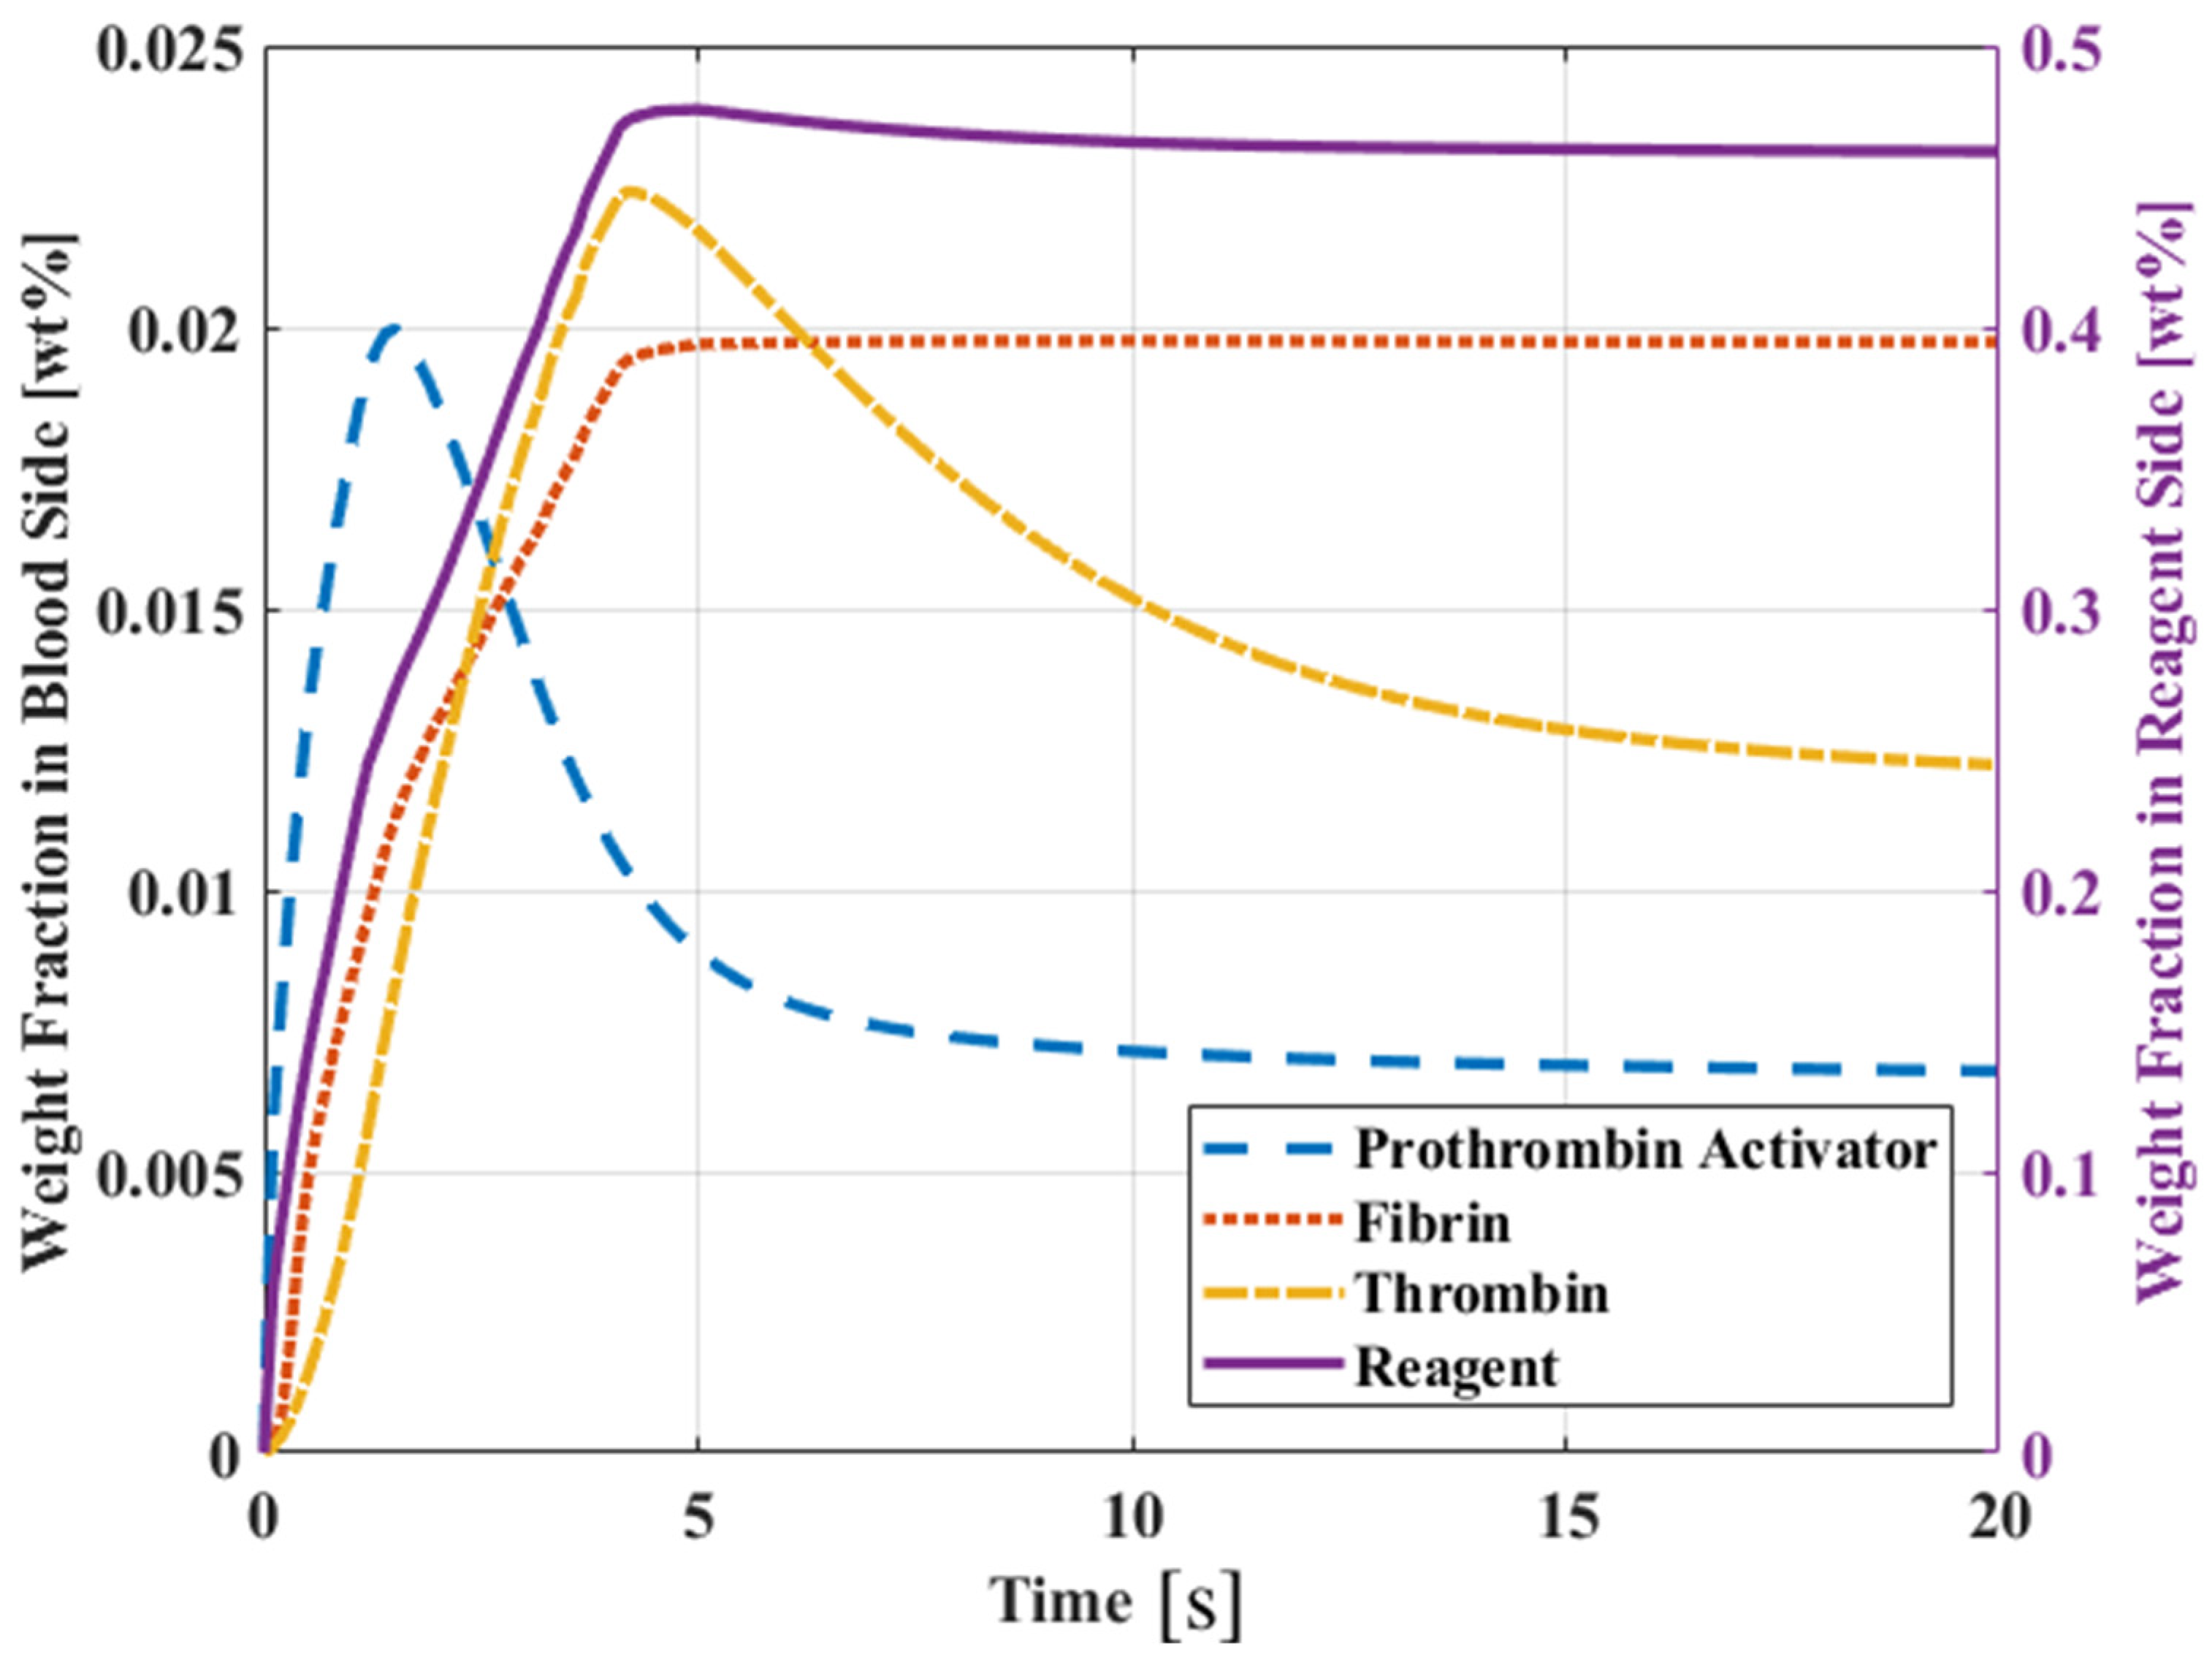
- Through simulation, it can be found that the chemical reaction of prothrombin in blood is a factor. When the reaction rate is k1, and reaction order n2, n3 increase, prothrombin will be quickly depleted, causing the drug to flow to the blood end, but too slow the time of PT is extended. The reaction rate and reaction order can be obtained more accurately by genetic algorithm. The chemical reaction rate constants indicate that the reaction rate of prothrombin activator is faster than thrombin, fibrin activator is faster than thrombin, and prothrombin activator is faster than fibrin.
- Predicted by simulation and experimental results, high blood concentration (>65%) is more accurate in predicting PT.
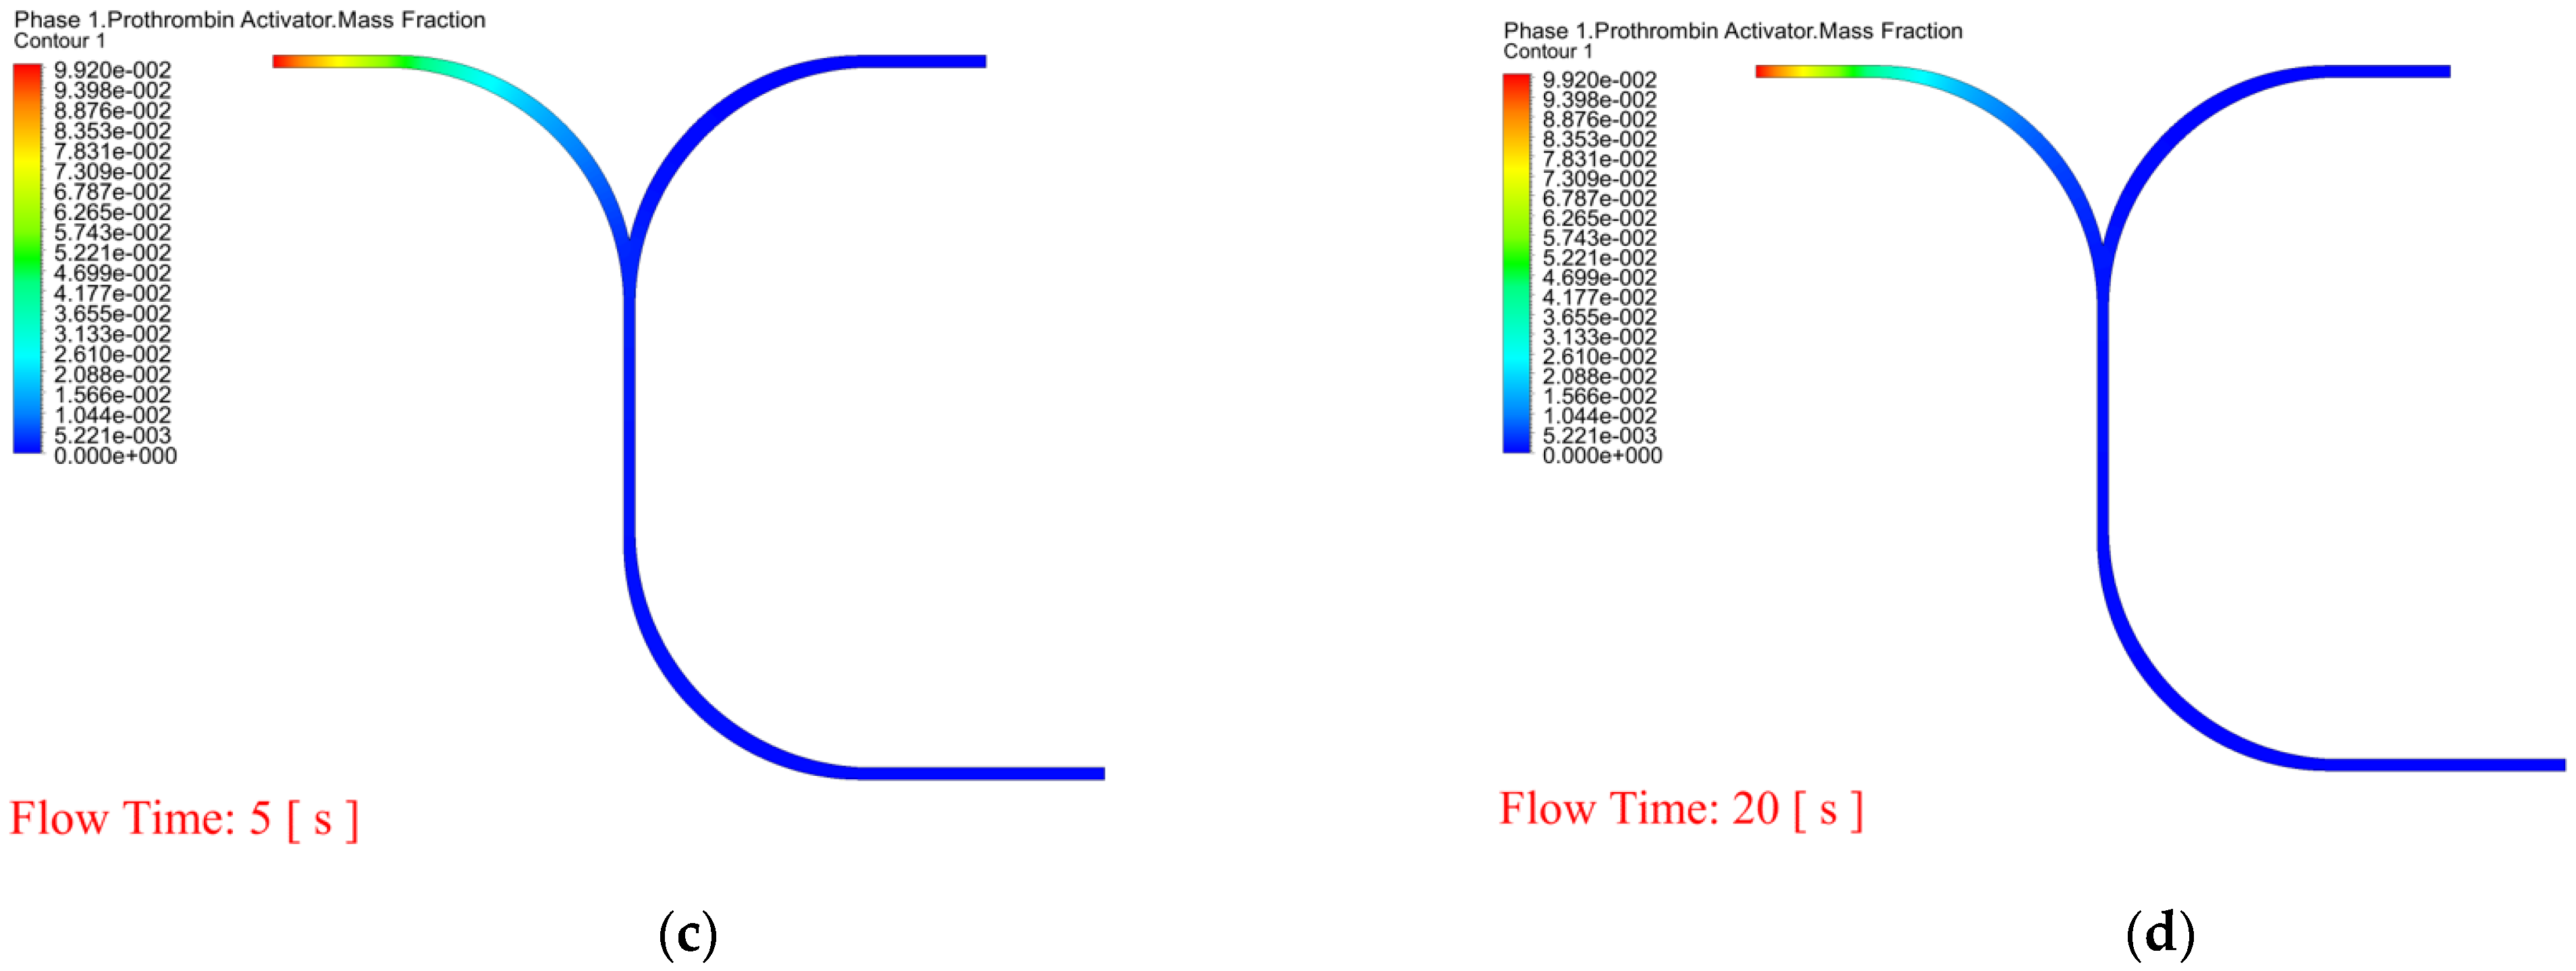
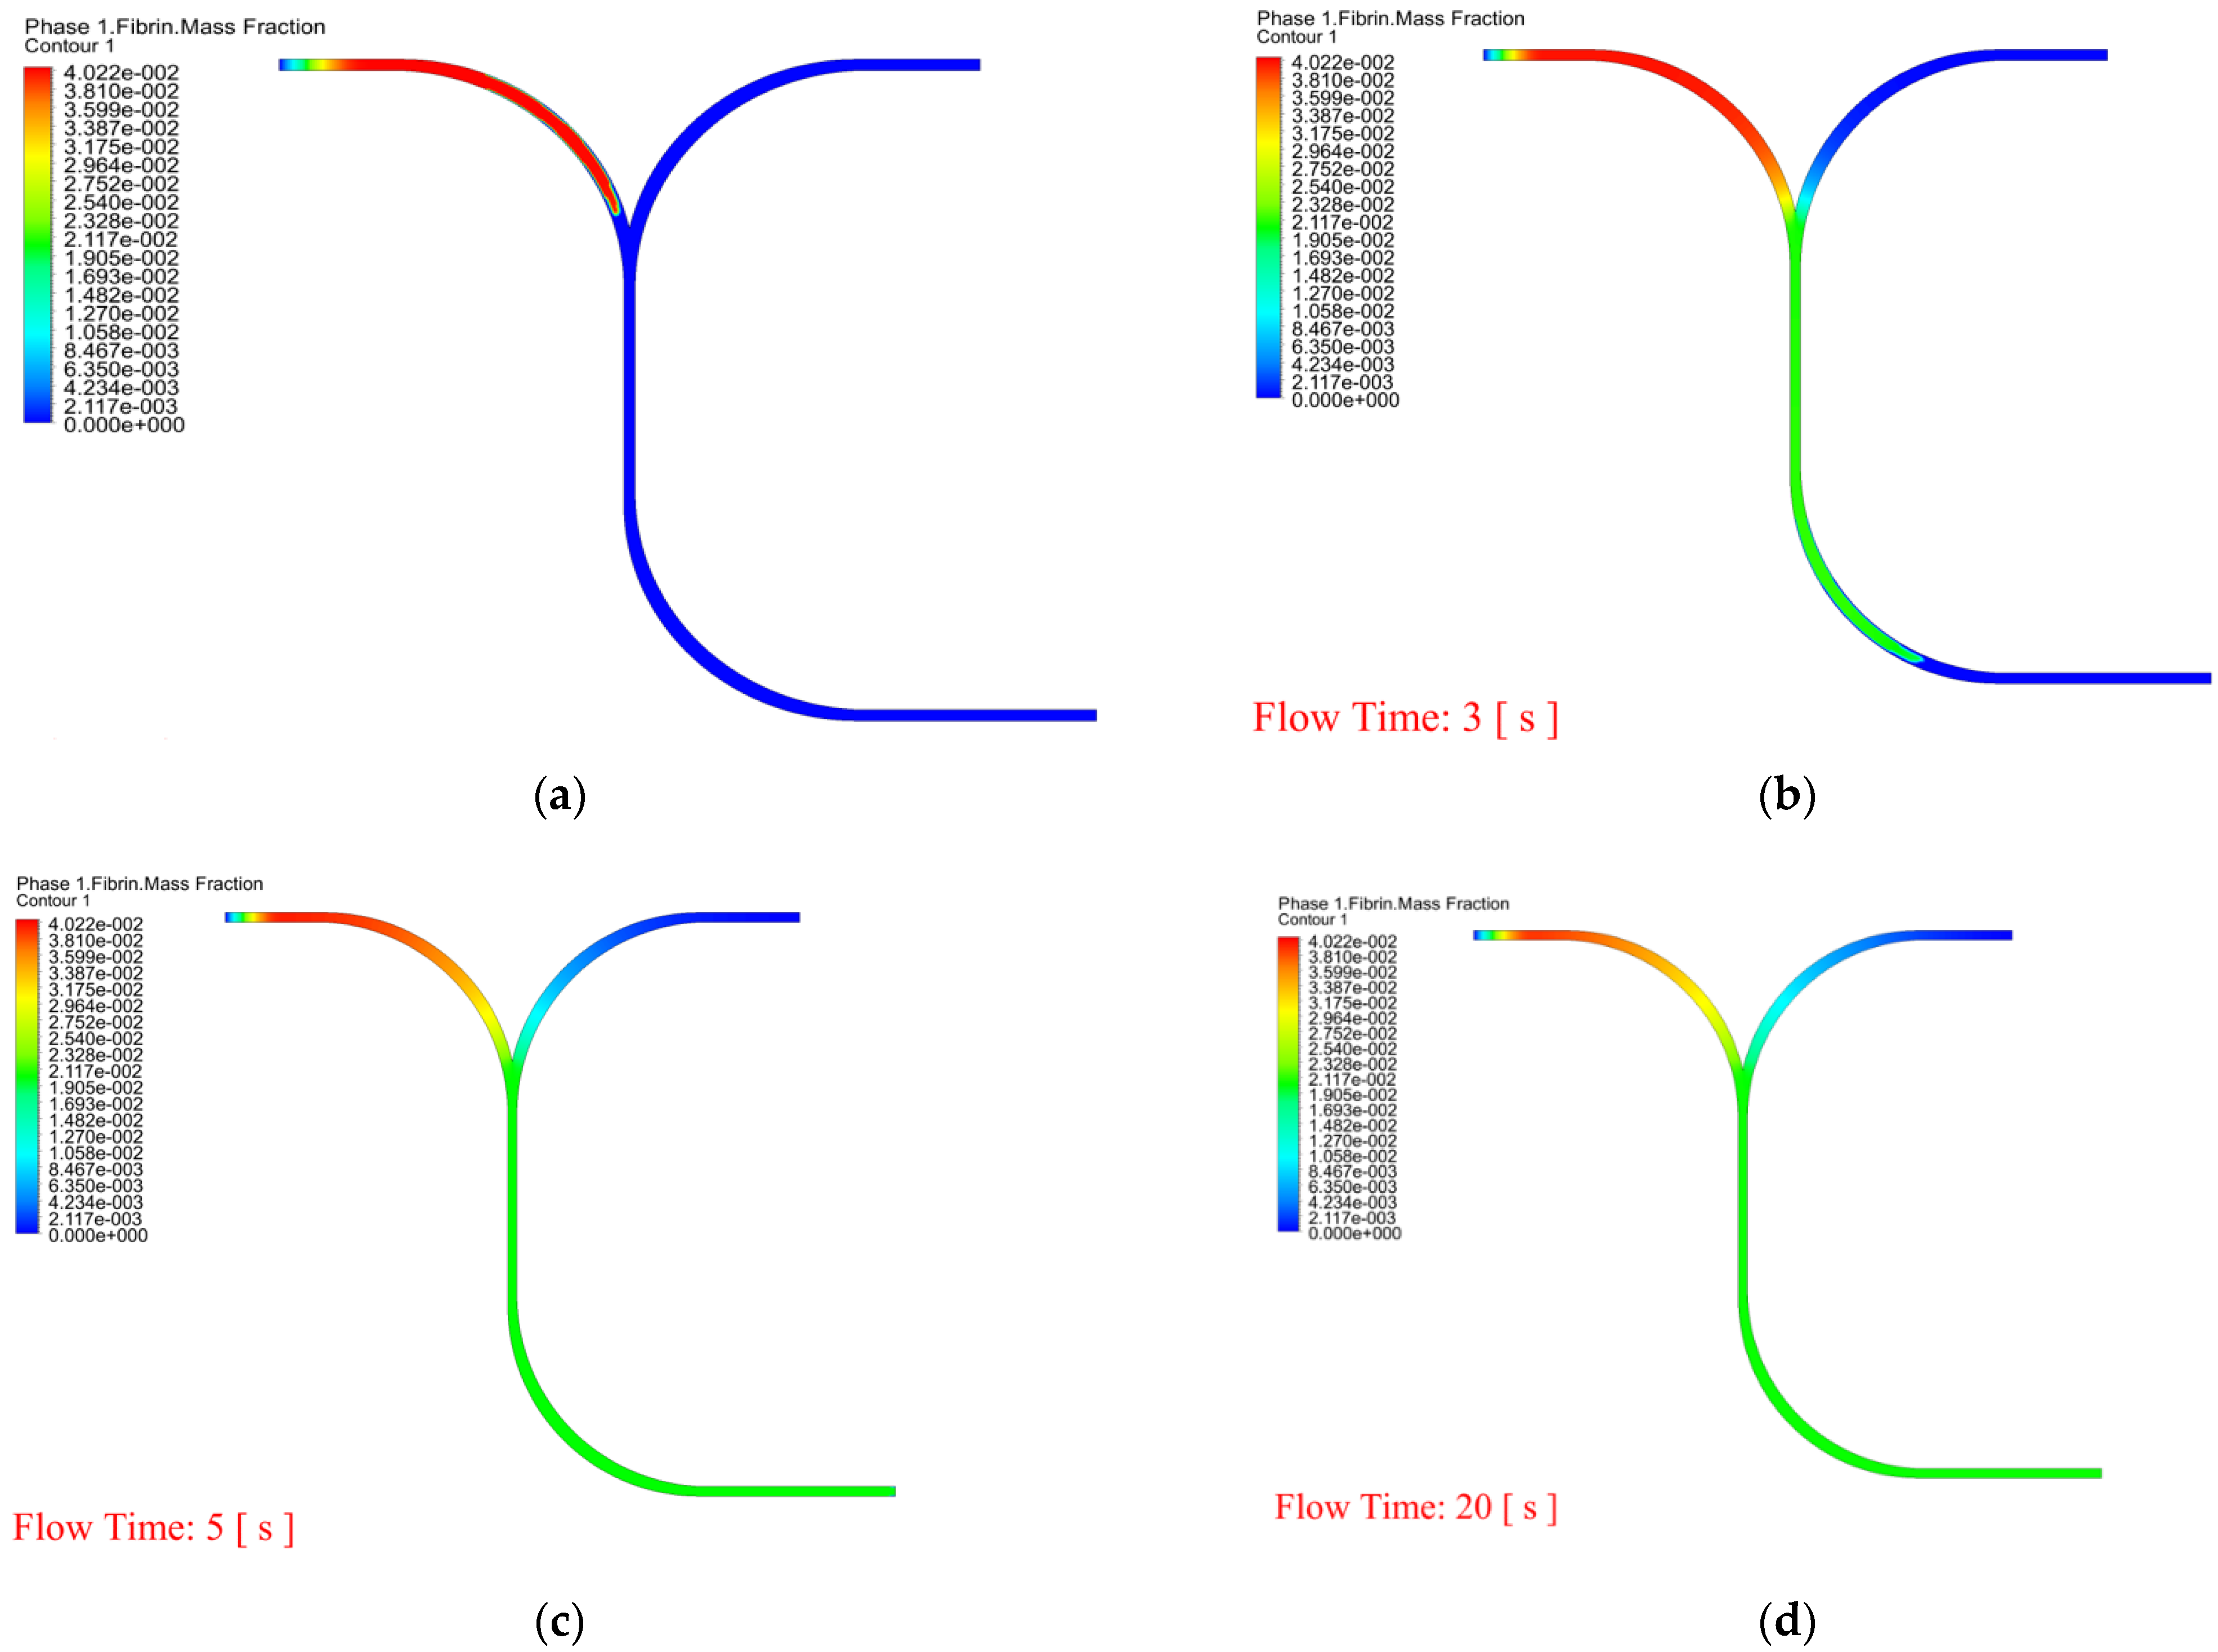
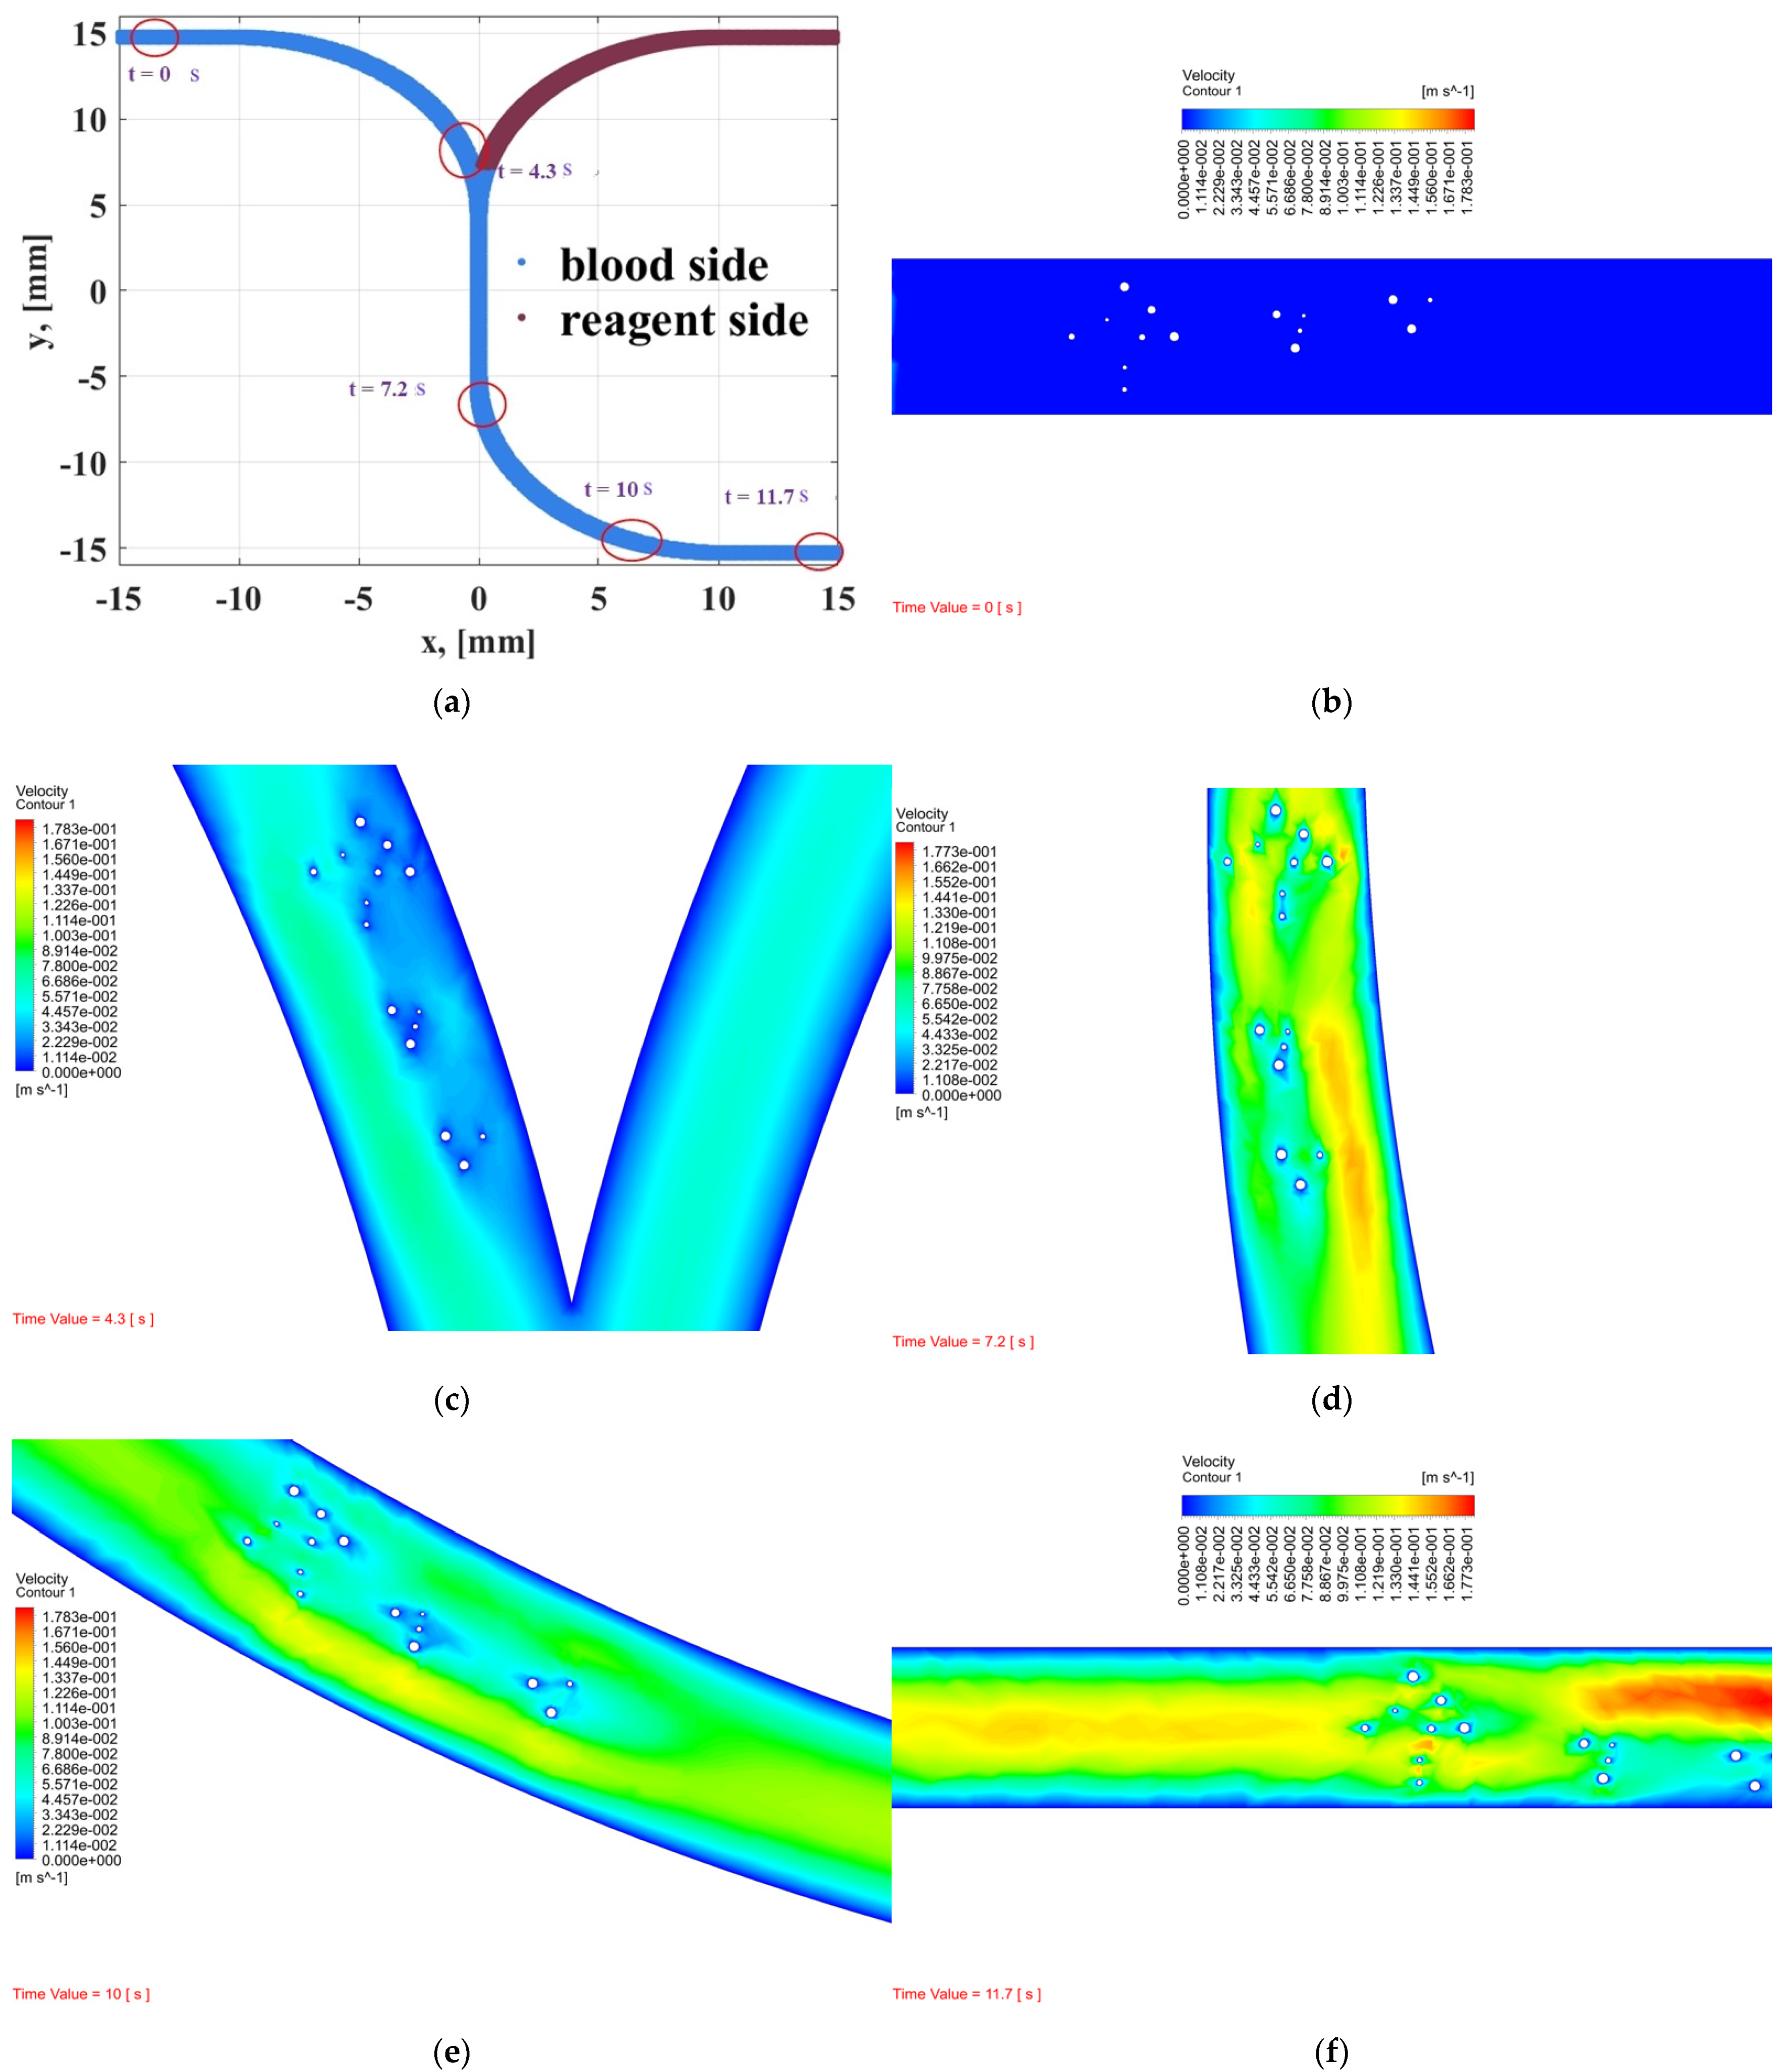
- In order to observe whether RBCs and WBCs are obstructed in the microchannel, the PT time cannot be accurately and effectively evaluated. Therefore, the dynamic mesh method can clearly determine the time for RBCs and WBCs to pass through the microchannel and can predict the dynamic behavior of blood and coagulants. The white blood cell flow time is 11.7 s and there are no obstructions.
Author Contributions
Funding
Institutional Review Board Statement
Informed Consent Statement
Data Availability Statement
Conflicts of Interest
Nomenclature
| Nomenclature | |
| V | velocity |
| mass from phase i to phase j | |
| X, Y | mass fraction |
| Mw | molecular weight |
| P | static pressure |
| J | diffusion flux |
| R | net rate of production by chemical reaction |
| Dj,m | diffusion coefficient for species j in the mixture |
| N | number of chemical species in the system |
| Nr | number of chemical species in reaction r |
| stoichiometric coefficient for reactant j in reaction r | |
| stoichiometric coefficient for product j in reaction r | |
| Mj | symbol denoting species j |
| forward rate constant for reaction r | |
| backward rate constant for reaction r | |
| molar concentration of each reactant and product species k in reaction r | |
| forward rate exponent for each reactant and product species k in reaction r | |
| backward rate exponent for each reactant and product species k in reaction r | |
| t | time |
| g | gravity acceleration |
| k1–k3 | chemical reaction rate |
| n1–n5 | chemical reaction order |
| weighting mass fraction | |
| objective function coefficient | |
| dA | average mass fraction |
| Greek letters | |
| α | volume fraction |
| β | interphase momentum exchange coefficient |
| μ | viscosity |
| τ | stress tensor |
| ρ | density |
| Subscripts | |
| i | phase, species |
| j, k, l | species |
| r | reaction |
References
- He, S.; Sharpless, N.E. Senescence in health and disease. Cell 2017, 169, 1000–1011. [Google Scholar] [CrossRef] [PubMed]
- Baumann, K. Cellular senescence: Senescence and reprogramming go hand-in-hand. Nat. Rev. Mol. Cell. Biol. 2016, 18, 4. [Google Scholar] [CrossRef] [PubMed]
- Anderson, E.L.; Howe, L.D.; Jones, H.E.; Higgins, J.P.; Lawlor, D.A.; Fraser, A. The prevalence of non-alcoholic fatty liver disease in children and adolescents: A systematic review and meta-analysis. PLoS ONE 2015, 10, e0140908. [Google Scholar] [CrossRef] [PubMed] [Green Version]
- Copplestone, J.A. 11 Bleeding and coagulation disorders in the elderly. Bailliere’s Clin. Haematol. 1987, 1, 559–580. [Google Scholar] [CrossRef]
- Saeed, A.; Alsubie, A.; Kumam, P.; Nasir, S.; Gul, T.; Kumam, W. Blood based hybrid nanofluid flow together with electromagnetic field and couple stresses. Sci. Rep. 2021, 11, 12865. [Google Scholar] [CrossRef]
- Saeed, A.; Khan, N.; Gul, T.; Kumam, W.; Alghamdi, W.; Kumam, P. The flow of blood-based hybrid nanofluids with couple stresses by the convergent and divergent channel for the applications of drug delivery. Molecules 2021, 26, 6330. [Google Scholar] [CrossRef]
- Alghamdi, W.; Alsubie, A.; Kumam, P.; Saeed, A.; Gul, T. MHD hybrid nanofluid flow comprising the medication through a blood artery. Sci. Rep. 2021, 11, 11621. [Google Scholar] [CrossRef]
- Korvink, J.; Paul, O. MEMS: A Practical Guide of Design, Analysis, and Applications; World Scientific: Singapore, 2010; p. 905. [Google Scholar]
- Bertsch, A.; Heimgartner, S.; Cousseau, P.; Renaud, R. Static micro-mixers based on large-scale industrial mixer geometry. Lab. Chip. 2001, 1, 56–60. [Google Scholar] [CrossRef]
- Hossian, S.; Ansari, M.A.; Kim, K.Y. Evaluation of the mixing performance of three passive micromixers. Chem. Eng. J. 2009, 150, 492–501. [Google Scholar] [CrossRef]
- Kuo, J.N.; Liao, H.S.; Li, X.M. Design optimization of capillary-driven micromixer with square-wave microchannel for blood plasma mixing. Microsyst. Technol. 2007, 23, 721–730. [Google Scholar] [CrossRef]
- Wong, S.; Ward, M.; Wharton, C. Micro T-mixer as a rapid mixing micromixer. Sens. Actuators B Chem. 2004, 100, 359–379. [Google Scholar] [CrossRef]
- Ahmed, A.M.; Normah, M.G.; Robiah, A. Optimization of an ammonia-cooled rectangular microchannel heat sink using multi-objective non-dominated sorting genetic algorithm (NSGA2). J. Heat Mass Transf. 2012, 48, 1723–1733. [Google Scholar] [CrossRef]
- Palta, S.; Saroa, R.; Palta, A. Overview of the coagulation system. Indian J. Anaesth. 2014, 58, 515–523. [Google Scholar] [CrossRef] [PubMed]
- MacFarlane, R.G. An enzyme cascade in the blood clotting mechanism, and its function as a biochemical amplifier. Nature 1954, 202, 498–499. [Google Scholar] [CrossRef] [PubMed]
- Seegers, W.H. Blood clotting mechanisms: Three basic reactions. Ann. Rev. Physiol. 1969, 31, 269–294. [Google Scholar] [CrossRef]
- Madana, V.S.; Basheer, A.A. Computational investigation of flow field, mixing and reaction in a T-shaped microchannel. Chem. Eng. Commun. 2021, 208, 903–913. [Google Scholar] [CrossRef]
- ANSYS. ANSYS Fluent Theory Guide; ANSYS Inc.: Canonsburg, PA, USA, 2019. [Google Scholar]
- Foli, K.; Okabe, T.; Olhofer, M.; Jin, Y.; Sendhoff, B. Optimization of micro heat exchanger: CFD, analytical results and multiobjective evolutionary algorithms. Int. J. Heat Mass Transf. 2006, 49, 1090–1099. [Google Scholar] [CrossRef]
- Amanifard, N.; Narima, N.-Z.; Borji, M.; Khalkhali, A.; Habidoust, A. Modeling and pareto optimization of heat transfer and flow coefficients in microchannel using GMDH types of neural networks and genetic algorithm. Energy Convers. Manag. 2008, 49, 311–325. [Google Scholar] [CrossRef]
- Khan, W.A.; Kadri, M.B.; Ali, Q. Optimization of microchannel heat sinks using genetic algorithm. Heat Transf. Eng. 2013, 34, 279–287. [Google Scholar] [CrossRef]
- Jafari, A.; Mousavi, S.M.; Kolari, P. Numerical investigation of blood flow. Part I: In microvessel bifurcations, Commun. Nonlinear Sci. Numer. Simul. 2008, 13, 1615–1626. [Google Scholar] [CrossRef]
- Jafari, A.; Zamankhan, P.; Mousavi, S.M.; Kolari, P. Numerical investigation of blood flow. Part II: In capillaries. Commun. Nonlinear Sci. Numer. Simul. 2009, 14, 1396–1402. [Google Scholar] [CrossRef]
- Ni, A.; Cheema, T.A.; Park, C.W. Numerical study of RBC motion and deformation through microcapillary in alcohol plasma solution. Open J. Fluid Dyn. 2015, 5, 26–33. [Google Scholar] [CrossRef] [Green Version]
- Houdijk, W.P.M.; van den Besselaar, A.M.H.P. International multicenter international sensitivity index (ISI) calibration of a new human tissue factor thromboplastin reagent derived from cultured human cells. J. Thromb. Haemost. 2004, 2, 266–270. [Google Scholar] [CrossRef] [Green Version]
- Matsuda, T.; Murakami, M. Relationship between fibrinogen and blood viscosity. Thromb. Res. 1976, 8, 25–33. [Google Scholar] [CrossRef]
- Fogel, D. Evolutionary Computation: Toward a New Philosophy of Machine Intelligence, 3rd ed.; IEEE Press: Piscataway, NJ, USA, 2006. [Google Scholar]
- Yang, C.L.; Huang, S.J.; Chou, C.W.; Chiou, Y.C.; Lin, K.P.; Tsai, M.S.; Young, K.C. Design and evaluation of a portable optical-based biosensor for testing whole blood prothrombin time. Talanta 2013, 116, 704–711. [Google Scholar] [CrossRef]
- Yang, C.L.; Chiou, Y.C.; Chou, C.W.; Young, K.C.; Huang, S.J.; Liu, C.Y. Point-of-care testing of portable blood coagulation detectors using optical sensors. J. Med. Biol. Eng. 2013, 33, 319–324. [Google Scholar] [CrossRef]
- Balendran, C.A.; Henderson, N.; Olsson, M.; Lövgren, A.; Hansson, K.M. Preclinical evaluation of point-of-care prothrombin time as a biomarker test to guide prothrombin replacement therapy in coagulopathic bleeding. Res. Pract. Thromb. Haemost. 2017, 1, 252–258. [Google Scholar] [CrossRef] [Green Version]


| Blood Volume (%) | Mean POC PT (Min, Max) (s) | Mean Lab PT (Min, Max) (s) | Simulated PT (s) |
|---|---|---|---|
| 100 | 12.0 (11.5, 13.0) | 11.7 (10.7, 13.4) | 12.3 |
| 75 | 14.6 (13.6, 15.9) | 13.3 (12.7, 14.6) | 14.5 |
| 65 | 16.2 (15.1, 17.4) | 14.7 (13.8, 15.4) | 15.5 |
| 55 | 20.1 (17.8, 24.3) | 16.1 (14.3, 17.3) | 21.0 |
| 40 | 41.8 (35.6, 60.6) | 21.8 (17.7, 23.4) | 21.0 |
Publisher’s Note: MDPI stays neutral with regard to jurisdictional claims in published maps and institutional affiliations. |
© 2021 by the authors. Licensee MDPI, Basel, Switzerland. This article is an open access article distributed under the terms and conditions of the Creative Commons Attribution (CC BY) license (https://creativecommons.org/licenses/by/4.0/).
Share and Cite
Immanuel, P.N.; Chiu, Y.-H.; Huang, S.-J. Microfluidic Simulation and Optimization of Blood Coagulation Factors and Anticoagulants in Polymethyl Methacrylate Microchannels. Coatings 2021, 11, 1394. https://doi.org/10.3390/coatings11111394
Immanuel PN, Chiu Y-H, Huang S-J. Microfluidic Simulation and Optimization of Blood Coagulation Factors and Anticoagulants in Polymethyl Methacrylate Microchannels. Coatings. 2021; 11(11):1394. https://doi.org/10.3390/coatings11111394
Chicago/Turabian StyleImmanuel, Philip Nathaniel, Yi-Hsiung Chiu, and Song-Jeng Huang. 2021. "Microfluidic Simulation and Optimization of Blood Coagulation Factors and Anticoagulants in Polymethyl Methacrylate Microchannels" Coatings 11, no. 11: 1394. https://doi.org/10.3390/coatings11111394
APA StyleImmanuel, P. N., Chiu, Y.-H., & Huang, S.-J. (2021). Microfluidic Simulation and Optimization of Blood Coagulation Factors and Anticoagulants in Polymethyl Methacrylate Microchannels. Coatings, 11(11), 1394. https://doi.org/10.3390/coatings11111394