Article

Use of Digital Image Correlation Method to Measure Bio-Tissue Deformation

1
Department of Mechanical Engineering, National Cheng Kung University, Tainan 70101, Taiwan
2
Graduate Institute of Precision Engineering, National Chung Hsing University, Taichung 40749, Taiwan
3
Center for Advanced Science Technology, National Chung Hsing University, Taichung 40749, Taiwan
*
Author to whom correspondence should be addressed.
Coatings 2021, 11(8), 924; https://doi.org/10.3390/coatings11080924
Submission received: 8 July 2021 / Revised: 26 July 2021 / Accepted: 28 July 2021 / Published: 1 August 2021

Abstract

:
Traditionally, strain gauge, extensometer, and reflection tracking markers have been used to measure the deformation of materials under loading. However, the anisotropy and inhomogeneity of most biological materials restricted the accessibility of the real strain field. Compared to the video extensometer, digital image correlation has the advantage of providing full-field displacement as well as strain information. In this study, a digital image correlation method (DIC) measurement system was employed for chicken breast bio-tissue deformation measurement. To increase the contrast for better correlation, a mixture of ground black pepper and white sesame was sprayed on the surface of samples. The first step was to correct the distorted image caused by the lens using the inverse distorted calibration method and then the influence of subset size and correlation criteria, sum of squared differences (SSD), and zero-normalized sum of squared differences (ZNSSD) were investigated experimentally for accurate measurement. Test results of the sample was translated along the horizontal direction from 0 mm to 3 mm, with an increment of 0.1 mm and the measurement result was compared, and the displacement set on the translation stage. The result shows that the error is less than 3%, and accurate measurement can be achieved with proper surface preparation, subset size, correlation criterion, and image correction. Detailed examination of the strain values show that the strain εx is proportional to the displacement of crosshead, but the strain εy indicates the viscoelastic behavior of tested bio-tissue. In addition, the tested bio-tissue’s linear birefringence extracted by a Mueller matrix polarimetry is for comparison and is in good agreement. As noted above, the integration of the optical parameter measurement system and the digital image correlation method is proposed in this paper to analyze the relationship between the strain changes and optical parameters of biological tissue, and thus the relative optic-stress coefficient can be significantly characterized if Young’s modulus of biological tissue is known.

1. Introduction

Generally, the deformation of materials under loading is often measured by strain gauges and extensometers when their mechanical properties are approached. In most cases, conventional methods can be used to measure the strain of a single point or the average strain of a region. On the other hand, biological tissues, which are often inhomogeneous and anisotropic, are different from conventional materials in terms of size and strength. Consequently, the actual deformation of biological tissues cannot be observed using conventional methods. In contrast, the digital image correlation (DIC) is a non-contact full-field deformation measurement approach, and complete data about deformation can be obtained through the analysis of digital image records.
In biomechanical testing, the application of digital technologies that allow computerization of the analysis and acquisition is imperative, especially for specimens with complex geometries and anisotropic or non-homogeneous materials. Simultaneously, an optical measurement technique must be precise and accurate. Deformable materials such as biological tissues are unsuitable for optical measurement techniques too exact to small displacements such as speckle interferometry or holographic interferometry [1]. In the case of using a Moiré interferometer, which requires the specimen to be a regular pattern on the surface [1,2]. It is very difficult for measuring biological samples with irregular geometries. Overall, using the techniques recommended above has limited applicability to practical use because of their complexity. To overcome most of the discussed limitations [1], we recommend digital image correlation (DIC) as a promising optical technique for the field of biomechanics [3].
Sutton et al. (1983) used a bilinear interpolation algorithm to transform originally discrete digital images into continuous and smooth ones, and grayscale information progressed from an integer number of pixels a non-integer number [4]. Later, Sutton et al. (1986) proposed to obtain an optimal deformation parameter vector with the Newton-Raphson method. The method facilitates reducing much time spent on computation without impairing its precision. That is one of the reasons why it has been used up until now [5]. In 1988, Sutton et al. discussed the error of the DIC method via a function of light intensity, putting forward three important factors: (1) The higher the bit resolution of digital images, the better the resolution will be, which indicates that grayscale values have better accuracy if they have a more detailed division; (2) The higher the sampling frequency is, the closer to the reality the information that a computer retrieves will be; (3) The bicubic spline interpolation has better accuracy than the bilinear interpolation when image reconstruction is employed for analysis [6]. In this respect, Tong (2005) compared the differences of DIC measurement in stability, accuracy, and computation speed caused by different correlation criteria, finding that zero-normalized sum of squared differences (ZNSSD) is better than sum of squared differences (SSD) and normalized sum of squared differences (NSSD) in terms of stability and accuracy, while SSD is faster than ZNSSD and (NSSD) in the computation speed [7]. Pan et al. (2009) proposed that the displacement field results calculated by DIC should be used to fit a plane with the iterative least squares method, and the strain field be obtained by differentiating the plane [8]. Subsequently, Pan et al. (2013) proposed to use the rigid body translation results and the least squares method to calculate the image distortion parameters, which were employed for correction subsequently [9].
Gao et al. (2010) adopted the DIC to measure the deformation behavior of soft tissues under autogenous gravity; the minimum strain rate arrived at 1.9%, and the maximum reached 9% [10]. Luyckx et al. (2014) analyzed the mechanical behavior of human tendon tissues with 3D-digital image correlation (3D-DIC), and the correlation coefficient between the results obtained via DIC and linear variable differential transformer (LVDT) was as high as 0.99 [11,12,13,14]. Rizzuto et al. (2014) characterized a DIC system for small biological specimens based on a high-speed camera, a stereomicroscope, and an original image correlation algorithm. For all the tested strain values, results showed a relative error lower than 1.3% between computed strains and control ones [15]. Chuda-Kowalska et al. (2015) determined mechanical characterization of orthotropic elastic parameters of a foam by combining the DIC strain measurement technique, non-traditional experimental setup, numerical modeling, and inverse analysis [16].
Since biological muscle tissue is a viscoelastic material, it is not easy to measure the stress of muscle tissue. In the past, many studies have used optical technology to measure the characteristics of biological muscle tissue [17,18,19,20,21], using optical measurement to measure abnormal stress of muscle tissue, and diagnosed some diseases. In the past, the anisotropic parameters, e.g., linear birefringence (LB), circular birefringence (CB), circular dichroism (CD), linear dichroism (LD), and depolarization (Dep), were used to measure the stress of chicken breast tissue [21] based upon the linear birefringence decoupled from the Mueller matrix of a tested sample. Chen et al. (2012) studied the optical properties of chicken breast under tensile loading with polarization sensitive optical coherence tomography (PS-OCT) technology, finding that the birefringence went up along with the increase of tensile loading [22].
There have been studies on stress-optic coefficients and strain-optic coefficients on optical fibers [23,24]. The changes in phase difference and axial stress of optical fibers are easy to determine, but the optical parameters of biological tissues are more difficult to measure than optical fibers. Research on the optical and mechanical parameters of biological tissues is rarely mentioned. Many studies show that digital image correlation (DIC) is an optical technique for contactless displacement and strain measurement and it can be applied to biological tissues. As noted above, we combine the optical parameter measurement system and the digital image correlation method developed in this paper to analyze the relationship between the strain changes and optical parameters of biological tissues.
The present study mainly aims to use a CCD camera and the DIC method to measure the surface displacement of the test specimen, applying the self-developed DIC technology to achieve non-contact full-field strain measurement in bio-tissue tensile testing, which is difficult for conventional sensors to measure accurately and quantitatively. Also, linear birefringence extracted by the Mueller matrix polarimetry is applied for comparisons.

2. Materials and Methods

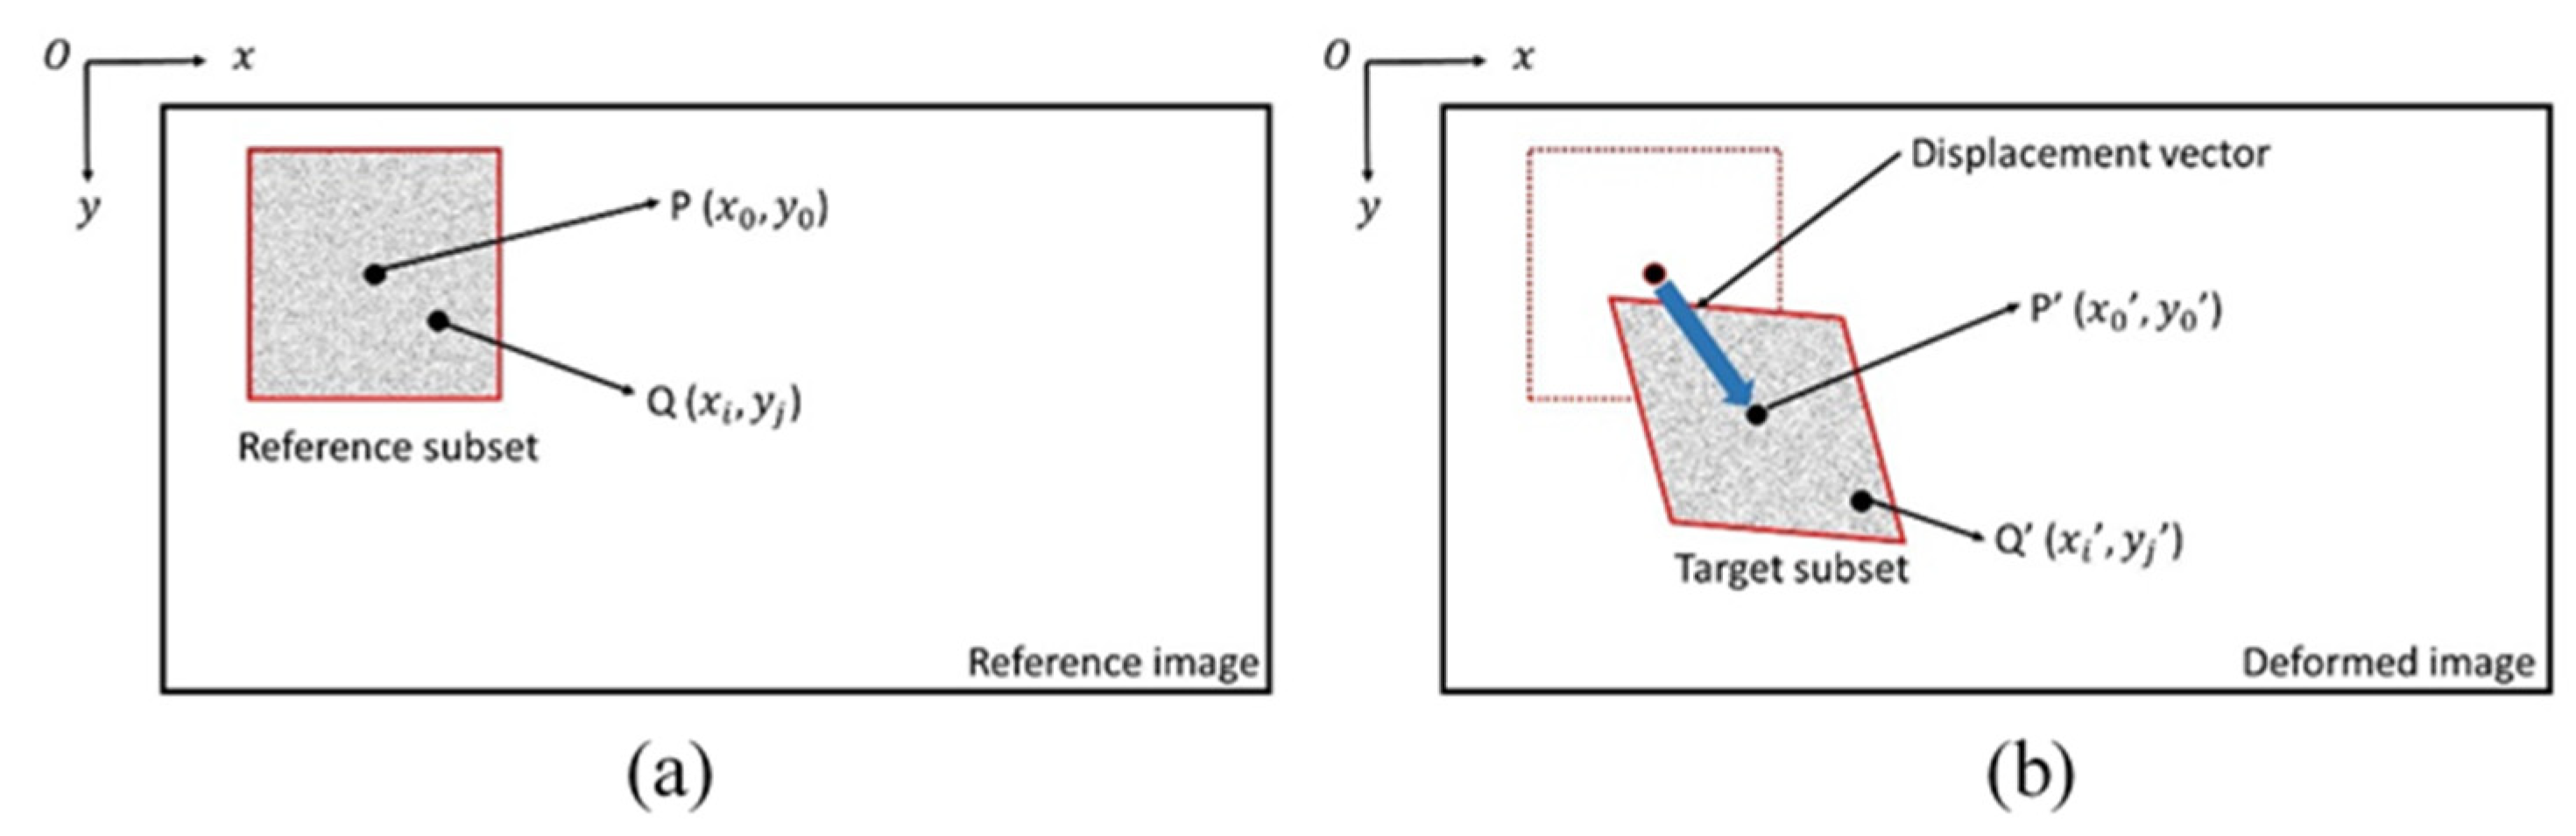
2.1. Deformation and Displacement

An object under loading deforms. It is assumed that spot markers on the surface of the object before and after deformation remain unchanged. Therefore, the comparison of digital images before and after deformation facilitates analyzing the relative positions of spot markers on the surface of the object. This way, the amount of deformation that an object undergoes can be calculated.
Suppose P ( x 0 , y 0 ) is the central point of a subset on the surface of an object, and Q ( x i , y i ) is a random point in the subset before deformation; ( x i , y i ) is its coordinates after deformation, which can be calculated via Equations (1) and (2). The relative positions of a point before and after deformation are clearly shown in Figure 1.
x i = x i + u ( x i , y i )
y i = y i + v ( x i , y i )
wherein u ( x i , y i ) is the displacement of the deformed object parallel to the x-axis, while v ( x i , y i ) is the displacement of the parallel y-axis.
The central point ( x 0 , y 0 ) experiences Taylor series expansion with Equations (1) and (2), after which Equations (3) and (4) can be obtained as below:
x i = x i + u 0 + u x d x + u y d y + 1 2 2 u x 2 ( d x ) 2 + 1 2 2 u y 2 ( d y ) 2
y i = y i + v 0 + v x d x + v y d y + 1 2 2 v x 2 ( d x ) 2 + 1 2 2 v y 2 ( d y ) 2
wherein d x = x i x 0 , which means the horizontal distance between x i and x 0 , and d y = y i y 0 , i.e., the vertical distance between y i and y 0 .
In the analysis and computation, if the selected subset is minimal, d x and d y tend to zero, so higher-order terms above the second order of Taylor series expansion can be ignored and Equations (3) and (4) can be simplified. This way, Equations (5) and (6) are obtained.
x i = x i + u 0 + u x d x + u y d y
y i = y i + v 0 + v x d x + v y d y
Six parameters to be solved ( u 0 , v 0 , u / x , u / y , v / x , v / y ) are obtained from Equations (5) and (6), of which ( u 0 , v 0 ) are displacement parameters, ( u / x = u x ) , ( u / y = u y ) , ( v / x = v x ) , and ( v / y = v y ) are displacement gradient parameters. These six parameters are what the DIC method aims to analyze, from which the DIC method can obtain the displacement and deformation of an object.

2.2. Digital Image Correlation Method

The DIC method keeps image data in a digital form. The grayscale function f ( x , y ) contains information such as the brightness and spatial coordinates of the pixel. This function can be regarded as a matrix, whose row and column values determine the horizontal and vertical coordinates of a point in the image, and the corresponding matrix element represents the gray value of the point. This point can be called pixels, a picture element or image element. A certain subset on an undeformed object corresponds to another subset on the deformed one, and the spot pattern changes with the deformation. If the spot patterns in the subset before and after deformation are consistent, the parameter vector of the object P ˜ can be obtained. The selected subset is small in size, so it is assumed that the parameters P ˜ = ( u 0 , v 0 , u x , u y , v x , v y ) are constants in this small subset.
Assuming that f ( x i , y i ) is the grayscale value of the coordinate for a point ( x i , y i ) before deformation, g ( x i , y i ) is the grayscale value of the corresponding point ( x i , y i ) after deformation. Whether the spot patterns before and after deformation are consistent is determined by the principle that the grayscale value of a point before and after deformation remains unchanged, i.e., f ( x i , y i ) = g ( x i , y i ) . Moreover, the correlation between the images before and after deformation is judged via their coefficient, which is obtained by substituting the grayscale value before deformation into the correlation criterion. Two correlation criteria are listed below [7,26]:
(1) Sum of Squared Differences (SSD)
C s s d ( P ˜ ) = i = M M j = M M [ f ( x i , y i ) g ( x i , y i ) ] 2
(2) Zero-Normalized Sum of Squared Differences (ZNSSD)
C Z N s s d ( P ˜ ) = i = M M j = M M [ f ( x i , y i ) f m Δ f g ( x i , y i ) g m Δ g ] 2
f m = 1 ( 2 M + 1 ) 2 i = M M j = M M f ( x i , y i )
g m = 1 ( 2 M + 1 ) 2 i = M M j = M M g ( x i , y i )
Δ f = i = M M j = M M [ f ( x i , y i ) 2 f m ] 2
Δ g = i = M M j = M M [ g ( x i , y i ) 2 g m ] 2
wherein M represents the subset size before and after deformation.
For any subsets, if an optimal group of constants ( u 0 , v 0 , u x , u y , v x , v y ) is provided, the above correlation coefficients in Equations (7) and (8) above will be minimized. If the correlation coefficient ( C ) is zero, the obtained six parameters are the most reliable.

2.3. Strain Field Calculation

The digital image correlation method causes errors in obtaining the deformation field due to CCD Camera captures images errors in the image digitization process and noise. We will use local least-squares fitting technique for strain estimation. In order to compute the strains of the current point, we take a small square window containing ( 2 M + 1 ) × ( 2 M + 1 ) points in the displacement field (i.e., strain calculation window). When the window is small enough, it can be regarded as a linear plane, so it can be expressed as:
u ( i , j ) = a 0 + a 1 x + a 2 y   ,   v ( i , j ) = b 0 + b 1 x + b 2 y
where i , j are the coordinates of each point in strain calculation window. u ( i , j ) and v ( i , j ) are the original deformation at location ( i , j ) obtained by DIC. Thus, simple linear least squares method can be used to solve the unknown polynomial coefficients. The strain at the center point of subset can therefore be computed based on the obtained coefficients a i = 0 ,     1 ,   2 ,   b i = 0 ,   1 ,   2 , and differentiate this plane to get.

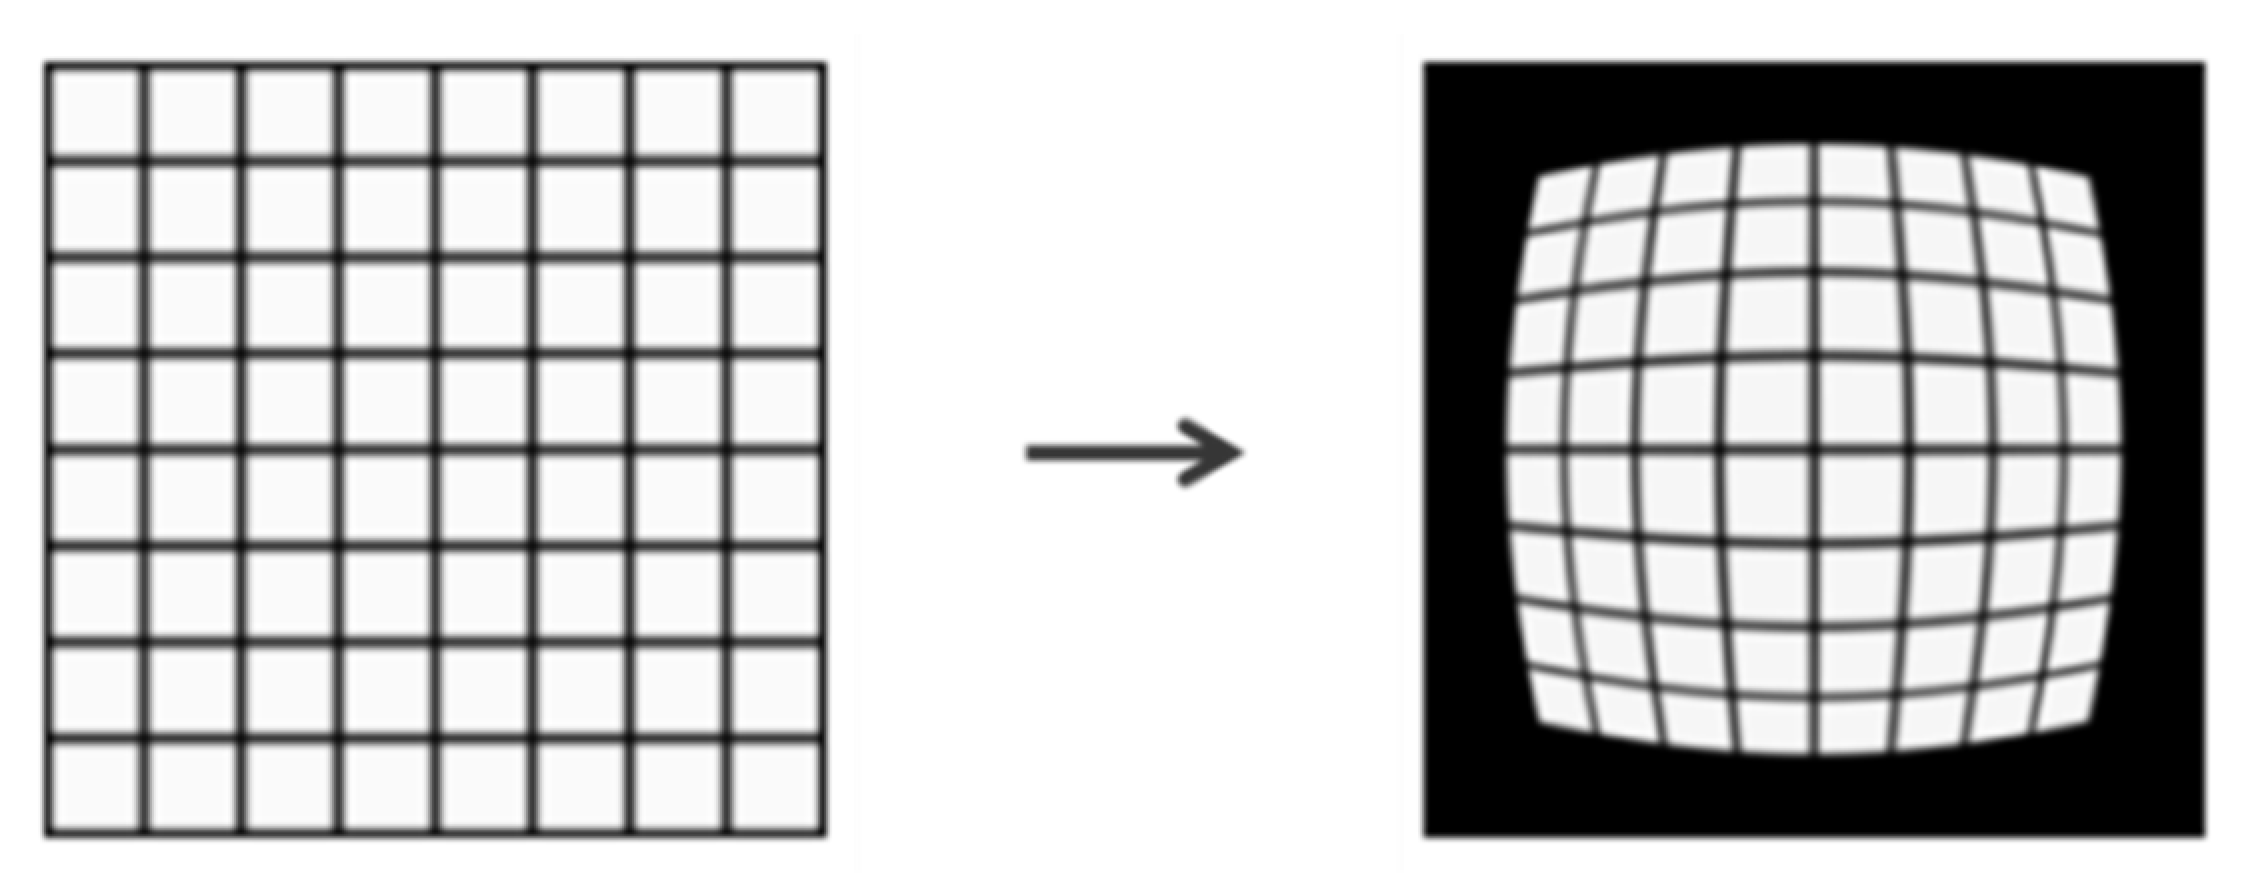
2.4. Image Distortion Correction

Images that a camera captures often distort, as shown in Figure 2. Image distortion affects the accuracy of the DIC method when it is used to calculate the displacement field. Consequently, the present study used the DIC method to get the displacement field after images were distorted via the known displacement field, after which the least squares method was used to find out distortion parameters and have it corrected.

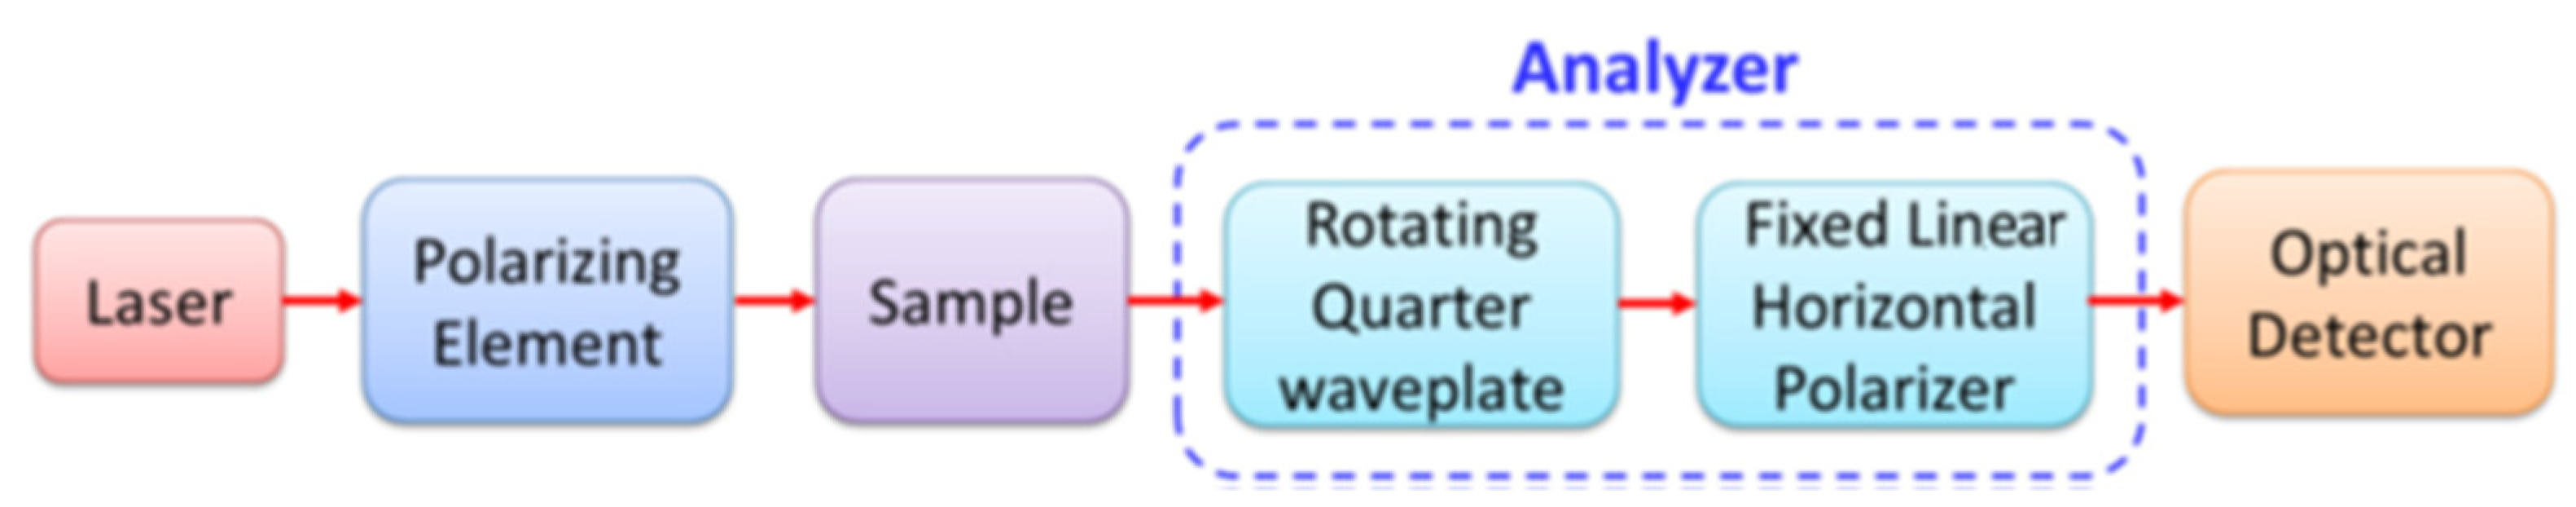
2.5. Stokes Vector and Mueller Matrix Polarimetry

The traditional way to measure the stress and strain of materials by a photo elastic-based model is via observation of the LB property, and this method has been developed as a commercial instrument. If the material thickness and stress-optic coefficient of the material are known, the LB can be used to calculate the residual stress [28].
The key of measuring optical parameters is acquisition of Mueller matrix of a sample. Figure 3 presents a full-field Mueller matrix system that a beam expander and a CCD are added into this system [21]. The intensity of the optical beam I ( θ ) on the detector is given by:
I ( θ ) = 1 2 ( S 0 1 2 S 2 + S 1 cos θ + 1 2 S 2 c o s 2 θ 1 2 S 3 sin 2 θ )  
where θ is the angle of the rotating quarter waveplate in the analyzer (dashed-line box in Figure 3), in which S 0 ,   S 1 ,   S 2 , and S 3 are the parameters of Stoke vector S. In the proposed method, six different input lights (four different angles linear polarized incident lights, with 0°, 45°, 90°, and 135°, respectively, and two circular polarized incident lights, one clockwise and another counterclockwise) are applied into a tested sample. Subsequently, the corresponding output Stokes vectors are measured in order to extract the full Mueller matrix of a tested sample. The detail arrangement of Stokes vectors in characterizing the Mueller elements are shown in Equation (14) as
M = 1 2 [ S L H P _ 0 + S L V P _ 0 S L H P _ 0 S L V P _ 0 S L 45 P _ 0 S L 135 P _ 0 S R H P _ 0 S L H P _ 0 S L H P _ 1 + S L V P _ 1 S L H P _ 1 S L V P _ 1 S L 45 P _ 1 S L 135 P _ 1 S R H P _ 1 S L H P _ 1 S L H P _ 2 + S L V P _ 2 S L H P _ 2 S L V P _ 2 S L 45 P _ 2 S L 135 P _ 2 S R H P _ 2 S L H P _ 2 S L H P _ 3 S L V P _ 3 S L H P _ 3 + S L V P _ 3 S L 45 P _ 3 S L 135 P _ 3 S R H P _ 3 S L H P _ 3 ]
where
S L H P = ( 1 1 0 0 ) , S L V P = ( 1 1 0 0 ) , S L 45 P = ( 1 0 1 0 )
According to Chen et al. [21], the Mueller matrix for a LB material with an orientation angle α and phase retardancy β can be decoupled and expressed as
M l b = [ 1 0 0 0 0 cos ( 4 α ) sin 2 ( β / 2 ) + cos 2 ( β / 2 ) sin ( 4 α ) sin 2 ( β / 2 ) sin ( 2 α ) sin ( β ) 0 sin ( 4 α ) sin 2 ( β / 2 ) cos ( 4 α ) sin 2 ( β / 2 ) cos 2 ( β / 2 ) cos ( 2 α ) sin ( β ) 0 sin ( 2 α ) sin 2 ( β ) cos ( 2 α ) sin ( β ) cos ( β ) ]
where β = 2 π d ( n e n 0 ) / λ , n 0 and n e are the refractive index of the fast and slow axis respectively, and d is the thickness of the object.

3. Experimental Procedure

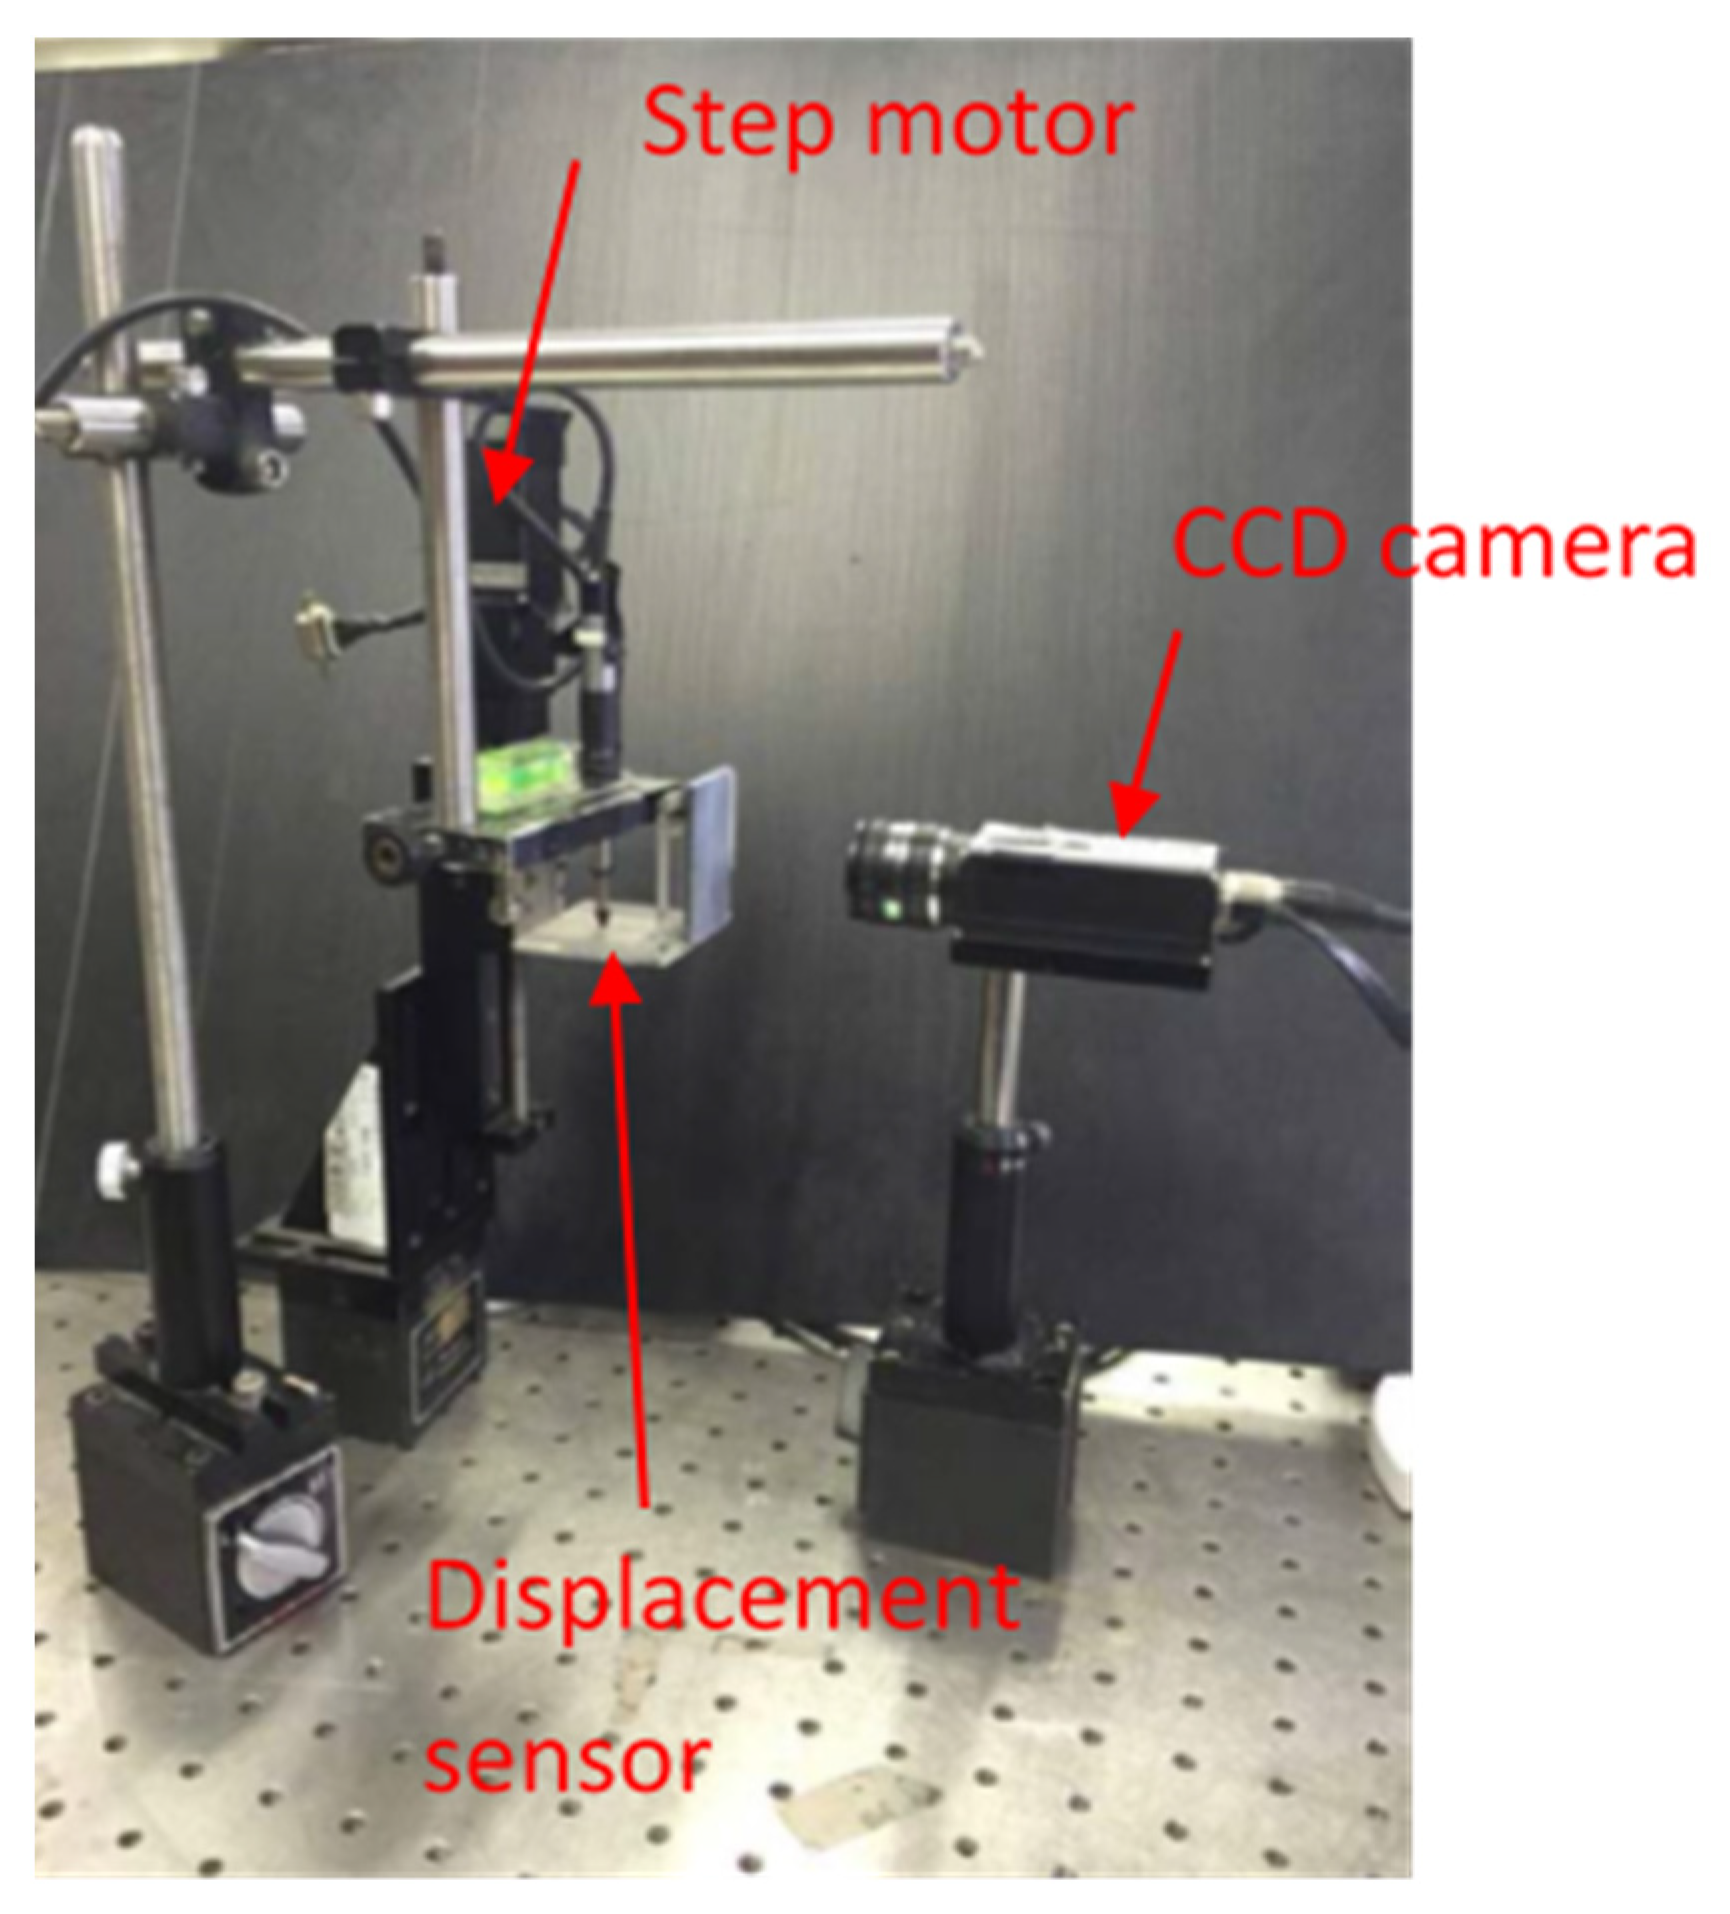
3.1. Image Measurement System
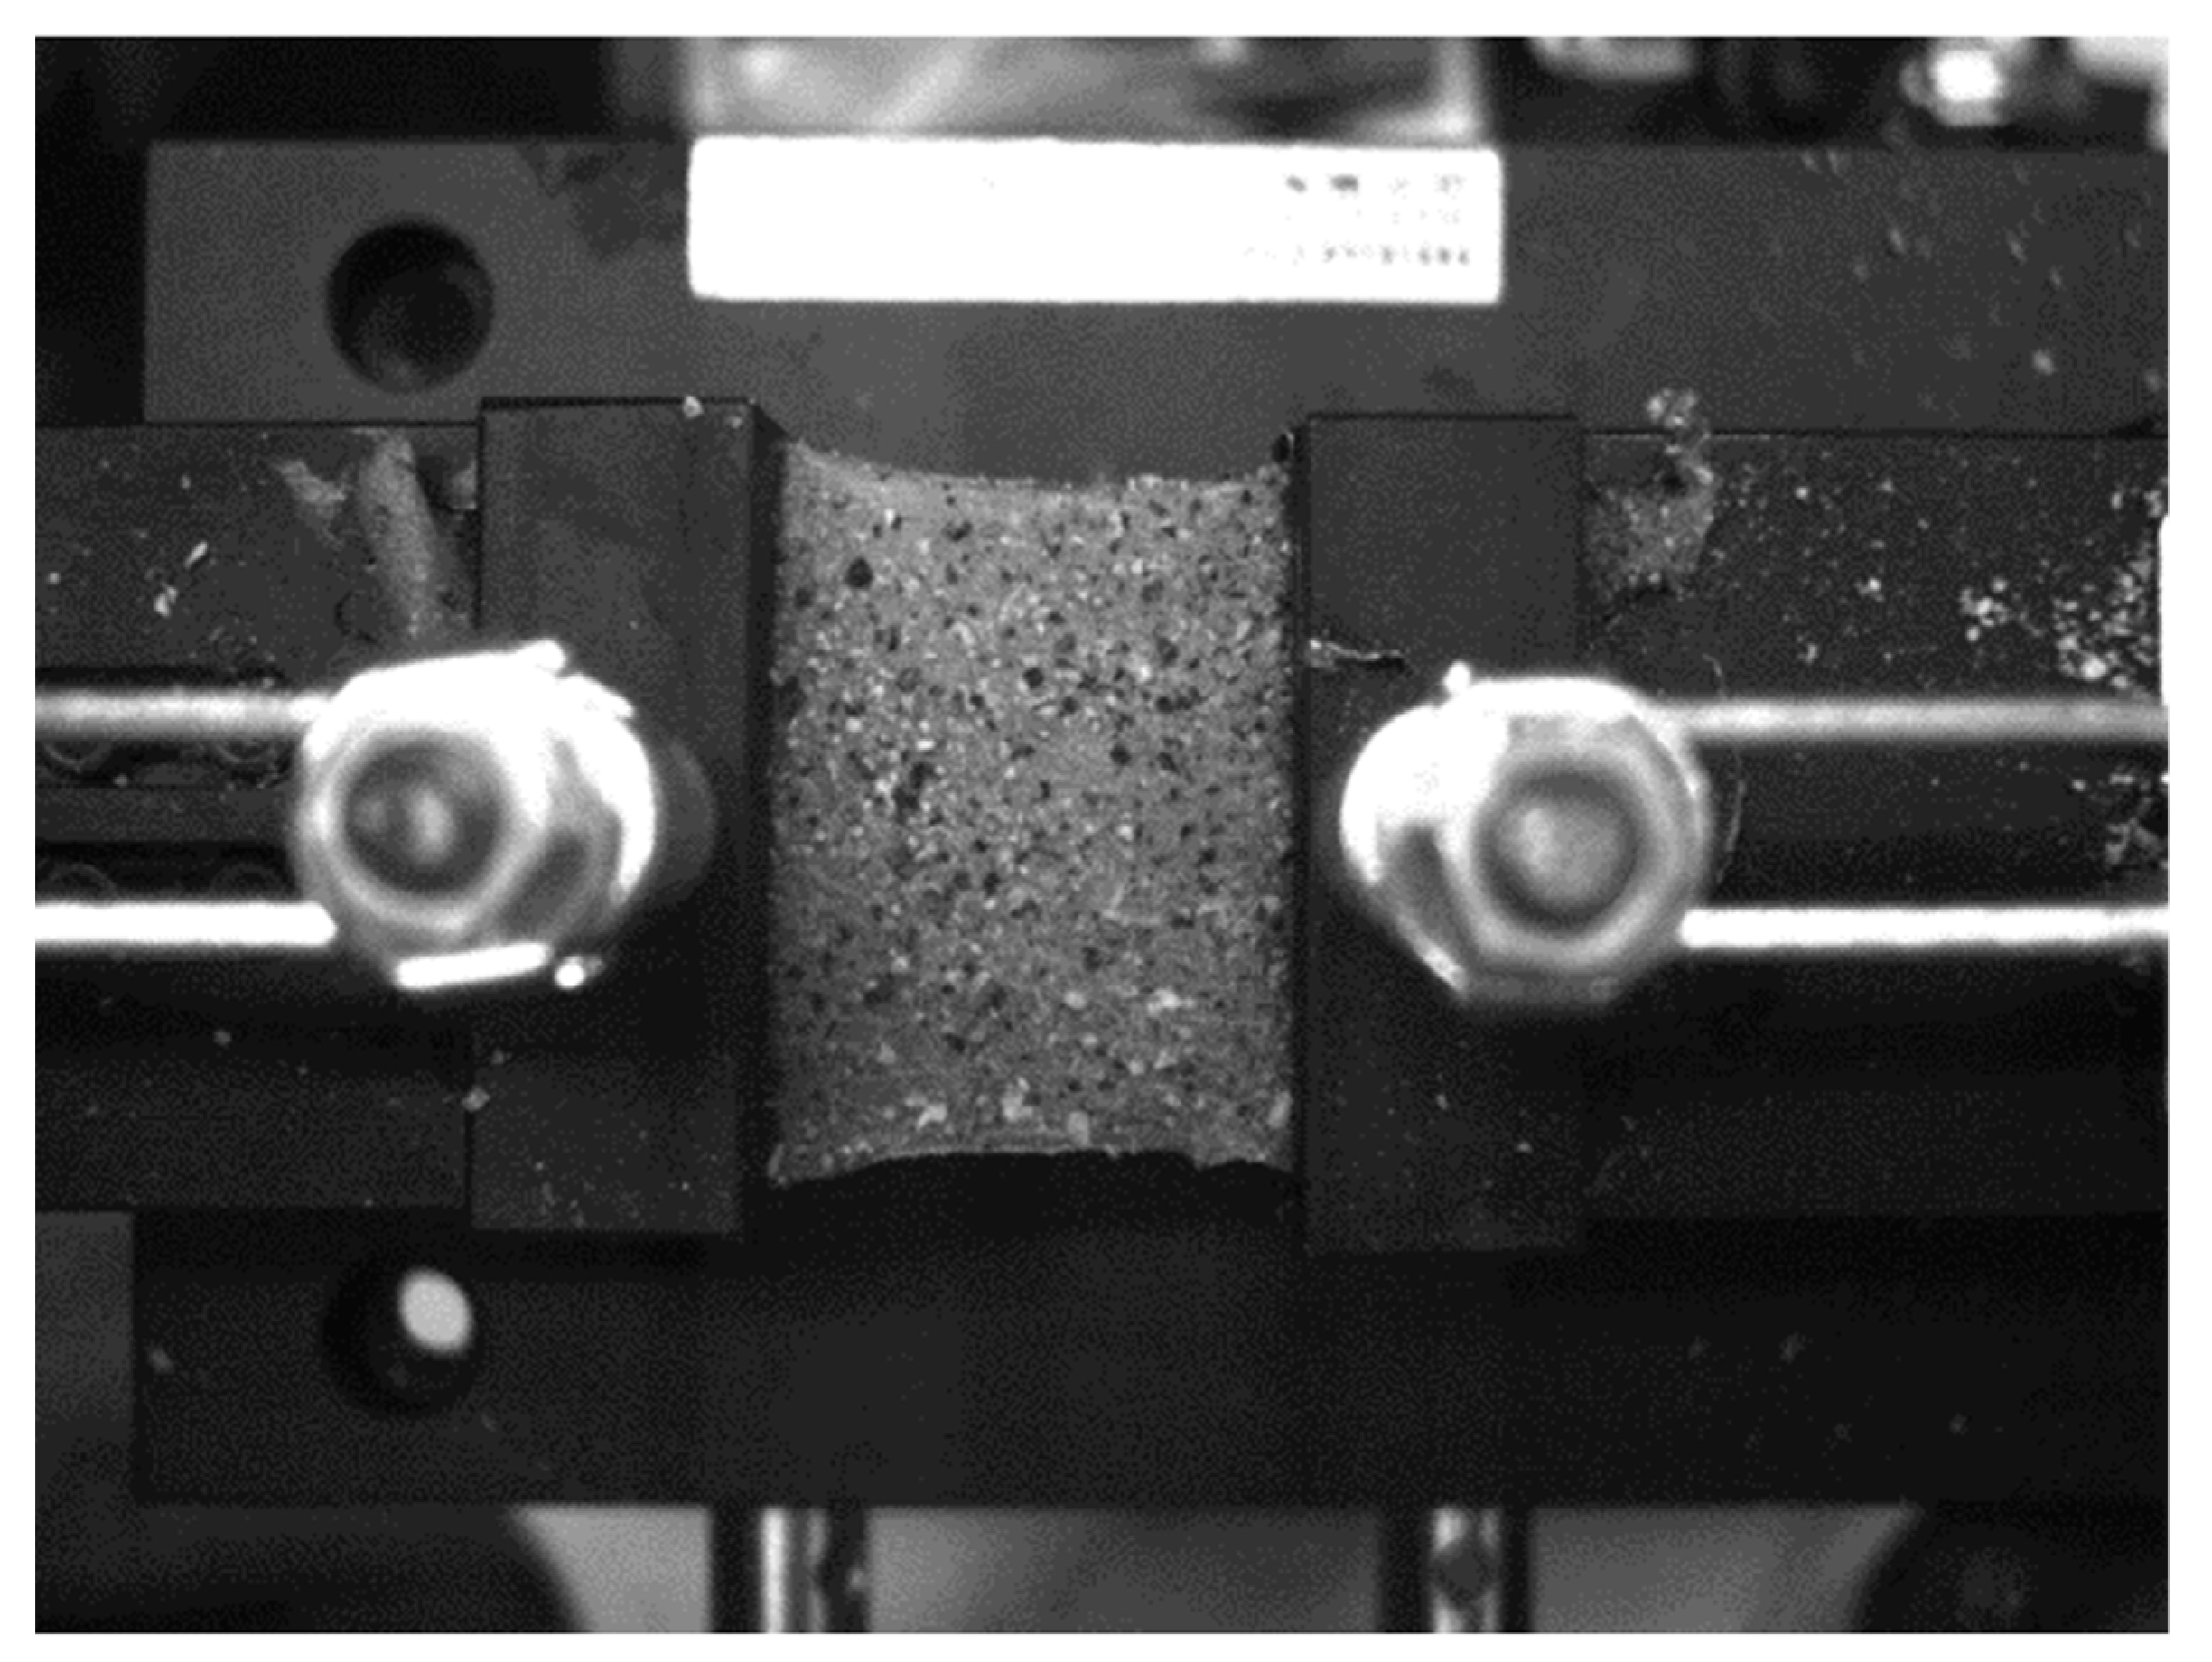
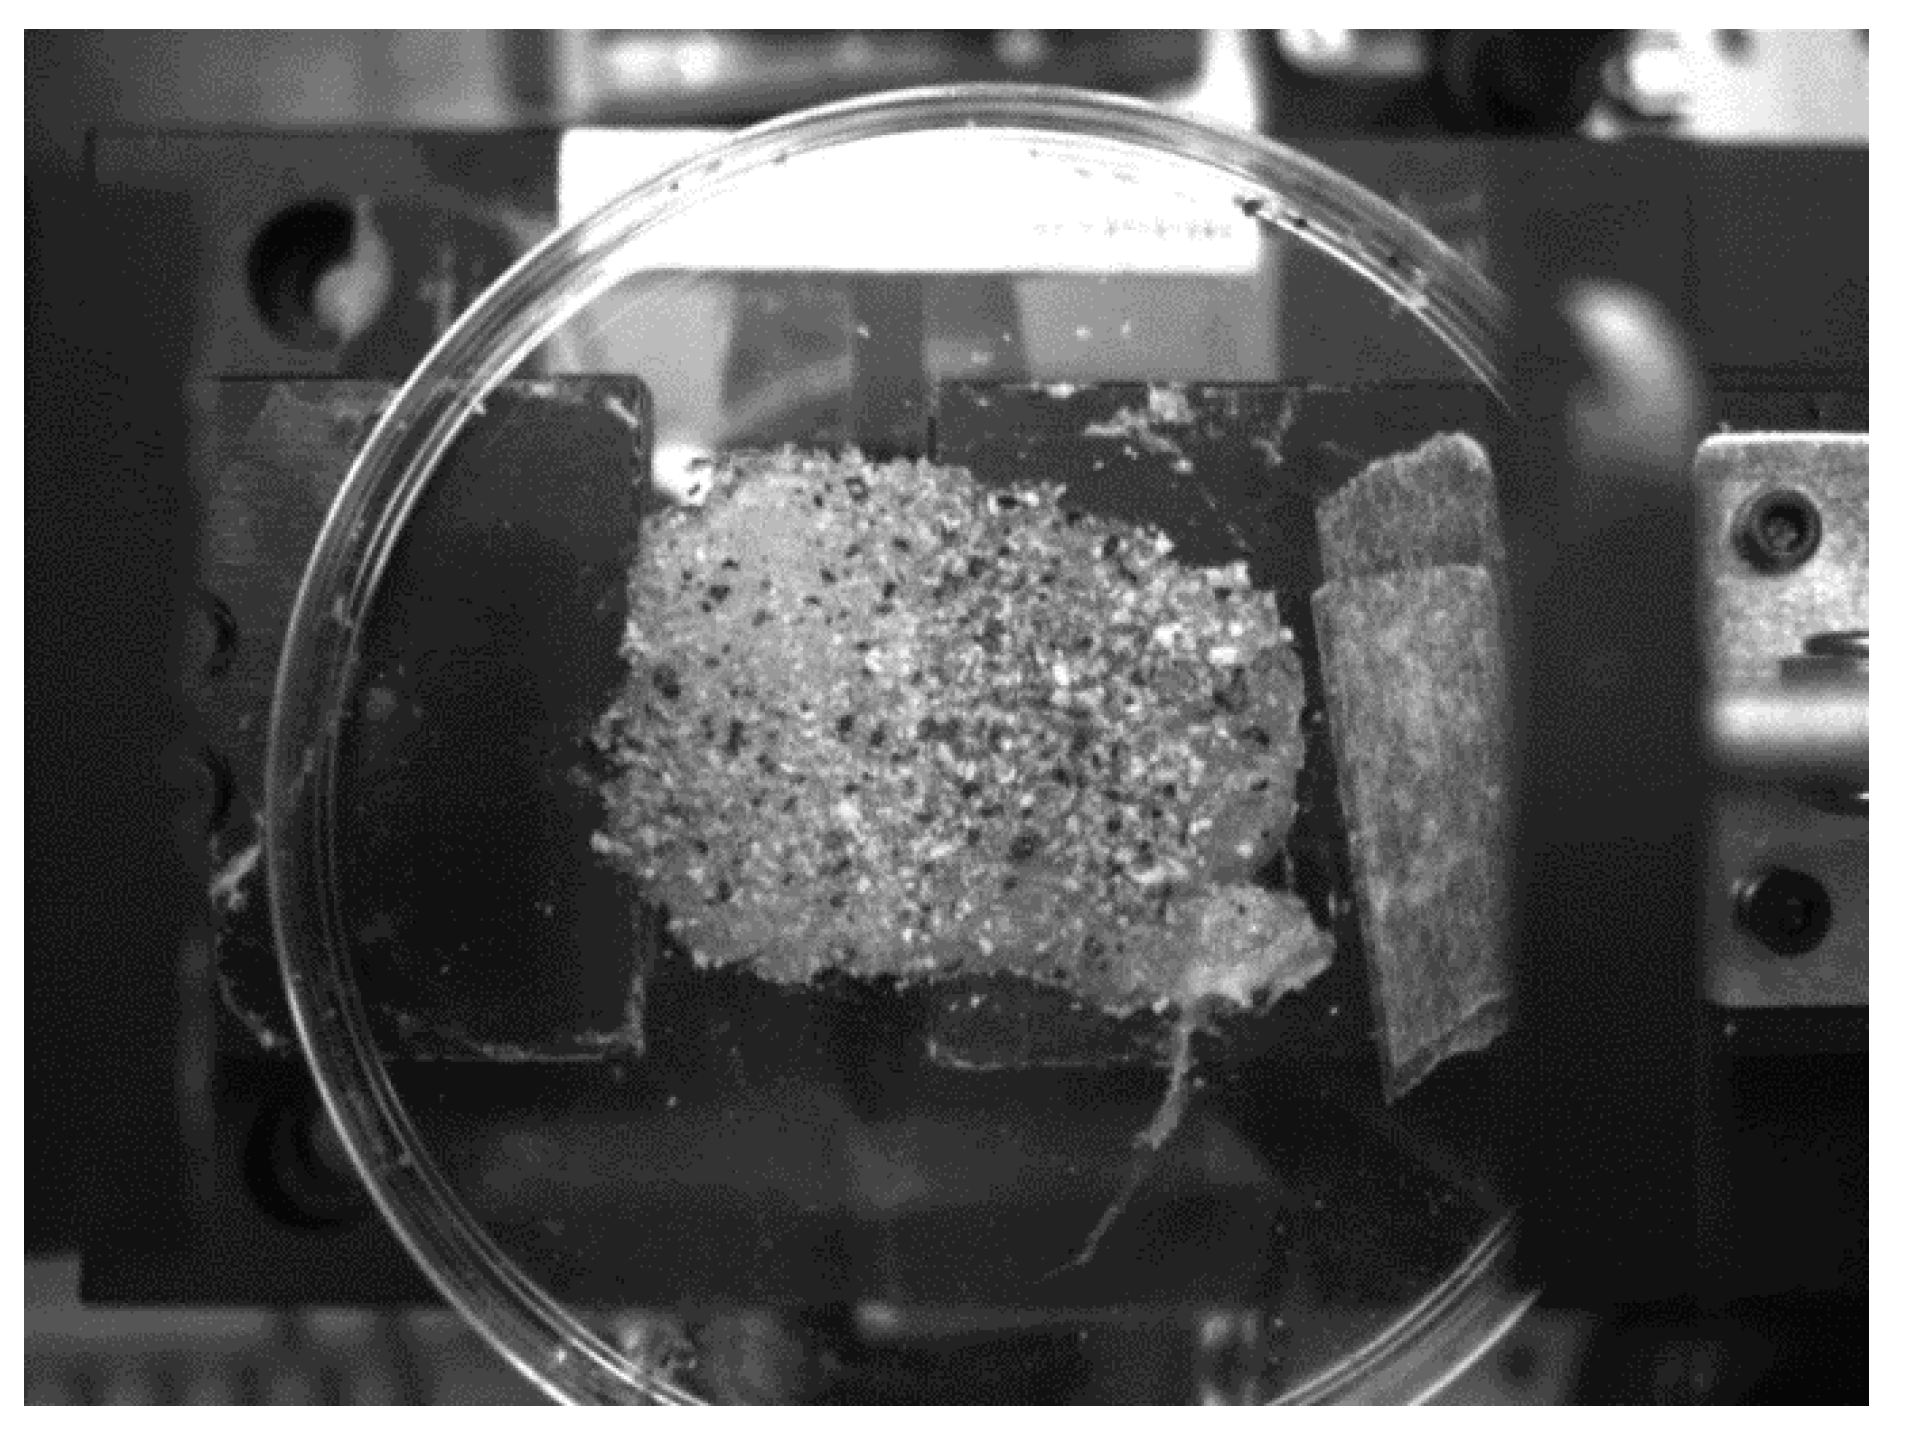
The measurement setup of the present study consisted of two parts. The first part was used to select the subset size with the DIC method, calculate image distortion correction parameters, and perform a rigid body translation, as shown in Figure 4. The first part of the setup is composed of a digital image system and a displacement control system. Specifically, the digital image system includes a CCD camera (Sca-1390-17gm, Basler AG, Ahrensburg, Germany) with a resolution of 1392 × 1040 pixels, a lens (09k, Computar, Chuo, Japan) with a focal length of 8 mm, a computer (Intel(R) Core™ i5-3201M 2.5 GHz), and DIC software written by LabVIEW (SP1, 2009, Texas, NI, USA). The displacement control system includes a step motor displacement controller (MMT32, OP MOUNT, Taoyuan, Taiwan) with a precision of 0.156 μm and a displacement sensor (EX-V01, Keyence Corporation, Osaka, Japan) with a precision of 0.1 μm.
The second part was used for biological tissue tensile testing, as shown in Figure 5, including a digital image system and a stretching platform. The digital image system was the same as the one used in the first part. The tensile platform was composed of a translation stage (T-LSM025A-S, Zaber Technologies, Vancouver, Canada) with a precision of 8 μm and a self-made chuck.

3.2. Test Specimen

In the present study, the test specimen was pasted on a glass plate after white spots were randomly sprayed on the insulating black tape (as a black underground), after which it was used to select subset sizes with the DIC method, calculate image distortion correction parameters, and perform rigid body translation, as shown in Figure 6.
The biological tissue tensile testing in the present study used chicken breast as its test specimen, which was cut into 1 mm thick slices. To produce spot markers on its surface and make their grayscales evenly distributed, ground black and white pepper and white sesame were mixed and evenly spread on the surface of the chicken breast, as shown in Figure 7.

3.3. Experimental Process

The present research wrote a DIC program with LabVIEW 2009 software, and the corresponding flow chart is shown in Figure 8. Before the measurement, the lens was mounted to a camera and connected to a computer, and the camera was set on an optical table. Thereafter, pre-experimental correction was performed, including subset selection and image distortion correction. Environmental factors may interfere with signals, so it is necessary to select subsets with a proper size that bring sufficient features, so as to suppress the error caused by noise. When the subset size was set, two images of the subset were photographed in a static state.
Subset selection and image distortion correction having been done, the displacement field was verified. Thereafter, the step motor and the displacement sensor were set up; the step motor was controlled to perform the translation of the test specimen. During this period, the camera was used to capture the images before and after the displacement. Lastly, the displacement field was calculated to discuss the accuracy of the analysis results.
The displacement and strain having been verified, the deformation of chicken breast was measured through the DIC method. In the tensile testing of the chicken breast, it was cut into thin slices that were 0.5 mm thick, which were put into the tensile test machine. After that, a mixture of ground pepper and sesame was sprayed on the surface of the chicken breast to make spot markers, and the digital imaging system was set up. During the testing, the translation stage was moved to a certain amount of stretch, and the images before and after deformation were recorded for subsequent calculation and analysis of the deformation.
In the tensile testing process, the changes in optical parameters [29,30,31,32,33] were also measured, which were compared with the experimental results obtained via the DIC.

4. Results and Discussion

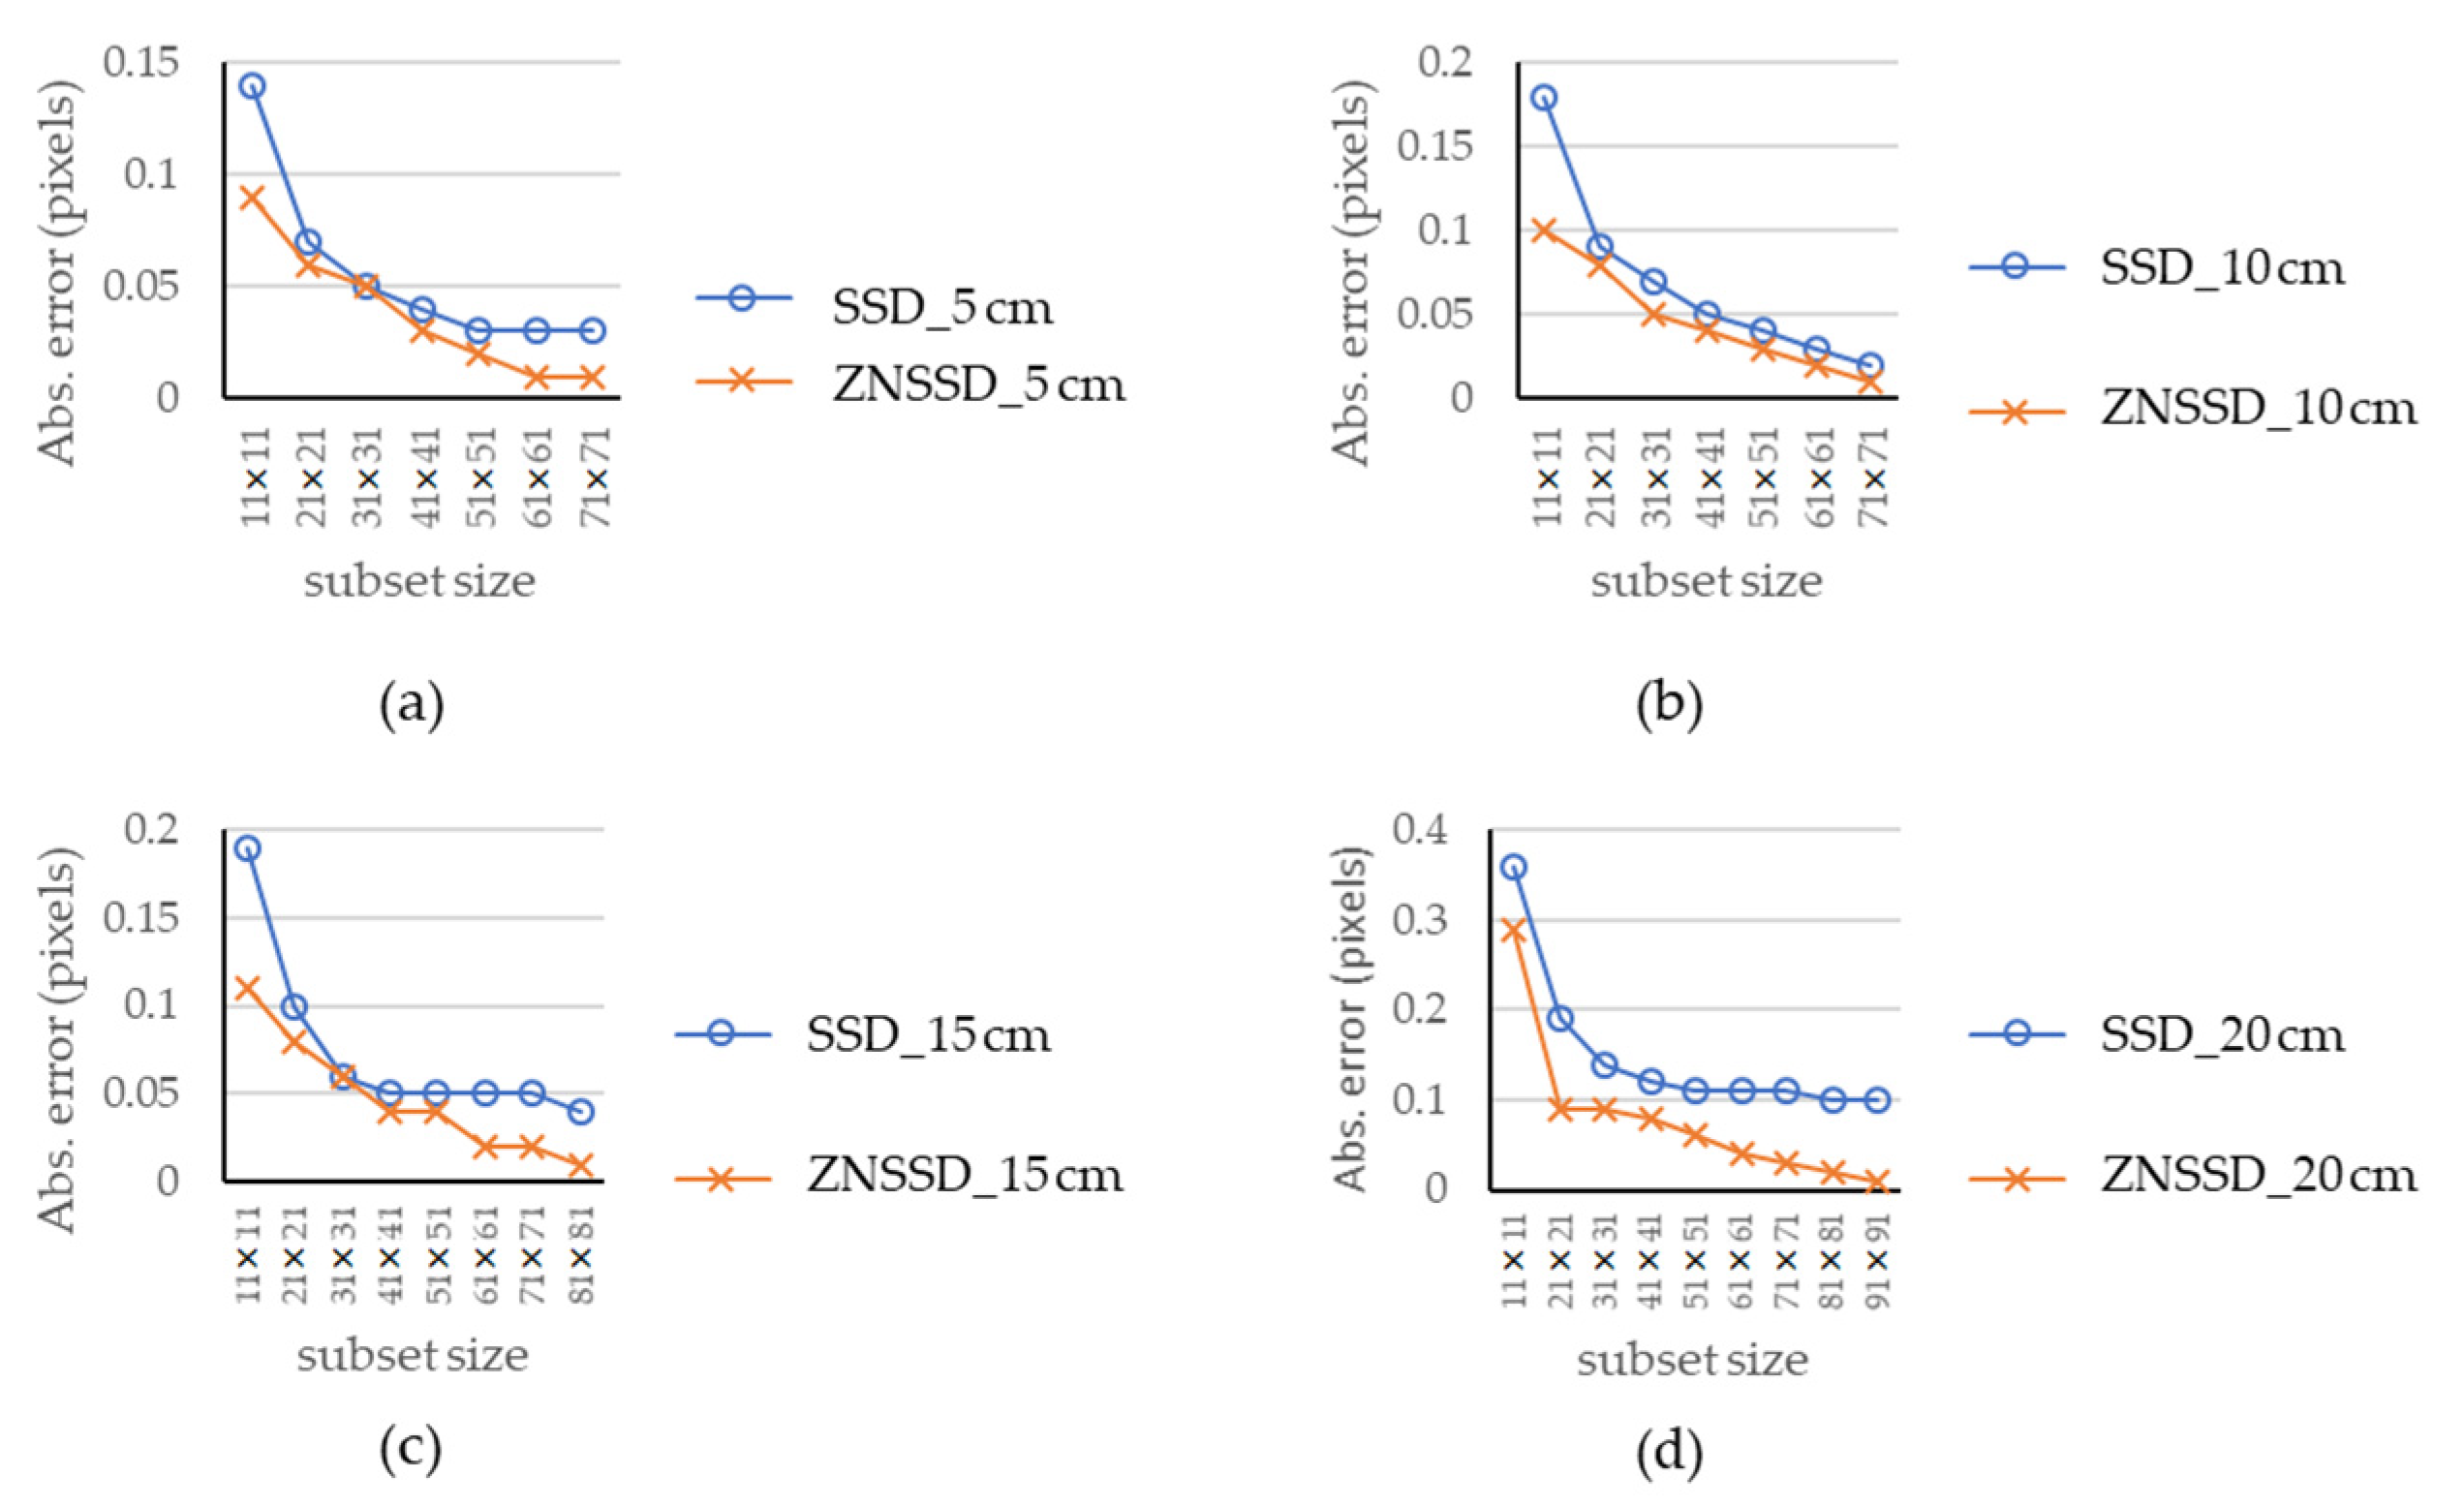
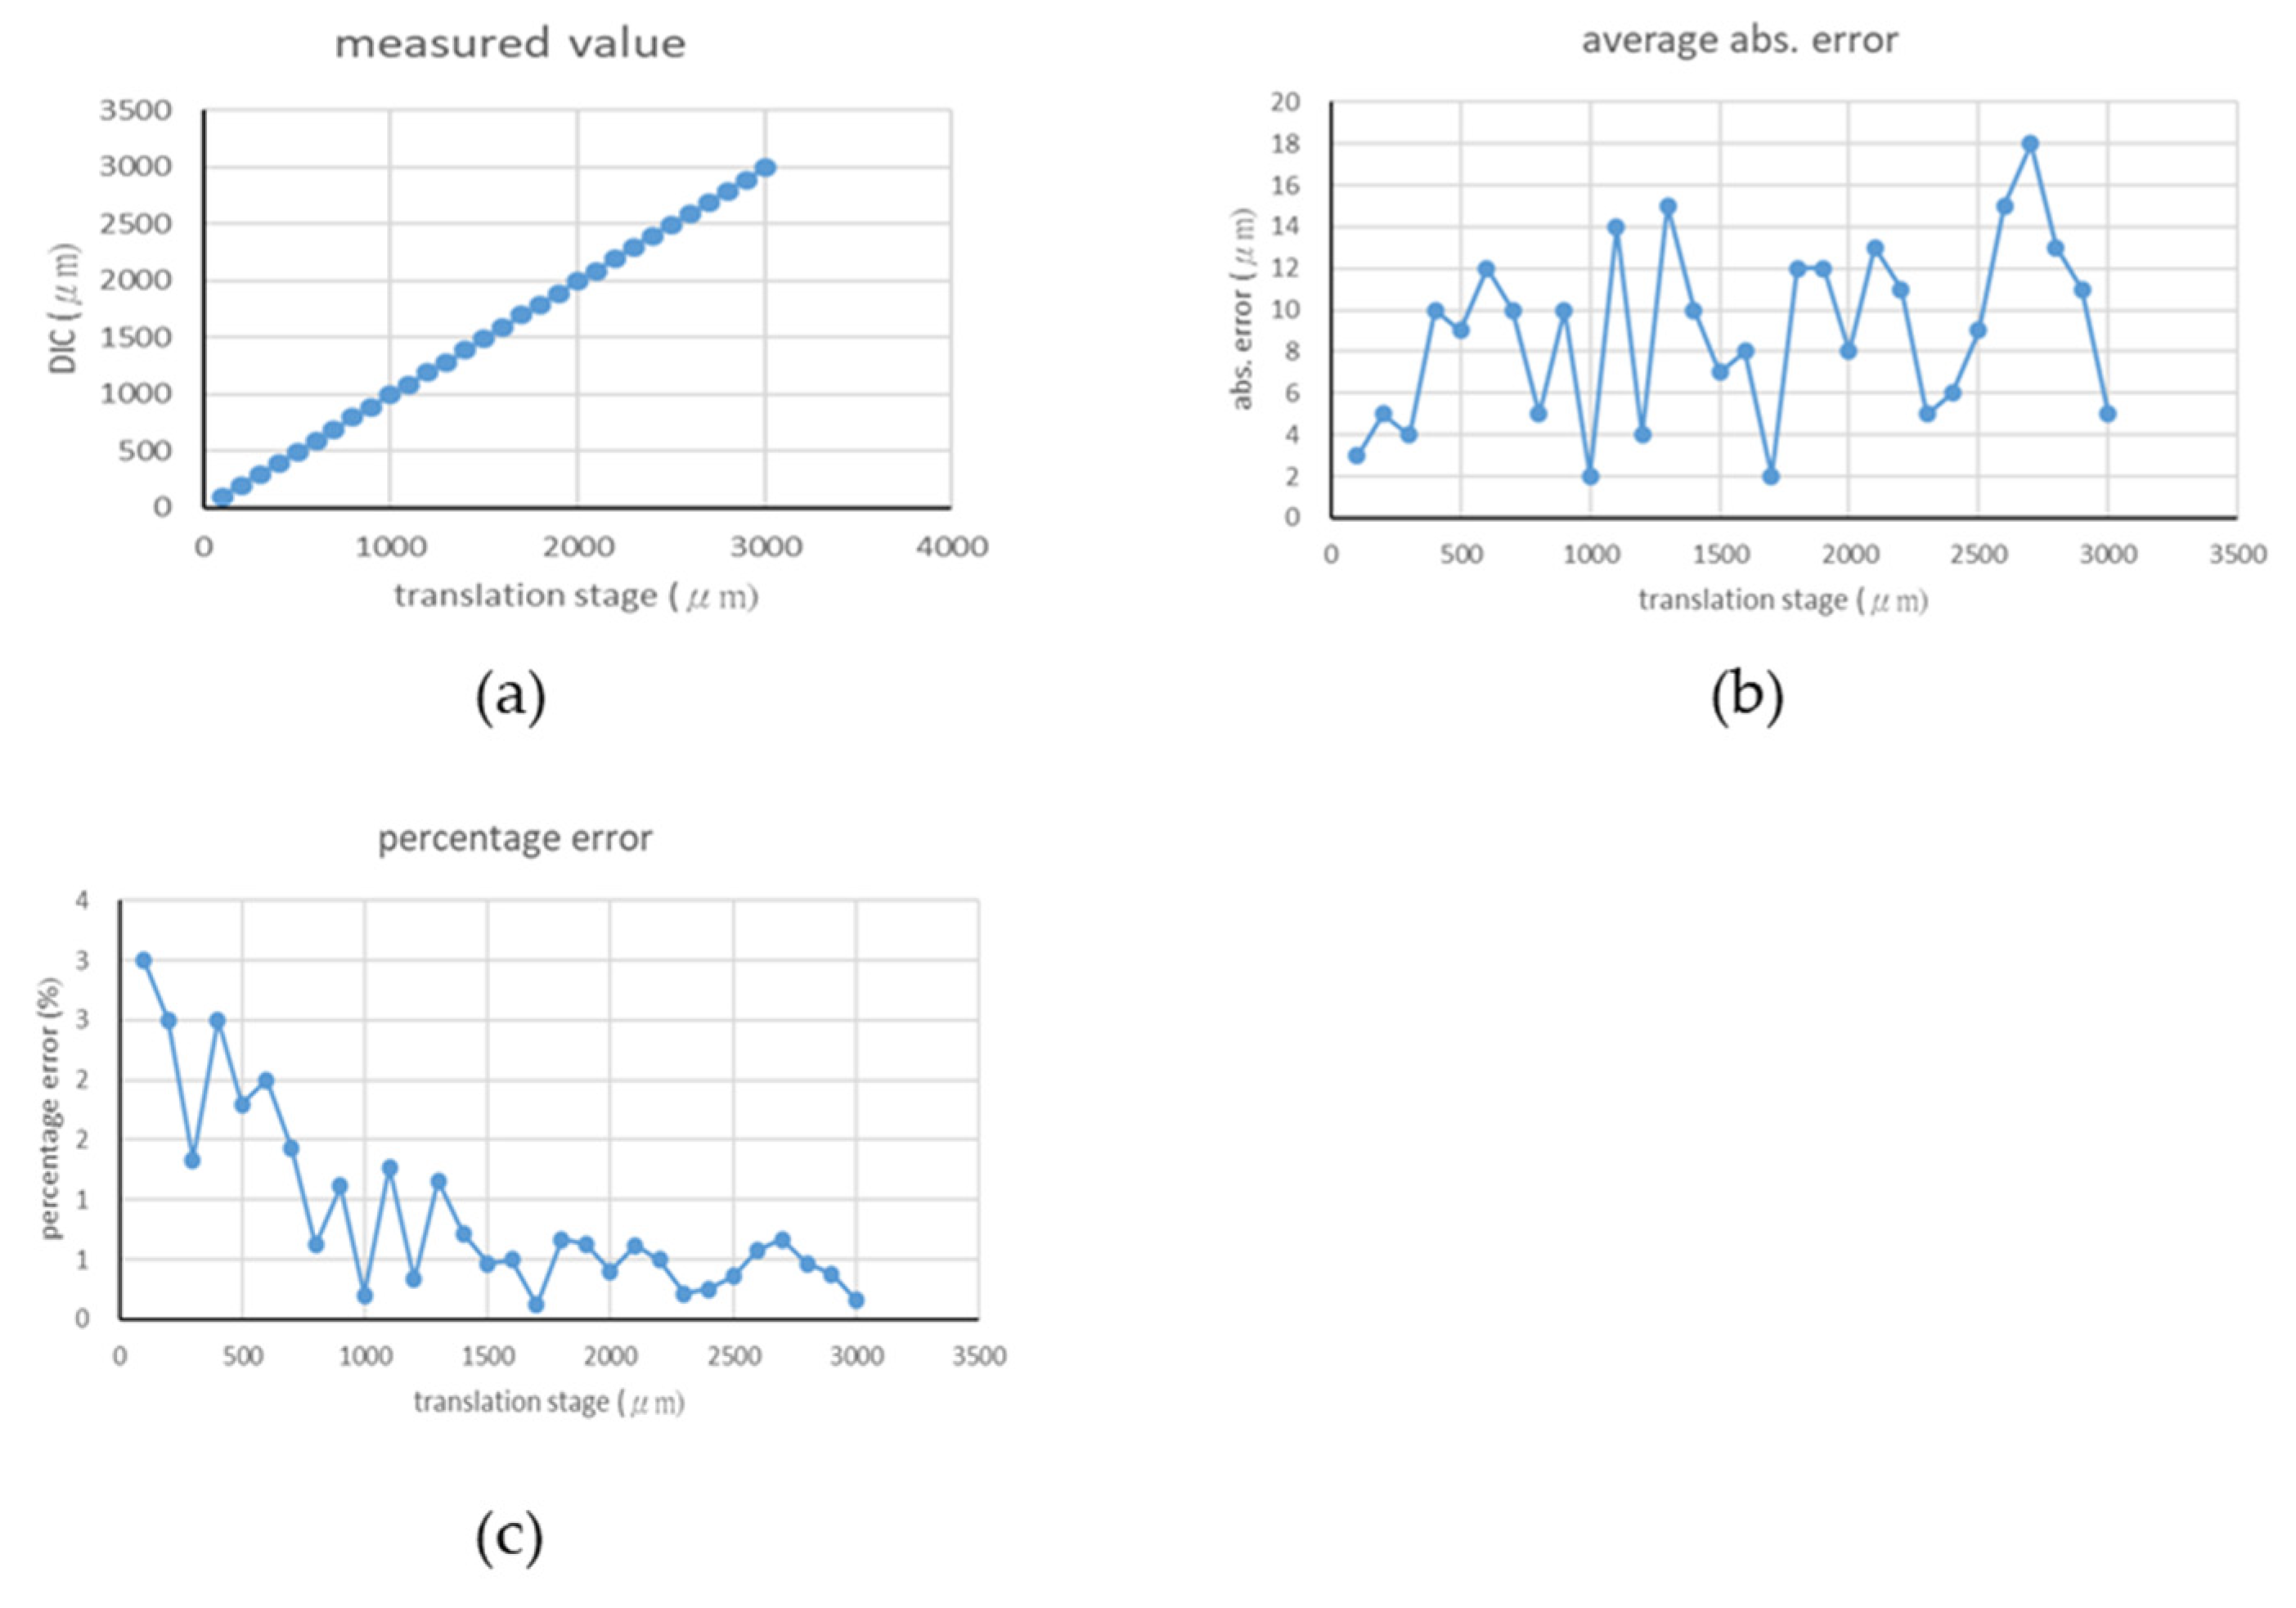
4.1. Rigid Body Translation Experiment

To subset selection at different resolutions, two images of the subset were photographed in a static state. The area of the test specimen to be examined was within 100 × 100 pixels of its center. A point was captured every 10 pixels, so a total of 121 points was taken to evaluate the displacement field calculated by the DIC program written based on the SSD and ZNSSD criteria. The average abs error and standard deviation (SD) of the displacement field were used to measure the impact of noise on accuracy. To evaluate the accuracy of the DIC program at different resolutions, the distance between the CCD camera and test specimens was set at 5 cm, 10 cm, 15 cm, and 20 cm respectively, after which the aforementioned steps were repeated.
The measurement was performed with following settings: a distance of 5 cm, a resolution of around 34.4 μm/pixels; a distance of 10 cm, a resolution of around 62.1 μm/pixels; a distance of 15 cm, a resolution of around 90.6 μm/pixels; a distance of 20 cm, a resolution of around 119.5 μm/pixels.
The experimental results are listed in Figure 9 and Figure 10. According to the experimental results, with same subset size, the absolute error, and standard deviation of ZNSSD are smaller than those of SSD. It can be seen that ZNSSD has better noise suppression than SSD; and when the camera is farther away from the specimen which the resolution is lower, the subset size needs to be larger. The standard deviation can be reduced to an acceptable range if it is large, so the selected subset size at different distance is 51 × 51, 61 × 61, 81 × 81 respectively and the error of ZNSSD due to noise is about 0.02 pixels.

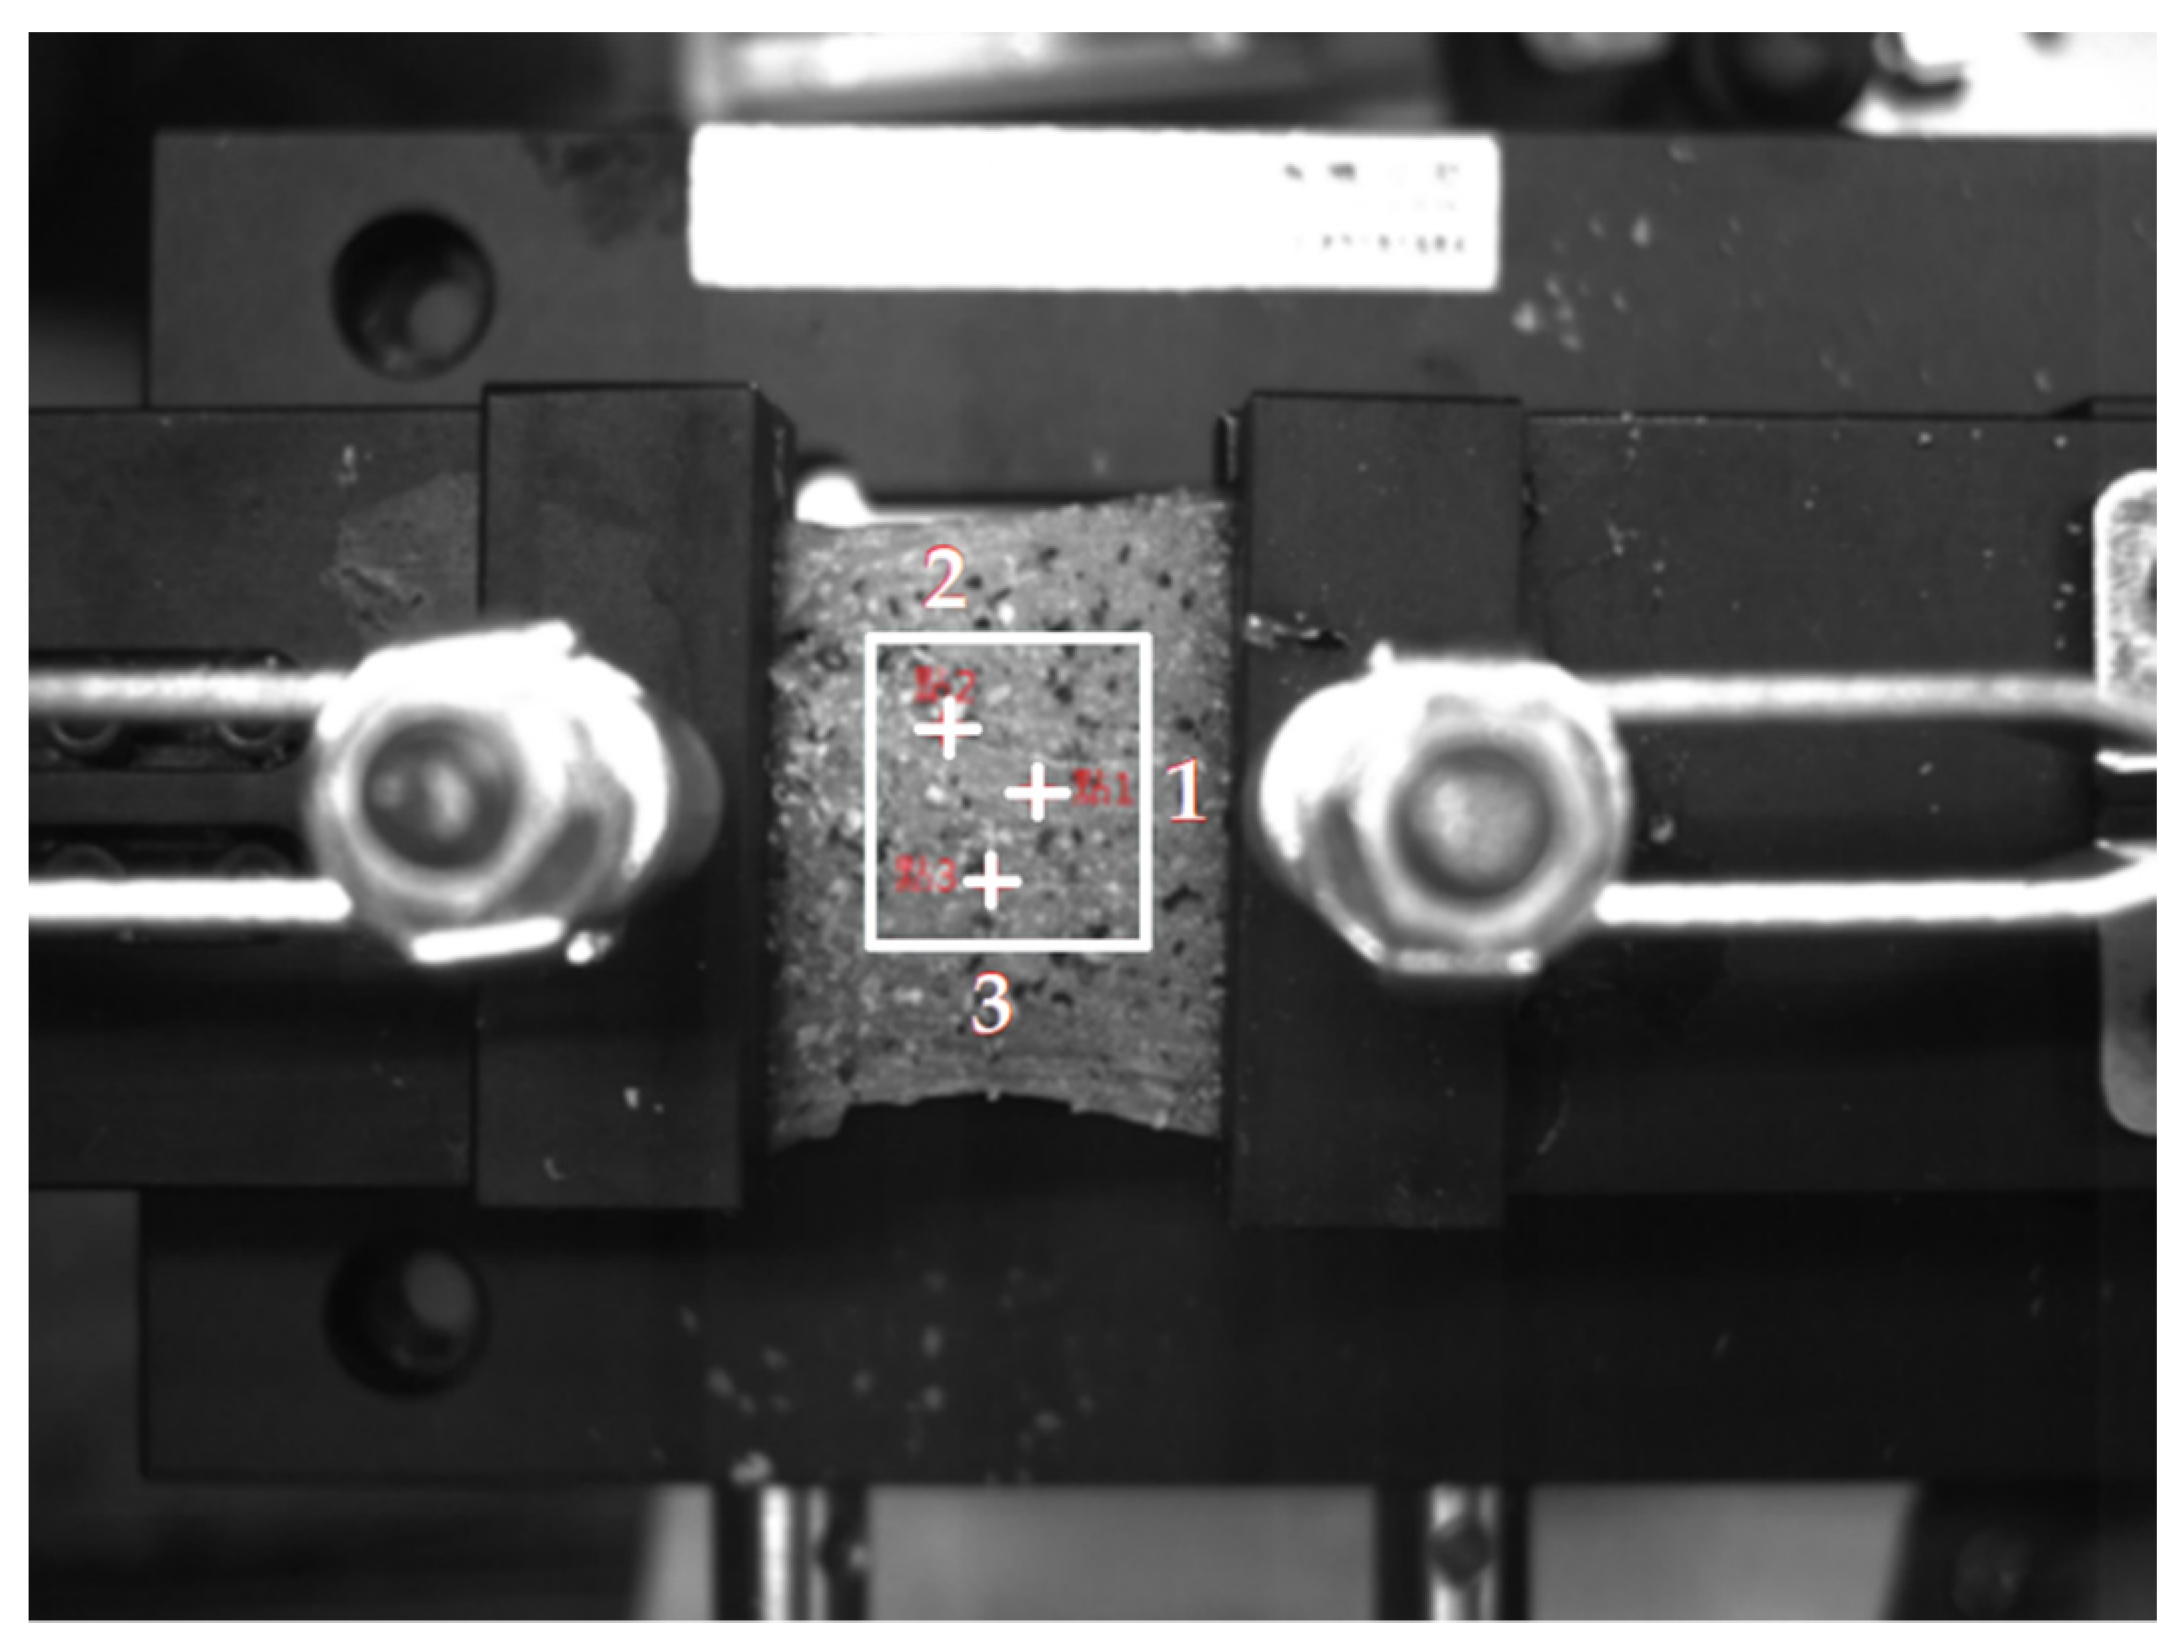
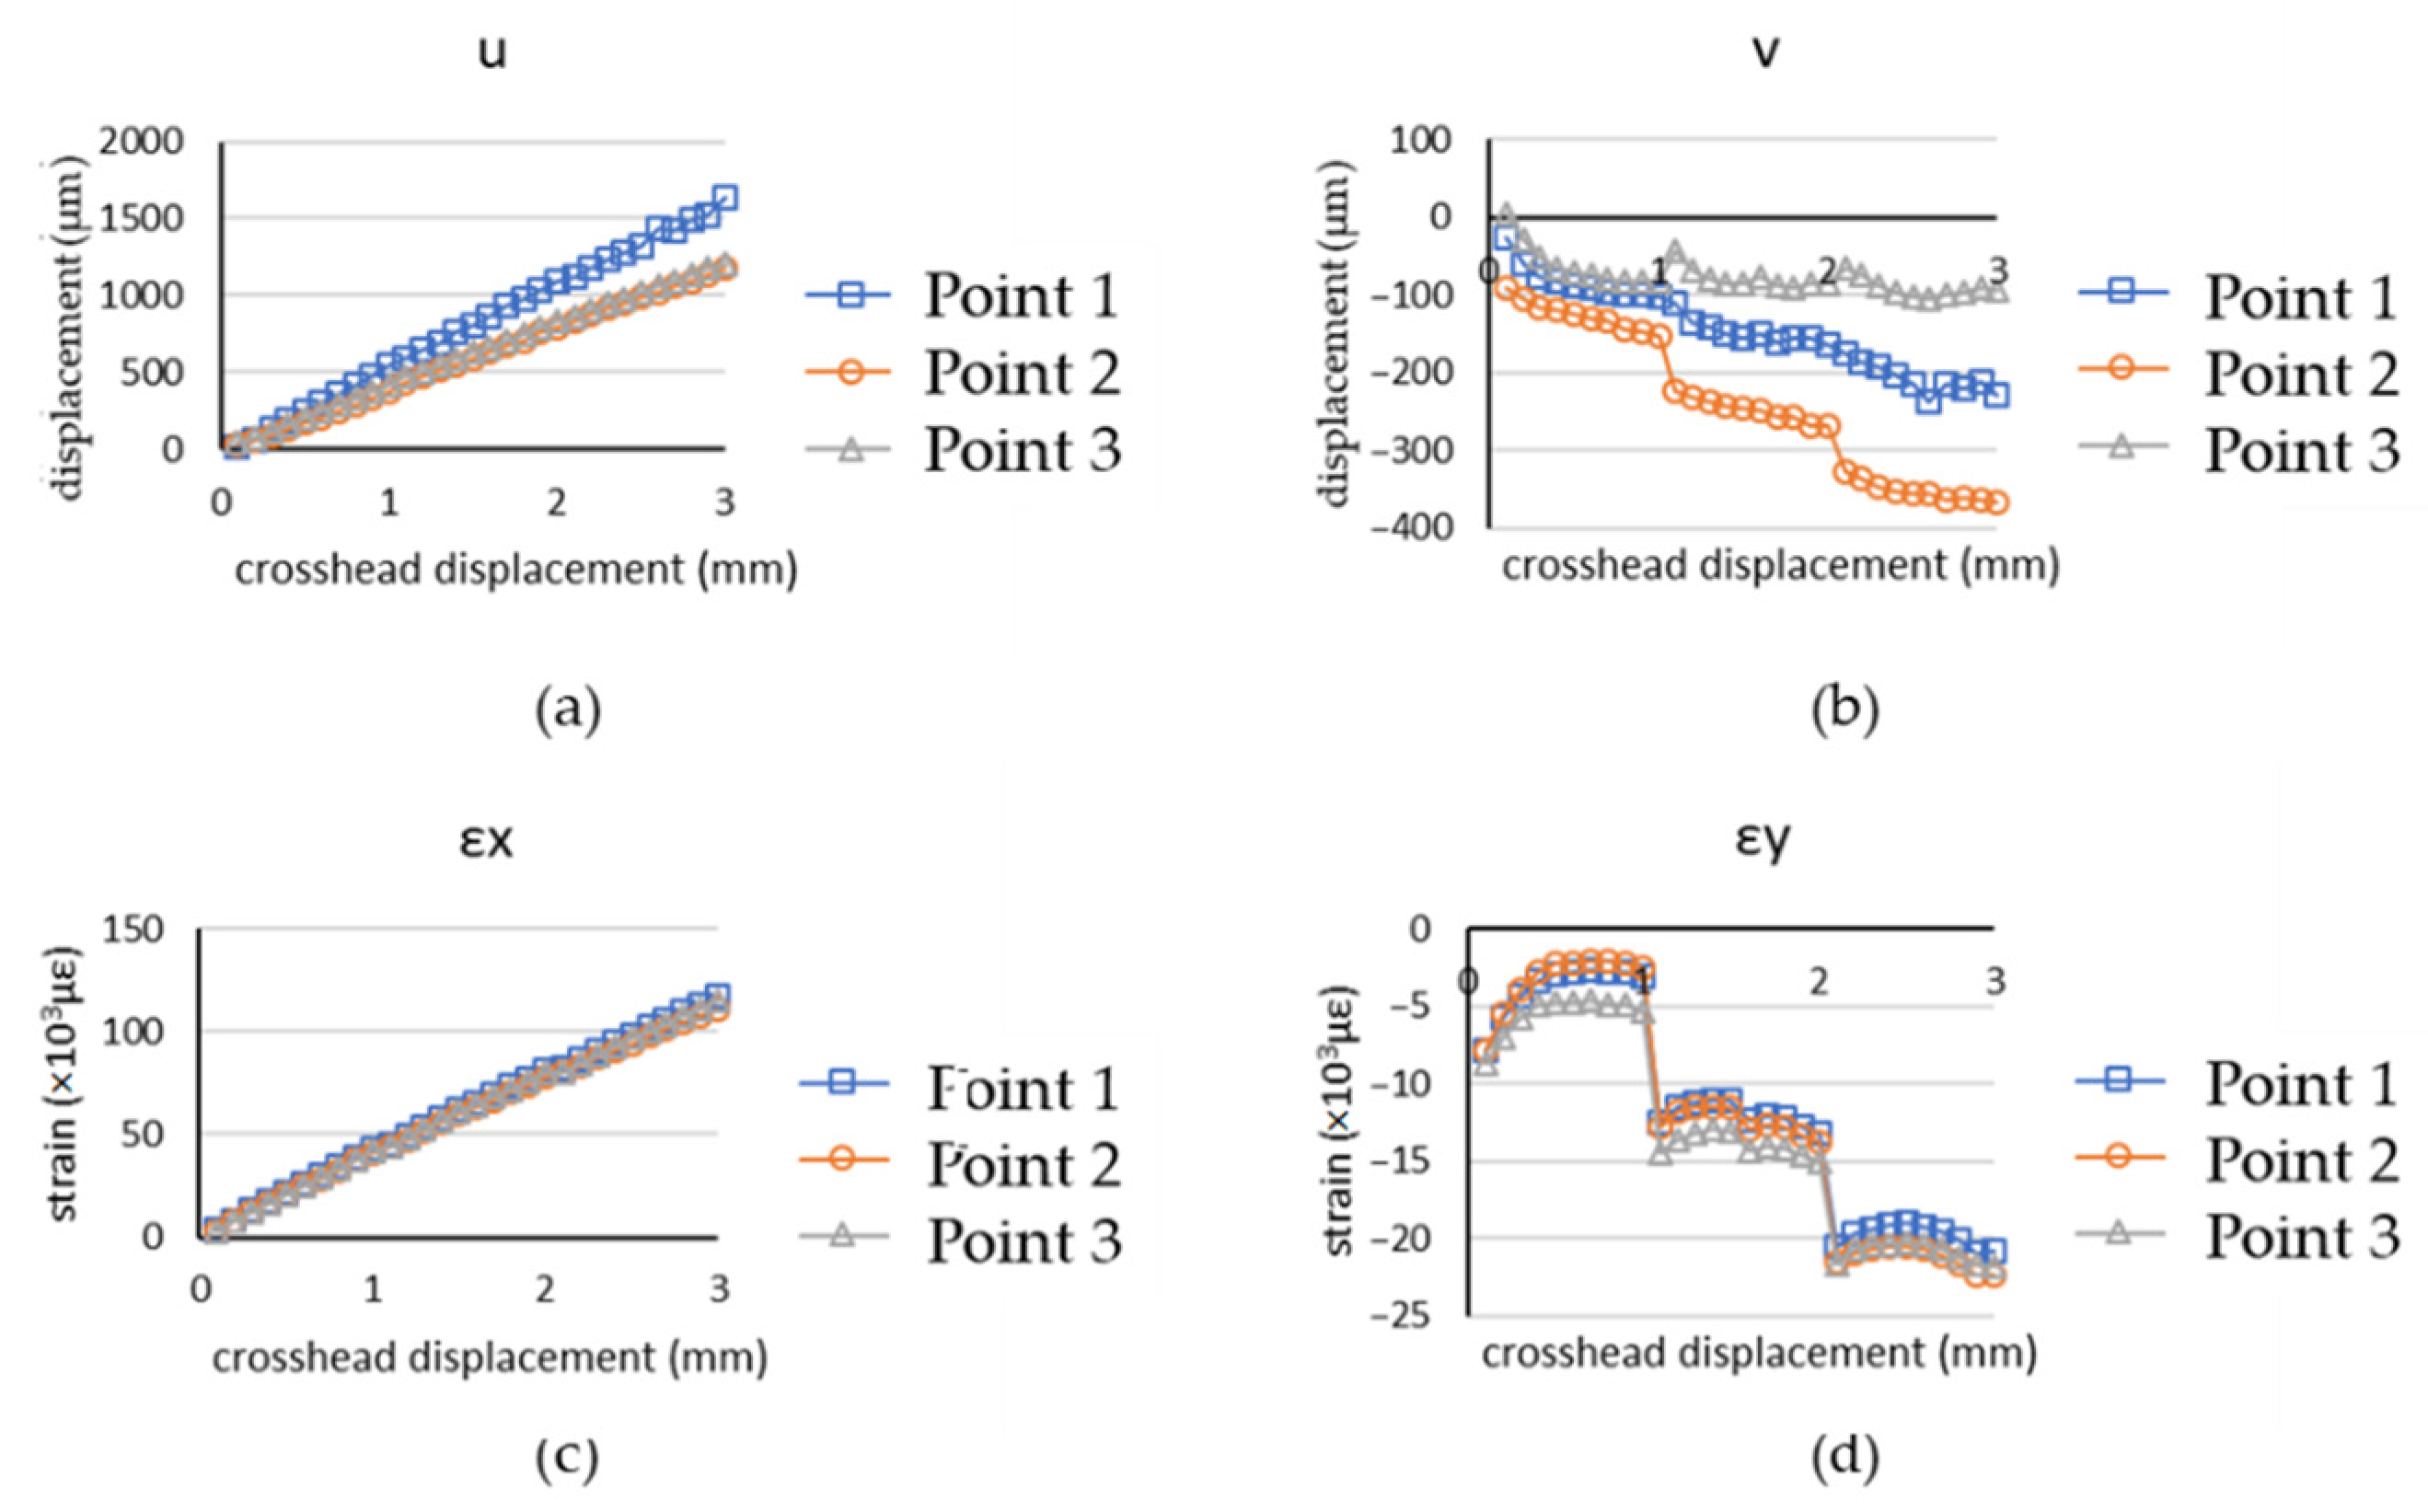
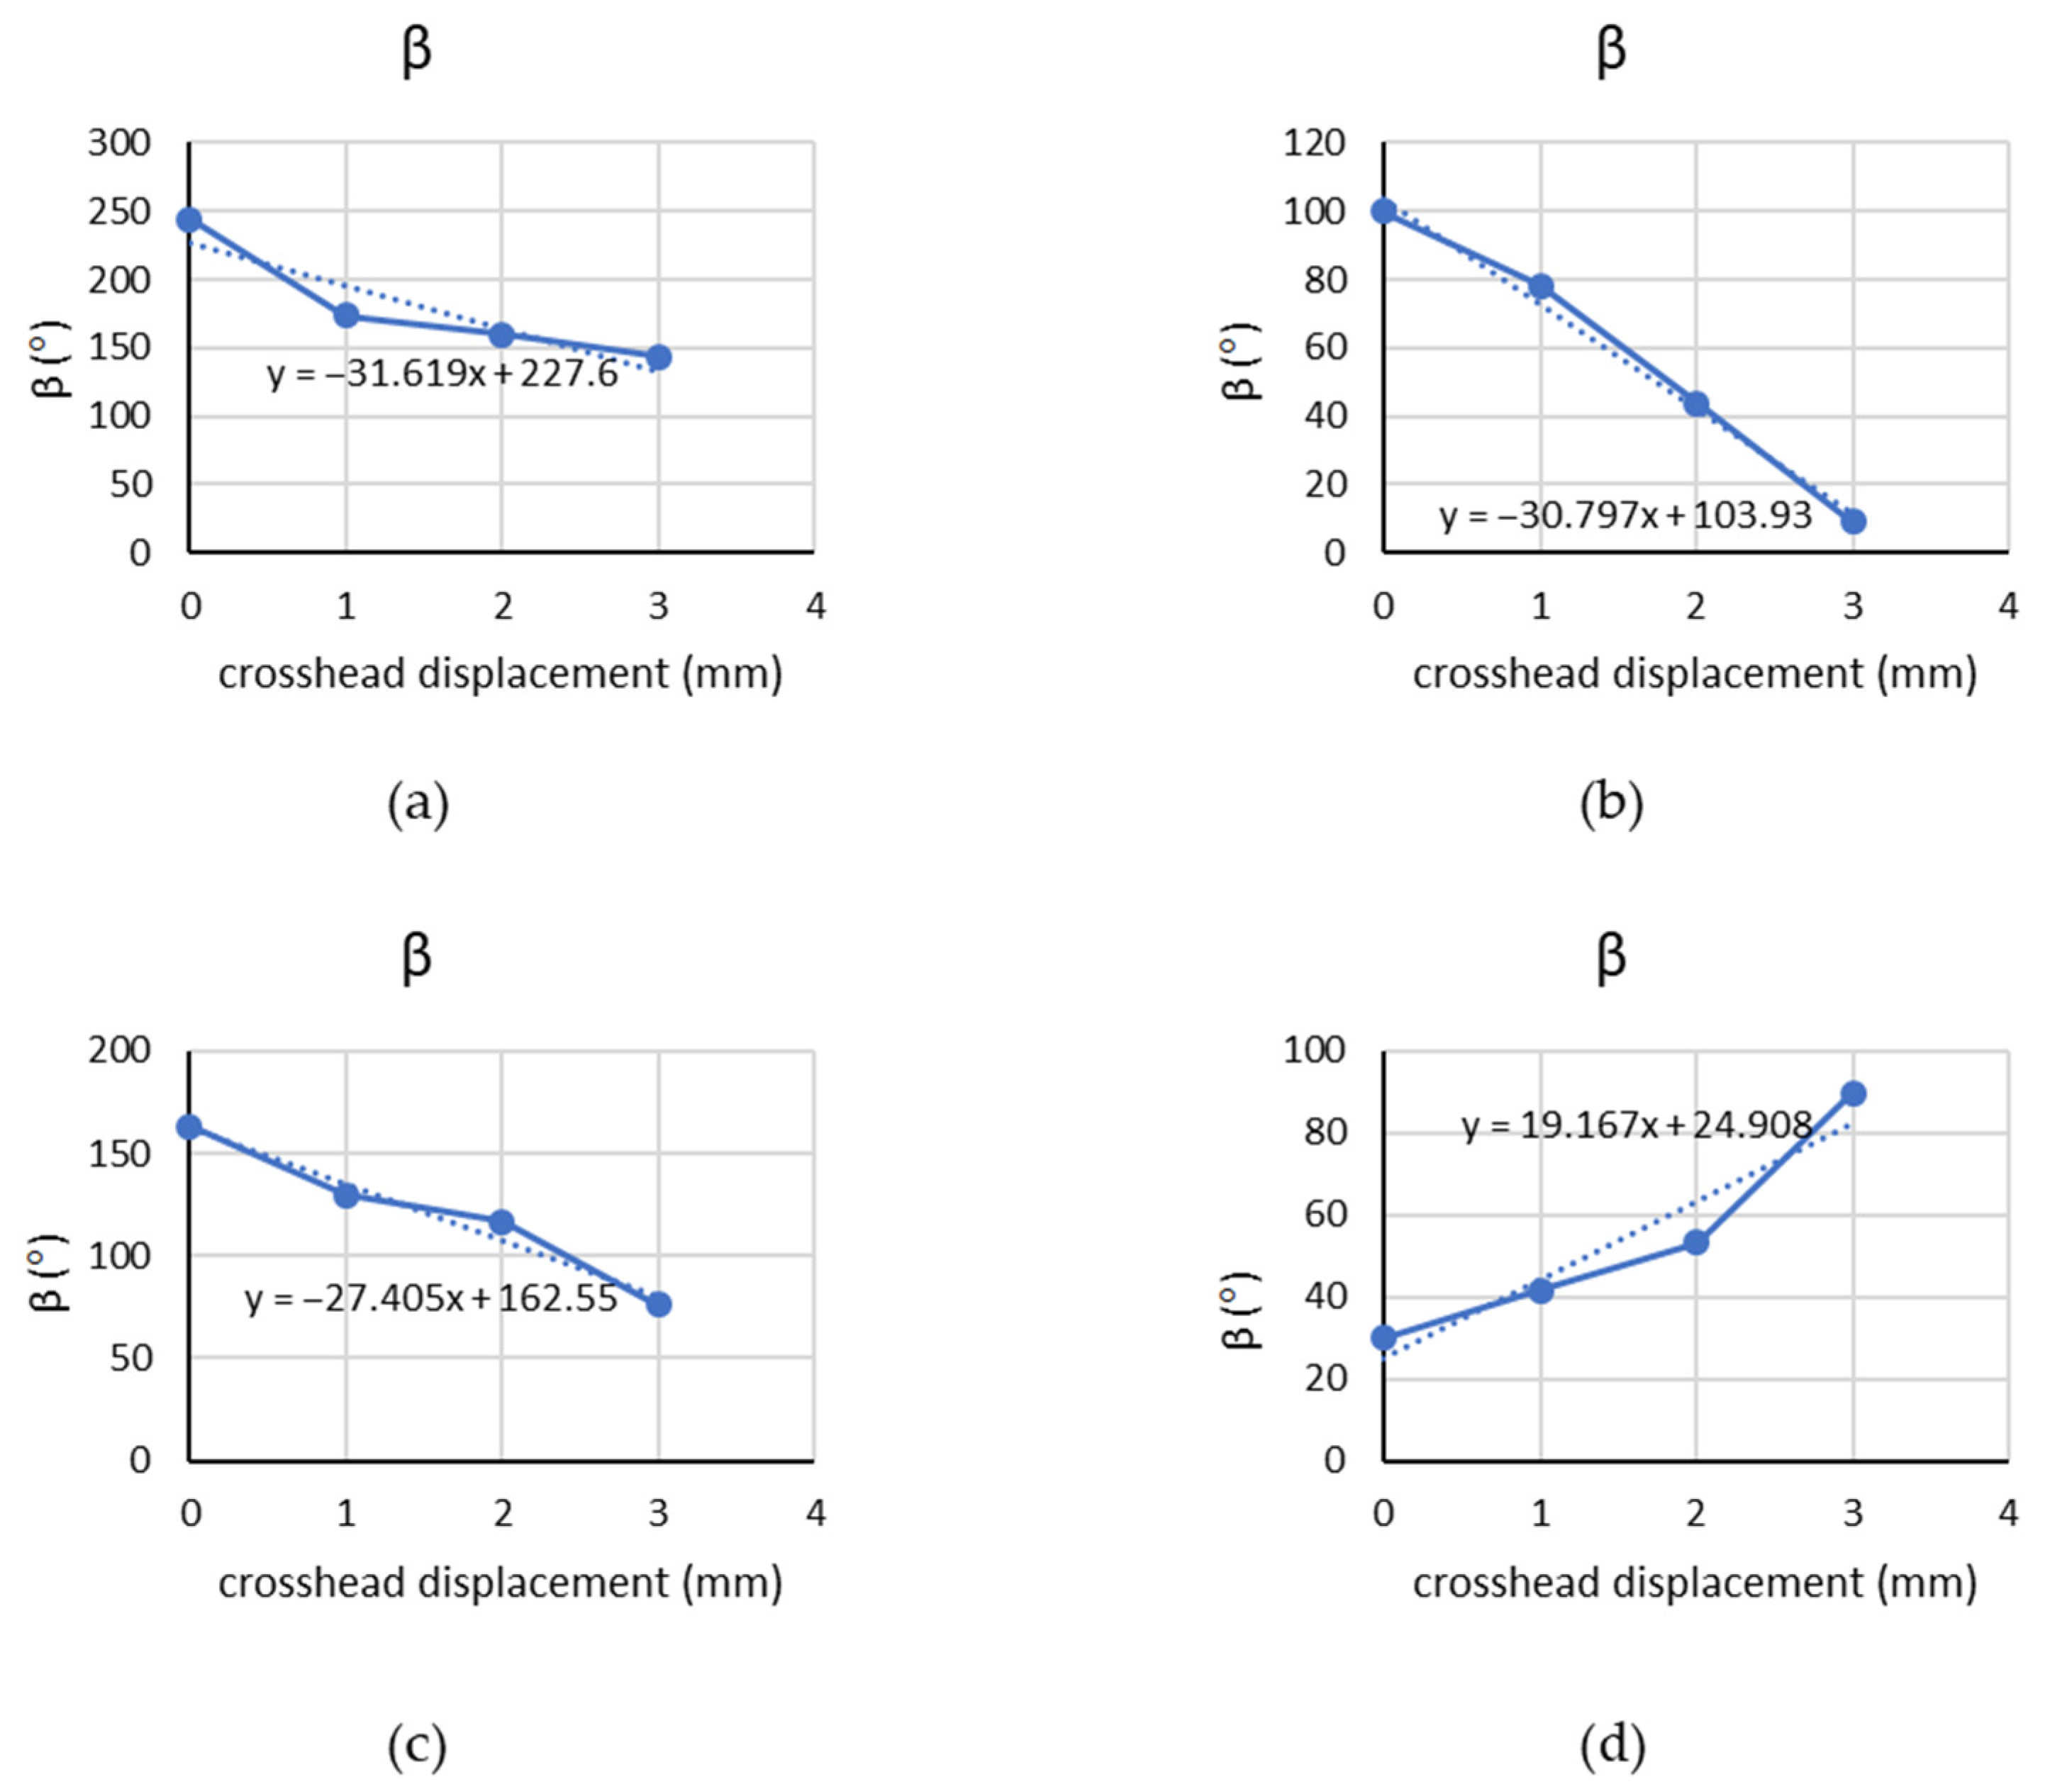
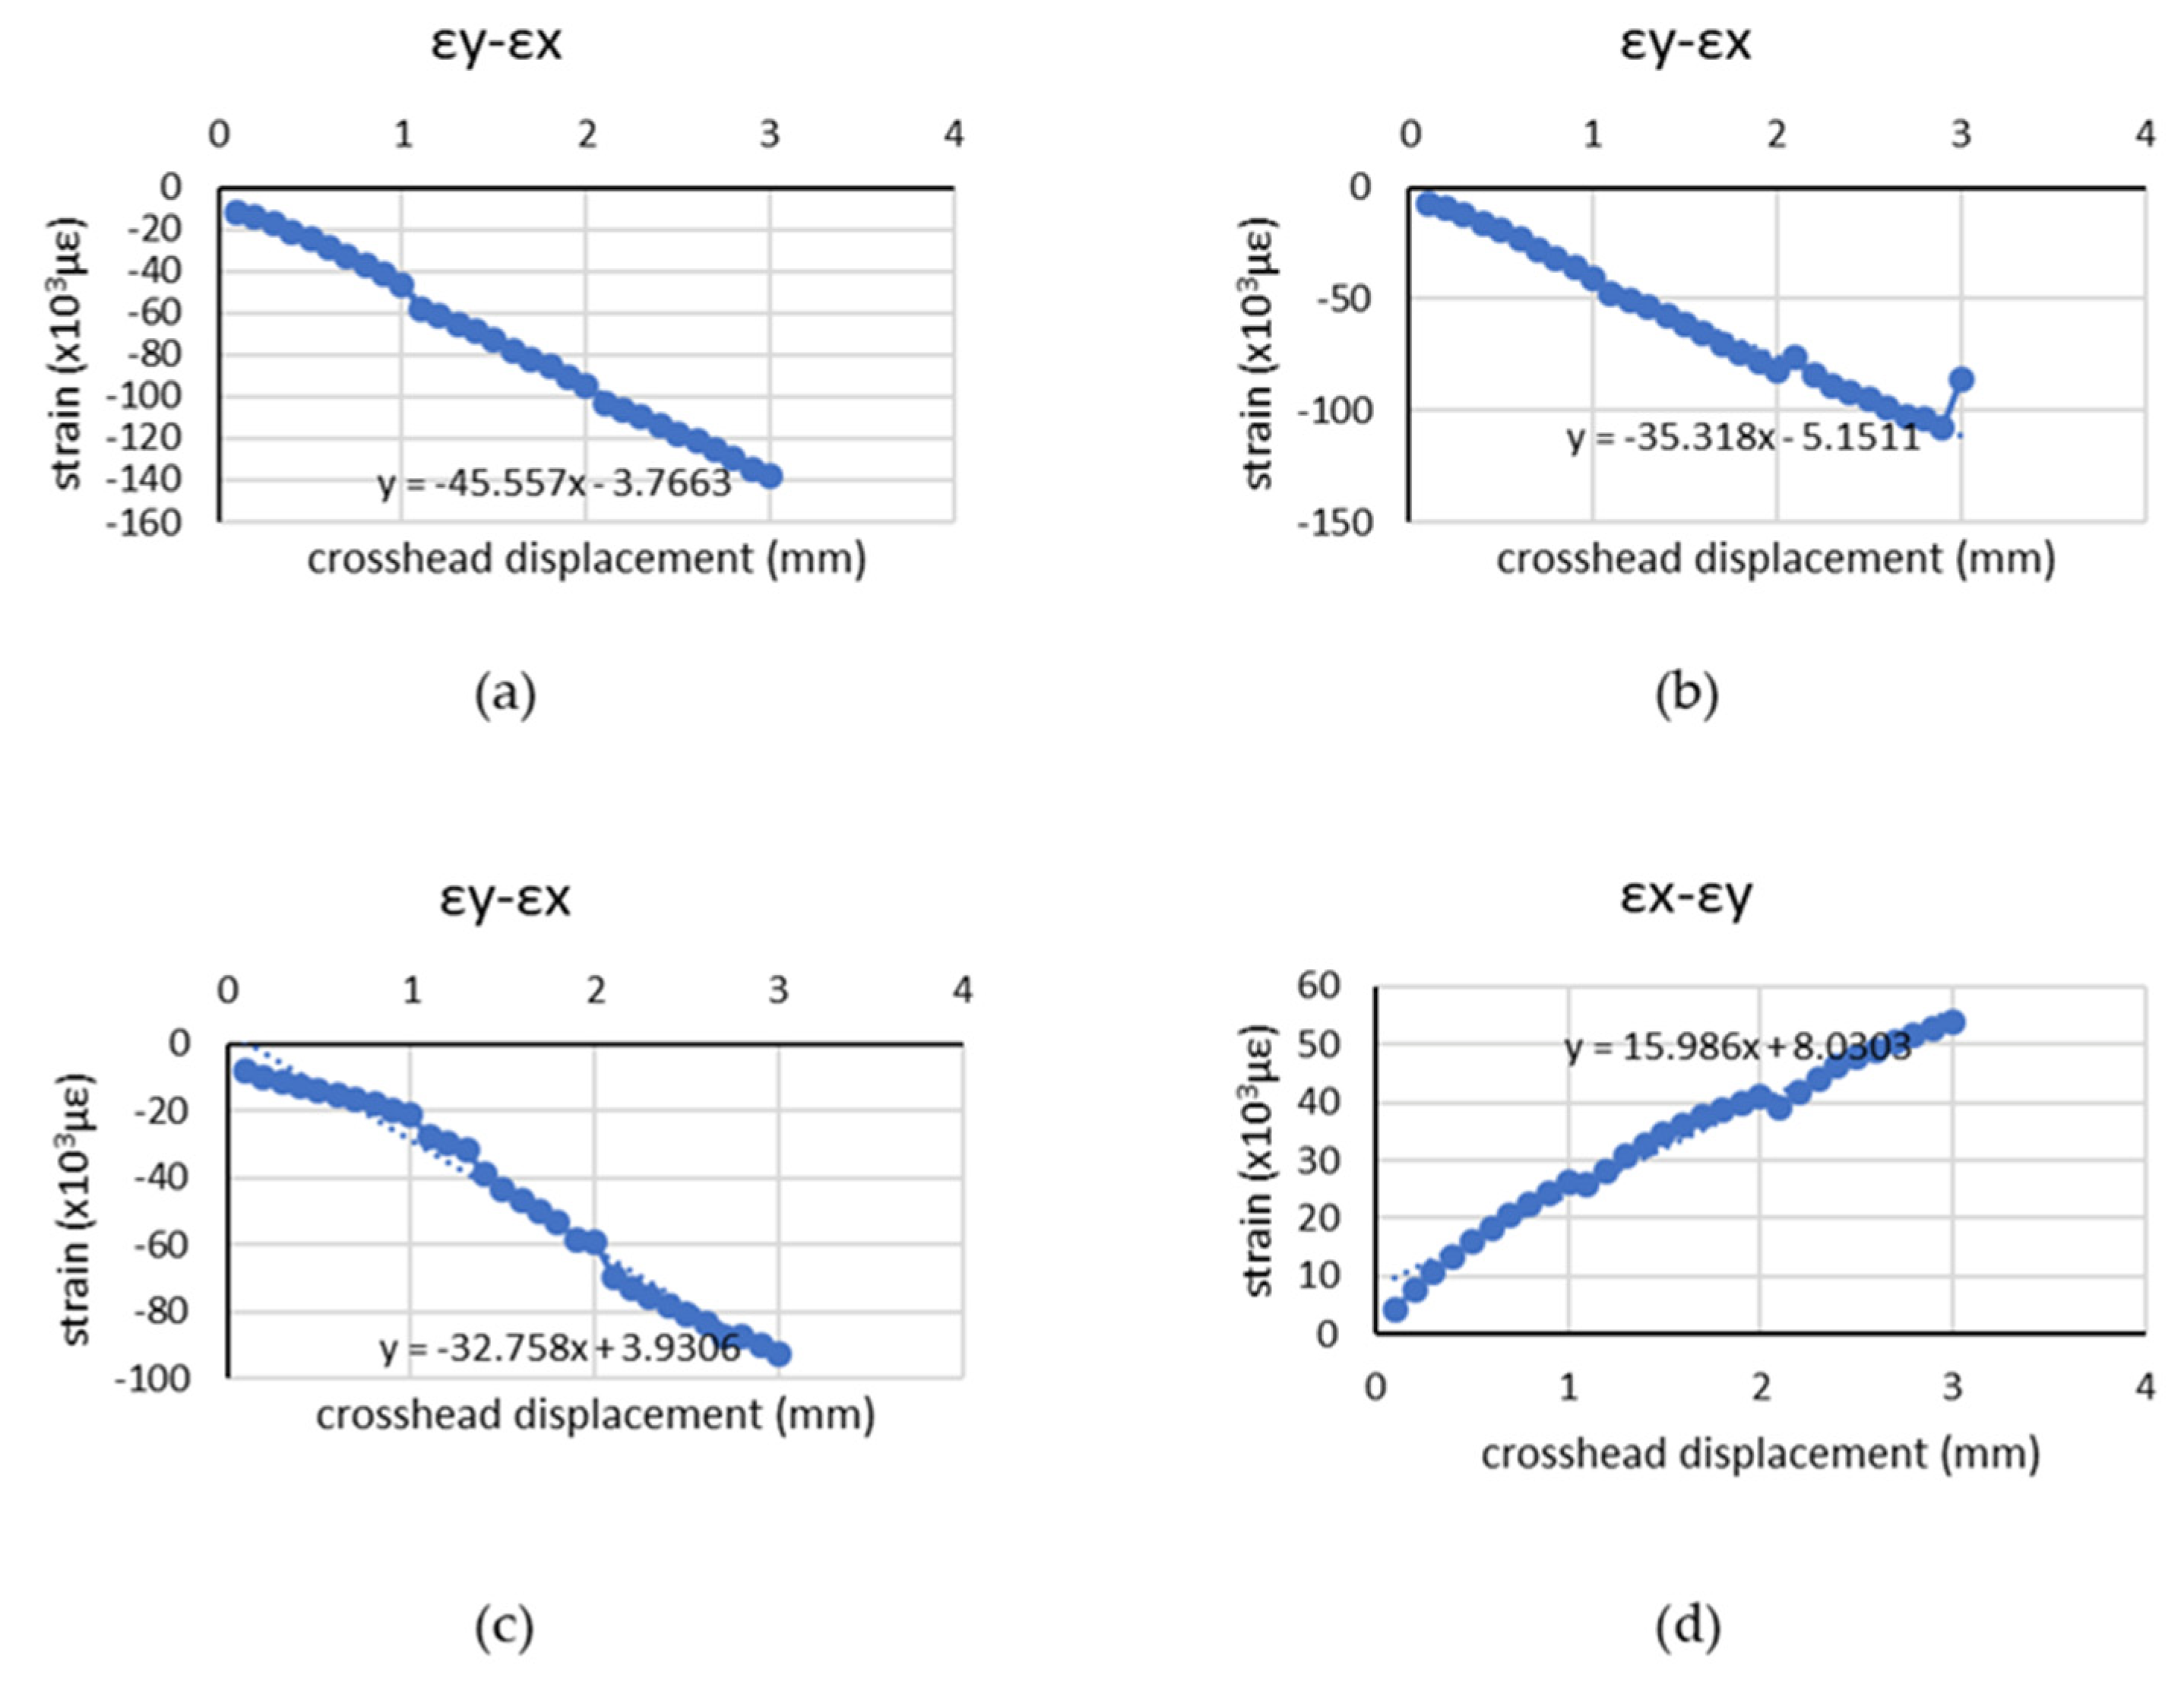
4.2. Chicken Breast Bio-Tissue Tensile Testing

In this experiment, the chicken breast was cut into thin slices and placed on the translation stage, as shown in Figure 11, to perform the rigid body translation test, expecting to verify whether the accuracy of the DIC did not lower when it was used in the chicken breast stretch system. The movement of the translation stage fell between 0–3 mm, and a photo was taken every 0.1 mm. The experimental results are listed in Figure 12. According to the experimental results, the error between the DIC measurement result and the actual displacement value was under 3%.
When the tensile testing was performed, the tensile machine stretched the slices in a horizontal manner. A total of four slices were measured: the first three were stretched along the direction of its texture, and the fourth one was stretched against the direction of its texture. During the DIC analysis, the red box shown in Figure 13 was analyzed as well as the three points in it. Point 1 is the central area where the laser light passes through, and Points 2 and 3 are two random ones in the area. To avoid affecting the measurement of optical parameters, the mixed powder should not be sprayed on the place where the laser light passes through, and the meet should be stretched to a horizontal state in advance. The stretching length fell between 0–1 mm, and a picture was taken every 0.1 mm for DIC measurement.
Figure 14a,b is the first slice to measure the axial and transverse displacements of the three points and the transformed axial and transverse strains. According to the results, the tested chicken breast is a viscoelastic biological material with a range of 1–1.1 mm and 2–2.1 mm. There is a significant change in the transverse strain, which shows that the chicken breast continues to deform during the waiting process, and there is a smaller change in the axial strain, and it is more linear than the transverse strain. During the stretching process, the texture of the chicken meat is not completely parallel to the stretching direction, but shear strain is generated. As shown in Figure 14c,d, the strain ε x is proportional to the displacement of crosshead, but the strain ε y indicates the viscoelastic behavior of tested materials.
After that, optical parameters were measured by a Mueller matrix polarimetry, which was finished in about 15 min. Then, the aforementioned steps were repeated until the sample was stretched to 3 mm. Finally, the deformation measurement results were compared with the obtained linear birefringence which was decoupled by a differential Mueller matrix method [20]. The linear birefringence was the phase difference between fast and slow axis of the linearly polarized light phase retardancy β = k d ( n e n 0 ) , wherein n 0 and n e are the refractive index of the fast and slow axis respectively, d is the thickness of the object, and k is 2 π λ .
Figure 15 shows the linear birefringence results of the biological tissue tensile experiment for four slices of chicken breast tissue in different directions. It is noted that the first three slices were stretched along the direction of its texture, while the fourth one was stretched against the direction of its texture.
The phase difference β is related to the refractive index difference between the fast and slow axis. According to the stress optical law, n 2 n 1 = c ( σ 1 σ 2 ) . The refractive index is related to the stress, which is related to the strain. The ratio of stress to strain is the Young’s modulus of the material. Therefore, axial and transverse strain were subtracted, which was compared with a linear fitting, as shown in Figure 16.
The comparison reveals that the slopes of DIC strain subtraction were ranged in the following order: the first slice > the second slice > the third slice > the fourth slice. The slopes of β were ranged in the same order; the first three slices had negative slopes, while the fourth one had a positive one, which was attributed to the direction of the chicken breast texture, indicating the correlation between the DIC strain measurements and the β value as below:
β = k d ( n e n 0 ) = k d c ( σ 1 σ 2 ) = k d c E ( ε 1 ε 2 )
where n 0 and n e are the refractive indexes of the fast and slow axis, respectively, d represents the thickness of the object, k is 2 π λ , E is the Young’s modulus of the material, and c = C 1 C 2 , which is the relative optic-stress coefficient. As a result, the value of c, the relative optic-stress coefficient can be significantly characterized based upon Equation (19) if the principal angle, α, and linear birefringence, β , are measured by Mueller matrix polarimetry and ( ε 1 ε 2 ) is measured by DIC technique.

5. Conclusions

Using the digital image correlation method to find the deformation of the object, the surface of the object must have appropriate patterns or features to find the deformation or the amount of strain. For chicken breast, it can be sprinkled with black and white uniform powder to achieve the proper characteristics on the surface.
The size of the subset is selected according to the resolution and surface characteristics, and different sizes are needed to achieve the required accuracy. The experimental result shows that when the distance from the specimen is 5 cm, the size of subset size needs 51 × 51 pixels, and the distance from the specimen is 20 cm. It is noted that the size of subset size must be 81 × 81 pixels; the difference in the correlation criteria will also affect it. It shows that ZNSSD outperforms SSD. Using ZNSSD correlation criteria and the distance from the specimen is 5 cm that has the best accuracy, which can reach 0.02 pixels.
In using the DIC system for bio-tissue tensile test, chicken breast is a viscoelastic material and it needed waiting when the optical parameters were measured. During the waiting time, there is a phenomenon of stress relaxation observed. We combine the DIC system with the linear birefringence model in order to locally determine strain-optic relationship. By using this new system, the chicken breast bio-tissue tensile test was conducted successfully. It can also be observed that the difference between the axial strain and transverse strain is related to the linear birefringence parameter.

Author Contributions

Conceptualization, T.Y.-F.C., Y.-L.L. and M.-T.L.; Data curation, N.M.D., Z.-Y.W., L.-W.C. and Y.-L.L.; Formal analysis, T.Y.-F.C., N.M.D., L.-W.C., W.-Y.K. and Y.-L.L.; Funding acquisition, T.Y.-F.C.; Investigation, T.Y.-F.C., N.M.D., Z.-Y.W., L.-W.C., W.-Y.K., Y.-L.L. and M.-T.L.; Methodology, T.Y.-F.C., Z.-Y.W., W.-Y.K., Y.-L.L. and M.-T.L.; Resources, M.-T.L.; Software, T.Y.-F.C. and L.-W.C.; Supervision, M.-T.L.; Validation, T.Y.-F.C., Z.-Y.W., L.-W.C., Y.-L.L. and M.-T.L.; Visualization, Y.-L.L.; Writing—original draft, T.Y.-F.C.; Writing—review & editing, N.M.D., Z.-Y.W., W.-Y.K., Y.-L.L. and M.-T.L. All authors have read and agreed to the published version of the manuscript.

Funding

This work was support by the Ministry of Science and Technology, Taiwan under MOST 105-2221-E-006-078.

Institutional Review Board Statement

Not applicable.

Informed Consent Statement

Not applicable.

Data Availability Statement

Data sharing is not applicable to this article.

Conflicts of Interest

The authors declare no conflict of interest.

References

  1. Freddi, A.; Olmi, G.; Cristofolini, L. Experimental Stress Analysis for Materials and Structures: Stress Analysis Models for Developing Design Methodologies; Springer: Cham, Switzerland, 2015; pp. 172–175. [Google Scholar]
  2. Post, D.; Han, B. Handbook on Experimental Mechanics; Springer: Boston, MA, USA, 2008; Moiré Interferometry; pp. 627–654. [Google Scholar]
  3. Sutton, M.A.; Orteu, J.J.; Schreier, H.W. Image Correlation for Shape, Motion and Deformation Measurements; Springer Science + Business Media: New York, NY, USA, 2009; pp. 7–10. [Google Scholar]
  4. Sutton, M.A.; Wolters, W.J.; Peters, W.H.; Ranson, W.F.; McNeill, S.R. Determination of displacements using an improved digital correlation method. Image Vis. Comput. 1983, 1, 133–139. [Google Scholar] [CrossRef]
  5. Sutton, M.A.; Cheng, M.; Peters, W.H.; Chao, Y.J.; McNeill, S.R. Application of an optimized digital correlation method to planar deformation analysis. Image Vis. Comput. 1986, 4, 143–150. [Google Scholar] [CrossRef]
  6. Sutton, M.A.; McNeill, S.R.; Jang, J.; Babai, M. Effects of Subpixel Image Restoration On Digital Correlation Error Estimates. Opt. Eng. 1988, 27, 271070. [Google Scholar] [CrossRef]
  7. Tong, W. An Evaluation of Digital Image Correlation Criteria for Strain Mapping Applications. Strain 2005, 41, 167–175. [Google Scholar] [CrossRef]
  8. Pan, B.; Asundi, A.; Xie, H.; Gao, J. Digital image correlation using iterative least squares and pointwise least squares for displacement field and strain field measurements. Opt. Laser. Eng. 2009, 47, 865–874. [Google Scholar] [CrossRef]
  9. Pan, B.; Yu, L.; Wu, D.; Tang, L. Systematic errors in two-dimensional digital image correlation due to lens distortion. Opt. Laser. Eng. 2013, 51, 140–147. [Google Scholar] [CrossRef]
  10. Gao, Z.; Desai, J.P. Estimating zero-strain states of very soft tissue under gravity loading using digital image correlation. Med. Image Anal. 2010, 14, 126–137. [Google Scholar] [CrossRef] [Green Version]
  11. Luyckx, T.; Verstraete, M.; Roo, K.D.; Waele, W.D.; Bellemans, J.; Victor, J. Digital image correlation as a tool for three-dimensional strain analysis in human tendon tissue. J. Exp. Orthop. 2014, 1, 7. [Google Scholar] [CrossRef] [Green Version]
  12. Laura, C.S.; Darryl, G.T. The use of 2D ultrasound elastography for measuring tendon motion and strain. J. Biomech. 2014, 47, 750–754. [Google Scholar] [CrossRef] [Green Version]
  13. Luyckx, T.; Verstraete, M.; De Roo, K.; Dewaele, W.; Victor, J.; Bellemans, J. The effect of single radius TKA implantation and joint line proximalisation on the strain pattern in the sMCL of the knee. Orthop. Proc. 2013, 95, 401. [Google Scholar]
  14. Spencer, M.; Siegmund, T.; Mongeau, L. Determination of superior surface strains and stresses, and vocal fold contact pressure in a synthetic larynx model using digital image correlation. J. Acoust. Soc. Am. 2008, 123, 1089–1103. [Google Scholar] [CrossRef] [Green Version]
  15. Rizzuto, E.; Carosio, S.; Del Prete, Z. Characterization of a Digital Image Correlation System for Dynamic Strain Measurements of Small Biological Tissues. Exp. Tech. 2016, 40, 743–753. [Google Scholar] [CrossRef]
  16. Chuda-Kowalska, M.; Gajewski, T.; Garbowski, T. Mechanical characterization of orthotropic elastic parameters of a foam by the mixed experimental-numerical analysis. J. Theor. Appl. Mech. 2015, 53, 383–394. [Google Scholar] [CrossRef] [Green Version]
  17. Chen, T.Y.F.; Chen, T.C.; Cheng, F.Y.; Tsai, A.T.; Lin, M.T. Digital image correlation of SEM images for surface deformation of CMOS IC. Microelectron. Eng. 2018, 201, 16–21. [Google Scholar] [CrossRef]
  18. Cheong, W.F.; Prahl, S.A.; Welch, A.J. A review of the optical properties of biological tissues. IEEE J. Quantum Electron. 1990, 26, 2166–2185. [Google Scholar] [CrossRef] [Green Version]
  19. Liao, R.; Zeng, N.; Jiang, X.; Li, D.; Yun, T.; He, Y.; Ma, H. Rotating linear polarization imaging technique for anisotropic tissues. J. Biomed. Opt. 2010, 15, 036014. [Google Scholar] [CrossRef] [PubMed] [Green Version]
  20. Wood, M.F.; Ghosh, N.; Wallenburg, M.A.; Li, S.H.; Weisel, R.D.; Wilson, B.C.; Li, R.K.; Vitkin, I.A. Polarization birefrin-gence measurements for characterizing the myocardium, including healthy, infarcted, and stem-cell-regenerated tissues. J. Biomed. Opt. 2010, 15, 047009. [Google Scholar] [CrossRef] [Green Version]
  21. Chen, H.W.; Huang, C.L.; Lo, Y.L.; Chang, Y.R. Analysis of optically anisotropic properties of biological tissues under stretching based on differential Mueller matrix formalism. J. Biomed. Opt. 2017, 22, 035006. [Google Scholar] [CrossRef]
  22. Chen, D.; Zeng, N.; Liu, C.; Ma, H. Characterization of muscle stretching and damage using polarization-sensitive optical coherence tomography (PS-OCT). In SPIE 8553, Optics in Health Care and Biomedical Optics V; Society of Photo-Optical Instrumentation Engineers: Bellingham, WA, USA, 2012. [Google Scholar] [CrossRef]
  23. Szczurowski, M.K.; Martynkien, T.; Statkiewicz-Barabach, G.; Urbanczyk, W.; Khan, L.; Webb, D.J. Measurements of stress-optic coefficient in polymer optical fibers. Opt. Lett. 2010, 35, 2013–2015. [Google Scholar] [CrossRef] [Green Version]
  24. Bertholds, A.; Dandliker, R. Determination of the individual strain-optic coefficients in single-mode optical fibres. J. Light. Technol. 1988, 6, 17–20. [Google Scholar] [CrossRef]
  25. Chen, T.Y.F.; Chou, Y.C.; Wang, Z.Y.; Lin, W.Y.; Lin, M.T. Using Digital Image Correlation on SEM Images of Strain Field after Ion Beam Milling for the Residual Stress Measurement of Thin Films. Materials 2020, 13, 1291. [Google Scholar] [CrossRef] [PubMed] [Green Version]
  26. Pan, B.; Xie, H.; Guo, Z.; Hua, T. Full-field strain measurement using a two-dimensional Savitzky-Golay digital differentiator in digital image correlation. Opt. Eng. 2007, 46, 062001. [Google Scholar] [CrossRef]
  27. Farid, H.; Popescu, A.C. Blind Removal of Lens Distortion. J. Opt. Soc. Am. A 2001, 18, 2072–2078. [Google Scholar] [CrossRef] [Green Version]
  28. Dally, J.W.; Riley, W.F. Experimental Stress Analysis, 4th ed.; College House Enterprises LLC: Knoxville, TN, USA, 2005. [Google Scholar]
  29. Pham, T.T.H.; Lo, Y.L. Extraction of effective parameters of anisotropic optical materials using a decoupled analytical method. J. Biomed. Opt. 2012, 17, 025006. [Google Scholar] [CrossRef] [PubMed]
  30. Chenault, D.B.; Chipman, R.A. Measurements of linear diattenuation and linear retardance spectra with a rotating sample spectropolarimeter. Appl. Opt. 1993, 32, 3513–3519. [Google Scholar] [CrossRef] [PubMed]
  31. Chenault, D.B.; Chipman, R.A. Infrared birefringence spectra for cadmium-sulfide and cadmium selenide. Appl. Opt. 1993, 32, 4223–4227. [Google Scholar] [CrossRef]
  32. Chenault, D.B.; Chipman, R.A.; Lu, S.Y. Electro-optic coefficient spectrum of cadmium telluride. Appl. Opt. 1994, 33, 7382–7389. [Google Scholar] [CrossRef]
  33. Sornsin, E.A.; Chipman, R.A. Visible Mueller matrix spectropolarimetry. In SPIE 3121, Polarization: Measurement, Analysis, and Remote Sensing; Society of Photo-Optical Instrumentation Engineers: Bellingham, WA, USA, 1997. [Google Scholar] [CrossRef]
Figure 1. Schematic diagram of object positions (a) the position before deformation; (b) the position after deformation [18,25].
Coatings 11 00924 g001
Figure 2. Schematic diagram of image distortion [27].
Coatings 11 00924 g002
Figure 3. Rotating quarter waveplate method for measuring Stokes parameters [20].
Coatings 11 00924 g003
Figure 4. Experimental setup used to select subset sizes, correct image distortion, and perform rigid body translation.
Coatings 11 00924 g004
Figure 5. Experimental setup for biological tissue tensile testing.
Coatings 11 00924 g005
Figure 6. Image for the selection of subset sizes, image distortion correction, and rigid body translation.
Coatings 11 00924 g006
Figure 7. Image of white spot markers randomly sprayed on the chicken breast bio-tissue sample.
Coatings 11 00924 g007
Figure 8. Flow chart of the DIC method.
Coatings 11 00924 g008
Figure 9. Comparison of average abs. errors under different criteria for (a) 5 cm, (b) 10 cm, (c) 15 cm, (d) 20 cm.
Coatings 11 00924 g009
Figure 10. Comparison of standard deviations under different criteria for (a) 5 cm, (b) 10 cm, (c) 15 cm, (d) 20 cm.
Coatings 11 00924 g010
Figure 11. Image of bio-tissue rigid body translation experiment.
Coatings 11 00924 g011
Figure 12. Displacement measurement results of bio-tissue rigid body plane (a) measurement displacement result (b) average absolute error (c) percentage error.
Coatings 11 00924 g012
Figure 13. Analysis area of biological tissue. Point 1 is the central area where the laser light passes through; Points 2 and 3 are two random ones in the area.
Coatings 11 00924 g013
Figure 14. Results of biological tissue tensile testing (a) axial displacement, (b) transverse displacement, (c) axial strain, (d) transverse strain.
Coatings 11 00924 g014
Figure 15. Optical measurement results of the biological tissue tensile experiment for (a) the first slice, (b) the second slice, (c) the third slice, and (d) the fourth slice.
Coatings 11 00924 g015
Figure 16. Axial and transverse strain subtracted linear fitting of biological tissue tensile experiment for (a) the first slice, (b) the second slice, (c) the third slice, and (d) the fourth slice.
Coatings 11 00924 g016
Publisher’s Note: MDPI stays neutral with regard to jurisdictional claims in published maps and institutional affiliations.

