Article

Experimental Study of the Influence of Deposition of Multilayer CrN/CrCN PVD Coating on Austenitic Steel on Resistance to Cavitation Erosion

1
Institute of Fluid Flow Machinery, Polish Academy of Sciences, Fiszera 14, 80-231 Gdansk, Poland
2
Faculty of Technology and Education, Koszalin University of Technology, Śniadeckich 2, 75-453 Koszalin, Poland
3
Faculty of Mechanical Engineering, Gdańsk University of Technology, 11/12 Narutowicza, 80-233 Gdansk, Poland
*
Author to whom correspondence should be addressed.
Coatings 2020, 10(5), 487; https://doi.org/10.3390/coatings10050487
Submission received: 12 March 2020 / Revised: 1 April 2020 / Accepted: 15 May 2020 / Published: 19 May 2020
(This article belongs to the Special Issue Erosion of Nanostructured Coatings)

Abstract

:
The impact of deposition of multilayer CrN/CrCN coating on X6CrNiTi18-10 steel by means of the PVD (physical vapour deposition) method on resistance to cavitation erosion has been investigated. Cavitation tests were performed using a cavitation chamber with a barricade system at the inlet pressure p1 = 600 kPa and the outlet pressure p2 = 123 kPa. Deposition of CrN/CrCN coating allowed increasing duration of the incubation period and decreasing cumulative volume loss until 500 min of exposure. The erosion of the CrN/CrCN–X6CrNiTi18-10 system begins with the removal of microdroplets from the coating surface and surface undulation. The surface undulation increases with the exposure time leading to coating fracture in a brittle mode. Initiation sites of cracks were located inside the PVD coating. Measurements of surface roughness illustrate uneven degradation of the exposed surface and the location of slight and severe erosion zones. The Ra parameters obtained for the CrN/CrCN–X6CrNiTi18-10 system and X6CrNiTi18-10 steel after 180 min of erosion were comparable. An elongation of erosion test up to 600 min resulted in a higher increase in surface roughness of the CrN/CrCN coating–X6CrNiTi18-10 steel system in comparison to that of X6CrNiTi18-10 steel. With increasing exposition time, the rate of increase of the surface roughness decreased due to overlapping damage.

1. Introduction

Cavitation erosion is a serious problem of hydraulic equipment leading to a decrease of its efficiency and an increase in maintenance costs. For this reason, the design of hydrodynamic devices is modified to reduce the risk of cavitation erosion occurrence. However, complete elimination of cavitation erosion is not always possible. Hence, it is important to use erosion-resistant materials. Due to the limited applicability of the models developed so far, the selection of such materials is mainly based on experimental tests. In order to decrease the duration of the erosion tests, a specialist laboratory apparatus generates cavitation of high aggressiveness, e.g., a vibration testing device and cavitating jet apparatus [1]. Investigations performed in such laboratories have shown that implosions of cavitation bubbles cause materials to be subjected to high local compression followed by inertially driven tension [2]. Compressive strains of the order of 0.25 to 0.5 are localized on the area of 0.18 mm2 or less and act over a very short time period, less than 24 μs [2]. On the other side, investigations of Smith and Kinslow have shown that a rise time of pressure peak is approximately 3 μs and the decay time is of approximately 5 μs [3]. Bourne has found that a jet travelling at 400 m/s penetrates a solid surface at a constant speed of approximately 200 m/s and the duration of the jet’s impact is several μs [4]. These exceptional material loading conditions, i.e., very short impact time, and very high velocity and pressure of liquid jet penetration mean the experimental investigations in laboratories take several hours rather than several months or years. However, in real hydraulic equipment cavitation intensity is much lower than that in the laboratory test devices. For this reason, tests carried out with the use of apparatus enabling the regulation of cavitation intensity, in particular enabling tests at low cavitation intensity, are extremely desirable.
A material’s resistance to cavitation erosion depends on its mechanical and endurance properties [5,6,7,8]. The most important ones are fatigue strength and hardness [8,9,10,11,12]. Therefore, technologies which allow increasing hardness, especially hardness of the surface layer, are used to improve the resistance of the material to cavitation erosion. Such technologies include modification of the surface layer by laser processing [13,14] as well as production of hard coatings [15,16,17]. Among the various technologies for the production of hard coatings, the PVD (physical vapour deposition) method arouses particular interest because it allows the deposition of coatings with special properties. The properties of PVD coatings depend on the deposited compound and its thickness in the monolayer coating or compounds, the number of layers, and their thickness forming the multilayer coating. In the case of nitride, carbon nitride and DLC (diamond-like carbon) coatings, PVD coatings are characterized by high hardness and Young’s modulus, good wear and cavitation erosion resistance [18,19]. Despite hard coatings, the PVD method also allows high-reflection optical thin film to be produced, whose hardness is much lower than 1 GPa [20]. In the case of hard PVD coatings, their deposition can improve fatigue strength [21,22,23]. However, in some cases, especially when there is a big difference in hardness between the substrate and the coating, a decrease in fatigue strength is obtained [22,24]. An increase in hardness (H) and Young’s modulus (E) lead to an increase in resistance to plastic deformation. As a measure of this resistance, the ratios of H/E (resistance to deformation relative to yielding) or H3/E2 (resistance to the plastic indentation) are used [25,26]. By increasing these ratios, material stiffness increases.
Material endurance depends on deformation rate. The standard tests are performed at quasi-static conditions. However, under real conditions, the rate of deformation varies widely. With an increase in loading speed, the risk of rapid coating fracture increases. In the case of hard PVD coatings, e.g., nitride, oxides and DLC coatings, the risk of rapid degradation is related to their ability to withstand impact energy and a mode of crack development. This risk increases with increasing coating stiffness. According to [5,27], the impact velocity increases with increasing cavitation intensity. This promotes the development of a brittle fracture and results in a decrease in cavitation erosion resistance.
Due to high importance in potential applications of PVD coatings in hydraulic equipment, comparison of erosion resistance of PVD coatings obtained at various cavitation intensities is particularly significant. This article refers to a previous study [28], in which the cavitation erosion resistance of CrN/CrCN multilayer coating was investigated at the inlet pressure of 700 kPa and the outlet pressure 125 kPa. It was shown there that cavitation loading caused rapid degradation of this coating due to its low resistance to plastic deformation (high H/E ratio) and a brittle mode of the fractures.
The purpose of this article is to examine an effect of a decrease of cavitation intensity on the protective properties of the CrN/CrCN coating deposited on X6CrNiTi18-10 steel to cavitation erosion, especially on the incubation period duration and on the erosion rate. Because the inlet pressure affects cavitation intensity [29], the CrN/CrCN coating deposited on austenitic steel was tested at the inlet pressure of 600 kPa and the outlet pressure of 123 kPa. The results obtained were compared with those from [28]. Taking into account that cavitation intensity in hydraulic machinery is lower than in experimental investigations in laboratories, the aim of this paper is important for practical applications of a CrN/CrCN multilayer coating. In addition, the degradation process was investigated in detail, an in particular the state of the coating after 180 min of erosion was compared with the coating state after 600 min of erosion.

2. Experiment

2.1. Substrate

X6CrNiTi18-10 stainless steel has been used as a substrate. Before coating deposition, substrate specimens (45 mm × 26 mm × 14 mm) have been subjected to quenching at 1050 °C. The properties of X6CrNiTi18-10 stainless steel are presented in Table 1. Before the cavitation test, the specimens were mirror polished with diamond paste.

2.2. Coating

The CrN/CrCN multilayer coating was deposited on X6CrNiTi18-10 stainless steel substrate by using the cathodic arc evaporation (CAE) method in the conventional multi-arc PVD system in the Koszalin University of Technology. The substrates were subjected to ultrasonic-aided cleaning with alkaline detergents, rinsed twice in deionized water and dried with compressed air. Next, they were placed in the vacuum chamber. The parameters of coating deposition are shown in Table 2. A pure (99.98%) chromium disc was used as a target material. Reaction gases, nitrogen and acetylene (for formation of the CrCN layer), were introduced near the cathode in order to increase the density of plasma. The CrCN/CrN coating was composed of six bi-layers with a single layer thickness ratio of 1:1. The flow rate of acetylene was matched to obtain 10 at.% of carbon content in the CrCN layer. In order to ensure proper adherence of the coating to the substrate, a thin chromium sub-layer of ~0.1 μm thick was initially deposited. The CrN and CrCN layers were deposited alternately, starting with the CrN layer. A top layer coating was the CrCN layer. The thicknesses of the CrN + CrCN bilayer (so called bilayer period) and the multilayer coating were determined using ball cratering test (Calotest) method. The thickness of the entire CrN/CrCN coating was 4.3 ± 0.2 µm, while the thickness of the bilayer period was approximately 700 nm. According to [30], density of the coating is taken as 6.18 g/cm3. Some of the substrate specimens have been left uncoated, and later used as the reference ones.
Hardness and Young’s modulus were measured with a Hardness Tester Fischerscope HM2000 (Fischer Technology Inc., Windsor, CT, USA) equipped with Berkovich indenter. In order to eliminate an impact of the substrate on coating hardness measurements, the indentation depth must not exceed 10% of the entire coating thickness [31,32]. Due to the coating thickness of 4.3 ± 0.2 µm, the maximum indentation depth of 300 nm has been applied. The hardness and Young’s modulus of the CrN/CrCN multilayer coatings produced for current tests was 24 ± 2 GPa and 235 ± 5 GPa, respectively [28]. The properties of the multilayer coating depend on the properties of each layer, their thickness and the period of the bilayer module [19,33]. According to Reference [33], an increase in bi-layer module period caused initially also an increase in hardness and Young’s modulus up to reaching the maximum values. A further increase in a module period was accompanied by a decrease in hardness and Young’s modulus and after exceeding 150 nm of the module period, stabilisation values of hardness and Young’s modulus were observed. Taking into account that the module period in the tested coating was 700 nm, the values of hardness and Young’s modulus were in a stabilisation regime.
Coating adhesion was measured using a scratch tester Revetest produced by CSEM. A diamond indenter with radius of 0.2 mm has been used. Measurements have been carried out at standard conditions: normal loading rate of 100 N/min, scratch speed of 10 mm/min and scratch length of 10 mm. For each specimen at least three scratches were caused. The adhesion was determined by observations from an optical microscope. First minor cracks occurred under the load of 4.7 N [28], which corresponds to the critical load LC1 defined by the occurrence of the first cohesive failure of the coating. The critical load LC2 related to the first delamination of the coating from the substrate and was used as a measure of coating adhesion was 29.8 N [28].

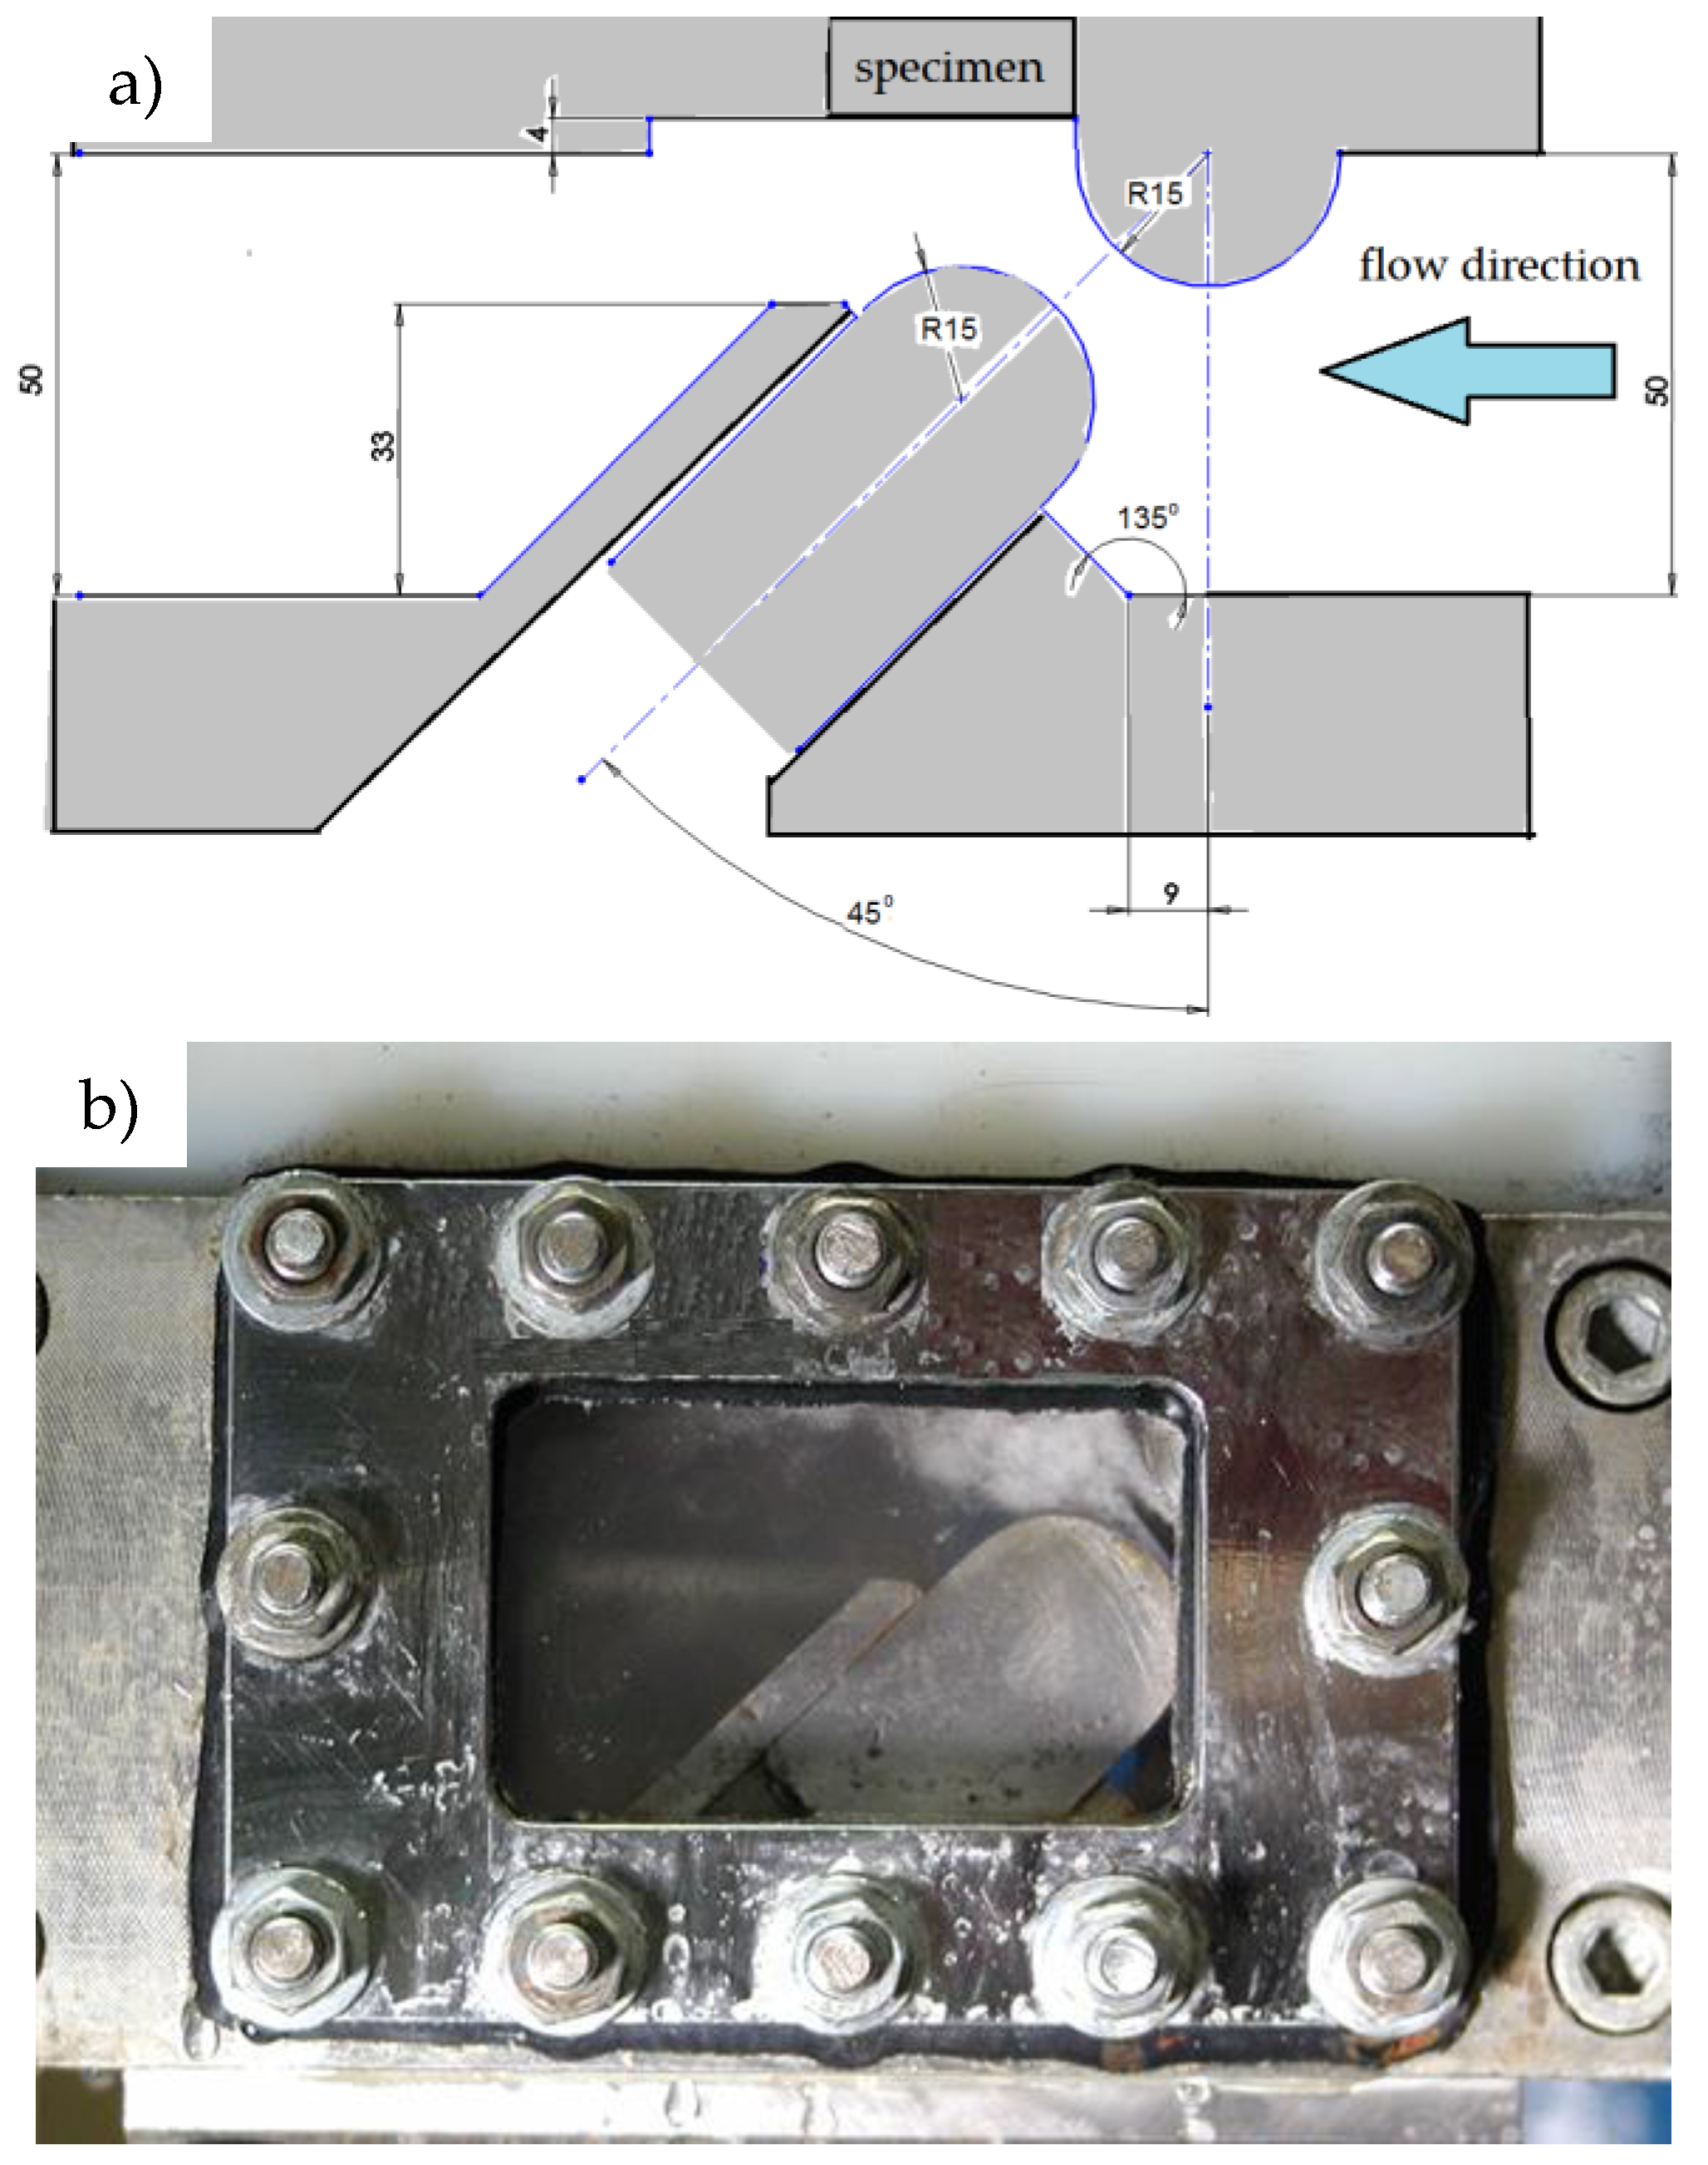
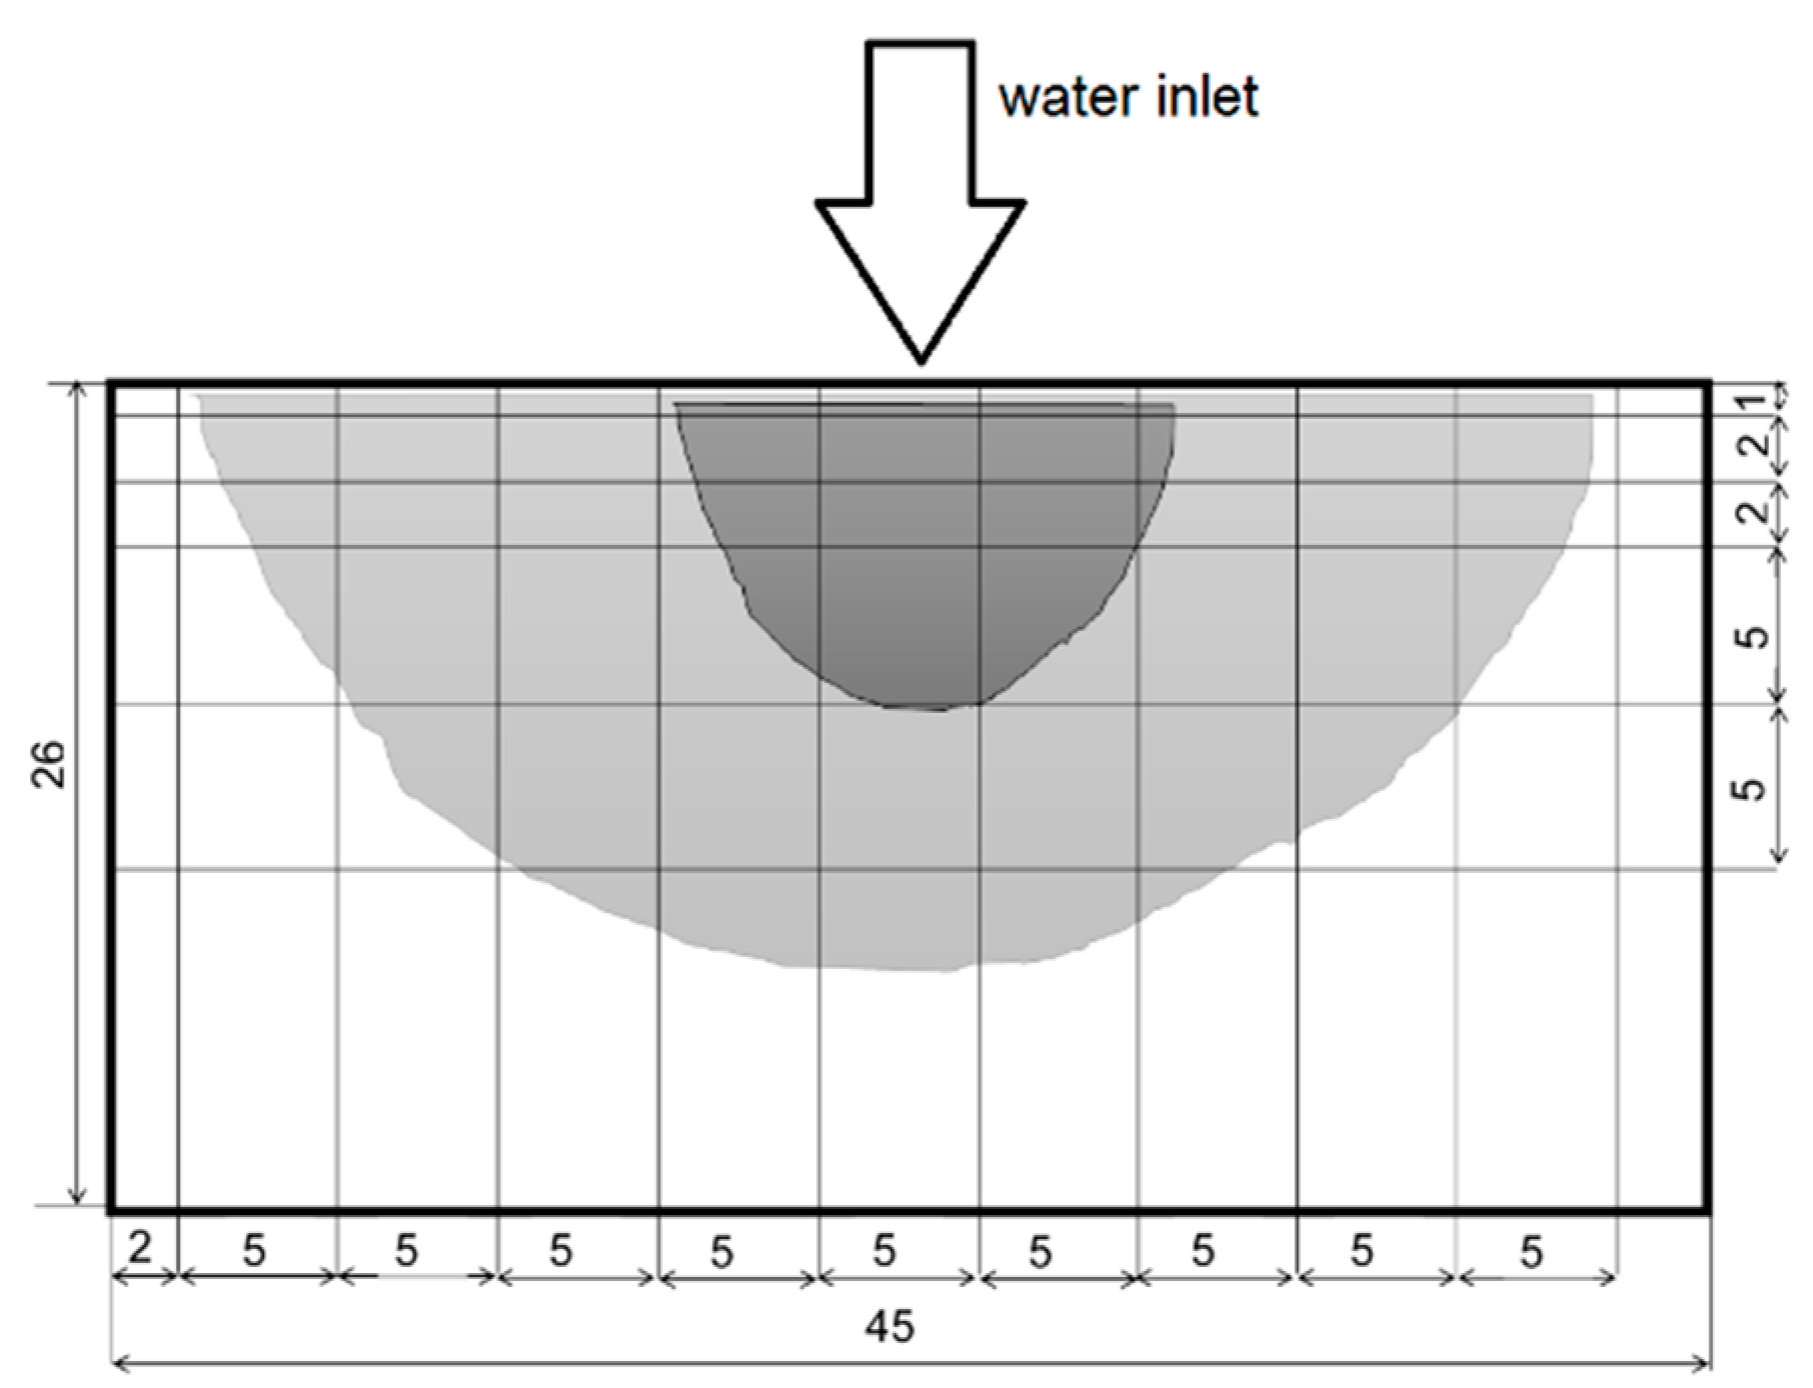
2.3. Cavitation Erosion Test

The cavitation erosion test was performed in the Institute of Fluid Flow Machinery Polish Academy of Science using a cavitation tunnel with a system of barricade/counter-barricade. The scheme of the tunnel and view of cavitation cloud are shown in Figure 1. The exact dimensions and full description of the cavitation tunnel have been presented in [26]. Flow conditions and cavitation intensity are controlled by inlet and outlet pressure. Specimens, both uncoated and coated, were subjected to cavitation loading at inlet pressure p1 = 600 kPa, outlet pressure p2 = 123 kPa, a slot width of 5 mm and using a 4 mm thick distance spacer. The applied inlet and outlet pressures resulted in a water flow velocity of 3.5 m/s in inlet pipeline and 35 m/s in the slot between the barricades. The temperature of the working liquid (tap water) was 20 ± 2 °C.
In order to observe the development of degradation of the tested specimens, the initial exposure interval lasted 5 min, then increased to 10 and then to 15 min for the first hour of the test. After that, the duration of exposure intervals increased to 30, 60, and 120 min. The total cavitation test lasted 600 min. Before the test and after each test interval, specimens were cleaned, dried and weighed using a first class analytical balance with sensitivity of 0.1 mg in order to achieve cavitation erosion curves.

2.4. Roughness Measurements

Before the cavitation erosion tests and after 180 and 600 min of erosion tests, surface roughness was measured using the SJ-301 Mitutoyo Surface Roughness Tester. Roughness measurements were performed in the Institute of Fluid Flow Machinery at the Polish Academy of Science. Because of the flat surface of the specimens, only a few roughness measurements were performed. During the cavitation erosion test, due to variations in surface roughness depending on the distance from water inlet, the roughness measurements were performed along the mesh, as shown in Figure 2. Due to high sensitivity of the location of measurements, the measurements in the low eroded zone were performed three times while in the high eroded zones four times. For presentation of surface roughness, the Ra and Rz parameters were used. The Ra parameter is the arithmetical mean of the absolute values of the profile deviations from the mean line of the roughness. The Rz parameter is the average maximum peak to valley of five consecutive sampling lengths within the measuring length. Each value of roughness parameter was the arithmetic mean calculated from experimental data.

2.5. Miscroscopic Observations

After 180 and 600 min of erosion tests, microscopic observations of surfaces of eroded specimens and cross-sections were carried out in the Faculty of Mechanical Engineering, Gdansk University of Technology, using a scanning electron microscope (SEM) JEOL JSM-7800 F (Tokyo, Japan). The cross-sections were made on the basis of surface roughness measurements, i.e., the occurrence of high roughness, which was noted 3 mm from the water inlet (Figure 2).

3. Results and Discussion

3.1. Cavitation Erosion Test

Because of high difference in density between the CrN/CrCN coating and X6CrNiTi18-10 steel, cavitation erosion curves are presented in Figure 3 in a form of volume loss vs. exposure time. Additionally, the curves of the erosion rate are presented in Figure 4, in order to better present the erosion process of the tested materials. In order to show the contribution of the CrN/CrCN coating to the degradation of the entire CrN/CrCN–X6CrNiTi18-10 system, the volume losses and the erosion rates of the coating and the entire system were shown separately. The volume losses were estimated based on observation of the damaged surface and determination of the corresponding coating mass.
According to Figure 3, an incubation period of the CrN/CrCN coating lasted 45 min in opposition to X6CrNiTi18-10 steel, which began to erode without an incubation period. The presence of the incubation period depends on material properties and cavitation aggressiveness. In the case of CrN/CrCN coating, the incubation period is associated with its high hardness and Young’s modulus. Both of these properties affect critical stress to initiate fracture. In the case of X6CrNiTi18-10 steel, the aforementioned properties are much lower than those of the coating. The lack of an incubation period and mass loss together with the start of the cavitation erosion test indicate an aggressive cavitation flow for this steel Similar results, including a lack of incubation period of X6CrNiTi18-10 steel, were also obtained in the previous investigations [28] and in Reference [34]. This indicates that a decrease in the inlet pressure from 700 [28] to 600 kPa, in the present study, did not affect the initiation of erosion of this steel.
In the case of the CrN/CrCN–X6CrNiTi18-10 system, after the initiation period, a small loss of volume was noted in the 60th minute of the test (Figure 3). During the next 30 min of erosion, no volume loss was noted, up to 90 min of the test. After that, the volume loss of the CrN/CrCN coating increased much faster. Considering that on the surface of CrN/CrCN coating were micro droplets, that were generated during coating production [28], the initial loss of the coating was likely related to the removal of some of these droplets. This thesis is also confirmed by the temporary absence of volume loss up to 90 min of test. In addition, up to approximately 300 min of the cavitation erosion test, only the CrN/CrCN coating eroded. After that time, the substrate began to erode. Nevertheless, until 500 min of the cavitation erosion test, the cumulative volume loss of the entire CrN/CrCN–X6CrNiTi18-10 system was lower than that of the uncoated steel.
The CrN/CrCN coating belongs to hard and stiff coatings. Its resistance to deformation relative to yielding was the H/E = 0.102, while its resistance to the plastic indentation was the H3/E2 = 0.25. In the case of the steel substrate, the H/E and H3/E2 ratios were 0.0085 and 0.00012, respectively. These two parameters show a high difference in stiffness between the coatings and the steel substrate. According to Reference [24], such a big difference in stiffness promotes a rapid fracture and a decrease in fatigue strength of the whole system. The performed investigations showed that despite the huge difference in deformation resistance, the deposited coating showed good protection of the ductile substrate against cavitation erosion.
Comparing the results obtained with the previous ones performed at p1 = 700 kPa [28], the reduction of the inlet pressure to p1 = 600 kPa in the cavitation erosion tests caused an extension of the incubation period from 30 to 45 min. Additionally, the volume loss of the CrN/CrCN–X6CrNiTi18-10 system decreased from 0.987 [28] to 0.755 mm3 and the period, during which the volume loss of the system was lower than that of the X6CrNiTi18-10 steel, increased from 180 to 500 min, i.e., 2.78 times. This indicates that a decrease in inlet pressure caused an essential increased in the protection of X6CRNiTi18-10 steel by the deposited CrN/CrCN coating to cavitation erosion.
Curves of the cavitation erosion rate (Figure 4) show that erosion of the uncoated X6CrNiTi18-10 austenitic steel started with the highest erosion rate of 0.0025 ± 0.001 mm3/min that then decreased nearly twice to 0.0011 ± 0.0002 mm3/min reaching this value at 180 min of exposure. This decrease in erosion rate was likely associated with the Feγ → Feε phase transformation, whose occurrence in austenitic stainless steels exposed to cavitation was confirmed many times, e.g., in [35,36,37]. The Feγ → Feε phase transformation absorbs impact energy and causes an increase in surface hardness, so degradation becomes more difficult and more energy-consuming.
According to the ASTM G-32 standard, a typical cavitation erosion curve has 5 periods: incubation, acceleration, maximum rate value, deceleration and terminal stage, which is characterised by the final steady-stage erosion rate. In the investigations presented here, the degradation of the austenitic steel began at the highest rate (Figure 4), i.e., the third erosion period according to the ASTM G-32 standard. Then, the erosion rate decreased indicating on the deceleration period and finally the erosion rate become stable indicating on the terminal stage. Thus, referring to the ASTM G-32 standard, only three erosion periods were noted: the third erosion period at the beginning of the test followed by the fourth and fifth erosion periods. The duration of the deceleration period (a decrease in erosion rate) was likely related to the duration of the mentioned phase transformation. The final erosion rate of X6CrNiTi18-10 steel after 600 min of the test was 0.0012 ± 0.0001 mm3/min.
In the case of the CrN/CrCN–X6CrNiTi18-10 system, after the incubation period, the erosion rate increased with the cavitation erosion test duration (Figure 4). The highest increase in erosion rate occurred from 90 to 180 min of exposure, when the erosion rate increased from 0.0003 ± 0.0001 mm3/min to 0.0008 ± 0.0001 mm3/min. It is worth mention that this erosion rate was caused by degradation of the CrN/CrCN coating. Because of the high H/E and H3/E2 ratios of the coating, this coating is stiff and critical stress required to initiate fracture is also high. Therefore, the incubation period occurred. However, after the initiation period, the cracks developed causing an increase in the erosion rate. Taking into account the high H/E and H3/E2 ratios and a NaCl structure of CrN and CrCN, cracks developed in the coating in a brittle mode. From 240 min of the test, when substrate degradation began, the erosion rate of the whole system increased, but the erosion rate of the CrN/CrCN coating remained unchanged. The final erosion rate of the entire CrN/CrCN–X6CrNiTi18-10 system was 0.00126 ± 0.0001 mm3/min. Thus, the final erosion rate was close to that of uncoated steel.
Comparing the results obtained with the previous ones [28], the reduction of the inlet pressure from p1 = 700 kPa to p1 = 600 kPa caused a decrease in the final erosion rate of the CrN/CrCN–X6CrNiTi18-10 system from 0.00165 ± 0.0001 mm3/min to 0.00126 ± 0.0001 mm3/min. According to [29,38,39], the inlet pressure in the cavitation chamber affects the flow velocity and cavitation intensity. Thus, a decrease in the inlet pressure of only 100 kPa was sufficient to decrease the number of pulses and their impact speed, which resulted in a 24% decrease of the final erosion rate of the entire CrN/CrCN–X6CrNiTi18-10 system and approximately a 3-fold increase in duration of substrate protection by the CrN/CrCN coating. This shows that a slight change in cavitation intensity causes an essential impact on the protection properties of the CrN/CrCN coating against cavitation erosion. This sensitivity on cavitation intensity is caused by the large differences in plasticity parameters (H/E and H3/E2 ratios) between the coating and the substrate. In the case of the H/E ratio, the difference was over 10 times, while in the case of the H3/E2 ratio, the difference was over 2000 times. Nevertheless, considering that the cavitation intensity in real machines is lower than in laboratory devices and that the harder steel (e.g., martensitic steel) is often used as a substrate, this coating is expected to exhibit good protection against cavitation erosion.

3.2. Microscopic Observations

Microscopic observations of the eroded surface of the coating and the steel were carried out after 180 and 600 min of exposure. In Figure 5 is presented the eroded surface of X6CrNiTi18-10 steel, while in Figure 6 and Figure 7 are presented surface and cross-sections of the CrN/CrCN coating–X6CrNiTi18-10 steel system after 180 min and in Figure 8 and Figure 9 after 600 min, respectively.
During the first 180 min of test, austenitic stainless steel X6CrNiTi18-10 underwent plastic degradation with fatigue failure predominance (Figure 5a,b). Deformation twins covered with agglomerates of fatigue slip bands were formed (marked by a solid line). Slip bands were formed mainly in one direction which indicates an easy slip system. However, in some places, slip bands were formed in two slip systems (marked by a dotted line). Formation of slip bands in two intersecting slip systems indicates very high impact energy delivered. This is in agreement with volume loss (Figure 3). At some intrusions of slip bands cracks developed. This caused more intensive erosion of the steel surface, which led to the removal of surface particles (arrows in Figure 5b). In addition, pits of various diameters can be observed. Some pits were formed due to plastic deformation, as well as due to the removal of surface particles. Elongation of test duration to 600 min caused much more severe damage (Figure 5c,d). The surface is covered with high density of craters and cracks, which were formed in a ductile mode, typical for this steel. However, in less eroded zone, fragments of deformation twins and slip bands are still visible, and some extrusions of slip bands become crack initiators (Figure 5c).
Microscopic study showed that the volume loss of the CrN/CrCN coating–X6CrNiTi18-10 steel system that arose during 180 min of the test was mainly due to the removal of the micro-droplets that are formed during coating deposition (Figure 6a). This led to the formation of many tiny pits on the coating surface. These tiny pits were a source of crack initiation. In addition, Figure 6 a shows that the surface underwent a slight micro-undulation that is confirmed on the cross-section in Figure 7. Cracks formed on the “tops” of the undulated coating migrated through these tiny pits (Figure 6a) from the top to the bottom of the undulated coating (Figure 7b). The height of the undulation is approximately 5 µm (Figure 7a). In addition, Figure 7 shows that undulation of the coating–substrate system did not cause coating delamination. In addition, cracks developed mainly in the coating.
Undulation of the coating occurs as a result of ductile substrate undulation and causes an increase in stress level in the coating. The formation of cracks on the top of the undulated coating is mainly due to the high tensile stresses generated there. When tensile stresses exceed the local strength of the coating, cracks initiate. The presence of pits, which are the sites of stress concentration, additionally decreases coating toughness. According to the theory of contact stress, an impact generates shear stress below the exposed surface. The place of the highest shear stress depends on material properties, mainly elastic modulus. As the modulus of elasticity increases, the position of the maximum shear stress approaches the surface. On the other side, investigations of the development of stresses in a solid by a high-velocity impact [40] showed that the impact generates a compressive wave, which is followed by tensile reflection wave. As a result, compressive stresses are generated first, followed by tensile stresses. Thus, both of these phenomena promote the removal of micro-droplets.
Apart from tiny pits generated due to micro-droplets’ removal, some pits were formed by impacts of micro-jets that were generated during the implosions of cavitation bubbles. An example of such pit is shown in Figure 6b. This pit has a shape of ellipse with one axis of about 70 μm and second axis of about 50 μm. However, the central depression has the diameter of about 16 μm. Taking into account that a reflecting micro-jet also influences the pit diameter, the diameter of the micro-jet was likely about 16 μm. The shape of this pit, especially its edge/rim, indicates high speed of the micro-jet and high local compressive stress, which led to shearing of the coating in a brittle mode and likely to a local temperature increase. In view of [41,42], heat is generated during the implosion of bubbles. An increase in temperature during micro-jet impact may additionally promote the formation of a pit.
Extending the test to 600 min contributed to development of coating erosion (Figure 8 and Figure 9): an increase in substrate and coating undulation (Figure 9a), coating piercing (Figure 8a) and removal (Figure 8b and Figure 9b) occurred. The height of coating-substrate system undulation increased to about 16 µm (Figure 9a). Thus, during 420 min of the test (from 180 to 600 min) the height of undulation increased about 3 times. Such a big increase in coating undulation indicates very good adhesion and tensile strength of the coating. The increase in the undulation height increased stress level in the coating that promoted coating delamination. A high velocity micro-jet impacting in such a delaminated place punctured and pressed the coating into the substrate (Figure 8a). The diameter of damaged coating is about 35 μm, but the central pit has one axis of about 10 μm long and the second one of about 14 μm long. The dimensions of damage are smaller than the dimensions of the pit shown in Figure 6b. However, the dimensions of the central pit from Figure 8a are comparable to the central depression from Figure 6b.
In some places in the area of the most aggressive cavitation pulses, the coating was removed revealing the substrate which underwent severe erosion (Figure 8b). On the surface were formed cracks, chips and craters. The depth of some craters was about 40 µm (Figure 9b). The substrate fractured in a ductile mode typical for austenitic stainless steel (Figure 8b). This mode of fracture is better presented in Figure 9b.
Thus, elongation of the test led to increase in coating undulation, puncture and gradual removal, and finally substrate degradation. Considering the cavitation erosion rates of the CrN/CrCN–X6CRNiTi18-10 system and X6CRNiTi18-10 steel (Figure 4) and microscopic study (Figure 5, Figure 6, Figure 7, Figure 8 and Figure 9), an increase in erosion rate of the CrN/CrCN–X6CRNiTi18-10 system after 240 min of the test was likely caused by simultaneously impacts of micro-jets and hard micro-particles of removed coating.

3.3. Roughness Measurements

Initial surface roughness of X6CrNiTi18-10 steel was Ra = 0.09 ± 0.08 µm and Rz = 0.67 ± 0.5 µm, while for the CrN/CrCN coating was Ra = 0.26 ± 0.07 µm and Rz = 2.52 ± 0.47 µm. Higher surface roughness of the CrN/CrCN coating was caused by micro-droplets. The results of surface roughness measurements after 180 and 600 min of erosion of X6CrNiTi18-10 steel and the CrN/CrCN– X6CrNiTi18-10 system are shown in Figure 10 and Figure 11, respectively. These graphs of the Ra and Rz parameter distributions show that higher roughness parameters were in the middle of the specimen width, approximately 17 mm of the specimen width, and near the sample front.
During an initial 180 min of erosion of X6CrNiTi18-10 steel, the Ra parameter increased up to Ra = 3.5 ± 0.15 µm, while the Rz parameter increased up to Rz = 20.58 ± 2.7 µm (Figure 10a). This increase in surface roughness was a result of slip bands, deformation twins, pits and craters, as is shown in Figure 5. In the case of the CrN/CrCN–X6CrNiTi18-10 system, cavitation action caused formation of the pits, as a result of the removal of micro-droplets and micro-jets impacts, micro undulation of the surface and the development of cracks (c.f. Figure 6 and Figure 7). This led to an increase in surface roughness up to Ra = 3.78 ± 0.2 µm and Rz = 20.39 ± 2.5 µm (Figure 11a). The maximum roughness parameters of the CrN/CrCN–X6CrNiTi18-10 system were comparable to that of X6CrNiTi18-10 steel, despite different surface damages and the fact that the volume loss and erosion rate of the CrN/CrCN– X6CrNiTi18-10 system were about 39% lower than those of X6CrNiTi18-10 steel (c.f. Figure 3 and Figure 4). In addition, the roughness distribution throughout the eroded area is also comparable for both cases (Figure 10a and Figure 11a).
Elongation of cavitation erosion tests up to 600 min caused a significant increase in surface degradation of the X6CrNiTi18-10 steel (Figure 5c,d) and the CrN/CrCN–X6CrNiTi18-10 system (Figure 8 and Figure 9). Therefore, a high increase and different values of roughness parameters were expected. The performed measurements showed that the maximum value of Ra parameter increased up to 5.86 ± 0.56 µm and 7.74 ± 0.98 µm, respectively, for X6CrNiTi18-10 steel and the CrN/CrCN–X6CrNiTi18-10 system. In the case of the Rz parameter, it increased up to 36.5 ± 3.27 µm and 40.6 ± 2 µm, respectively for X6CrNiTi18-10 steel and the CrN/CrCN–X6CrNiTi18-10 system. The value of the maximum Rz parameter of the system was close to the crater depth shown in Figure 9b. Thus, the difference in surface roughness was caused by the number and depth of craters (cf. Figure 5, Figure 8 and Figure 9). The roughness distributions over the entire surfaces of X6CrNiTi18-10 steel after 600 min of erosion showed that a place of the highest roughness was unchanged in comparison to that after 180 min (Figure 10). In the case of the CrN/CrCN–X6CrNiTi18-10 system (Figure 11), this place was moved from the distance of 3 mm from water inlet (after 180 min) to 5 mm from the water inlet (after 600 min).
Figure 10b and Figure 11b show that the high roughness zone (Ra > 3 µm) significantly increased at the specimen front, which is located next to the upper barricade (water inlet) and up to about 10 mm from the specimen length regardless of the tested material. The width of the high roughness zone varied depending on the examined material. In the case of X6CrNiTi18-10 steel, the high roughness zone starts from about 10 mm and ends at about 27 mm of the specimen width (Figure 10b). In the case of the CrN/CrCN–X6CrNiTi18-10 system, the high roughness zone starts at about 7 mm and ends at about 32 mm of the specimen width (Figure 11b). In addition, an area with Ra > 5 µm is essentially larger on the CrN/CrCN–X6CrNiTi18-10 system. Thus, high roughness area was bigger for the system, despite comparable volume loss. This was likely caused by system undulation, brittle fracture of the coating, and deep craters.
The roughness measurements of the CrN/CrCN–X6CrNiTi18-10 system and X6CrNiTi18-10 steel showed that during first 180 min of erosion, the Ra parameter increased at an average rate of 0.021 µm/min and 0.0194 µm/min, respectively. After the entire test (600 min), the average rate of a Ra parameter increase was 0.0119 µm/min and 0.0097 µm/min, respectively. In the case of the Rz parameter, during the first 180 min of erosion, it increased at an average rate of 0.113 and 0.114 µm/min, and after the entire test, an average rate was 0.0677 and 0.0608 µm/min, respectively. Thus, the average rates of an increase in roughness parameters decreased nearly twice. This indicates that surface roughness increased with the highest rate at the beginning of the tests and with increasing test duration the rate of an increase in surface roughness decreased. This decrease in an increase in surface roughness is likely related to overlapping damage.

4. Conclusions

The presented investigations of cavitation erosion resistance of the CrN/CrCN–X6CrNiTi18-10 system and X6CrNiTi18-10 steel performed at the inlet pressure of 600 kPa showed that:
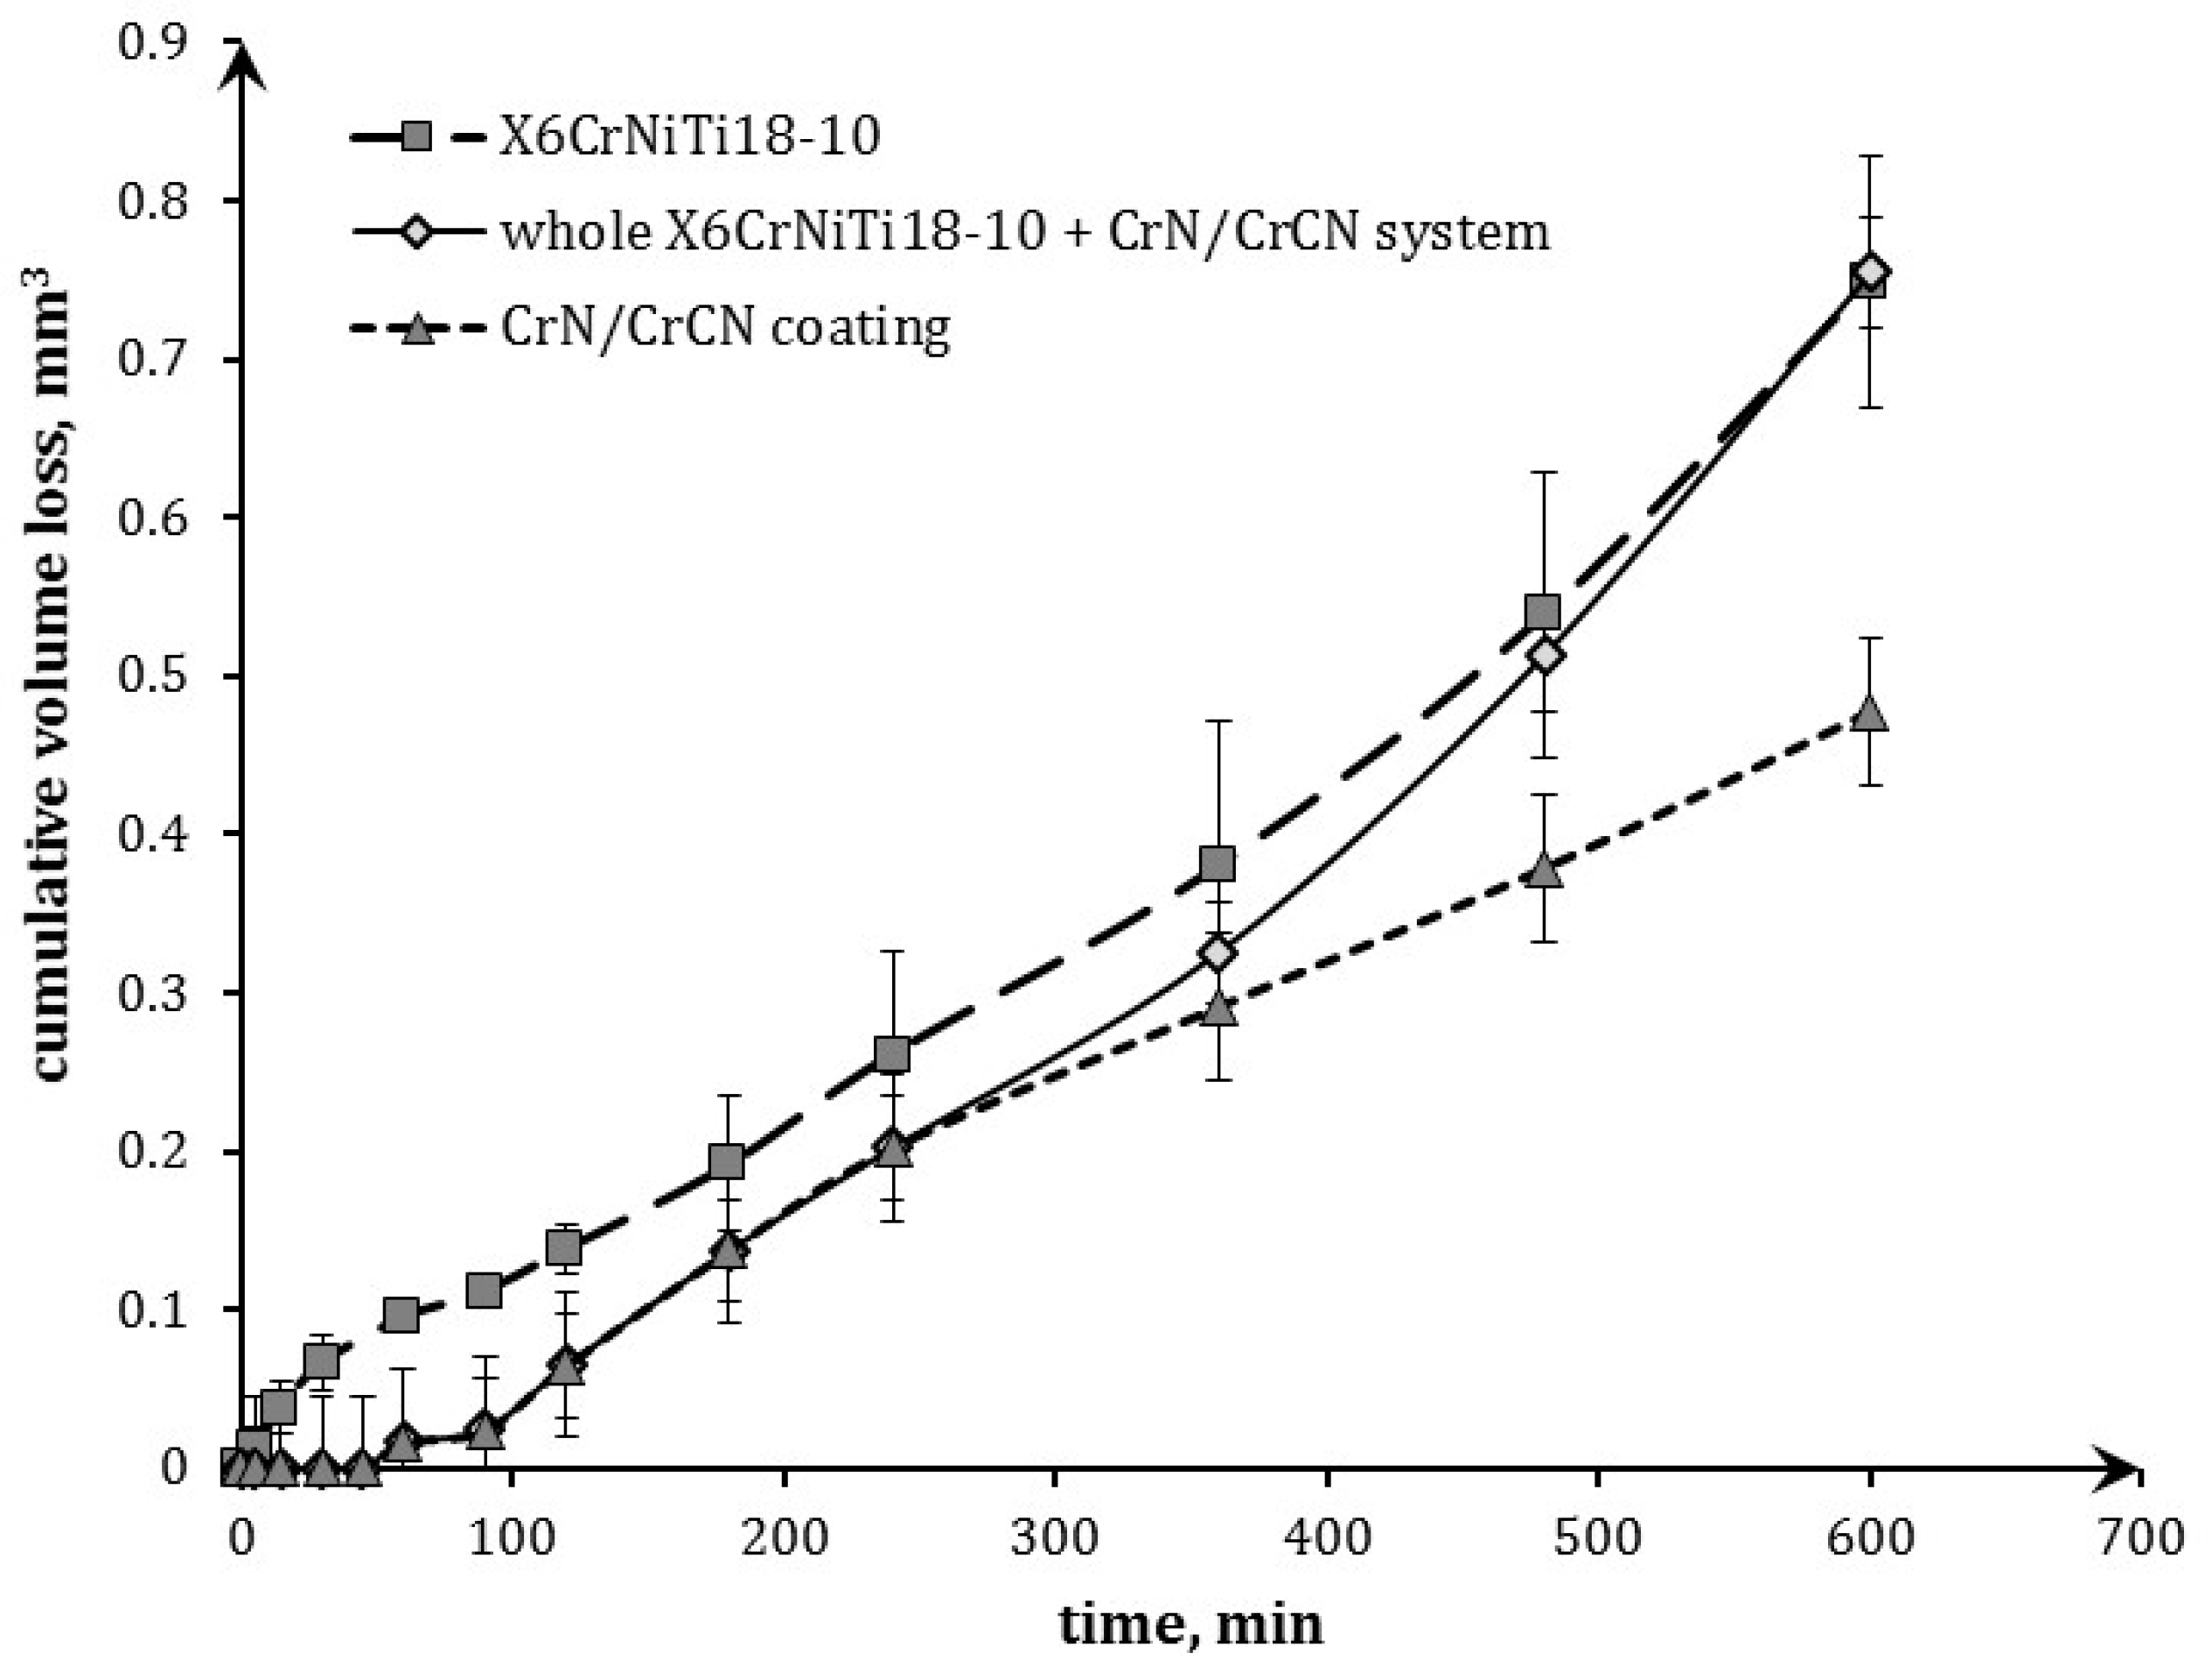
  • Deposition of CrN/CrCN coating on X6CrNiTi18-10 austenitic steel increased the incubation period and decreased cumulative volume loss. Until 300 min of erosion, only the coating in the CrN/CrCN–X6CrNiTi18-10 system was eroded. Starting from 500 min of erosion, the erosion rate of the system was comparable to austenitic steel.
  • The decrease in the inlet pressure of 100 kPa resulted in a 24% decrease in final erosion rate and approximately a 3-fold increase in duration of substrate protection by the CrN/CrCN coating.
  • Microscopic observations show that on the surface of X6CrNiTi18-10 steel were formed deformation twins covered by fatigue slip band agglomerates during the first 180 min of the test. Slip bands were formed mainly in the easy slip system, but in some places, slip bands were formed in two intersecting slip systems, indicating the very high impact energy delivered.
  • Microscopic study of the CrN/CrCN coating–X6CrNiTi18-10 steel system showed the removal of the micro-droplets, formation of pits/craters by micro-jets, and system undulation during initial 180 min of the test. Cracks were formed on the tops of the undulated coating and developed along the pits after the removed micro-droplets, which decreased coating toughness.
  • Extending the test duration to 600 min resulted in a 3-fold increase in the undulation height and the formation of craters about 40 µm deep.
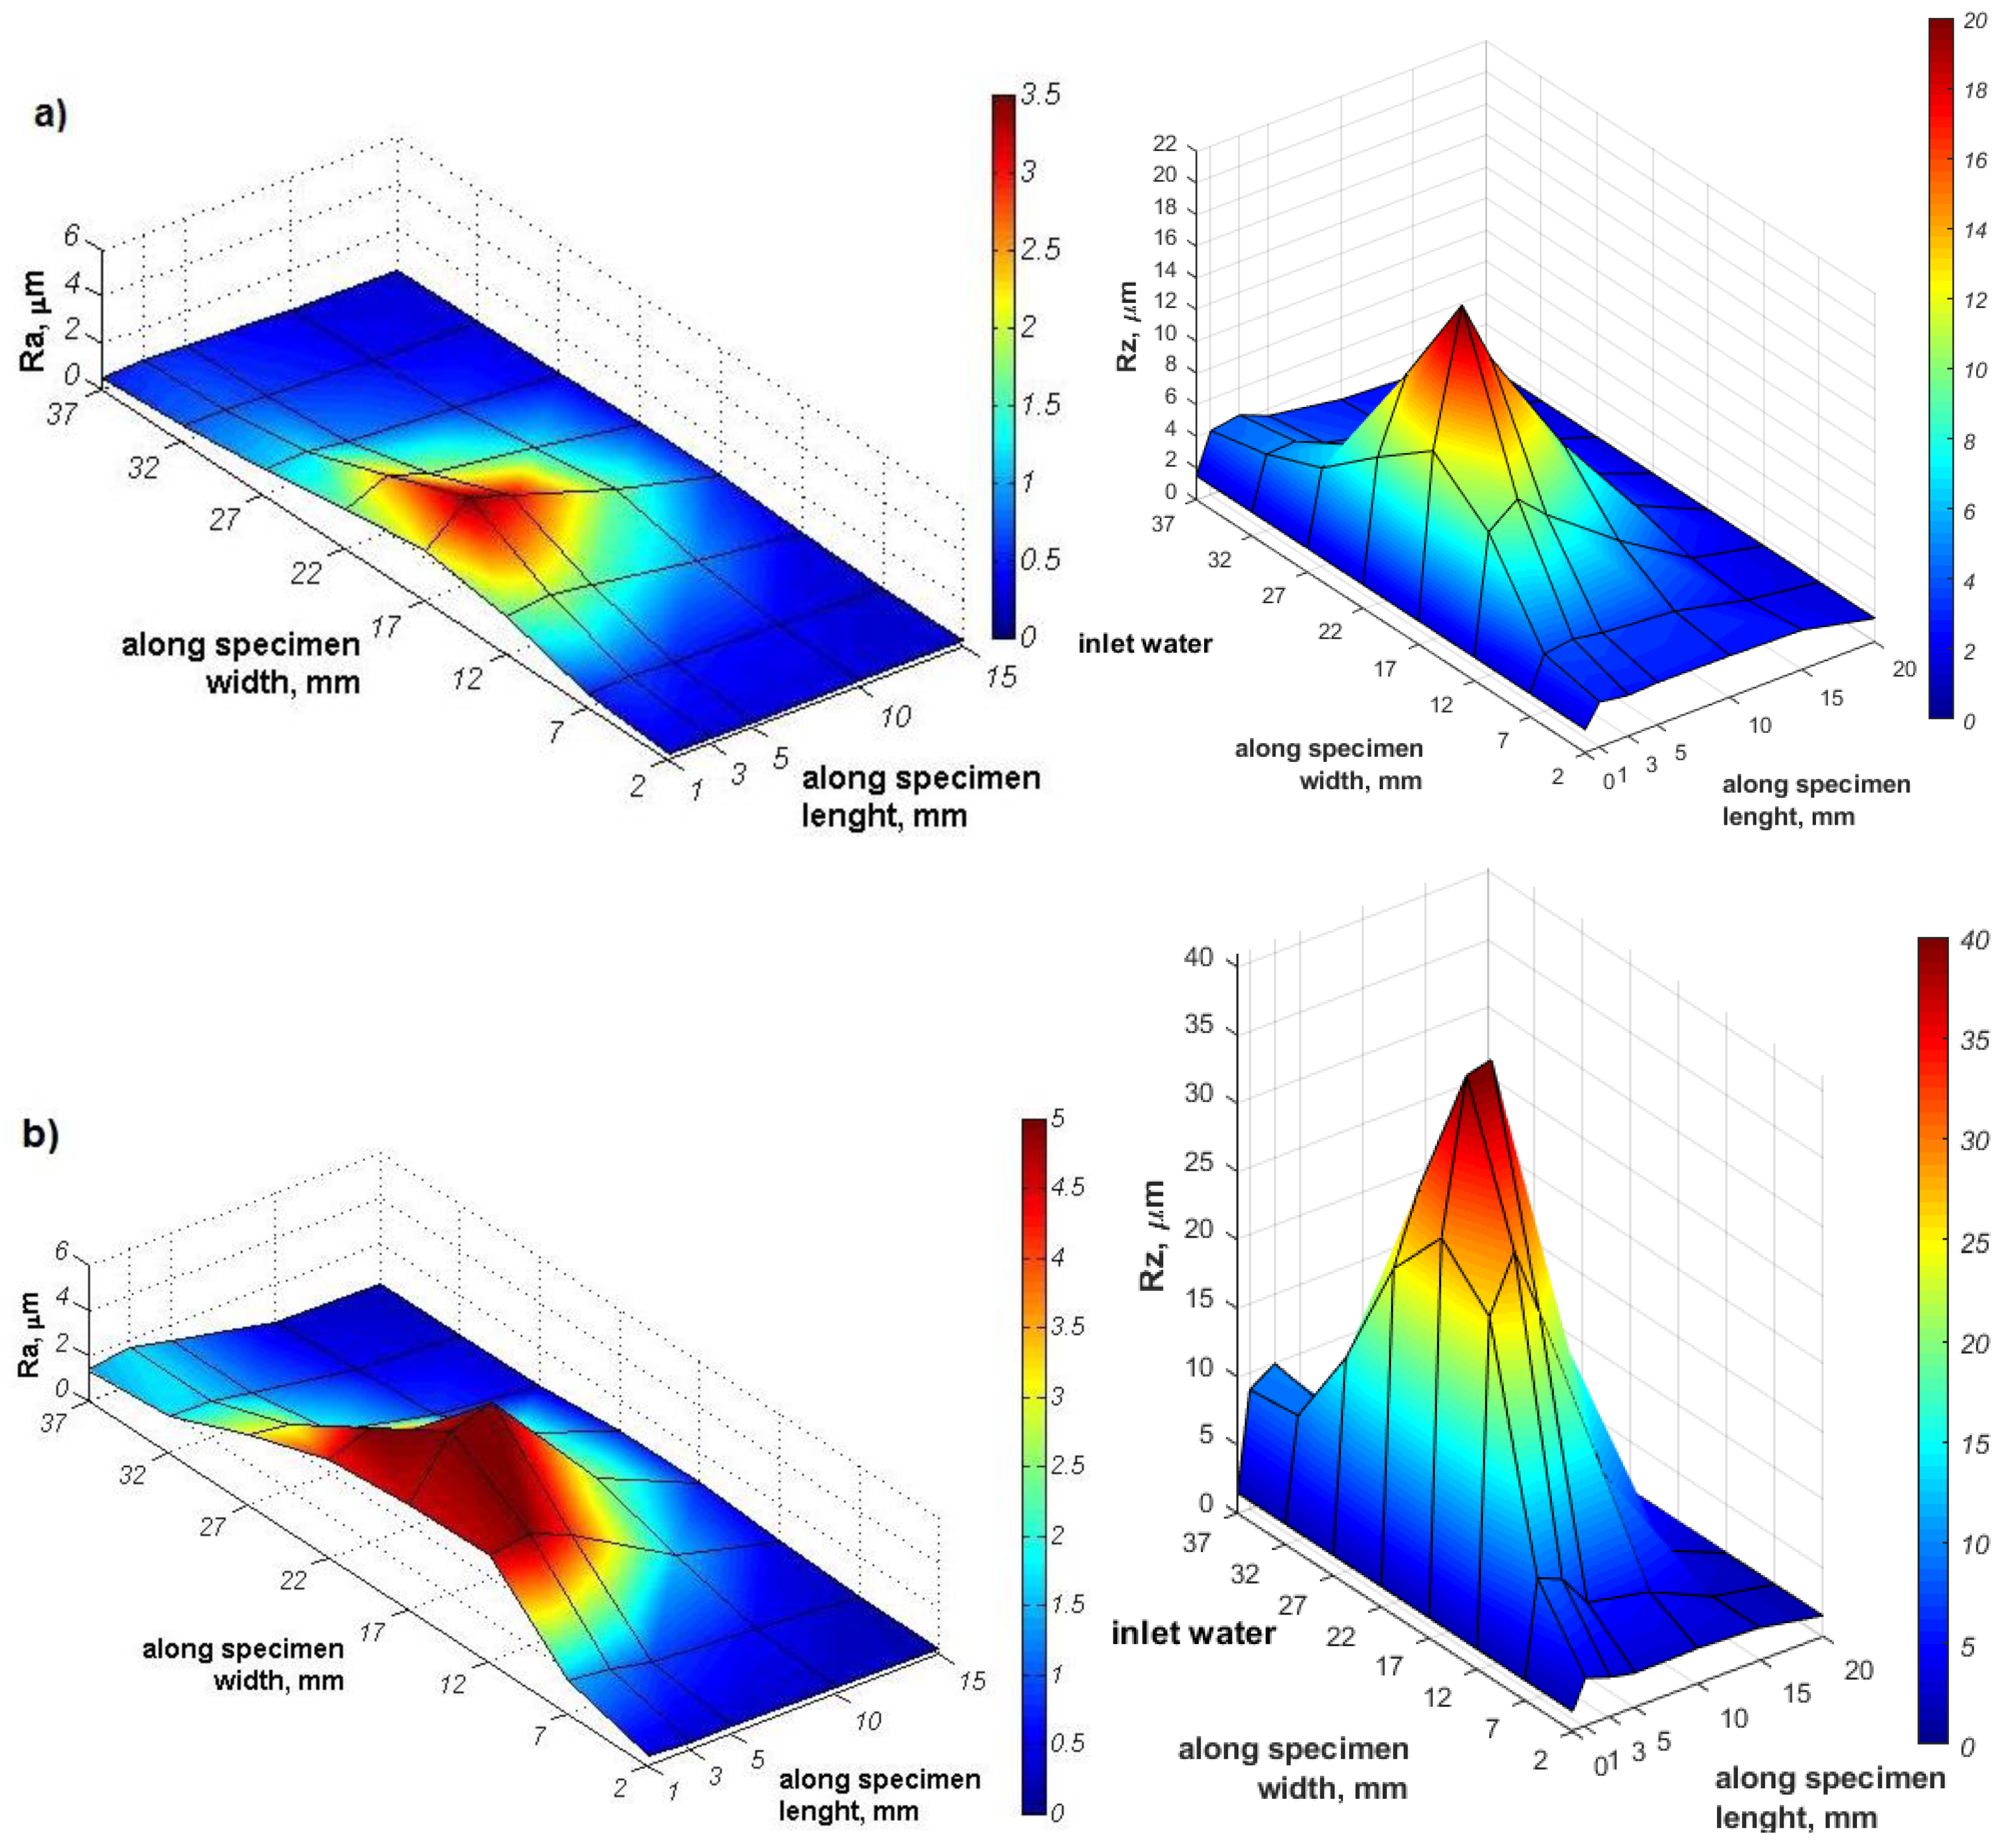
  • After initial 180 min of the test, surface roughness of the coating (Ra = 3.78 μm) was similar to that of the substrate (Ra = 3.5 μm) despite different damage to the surface.
  • The mechanisms of formation and development of surface damage were related to the ability to withstand plastic deformation. In the case of X6CrNiTi18-10 steel, an elongation of erosion test up to 600 min caused generation of pits and craters as well as the removal of surface particles. In the case of the CrN/CrCN coating–X6CrNiTi18-10 steel system, undulation of the surface increased and fractured in a brittle mode due to high H/E ratio. The coating was punctured and removed in some places by simultaneous impacts of micro-jets and hard micro-particles of the removed coating. The mechanisms of surface degradation affected a rate of change of surface roughness.
  • At the beginning of the tests, surface roughness increased at the highest rate when the volume loss was very low and afterwards the rate of an increase in surface roughness decreased due to overlapping damage.

Author Contributions

Conceptualization, A.K.K.; methodology, A.K.K.; formal analysis, A.K.K.; investigation, A.K.K., A.C., A.G. and G.G.; resources, A.K.K.; data curation, A.K.K.; writing—original draft preparation, A.K.K.; writing—review and editing, A.K.K.; visualization, A.K.K.; supervision, A.K.K. All authors have read and agreed to the published version of the manuscript.

Funding

This research received no external funding.

Conflicts of Interest

The authors declare no conflict of interest.

References

  1. Krella, A.K.; Zakrzewska, D.E. Cavitation Erosion–Phenomenon and Test Rigs. Adv. Mater. Sci. 2018, 18, 15–26. [Google Scholar] [CrossRef] [Green Version]
  2. Hong, Y.; Sarntinoranont, M.; Subhash, G.; Canchi, S.; King, M.A. Localized Tissue Surrogate Deformation due to Controlled Single Bubble Cavitation. Exp. Mech. 2016, 56, 97–109. [Google Scholar] [CrossRef]
  3. Smith, D.G.; Kinslow, R. Pressure due to high-velocity impact of a water jet. Exp. Mech. 1976, 16, 21–25. [Google Scholar] [CrossRef]
  4. Bourne, N.K. On stress wave interactions in liquid impact. Wear 2005, 258, 588–595. [Google Scholar] [CrossRef]
  5. Karimi, A.; Martin, J.L. Cavitation erosion of materials. Int. Mater. Rev. 1986, 31, 1–26. [Google Scholar] [CrossRef]
  6. Wang, Z.; Zhu, J. Correlation of martensitic transformation and surface mechanical behavior with cavitation erosion resistance for some iron-based alloys. Wear 2004, 256, 1208–1213. [Google Scholar] [CrossRef]
  7. Bedkowski, W.; Gasiak, G.; Lachowicz, C.; Lichtarowicz, A.; Łagoda, T.; Macha, E. Relations between cavitation erosion resistance of materials and their fatigue strength under random loading. Wear 1999, 230, 201–209. [Google Scholar] [CrossRef]
  8. Hattori, S.; Ishikura, R. Revision of cavitation erosion database and analysis of stainless steel data. Wear 2010, 268, 109–116. [Google Scholar] [CrossRef]
  9. Kristensen, J.K.; Hansson, I.; Morch, K. A simple model for cavitation erosion of metals. J. Phys. D Appl. Phys. 1978, 11, 899–912. [Google Scholar] [CrossRef]
  10. Cui, Z.; Man, H.; Cheng, F.; Yue, T. Cavitation erosion–corrosion characteristics of laser surface modified NiTi shape memory alloy. Surf. Coat. Technol. 2003, 162, 147–153. [Google Scholar] [CrossRef]
  11. Kwok, C.T.; Cheng, F.T.; Man, H.C. Laser-fabricated Fe-Ni-Co-Cr-B austenitic alloy on steels. Part I. Microstructures and cavitation erosion behaviour. Surf. Coat. Technol. 2001, 145, 194–205. [Google Scholar] [CrossRef]
  12. Kwok, C.T.; Cheng, F.T.; Man, H.C. Laser surface modification of UNS S31603 stainless steel. Part II: Cavitation erosion characteristics. Mater. Sci. Eng. A 2000, 290, 74–88. [Google Scholar] [CrossRef]
  13. Zhang, L.; Liu, Y.H.; Luo, K.Y.; Zhang, Y.K.; Zhao, Y.; Huang, J.Y.; Wu, X.D.; Zhou, C. Tensile property of ANSI 304 stainless steel weldments subjected to cavitation erosion based on treatment of laser shock processing. Materials 2018, 11, 805. [Google Scholar] [CrossRef] [PubMed] [Green Version]
  14. Lo, K.H.; Cheng, F.T.; Kwok, C.T.; Man, H.C. Improvement of cavitation erosion resistance of AISI 316 stainless steel by laser surface alloying using fine WC powder. Surf. Coat. Technol. 2003, 165, 258–267. [Google Scholar] [CrossRef]
  15. Ding, X.; Ke, D.; Yuan, C.; Ding, Z.; Cheng, X. Microstructure and cavitation erosion resistance of HVOF deposited WC-Co coatings with different sized WC. Coatings 2018, 8, 307. [Google Scholar] [CrossRef] [Green Version]
  16. Han, S.; Lin, J.; Kuo, J.; He, J.; Shih, H. The cavitation-erosion phenomenon of chromium nitride coatings deposited using cathodic arc plasma deposition on steel. Surf. Coat. Technol. 2002, 161, 20–25. [Google Scholar] [CrossRef]
  17. Krella, A. Cavitation erosion of TiN and CrN coatings deposited on different substrates. Wear 2013, 297, 992–997. [Google Scholar] [CrossRef]
  18. Krella, A.K. Cavitation erosion resistance of Ti / TiN multilayer coatings. Surf. Coat. Technol. 2013, 228, 115–123. [Google Scholar] [CrossRef]
  19. Krella, A.K. Degradation of protective PVD coatings. In Handbook of Materials Failure Analysis; Elsevier B.V.: Amsterdam, The Netherlands, 2016; pp. 411–440. ISBN 9780081001165. [Google Scholar]
  20. Zhou, H.; Liu, H.Y.; Fu, K.; Yuan, H.; Du, X.; Mai, Y.W. Numerical simulation of failure of composite coatings due to thermal and hygroscopic stresses. Coatings 2019, 9, 243. [Google Scholar] [CrossRef] [Green Version]
  21. Puchi-Cabrera, E.S.; Matínez, F.; Herrera, I.; Berríos, J.A.; Dixit, S.; Bhat, D. On the fatigue behavior of an AISI 316L stainless steel coated with a PVD TiN deposit. Surf. Coat. Technol. 2004, 182, 276–286. [Google Scholar] [CrossRef]
  22. Puchi-Cabrera, E.S.; Staia, M.H.; Quinto, D.T.; Villalobos-Gutiérrez, C.; Ochoa-Pérez, E. Fatigue properties of a SAE 4340 steel coated with TiCN by PAPVD. Int. J. Fatigue 2007, 29, 471–480. [Google Scholar] [CrossRef]
  23. Su, Y.; Yao, S.; Wei, C.; Wu, C. Tension and fatigue behavior of a PVD TiN-coated material. Thin Solid Films 1998, 315, 153–158. [Google Scholar] [CrossRef]
  24. Baragetti, S.; La Vecchia, G.M.; Terranova, A. Variables affecting the fatigue resistance of PVD-coated components. Int. J. Fatigue 2005, 27, 1541–1550. [Google Scholar] [CrossRef]
  25. Leyland, A.; Matthews, A. On the significance of the H/E ratio in wear control: A nanocomposite coating approach to optimised tribological behaviour. Wear 2000, 246, 1–11. [Google Scholar] [CrossRef]
  26. Lee, S.C.; Ho, W.Y.; Lai, F.D. Effect of substrate surface roughness on the characteristics of CrN hard film. Mater. Chem. Phys. 1996, 43, 266–273. [Google Scholar] [CrossRef]
  27. Howard, R.L.; Ball, A. Mechanisms of cavitation erosion of TiAl -based titanium alumine intermetalic alloys. Acta Metall. 1996, 44, 3157–3168. [Google Scholar]
  28. Krella, A.K.; Czyzniewski, A.; Gilewicz, A.; Krupa, A. Cavitation erosion of CrN/CrCN multilayer coating. Wear 2017, 386–387, 80–89. [Google Scholar] [CrossRef]
  29. Krella, A.K. Degradation of AlMg2 aluminium alloy caused by cavitation—An effect of cavitation intensity. Mater. Charact. 2017, 130, 219–229. [Google Scholar] [CrossRef]
  30. Bertrand, G.; Meunier, C.; Savall, C. Properties of reactively RF magnetron-sputtered chromium nitride coatings. Surf. Coat. Technol. 1997, 96, 323–329. [Google Scholar] [CrossRef]
  31. Berg, G.; Friedrich, C.; Broszeit, E.; Berger, C. Development of chromium nitride coatings substituting titanium nitride. Surf. Coat. Technol. 1996, 86–87, 184–191. [Google Scholar] [CrossRef]
  32. Cai, F.; Huang, X.; Yang, Q. Mechanical properties, sliding wear and solid particle erosion behaviors of plasma enhanced magnetron sputtering CrSiCN coating systems. Wear 2015, 324–325, 27–35. [Google Scholar] [CrossRef]
  33. Azizpour, A.; Hahn, R.; Klimashin, F.F.; Wojcik, T.; Poursaeidi, E.; Mayrhofer, P.H. Deformation and cracking mechanism in CrN/TiN multilayer coatings. Coatings 2019, 9, 363. [Google Scholar] [CrossRef] [Green Version]
  34. Li, D.G.; Chen, D.R.; Liang, P. Enhancement of cavitation erosion resistance of 316 L stainless steel by adding molybdenum. Ultrason. Sonochem. 2017, 35, 375–381. [Google Scholar] [CrossRef] [PubMed]
  35. Krella, A.; Czyzniewski, A. Influence of the substrate hardness on the cavitation erosion resistance of TiN coating. Wear 2007, 263, 395–401. [Google Scholar] [CrossRef]
  36. Xiaojun, Z.; Procopiak, L.A.J.; Souza, N.C.; d’Oliveira, A.S.C.M. Phase transformation during cavitation erosion of a Co stainless steel. Mater. Sci. Eng. A 2003, 358, 199–204. [Google Scholar] [CrossRef]
  37. Zhang, Y.; Wang, Z.; Cui, Y. The cavitation behavior of a metastable Cr-Mn-Ni steel. Wear 2000, 240, 231–234. [Google Scholar] [CrossRef]
  38. Hattori, S.; Hirose, T.; Sugiyama, K. Prediction method for cavitation erosion based on measurement of bubble collapse impact loads. Wear 2010, 269, 507–514. [Google Scholar] [CrossRef]
  39. Carnelli, D.; Karimi, A.; Franc, J.P. Evaluation of the hydrodynamic pressure of cavitation impacts from stress-strain analysis and geometry of individual pits. Wear 2012, 289, 104–111. [Google Scholar] [CrossRef]
  40. Bustamante, M.C.; Singh, D.; Cronin, D.S. Polymeric Hopkinson Bar-Confinement Chamber Apparatus to Evaluate Fluid Cavitation. Exp. Mech. 2018, 58, 55–74. [Google Scholar] [CrossRef] [Green Version]
  41. Suslick, K.S.; Flannigan, D.J. Inside a Collapsing Bubble: Sonoluminescence and the Conditions During Cavitation. Annu. Rev. Phys. Chem. 2008, 59, 659–683. [Google Scholar] [CrossRef] [Green Version]
  42. Flint, E.B.; Suslick, K.S. The temperature of Cavitation. Science 1991, 253, 1397–1399. [Google Scholar] [CrossRef] [PubMed]
Figure 1. Scheme of cavitation tunnel (a) and view of the testing part with cavitation cloud (b).
Coatings 10 00487 g001
Figure 2. Mesh of the roughness measurements with marked eroded area.
Coatings 10 00487 g002
Figure 3. Cavitation curves of X6CrNiTi18-10 steel and CrN/CrCN coating deposited on X6CrNiTi18-10 steel.
Coatings 10 00487 g003
Figure 4. Curves of cavitation erosion rate of X6CrNiTi18-10 steel and CrN/CrCN coating deposited on X6CrNiTi18-10 steel.
Coatings 10 00487 g004
Figure 5. Eroded surface of X6CrNiTi18-10 steel; (a) and (b) after 180 min of exposition; (c) and (d) after 600 min of exposition.
Coatings 10 00487 g005
Figure 6. CrN/CrCN coating - X6CrNiTi18-10 steel system after 180 min of exposition; (a) crack, (b) pit.
Coatings 10 00487 g006
Figure 7. Cross-section of CrN/CrCN coating–X6CrNiTi18-10 steel system after 180 min of exposition; (a) undulation, (b) coating fracture.
Coatings 10 00487 g007
Figure 8. CrN/CrCN coating–X6CrNiTi18-10 steel system after 600 min of test duration (a) pit, (b) eroded substrate.
Coatings 10 00487 g008
Figure 9. Cross-section of CrN/CrCN coating–X6CrNiTi18-10 steel system after 600 min of exposition; (a) undulation in the lower eroded zone, (b) surface damage in the high eroded zone.
Coatings 10 00487 g009
Figure 10. Distribution of Ra and Rz parameters on the surface of X6CrNiTi18-10 steel after (a) 180 and (b) 600 min of the cavitation erosion test.
Coatings 10 00487 g010
Figure 11. Distribution of Ra parameter on the surface of the CrN/CrCN–X6CrNiTi18-10 system after (a) 180 and (b) 600 min of the cavitation erosion test.
Coatings 10 00487 g011
Table 1. Mechanical properties of X6CrNiTi18-10 steel.
Hardness
[HRC]
Young’s Modulus
[GPa]
Ultimate Tensile Strength
[MPa]
Yield Strength
[MPa]
Elongation
[%]
Density
[g/cm3]
25199662307367.86
Table 2. Deposition parameters of CrN/CrCN coating.
Pressure of Residual GasesWorking Pressure of ArgonWorking Pressure of NitrogenArc CurrentSubstrate Bias VoltageSubstrate Temperature
1 × 10⁻³ Pa0.5 Pa1.8 Pa80 A−70 V300 °C

