The Effect of the Methyl and Ethyl Group of the Acrylate Precursor in Hybrid Silane Coatings Used for Corrosion Protection of Aluminium Alloy 7075-T6

 , ,
, , 
Abstract
1. Introduction
2. Materials and Methods
2.1. Preparation of Coatings
2.1.1. Substrates and Chemicals
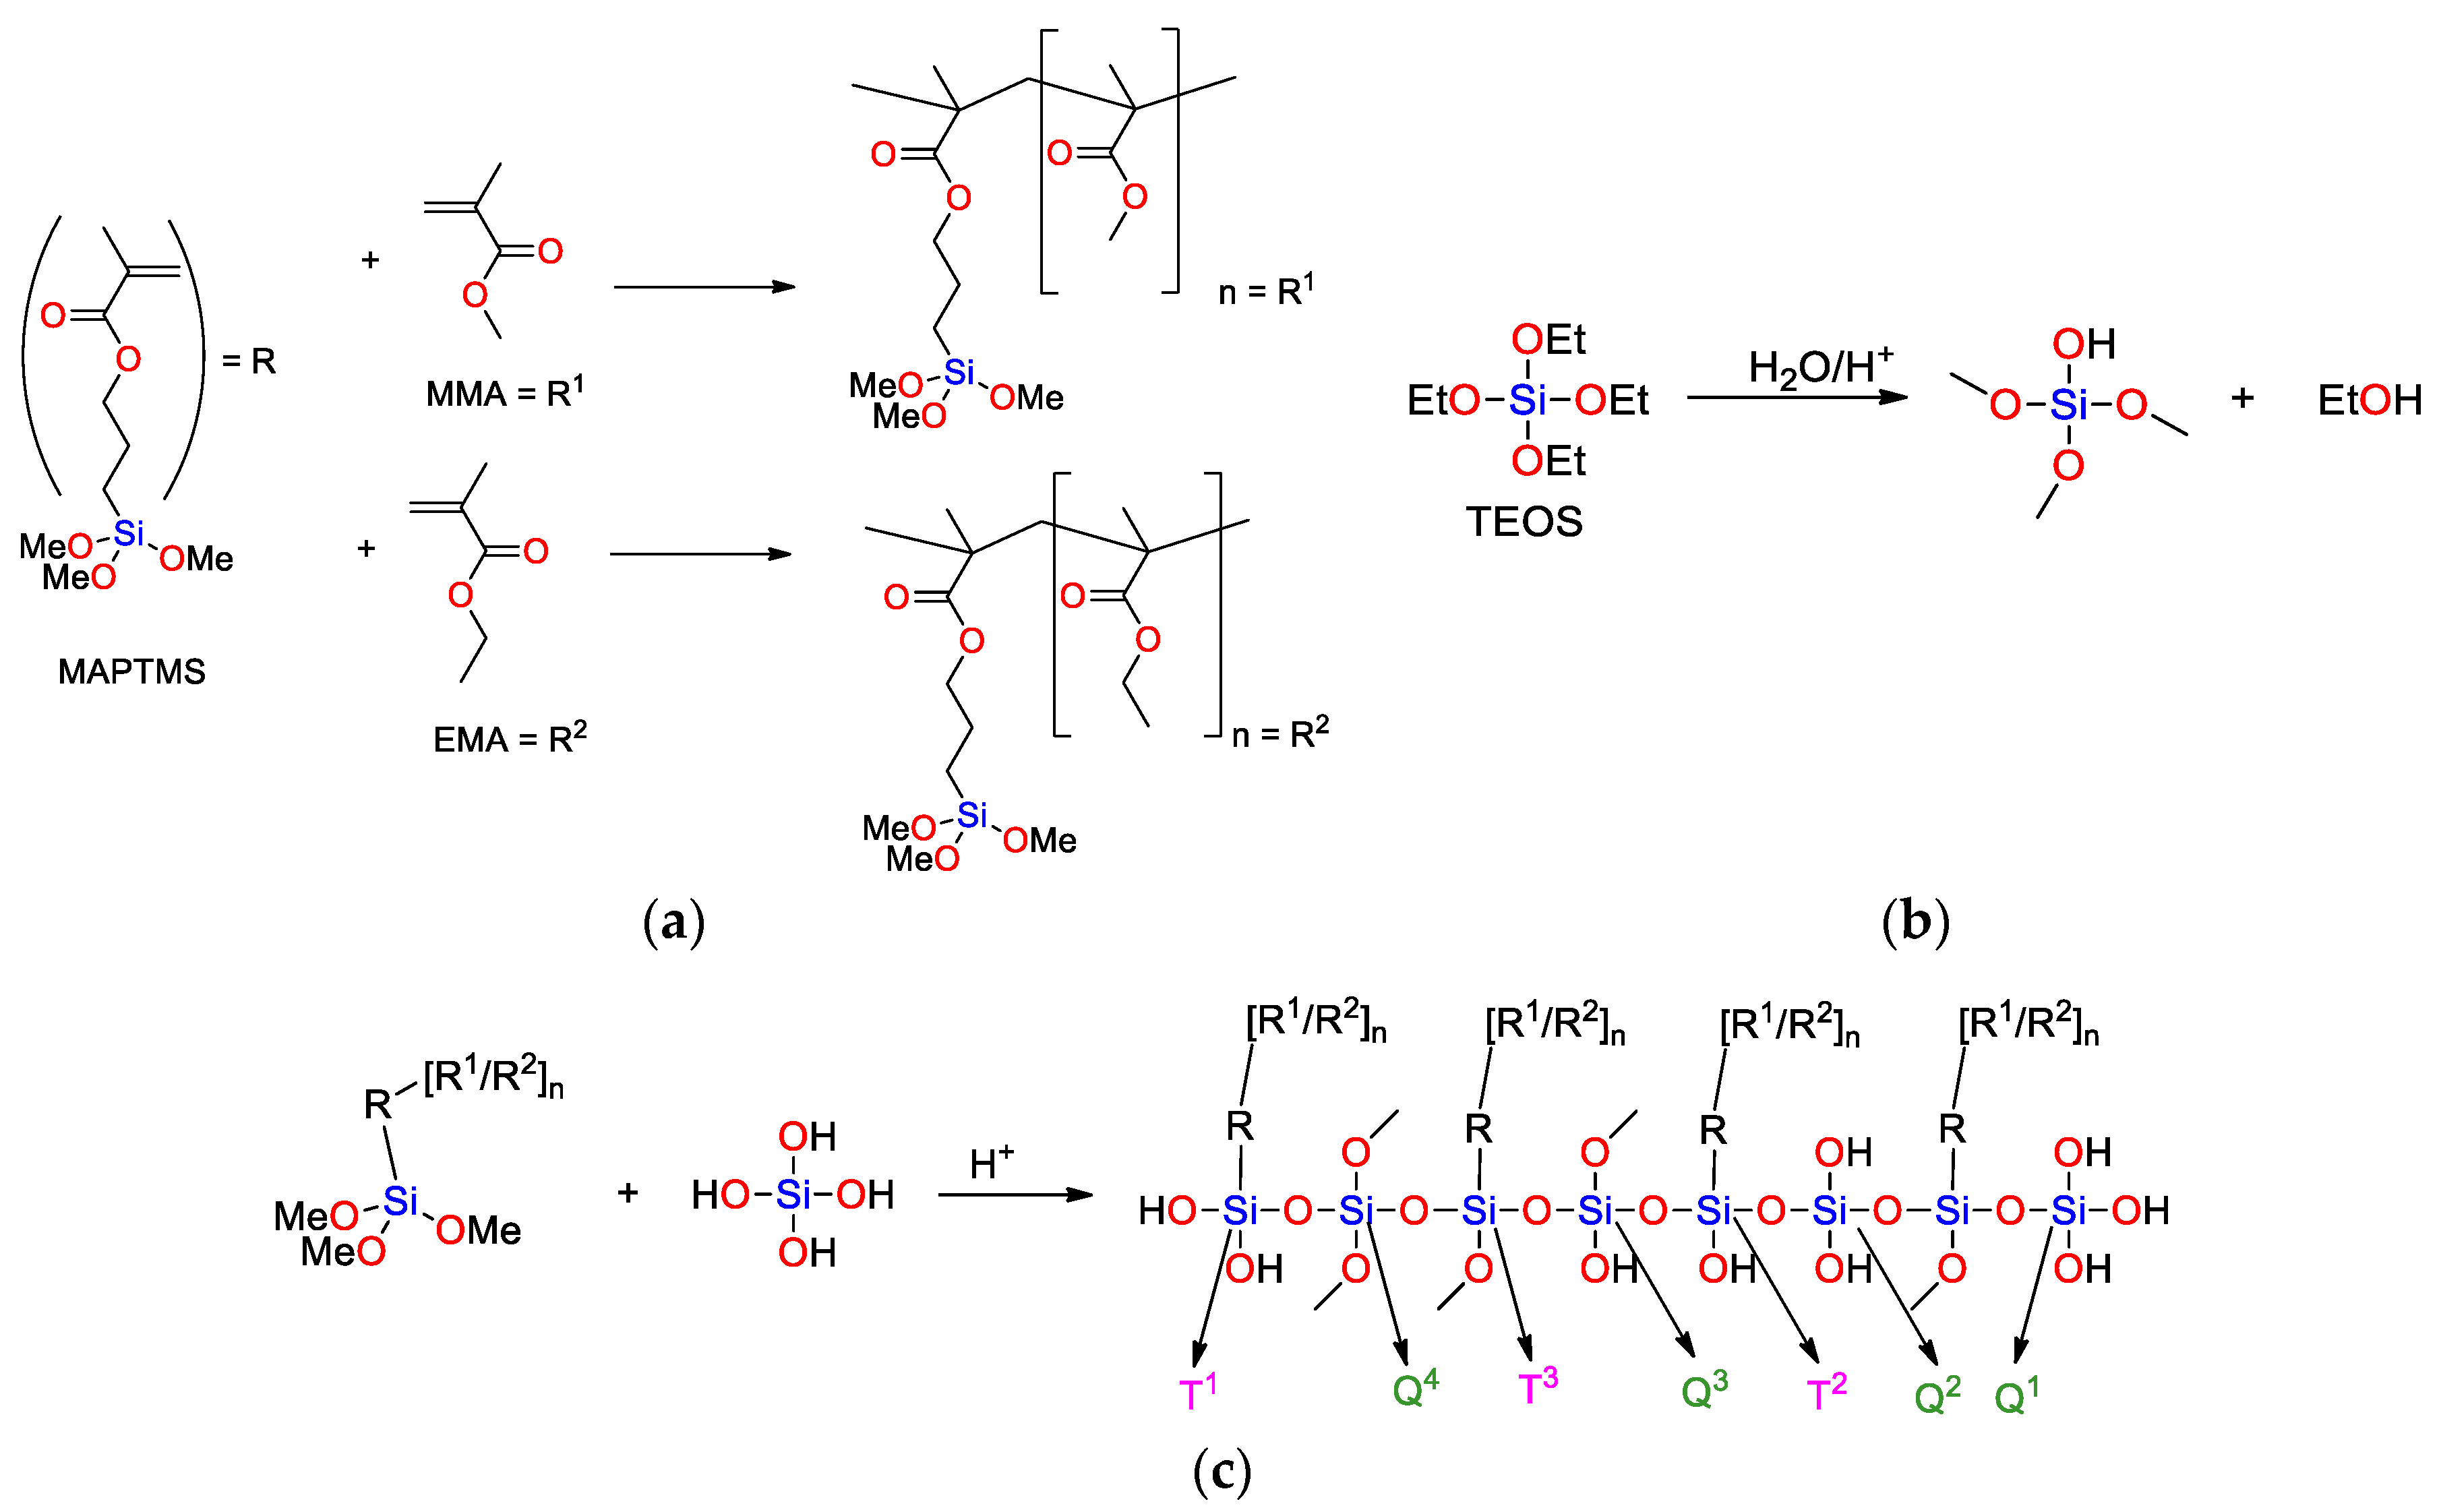
2.1.2. Synthesis of Sols
2.1.3. Deposition of Coatings
2.2. Characterization of Sols
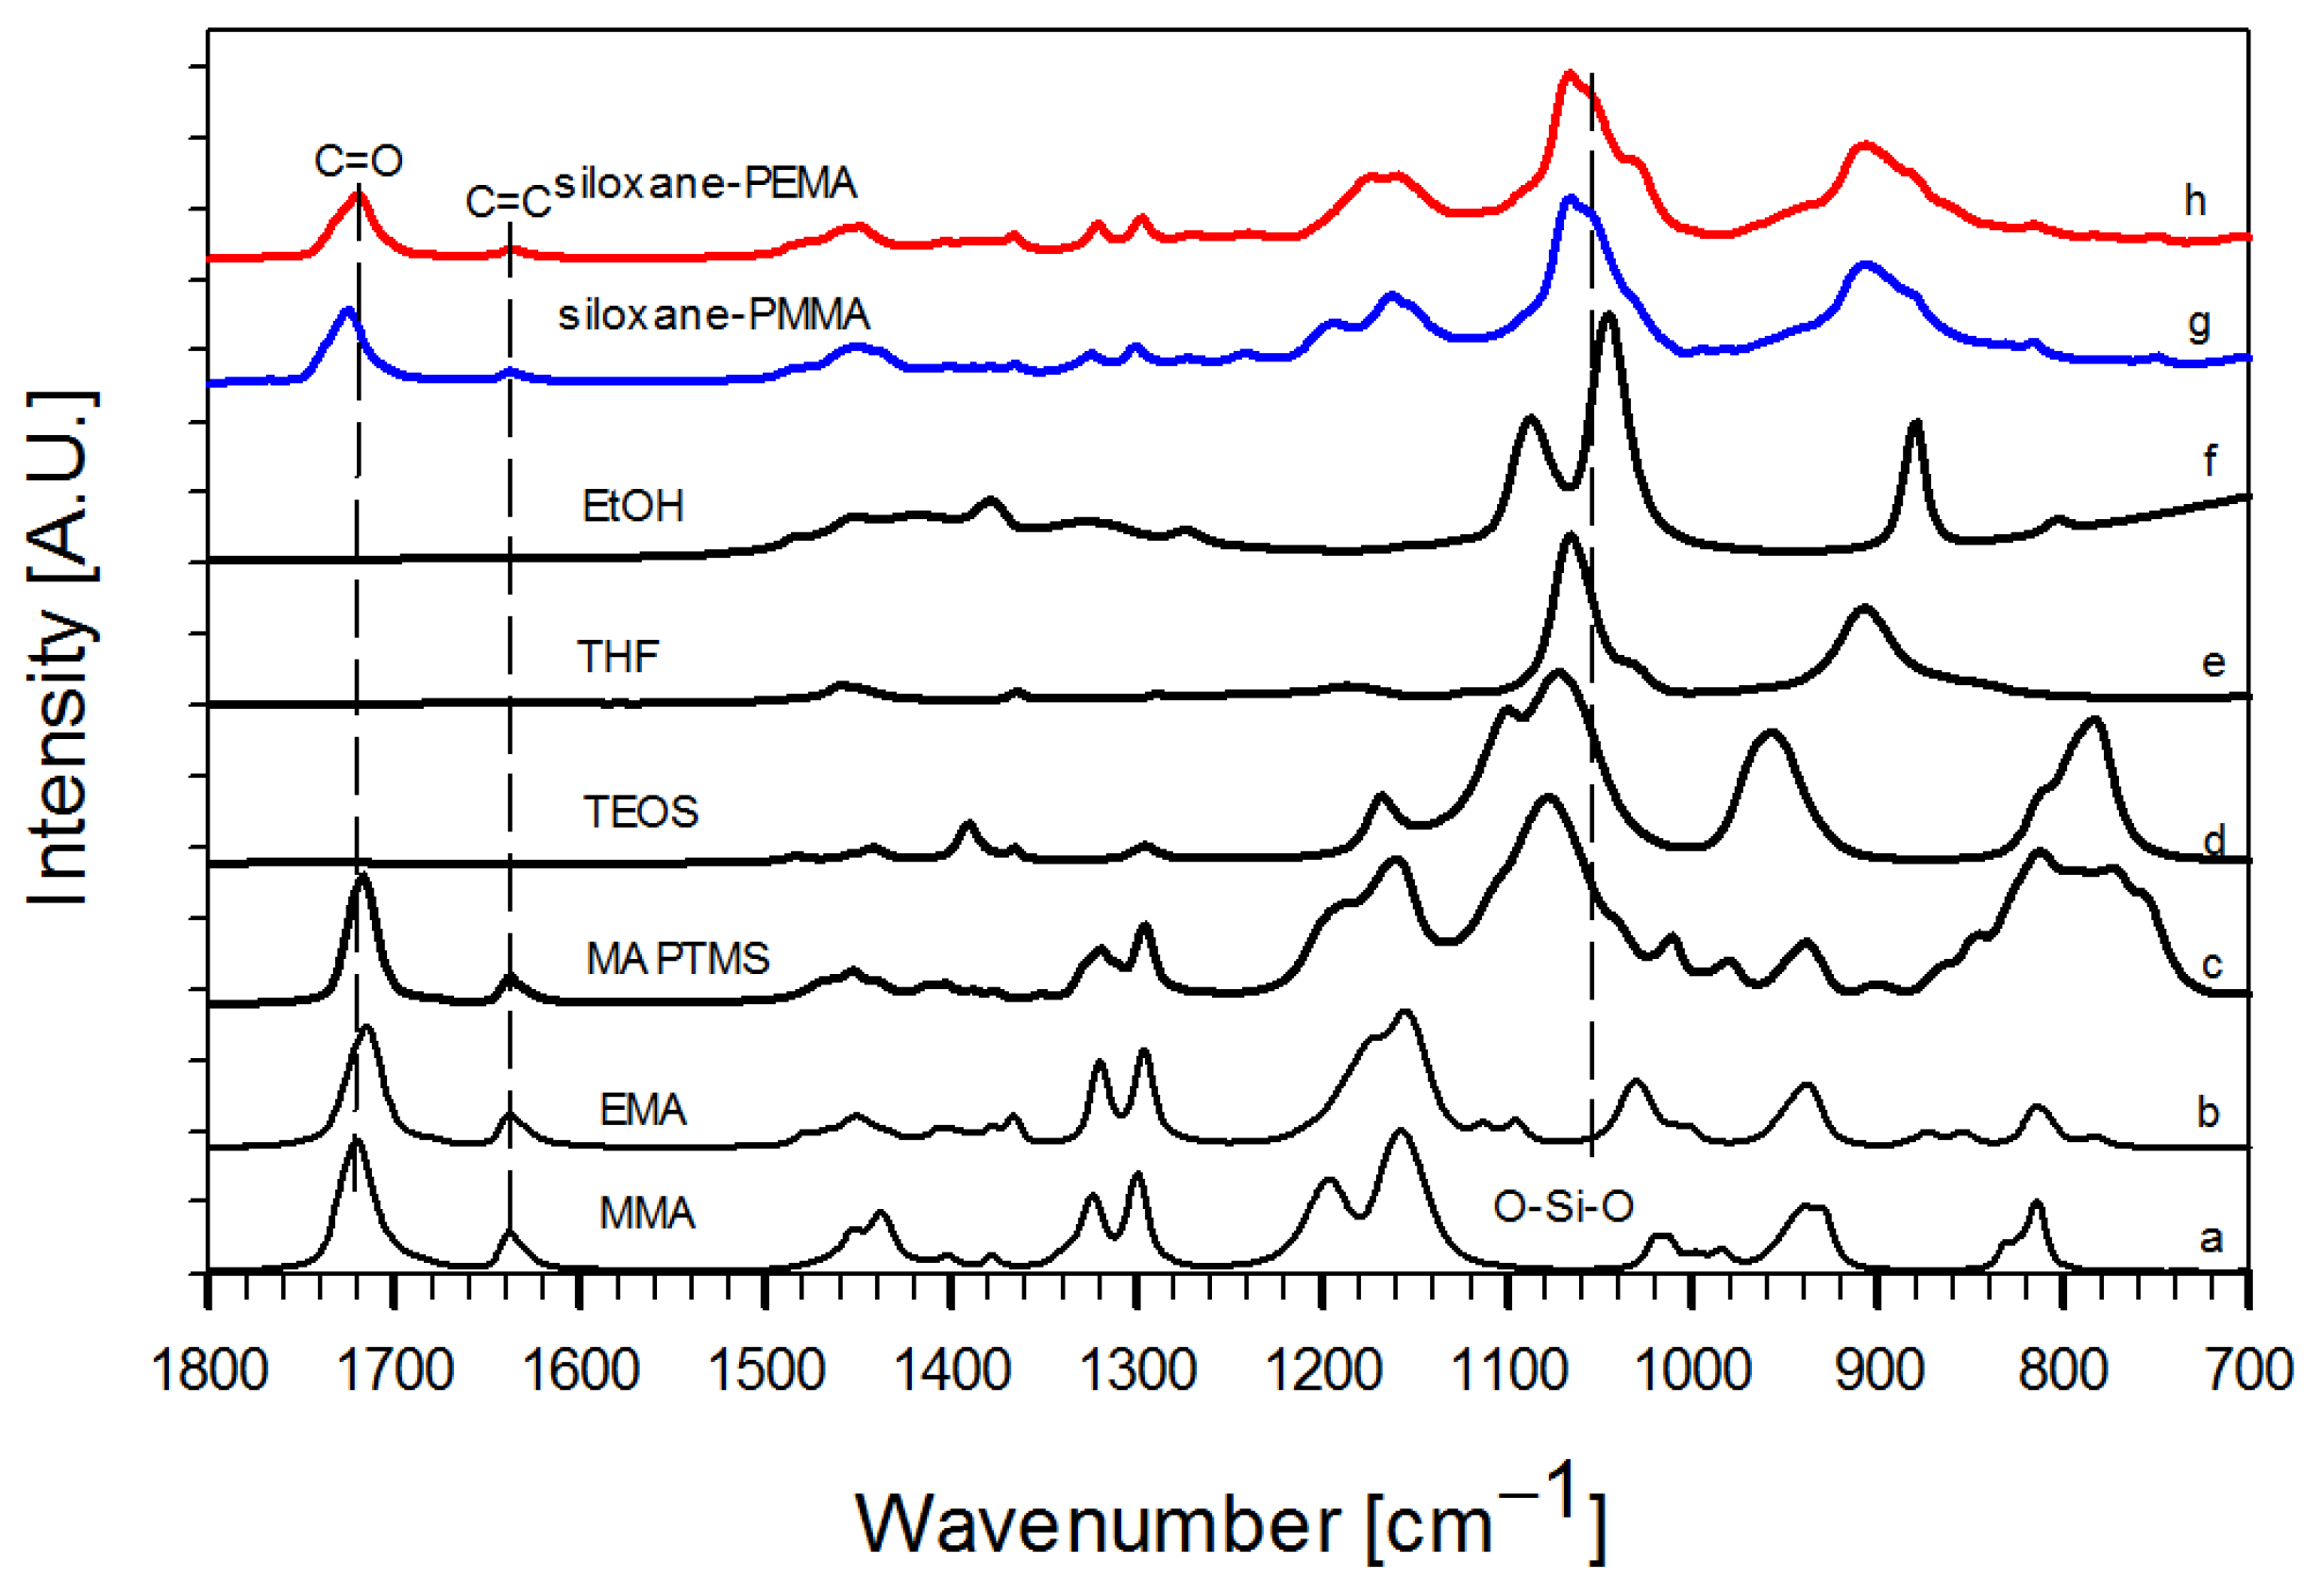
2.2.1. FTIR
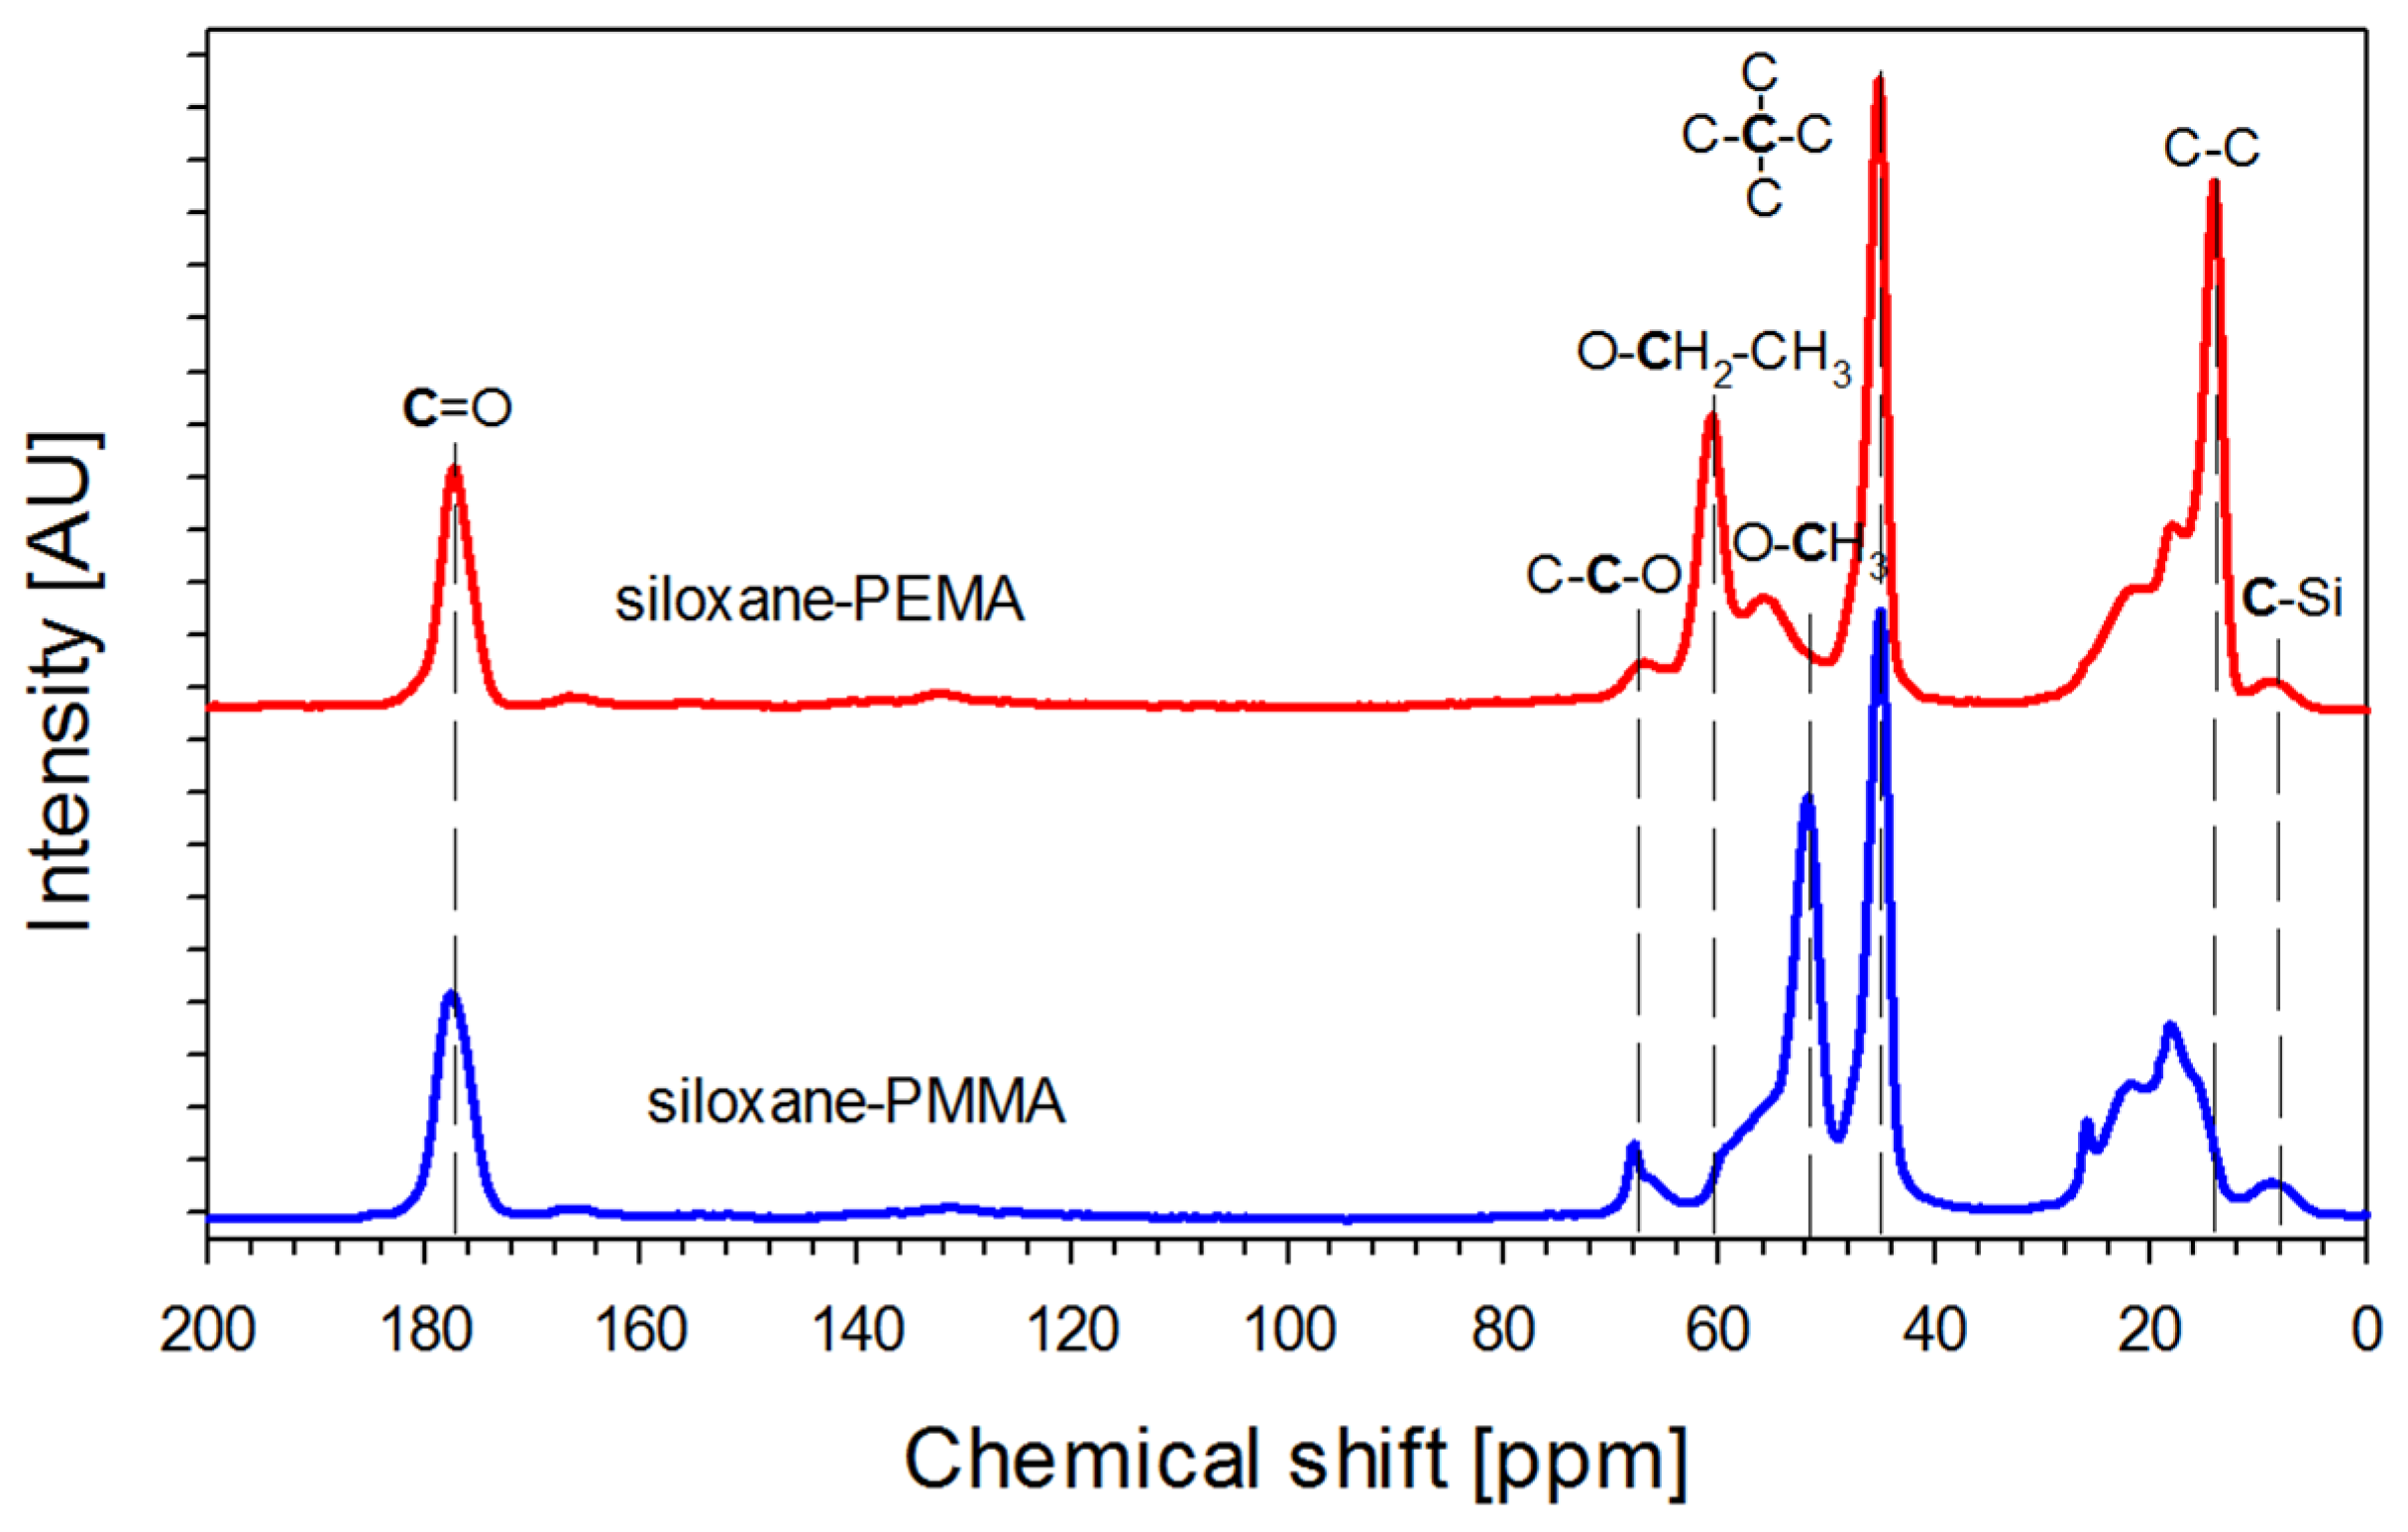
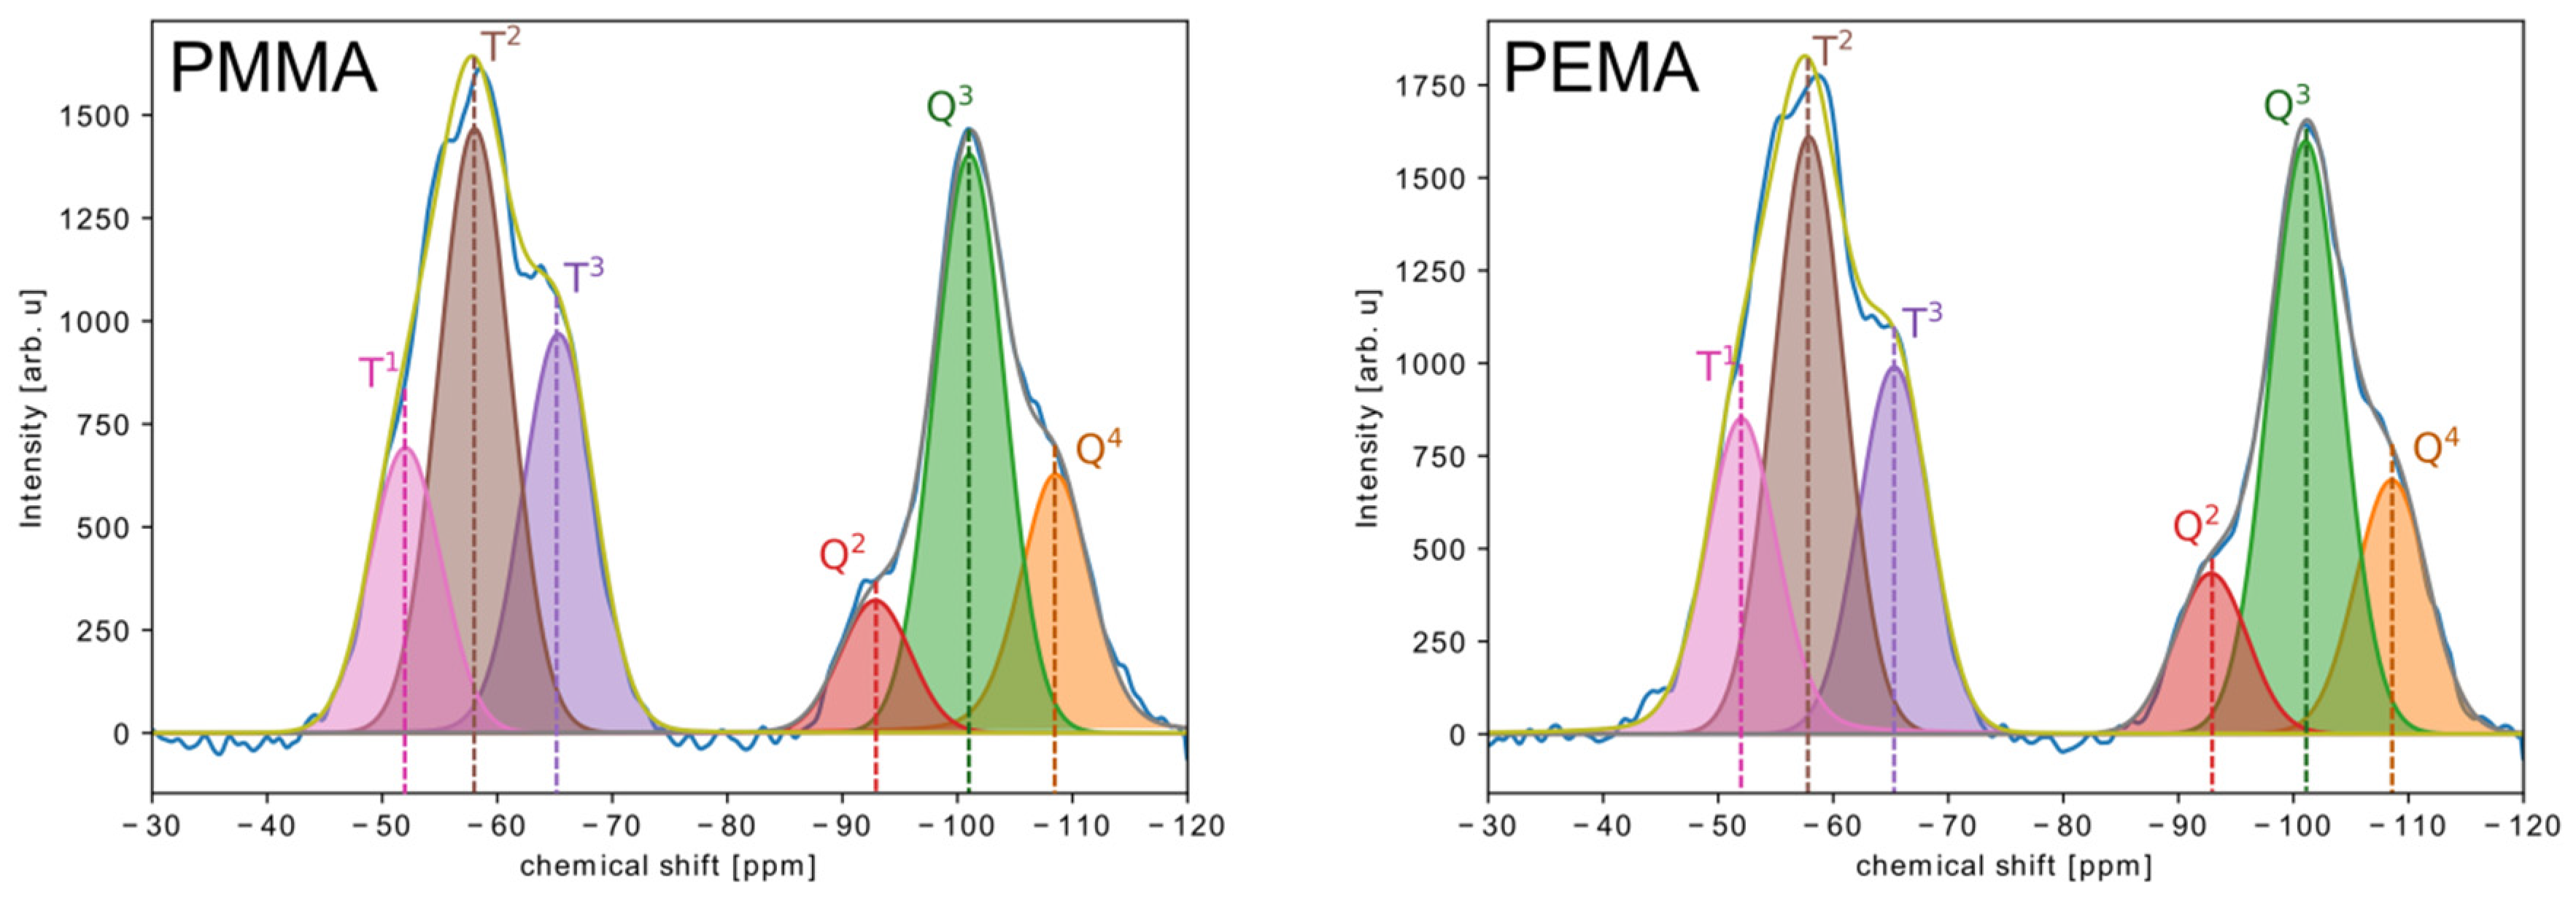
2.2.2. CP/MAS NMR
2.3. Characterization of Coatings
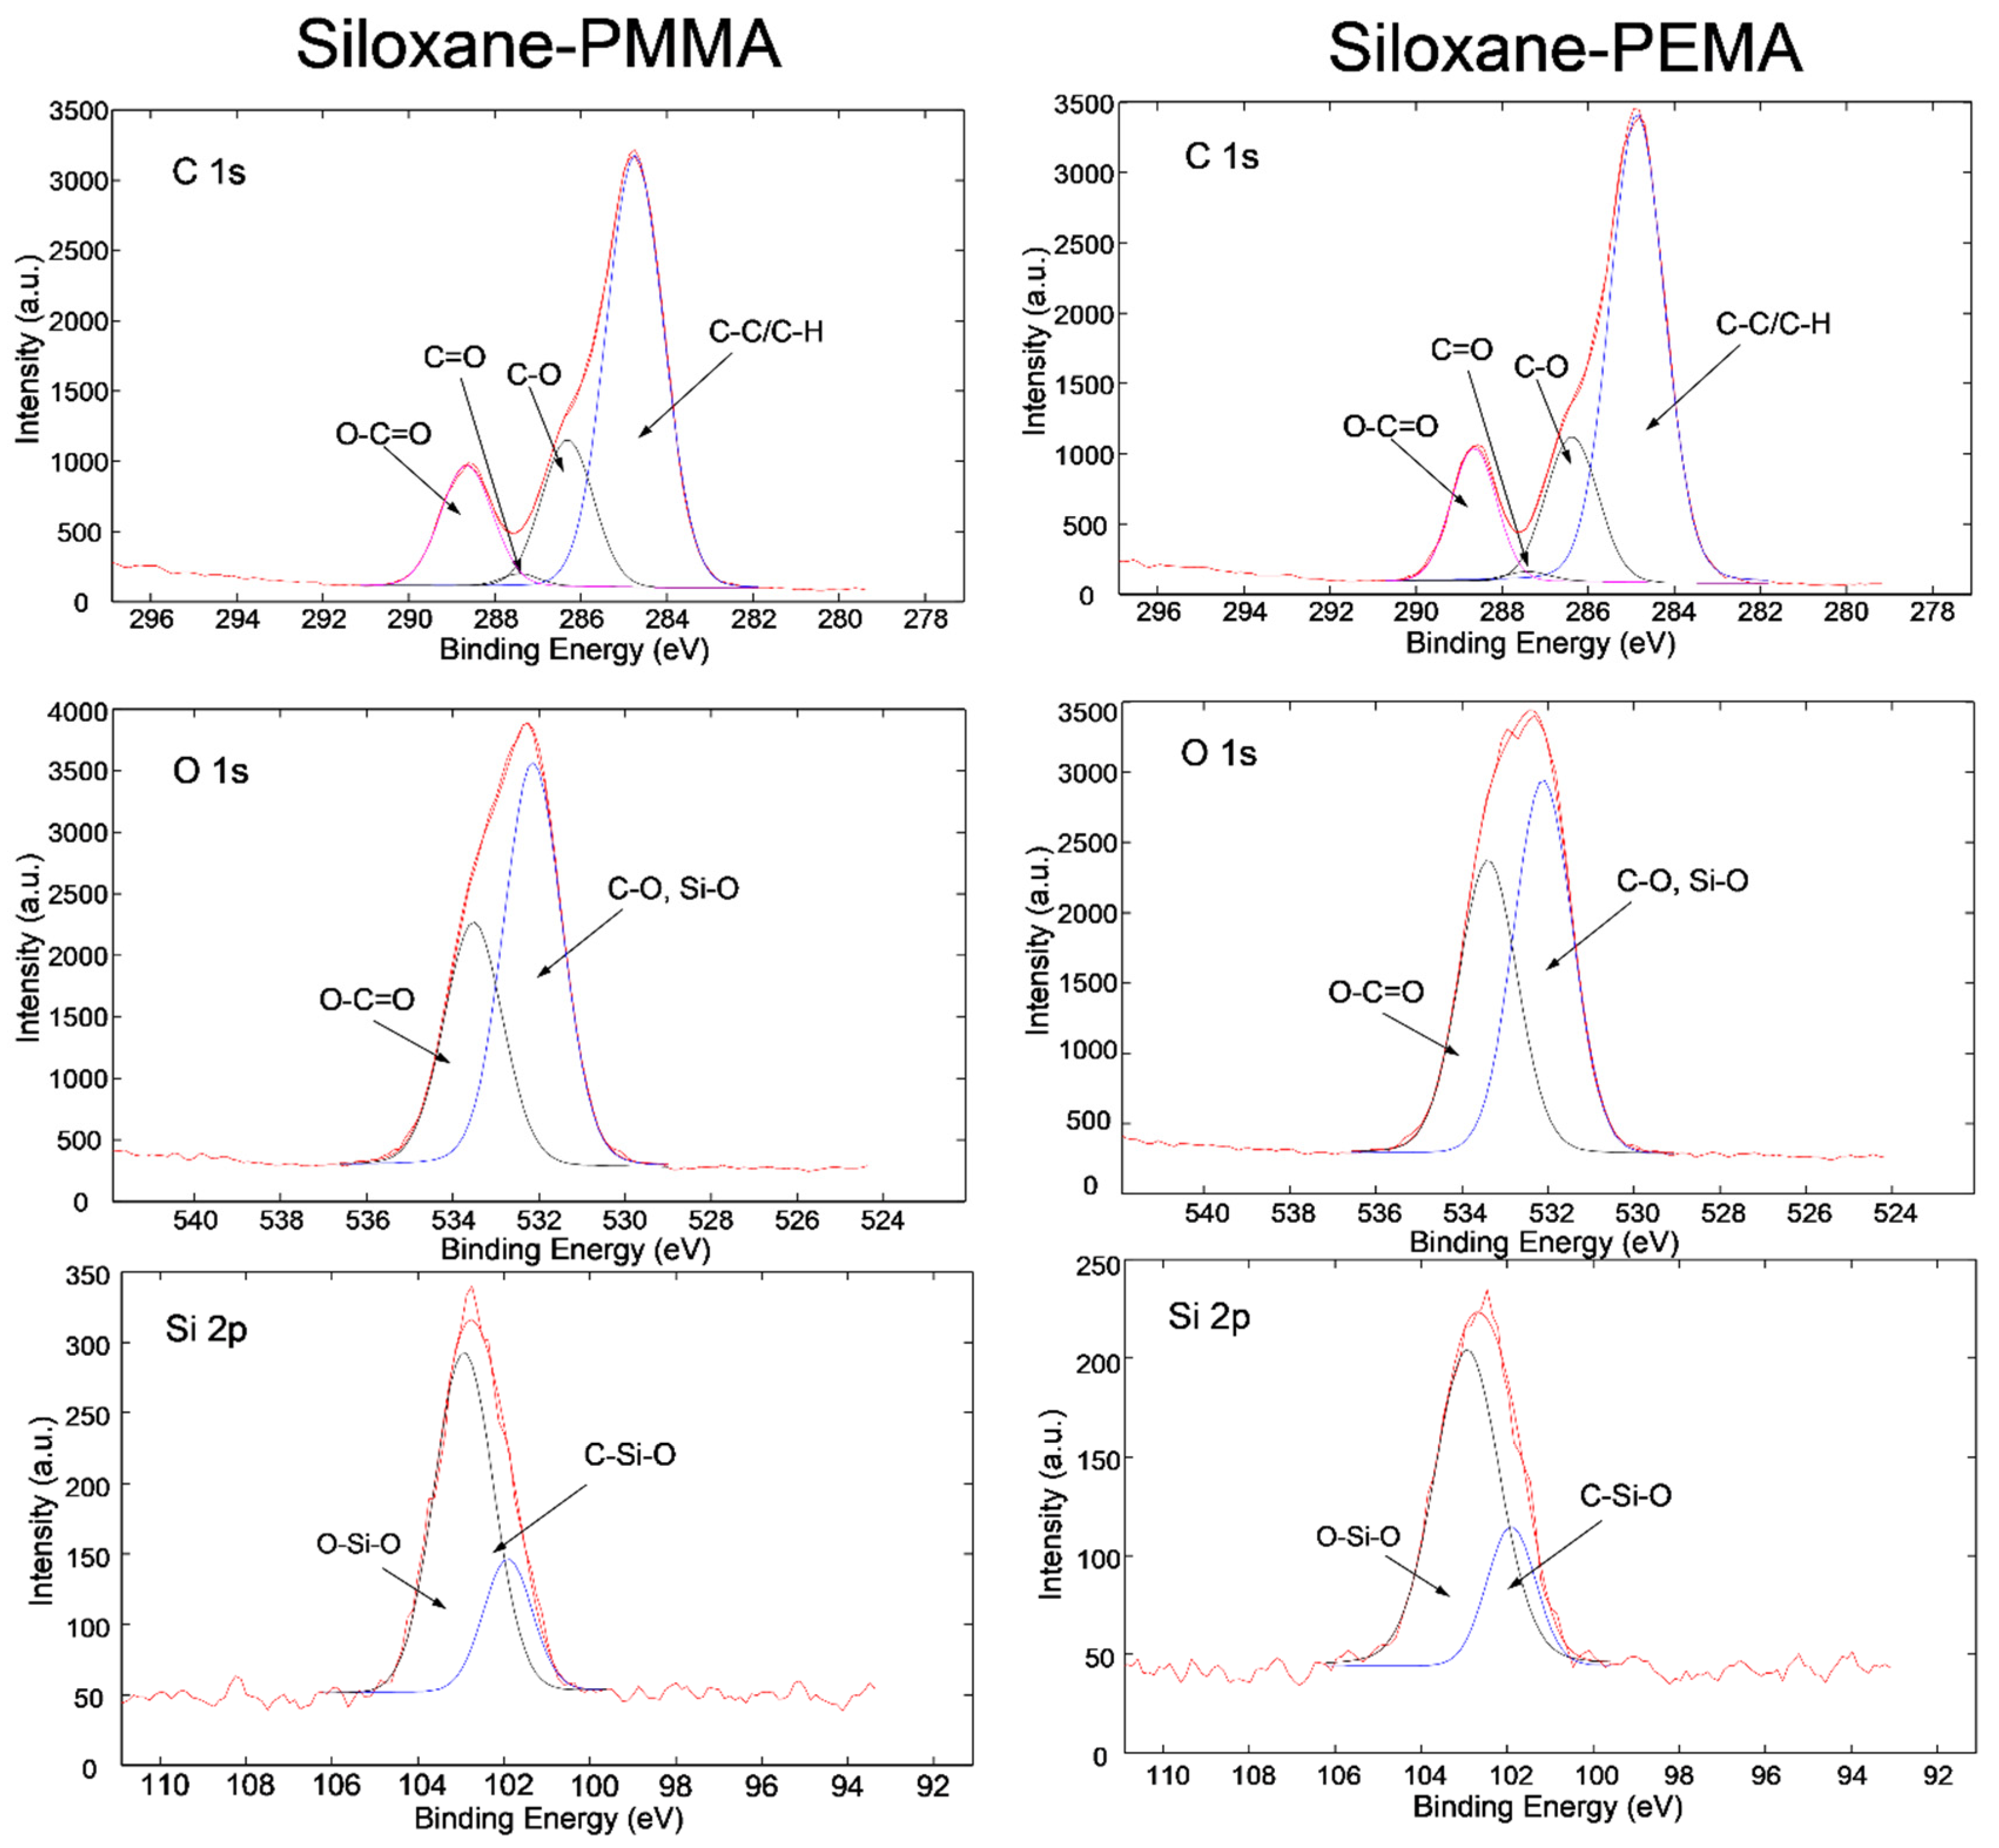
2.3.1. XPS and ToF-SIMS
2.3.2. Coating Thickness, 3-D Topography, Adhesion and Water Contact Angle
2.3.3. Electrochemical Measurements
2.3.4. Salt Spray Test
3. Results and Discussion
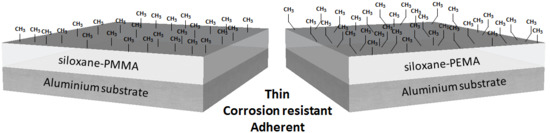
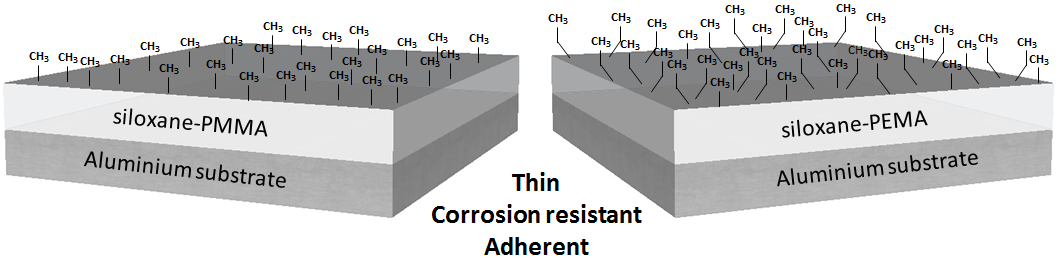
3.1. Chemical Composition, Bonding and Mechanism of Formation of A Sol-Gel Network
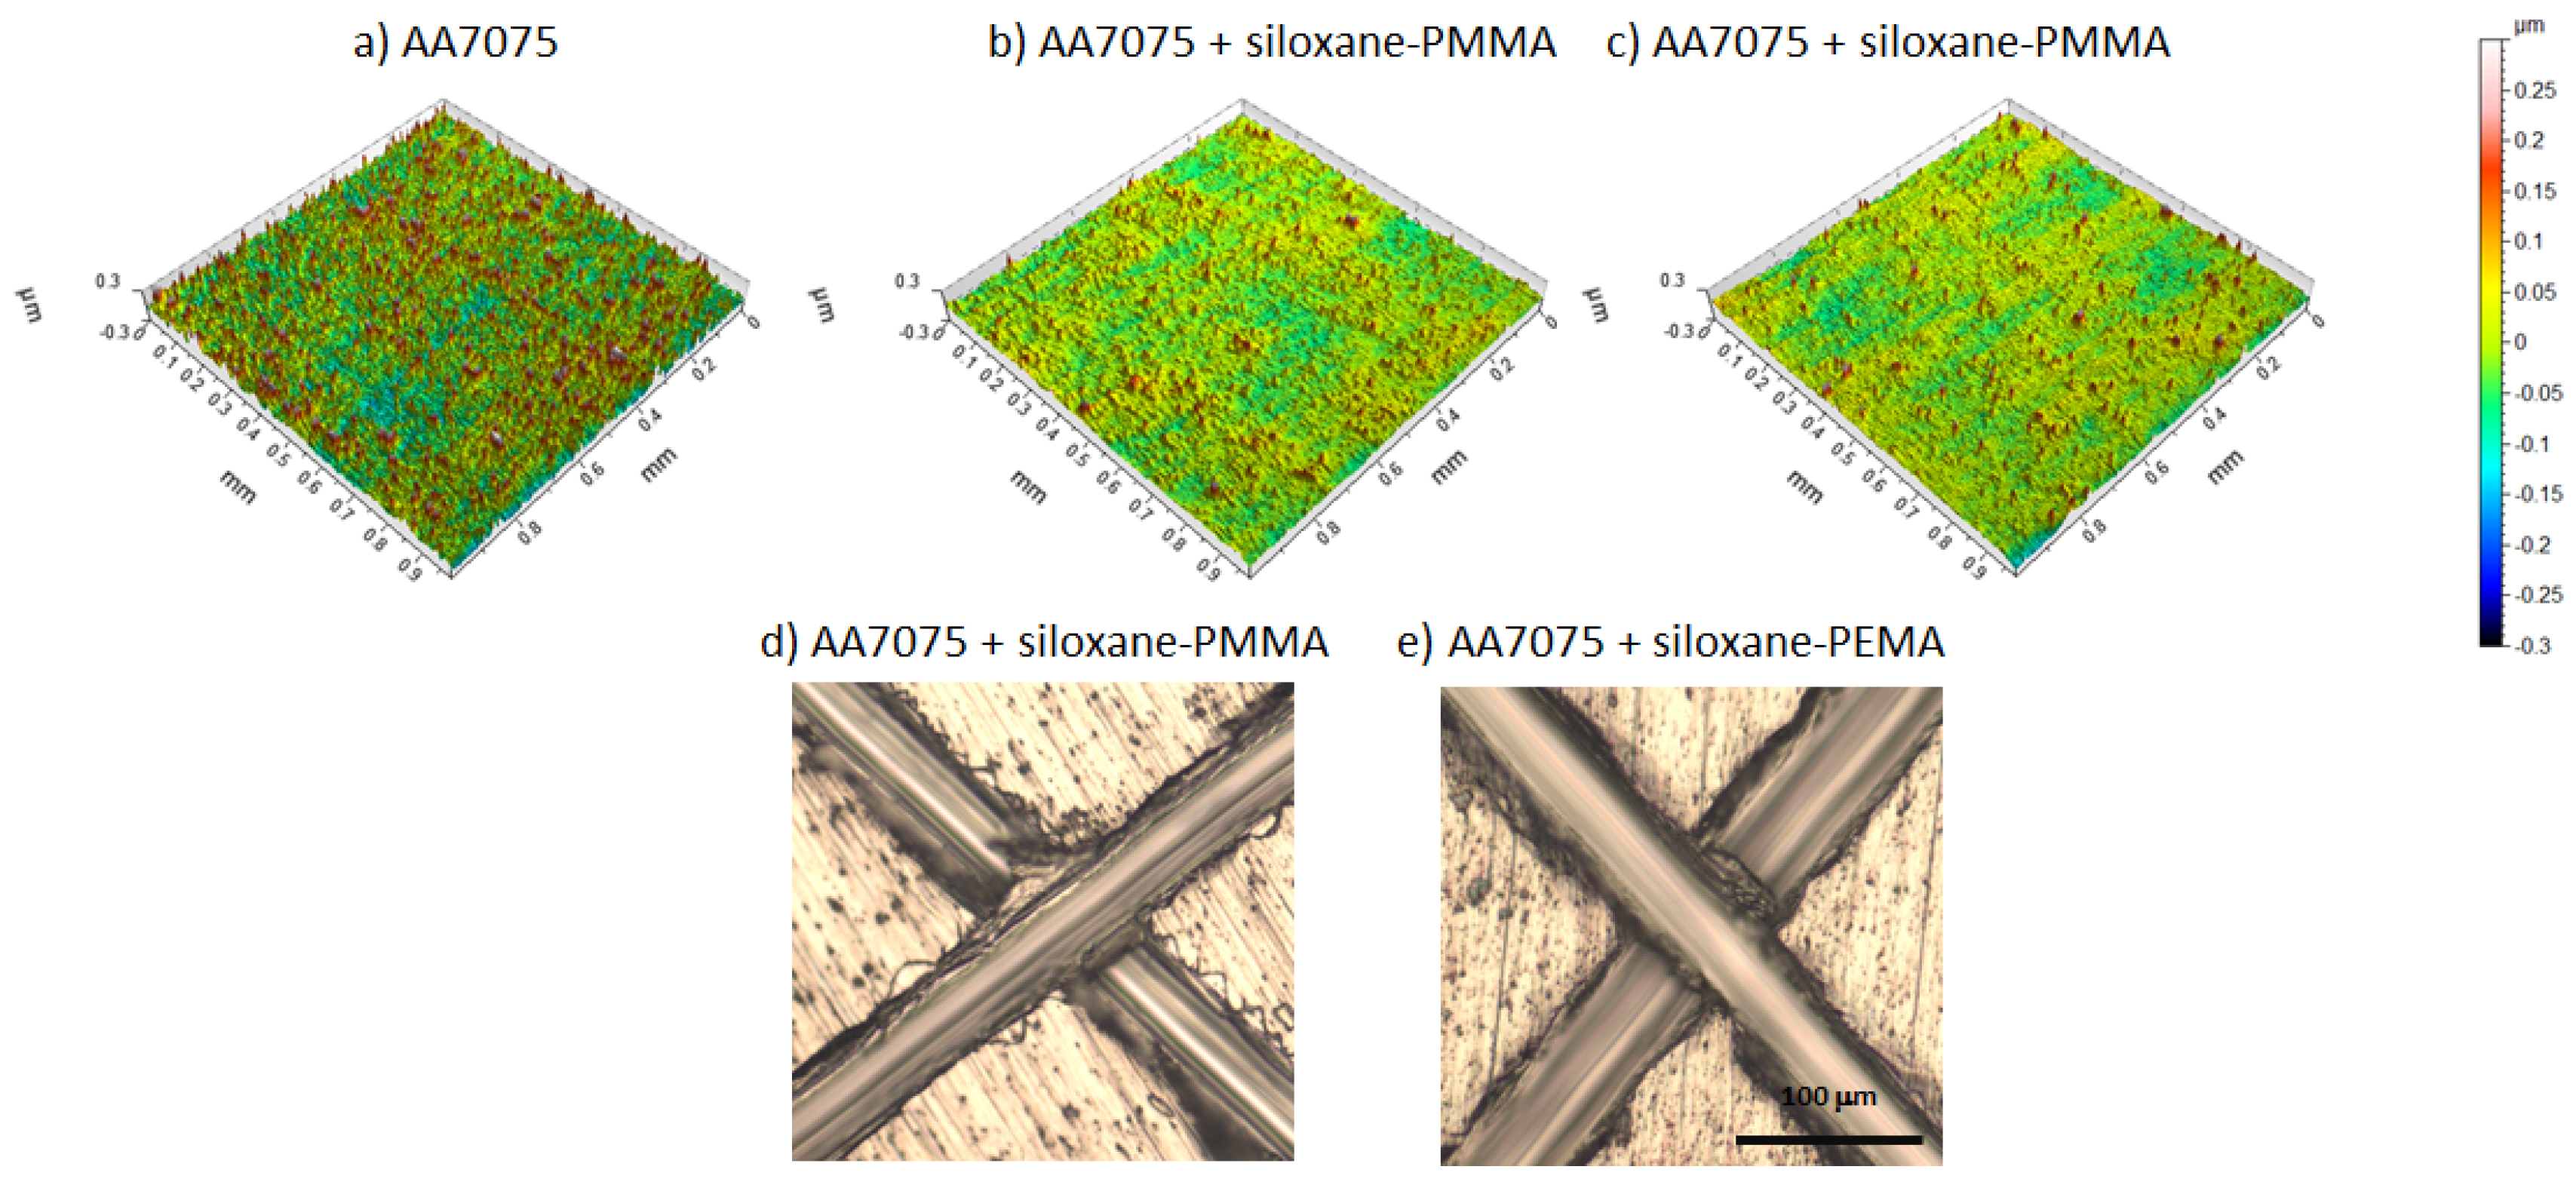
3.2. Thickness, Topography, Water Contact Angle and Adhesion of the Coatings
3.3. Electrochemical and Corrosion Properties of the Coatings
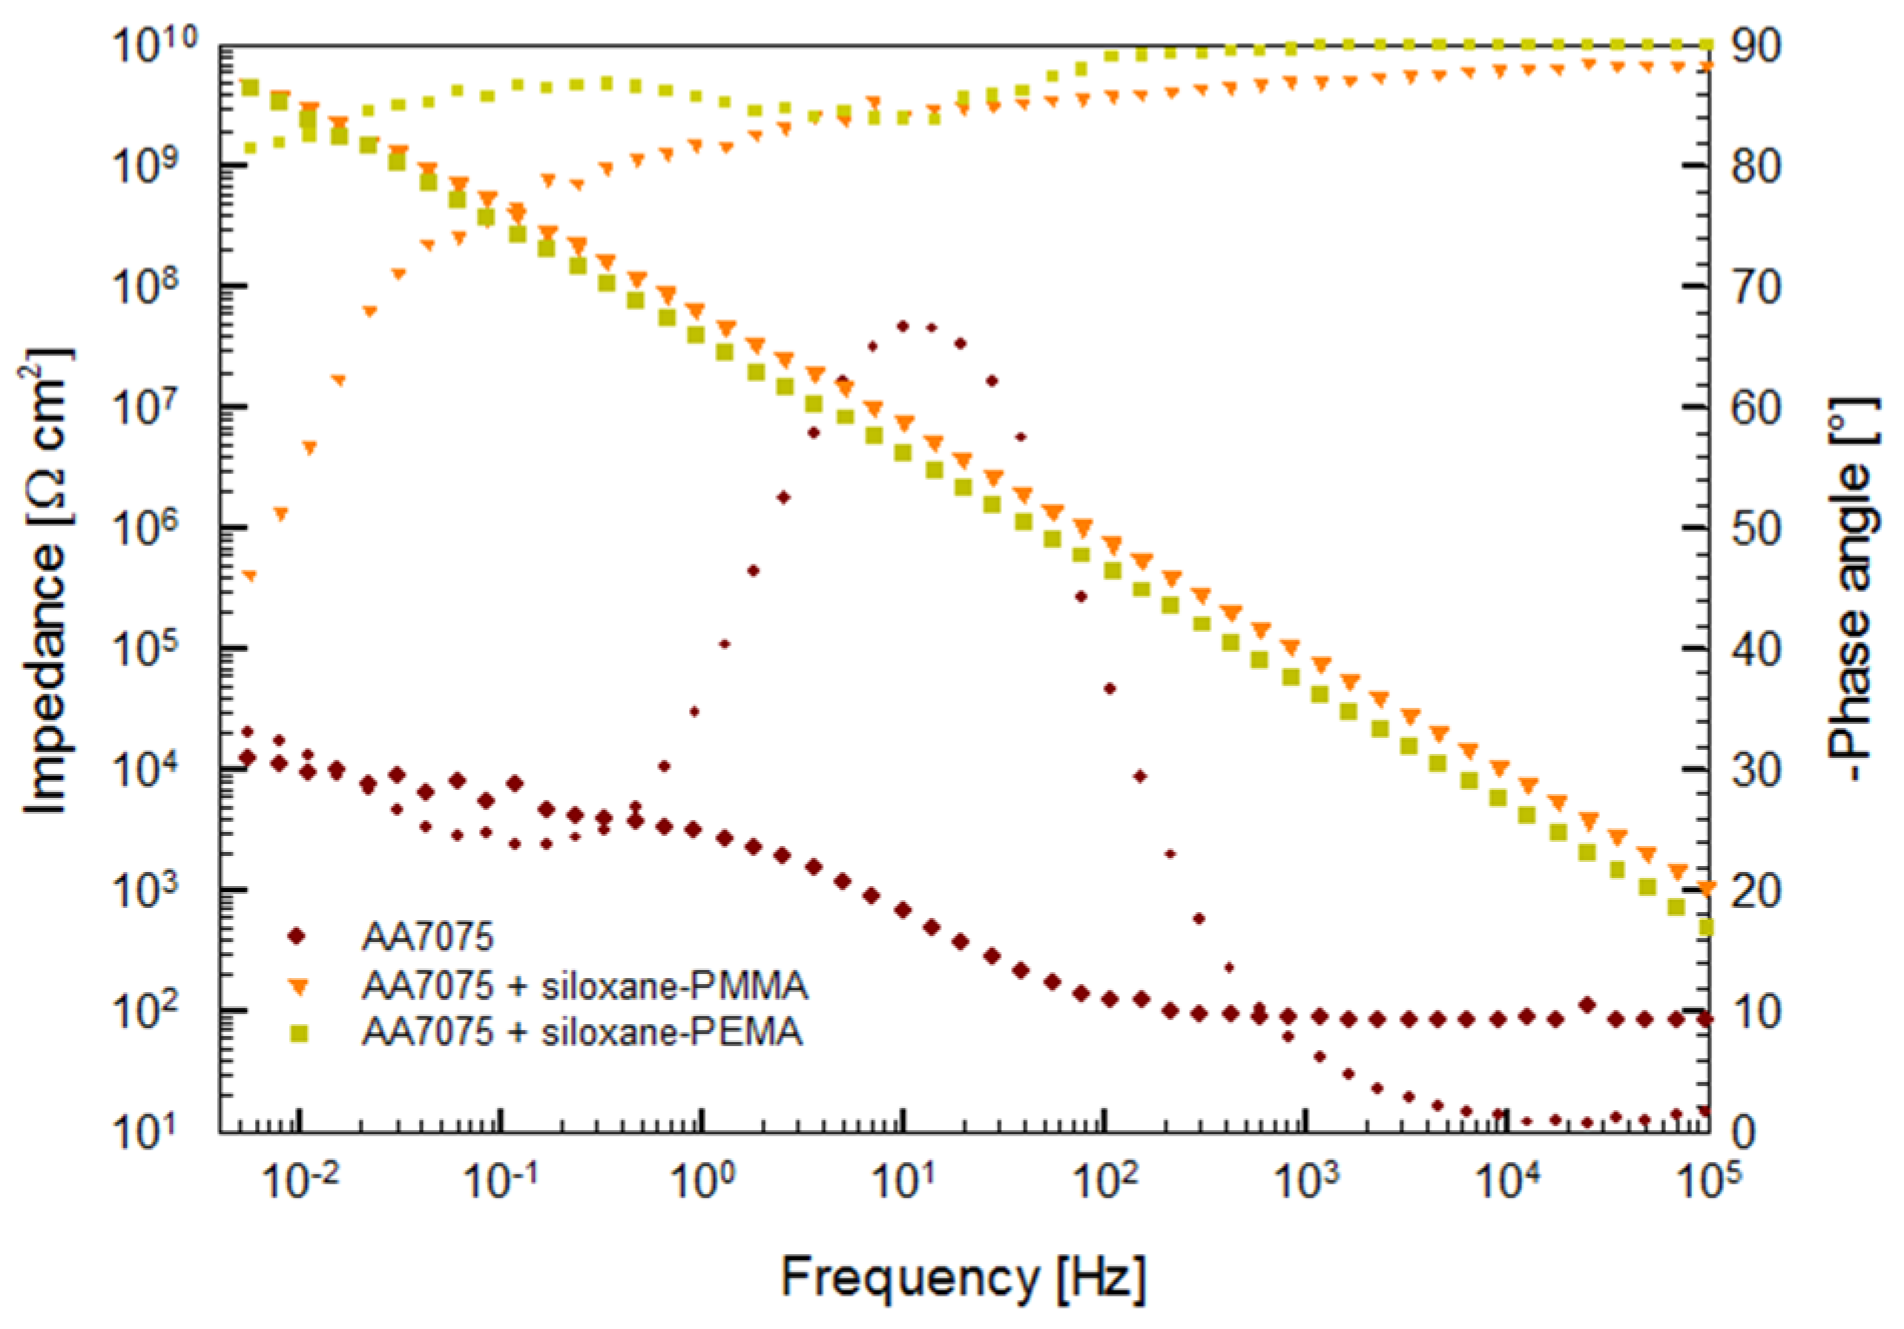
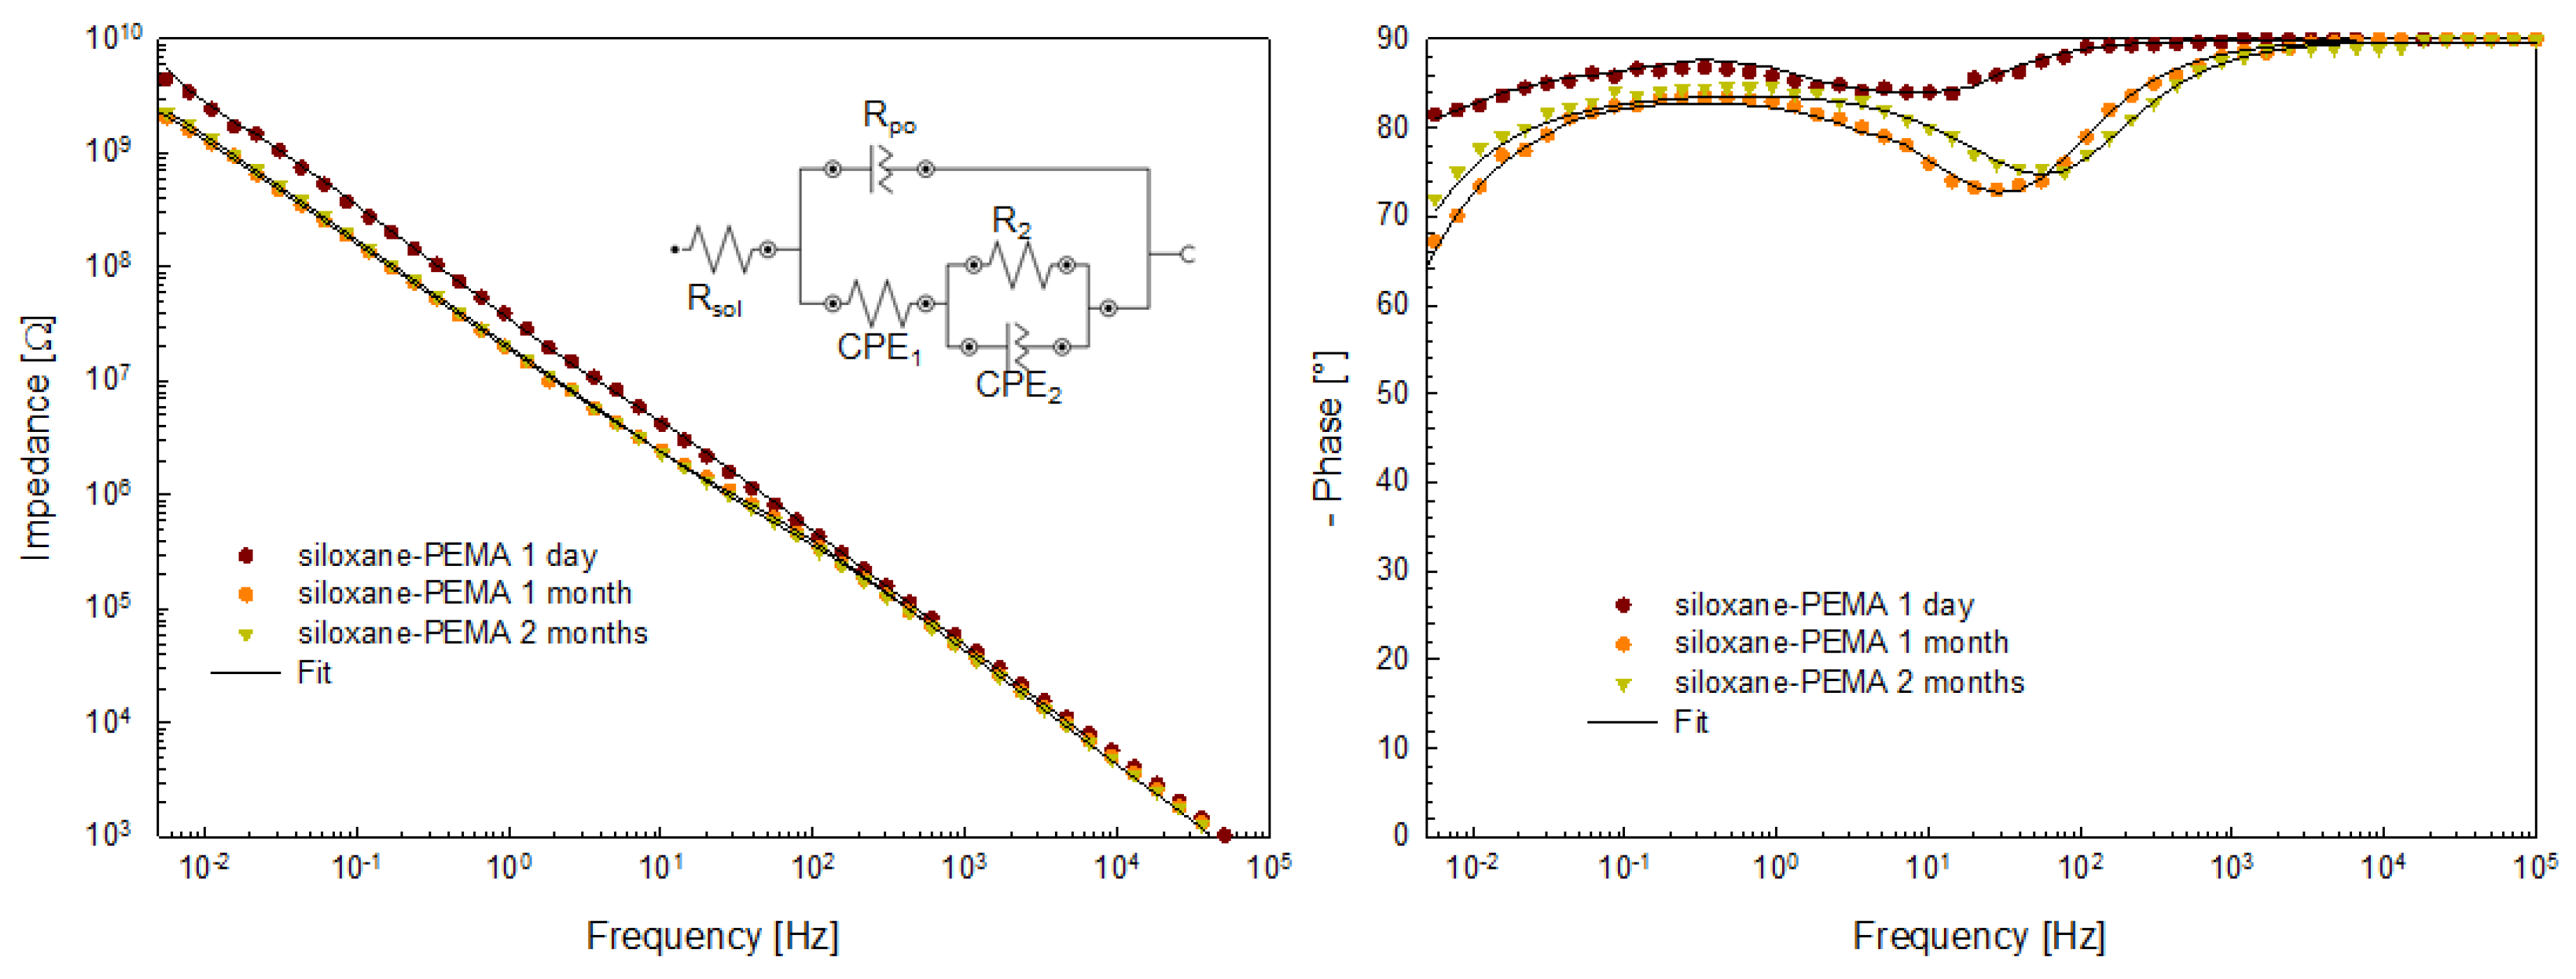
3.3.1. Electrochemical Properties
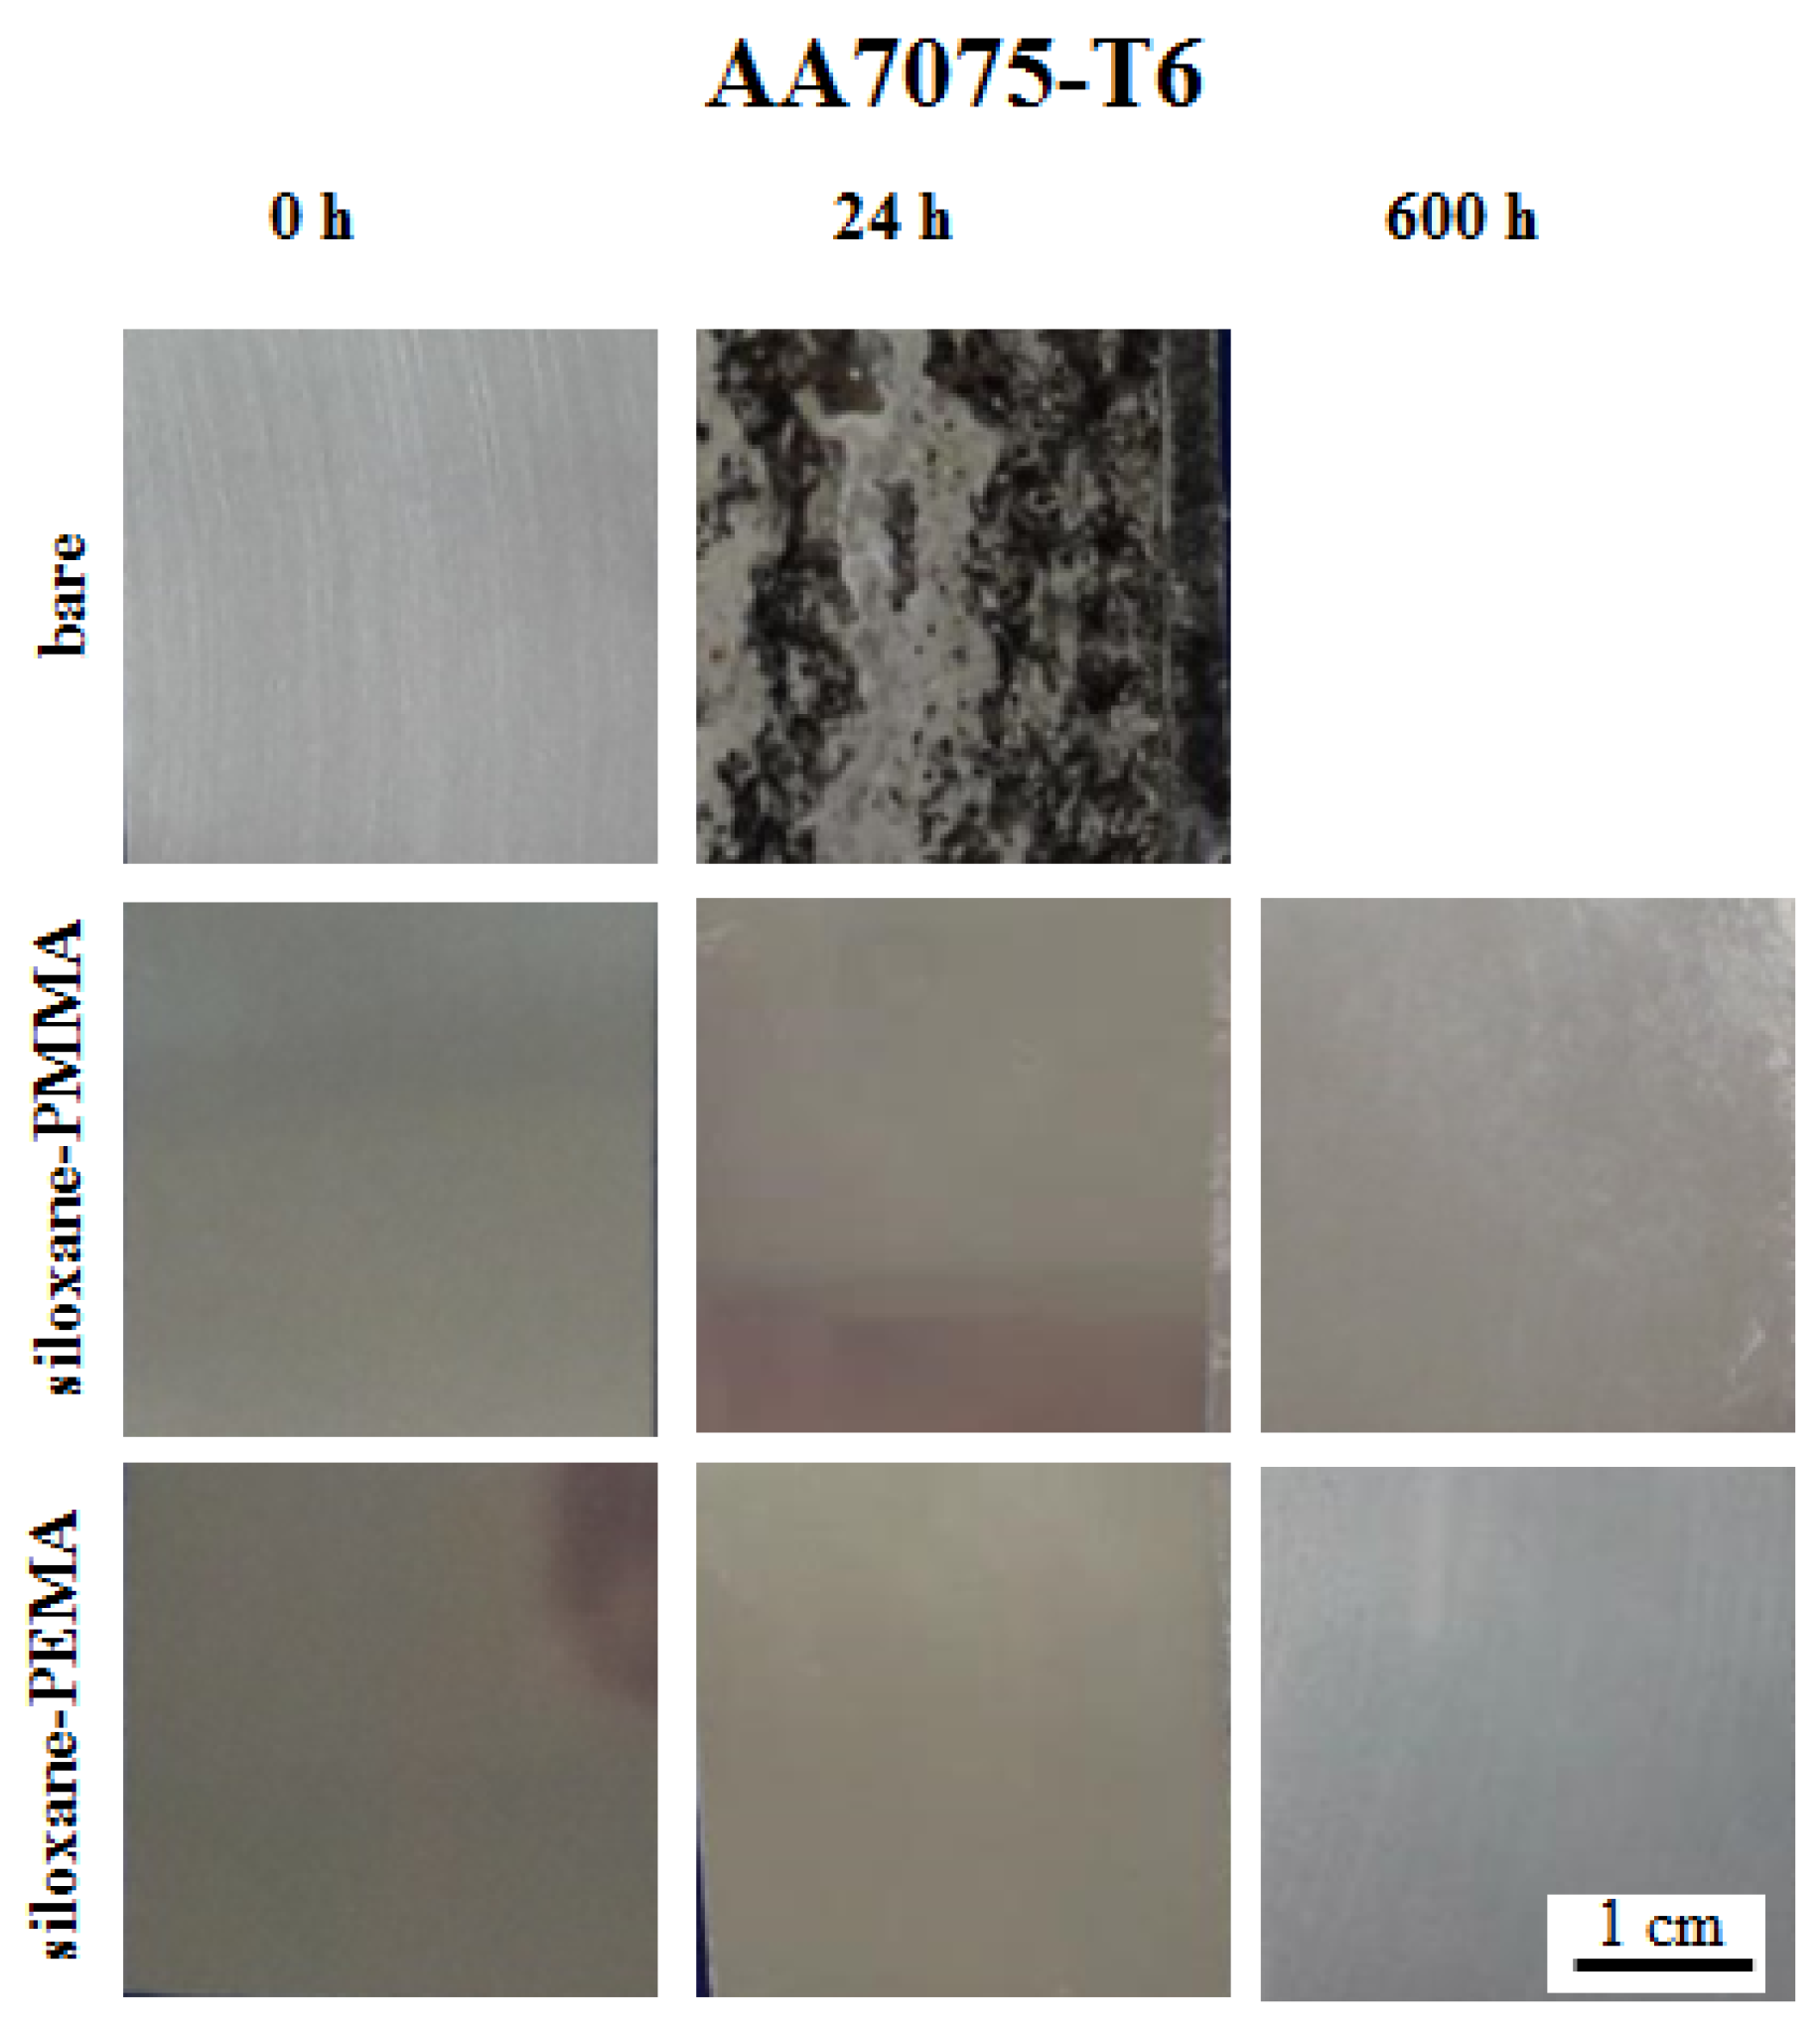
3.3.2. Salt Spray Test
3.3.3. Summary of Coatings Characteristics and Performance
4. Conclusions
Supplementary Materials
Author Contributions
Funding
Acknowledgments
Conflicts of Interest
References
- Abrahami, S.T.; de Kok, J.M.M.; Terryn, H.; Mol, J.M.C. Towards Cr(VI)-free anodization of aluminum alloys for aerospace adhesive bonding applications: A review. Front. Chem. Sci. Eng. 2017, 11, 465–482. [Google Scholar] [CrossRef]
- Figueira, R.B.; Silva, C.J.R.; Pereira, E.V. Organic–inorganic hybrid sol–gel coatings for metal corrosion protection: a review of recent progress. J. Coat. Technol. Res. 2015, 12, 1–35. [Google Scholar] [CrossRef]
- Sakai, R.T.; Di Da Cruz, F.M.L.; De Melo, H.G.; Benedetti, A.V.; Santilli, C.V.; Suegama, P.H. Electrochemical study of TEOS, TEOS/MPTS, MPTS/MMA and TEOS/MPTS/MMA films on tin coated steel in 3.5% NaCl solution. Prog. Org. Coat. 2012, 74, 288–301. [Google Scholar] [CrossRef]
- Sarmento, V.H.V.; Schiavetto, M.G.; Hammer, P.; Benedetti, A.V.; Fugivara, C.S.; Suegama, P.H.; Pulcinelli, S.H.; Santilli, C.V. Corrosion protection of stainless steel by polysiloxane hybrid coatings prepared using the sol-gel process. Surf. Coat. Technol. 2010, 204, 2689–2701. [Google Scholar] [CrossRef]
- Hammer, P.; Dos Santos, F.C.; Cerrutti, B.M.; Pulcinelli, S.H.; Santilli, C.V. Highly corrosion resistant siloxane-polymethyl methacrylate hybrid coatings. J. Sol-Gel Sci. Technol. 2012, 63, 266–274. [Google Scholar] [CrossRef]
- dos Santos, F.C.; Harb, S.V.; Menu, M.-J.; Turq, V.; Pulcinelli, S.H.; Santilli, C.V.; Hammer, P. On the structure of high performance anticorrosive PMMA–siloxane–silica hybrid coatings. RSC Adv. 2015, 5, 106754–106763. [Google Scholar] [CrossRef]
- Hammer, P.; Schiavetto, M.G.; dos Santos, F.C.; Benedetti, A.V.; Pulcinelli, S.H.; Santilli, C.V. Improvement of the corrosion resistance of polysiloxane hybrid coatings by cerium doping. J. Non-Cryst. Solids 2010, 356, 2606–2612. [Google Scholar] [CrossRef]
- Trentin, A.; de Gasparini, A.L.; Faria, F.A.; Harb, S.V.; dos Santos, F.C.; Pulcinelli, S.H.; Santilli, C.V.; Hammer, P. Barrier properties of high performance PMMA-silica anticorrosion coatings. Prog. Org. Coat. 2020, 138, 105398. [Google Scholar] [CrossRef]
- Tiringer, U.; Durán, A.; Castro, Y.; Milošev, I. Self-Healing Effect of Hybrid Sol-Gel Coatings Based on GPTMS, TEOS, SiO2 Nanoparticles and Ce(NO3)3 Applied on Aluminum Alloy 7075-T6. J. Electrochem. Soc. 2018, 165, C213–C225. [Google Scholar] [CrossRef]
- Suegama, P.H.; Sarmento, V.H.V.; Montemor, M.F.; Benedetti, A.V.; de Melo, H.G.; Aoki, I.V.; Santilli, C.V. Effect of cerium (IV) ions on the anticorrosion properties of siloxane-poly(methyl methacrylate) based film applied on tin coated steel. Electrochim. Acta 2010, 55, 5100–5109. [Google Scholar] [CrossRef]
- Rodič, P.; Katić, J.; Korte, D.; Desimone, P.; Franko, M.; Ceré, S.; Metikoš-Huković, M.; Milošev, I. The Effect of Cerium Ions on the Structure, Porosity and Electrochemical Properties of Si/Zr-Based Hybrid Sol-Gel Coatings Deposited on Aluminum. Metals 2018, 8, 248. [Google Scholar] [CrossRef]
- Mosa, J.; Rosero-Navarro, N.C.; Aparicio, M. Active corrosion inhibition of mild steel by environmentally-friendly Ce-doped organic–inorganic sol–gel coatings. RSC Adv. 2016, 6, 39577–39586. [Google Scholar] [CrossRef]
- Harb, S.V.; Pulcinelli, S.H.; Santilli, C.V.; Knowles, K.M.; Hammer, P. A Comparative Study on Graphene Oxide and Carbon Nanotube Reinforcement of PMMA-Siloxane-Silica Anticorrosive Coatings. ACS Appl. Mater. Inter. 2016, 8, 16339–16350. [Google Scholar] [CrossRef] [PubMed]
- Harb, S.V.; Cerrutti, B.M.; Pulcinelli, S.H.; Santilli, C.V.; Hammer, P. Siloxane–PMMA hybrid anti-corrosion coatings reinforced by lignin. Surf. Coat. Technol. 2015, 275, 9–16. [Google Scholar] [CrossRef]
- Trentin, A.; Harb, S.V.; Uvida, M.C.; Pulcinelli, S.H.; Santilli, C.V.; Marcoen, K.; Pletincx, S.; Terryn, H.; Hauffman, T.; Hammer, P. Dual Role of Lithium on the Structure and Self-Healing Ability of PMMA-Silica Coatings on AA7075 Alloy. ACS Appl. Mater. Inter. 2019, 11, 40629–40641. [Google Scholar] [CrossRef]
- Davis, J.R. Corrosion of Aluminum and Aluminum Alloys; ASM International: Cleveland, OH, USA, 1999. [Google Scholar]
- Vargel, C. Corrosion of Aluminum, 1st ed.; Elsevier: Amsterdam, The Netherlands, 2004. [Google Scholar]
- Starke, E.A.; Staley, J.T. Application of modern aluminum alloys to aircraft. Prog. Aerospace Sci. 1996, 32, 131–172. [Google Scholar] [CrossRef]
- Buchheit, R.G. A Compilation of Corrosion Potentials Reported for Intermetallic Phases in Aluminum Alloys. J. Electrochem. Soc. 1995, 142, 3994–3996. [Google Scholar] [CrossRef]
- Rodič, P.; Milošev, I. Corrosion Inhibition of Pure Aluminium and Alloys AA2024-T3 and AA7075-T6 by Cerium(III) and Cerium(IV) Salts. J. Electrochem. Soc. 2016, 163, C85–C93. [Google Scholar] [CrossRef]
- Scofield, J.H. Hartree-Slater subshell photoionization cross-sections at 1254 and 1487 eV. J. Electron Spectrosc. Relat. Phenom 1976, 8, 129–137. [Google Scholar] [CrossRef]
- Reilman, R.F.; Msezane, S.T.; Manson, J. Relative intensities in photoelectron spectroscopy pf atoms and molecules. J. Electron Spectrosc. Relat. Phenom. 1976, 8, 38–44. [Google Scholar] [CrossRef]
- ASTM D3359-09 Standard Test Methods for Measuring Adhesion by Tape Test; ASTM: West Conshohocken, PA, USA, 2009.
- Boukamp, B. A Nonlinear Least Squares Fit procedure for analysis of immittance data of electrochemical systems. Solid State Ionics 1986, 20, 31–44. [Google Scholar] [CrossRef]
- ASTM B117-07a Standard Practice for Operating Salt Spray (Fog) Apparatus; ASTM: West Conshohocken, PA, USA, 2007.
- ASTM D610-01 Standard Test Method for Evaluating Degree of Rusting on Painted Steel Surfaces; ASTM: West Conshohocken, PA, USA, 2001.
- Dazzi, A.; Deniset-Besseau, A.; Lasch, P. Minimising contributions from scattering in infrared spectra by means of an integrating sphere. Analyst 2013, 138, 4191. [Google Scholar] [CrossRef] [PubMed]
- Rodič, P.; Iskra, J.; Milošev, I. A hybrid organic–inorganic sol–gel coating for protecting aluminium alloy 7075-T6 against corrosion in Harrison’s solution. J. Sol-Gel Sci. Technol. 2014, 70, 90–103. [Google Scholar] [CrossRef]
- Rodič, P.; Iskra, J.; Milošev, I. Study of a sol–gel process in the preparation of hybrid coatings for corrosion protection using FTIR and 1H NMR methods. J. Non-Cryst. Solids 2014, 396–397, 25–35. [Google Scholar] [CrossRef]
- Pellice, S.A.; Williams, R.J.J.; Sobrados, I.; Sanz, J.; Castro, Y.; Aparicio, M.; Durán, A. Solutions of hybrid silica microgels as precursors of sol–gel coatings. J. Mater. Chem. 2006, 16, 3318–3325. [Google Scholar] [CrossRef][Green Version]
- Rubio, F.; Rubio, J.; Oteo, J.L. A FT-IR Study of the Hydrolysis of Tetraethylorthosilicate (TEOS). Spectrosc. Lett. 1998, 31, 199–219. [Google Scholar] [CrossRef]
- Rodič, P.; Milošev, I.; Lekka, M.; Andreatta, F.; Fedrizzi, L. Corrosion behaviour and chemical stability of transparent hybrid sol-gel coatings deposited on aluminium in acidic and alkaline solutions. Prog. Org. Coat. 2018, 124, 286–295. [Google Scholar] [CrossRef]
- Criado, M.; Sobrados, I.; Sanz, J. Polymerization of hybrid organic-inorganic materials from several silicon compounds followed by TGA/DTA, FTIR and NMR techniques. Prog. Org. Coat. 2014, 77, 880–891. [Google Scholar] [CrossRef]
- Han, Y.-H.; Taylor, A.; Mantle, M.D.; Knowles, K.M. UV curing of organic–inorganic hybrid coating materials. J. Sol-Gel Sci. Technol. 2007, 43, 111–123. [Google Scholar] [CrossRef]
- Milošev, I.; Jovanović, Ž.; Bajat, J.B.; Jančić-Heinemann, R.; Mišković-Stanković, V.B. Surface Analysis and Electrochemical Behavior of Aluminum Pretreated by Vinyltriethoxysilane Films in Mild NaCl Solution. J. Electrochem. Soc. 2012, 159, C303–C311. [Google Scholar] [CrossRef]
- Zhang, D.; Wang, L.; Qian, H.; Li, X. Superhydrophobic surfaces for corrosion protection: a review of recent progresses and future directions. J. Coat. Technol. Res. 2016, 13, 11–29. [Google Scholar] [CrossRef]
- Mansfeld, F. Use of electrochemical impedance spectroscopy for the study of corrosion protection by polymer coatings. J. Appl. Electrochem. 1995, 25, 187–202. [Google Scholar] [CrossRef]
- Mitton, D.B.; Latanision, R.M.; Bellucci, F. The Effect of Post-Cure Annealing on the Protective Properties of Polyimides on Chromium Substrates. J. Electrochem. Soc. 1996, 143, 3307–3316. [Google Scholar] [CrossRef]


| Nominal Composition (wt. %) | Si | Fe | Cu | Mg | Zn | Cr | Other | Al |
|---|---|---|---|---|---|---|---|---|
| AA7075-T6 | 0.08 | 0.21 | 1.67 | 2.55 | 5.81 | 0.19 | 0.08 | 89.41 |
| Monomers, Precursors, Solvents and Sols. | Wavenumber (cm−1) |
|---|---|
| MMA | 1720, 1638, 1452, 1438, 1325, 1300, 1198, 1158, 1015, 939, 930, 832, 813 |
| EMA | 1715, 1638, 1452, 1405, 1364, 1318, 1298, 1173, 1158, 1032, 938, 815 |
| MAPTMS | 1720, 1640, 1455, 1407, 1323, 1297, 1190, 1162, 1081, 1014, 980, 940, 816, 792, 775, 755 |
| TEOS | 1392, 1169, 1100, 1075, 960, 812, 785 |
| THF | 1461, 1365, 1065, 1030, 908 |
| Ethanol | 1382, 1088, 1047, 880 |
| water | 1638 |
| siloxane-PMMA | 1055 |
| siloxane-PEMA | 1055 |
| T1 | T2 | T3 | Dc(T) | Q2 | Q3 | Q4 | Dc(Q) | Cd c | |
| Siloxane-PMMA | |||||||||
| Proportions a (%) | 12.7 | 26.9 | 17.8 | 40 | 5.8 | 25.3 | 11.5 | 33.4 | 73.4 |
| Relative proportions b (%) | 22.1 | 46.9 | 31.0 | - | 13.6 | 59.4 | 27.0 | - | - |
| Siloxane-PEMA | |||||||||
| Proportions a (%) | 14.3 | 25.8 | 15.8 | 37.8 | 7.0 | 26.1 | 11.0 | 34.1 | 71.9 |
| Relative proportions b (%) | 25.6 | 46.2 | 28.2 | - | 15.9 | 59.1 | 25.0 | - | - |
| Sample | C (at. %) | O (at. %) | Si (at. %) |
|---|---|---|---|
| siloxane-PMMA | 65.3 | 29.9 | 4.8 |
| siloxane-PEMA | 69.2 | 27.2 | 3.6 |
| Sample | Siloxane-PMMA | Siloxane-PEMA | ||||
|---|---|---|---|---|---|---|
| 1 Day | 1 Month | 2 Months | 1 Day | 1 Month | 2 Months | |
| χ2 | 0.0523 | 0.0539 | 0.0595 | 0.0129 | 0.0337 | 0.0329 |
| Rsol [Ω cm2] | 11 (3.1) * | 10 (4.0) | 12 (2.5) | 13 (2.8) | 10 (1.2) | 10 (2.8) |
| Q1 [nΩ−1 cm−2 sn] | 1.92 (23.2) | 2.12 (13.6) | 1.99 (7.2) | 3.90 (2.5) | 4.99 (3.5) | 4.81 (3.6) |
| n1 | 0.83 (4.0) | 0.76 (3.9) | 0.60 (6.5) | 0.98 (0.3) | 0.97 (0.4) | 0.97 (0.4) |
| Rpo [Ω cm2] | 26 (32.3) | 0.9 (30.1) | 0.9 (30.8) | 27.7 × 10⁶ (27.5) | 2.87 × 10⁶ (9.1) | 1.73 × 10⁶ (10.0) |
| Q2 [nΩ−1 cm−2 sn] | 1.22 (28.6) | 1.89 (15.2) | 2.64 (5.6) | 0.828 (13.4) | 4.60 (4.0) | 4.12 (4.4) |
| n2 | 1.0 (2.2) | 0.99 (1.0) | 0.97 (0.5) | 0.85 (3.5) | 0.89 (0.6) | 0.89 (0.6) |
| R2 [GΩ cm2] | 8.28 (5.6) | 1.63 (2.5) | 0.844 (4.2) | 1100 (45.2) | 6.99 (5.2) | 12.9 (11.1) |
| Coating | Condensation Degree | Thickness | Contact Angle | Roughness | Impedance at 4 mHz After 2 Months in 0.1 M NaCl | Adhesion |
|---|---|---|---|---|---|---|
| siloxane-PMMA | 73.2 % | 5.0 ± 0.3 μm | 70° ± 2° | 0.027 ± 0.001 μm | 0.83 ± 0.03 GΩ cm2 | 5 B |
| siloxane-PEMA | 71.6 % | 6.7 ± 0.3 μm | 76° ± 2° | 0.027 ± 0.001 μm | 3.2 ± 0.4 GΩ cm2 | 5 B |
© 2020 by the authors. Licensee MDPI, Basel, Switzerland. This article is an open access article distributed under the terms and conditions of the Creative Commons Attribution (CC BY) license (http://creativecommons.org/licenses/by/4.0/).
Share and Cite
Hamulić, D.; Rodič, P.; Poberžnik, M.; Jereb, M.; Kovač, J.; Milošev, I. The Effect of the Methyl and Ethyl Group of the Acrylate Precursor in Hybrid Silane Coatings Used for Corrosion Protection of Aluminium Alloy 7075-T6. Coatings 2020, 10, 172. https://doi.org/10.3390/coatings10020172
Hamulić D, Rodič P, Poberžnik M, Jereb M, Kovač J, Milošev I. The Effect of the Methyl and Ethyl Group of the Acrylate Precursor in Hybrid Silane Coatings Used for Corrosion Protection of Aluminium Alloy 7075-T6. Coatings. 2020; 10(2):172. https://doi.org/10.3390/coatings10020172
Chicago/Turabian StyleHamulić, Damir, Peter Rodič, Matic Poberžnik, Marjan Jereb, Janez Kovač, and Ingrid Milošev. 2020. "The Effect of the Methyl and Ethyl Group of the Acrylate Precursor in Hybrid Silane Coatings Used for Corrosion Protection of Aluminium Alloy 7075-T6" Coatings 10, no. 2: 172. https://doi.org/10.3390/coatings10020172
APA StyleHamulić, D., Rodič, P., Poberžnik, M., Jereb, M., Kovač, J., & Milošev, I. (2020). The Effect of the Methyl and Ethyl Group of the Acrylate Precursor in Hybrid Silane Coatings Used for Corrosion Protection of Aluminium Alloy 7075-T6. Coatings, 10(2), 172. https://doi.org/10.3390/coatings10020172