Article

Proteomic Analysis of Biomaterial Surfaces after Contacting with Body Fluids by MALDI-ToF Mass Spectroscopy

by
Makoto Hirohara
1,†,
Tatsuhiro Maekawa
1,†,
Evan Angelo Quimada Mondarte
1,
Takashi Nyu
1,
Yoshiki Mizushita
1 and
Tomohiro Hayashi
1,2,3,*
1
Department of Materials Science and Engineering, School of Materials and Chemical Technology, Tokyo Institute of Technology, 4259 Nagatsuta-cho, Midori-ku, Yokohama, Kanagawa 226-8502, Japan
2
Surface and Interface Science Laboratory, RIKEN, 2-1 Hirosawa, Wako, Saitama 351-0198, Japan
3
JST-PRESTO, 4-1-8 Hon-cho, Kawaguchi, Saitama 332-0012, Japan
*
Author to whom correspondence should be addressed.
These authors contributed equally to this work.
Coatings 2020, 10(1), 12; https://doi.org/10.3390/coatings10010012
Submission received: 22 October 2019 / Revised: 25 November 2019 / Accepted: 17 December 2019 / Published: 22 December 2019
(This article belongs to the Special Issue Biointerface Coatings for Biomaterials and Biomedical Applications)

Abstract

:
We developed a method to identify proteins adsorbed on solid surfaces from a solution containing a complex mixture of proteins by using Matrix-Assisted Laser Desorption/Ionization-Time of Flight mass (MALDI-ToF mass) spectroscopy. In the method, we performed all procedures of peptide mass fingerprint method including denaturation, reduction, alkylation, digestion, and spotting of matrix on substrates. The method enabled us to avoid artifacts of pipetting that could induce changes in the composition. We also developed an algorithm to identify the adsorbed proteins. In this work, we demonstrate the identification of proteins adsorbed on self-assembled monolayers (SAMs). Our results show that the composition of proteins on the SAMs critically depends on the terminal groups of the molecules constituting the SAMs, indicating that the competitive adsorption of protein molecules is largely affected by protein-surface interaction. The method introduced here can provide vital information to clarify the mechanism underlying the responses of cells and tissues to biomaterials.

Graphical Abstract

1. Introduction

Scaffolding protein in extracellular matrices (ECM) plays a significant role in determining cellular responses. There are many situations where the scaffolding proteins govern the cellular responses—biodevices implanted in a body [1], patterning of cells on solid substrates [2], and general cell culturing in dishes, among others. For the thorough understanding of the mechanism underlying the cellular behavior, we need to clarify the properties of the layer of the scaffolding proteins [3,4].
Investigation of the adsorbed proteins has been done mostly in terms of the amount of adsorption. They are measured with surface plasmon resonance (SPR) spectroscopy [5], quartz crystal microbalance (QCM) [6,7,8], and surface acoustic wave spectroscopy (SAW) [9,10,11] for real-time adsorption kinetic measurements; and X-ray photoelectron spectroscopy (XPS) [12,13], Fourier transform infrared absorption spectroscopy (FTIR) [14,15,16], and fluorescence microscopy with labeling molecules [17,18] for samples in dry state after adsorption.
In contrast with the number of proteins in the scaffolding layer, the composition of proteins in the protein layers formed on biomaterials after contacting body fluids or cell-culturing media has not been intensively studied even though this information is essential for the understanding of the mechanism underlying the responses of the adhered cells to materials. In general, the identification of proteins in solution is carried out by a peptide mass fingerprint method [19]. In this method, the proteins in the solution are separated first by electrophoresis [20]. Then, the separated proteins are fragmented into peptides by digestion with trypsin. Finally, the proteins can be identified from the pattern of the peaks in the Matrix Assisted Laser Desorption/Ionization-Time of Flight mass (MALDI-ToF mass) spectrum. However, in the case of the scaffolding proteins on the surface of biomaterials, especially on small surface areas, this procedure is difficult to employ because the total amount of adsorbed proteins is often not enough for a reliable and efficient separation by electrophoresis which, in general, requires ~20–30 μg of proteins.
Several works that overcame the problem have been reported. One is the usage of nanoparticles to acquire a large interfacial area between materials and proteins [21]. However, this approach is not universal because many biomaterials cannot be fabricated in the form of nanoparticles. Another is the proteomic analysis of membrane filters for hemodialysis wherein the proteins adsorbed on the membrane filters after hemodialysis were collected by an eluting solvent and then isolated by electrophoresis followed by MALDI-ToF mass measurements [22,23]. Like the first example, this approach also has the merit of having a larger interfacial area. Unfortunately, this method cannot be employed for biomaterials with a flat surface. Moreover, proteins with relatively high hydrophobicity can easily adhere to the walls of pipets resulting in the change in the composition of the protein and thus greatly affects the results especially for a small collection of proteins [24]. Therefore, it is important to perform all steps of the proteomic analysis directly on the surface of the materials. Although this approach was already performed by Kirschhofer et al., who have succeeded in the identification of the adsorbed proteins, the proteins used in their reports consist of only three kinds with known compositions [25].
In this work, we performed the full peptide mass fingerprint method on the biomaterial surfaces and obtained mass spectra by MALDI-ToF mass spectroscopy of the adsorbed proteins from the more complex protein serum. To extract the composition of the adsorbed proteins from the resulting complex spectra, we developed an algorithm to give assignments to the peaks by collating the experimental and theoretical peak positions of peptide fragmented from the serum proteins. Furthermore, we established a method to evaluate the molar ratio between proteins in the scaffolding layer. In general, the composition of proteins strongly depends on the analytical techniques used [26,27,28,29]. To solve this problem, we thereby employed a method to evaluate molar ratios between proteins by using the results obtained from original standard samples with a known molar ratio. We believe that our method may shed light on the role of the scaffolding layer in determining the fates of cells or tissues after being in contact with biomaterials.

2. Materials and Methods

2.1. Self-Assembled Monolayers and Their Substrates

Metal substrates for self-assembled monolayers (SAMs) of alkanethiols were prepared by thermal evaporation under vacuum (base pressure: 4 × 10⁻⁶ Pa). A 5-nm Ge (adhesion promoter) was first deposited on a glass plate (18 × 18 mm2, Matsunami glass inc. Ltd., Oosaka, Japan) followed by the deposition of 100-nm Au film. The glass plates underwent prior cleaning by sonication in ethanol, then in pure water, and lastly dried with nitrogen gas.
Fabrication of the SAMs was carried out by immersing the substrates in a thiol solution in ethanol (0.1 mM) for 24 h. We used five kinds of thiols in this work (Table 1) [Sigma-Aldrich (St. Louis, MI, USA) and ProChimia Surfaces (Gdan ́sk, Poland)]. After the immersion, the samples were carefully rinsed with pure ethanol to remove the physisorbed thiol molecules from the surface.

2.2. QCM Measurements

The amounts of proteins adsorbed onto the SAMs from protein solution and fetal bovine serum (FBS) (Equitech-Bio Inc, Kerrville, TX, USA, lot number: SFBM30-2485) were measured by QCM (D300 Q-Sense, Gothenburg, Sweden). The sensors were cleaned by UV-Ozone treatment, followed by rinsing with ethanol and pure water. The fabrication of the SAMs on the Au-coated QCM sensors was done with the same procedure as the case of the Au/Ge/glass substrates. For the adsorption of bovine serum albumin (BSA) (Sigma-Aldrich, St. Louis, MI, USA) and fibrinogen (Biogenesis, Poole, England), we prepared the protein solution by dissolving the proteins in phosphate buffer saline (PBS) (Sigma Aldrich, St. Louis, MI, USA) at a concentration of 1 mg/mL. For the adsorption of proteins from the serum, the FBS was diluted to 20% in volume with PBS.
In the QCM measurements, the measurement cell was first filled with PBS for background measurements, then the protein or serum solution was injected. After the frequency shift was equilibrated, PBS was injected again for rinsing. All measurements were performed at 25 °C We calculated the amount of the adsorbed protein from the Sauerbrey equation (Equation (1))
Δ m =   C · Δ f n ,
where C, Δf, n are the conversion constant (17.7 ng cm−2 Hz−1), change in the resonant frequency and overtone number (n = 3 in this work), respectively.

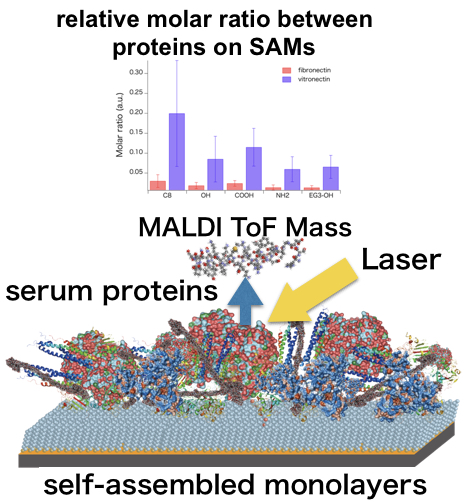
2.3. Formation of Protein Layer on SAMs from FBS for Peptide Mass Fingerprinting

To form a layer of serum proteins on the SAMs, 50 μL of the 20% (v/v) FBS were placed on the SAMs for 24 h at room temperature. Then, the SAMs were rinsed with PBS buffer and dried in air.

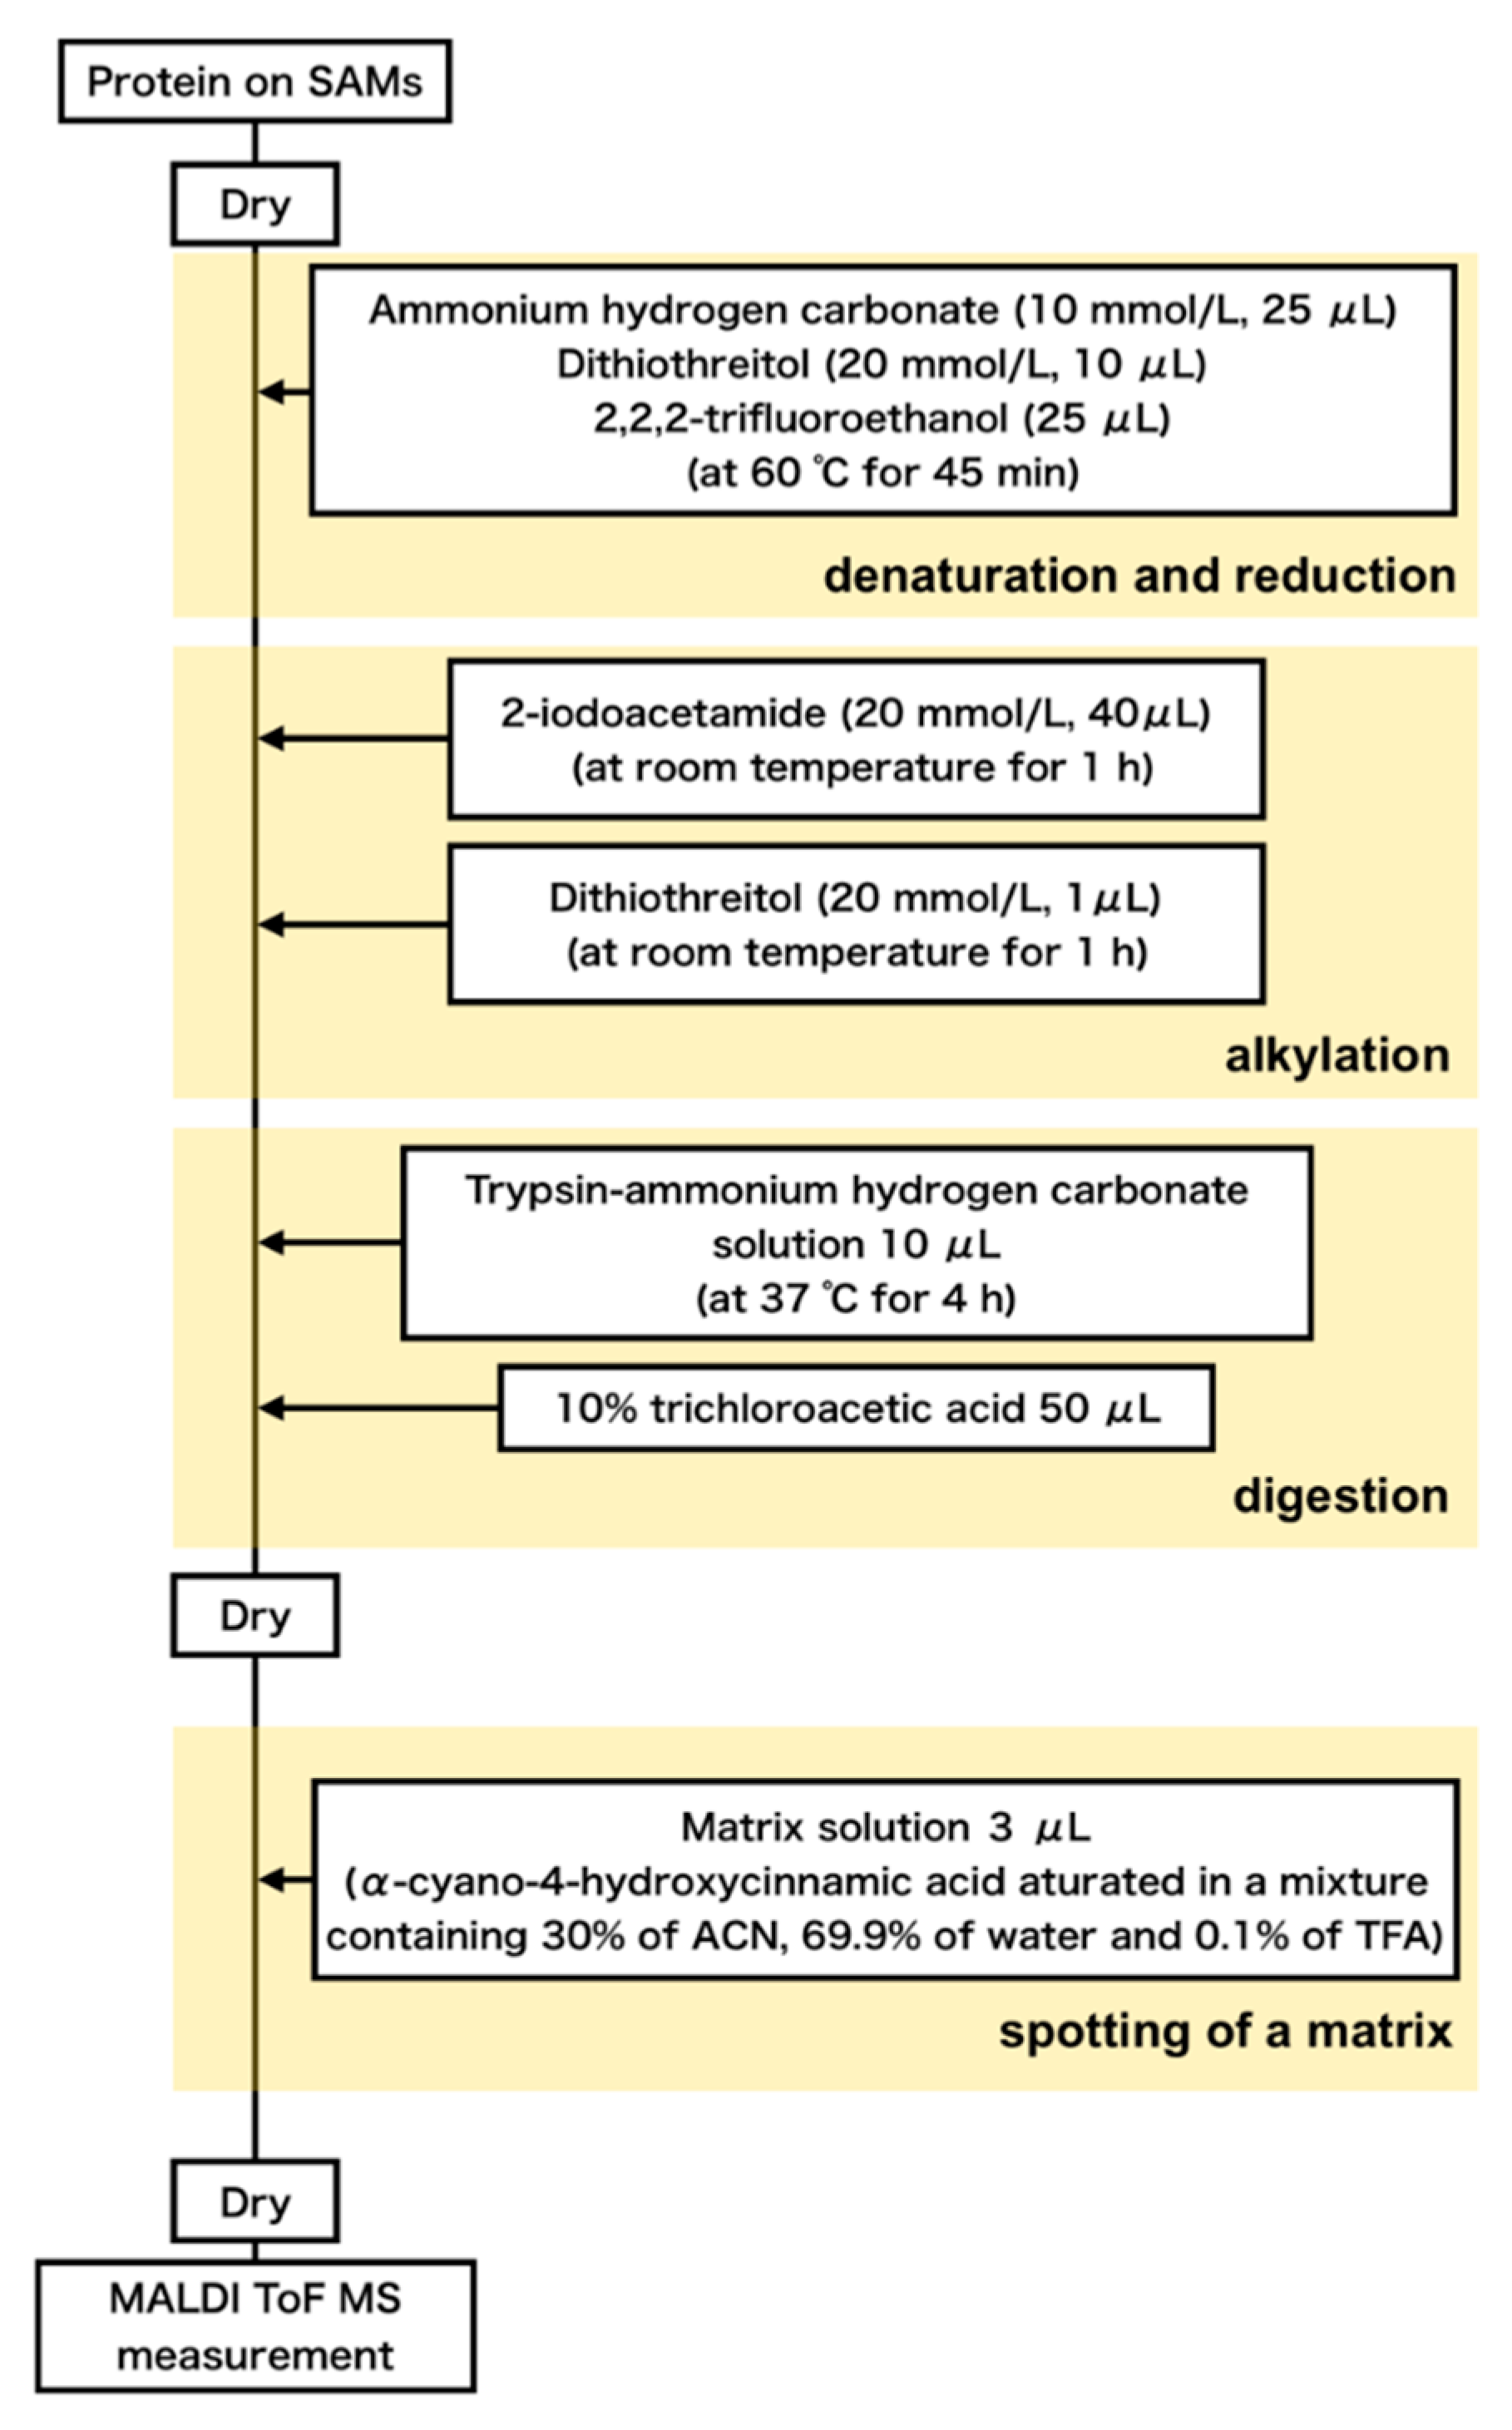
2.4. Digestion of the Serum Proteins Adsorbed on the SAMs

The procedure of the preparation of samples for MALDI-ToF mass measurements (denaturation, reduction, alkylation, digestion, and spotting of a matrix) is summarized in Figure 1. A mixture of 25 μL of 10 mM ammonium bicarbonate aqueous solution (Wako, Osaka, Japan), 25 μL of 2,2,2-trifluoroethanol (Wako, Osaka, Japan), and 10 μL of 20 mM dithiothreitol aqueous solution (Sigma-Aldrich, St. Louis, MI, USA) was placed on the dried protein layer then was left still in an oven at 60 °C under atmospheric pressure for 45 min to denature and reduce the adsorbed proteins. Then, the sample was taken out from the oven, cooled to room temperature, added with 40 μL of 20 mM iodoacetamide (Sigma-Aldrich, St. Louis, MI, USA) aqueous solvent to allow alkylation, and was allowed to stand at room temperature for 1 h. In order to quench the iodoacetamide aqueous solvent, 10 μL of an aqueous dithiothreitol solution used in the reduction was added and then dried at 60 °C under vacuum. Next, the proteins underwent digestion with trypsin (Promega, Madison, WI, USA). A 200 μL of trypsin-acetic acid solution was prepared by dissolving 20 μg trypsin in 1 mM acetic acid (Promega, Madison, WI, USA). A 10-μL aliquot of the trypsin-acetic acid solution was mixed with 30 μL of a 10 mM ammonium hydrogen carbonate aqueous solution, and 10 μL of the mixture was dropped onto the sample and kept for 4 h. To stop the digestion, 50 μL of 10% trichloroacetic acid (Wako, Osaka, Japan) was added and then the samples were dried in a desiccator at 60 °C. The digestion of proteins in 20% (v/v) FBS was performed with the same procedure.
The samples were fixed on a slide glass coated with an indium tin oxide (ITO) film with carbon tape. To be able to check if the samples are of the same height level, a commercial peptide solution (Peptide Calibration Standard II: PCS II) (Bruker, Billerica, MA, USA) was placed on all the samples. After that, the matrix solution (α-cyano-4-hydroxycinnamic acid (Sigma-Aldrich, St. Louis, MI, USA)) saturated in a mixture containing 30% of acetonitrile (Wako, Osaka, Japan), 69.9% of water and 0.1% of trifluoracetic acid (TFA) (Wako, Osaka, Japan) is placed on the samples to be measured then dried. The height of the samples was adjusted by placing blank substrates with the same thickness as a spacer at the corners (Figure 2).

2.5. Standard Samples to Calibrate Peak Intensity

A mixture of proteins of interest with a known ratio was prepared to calibrate the effect of ionization of peptides, which is dependent on the peptide sequence, on their intensities in mass spectra. In this work, we dissolved BSA, vitronectin, and fibronectin in PBS and prepare the mixed solution at a molar ratio of 1:1.29:0.255 (weight ratio of 1:1:1). This solution was spotted on an ITO substrate and processed as the same procedure as the case of serum proteins on the SAMs.

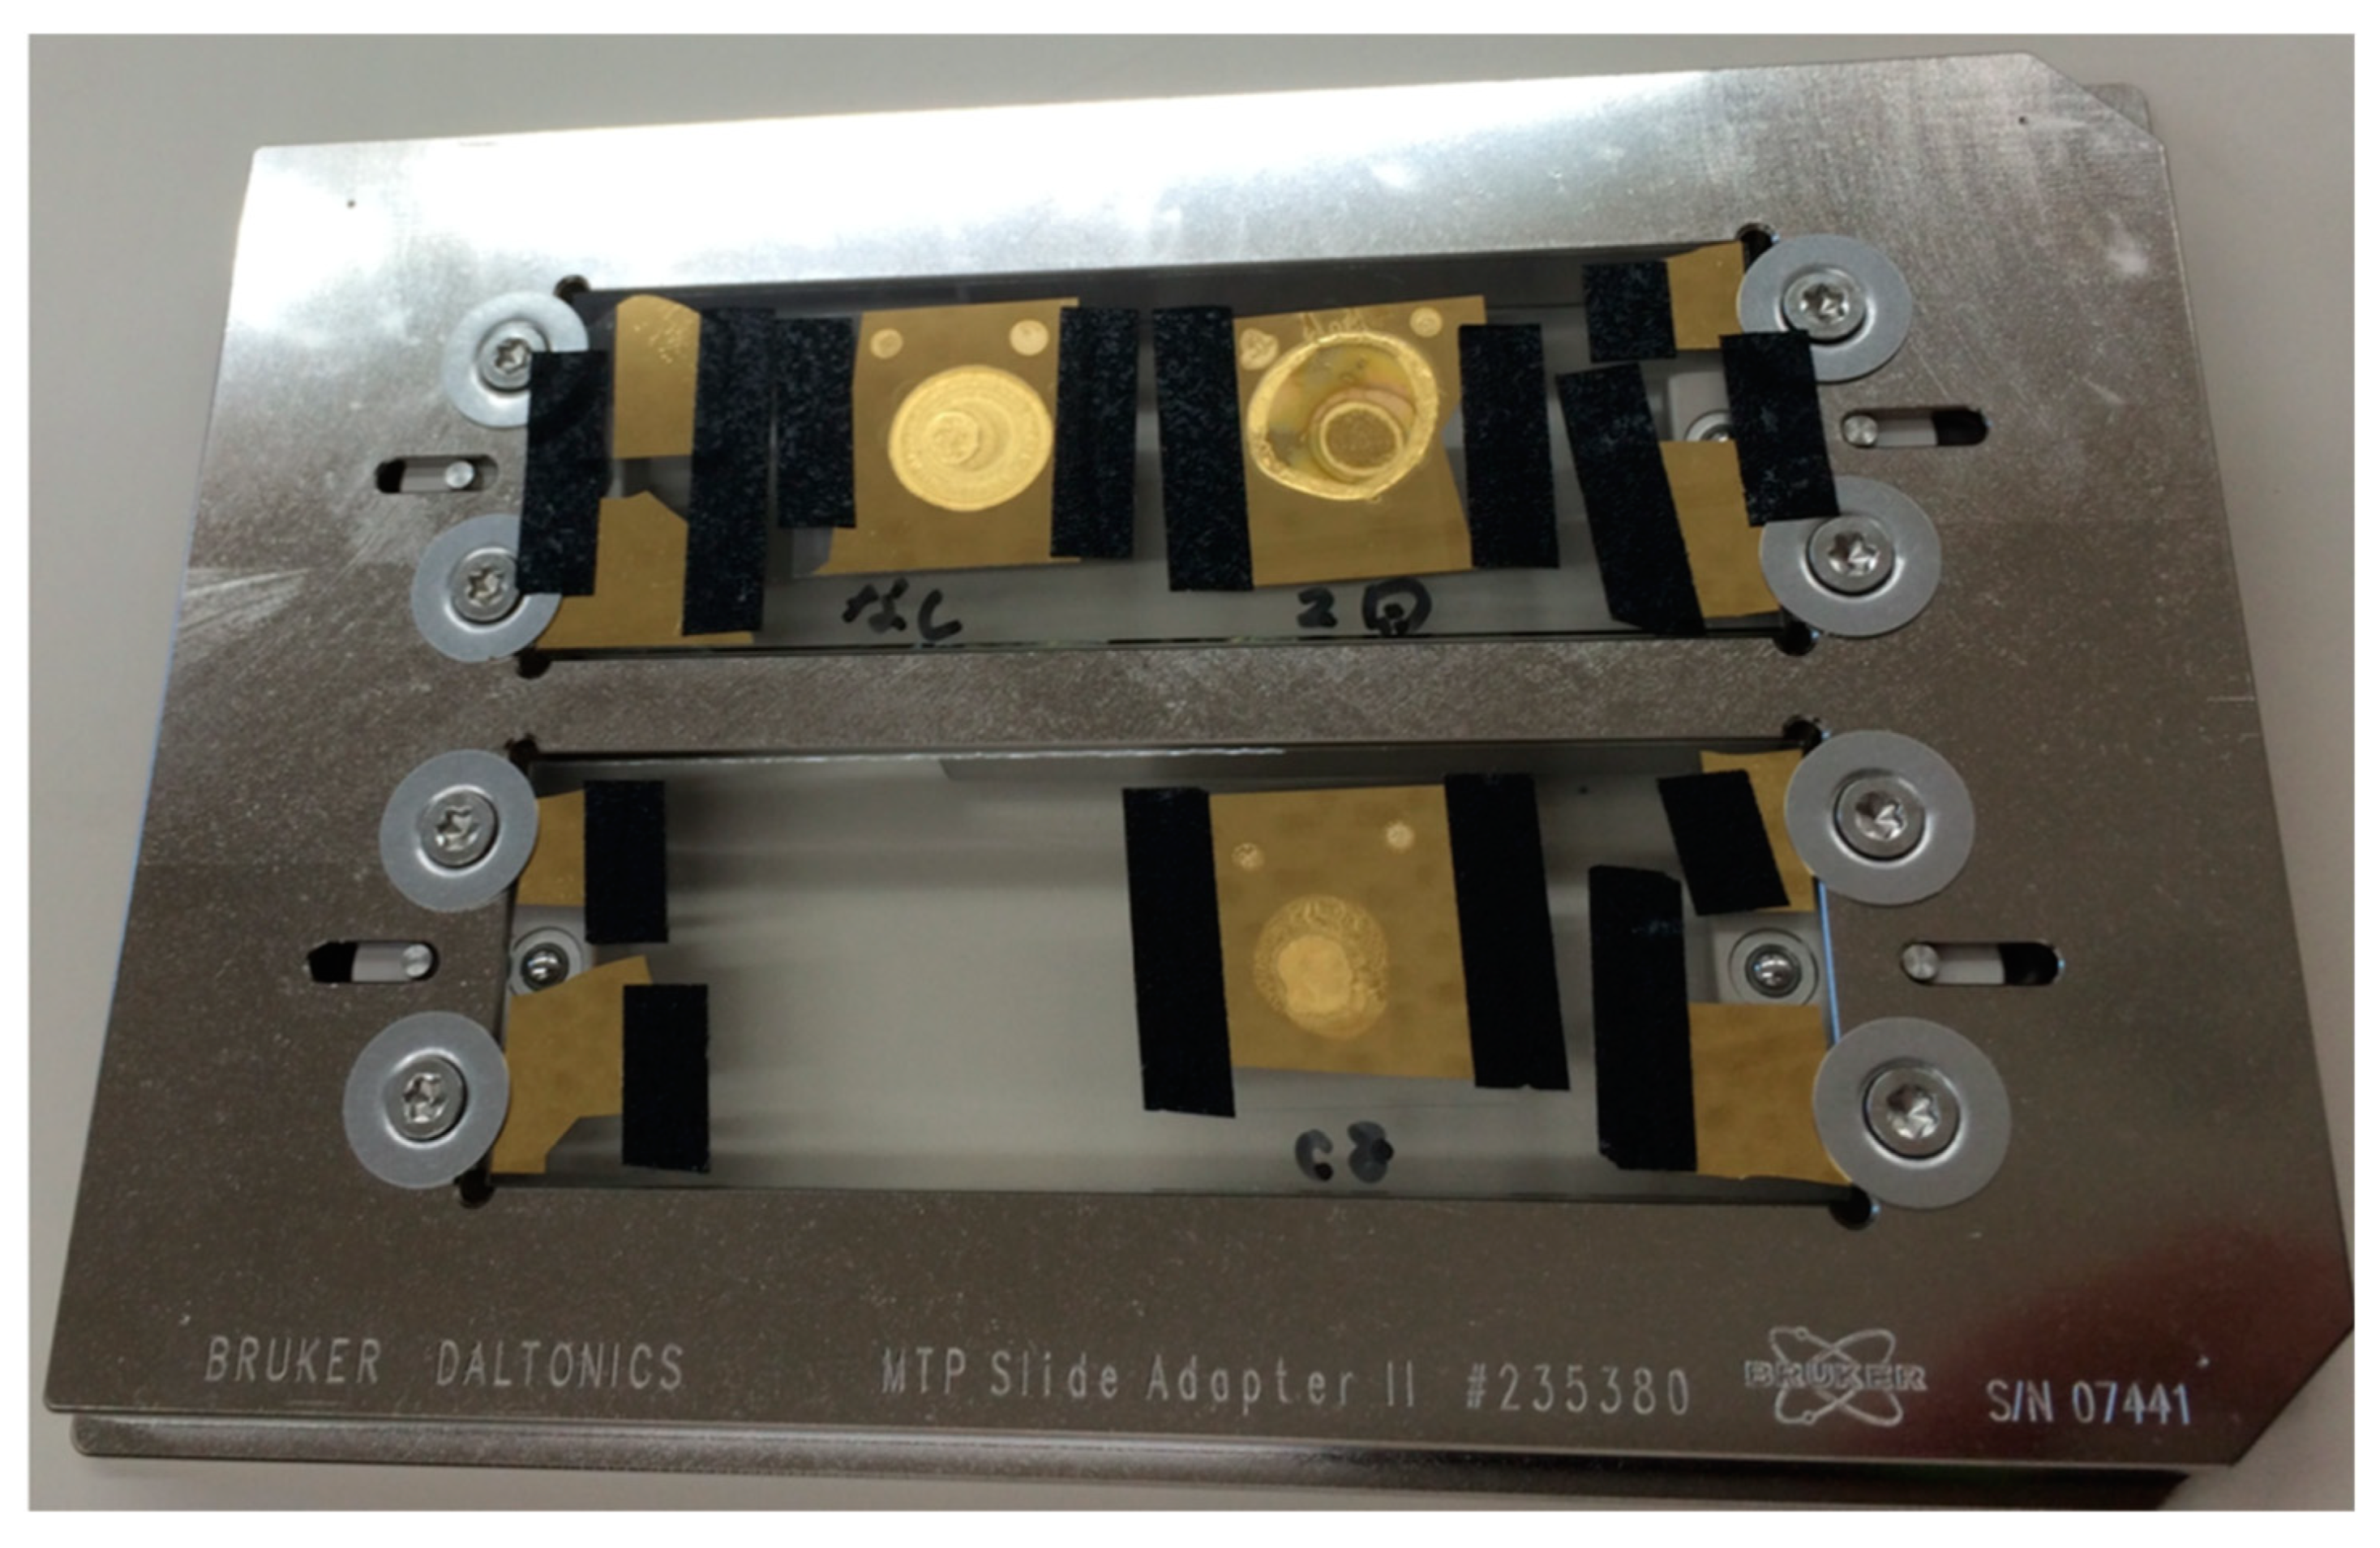
2.6. MALDI-ToF Mass Spectroscopic Measurements

We used a commercial MALDI-ToF mass spectrometer (ultrafleXtreme, Bruker Daltonics, Billerica, MA, USA) for our measurements. Mass spectra in the range of 500 to 4000 Da were measured in the positive-ion reflector mode with 5000 laser shots with raster. FlexAnalysis software (Bruker Daltonics, Billerica, MA, USA) was used to assign peaks. For each sample, 10 spectra obtained at different positions of the substrates were accumulated after the calibration of m/z values (linear offset in m/z) using the fragment peak from BSA (m/z = 927.49). We prepared two samples for each SAM and measured 15 spectra for each sample giving a total of 30 spectra for each SAM.

2.7. Analysis of the Obtained Mass Spectra

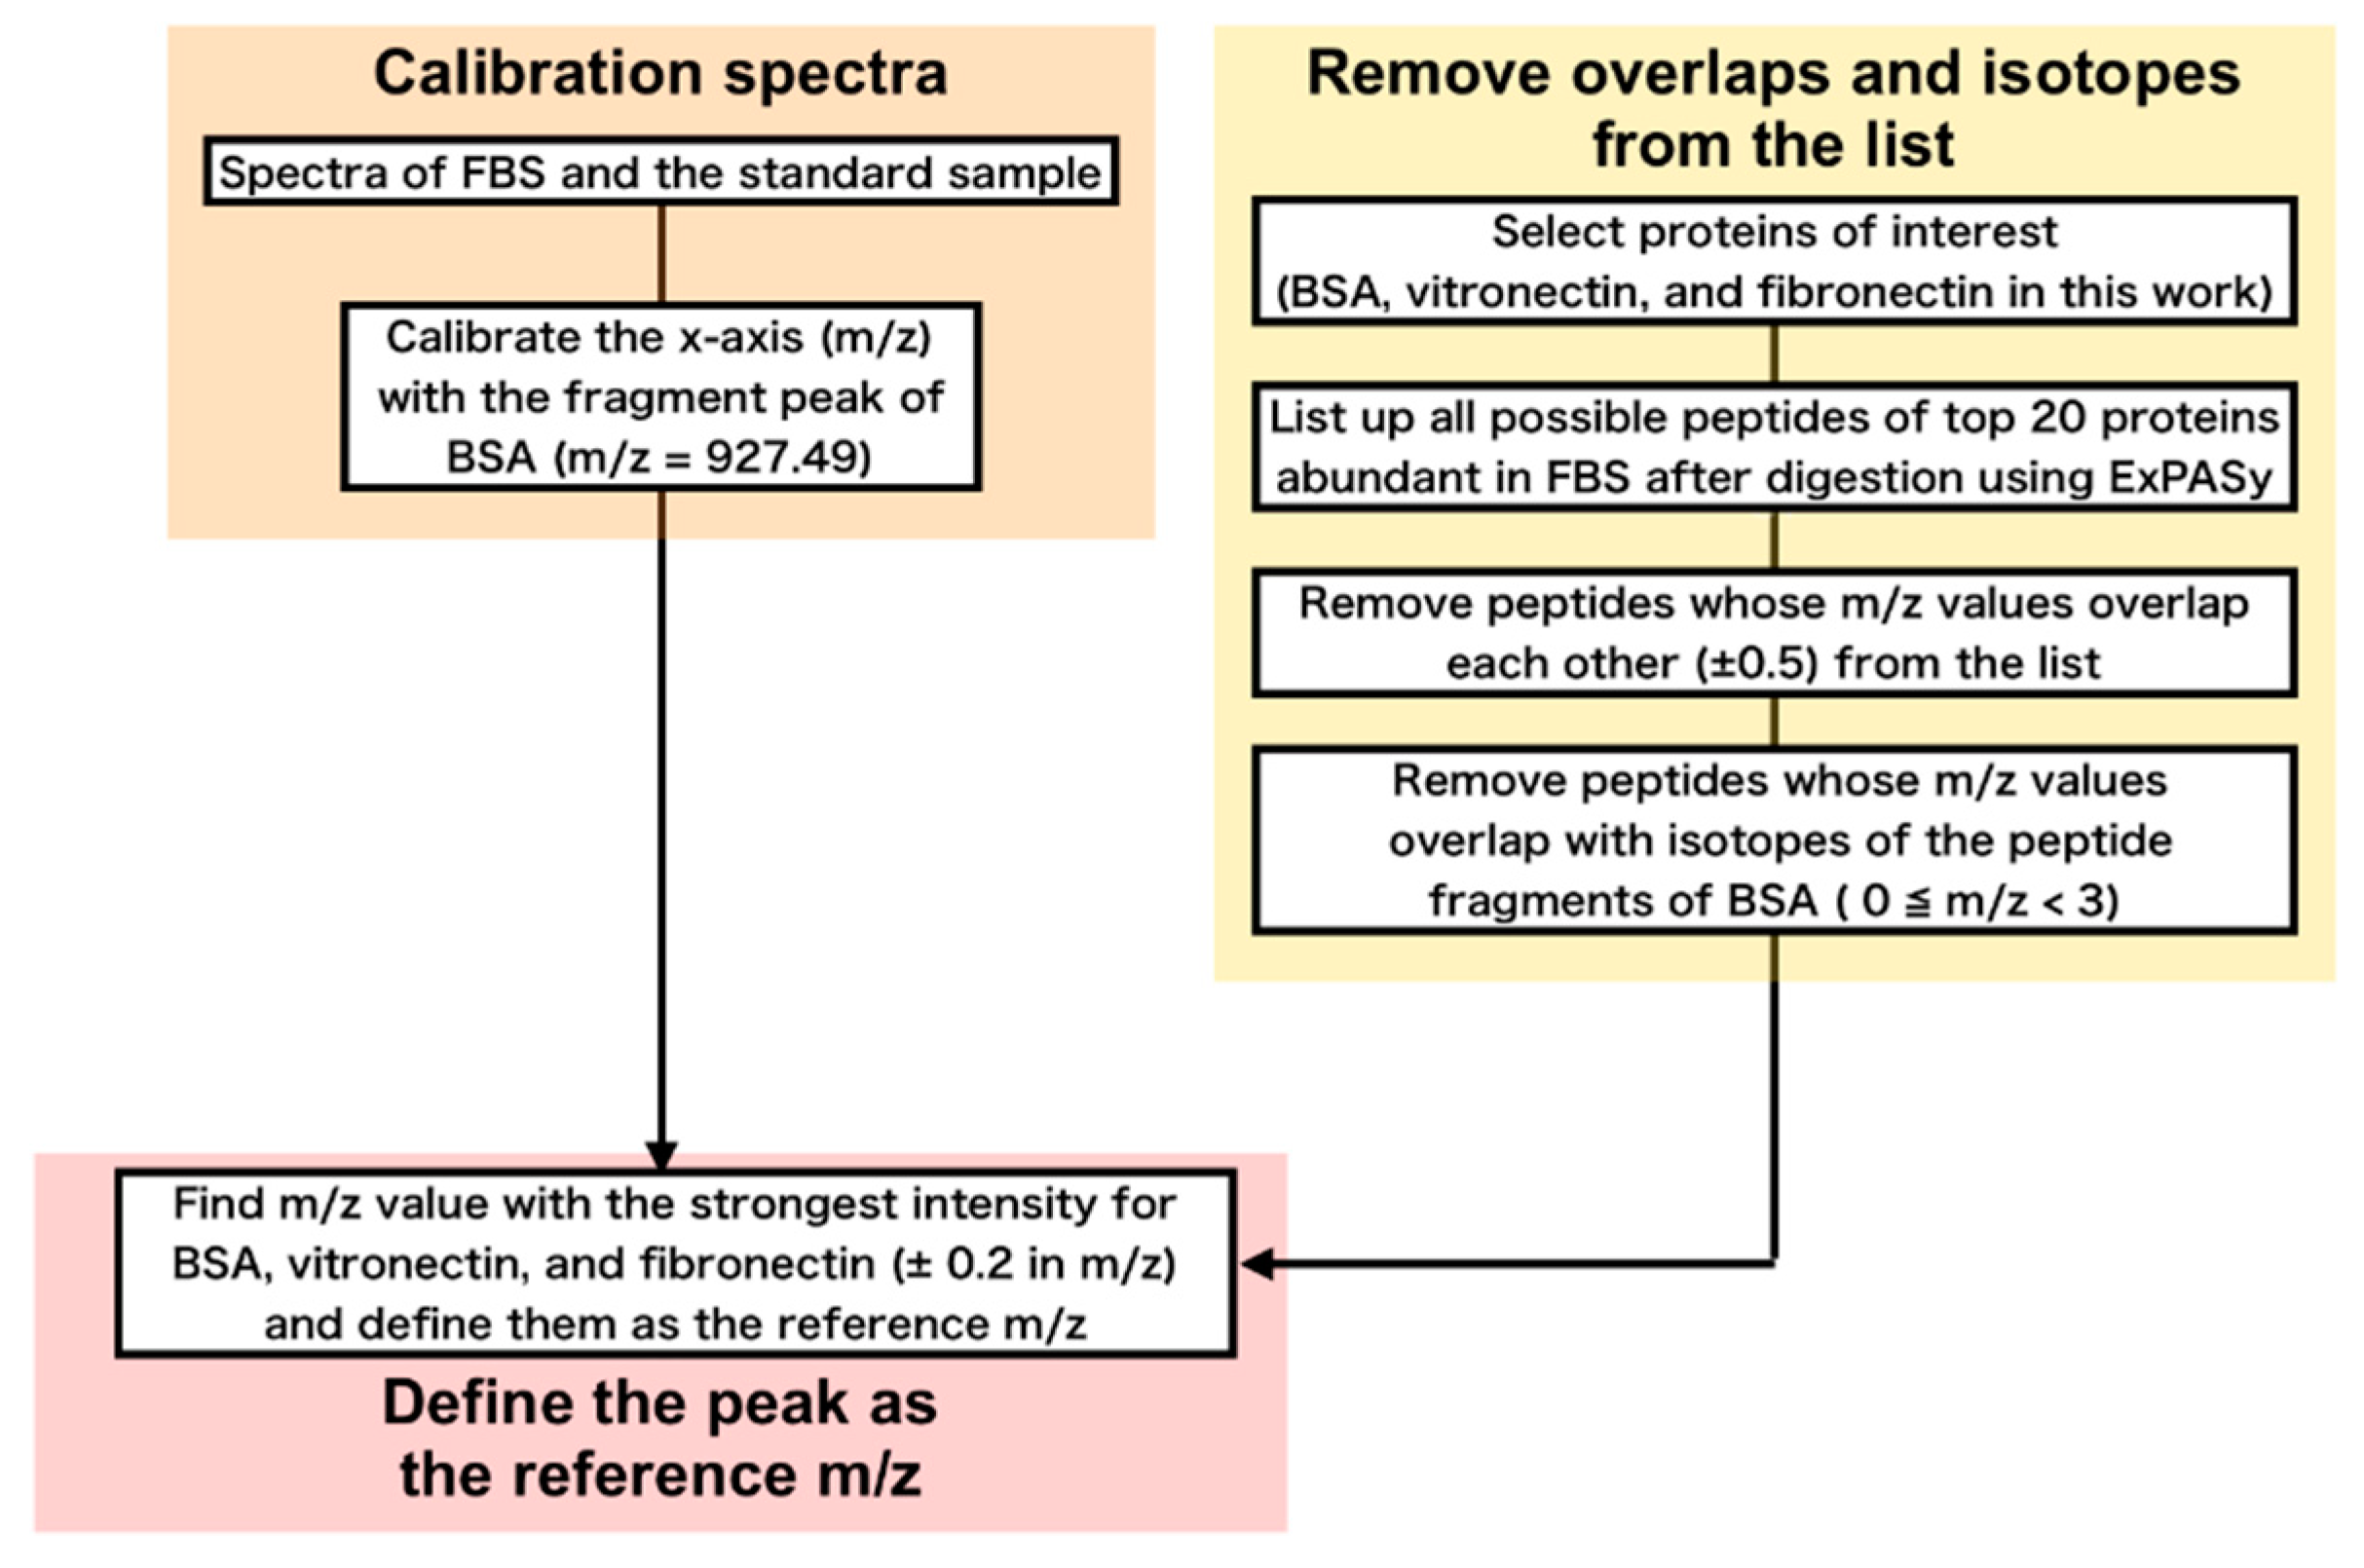
2.7.1. Finding m/z Values Unique for Proteins of Interest

From the complex spectra we obtained, we attempted to find m/z values unique for each protein. Basing on the top 20 abundant proteins plus the proteins associated with cell adhesion (fibronectin and vitronectin) (Table 2) in FBS, we constructed a list of all possible fragments after digestion using a WEB-based database of ExPASy (https://www.expasy.org/) [30,31]. We omitted m/z values that are close to each other within 0.5 Δ m/z. Furthermore, we also removed m/z values that are close (0 m/z < 3) to that of the isotopes of the peptide fragments of BSA, because BSA is dominant (around 60%) in serum and even the isotopes of its fragments exhibit peaks with considerable intensity. Finally, from the remaining m/z values for each protein, we selected the one with the highest intensity in the spectra and denote as the ‘reference m/z’ hereafter (Figure 3).

2.7.2. Conversion from Peak Intensities to Molar Ratio

The peak intensity in the mass spectrum linearly correlates to the concentration of the peptide in the sample [32]. However, the dependence of the signal intensity on the sequences of peptide must be calibrated. In this work, we employ Equation (2) to evaluate molar ratios,
M a / b = I a I b · K a / b ,
where I, M, and K are the intensities of the reference peaks, molar ratio between two proteins, and coefficients to calibrate the intensity and molar ratios, respectively. Using the standard sample with known composition, Kvitronectin/BSA and Kfibronectin/BSA were calculated to be 0.302 and 1.51, respectively.

3. Results and Discussion

First, we verified whether the processes of the digestion affect the spectral patterns. Figure 4 compares the spectra obtained from proteins digested in different environments—on substrate and in solution. The overall intensity of the spectrum (a) is about 10 times weaker than that of the spectrum (b), which is rationalized by the total amounts of BSA molecules measured. The peak positions assigned to the fragments of BSA and the relative ratio between the peaks of the fragments are consistent, indicating that the digestion of BSA on C8-SAM provides the same result as in solution. It should be noted that there is disagreement in the peak intensity of the other peaks. A possible reason is a different ratio among BSA, trypsin, and other chemicals in the different environments of digestion.
The results of the adsorption tests with proteins of single composition (Figure 5) showed that EG3-OH exhibited strong resistance to fibrinogen and BSA, whereas the other SAMs adsorbed these proteins. These results are consistent with previous findings reported from our group and others [33,34,35,36,37,38] showing that SAMs of oligo(ethyleneglycol)-terminated alkanethiols exhibit strong protein-resistance to various proteins at relatively low concentrations of protein solution (typically < 2 mg/mL). In contrast with the adsorption of single protein at low concentration, the results of adsorption tests with the serum diluted to 20% with PBS revealed that all the SAMs used in this work adsorbed serum proteins. Considering that the adsorption amount of about 100 ng/cm2 corresponds to a monolayer of fibrinogen [35], all the SAMs were certainly covered with a layer of serum proteins. It should also be noted that this concentration of serum employed in this work is often used for cell culturing. There is strong dependence of the amounts of adsorbed proteins on both the concentration and composition of the proteins in the original solution [39]. This is one of the good examples that demonstrate that conventional protein adsorption assays cannot predict the protein adsorption from serum or other body fluids.
After the confirmation of the formation of the protein layers on the SAMs by QCM-D, we processed the adsorbed protein as the procedure shown in Figure 1. Figure 6a–e shows mass spectra of digested adsorbed proteins on the SAMs. In contrast with the peaks assigned to BSA, the patterns of other peaks, e.g., in the ranges of m/z = 1300–1400 and 1600–1700 are different depending on the SAMs. This indicates that the composition of proteins other than BSA is different depending on the terminal groups of the molecules constituting the SAMs.
The relative peak intensities of the reference m/z for each protein with respect to that for BSA for each SAM are summarized in Table 3. Although we cannot discuss the exact amount of proteins from peak intensities, the change in the composition of proteins after adsorption from serum onto SAMs can be easily seen from the results. The final composition of the adsorbed proteins on materials is a result of competitive adsorption of serum proteins (Vroman effect) [40,41]. In theoretical models proposed so far, small proteins adsorb first because of their high mobility and replaced with larger ones. However, the complexity of the problem includes a wide variety of protein-protein and protein-surface interactions. Moreover, the conformational changes of proteins after adsorption complicates the issue. Therefore, it is very difficult to correlate the composition with the physicochemical properties of the SAMs. It should also be noted that we also compared the compositions of vitronectin and fibronectin with respect to BSA obtained by the conventional methods, which incorporate pipetting processes, and our method (Table S1), clearly indicating the effect of pipetting on the ratio of the peak intensities.
The main finding here is that the compositions of vitronectin and fibronectin on the SAMs, which provide RGD moieties essential for cell adhesion, are higher than in serum (Figure 7). The evaluation of the exact amounts of the serum proteins requires standard samples containing the proteins. Unfortunately, many of the proteins listed in Table 2 and Table 3 were not available, and we were not able to evaluate the exact amounts by combining with the results of QCM-D. But fortunately, there have been several works that attempted to predict peak intensities of peptides from their sequences by using techniques of informatics [42,43,44]. These approaches may realize the exact evaluation of the protein composition in the future.

4. Summary and Conclusions

In this paper, we proposed a new method to evaluate the composition of adsorbed proteins on solid surfaces. In this method, we perform denaturation, alkylation, digestion, and measurements without the collection of proteins. This method enables us to collect all the peptide fragments without the artifact of pipetting. To find reference m/z values used to evaluate the protein composition, we first looked for the m/z value unique for the proteins of interest by listing up m/z values of all possible fragments of the top 20 proteins abundant in serum and the interesting proteins, i.e., those with RGD moieties. Then, we determined a correlation factor to evaluate molar ratios between the proteins from peak intensities by using standard samples with the known composition of proteins.
Our results clearly showed that the composition of the proteins adsorbed from serum onto SAMs critically depends on the terminal groups of the molecules constituting the SAMs as a result of the Vroman effect (competitive adsorption of proteins onto surfaces). Moreover, in this work, we evaluated the ratios of vitronectin and fibronectin to BSA. The compositions of vitronectin and fibronectin govern the adhesion of cells that have integrin-mediated adhesion systems since RGD moieties of the proteins provide binding sites for integrins. We found a clear correlation between cell adhesion and the compositions of vitronectin and fibronectin. This finding will be published elsewhere.

Supplementary Materials

The following are available online at https://www.mdpi.com/2079-6412/10/1/12/s1. For quality assessment of identification of proteins. Here we simply show the matching ratio between theoretical m/z values and experimentally observed peak positions, since we removed some of the m/z values and cannot employ ROC plot analysis. In the case of the standard sample, which contains BSA, fibronectin, and vitronectin, more than 95% of the theoretical fragment m/z values were observed in the spectra. In the case of serum proteins, the matching rate is lower (Table S2). If the matching rate is larger than 25%, it can be considered to be marginally matched [45]. Therefore, we consider that the identification is satisfactory in this work.

Author Contributions

M.H. and T.M. did all the experiments and analysis. T.N. and E.A.Q.M. contributed to the coding of the software. Y.M. and T.H. designed this project and optimized the experimental conditions. All authors have read and agreed to the published version of the manuscript.

Funding

The author (T.H.) acknowledges the financial supports by KAKENHI (19H02565, 17K20095 and 15KK0184) and JST- PRESTO.

Acknowledgments

The authors appreciate the help of Ms. Kazue Taki for the administration of this project.

Conflicts of Interest

The authors declare no conflict of interest.

References

  1. Tanaka, M.; Hayashi, T.; Morita, S. The roles of water molecules at the biointerface of medical polymers. Polym. J. 2013, 45, 701–710. [Google Scholar] [CrossRef]
  2. Kane, R.S.; Takayama, S.; Ostuni, E.; Ingber, D.E.; Whitesides, G.M. Patterning proteins and cells using soft lithography. Biomaterials 1999, 20, 2363–2376. [Google Scholar] [CrossRef]
  3. Flaim, C.J.; Chien, S.; Bhatia, S.N. An extracellular matrix microarray for probing cellular differentiation. Nat. Methods 2005, 2, 119–125. [Google Scholar] [CrossRef] [PubMed]
  4. Watt, F.M.; Huck, W.T. Role of the extracellular matrix in regulating stem cell fate. Nat. Rev. Mol. Cell Biol. 2013, 14, 467–473. [Google Scholar] [CrossRef] [PubMed]
  5. Silin, V.V.; Weetall, H.; Vanderah, D.J. SPR Studies of the Nonspecific Adsorption Kinetics of Human IgG and BSA on Gold Surfaces Modified by Self-Assembled Monolayers (SAMs). J. Colloid Interface Sci. 1997, 185, 94–103. [Google Scholar] [CrossRef] [PubMed]
  6. Nakata, S.; Kido, N.; Hayashi, M.; Hara, M.; Sasabe, H.; Sugawara, T.; Matsuda, T. Chemisorption of proteins and their thiol derivatives onto gold surfaces: Characterization based on electrochemical nonlinearity. Biophys. Chem. 1996, 62, 63–72. [Google Scholar] [CrossRef]
  7. Caruso, F.; Furlong, D.N.; Kingshott, P. Characterization of Ferritin Adsorption onto Gold. J. Colloid Interface Sci. 1997, 186, 129–140. [Google Scholar] [CrossRef]
  8. Hook, F.; Rodahl, M.; Kasemo, B.; Brzezinski, P. Structural changes in hemoglobin during adsorption to solid surfaces: Effects of pH, ionic strength, and ligand binding. Proc. Natl. Acad. Sci. USA 1998, 95, 12271–12276. [Google Scholar] [CrossRef] [Green Version]
  9. Renken, J.; Dahint, R.; Grunze, M.; Josse, F. Multifrequency evaluation of different immunosorbents on acoustic plate mode sensors. Anal. Chem. 1996, 68, 176–182. [Google Scholar] [CrossRef]
  10. Cavic, B.A.; Thompson, M. Adsorptions of plasma proteins and their elutabilities from a polysiloxane surface studied by an on-line acoustic wave sensor. Anal. Chem. 2000, 72, 1523–1531. [Google Scholar] [CrossRef]
  11. Gizeli, E.; Bender, F.; Rasmusson, A.; Saha, K.; Josse, F.; Cernosek, R. Sensitivity of the acoustic waveguide biosensor to protein binding as a function of the waveguide properties. Biosens. Bioelectron. 2003, 18, 1399–1406. [Google Scholar] [CrossRef]
  12. Labarre, D.; Vauthier, C.; Chauvierre, C.; Petri, B.; Muller, R.; Chehimi, M.M. Interactions of blood proteins with poly(isobutylcyanoacrylate) nanoparticles decorated with a polysaccharidic brush. Biomaterials 2005, 26, 5075–5084. [Google Scholar] [CrossRef] [PubMed]
  13. Zenhausern, F.; Adrian, M.; Descouts, P. Solution structure and direct imaging of fibronectin adsorption to solid surfaces by scanning force microscopy and cryo-electron microscopy. J. Electron Microsc. 1993, 42, 378–388. [Google Scholar]
  14. Lestelius, M.; Liedberg, B.; Lundstrom, I.; Tengvall, P. In vitro plasma protein adsorption and kallikrein formation on 3-mercaptopropionic acid, L-cysteine and glutathione immobilized onto gold. J. Biomed. Mater. Res. 1994, 28, 871–880. [Google Scholar] [CrossRef] [PubMed]
  15. Caruso, F.; Furlong, D.N.; Ariga, K.; Ichinose, I.; Kunitake, T. Characterization of polyelectrolyte-protein multilayer films by atomic force microscopy, scanning electron microscopy, and Fourier transform infrared reflection-absorption spectroscopy. Langmuir 1998, 14, 4559–4565. [Google Scholar] [CrossRef]
  16. Schwendel, D.; Dahint, R.; Herrwerth, S.; Schloerholz, M.; Eck, W.; Grunze, M. Temperature dependence of the protein resistance of poly- and oligo(ethylene glycol)-terminated alkanethiolate monolayers. Langmuir 2001, 17, 5717–5720. [Google Scholar] [CrossRef]
  17. Model, M.A.; Healy, K.E. Quantification of the surface density of a fluorescent label with the optical microscope. J. Biomed. Mater. Res. 2000, 50, 90–96. [Google Scholar] [CrossRef]
  18. Beverloo, H.B.; Vanschadewijk, A.; Bonnet, J.; Vandergeest, R.; Runia, R.; Verwoerd, N.P.; Vrolijk, J.; Ploem, J.S.; Tanke, H.J. Preparation and microscopic visualization of multicolor luminescent immunophosphors. Cytometry 1992, 13, 561–570. [Google Scholar] [CrossRef]
  19. Pappin, D.J.; Hojrup, P.; Bleasby, A.J. Rapid identification of proteins by peptide-mass fingerprinting. Curr. Biol. 1993, 3, 327–332. [Google Scholar] [CrossRef]
  20. Scheler, C.; Lamer, S.; Pan, Z.; Li, X.P.; Salnikow, J.; Jungblut, P. Peptide mass fingerprint sequence coverage from differently stained proteins on two-dimensional electrophoresis patterns by matrix assisted laser desorptiodionization-mass spectrometry (MALDI-MS). Electrophoresis 1998, 19, 918–927. [Google Scholar] [CrossRef]
  21. Sempf, K.; Arrey, T.; Gelperina, S.; Schorge, T.; Meyer, B.; Karas, M.; Kreuter, J. Adsorption of plasma proteins on uncoated PLGA nanoparticles. Eur. J. Pharm. Biopharm. 2013, 85, 53–60. [Google Scholar] [CrossRef] [PubMed]
  22. Urbani, A.; Lupisella, S.; Sirolli, V.; Bucci, S.; Amoroso, L.; Pavone, B.; Pieroni, L.; Sacchetta, P.; Bonomini, M. Proteomic analysis of protein adsorption capacity of different haemodialysis membranes. Mol. BioSyst. 2012, 8, 1029–1039. [Google Scholar] [CrossRef] [PubMed]
  23. Urbani, A.; Sirolli, V.; Lupisella, S.; Levi-Mortera, S.; Pavone, B.; Pieroni, L.; Amoroso, L.; Di Vito, R.; Bucci, S.; Bernardini, S.; et al. Proteomic investigations on the effect of different membrane materials on blood protein adsorption during haemodialysis. Blood Transfus. 2012, 10, s101–s112. [Google Scholar] [CrossRef] [PubMed]
  24. Kristensen, K.; Henriksen, J.R.; Andresen, T.L. Adsorption of cationic peptides to solid surfaces of glass and plastic. PLoS ONE 2015, 10, 1–17. [Google Scholar] [CrossRef] [PubMed] [Green Version]
  25. Kirschhofer, F.; Rieder, A.; Prechtl, C.; Kuhl, B.; Sabljo, K.; Woll, C.; Obst, U.; Brenner-Weiss, G. Quartz crystal microbalance with dissipation coupled to on-chip MALDI-ToF mass spectrometry as a tool for characterising proteinaceous conditioning films on functionalised surfaces. Anal. Chim. Acta 2013, 802, 95–102. [Google Scholar] [CrossRef] [PubMed]
  26. Zheng, X.Y.; Baker, H.; Hancock, W.S.; Fawaz, F.; McCaman, M.; Pungor, E. Proteomic analysis for the assessment of different lots of fetal bovine serum as a raw material for cell culture. Part IV. Application of proteomics to the manufacture of biological drugs. Biotechnol. Prog. 2006, 22, 1294–1300. [Google Scholar] [CrossRef]
  27. Shannahan, J.H.; Brown, J.M.; Chen, R.; Ke, P.C.; Lai, X.; Mitra, S.; Witzmann, F.A. Comparison of nanotube-protein corona composition in cell culture media. Small 2013, 9, 2171–2181. [Google Scholar] [CrossRef]
  28. Sakulkhu, U.; Mahmoudi, M.; Maurizi, L.; Coullerez, G.; Hofmann-Amtenbrink, M.; Vries, M.; Motazacker, M.; Rezaee, F.; Hofmann, H. Significance of surface charge and shell material of superparamagnetic iron oxide nanoparticle (SPION) based core/shell nanoparticles on the composition of the protein corona. Biomater. Sci. 2015, 3, 265–278. [Google Scholar] [CrossRef]
  29. Strojan, K.; Leonardi, A.; Bregar, V.B.; Krizaj, I.; Svete, J.; Pavlin, M. Dispersion of nanoparticles in different media importantly determines the composition of their protein corona. PLoS ONE 2017, 12, 1–21. [Google Scholar] [CrossRef] [Green Version]
  30. Artimo, P.; Jonnalagedda, M.; Arnold, K.; Baratin, D.; Csardi, G.; De Castro, E.; Duvaud, S.; Flegel, V.; Fortier, A.; Gasteiger, E.; et al. ExPASy: SIB bioinformatics resource portal. Nucleic Acids Res. 2012, 40, W597–W603. [Google Scholar] [CrossRef]
  31. Available online: https://www.expasy.org/ (accessed on 22 December 2019).
  32. Bucknall, M.; Fung, K.Y.C.; Duncan, M.W. Practical quantitative biomedical applications of MALDI-TOF mass spectrometry. J. Am. Soc. Mass Spectrom. 2002, 13, 1015–1027. [Google Scholar] [CrossRef] [Green Version]
  33. Chang, R.; Asatyas, S. Water near bioinert self-assembled monolayers. Polym. J. 2018, 50, 563–571. [Google Scholar] [CrossRef]
  34. Hayashi, T.; Tanaka, Y. Mechanism underlying bioinertness of self-assembled monolayers of oligo(ethyleneglycol)-terminated alkanethiols on gold: protein adsorption, platelet adhesion, and surface forces. Phys. Chem. Chem. Phys. 2012, 14, 10196–10206. [Google Scholar] [CrossRef] [PubMed]
  35. Sekine, T.; Tanaka, Y. Evaluation of Factors To Determine Platelet Compatibility by Using Self-Assembled Monolayers with a Chemical Gradient. Langmuir 2015, 31, 7100–7105. [Google Scholar] [CrossRef]
  36. Harder, P.; Grunze, M. Molecular conformation in oligo(ethylene glycol)-terminated self-assembled monolayers on gold and silver surfaces determines their ability to resist protein adsorption. J. Phys. Chem. B 1998, 102, 426–436. [Google Scholar] [CrossRef]
  37. Sekine, T.; Asatyas, S. Surface force and vibrational spectroscopic analyses of interfacial water molecules in the vicinity of methoxy-tri(ethylene glycol)-terminated monolayers: mechanisms underlying the effect of lateral packing density on bioinertness. J Biomater Sci Polym Ed 2017, 28, 1231–1243. [Google Scholar] [CrossRef]
  38. Hayashi, T.; Hara, M. Nonfouling self-assembled monolayers: mechanisms underlying protein and cell resistance. Curr. Phys. Chem. 2011, 1, 90–98. [Google Scholar] [CrossRef]
  39. Yang, Z.; Jaeckisch, S.M. Enhanced binding of Aspergillus fumigatus spores to A549 epithelial cells and extracellular matrix proteins by a component from the spore surface and inhibition by rat lung lavage fluid. Thorax 2000, 55, 579–584. [Google Scholar] [CrossRef] [Green Version]
  40. Cuypers, P.A.; Willems, G.M. Adsorption kinetics of protein mixtures. A tentative explanation of the Vroman effect. Ann. N. Y. Acad. Sci. 1987, 516, 244–252. [Google Scholar] [CrossRef] [Green Version]
  41. Leonard, E.F.; Vroman, L. Is the Vroman effect of importance in the interaction of blood with artificial materials? J. Biomater. Sci. Polym. Ed 1991, 3, 95–107. [Google Scholar] [CrossRef]
  42. Yang, D.; Ramkissoon, K. High-accuracy peptide mass fingerprinting using peak intensity data with machine learning. J. Proteome Res. 2008, 7, 62–69. [Google Scholar] [CrossRef] [PubMed]
  43. Timm, W.; Scherbart, A. Peak intensity prediction in MALDI-TOF mass spectrometry: a machine learning study to support quantitative proteomics. Bmc Bioinformatics 2008, 9, 443. [Google Scholar] [CrossRef] [PubMed] [Green Version]
  44. Gay, S.; Binz, P.A. Peptide mass fingerprinting peak intensity prediction: extracting knowledge from spectra. Proteomics 2002, 2, 1374–1391. [Google Scholar] [CrossRef]
  45. Stead, D.A.; Preece, A. Universal metrics for quality assessment of protein identifications by mass spectrometry. Mol. Cell. Proteomics 2006, 5, 1205–1211. [Google Scholar] [CrossRef] [Green Version]
Figure 1. Flow of preparation of samples for MALDI-ToF mass spectroscopic measurements.
Coatings 10 00012 g001
Figure 2. Samples (protein/SAM/Au/Ge/glass) fixed on a MALDI target plate after all the processes presented in Figure 1.
Coatings 10 00012 g002
Figure 3. Procedure for determination of the reference m/z values.
Coatings 10 00012 g003
Figure 4. MALDI-ToF mass spectra of digested BSA. (a) BSA adsorbed on the C8 SAM then digested (procedure shown in Figure 2) (b) BSA was digested in a vial and measured on an C8 SAM.
Coatings 10 00012 g004
Figure 5. Amounts of adsorbed proteins and changes in the resonant frequency measured by QCM. (a) Adsorption of BSA and fibrinogen from 1 mg/mL solution in PBS (n = 4) and (b) adsorption of serum proteins from 20% serum diluted with PBS (n = 3). Error bars and n denote standard deviation and the number of measurements, respectively.
Coatings 10 00012 g005
Figure 6. MALDI-ToF mass spectra of fragmented proteins on the SAMs; (a) C8, (b) OH, (c) COOH, (d) NH2, and (e) EG3-OH SAMs. The locations of the reference m/z of BSA, vitronectin and fibronectin are shown (m/z = 927.49, 946.48 and 1323.71 for BSA, vitronectin, and fibronectin, respectively).
Coatings 10 00012 g006
Figure 7. Evaluated molar ratios of vitronectin and fibronectin with respect to BSA (n = 30). Error bars and n denote standard deviation and the number of spectra analyzed, respectively.
Coatings 10 00012 g007
Table 1. Thiols used in this work and their chemical structures.
AbbreviationChemical Structure of the Thiol Molecules
C8HS–(CH2)7–CH3
COOHHS–(CH2)11–COOH
OHHS–(CH2)11–OH
NH2HS–(CH2)11–NH2
EG3–OHHS–(CH2)11–(O–CH2–CH2)3–OH
Table 2. Proteins of interest in serum (abundant and those with RGD moieties), their molecular weights, and reference m/z obtained by the procedure presented in Figure 3.
ProteinMolecular WeightReference m/z
Serum albumin69,293927.493
Alpha-1-antiproteinase46,104873.468
Plasminogen91,2161426.640
Cone cGMP-specific 3′,5′-cyclic phosphodiesterase subunit alpha’98,7981476.690
Lactoperoxidase80,6421423.830
NADH-ubiquinone oxidoreductase 75 kDa subunit79,4682048.070
Alpha-2-HS-glycoprotein38,4192058.130
Kininogen-268,7101998.000
hemiferrin24,0911715.900
Integrin beta-188,0941436.670
Prothrombin70,5061716.890
Apolipoprotein A-I30,2761772.920
Antithrombin-III52,3472062.050
Beta-2-glycoprotein 138,2521475.770
Alpha-2-antiplasmin54,7111728.820
Protein AMBP39,2352058.930
Hemoglobin fetal subunit beta15,8591434.670
Alpha 1-antichymotrypsin28,5712210.180
Apolipoprotein A-II11,202657.324
Hemoglobin subunit alpha15,1842986.440
fibronectin272,1541323.710
vitronectin53,615946.489
Table 3. Relative peak intensity of the reference m/z for each protein with respect to that of BSA in FBS and on the SAMs. Errors denote a standard deviation of 30 spectra (two substrates for each SAM with 15 spectra each at different positions).
ProteinRelative Peak Intensity of the Reference m/z for Each Protein with Respect to that for BSA
FBSC8OHCOOHNH2EG3-OH
Serum albumin1.001.001.001.001.001.00
Alpha-1-antiproteinase0.00719 ± 0.004210.212 ± 0.1380.0843 ± 0.03330.109 ± 0.0760.172 ± 0.0840.111 ± 0.056
Plasminogen0.950 ± 0.5262.59 ± 1.810.746 ± 0.6091.31 ± 0.501.54 ± 0.690.846 ± 0.314
Cone cGMP-specific 3′,5′-cyclic phosphodiesterase subunit alpha’0.0639 ± 0.04421.24 ± 0.820.279 ± 0.1770.298 ± 0.1860.972 ± 0.5371.17 ± 0.77
Lactoperoxidase0.0132 ± 0.00750.166 ± 0.1710.0575 ± 0.03080.0692 ± 0.02690.311 ± 0.5390.222 ± 0.160
NADH-ubiquinone oxidoreductase 75 kDa subunit0.0763 ± 0.06581.62 ± 2.030.101 ± 0.0630.231 ± 0.1570.533 ± 0.2470.242 ± 0.062
Alpha-2-HS-glycoprotein1.02 ± 0.970.707 ± 0.7750.0908 ± 0.04890.152 ± 0.1500.317 ± 0.1940.179 ± 0.029
Kininogen-20.0118 ± 0.00550.135 ± 0.1120.0731 ± 0.04890.0916 ± 0.03450.137 ± 0.0880.103 ± 0.045
Hemiferrin0.138 ± 0.1230.155 ± 0.0500.114 ± 0.0570.142 ± 0.0620.110 ± 0.0390.100 ± 0.020
Integrin beta-10.0117 ± 0.006090.123 ± 0.0390.114 ± 0.0470.140 ± 0.0520.0825 ± 0.03470.0676 ± 0.0361
Prothrombin0.125 ± 0.1180.212 ± 0.1110.241 ± 0.0750.234 ± 0.1070.121 ± 0.0570.143 ± 0.081
Apolipoprotein A-I0.0242 ± 0.02370.157 ± 0.0790.0925 ± 0.04570.107 ± 0.0700.143 ± 0.1080.0798 ± 0.0403
Antithrombin-III0.0641 ± 0.07152.56 ± 2.170.786 ± 0.2960.757 ± 0.6761.01 ± 0.510.482 ± 0.122
Beta-2-glycoprotein 10.582 ± 0.4810.117 ± 0.0610.0784 ± 0.03270.128 ± 0.0640.0953 ± 0.04030.0948 ± 0.0556
Alpha-2-antiplasmin0.0355 ± 0.02970.256 ± 0.1330.129 ± 0.0380.153 ± 0.0970.159 ± 0.0920.0913 ± 0.0375
Protein AMBP0.0596 ± 0.03830.204 ± 0.0770.0859 ± 0.03310.131 ± 0.0560.108 ± 0.0380.0894 ± 0.0375
Hemoglobin fetal subunit beta0.0187 ± 0.00640.154 ± 0.1210.0531 ± 0.02770.0703 ± 0.0310.151 ± 0.0820.216 ± 0.158
Alpha 1-antichymotrypsin0.00869 ± 0.004510.192 ± 0.0620.475 ± 0.3100.467±0.1910.208 ± 0.0680.130 ± 0.054
Apolipoprotein A-II0.00390 ± 0.004200.227 ± 0.2630.110 ± 0.0470.109±0.0720.133 ± 0.0610.115 ± 0.044
Hemoglobin subunit alpha0.00598 ± 0.005800.166 ± 0.1450.212 ± 0.1210.346 ± 0.3340.136 ± 0.0640.125 ± 0.124
Fibronectin0.00317 ± 0.002260.100 ± 0.0510.0620 ± 0.02590.0803 ± 0.03650.0461 ± 0.02410.0451 ± 0.0176
Vitronectin0.00297±0.001600.132 ± 0.1290.0563 ± 0.03790.0761 ± 0.03290.0396 ± 0.02490.0435 ± 0.0200

