Abstract
Comparative transcriptome analysis and de novo short-read assembly of S. aureus Newman strains revealed significant transcriptional changes in response to the exposure to triple-acting staphylolytic peptidoglycan hydrolase (PGH) 1801. Most altered transcriptions were associated with the membrane, cell wall, and related genes, including amidase, peptidase, holin, and phospholipase D/transphosphatidylase. The differential expression of genes obtained from RNA-seq was confirmed by reverse transcription quantitative PCR. Moreover, some of these gene expression changes were consistent with the observed structural perturbations at the DNA and RNA levels. These structural changes in the genes encoding membrane/cell surface proteins and altered gene expressions are the candidates for resistance to these novel antimicrobials. The findings in this study could provide insight into the design of new antimicrobial agents.
1. Introduction
Lysostaphin [1], classified as a prototype III bacteriocin, is a glycyl-glycine bacteriocin peptidoglycan hydrolase (PGH) secreted by Staphylococcus simulans. PGH is known to degrade the peptidoglycans in Staphylococcus aureus cell walls, resulting in cell lysis [2]. The antimicrobial properties of lysostaphin have been demonstrated in vitro and in vivo [3]. Several mechanisms of resistance to lysostaphin have been proposed: for example, reduced S. aureus fitness [4]; mutations in lysostaphin-resistant S. aureus femA [5]; replacing the Gly3 of the pentaglycine ligand by serine in the peptidoglycan pentaglycine cross bridge or a shortened cross-bridge [6,7,8,9,10]; alterations in the plasmid-borne lss (lysostaphin endopeptidase) and lif (pACK1) genes [9,11].
In this study, we have identified the genetic mechanisms of resistance to peptidoglycan hydrolases via repeated exposure of S. aureus Newman_2010 strain (cultured wild-type (WT) S. aureus Newman in the year of 2010) to sublethal concentrations of a genetically engineered, triple-acting, staphylolytic, peptidoglycan hydrolase (PGH1801) [2,12]. The resultant mutant strain S. aureus Newman 1801_2010 has resistance to lysostaphin with a >2-fold increase in minimum inhibitory concentration (MIC) relative to the wild-type strain Newman_2010 without exposure to any PGH [2,13,14,15]. This phenotype does not appear to be caused by the resistance mechanisms described previously because no changes were found in the known resistance genes (data not shown).
Environmental conditions experienced by multiple generations of S. aureus Newman_2010 cultured with PGH1801 could alter this organism’s differential survival and reproduction characteristics. In response to sublethal concentrations of triple-acting PGH1801, S. aureus Newman could produce a unique phenotypic adaptation. This property is known as phenotypic plasticity [16]. Such ‘transgenerational’ plasticity could provide a competitive advantage in growth resulting in long-term environmental variation [17,18,19,20].
Next-generation sequencing allows the study of any organism at the genomic and transcriptomic levels. Exploring whole-genome expression using next-generation sequencing and RNA-seq provides a more comprehensive understanding than just looking at DNA primary structure, since RNA-seq captures actively transcribed regions and, therefore, can ascertain the molecular basis of a phenotype [21,22,23,24,25]. In this study, we have applied DNA- and RNA-seq analyses by comparing genome-wide single nucleotide polymorphism (SNP) and insertion/deletion (InDel) results, as well as by measuring the differential expression levels of thousands of genes simultaneously between the strains of wild-type Newman_2010 and mutant 1801_2010 to identify mutations associated with the above resistant phenotypes. Meanwhile, our comparative transcriptome analysis and de novo short-read assembly revealed the transcriptional changes of S. aureus in response to lysostaphin treatment. All the pooled RNA-seq data were used to compare and establish genome-wide SNP and InDel results between the mutant 1801_2010 and WT Newman_2010. Reverse transcription qPCR was used to confirm the RNA-seq results. Computational analyses, including gene ontology and KEGG pathway enrichment, were also employed. We aim to identify the mutations which provide resistance to the triple-acting PGH. The findings in this work could provide insights into the design of new antimicrobial agents.
2. Materials and Methods
2.1. Bacterial Strains, Culture Conditions and Mutant Isolation
S. aureus strain Newman_2010 (wild-type) was used in this study [2]. A mutant strain 1801_2010 was developed by repeated exposure of the wild-type strain to sublethal concentrations of the triple-acting PGH1801, a fusion protein containing 3 active domains [2,12,14]. Briefly, S. aureus Newman 2010 bacteria were incubated with two-fold serial dilutions of PGH1801 (10, 5, 2.5, 1.25, and 0.63 µg/well). On day 1 of the MIC assay, bacteria growing in the first turbid well (a sublethal concentration) next to clear wells (lethal concentration) were selected as an inoculate for next MIC assay. Over this time of repeated exposures, bacteria developed more and more resistance to PGH1801. After 10 cycles of exposure of S. aureus Newman_2010 to sublethal concentrations of PGH1801, a mutant strain (1801_2010) with a 2- fold increase in MIC was isolated. Both wild-type and mutant S. aureus strains were grown at 37 °C on tryptic soy agar (TSA) or in tryptic soy broth (TSB). Growth curves of the strains were determined and shown in Supplementary Figure S1. The wild-type and mutant strains displayed a similar growth pattern with the doubling times 47.9 ± 0.431 and 48.1 ± 0.458 min, respectively.
2.2. RNA Preparation
S. aureus Newman_2010 and 1801_2010 cultures were grown in triplicates to around 0.4 of OD600, and harvested by centrifugation at 4000× g for 15 min at 4 °C. Bacterial pellets were then immediately resuspended into TRI Reagent (Molecular Research Center, Inc., Cincinnati, OH, USA). Total RNA was extracted using Direct-Zol RNA MiniPrep according to the manufacturer’s instructions (Zymo Research, Irvine, CA, USA). Each RNA sample (50 μg) was treated with 5 U of RNase-free DNase I in the presence of 80 U of RNasin (Promega) at 37 °C for 2 h to remove traces of chromosomal DNA, and then purified using an RNA Clean and Concentrator™-25 kit (Zymo Research, Irvine, CA, USA). Eluted RNAs were quantified using a Qubit 2.0 fluorometer with a Qubit RNA HS Assay Kit (Life Technologies, Carlsbad, CA, USA). Quality of each RNA sample was evaluated using an Agilent Bioanalyzer (Agilent Technologies, Santa Clara, CA, USA) with an RNA 6000 Nano kit. All the samples showed the RNA integrity numbers (RIN) above 8. The efficiency of DNase I treatment of the RNA samples was assessed by PCR amplification of a S. aureus house-keeping gene (gyrA) with a positive (S. aureus genomic DNA) and negative control (nuclease-free water).
2.3. RNA-seq Library Construction and Sequencing
Prior to RNA-seq library preparation, ribosomal RNA was depleted from the total RNA using a Ribo-Zero rRNA Removal Kit for Gram-positive Bacteria (Illumina, San Diego, CA, USA) according to the manufacturer’s instructions. A Qubit RNA HS Assay and Agilent Bioanalyzer with an RNA 6000 Pico kit were used to assess the quantity and quality of the rRNA-depleted RNA samples. Six libraries (2 strains × 3 biological replicates) were constructed using a TruSeq Stranded mRNA Sample Preparation kit (Illumina, San Diego, CA, USA) following the manufacturer’s recommendations. The libraries were sequenced on an Illumina Miseq platform using 300 base- length read chemistry in a paired-end mode.
2.4. Reverse Transcription Quantitative PCR (RT-qPCR) Analysis
RT-qPCR was performed on selected genes based on the relative transcription levels (logFC > 2.0) obtained from RNA-seq results. Primers were designed using the NCBI primer designing tool (http://www.ncbi.nlm.nih.gov/tools/primer-blast/index.cgi) (accessed on 10 January 2022). Reverse transcription reactions were carried out using random primers and SuperScript II Reverse Transcriptase (Life Technologies, Carlsbad, CA, USA). Quantification of cDNA was performed on a 7500 real-time PCR system (Applied Biosystems, Foster City, CA, USA) using a SYBR®® Green PCR Master Mix. The gyrA gene was used as a reference for data normalization. Housekeeping genes gmk and pta were included as controls to ensure data reliability. All the samples were analyzed in three biological and technique triplicates. Relative gene expression levels were computed by the 2−ΔΔCT method, where ΔΔCT = ΔCT (mutant) − ΔCT (WT), ΔCT = CT (target gene) − CT (gyrA), and CT is the threshold cycle value of the amplified gene.
2.5. Bioinformatics Analysis
Computational analyses, including gene ontology and KEGG pathway enrichment analysis, were performed [26]. Pooled RNA-seq data were used to compare genome-wide SNP and InDel results between the mutant 1801_2010 and WT Newman_2010 strains. The details are referenced [27].
2.6. Data Accession Numbers
Project accessions in NCBI: PRJNA235858 and PRJNA235865 for S. aureus newman_2010 and 1801_2010 strains are available, respectively. DNA sequence accession numbers are SRX478042 (Newman_2010) and SRX478056 (1801_2010). The whole-genome sequence of S. aureus Newman_WT (GenBank accession: NC_009641) was used as a reference for genome mapping.
3. Results
3.1. Integrated Genome and Transcriptome Sequencing for Identification of Genetic Variants
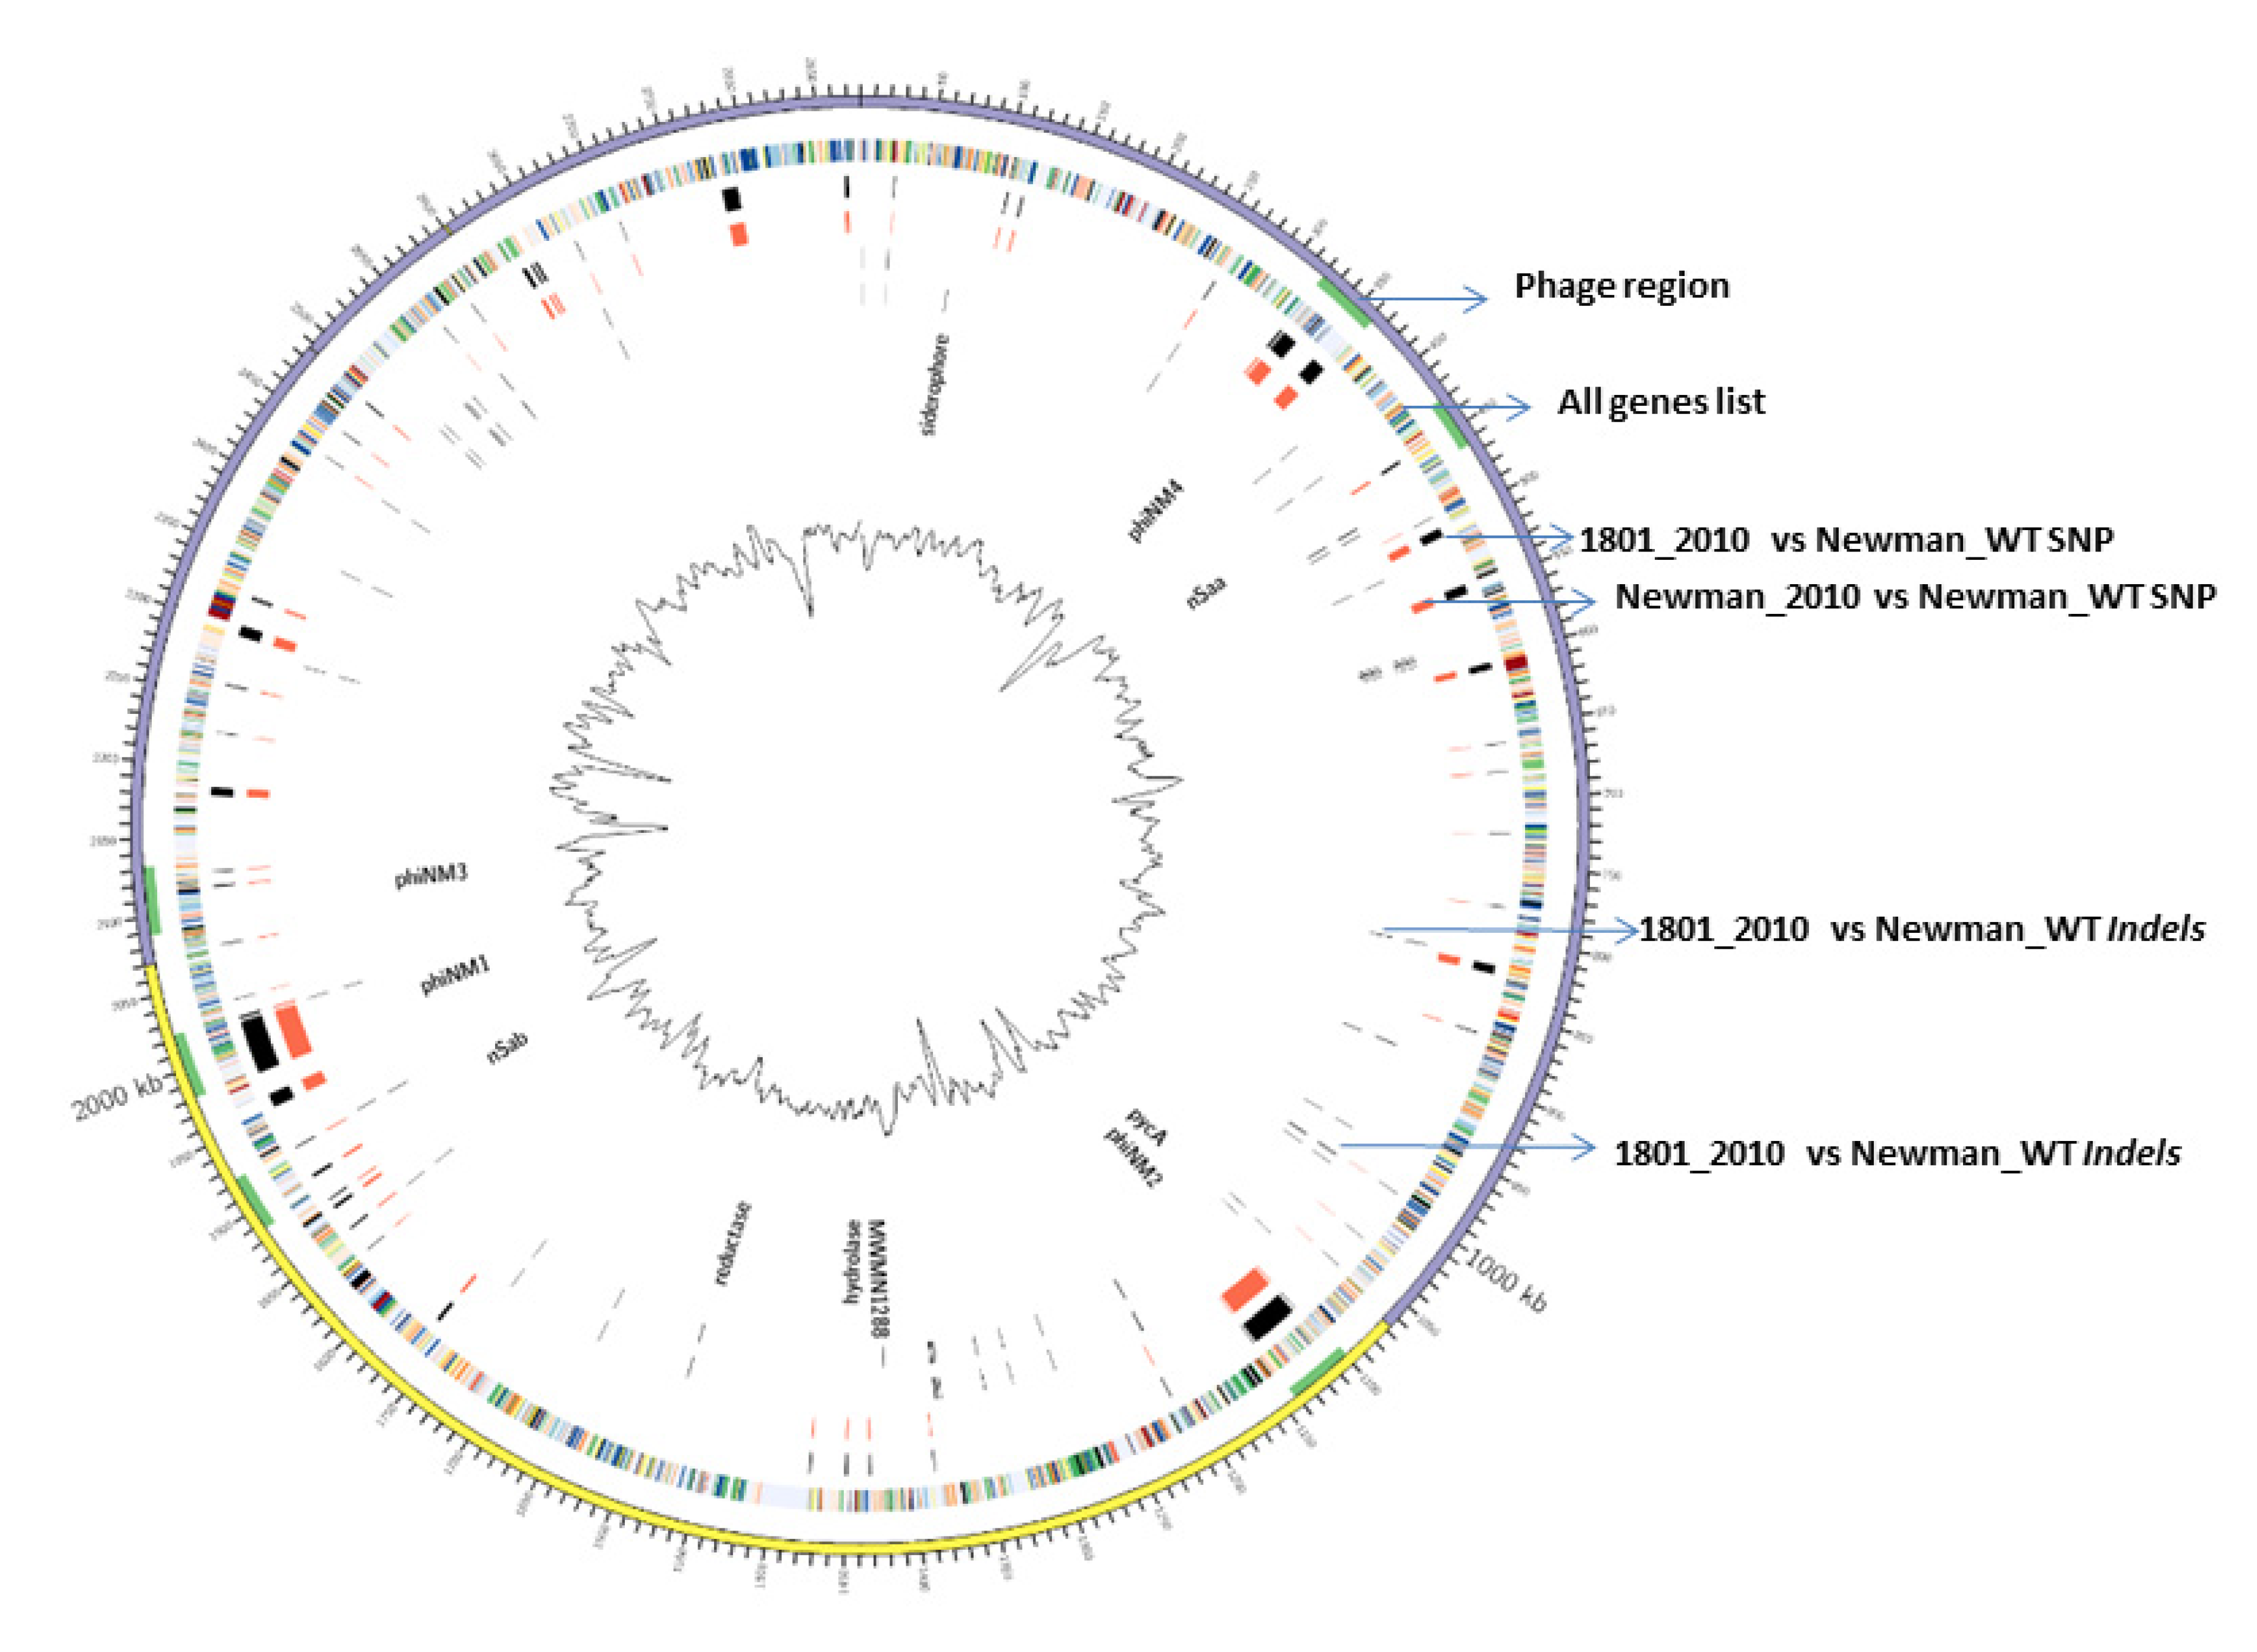
In this study, we applied a Circos diagram (Figure 1) to illuminate the whole-genome and transcriptome sequencing in order to graphically represent genetic variations and association with their corresponding phenotypes across S. aureus Newman WT and mutant strains. Figure 1 shows several genetic differences between mutant 1801_2010 and WT Newman_2010 compared to the reference genome of Newman_WT (NC_009641).
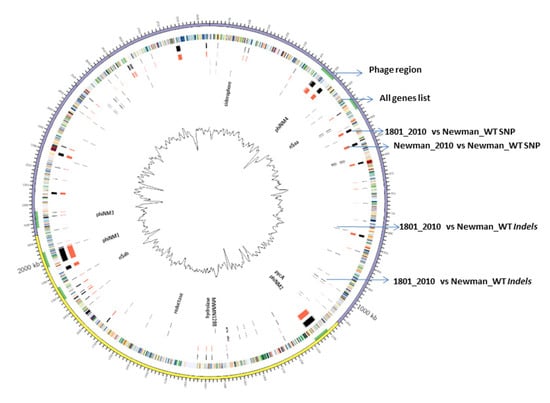
Figure 1.
WGS and RNA-seq polymorphism comparison. Ring 1 (outer circle) shows the chromosomal map positions; ring 2 lists chromosome genes; rings 3 and 4 represent the SNP differences between S. aureus mutant 1801_2010 to Newman_WT and Newman_2010 to Newman_WT; rings 5 and 6 represent the InDel differences between S. aureus mutant 1801_2010 to Newman_WT and Newman_2010 to Newman_WT.
3.2. InDels, Gaps, and SNPs Identified
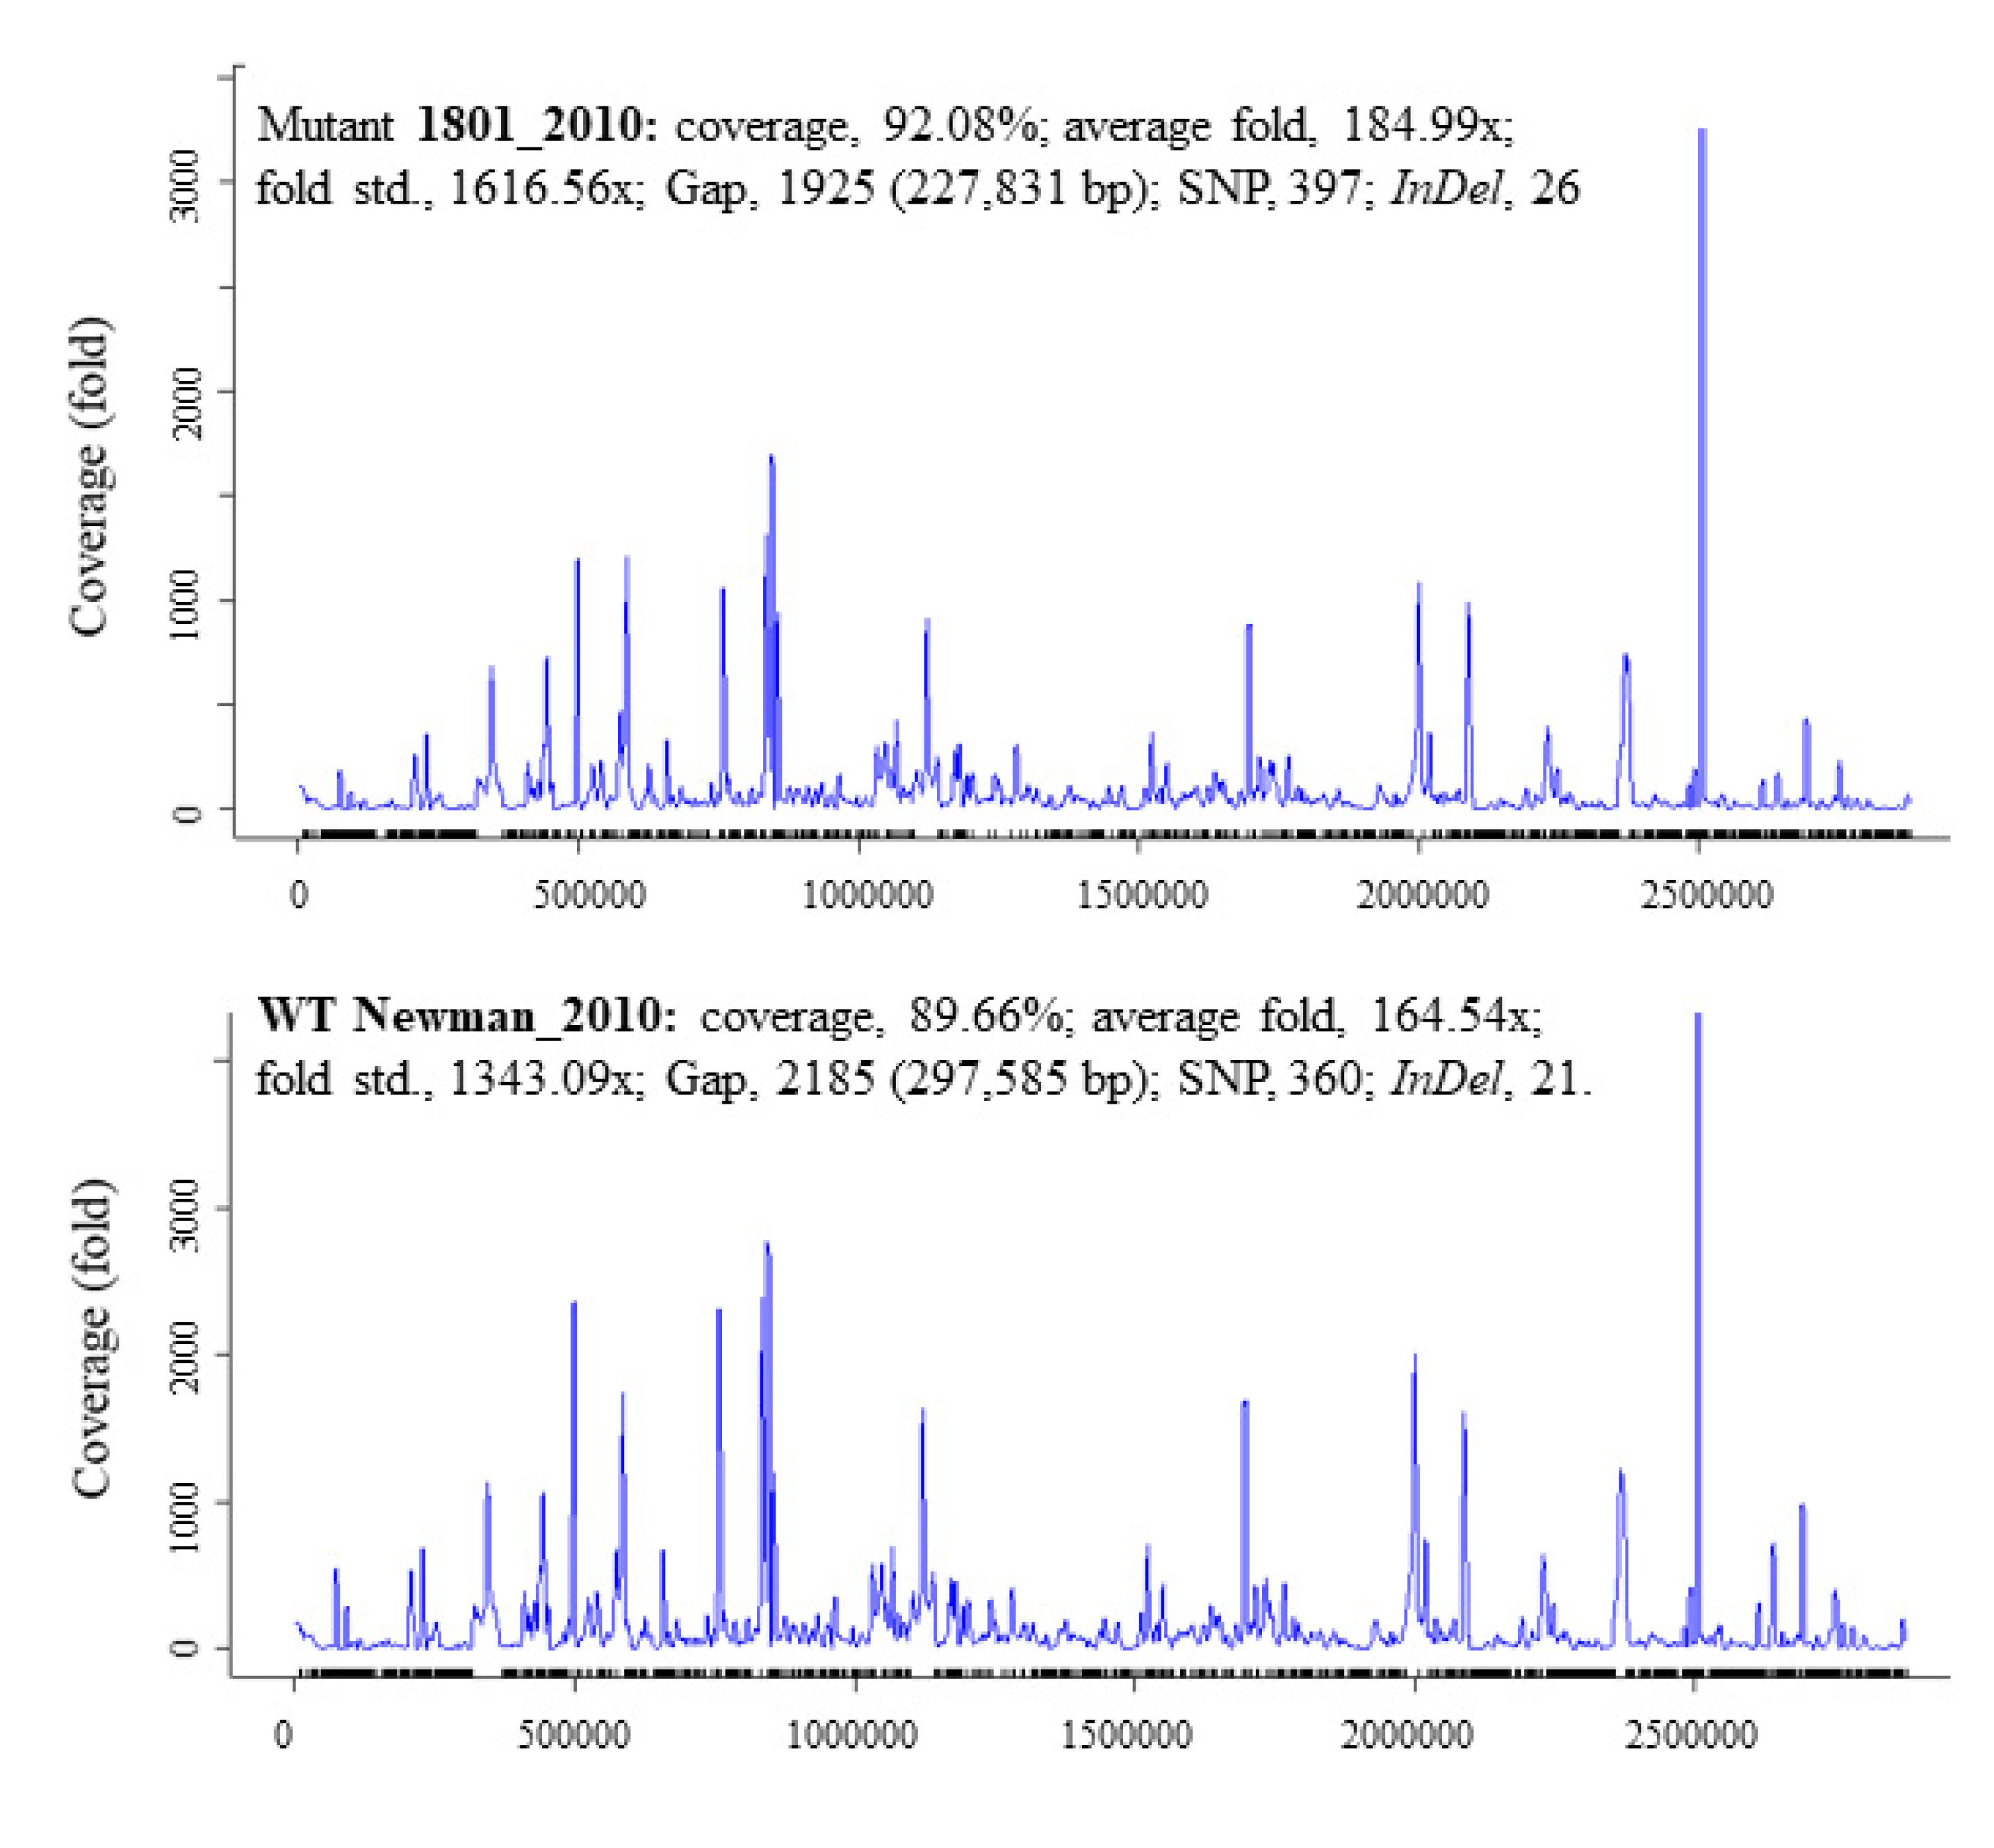
There was a total of 397 SNPs, 1925 gaps, and 26 InDels detected in mutant 1801_2010 and 360 SNPs, 2185 gaps, and 21 InDels in WT Newman_2010 (Figure 2) compared to Newman_WT via using the EDGE bioinformatics software [27]. RNA-seq data were used to verify these results. The purpose of this study is to investigate whether these genomic alterations contribute to gene expression. There are six rings in Figure 1: the inner two rings are the genetic difference of InDels, the middle two rings are SNP differences. The second ring from the outside is the list of all genes. All genetic variations of SNPs and InDels from WT Newman_2010 and mutant 1801_2010 were mapped relative to the reference genome sequence of Newman_WT (NC_009641). Several important genes have been identified which could be responsible for the phenotype. Table 1 lists the polymorphic changes in the mutant compared to Newman_WT. Of the 21 significant SNPs, 18 were associated with 4 individual genes (NWMN_0305, NWMN_0306, NWMN_0979, and NWMN_1288). The remaining three SNPs were distributed in the intergenic regions: two of them were between the lctp and Spa genes and one was located between the recR and tmk genes. Table 2 presents the 15 InDels identified in mutant 1801_2010 compared to Newman_WT. Two genes (NWMN_1308 and NWMN_1410) contained 5 InDels. The remaining 10 InDels were distributed in 5 important intergenic regions: 4 of them were in the intergenic region between the NWMN_0810 and NWMN_0811 genes; 2 were in the intergenic region between the NWMN_2500 and ldh genes; 2 of the InDels were in the intergenic region between the citZ and aapA genes; 2 of them were in the region between dnaA and rpmH. In Table 1 and Table 2, two different assembly methods were compared to identify genetic variations: one was based on sequence reads and the other was based on contigs. The results from both methods agreed with each other very well.
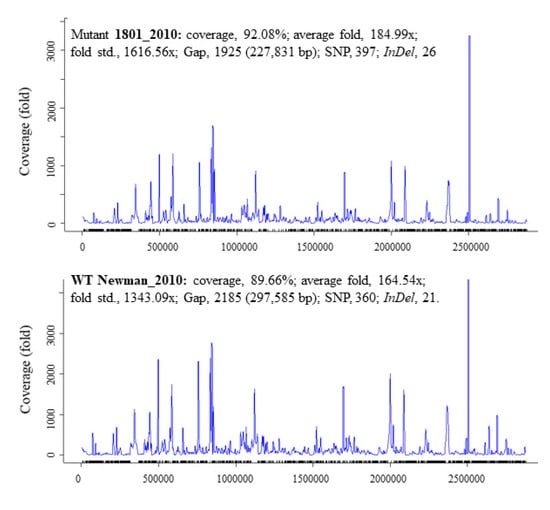
Figure 2.
Summary statistics for the InDel and SNP data of S. aureus Newman_2010 and mutant 1801_2010 by comparing to Newman_WT (NC_009641).

Table 1.
Polymorphic changes in S. aureus mutant 1801_2010 compared to Newman_WT *.

Table 2.
InDels identified in S. aureus mutant 1801_2010 compared to Newman_WT *.
3.3. Identification of Up-Regulated and Down-Regulated Genes
After normalization, the DESeq2 tool [28] was employed for quantitative analysis of RNA-seq data and identification of the genes differentially expressed between the mutant and WT strains. In total, 1091 differentially expressed genes (DEGs) (padj < 0.001) were obtained (Supplementary Table S1): 18 of them were significantly up-regulated (padj < 0.001, log2 FC > 0.7, FDR < 0.05) and 6 genes were significantly down-regulated (padj < 0.001, log2 FC < −0.7, FDR < 0.05). The summary of DEGs between the mutant 1801_2010 and WT Newman_2010 is shown in Table 3. Comparative transcriptome analysis and de novo short-read transcriptome assembly revealed that significant transcriptional changes in response to the triple-acting PGH 1801 were associated with membrane, cell wall, and their related genes (e.g., amidase, peptidase, holin, and phospholipase D/transphosphatidylase).

Table 3.
Up- and down-regulated genes in S. aureus mutant 1801_2010 compared to WT Newman_2010.
3.4. Function Ontology and KEGG Pathway Enrichment Analyses of DEGs
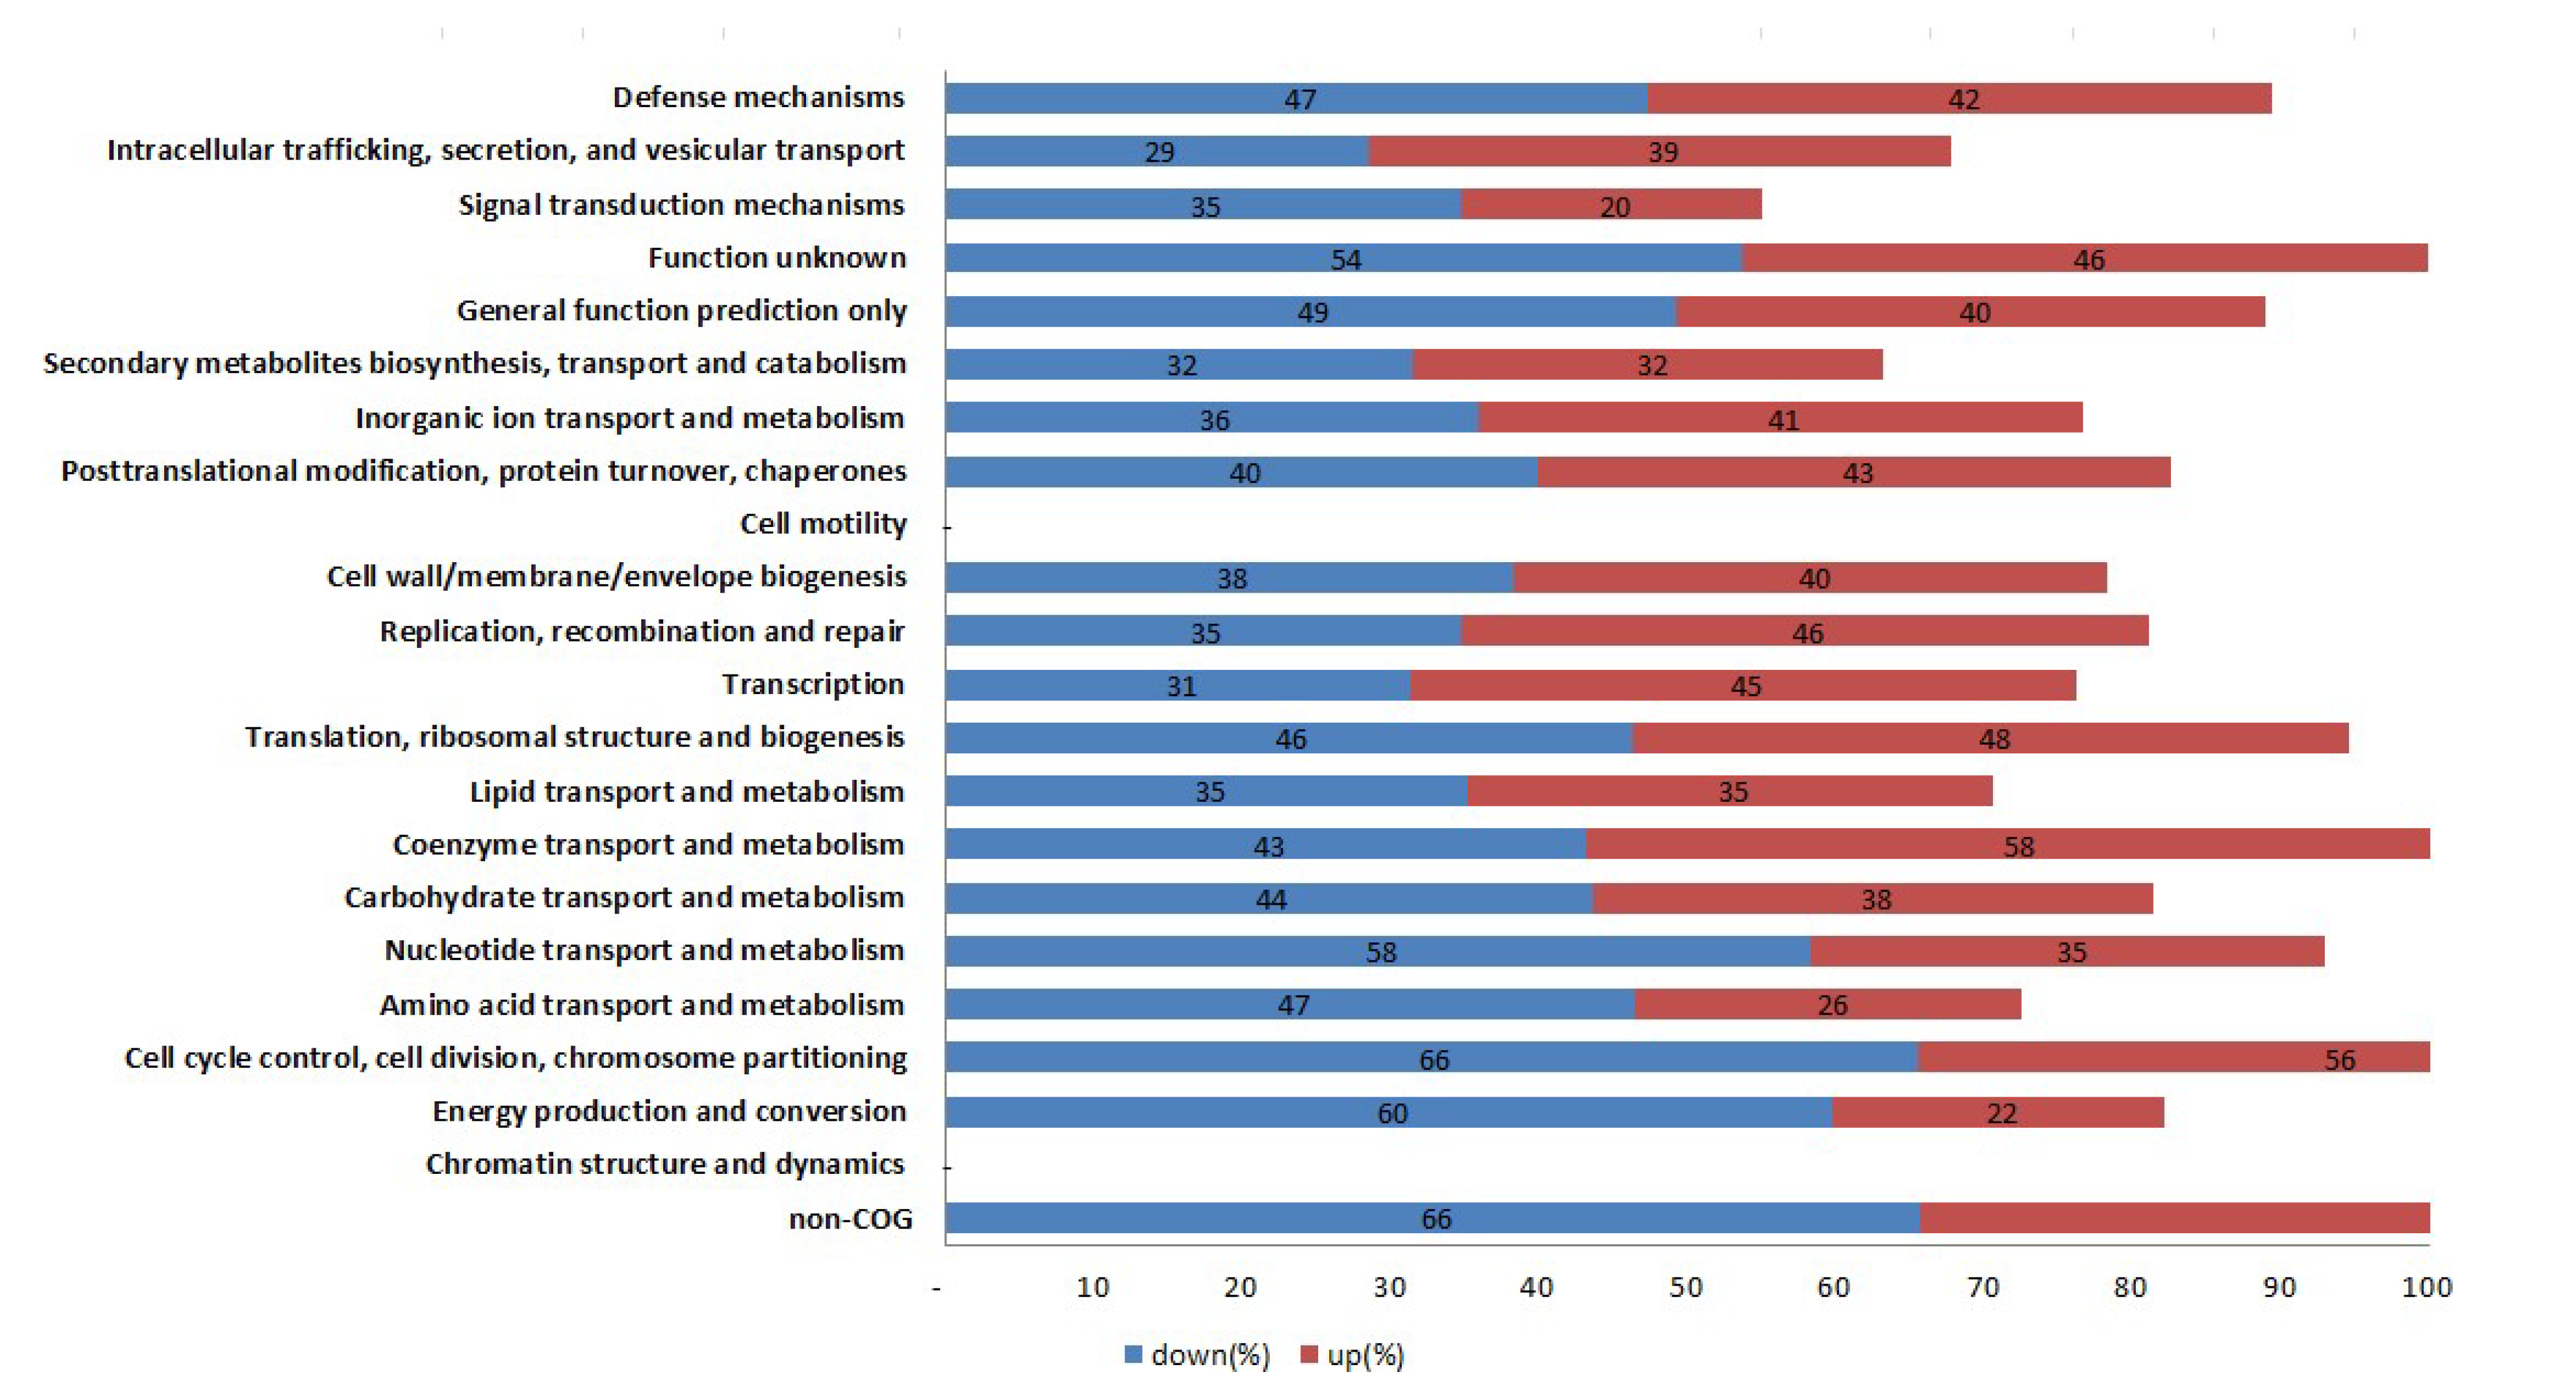
To annotate the potential functions of the DEGs between WT and mutant strains, DEGs with >2-fold expression change were assigned to different KEGG pathways. All KEGG pathways were analyzed as shown in Figure 3. In these pathways, energy production and conversion, amino acid transport and metabolism, nucleotide transport and metabolism, intracellular trafficking, secretion, and vesicular transport, signal transduction and mechanisms were the most enriched pathways either up- or down-expressed between WT Newman_2010 and mutant 1801_2010 strains.
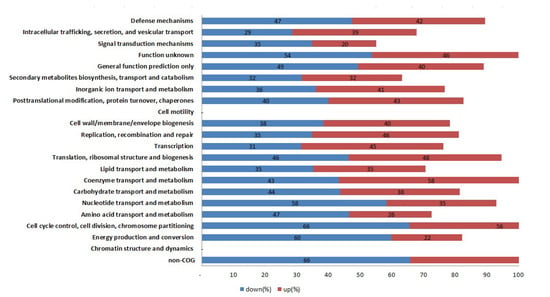
Figure 3.
KEGG pathway classification of the DEGs between S. aureus mutant 1801_2010 and WT Newman_2010.
3.5. RT-qPCR Confirmation
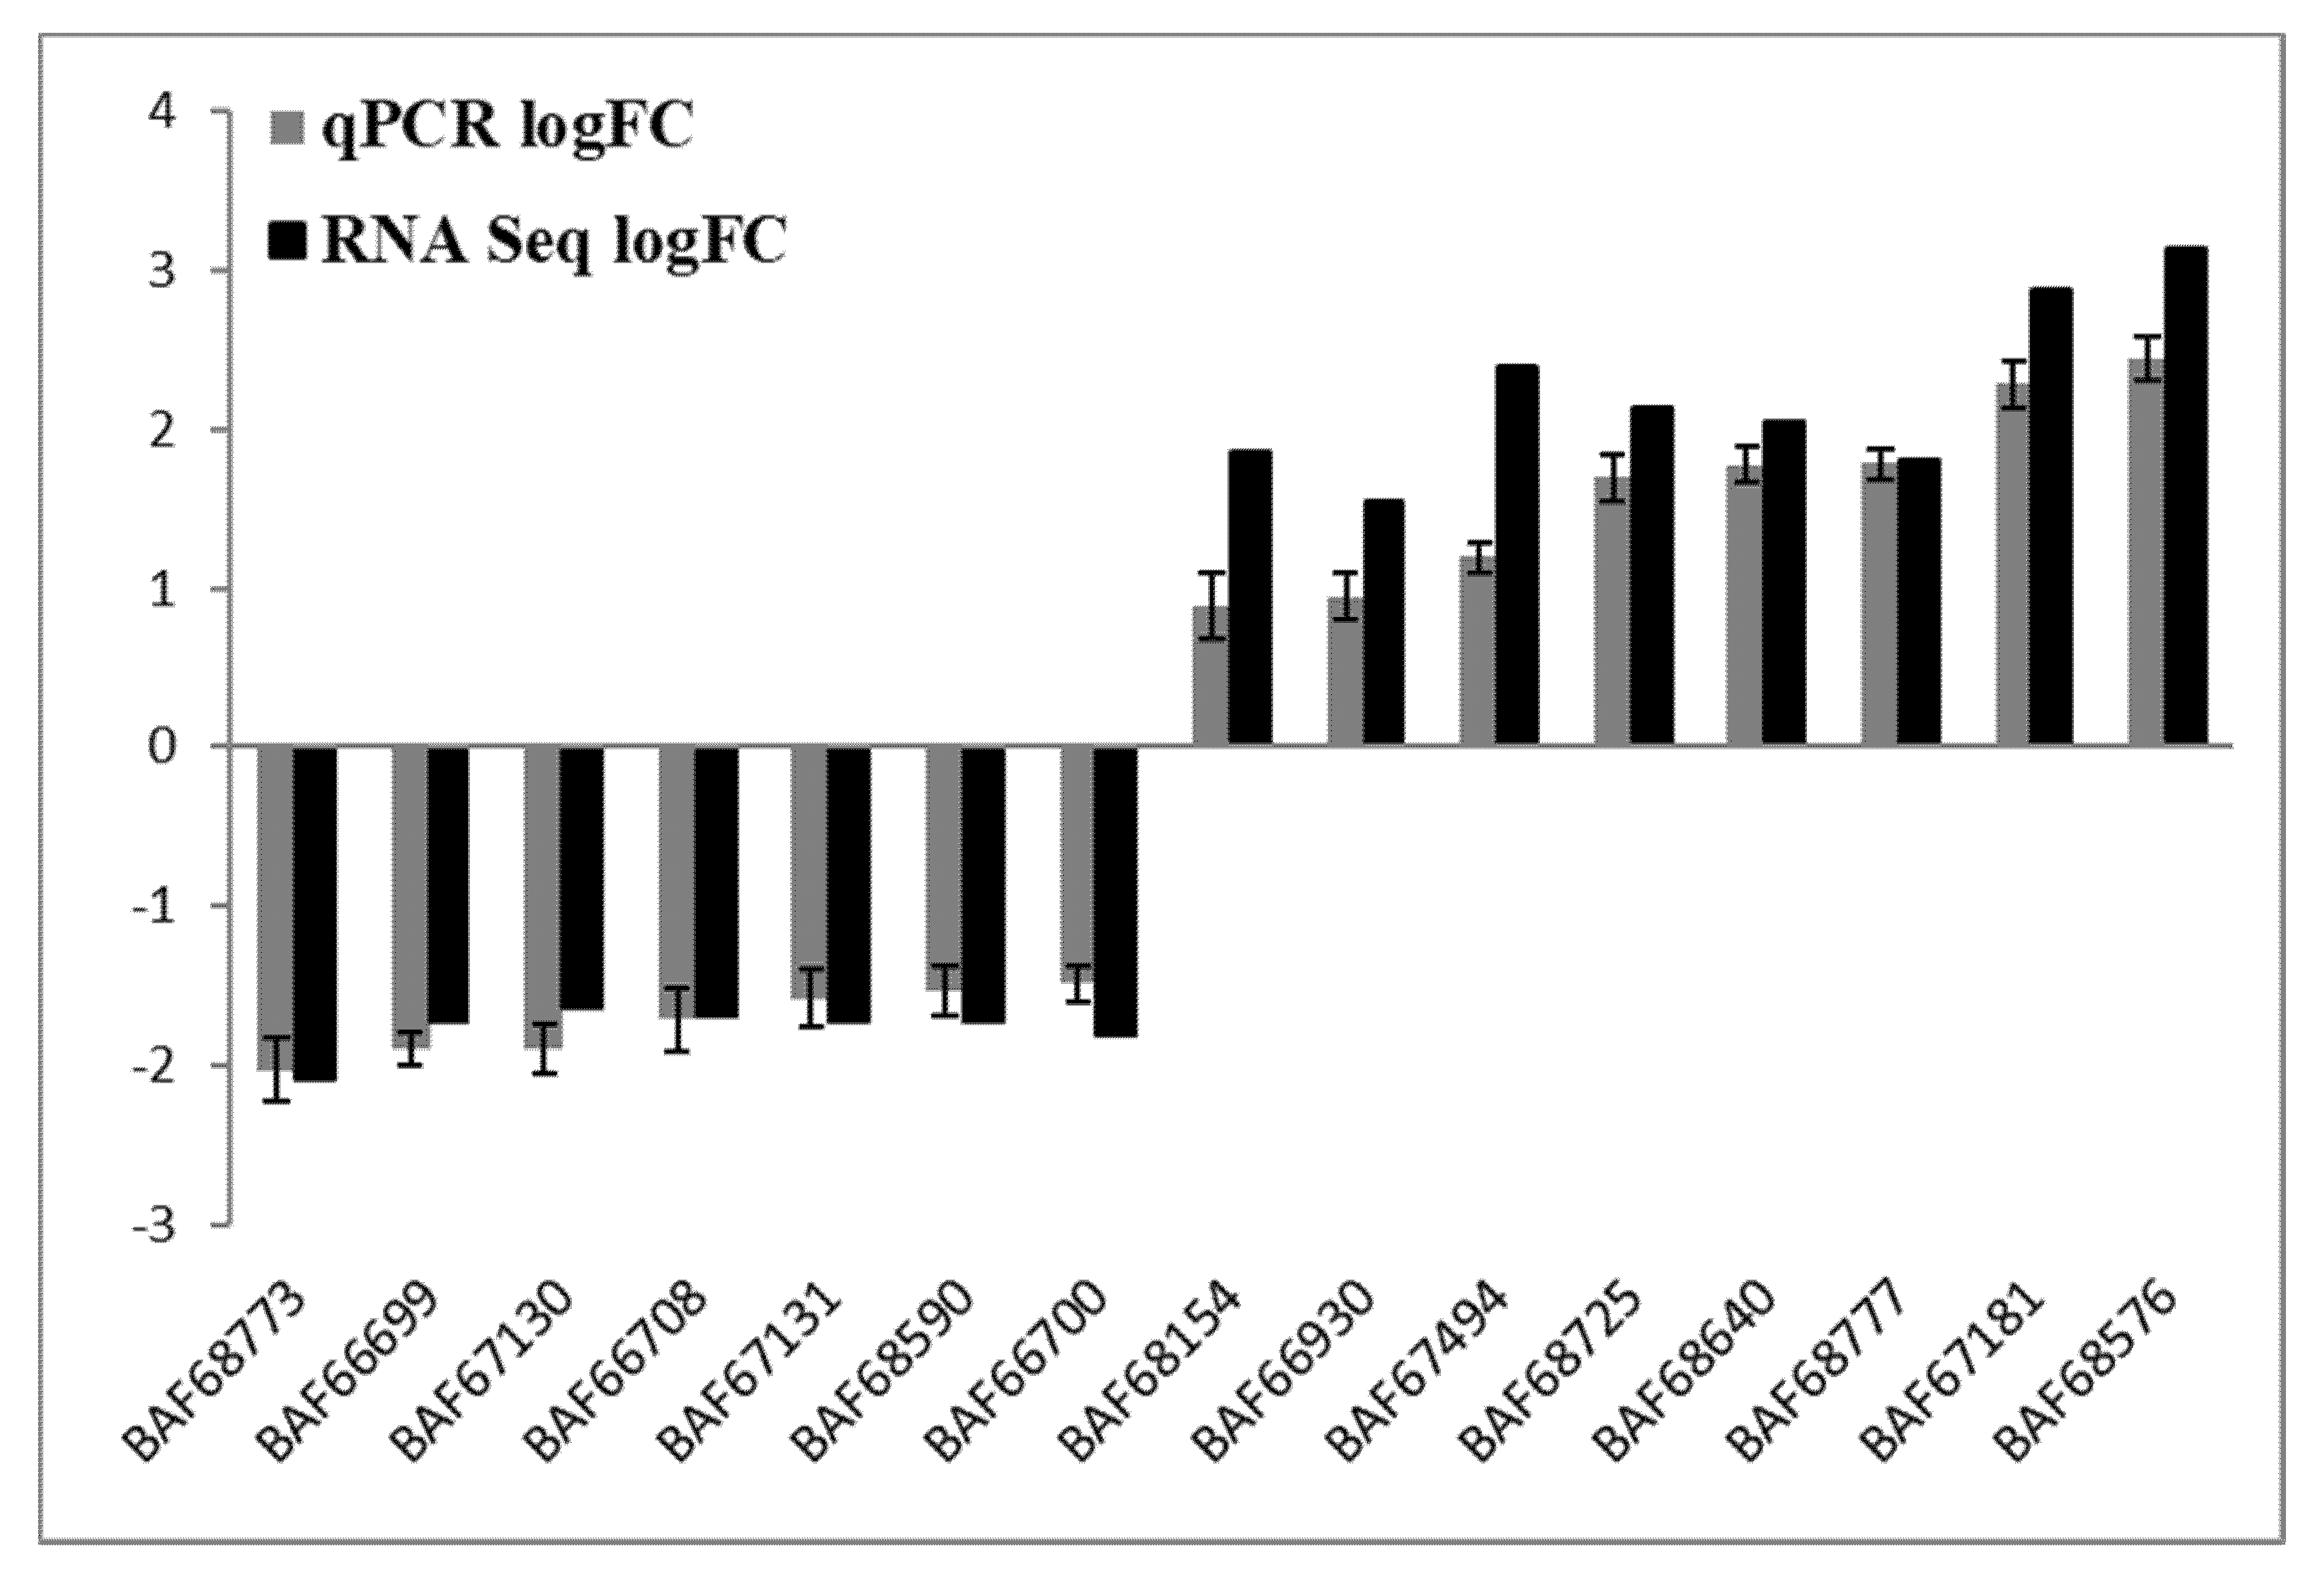
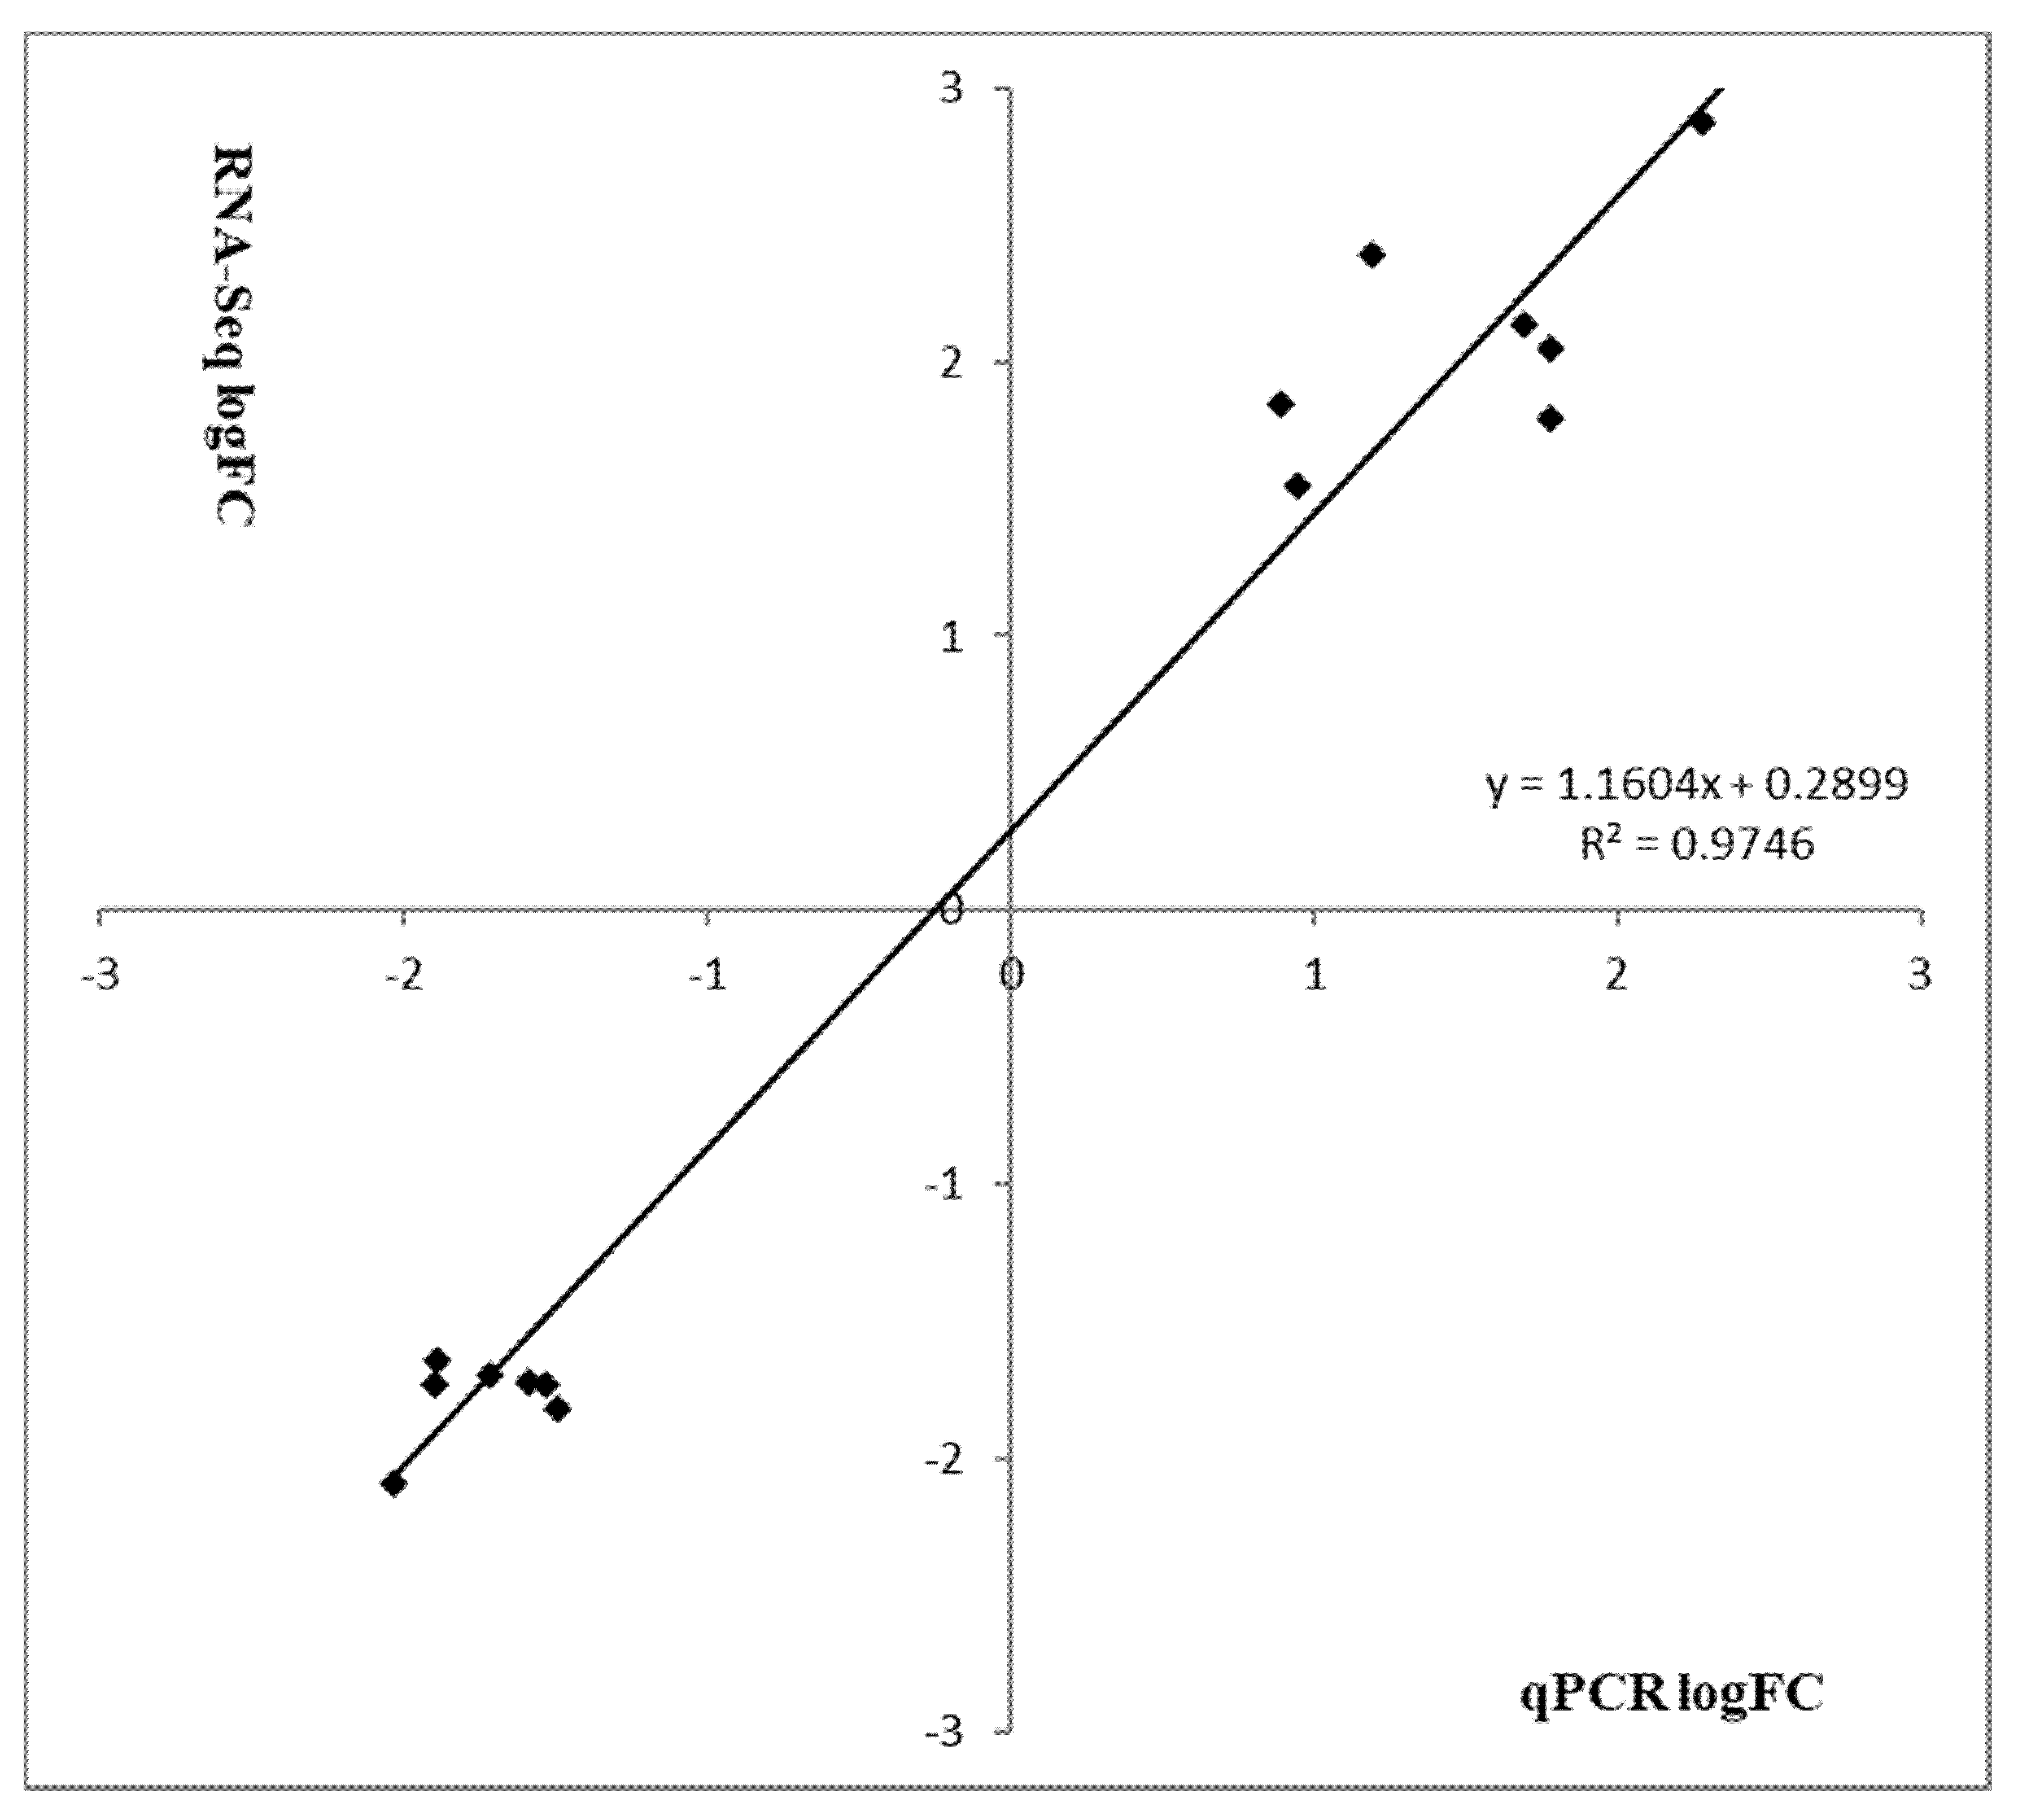
To verify the most differentially expressed genes obtained from RNA-seq datasets of WT Newman_2010 and mutant 1801_2010, we performed reverse transcription qPCR experiments and compared these results with RNA-seq. Figure 4 demonstrated that the changes of gene expression from RT-qPCR correlated well with the transcriptome profiling from RNA-seq. Moreover, these results were consistent with the observed structural changes at the DNA and RNA levels (Table 1 and Table 2). These structural changes in the genes encoding membrane/cell surface proteins and the perturbation in gene expression are potential candidates responsible for resistance to these novel antimicrobials.
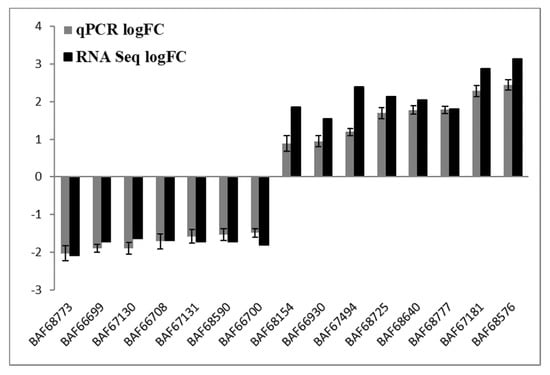
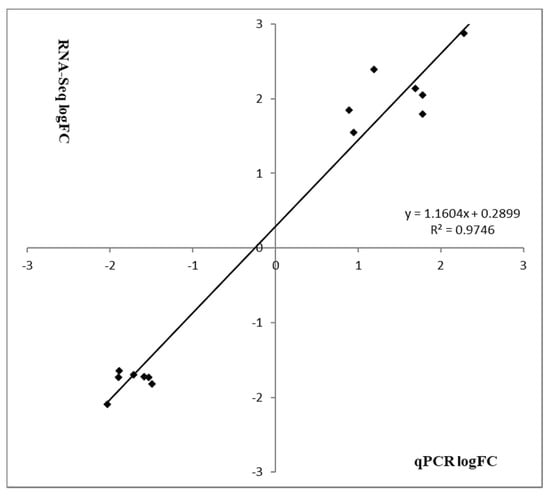
Figure 4.
Validation of RNA-seq analysis by RT-qPCR. Relative gene expression levels of S. aureus mutant 1801_2010 and WT Newman_2010 were quantified by RT-qPCR, and data were analyzed using the comparative critical threshold (ΔΔCT) method. The ratios (log2) of relative gene expression from RT-qPCR and RNA-seq are shown in grey and black bars, respectively. A ratio greater than zero (>0) indicates up regulation of gene expression and a ratio below zero (<0) indicates down regulation in mutant 1801_2010. Error bars indicate standard deviations of three replicates.
4. Discussion
Our previous genome sequencing work (https://www.ncbi.nlm.nih.gov/sra/?term=SRX478056) (accessed on 10 January 2022) has been trying to identify the genomic changes in Staphylococcus aureus that confer resistance to peptidoglycan hydrolase antimicrobial enzymes [15,29]. In this study, we combined RNA-seq and genome sequence data of WT Newman_2010 and mutant 1801_2010 strains by comparing genome-wide SNP and InDel results. Additionally, we applied RT-qPCR to confirm these results. To reveal the differences between the positive genes and other genes, computational analyses, including gene ontology and KEGG pathway enrichment, were also employed. These differences between mutant 1801_2010, WT Newman_2010, and Newman_WT strains in Figure 1 indicate these genetic changes are potentially responsible for phenotypic variation. However, a phenotypic trait caused by genetic sources of variation could include additive variance, dominant variance, environmental variance (e.g., organismal adaptation), and epistatic variance [30,31].
In Table 1 and Table 2, and Figure 2, we observed the genetic variations which could be responsible for the mechanism of resistance to peptidoglycan hydrolase (PGH 1801) in S. aureus. However, these variations are only statistical indicators of a functional effect associated with their genotypic variants because it is uncommon to have a concrete variant with a “precise” genetic location with measurable statistical “effects”. Although we can say that there is a functional effect, in order to determine functionality we must go beyond the identification of the variant phenotype due to a specific SNP- or InDel-based locus. It will be instructive to compare the results of current study with those in the literatures. Mostly, there are genomic loci that could influence the expression level of mRNA and these loci can be physically located close to or far away from the gene that gets regulated. It is not necessary that genetic loci are associated with a SNP or InDel.
In this study, we observed significant transcriptional changes in S. aureus Newman_2010 upon exposure to the triple-acting fusion protein PGH1801 [2,12]. We found most of these are membrane proteins, cell wall related proteins [32,33,34,35,36,37], such as amidase [12], peptidase [29], holin [38,39,40,41,42], and phospholipase D/transphosphatidylase [43,44].
Through the Gene Ontology function and KEGG pathway enrichment analyses, we found energy production and conversion, amino acid transport and metabolism, nucleotide transport and metabolism, intracellular trafficking, secretion, and vesicular transport, signal transduction and mechanisms were the most enriched pathways either up- or down-expressed between the wild-type and mutant.
Comparative transcriptome analysis and de novo short-read assembly in this study revealed that the genes with significant transcriptional changes in response to exposure to the triple-acting fusion protein are associated with membrane and cell wall (e.g., amidase, peptidase, holin, and phospholipase D/transphosphatidylase). These results are consistent with the observed nucleotide changes at the DNA level. The nucleotide changes in the genes encoding membrane/cell surface proteins and the alteration of gene expression may contribute to the increased resistance of S. aureus to PGHs. The findings of this study could provide insights into the target genes responsible for PGH resistance and lead to the design of new antimicrobial agents.
Supplementary Materials
The following supporting information can be downloaded at: https://www.mdpi.com/article/10.3390/antibiotics11020125/s1, Figure S1: Growth curves of S. aureus Newman_2010 and mutant 1801_2010; Table S1: Complete list of differentially expressed genes based on normalized RNA-seq data.
Author Contributions
X.Y. and Y.H.—planned and directed experiments, analyzed results, and prepared and edited the manuscript; Y.X.—designed and conducted experiments, processed data, and assisted in manuscript preparation, C.L., D.M.D., A.G. and P.I.—planned experiments, analyzed data, and edited the manuscript. All authors have read and agreed to the published version of the manuscript.
Funding
This research was supported by the U.S. Department of Agriculture, Agricultural Research Service (USDA-ARS), Current Research Information System number 8072-42000-093 8072-42000-093.
Data Availability Statement
DNA sequence reads are available in GenBank of NCBI with the accession No. SRX478042 for S. aureus Newman_2010 and SRX478056 for mutant 1801_2010. The GenBank accession number for complete genome sequence of S. aureus Newman_WT is NC_009641.
Conflicts of Interest
The authors declare that they have no conflict of interest.
References
- Bastos, M.D.; Coutinho, B.G.; Coelho, M.L. Lysostaphin: A Staphylococcal Bacteriolysin with Potential Clinical Applications. Pharmaceuticals 2010, 3, 1139–1161. [Google Scholar] [CrossRef] [Green Version]
- Becker, S.C.; Dong, S.; Baker, J.R.; Foster-Frey, J.; Pritchard, D.G.; Donovan, D.M. Triple-acting Lytic Enzyme Treatment of Drug-Resistant and Intracellular Staphylococcus aureus. Sci. Rep. 2016, 6, 25063. [Google Scholar] [CrossRef]
- Johnson, C.T.; Sok, M.C.P.; Martin, K.E.; Kalelkar, P.P.; Caplin, J.D.; Botchwey, E.A.; Garcia, A.J. Lysostaphin and BMP-2 co-delivery reduces S. aureus infection and regenerates critical-sized segmental bone defects. Sci. Adv. 2019, 5, eaaw1228. [Google Scholar] [CrossRef] [Green Version]
- Kusuma, C.; Jadanova, A.; Chanturiya, T.; Kokai-Kun, J.F. Lysostaphin-resistant variants of Staphylococcus aureus demonstrate reduced fitness in vitro and in vivo. Antimicrob. Agents Chemother. 2007, 51, 475–482. [Google Scholar] [CrossRef] [Green Version]
- Climo, M.W.; Ehlert, K.; Archer, G.L. Mechanism and suppression of lysostaphin resistance in oxacillin-resistant Staphylococcus aureus. Antimicrob. Agents Chemother. 2001, 45, 1431–1437. [Google Scholar] [CrossRef] [PubMed] [Green Version]
- Dehart, H.P.; Heath, H.E.; Heath, L.S.; Leblanc, P.A.; Sloan, G.L. The Lysostaphin Endopeptidase Resistance Gene (epr) Specifies Modification of Peptidoglycan Cross Bridges in Staphylococcus simulans and Staphylococcus aureus. Appl. Environ. Microbiol. 1995, 61, 2811. [Google Scholar] [CrossRef] [PubMed] [Green Version]
- Stranden, A.M.; Ehlert, K.; Labischinski, H.; Berger-Bachi, B. Cell wall monoglycine cross-bridges and methicillin hypersusceptibility in a femAB null mutant of methicillin-resistant Staphylococcus aureus. J. Bacteriol. 1997, 179, 9–16. [Google Scholar] [CrossRef] [PubMed] [Green Version]
- Sugai, M.; Fujiwara, T.; Ohta, K.; Komatsuzawa, H.; Ohara, M.; Suginaka, H. epr, which encodes glycylglycine endopeptidase resistance, is homologous to femAB and affects serine content of peptidoglycan cross bridges in Staphylococcus capitis and Staphylococcus aureus. J. Bacteriol. 1997, 179, 4311–4318. [Google Scholar] [CrossRef] [PubMed] [Green Version]
- Thumm, G.; Gotz, F. Studies on prolysostaphin processing and characterization of the lysostaphin immunity factor (Lif) of Staphylococcus simulans biovar staphylolyticus. Mol. Microbiol. 1997, 23, 1251–1265. [Google Scholar] [CrossRef] [PubMed]
- Rohrer, S.; Ehlert, K.; Tschierske, M.; Labischinski, H.; Berger-Bachi, B. The essential Staphylococcus aureus gene fmhB is involved in the first step of peptidoglycan pentaglycine interpeptide formation. Proc. Natl. Acad. Sci. USA 1999, 96, 9351–9356. [Google Scholar] [PubMed] [Green Version]
- Heath, H.E.; Heath, L.S.; Nitterauer, J.D.; Rose, K.E.; Sloan, G.L. Plasmid-encoded lysostaphin endopeptidase resistance of Staphylococcus simulans biovar staphylolyticus. Biochem. Biophys. Res. Commun. 1989, 160, 1106–1109. [Google Scholar] [CrossRef]
- Filatova, L.Y.; Donovan, D.M.; Ishnazarova, N.T.; Foster-Frey, J.A.; Becker, S.C.; Pugachev, V.G.; Balabushevich, N.G.; Dmitrieva, N.F.; Klyachko, N.L. A Chimeric LysK-lysostaphin fusion enzyme lysing Staphylococcus aureus Cells: A study of both kinetics of inactivation and specifics of interaction with anionic polymers. Appl. Biochem. Biotechnol. 2016, 180, 544–557. [Google Scholar] [CrossRef] [PubMed]
- von Eiff, C.; Kokai-Kun, J.F.; Becker, K.; Peters, G. In vitro activity of recombinant lysostaphin against Staphylococcus aureus isolates from anterior nares and blood. Antimicrob. Agents Chemother. 2003, 47, 3613–3615. [Google Scholar] [CrossRef] [Green Version]
- Becker, S.C.; Dong, S.; Baker, J.R.; Foster-Frey, J.; Pritchard, D.G.; Donovan, D.M. Differentially conserved staphylococcal SH3b_5 cell wall binding domains confer increased staphylolytic and streptolytic activity to a streptococcal prophage endolysin domain. Gene 2009, 443, 32–41. [Google Scholar] [CrossRef] [PubMed]
- Schmelcher, M.; Powell, A.M.; Becker, S.C.; Camp, M.J.; Donovan, D.M. Chimeric phage lysins act synergistically with lysostaphin to kill mastitis-causing Staphylococcus aureus in murine mammary glands. Appl. Environ. Microbiol. 2012, 78, 2297–2305. [Google Scholar] [CrossRef] [PubMed] [Green Version]
- Kelly, S.A.; Panhuis, T.M.; Stoehr, A.M. Phenotypic plasticity: Molecular mechanisms and adaptive significance. Compr. Physiol. 2012, 2, 1417–1439. [Google Scholar] [PubMed]
- Hurdle, J.G.; O’Neill, A.J.; Ingham, E.; Fishwick, C.; Chopra, I. Analysis of mupirocin resistance and fitness in Staphylococcus aureus by molecular genetic and structural modeling techniques. Antimicrob. Agents Chemother. 2004, 48, 4366–4376. [Google Scholar] [CrossRef] [Green Version]
- O’Neill, A.J.; Huovinen, T.; Fishwick, C.W.; Chopra, I. Molecular genetic and structural modeling studies of Staphylococcus aureus RNA polymerase and the fitness of rifampin resistance genotypes in relation to clinical prevalence. Antimicrob. Agents Chemother. 2006, 50, 298–309. [Google Scholar] [CrossRef] [Green Version]
- Mushegian, A.A.; Arbore, R.; Walser, J.C.; Ebert, D. Environmental sources of bacteria and genetic variation in behavior influence host-associated microbiota. Appl. Environ. Microbiol. 2019, 85, e01547-18. [Google Scholar] [CrossRef] [Green Version]
- Patlar, B.; Weber, M.; Ramm, S.A. Genetic and environmental variation in transcriptional expression of seminal fluid proteins. Heredity 2019, 122, 595–611. [Google Scholar] [CrossRef]
- Qin, N.; Tan, X.; Jiao, Y.; Liu, L.; Zhao, W.; Yang, S.; Jia, A. RNA-Seq-based transcriptome analysis of methicillin-resistant Staphylococcus aureus biofilm inhibition by ursolic acid and resveratrol. Sci. Rep. 2014, 4, 5467. [Google Scholar] [CrossRef] [PubMed] [Green Version]
- Zhao, X.; Liu, Z.; Liu, Z.; Meng, R.; Shi, C.; Chen, X.; Bu, X.; Guo, N. Phenotype and RNA-seq-Based transcriptome profiling of Staphylococcus aureus biofilms in response to tea tree oil. Microb. Pathog. 2018, 123, 304–313. [Google Scholar] [CrossRef] [PubMed]
- Chauhan, D.; Hati, S.; Priyadarshini, R.; Sen, S. Transcriptome analysis predicts mode of action of benzimidazole molecules against Staphylococcus aureus UAMS-1. Drug Dev. Res. 2019, 80, 490–503. [Google Scholar] [CrossRef]
- Nitzan, T.; Kokou, F.; Doron-Faigenboim, A.; Slosman, T.; Biran, J.; Mizrahi, I.; Zak, T.; Benet, A.; Cnaani, A. Transcriptome analysis reveals common and differential response to low temperature exposure between tolerant and sensitive blue tilapia (Oreochromis aureus). Front. Genet. 2019, 10, 100. [Google Scholar] [CrossRef]
- Singh, N.; Rajwade, J.; Paknikar, K.M. Transcriptome analysis of silver nanoparticles treated Staphylococcus aureus reveals potential targets for biofilm inhibition. Coll. Surf. B Biointerfaces 2019, 175, 487–497. [Google Scholar] [CrossRef] [PubMed]
- Smith, A.D.; Yan, X.; Chen, C.; Dawson, H.D.; Bhagwat, A.A. Understanding the host-adapted state of Citrobacter rodentium by transcriptomic analysis. Arch. Microbiol. 2016, 198, 353–362. [Google Scholar] [CrossRef] [PubMed]
- Li, P.E.; Lo, C.C.; Anderson, J.J.; Davenport, K.W.; Bishop-Lilly, K.A.; Xu, Y.; Ahmed, S.; Feng, S.; Mokashi, V.P.; Chain, P.S. Enabling the democratization of the genomics revolution with a fully integrated web-based bioinformatics platform. Nucleic Acids Res. 2017, 45, 67–80. [Google Scholar] [CrossRef] [PubMed] [Green Version]
- Love, M.I.; Huber, W.; Anders, S. Moderated estimation of fold change and dispersion for RNA-seq data with DESeq2. Genome Biol. 2014, 15, 550. [Google Scholar] [CrossRef] [PubMed] [Green Version]
- Yeroslavsky, G.; Girshevitz, O.; Foster-Frey, J.; Donovan, D.M.; Rahimipour, S. Antibacterial and antibiofilm surfaces through polydopamine-assisted immobilization of lysostaphin as an antibacterial enzyme. Langmuir 2015, 31, 1064–1073. [Google Scholar] [CrossRef] [PubMed]
- Hall, J.W.; Yang, J.; Guo, H.; Ji, Y. The Staphylococcus aureus AirSR two-component system mediates reactive oxygen species resistance via transcriptional regulation of staphyloxanthin production. Infect. Immun. 2017, 85, e00838-16. [Google Scholar] [CrossRef] [PubMed] [Green Version]
- McLean, K.; Holmes, E.A.; Penewit, K.; Lee, D.K.; Hardy, S.R.; Ren, M.; Krist, M.P.; Huang, K.; Waalkes, A.; Salipante, S.J. Artificial Selection for Pathogenicity Mutations in Staphylococcus aureus Identifies Novel Factors Relevant to Chronic Infection. Infect. Immun. 2019, 87, e00884-18. [Google Scholar] [CrossRef] [PubMed] [Green Version]
- Zygmunt, W.A.; Browder, H.P.; Tavormina, P.A. Susceptibility of coagulase-negative staphylococci to lysostaphin and other antibiotics. Appl. Microbiol. 1968, 16, 1168–1173. [Google Scholar] [CrossRef]
- Becker, S.C.; Dong, S.; Baker, J.R.; Foster-Frey, J.; Pritchard, D.G.; Donovan, D.M. LysK CHAP endopeptidase domain is required for lysis of live staphylococcal cells. FEMS Microbiol. Lett. 2009, 294, 52–60. [Google Scholar] [CrossRef] [PubMed] [Green Version]
- Belyansky, I.; Tsirline, V.B.; Montero, P.N.; Satishkumar, R.; Martin, T.R.; Lincourt, A.E.; Shipp, J.I.; Vertegel, A.; Heniford, B.T. Lysostaphin-coated mesh prevents staphylococcal infection and significantly improves survival in a contaminated surgical field. Am. Surg. 2011, 77, 1025–1031. [Google Scholar] [CrossRef] [PubMed]
- Abtahi, H.; Farhangnia, L.; Ghaznavi-Rad, E. In vitro and in vivo antistaphylococcal activity determination of the new recombinant lysostaphin protein. Jundishapur. J. Microbiol. 2016, 9, e28489. [Google Scholar] [CrossRef] [PubMed] [Green Version]
- Boksha, I.S.; Lavrova, N.V.; Grishin, A.V.; Demidenko, A.V.; Lyashchuk, A.M.; Galushkina, Z.M.; Ovchinnikov, R.S.; Umyarov, A.M.; Avetisian, L.R.; Chernukha, M.; et al. Staphylococcus simulans Recombinant lysostaphin: Production, purification, and determination of antistaphylococcal activity. Biochemistry 2016, 81, 502–510. [Google Scholar] [CrossRef]
- Chandra Ojha, S.; Imtong, C.; Meetum, K.; Sakdee, S.; Katzenmeier, G.; Angsuthanasombat, C. Purification and characterization of the antibacterial peptidase lysostaphin from Staphylococcus simulans: Adverse influence of Zn(2+) on bacteriolytic activity. Protein Expr. Purif. 2018, 151, 106–112. [Google Scholar] [CrossRef] [PubMed]
- Loessner, M.J.; Gaeng, S.; Wendlinger, G.; Maier, S.K.; Scherer, S. The two-component lysis system of Staphylococcus aureus bacteriophage Twort: A large TTG-start holin and an associated amidase endolysin. FEMS Microbiol. Lett. 1998, 162, 265–274. [Google Scholar] [CrossRef] [PubMed]
- Donovan, D.M. Bacteriophage and peptidoglycan degrading enzymes with antimicrobial applications. Recent Pat. Biotechnol. 2007, 1, 113–122. [Google Scholar] [CrossRef] [PubMed]
- Shi, Y.; Li, N.; Yan, Y.; Wang, H.; Li, Y.; Lu, C.; Sun, J. Combined antibacterial activity of phage lytic proteins holin and lysin from Streptococcus suis bacteriophage SMP. Curr. Microbiol. 2012, 65, 28–34. [Google Scholar] [CrossRef]
- Sahin, F.; Karasartova, D.; Ozsan, T.M.; Kiyan, M.; Karahan, C.Z.; Tekeli, A. Identification of methicillin-resistant Staphylococcus aureus carrying an exfoliative toxin A gene encoding phage isolated from a hospitalized patient in Turkey. Can. J. Microbiol. 2013, 59, 260–265. [Google Scholar] [CrossRef] [PubMed]
- Beltrame, C.O.; Cortes, M.F.; Bonelli, R.R.; Correa, A.B.; Botelho, A.M.; Americo, M.A.; Fracalanzza, S.E.; Figueiredo, A.M. Inactivation of the autolysis-related genes lrgB and yycI in Staphylococcus aureus increases cell lysis-dependent eDNA release and enhances biofilm development in vitro and in vivo. PLoS ONE 2015, 10, e0138924. [Google Scholar] [CrossRef] [PubMed]
- Buckland, A.G.; Heeley, E.L.; Wilton, D.C. Bacterial cell membrane hydrolysis by secreted phospholipases A(2): A major physiological role of human group IIa sPLA(2) involving both bacterial cell wall penetration and interfacial catalysis. Biochim. Biophys. Acta 2000, 1484, 195–206. [Google Scholar] [CrossRef]
- Pourhajibagher, M.; Bahador, A. Outer membrane protein 100 of Aggregatibacter actinomycetemcomitans act as a biopharmaceutical target for photodynamic therapy: An in silico analysis. Photodiagnosis Photodyn. Ther. 2016, 16, 154–160. [Google Scholar] [CrossRef] [PubMed]
Publisher’s Note: MDPI stays neutral with regard to jurisdictional claims in published maps and institutional affiliations. |
© 2022 by the authors. Licensee MDPI, Basel, Switzerland. This article is an open access article distributed under the terms and conditions of the Creative Commons Attribution (CC BY) license (https://creativecommons.org/licenses/by/4.0/).

