Dual-Oriented Targeted Nanostructured SERS Label-Free Immunosensor for Detection, Quantification, and Analysis of Breast Cancer Biomarker Concentrations in Blood Serum

 ,
,  ,
,
Abstract
1. Introduction
2. Materials and Methods
2.1. Reagents
2.2. Functionalization of Substrates
2.3. HER-II mAb Buffer Exchange
2.4. HER-II mAb Preparation
2.5. SERS Biosensor–Breast Cancer Serum Interaction
2.6. CA 15-3 Antibody Buffer Exchange, Activation, and Purification
2.7. CA 15-3 Antibody Conjugation
2.8. Interaction of SERS Biosensor with CA 15-3 Standard Solution
2.9. Characterization Methods
3. Quantification
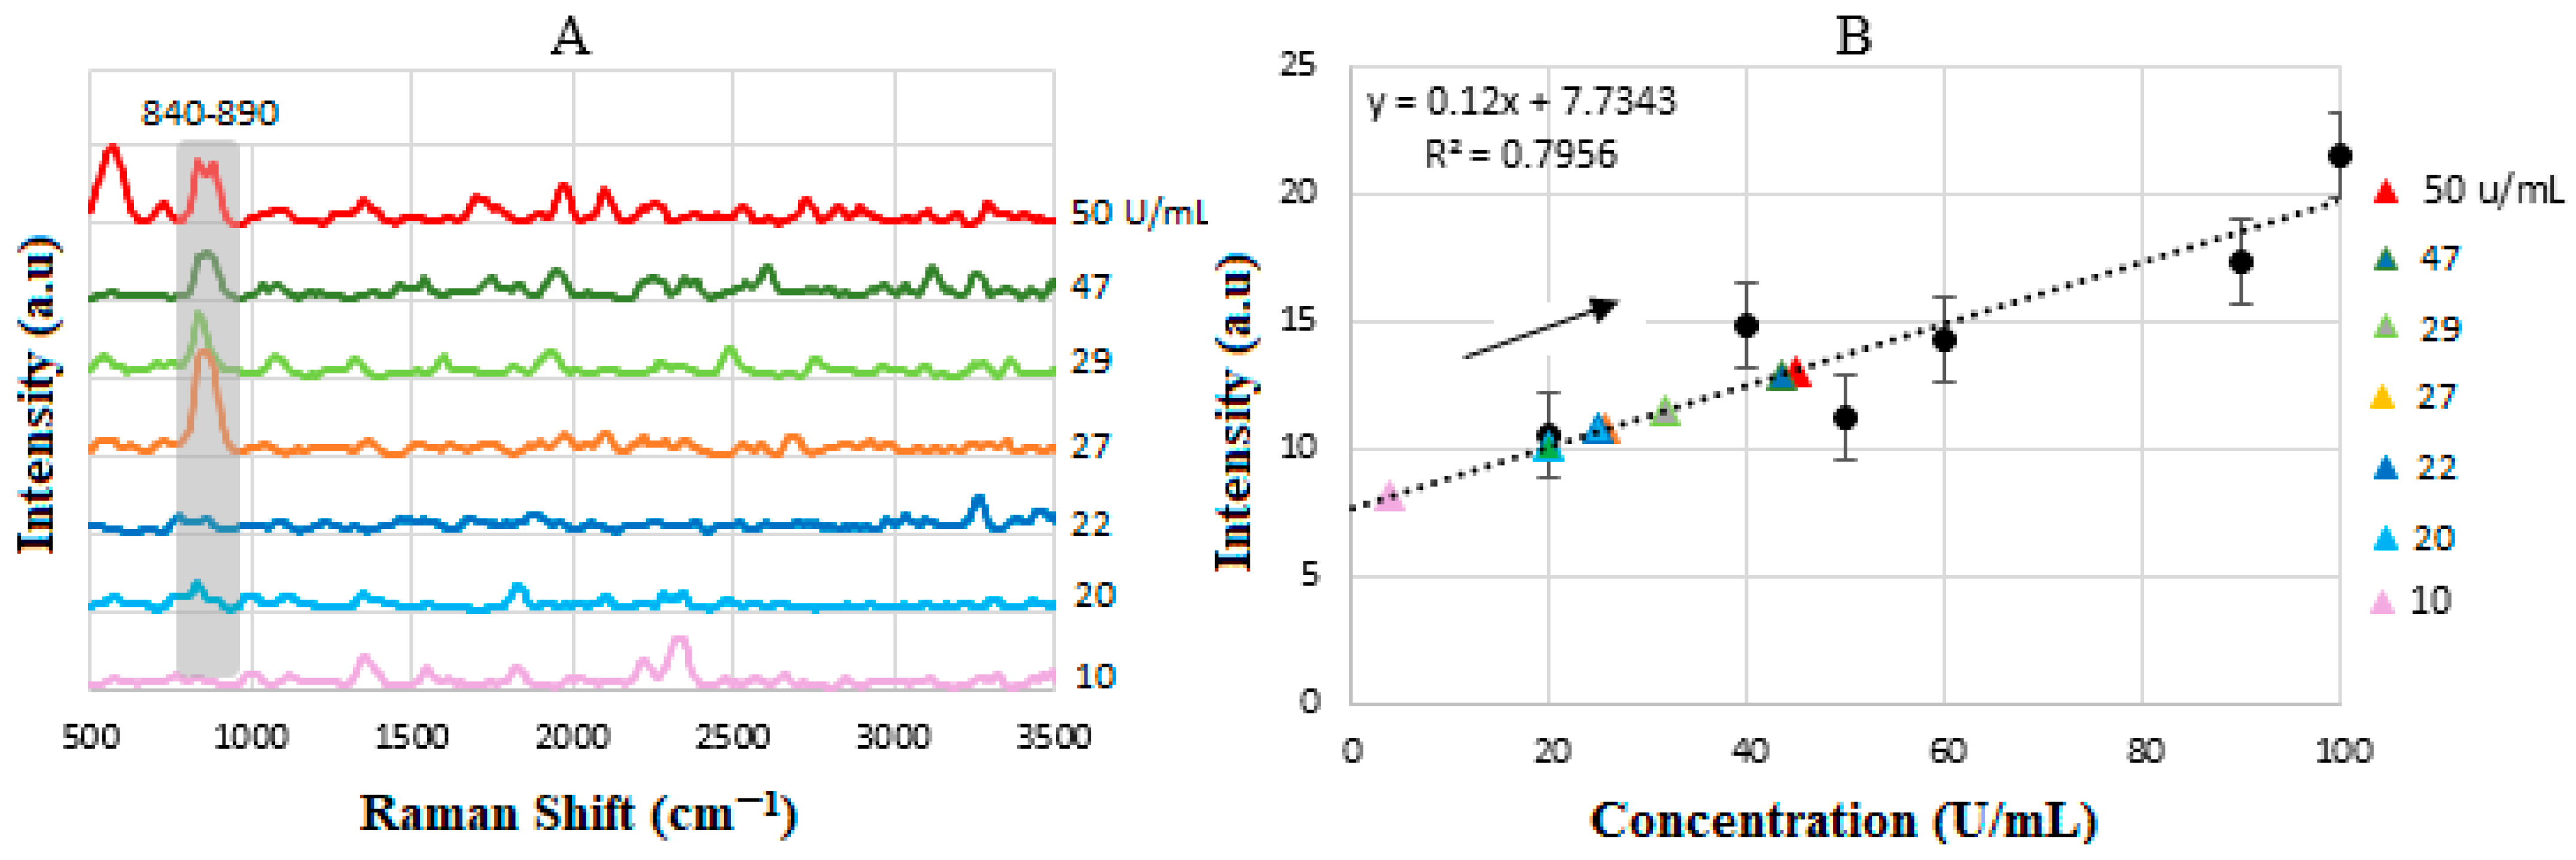
3.1. Calibration
3.2. Implementation: SpectraView (SV)
4. Results and Discussion
4.1. UV–Vis Spectroscopy
4.2. AFM of GNU-Immobilized Substrate
4.3. Enhancement Factor (EF)
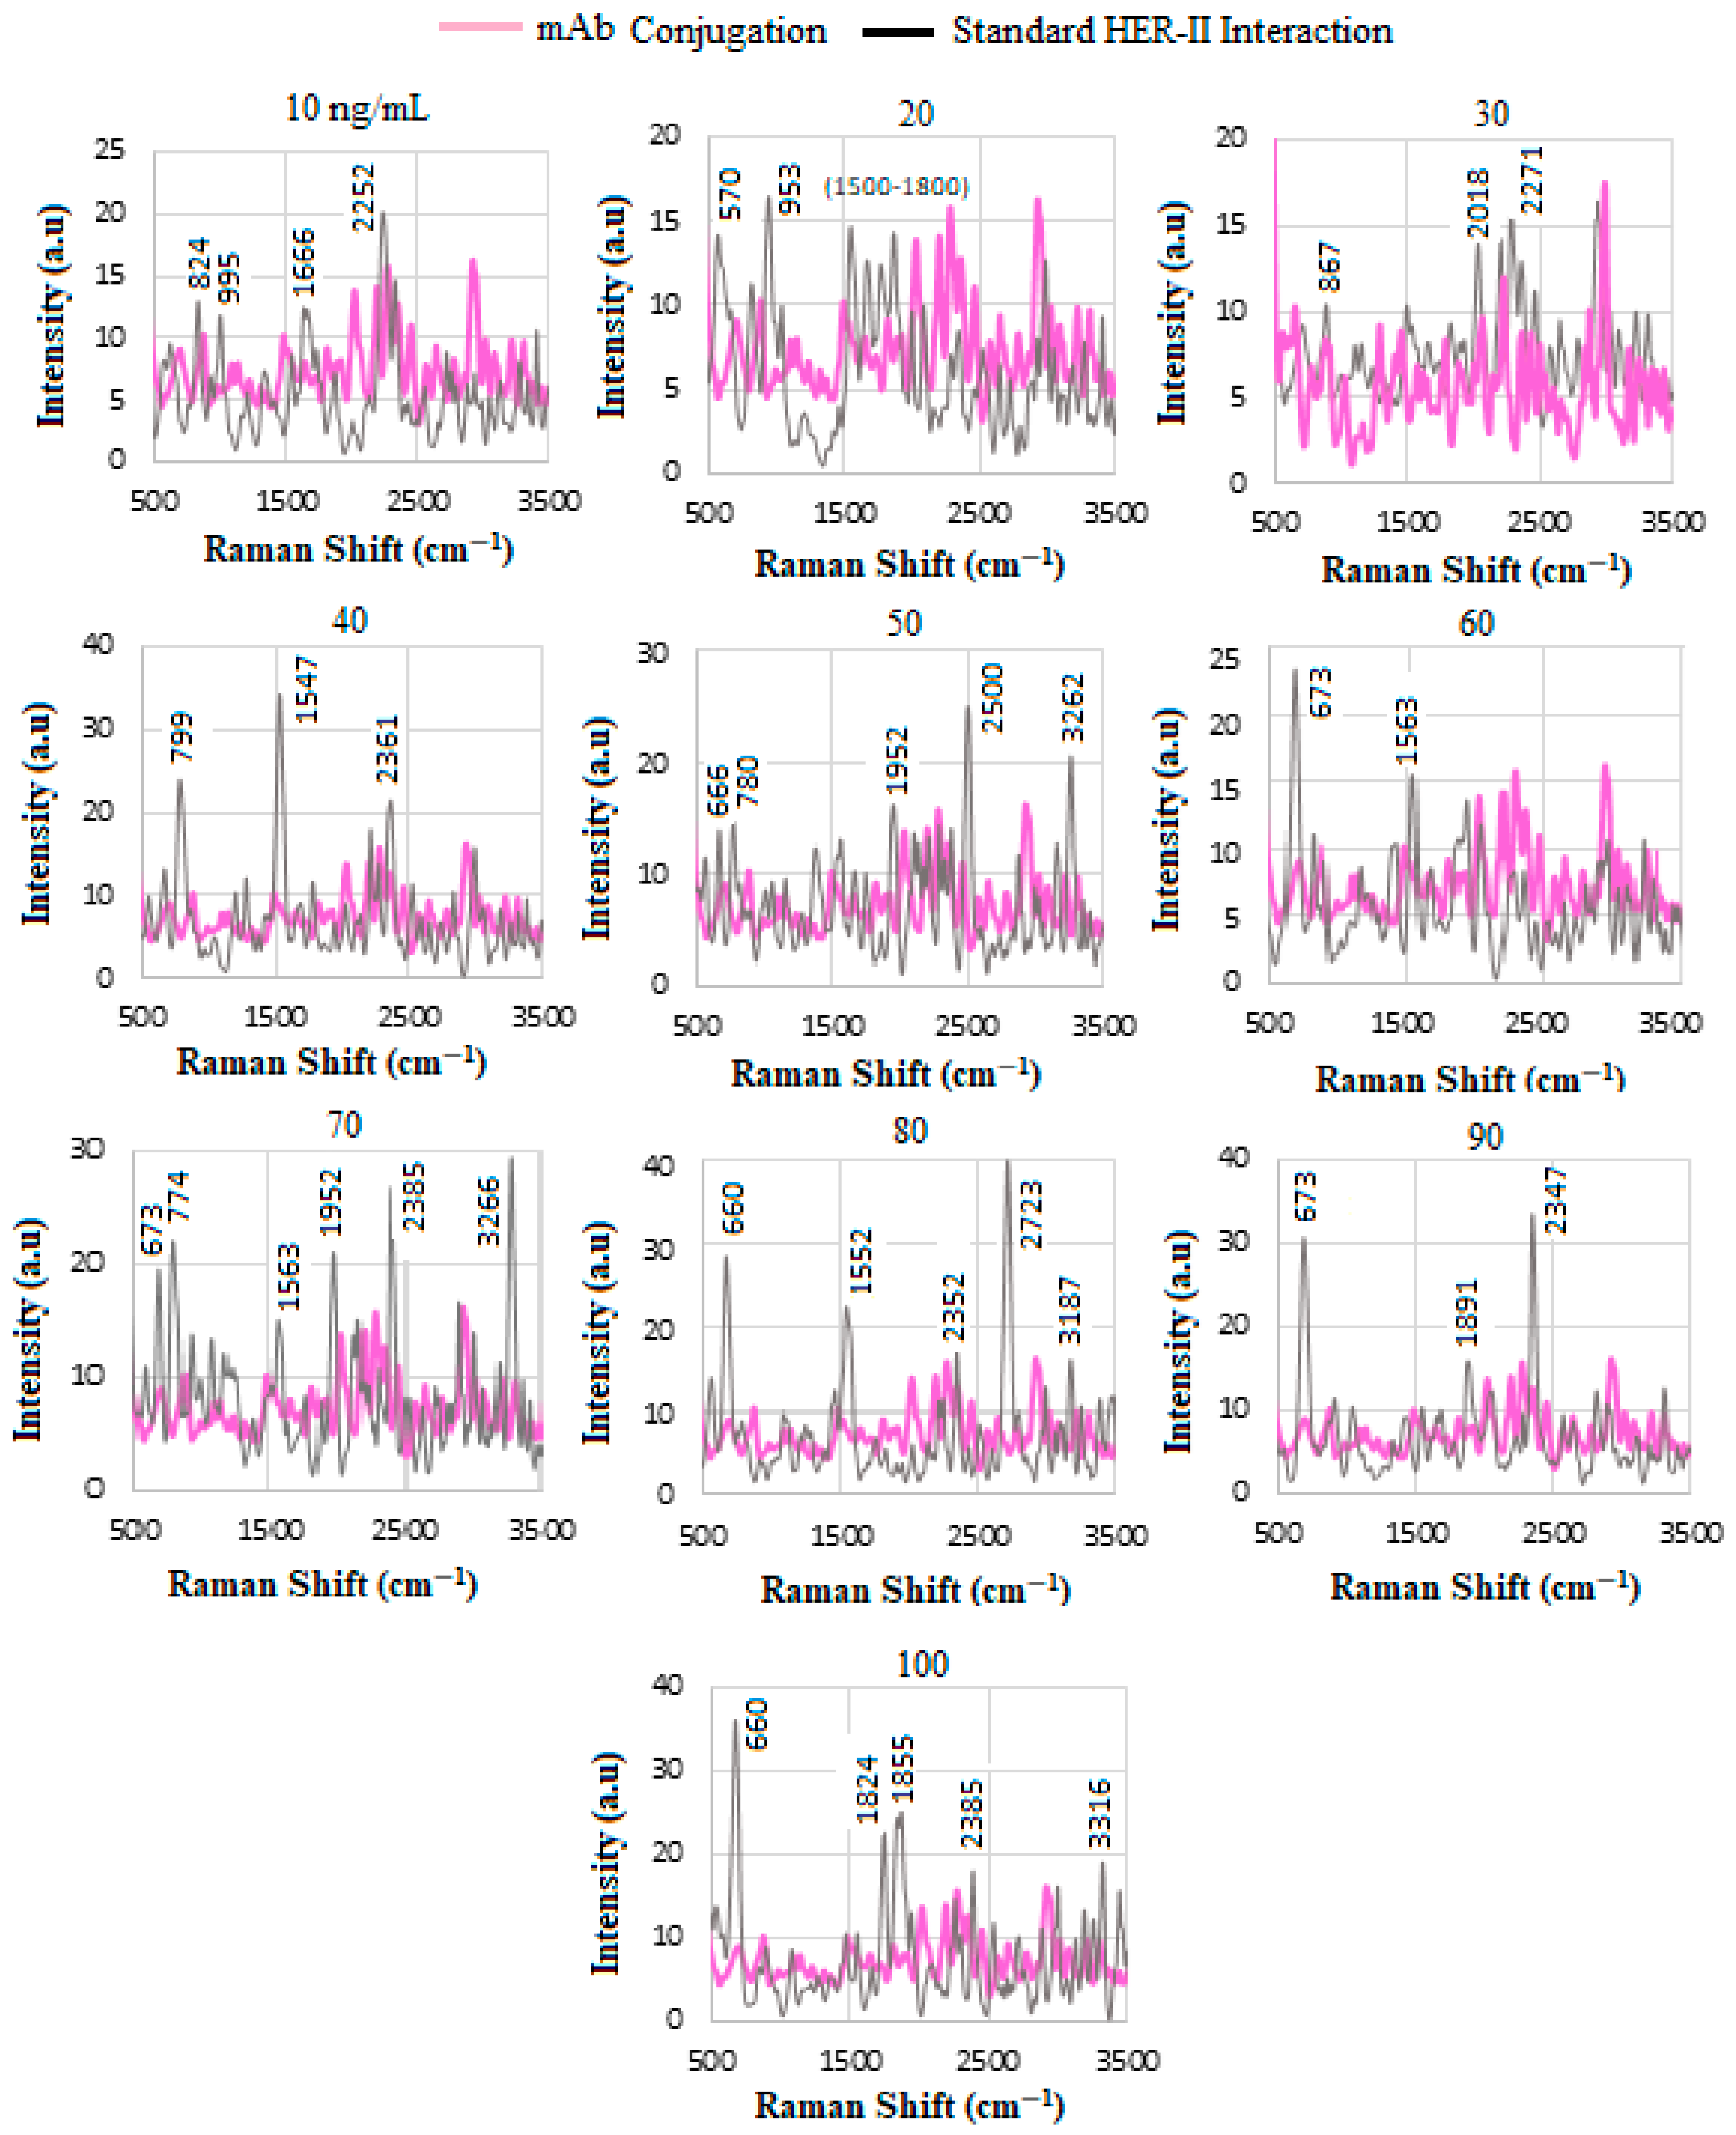
4.4. SERS of Conjugation and Interaction of Standard HER-II Solution
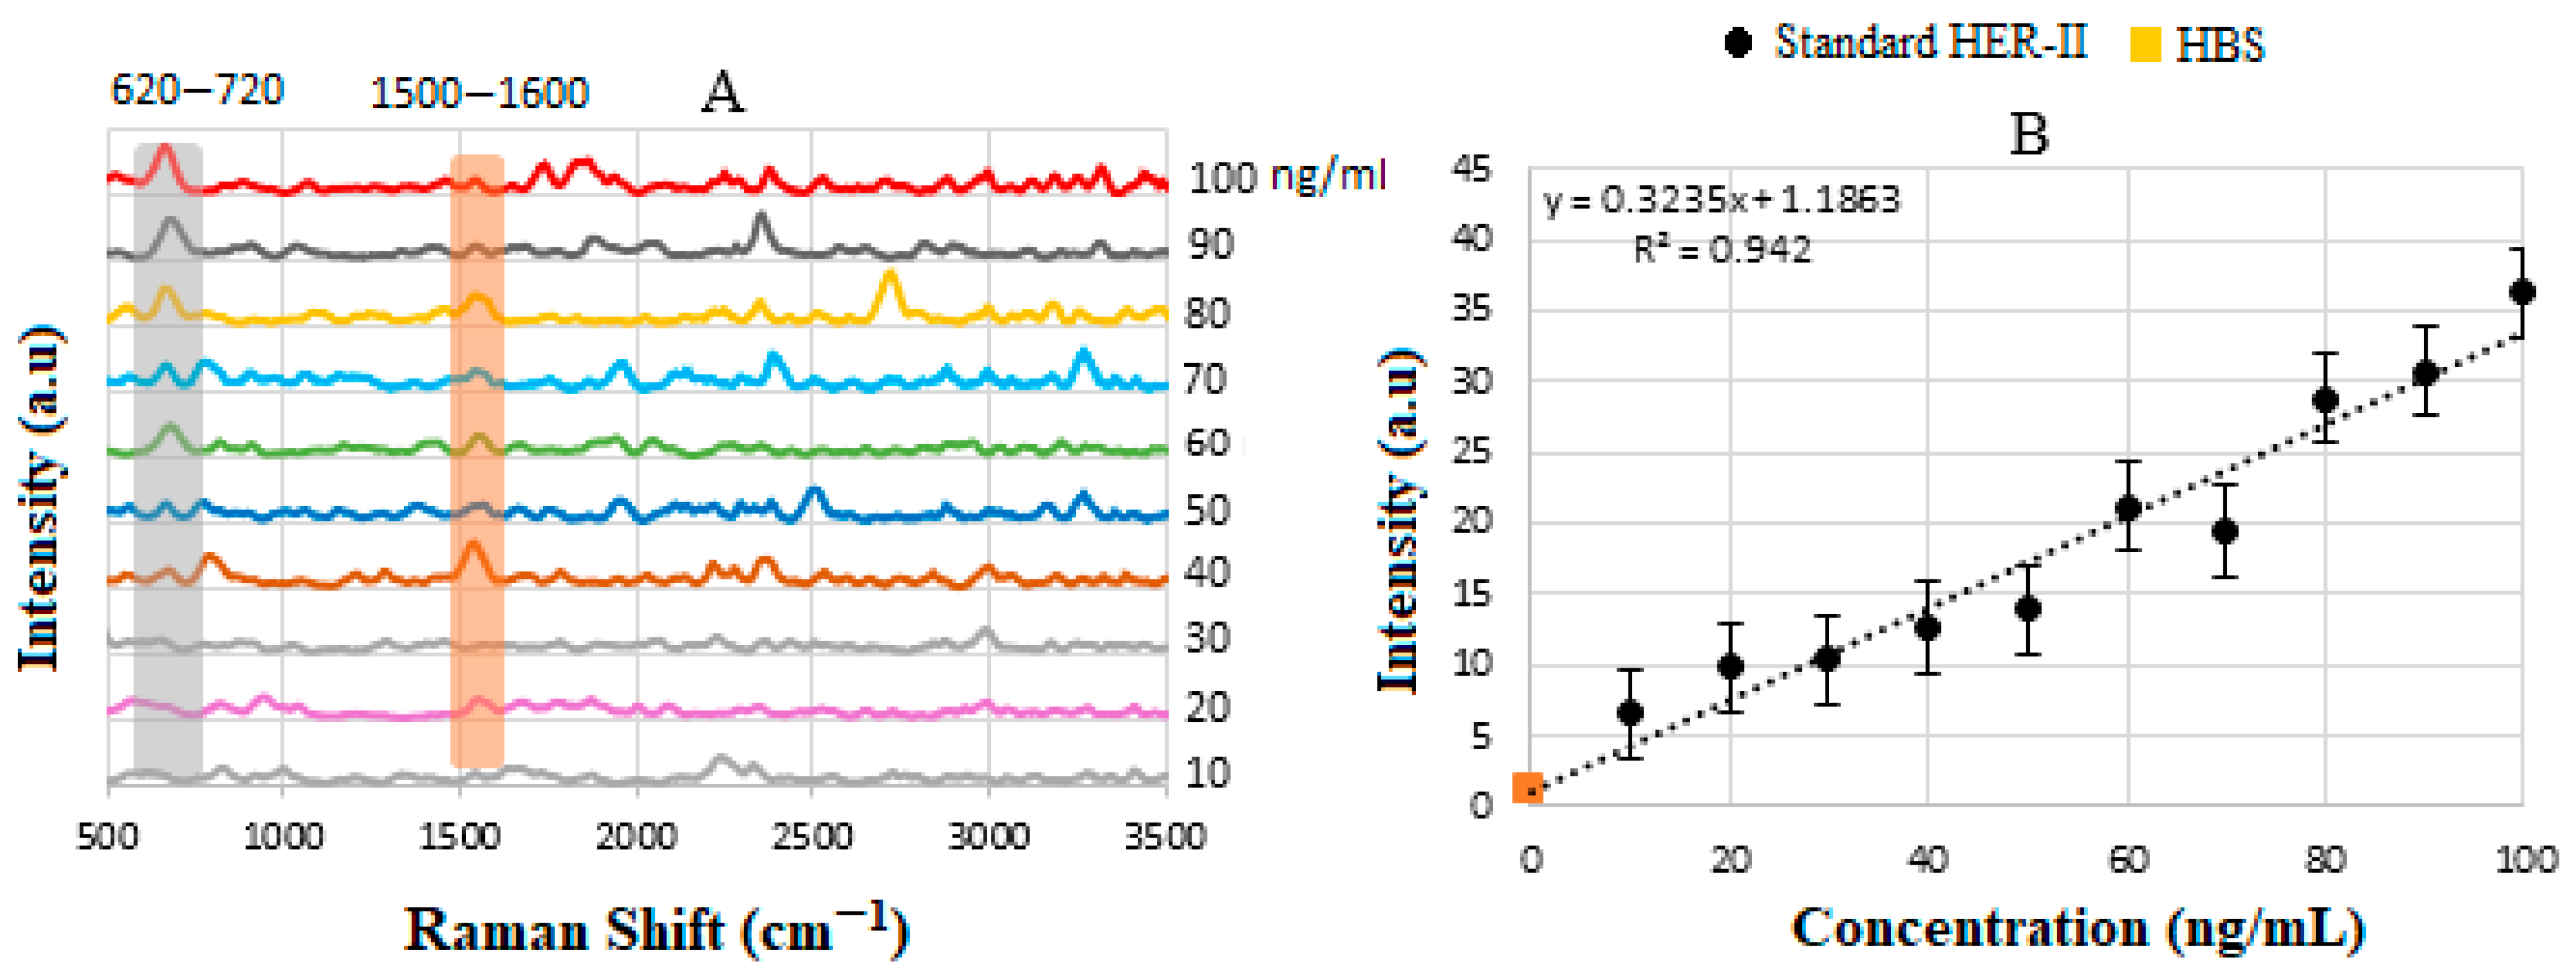
4.5. Calibration Curve of Standard HER-II Solution
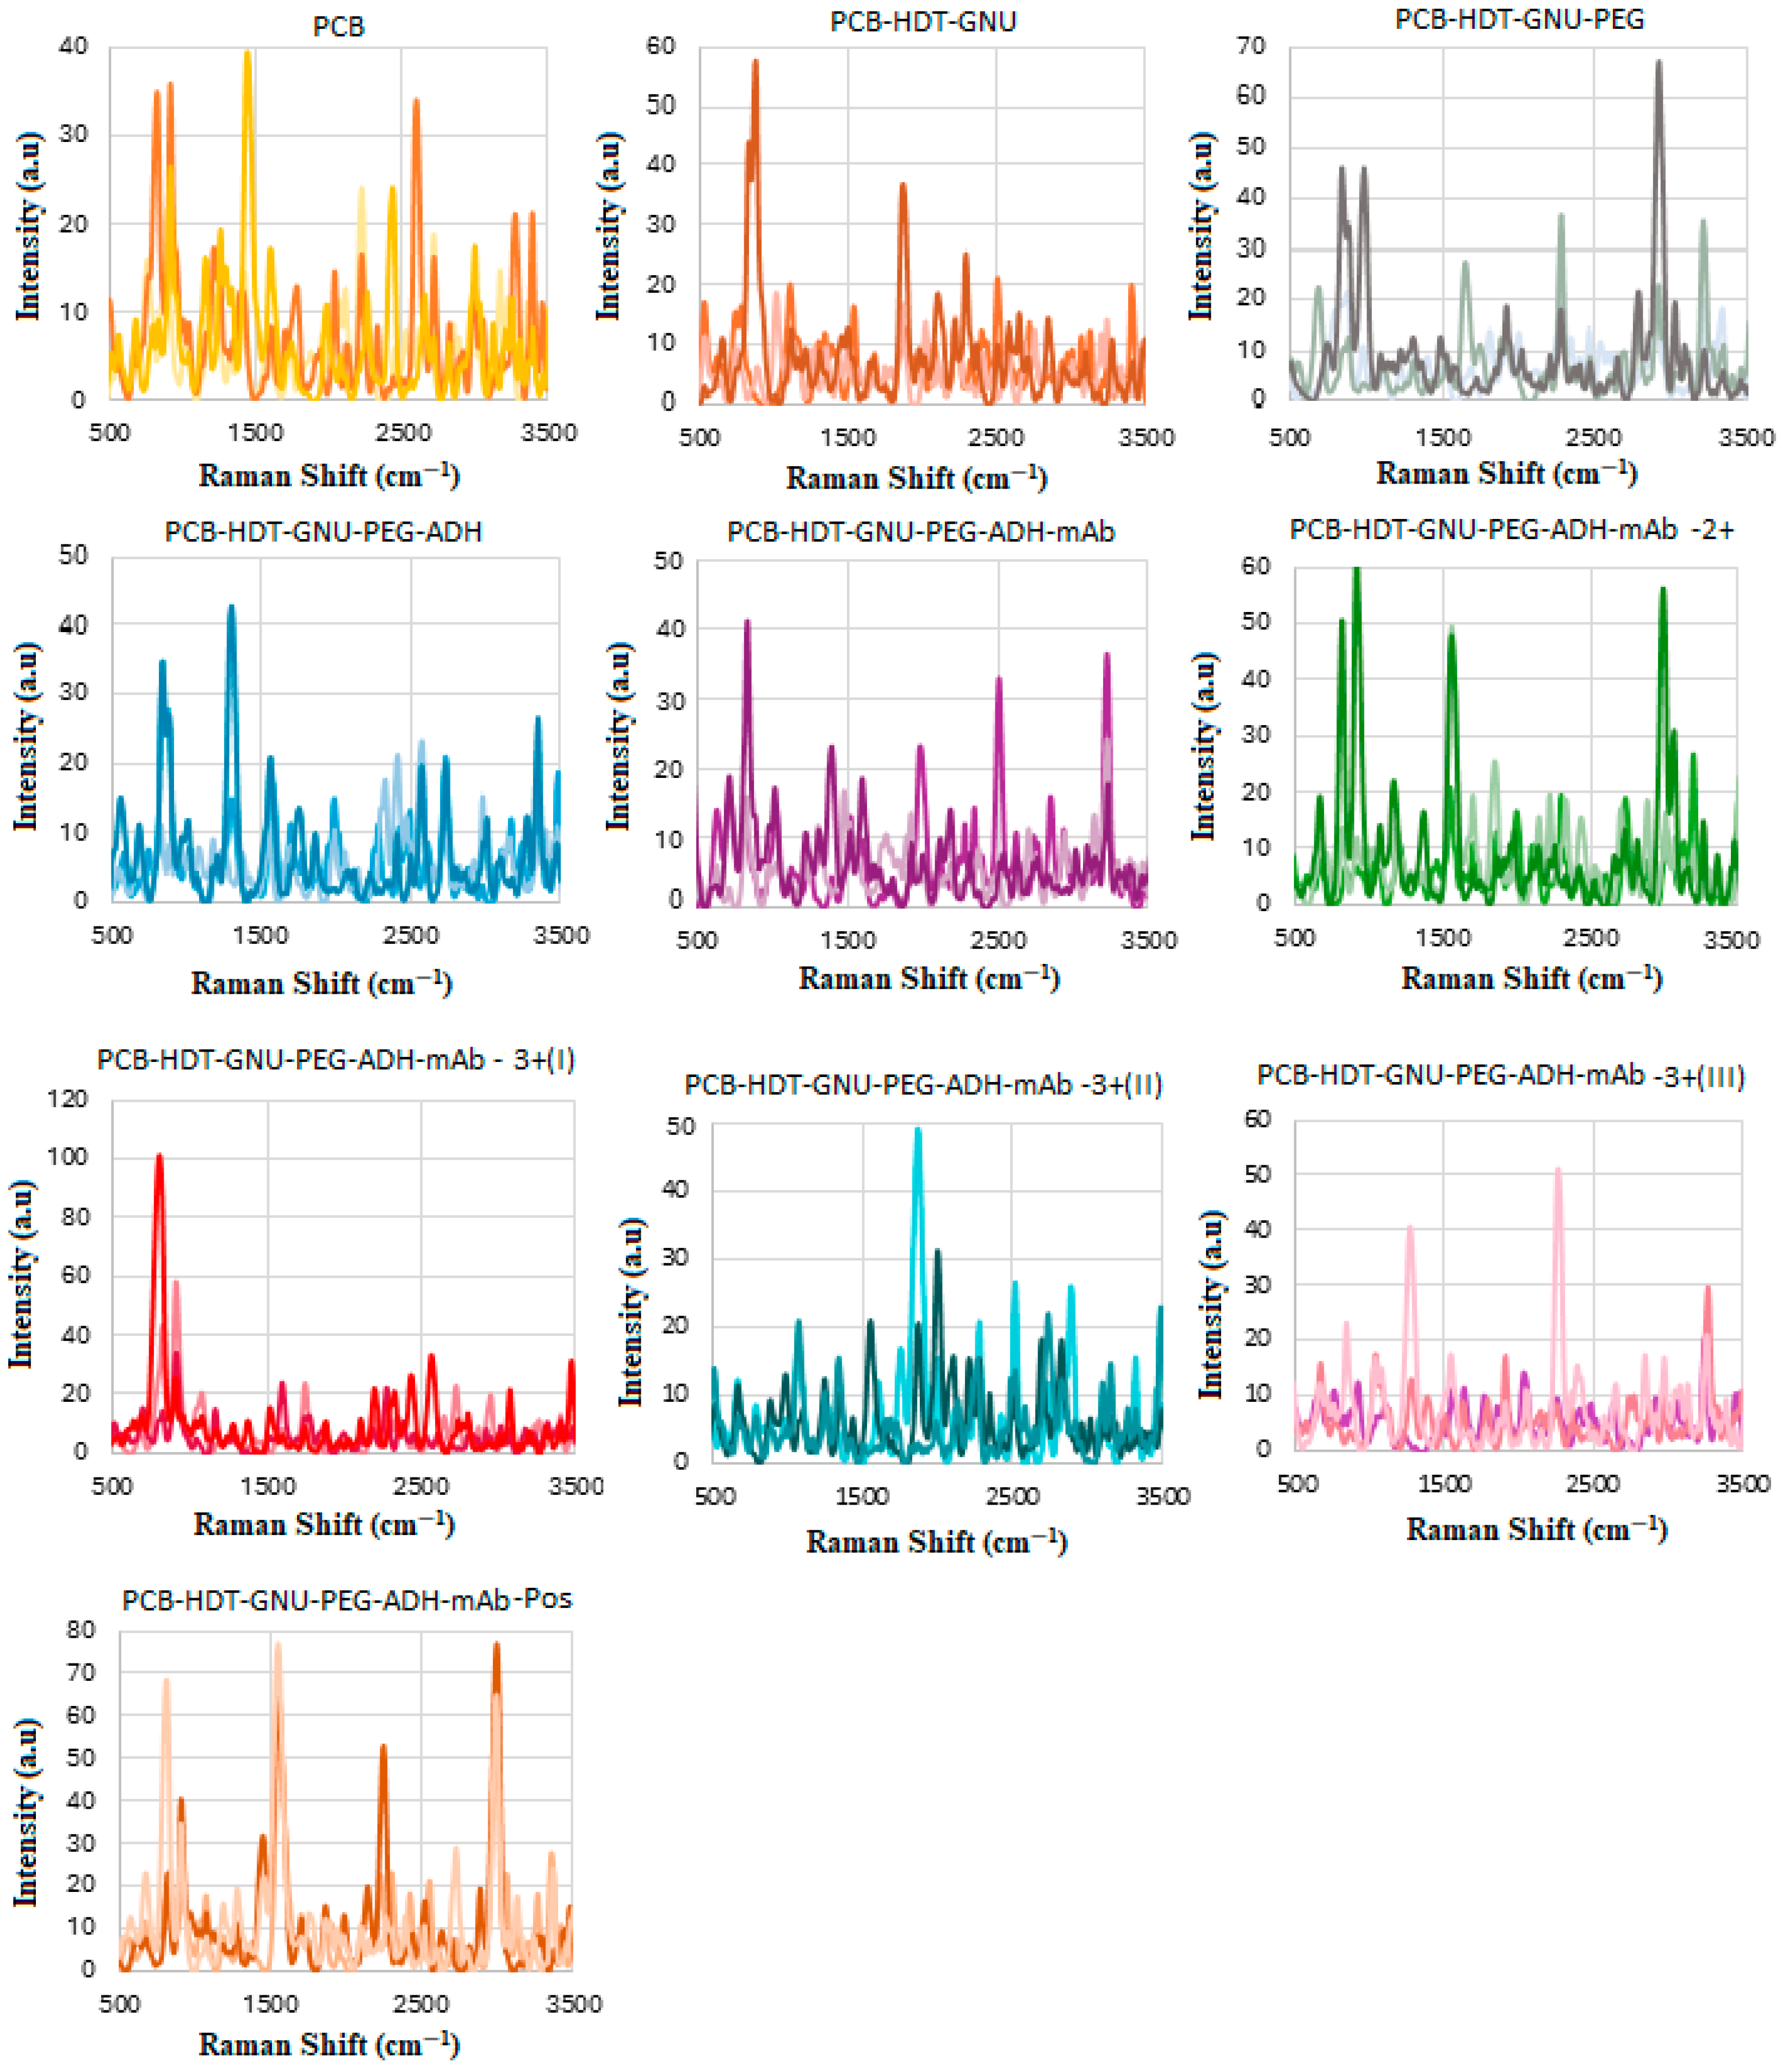
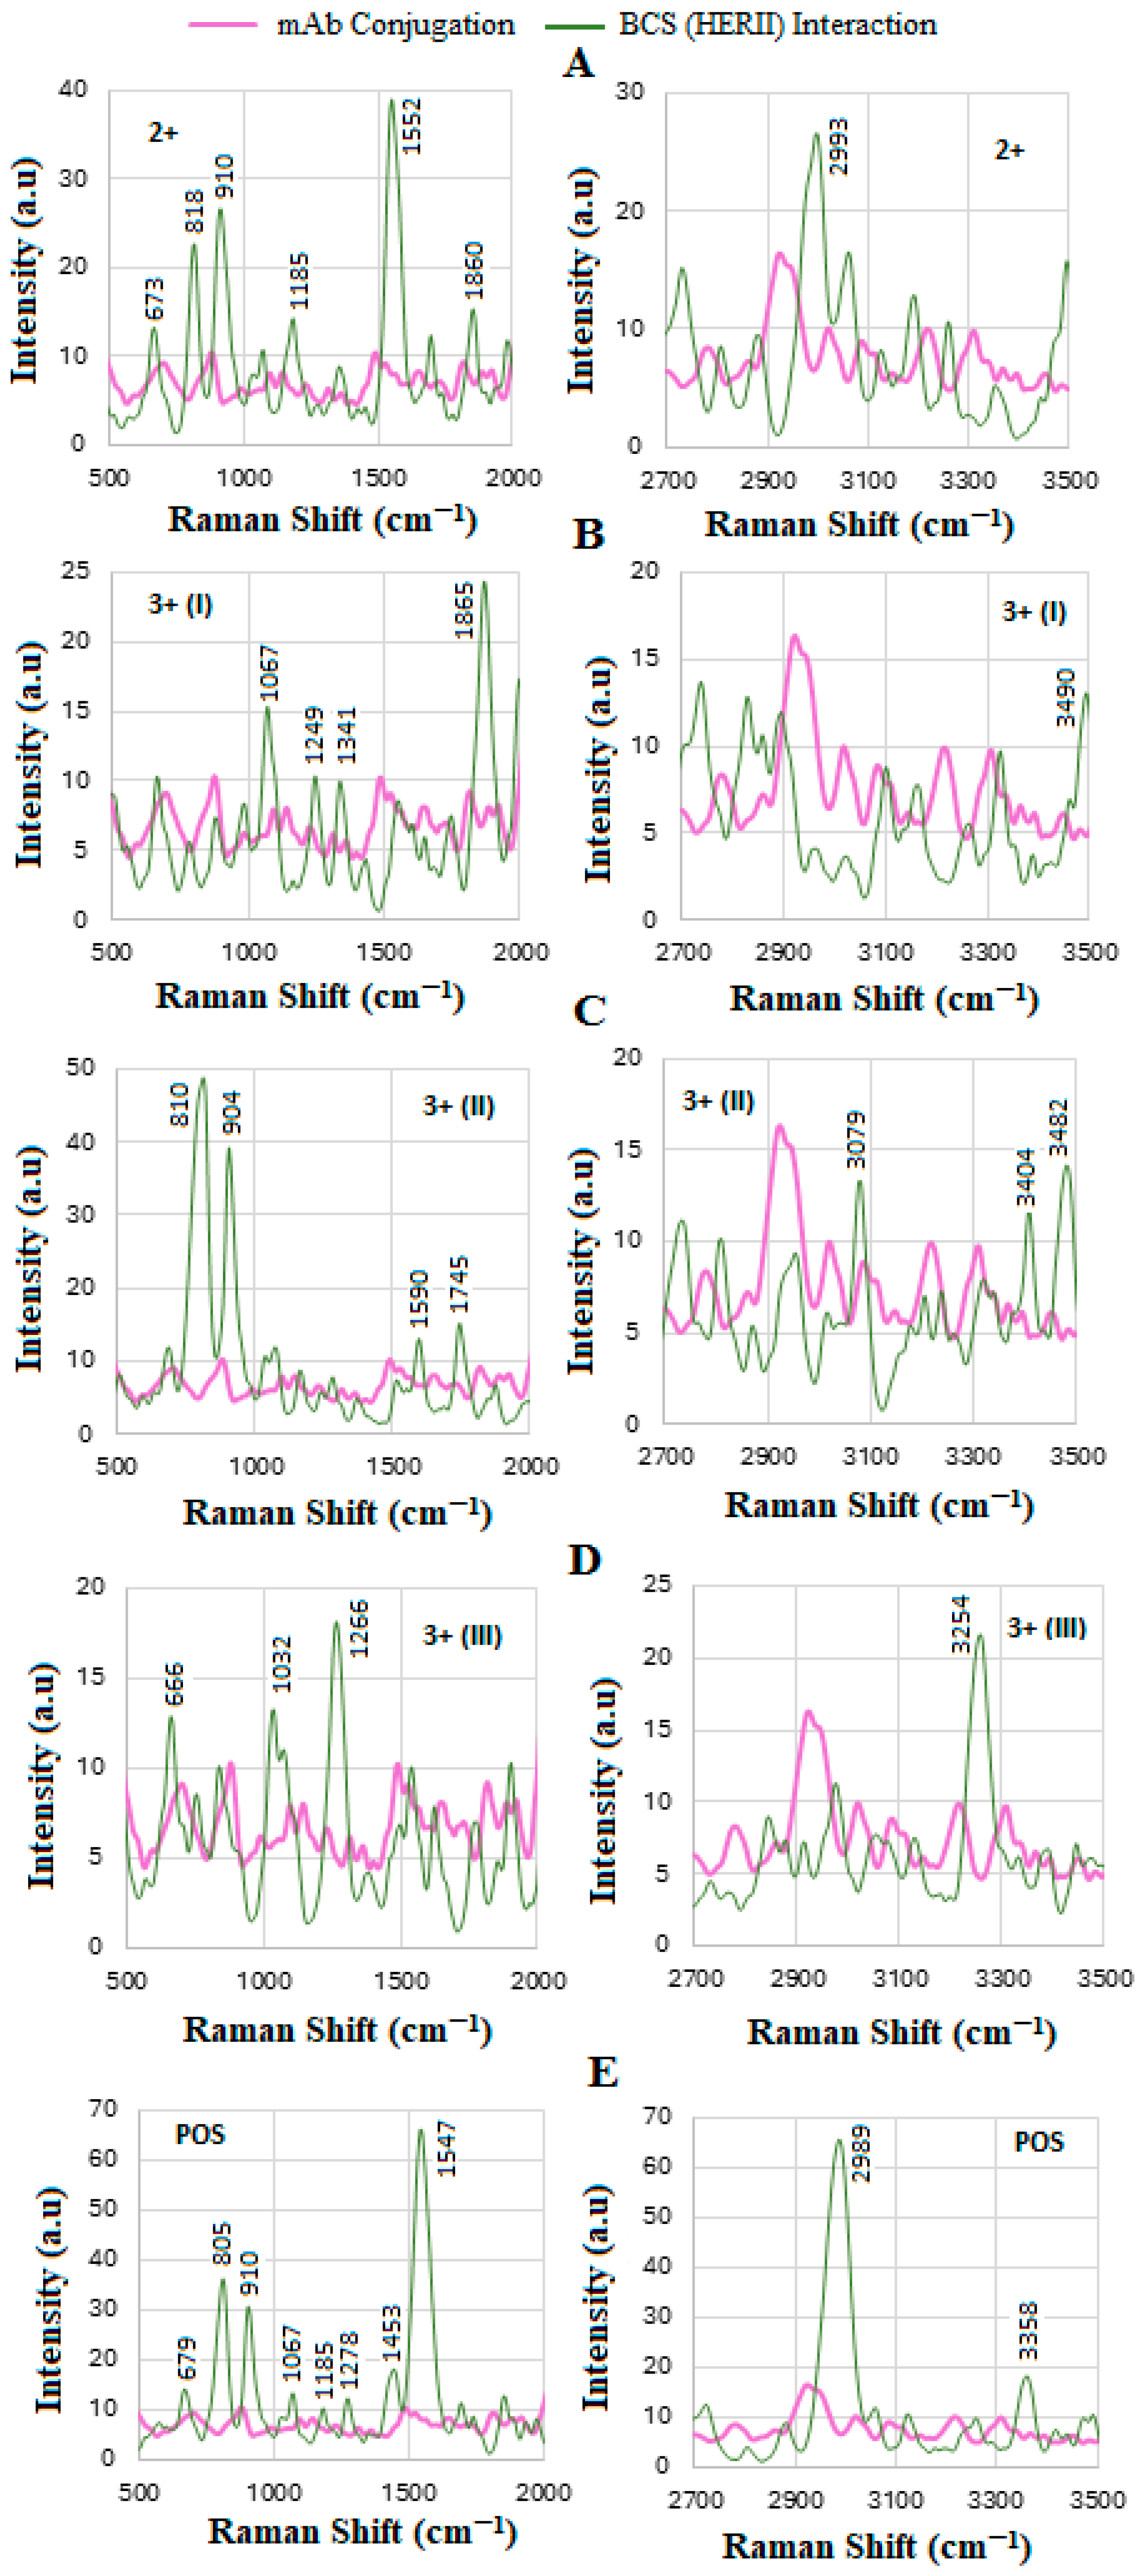
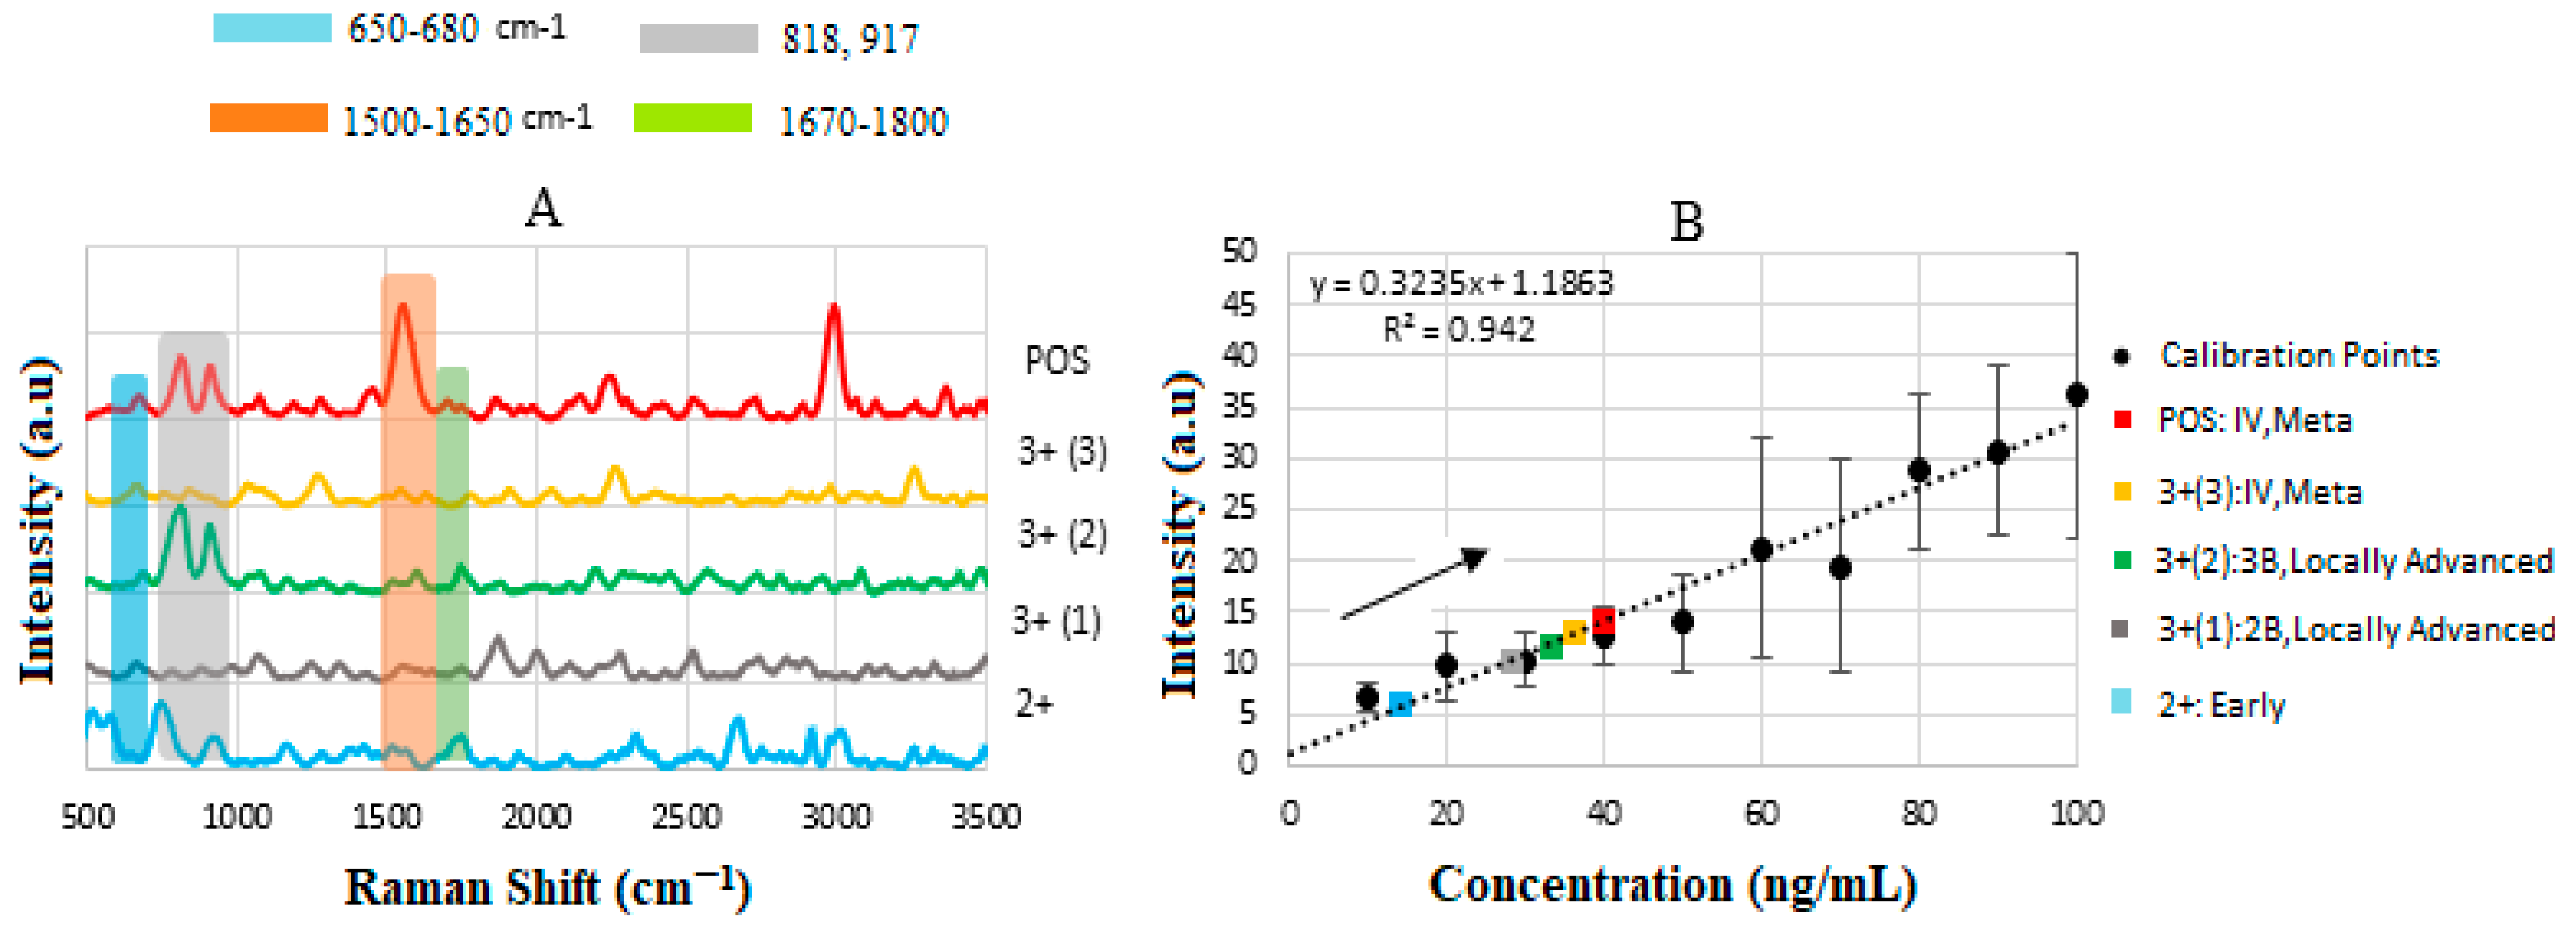
4.6. SERS of Conjugation and Interaction of BCS HER-II Samples
4.7. Calibration Curve of BCS HER-II Samples
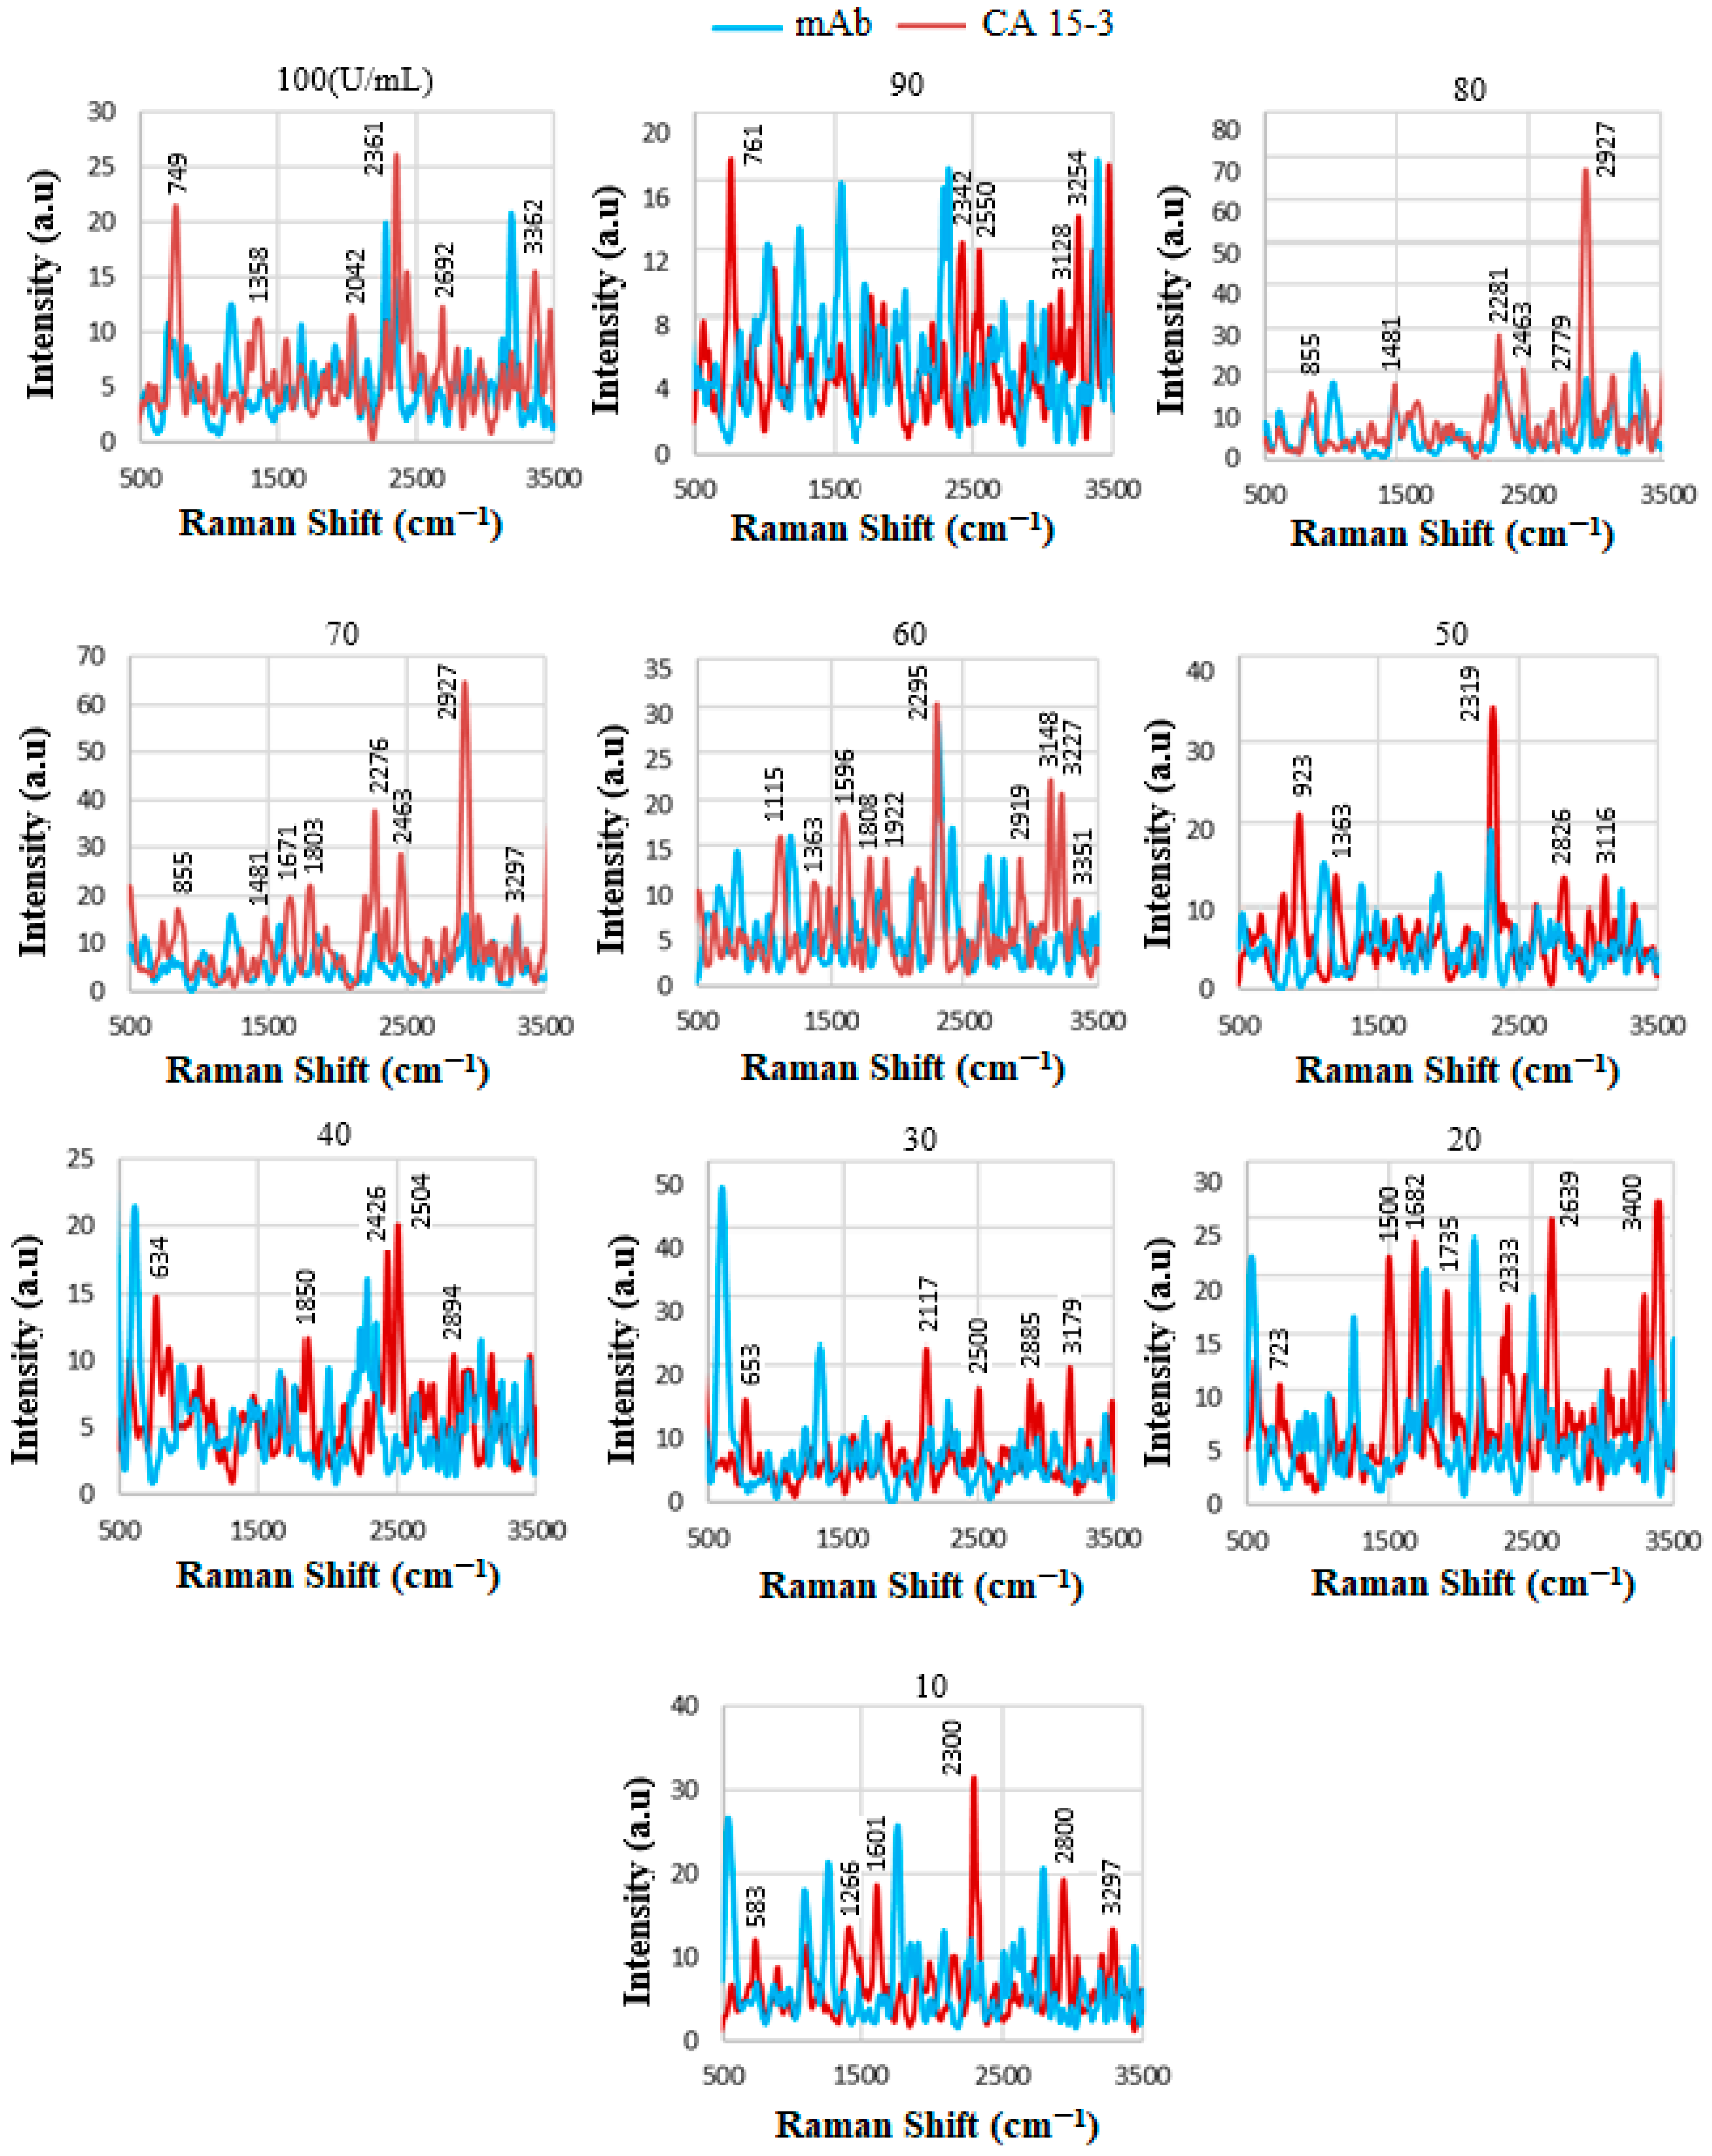
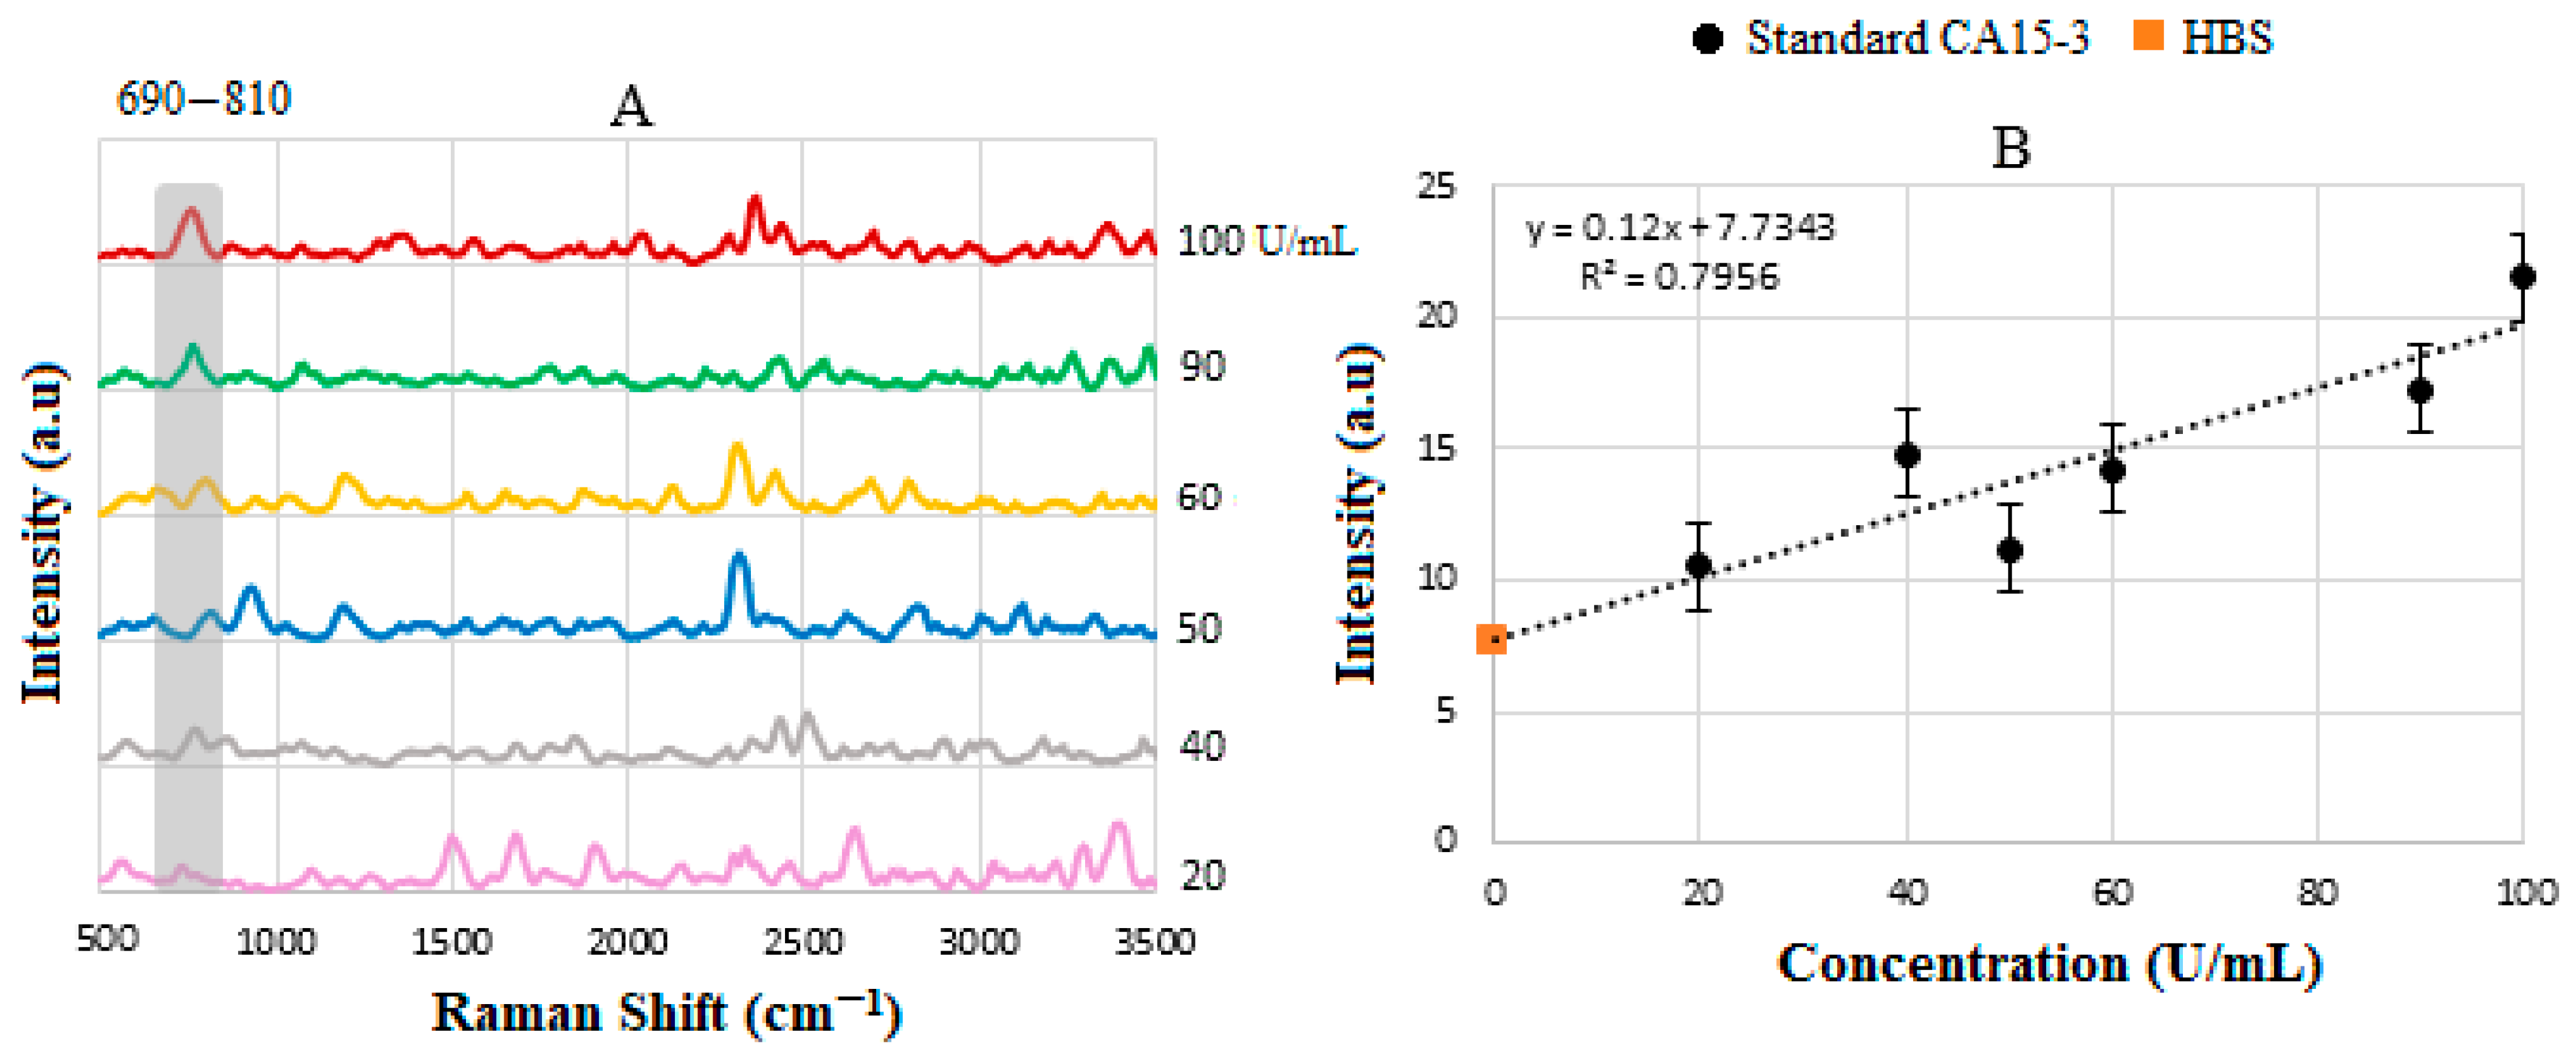
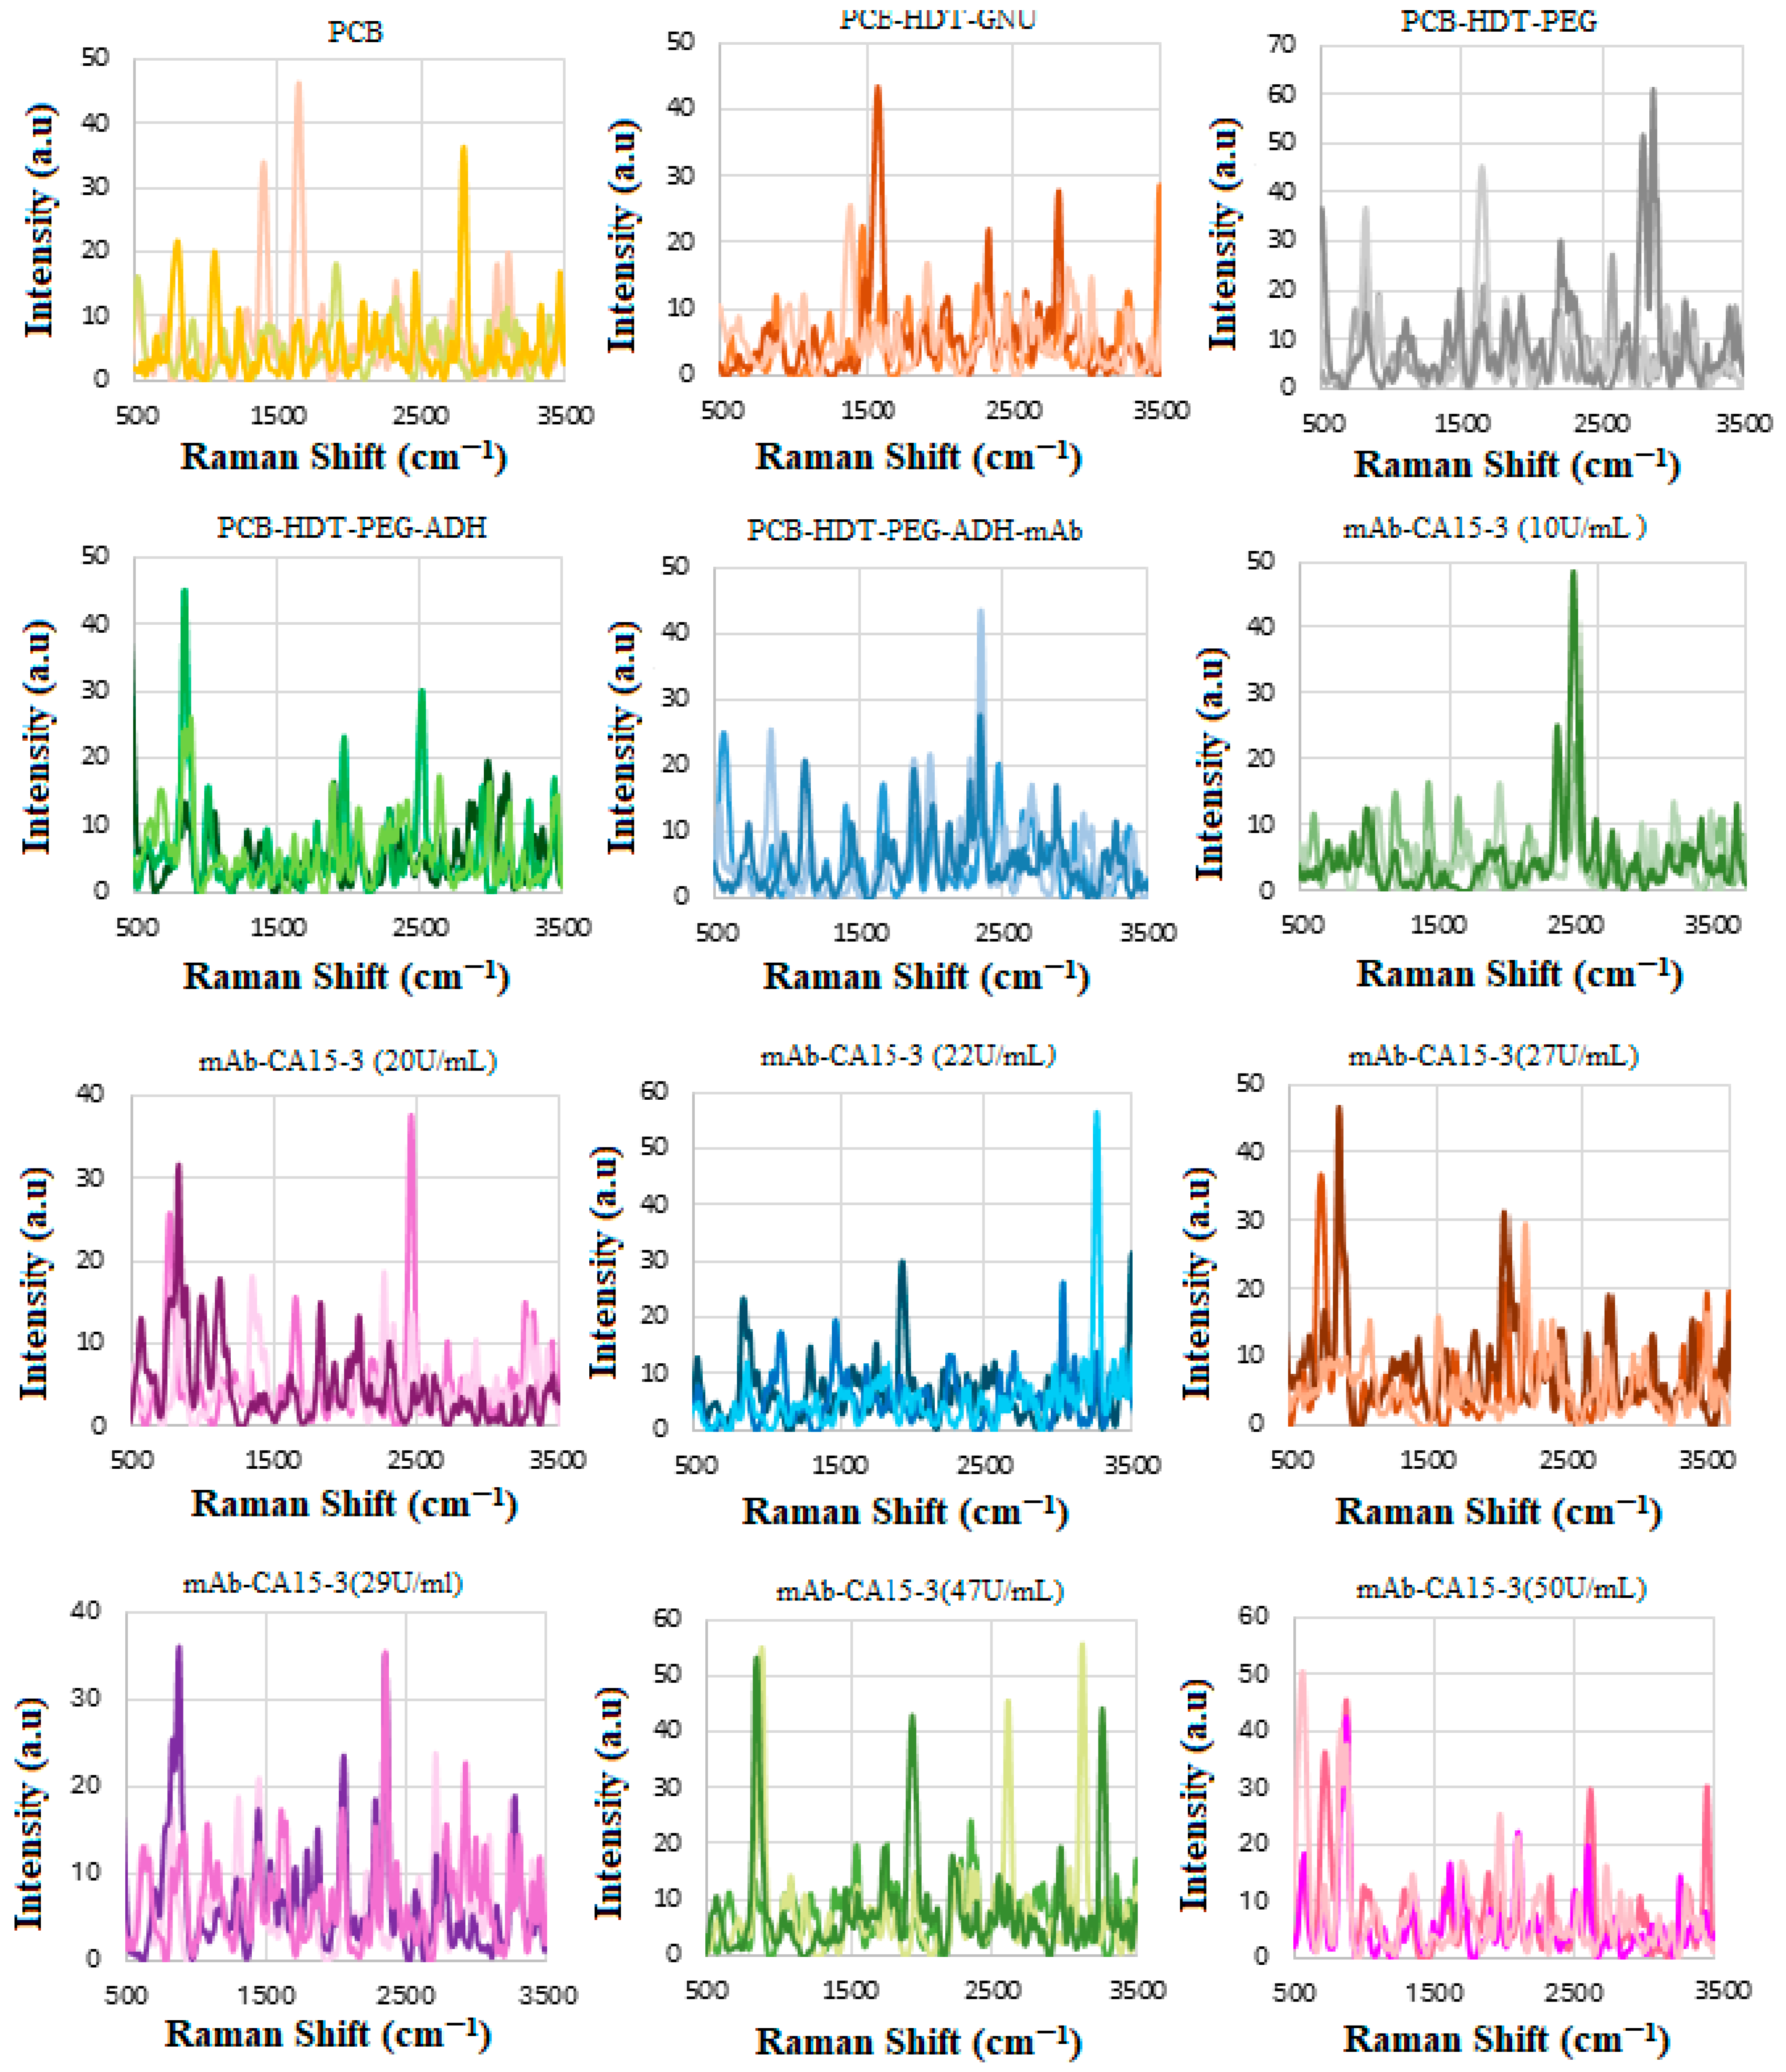
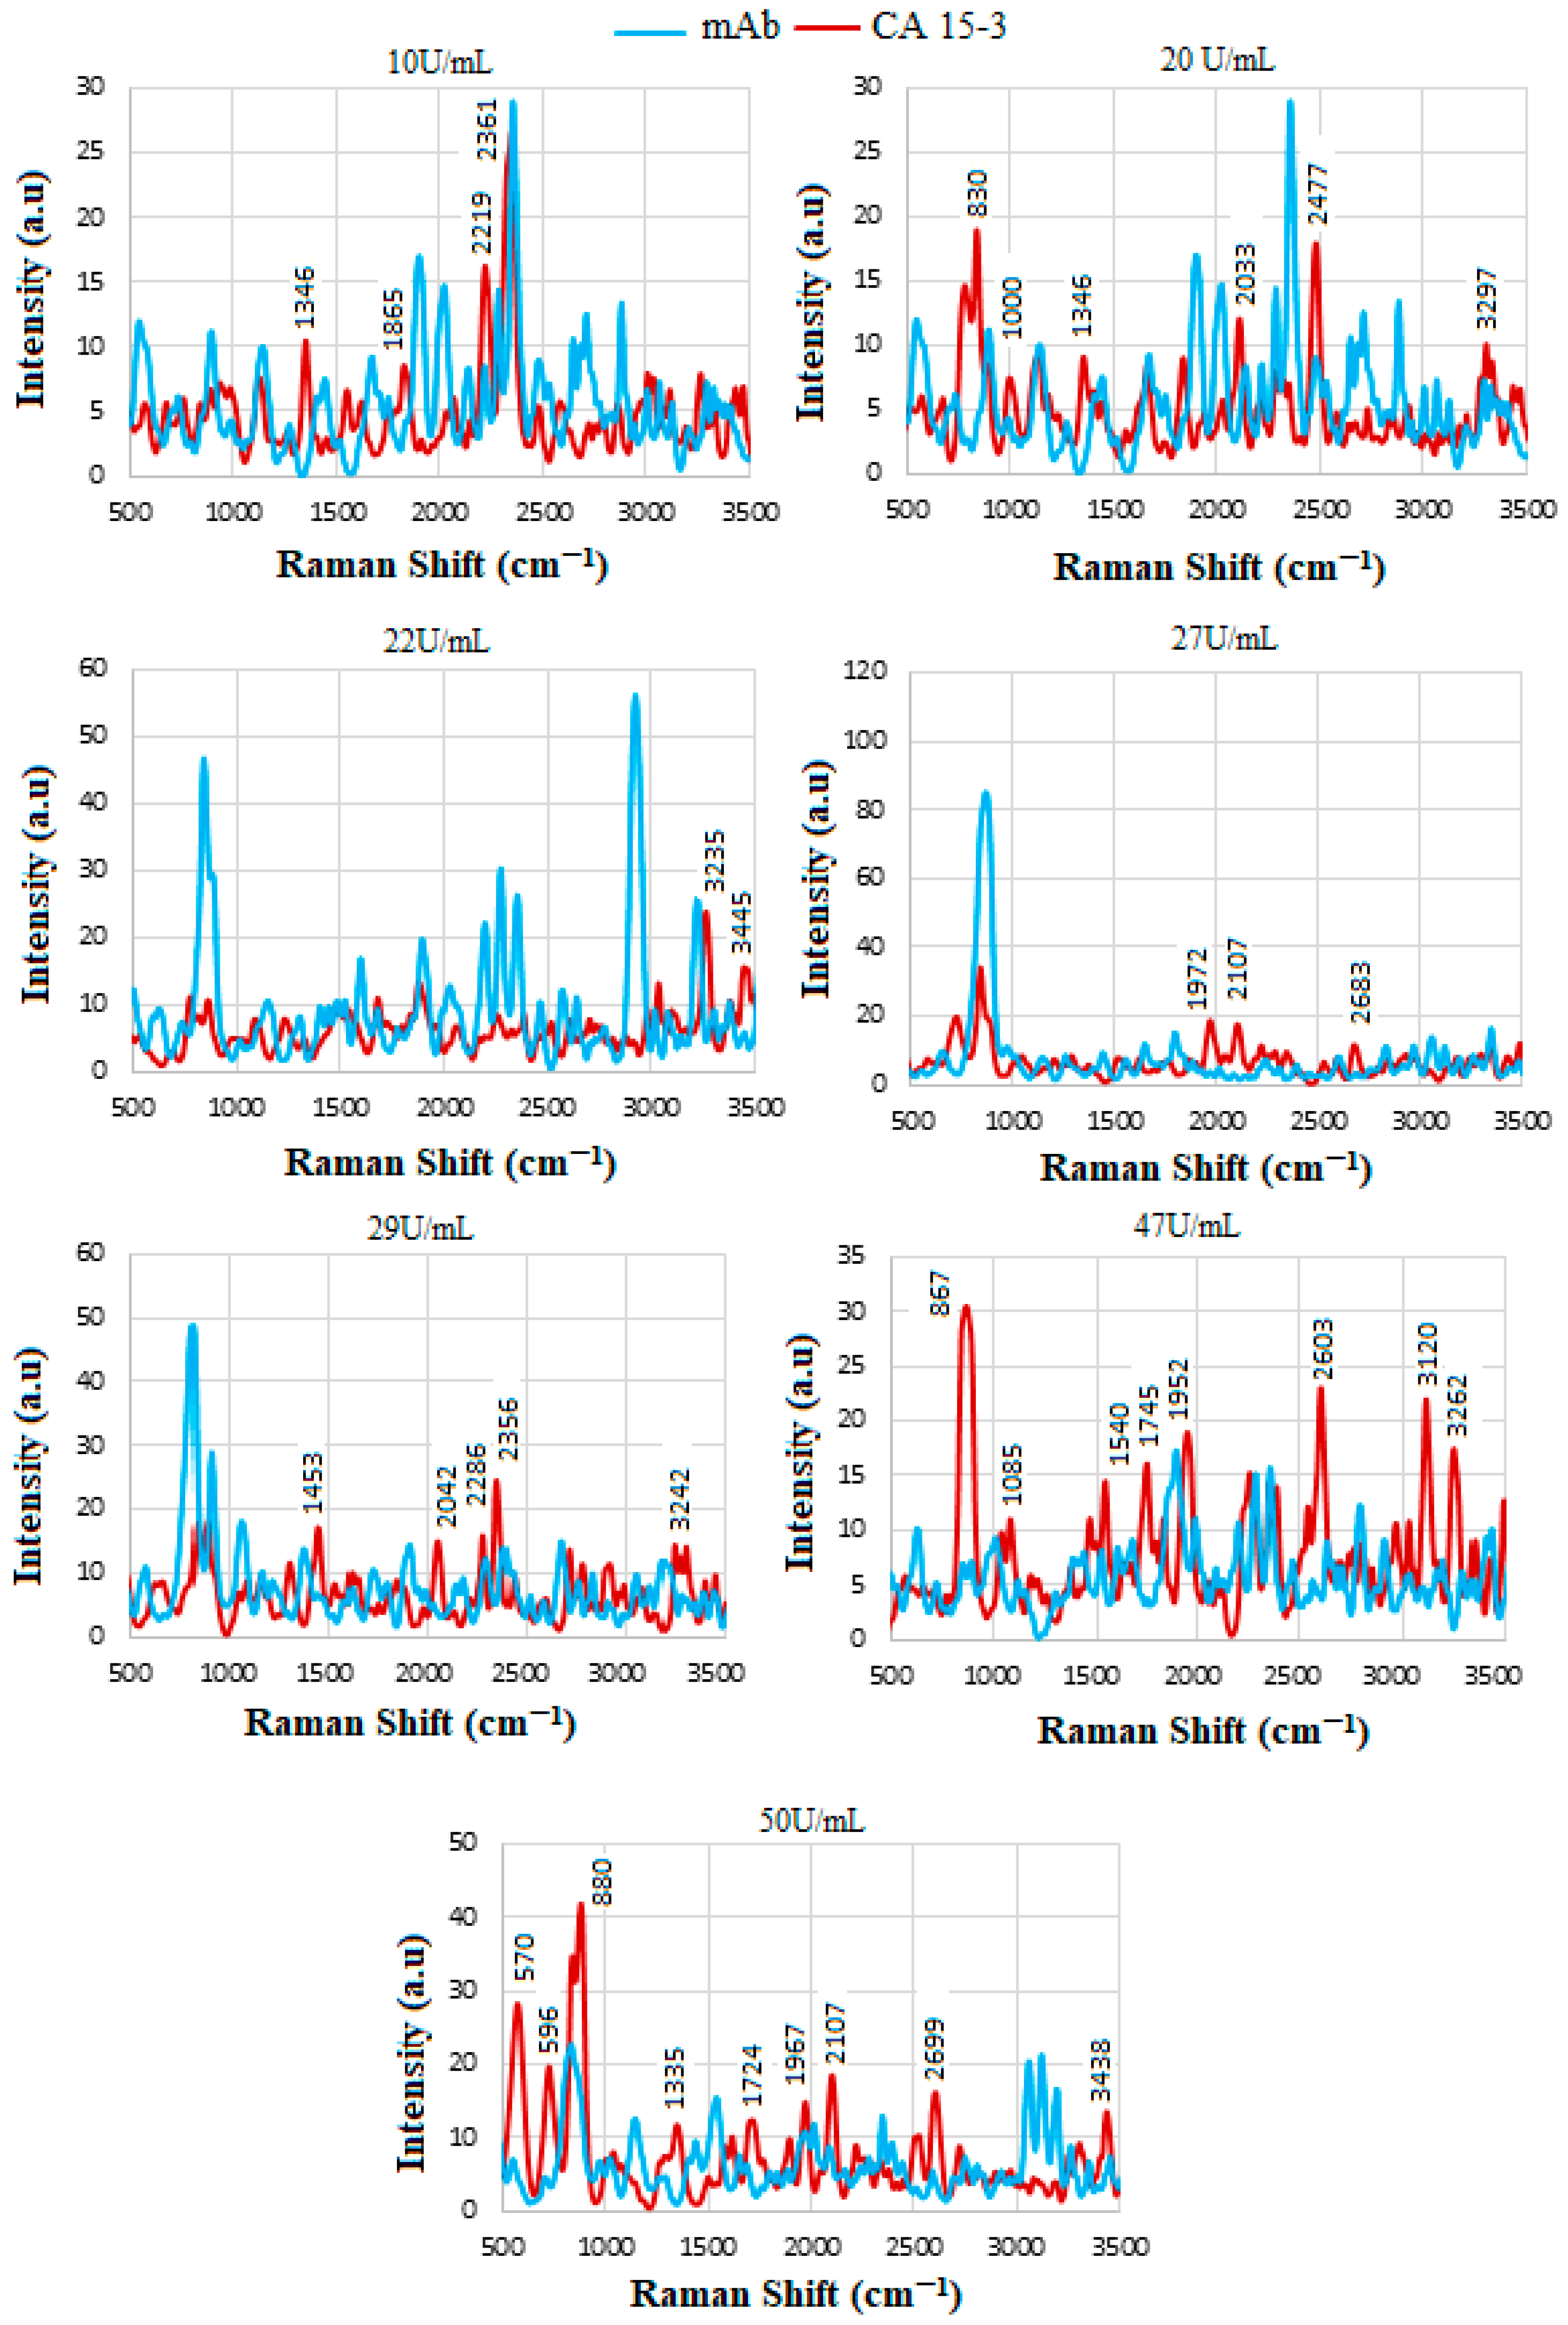
4.8. SERS of Conjugation and Interaction of Standard CA15-3 Solution
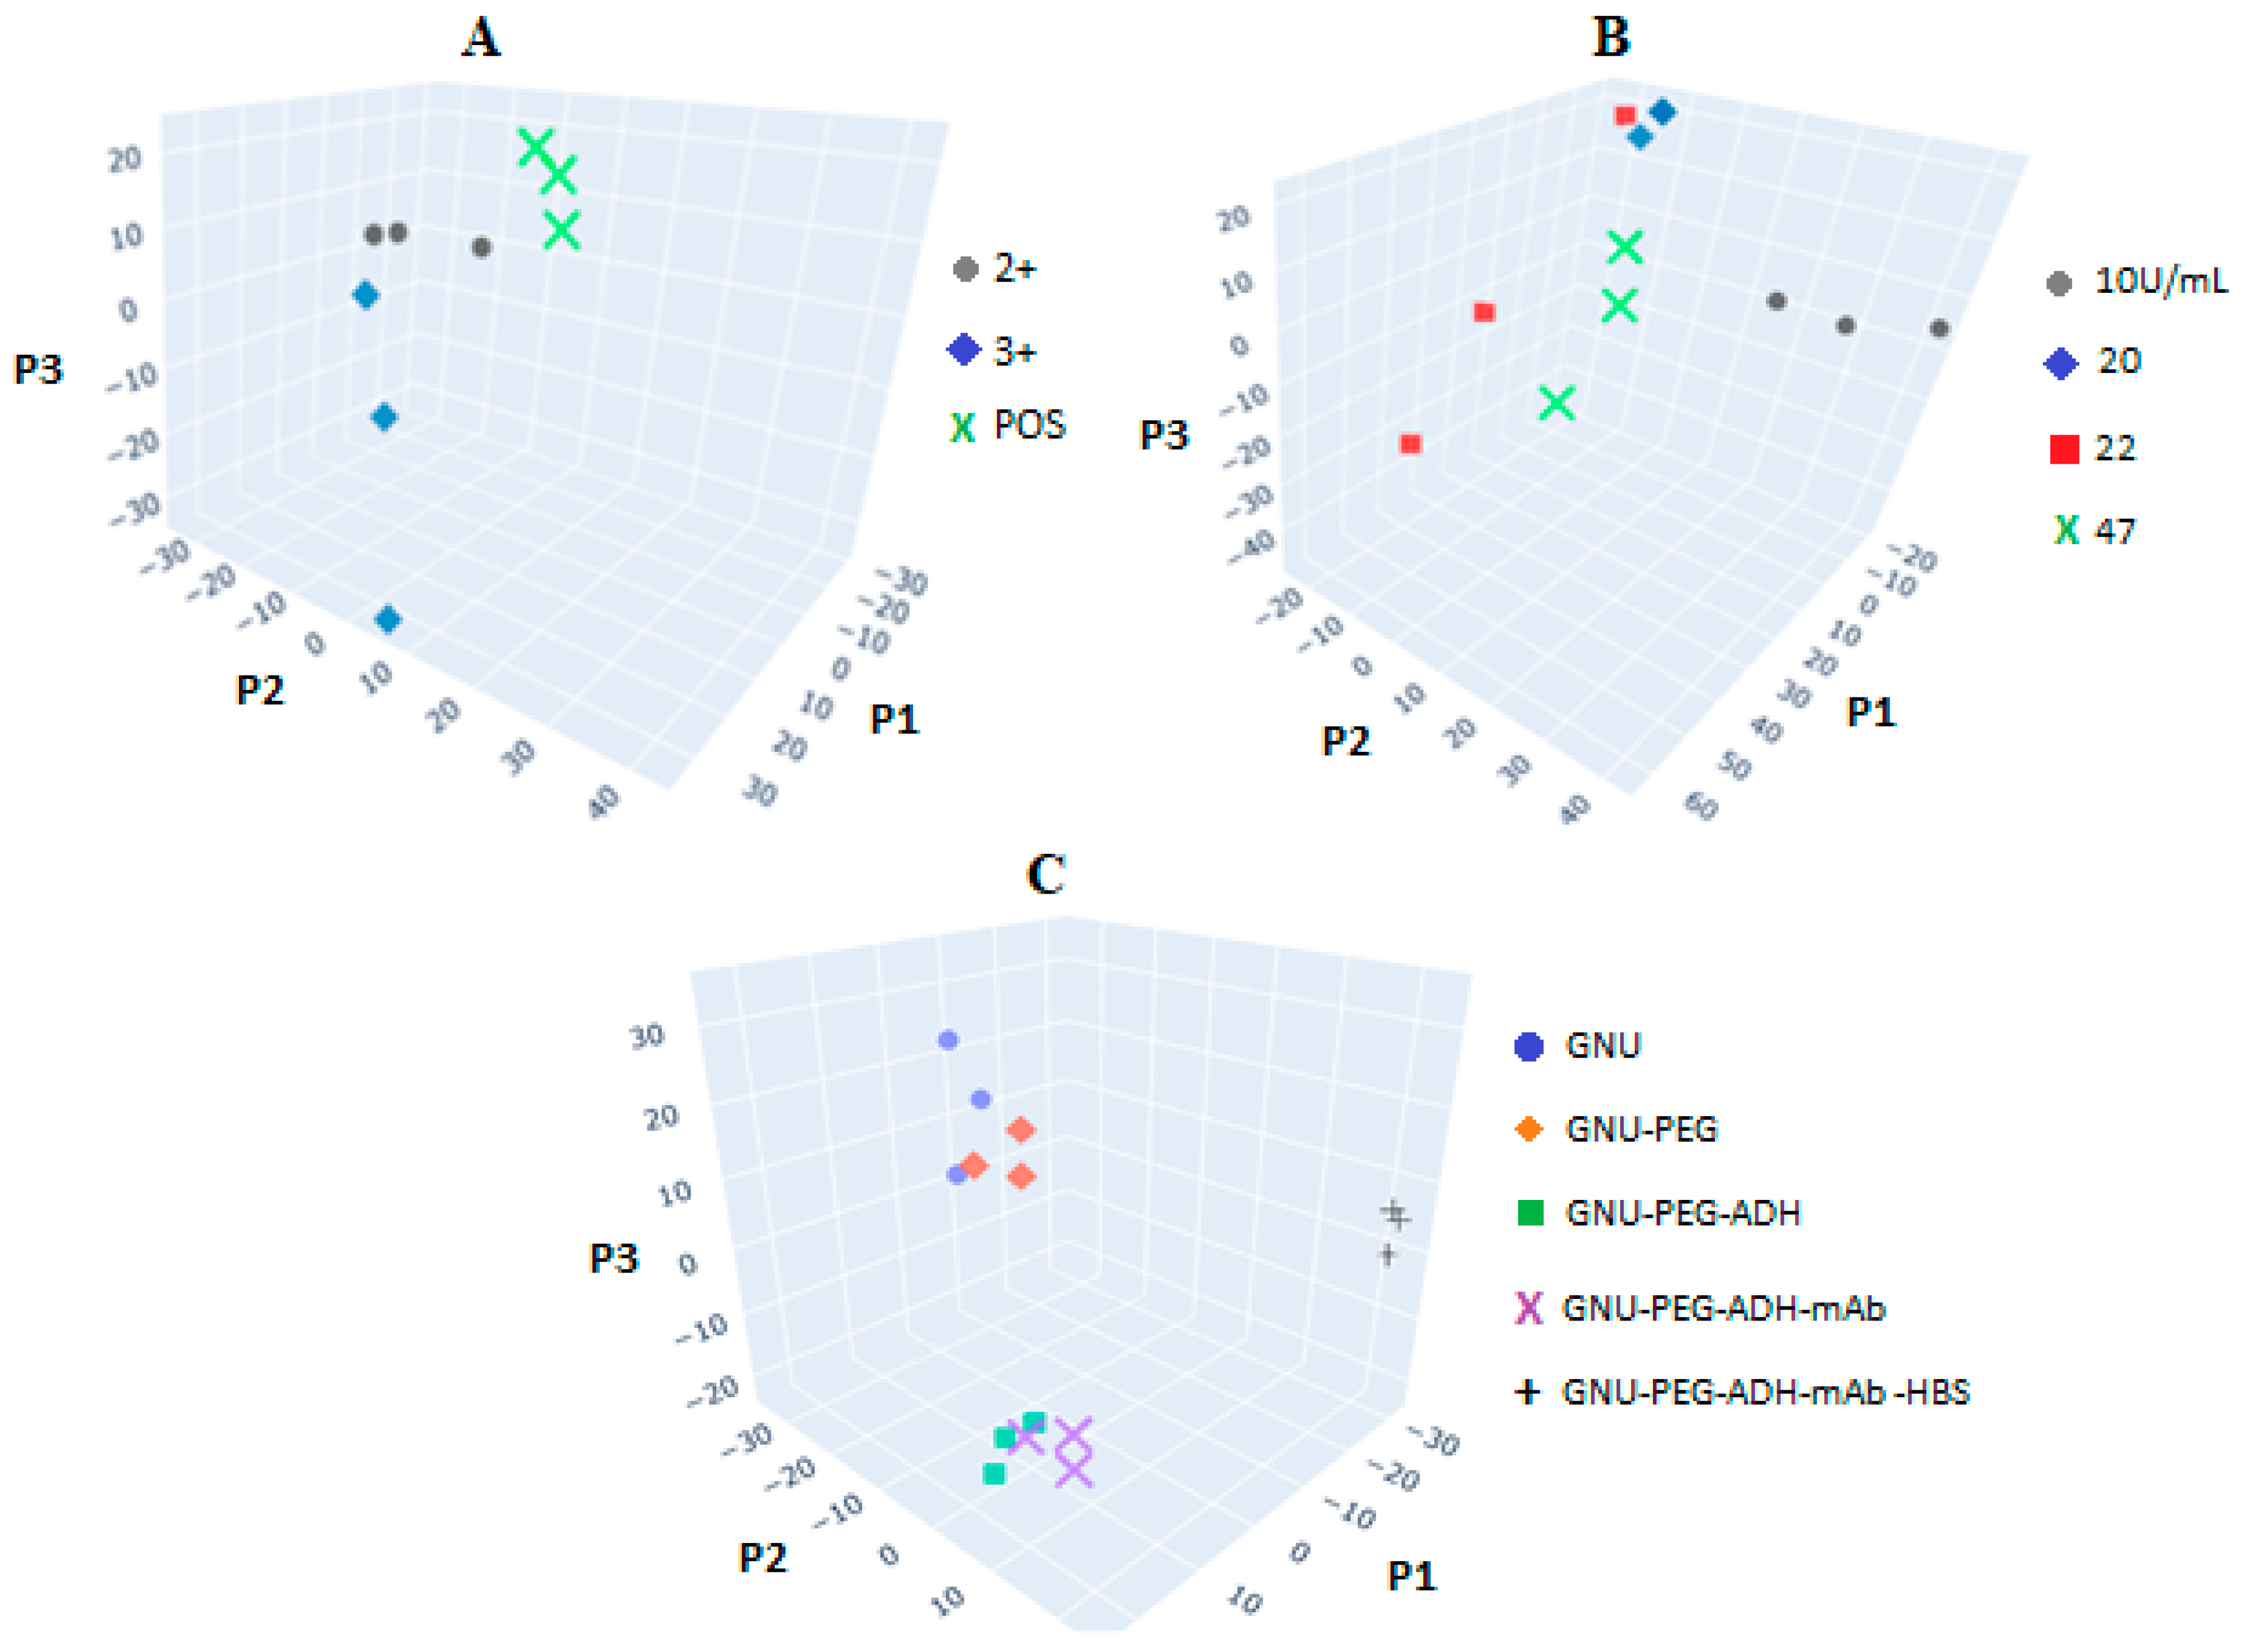
5. Statistical Analysis
6. Conclusions
Author Contributions
Funding
Data Availability Statement
Conflicts of Interest
References
- Loeb, K.R.; Loeb, L.A. Significance of multiple mutations in cancer. Carcinogenesis 2000, 21, 379–385. [Google Scholar] [CrossRef] [PubMed]
- Siegel, R.L.; Jamel, A.; Wander, R.C. An assessment of progress in cancer control. CA Cancer J. Clin. 2018, 6, 329–339. [Google Scholar] [CrossRef] [PubMed]
- Fan, L.; Strasser-Weippl, K.; Li, J.; St Louis, J.; Finkelstein, D.; Chen, W.; Shao, Z. Breast cancer in China. Lancet Oncol. 2014, 15, e279–e289. [Google Scholar] [CrossRef] [PubMed]
- Momenimovahed, Z.; Salehiniya, H. Epidemiological characteristics of and risk factors for Breast cancer in the world. Breast Cancer 2019, 11, 151–164. [Google Scholar] [CrossRef]
- Zhang, P.; Xiao, J.; Ruan, Y.; Zhang, Z.; Zhang, X. Monitoring value of serum HER2 as a predictive biomarker in patients with metastatic breast cancer. Cancer Manag. Res. 2020, 12, 4667–4675. [Google Scholar] [CrossRef]
- Shaath, H.; Elango, R.; Alajez, N.M. Molecular classification of breast cancer utilizing long non-coding RNA (lncRNA) tran-scriptomes identifies novel diagnostic lncRNA panel for triple-negative breast cancer. Cancers 2021, 13, 5350. [Google Scholar] [CrossRef]
- Lipscomb, J. Estimating the cost of cancer care in the United States: A work very much in progress. J. Natl. Cancer Inst. 2008, 100, 607–610. [Google Scholar] [CrossRef]
- Kazarian, A.; Blyss, O.; Metodieva, G.; Gentry-Maharaj, A.; Ryan, A.; Kiseleva, E.M.; Prytomanova, O.M.; Jacobs, I.J.; Widschwendter, M.; Menon, U.; et al. Testing breast cancer serum biomarkers for early detection and prognosis in pre-diagnosis samples. Br. J. Cancer 2017, 116, 501–508. [Google Scholar] [CrossRef]
- Manuali, E.; De Giuseppe, A.; Feliziani, F.; Forti, K.; Casciari, C.; Marchesi, M.C.; Pacifico, E.; Pawłowski, K.M.; Majchrzak, K.; Król, M. CA 15–3 cell lines and tissue expression in canine mammary cancer and the correlation between serum levels and tumour histological grade. BMC Vet. Res. 2012, 8, 86. [Google Scholar] [CrossRef]
- Zhu, H.; Dale, P.S.; Caldwell, C.W.; Fan, X. Rapid and label-free detection of breast cancer biomarker CA15-3 in clinical human serum samples with optofluidic ring resonator sensors. Anal. Chem. 2009, 81, 9858–9865. [Google Scholar] [CrossRef]
- Handy, B. The clinical utility of tumor markers. Lab. Med. 2009, 40, 99–103. [Google Scholar] [CrossRef]
- Fan, X.; White, I.M.; Shopova, S.I.; Zhu, H.; Suter, J.D.; Sun, Y. Sensitive optical biosensors for unlabeled targets: A review. Anal. Chim. Acta 2008, 620, 8–26. [Google Scholar] [CrossRef] [PubMed]
- Stone, N.; Prieto, M.C.H.; Crow, P.; Uff, J.; Ritchie, A.W. The use of Raman spectroscopy to provide an estimation of the gross biochemistry associated with urological pathologies. Anal. Bioanal. Chem. 2007, 387, 1657–1688. [Google Scholar] [CrossRef]
- Silveira, L.; Leite, K.R.W.; Silveira, F.L.; Srougi, M.; Pacheco, M.T.T.; Zângaro, R.A.; Pasqualucci, C.A. Discrimination of prostate carcinoma from benign prostate tissue fragments in-vitro by estimating the gross biochemical alterations through Raman spectroscopy. Lasers Med. Sci. 2014, 29, 1469–1477. [Google Scholar] [CrossRef]
- Willets, K.; Van Dune, R. Localized surface plasmon resonance spectroscopy and Sensing. Annu. Phys. Rev. Chem. 2007, 58, 267–297. [Google Scholar] [CrossRef]
- Jain, P.K.; Lee, K.S.; El-Sayed, I.H.; El-Sayed, M.A. Calculated absorption and scattering properties of gold nanoparticles of different size, shape, and composition: Applications in biological imaging and biomedicine. J. Phys. Chem. B 2006, 110, 7238–7248. [Google Scholar] [CrossRef]
- Shanbhag, M.M.; Manasa, G.; Mascarenhas, R.J.; Mondal, K.; Shetti, N.P. Fundamentals of bio-electrochemical sensing. Chem. Eng. J. Adv. 2023, 16, 100516. [Google Scholar] [CrossRef]
- Menon, S.; Mathew, M.R.; Sam, S.; Keerthi, K.; Kumar, K.G. Recent advances and challenges in electrochemical biosensors for emerging and re-emerging infectious diseases. J. Electroanal. Chem. 2020, 878, 114596. [Google Scholar] [CrossRef]
- Cao, Y.; Dai, Y.; Chen, H.; Tang, Y.; Chen, X.; Wang, Y.; Zhao, J.; Zhu, X. Integration of fluorescence imaging and electro-chemical biosensing for both qualitative location and quantitative detection of cancer cells. Biosens. Bioelectron. 2019, 130, 132–138. [Google Scholar] [CrossRef]
- Gil, B.; Keshavarz, M.; Wales, D.; Darzi, A.; Yeatman, E. Orthogonal surface-enhanced Raman scattering/field-effect transistor detection of breast and colorectal cancer-derived exosomes using graphene as a tag-free diagnostic template. Adv. NanoBiomed Res. 2023, 3, 2300055. [Google Scholar] [CrossRef]
- Gil Rosa, B.; Akingbade, O.E.; Guo, X.; Gonzalez-Macia, L.; Crone, M.A.; Cameron, L.P.; Freemont, P.; Choy, K.-L.; Güder, F.; Yeatman, E.; et al. Multiplexed immunosensors for point-of-care diagnostic applications. Biosens. Bioelectron. 2022, 203, 114050. [Google Scholar] [CrossRef] [PubMed]
- Rodríguez-Oliveros, R.; Sánchez-Gill, J. Gold nanostars as thermoplasmonic nanoparticles for optical heating. Opt. Express 2012, 20, 621–626. [Google Scholar] [CrossRef] [PubMed]
- Hrelescu, C.; Sau, T.K.; Rogach, A.L.; Jäckel, F.; Feldmann, J. Single gold nanostars enhance Raman scattering. Appl. Phys. Lett. 2009, 94, 153113. [Google Scholar] [CrossRef]
- Shan, F.; Zhang, X.-Y.; Fu, X.-C.; Zhang, L.-J.; Su, D.; Wang, S.-J.; Wu, J.-Y.; Zhang, T. Investigation of simultaneously existed Raman scattering enhancement and inhibiting fluorescence using surface modified gold nanostars as SERS probes. Sci. Rep. 2017, 7, 6813. [Google Scholar] [CrossRef]
- Jana, D.; Gorunmez, Z.; He, J.; Bruzas, I.R.; Beck, T.L.; Sagle, L.B. Surface enhanced Raman spectroscopy of Au@Au core-shell structure containing a spiky shell. J. Phys. Chem. C 2016, 120, 20814–20821. [Google Scholar] [CrossRef]
- Khosroshahi, M.E.; Woll-Morison, V.; Patel, Y. Near IR-plasmon enhanced guided fluorescence and thermal imaging of tissue subsurface target using ICG-labelled gold nanourchin and protein Contrast agent: Implication of stability. Lasers Med. Sci. 2022, 37, 2145–2156. [Google Scholar] [CrossRef]
- Seungyoung, P.; Lee, J.; Ko, H. Transparant and flexible SERS sensors based on gold nanostar array embedded in silicone rubber film. ACS Appl. Mater. Interfaces 2017, 9, 44088–44095. [Google Scholar]
- Jalani, G.; Cerruti, M. Nano graphene oxide-wrapped gold nanostars as ultrasensitive and stable SERS nanoprobes. Nanoscale 2015, 7, 9990–9997. [Google Scholar] [CrossRef]
- Lin, J.; Huang, Z.; Lin, X.; Wu, Q.; Quan, K.; Cheng, Y.; Zheng, M.; Xu, J.; Dai, Y.; Qiu, H.; et al. Rapid and label-free urine test based on surface-enhanced Raman spectroscopy for the non-invasive detection of colorectal cancer at different stages. Biomed. Opt. Express 2020, 11, 7109–7119. [Google Scholar] [CrossRef]
- Kong, K.V.; Leong, W.K.; Lam, Z.; Gong, T.; Goh, D.; Lau, W.K.O.; Olivo, M. A rapid and label-free SERS detection method for biomarkers in clinical biofluids. Small 2014, 10, 5030–5034. [Google Scholar] [CrossRef]
- Lin, Y.; Gao, J.; Tang, S.; Zhao, X.; Zheng, M.; Gong, W.; Xie, S.; Gao, S.; Yu, Y.; Lin, J. Label-free diagnosis of breast cancer based on serum protein purification assisted surface-enhanced Raman spectroscopy. Spectrochim. Acta Part A Mol. Biomol. Spectrosc. 2021, 263, 120234. [Google Scholar] [CrossRef] [PubMed]
- Avci, E.; Yilmaz, H.; Sahiner, N.; Tuna, B.G.; Cicekdal, M.B.; Eser, M.; Basak, K.; Altıntoprak, F.; Zengin, I.; Dogan, S.; et al. Label-free surface enhanced Raman spectroscopy for cancer detection. Cancers 2022, 14, 5021. [Google Scholar] [CrossRef] [PubMed]
- Khosroshahi, M.E.; Chabok, R.; Chung, N. Glass-based biosensor for targeted detection of HER-II biomarker in serum using oriented antibody-conjugated gold nanourchin. Plasmonics 2023, 8, 2155–2176. [Google Scholar] [CrossRef]
- Xia, M.; Zhang, P.; Qiao, K.; Bai, Y.; Xie, Y.-H. Coupling SPP with LSPR for enhanced field confinement: A simulation study. J. Phys. Chem. C 2016, 120, 527–533. [Google Scholar] [CrossRef]
- Bhattarai, J.K.; Maruf, M.H.U.; Stine, K.J. Plasmonic-active nanostructured thin films. Processes 2020, 8, 115. [Google Scholar] [CrossRef]
- Khosroshahi, M.E.; Patel, Y.; Chabok, R. Non-invasive optical characterization and detection of CA 15-3 breast cancer bi-omarker in blood serum using monoclonal antibody-conjugated gold nanourchin and surface-enhanced Raman scattering. Lasers Med. Sci. 2023, 38, 24. [Google Scholar] [CrossRef]
- Khosroshahi, M.E.; Patel, Y.; Umashanker, V.; Gaoiran, C. Fabrication of and characterization of directional anti-body-conjugated gold nanourchin colloid and effect of laser polarization on SERS detection of breast cancer biomarker in serum. Colloids Surf. A Physicochem. Eng. Asp. 2024, 694, 134035. [Google Scholar] [CrossRef]
- Khosroshahi, M.E.; Patel, Y. Reflective FT-NIR and SERS Study of HER-II breast cancer biomarker in blood serum using plasmonic-active nanostructured thin film immobilized with oriented monoclonal antibody. J. Biophotonics 2023, 16, e202200252. [Google Scholar] [CrossRef]
- Khosroshahi, M.E.; Patel, Y.; Umashanker, V. Targeted FT-NIR and SERS Detection of Breast cancer HER-II biomarkers in blood serum using PCB-based plasmonic active nanostructured thin film label-free immunosensor immobilized with directional GNU-conjugated antibody. Sensors 2024, 24, 5378. [Google Scholar] [CrossRef]
- Antosiewicz, M.J.; Shugar, D. UV-vis spectroscopy of tyrosine side-groups in studies of protein structure, Part 2: Selected applications. Biophys. Rev. 2016, 8, 163–177. [Google Scholar] [CrossRef]
- Fisher, R.D.; Ultsch, M.; Lingel, A.; Schaefer, G.; Shao, L.; Birtalan, S.; Sidhu, S.S.; Eigenbrot, C. Structure of the complex between HER2 and an antibody paratope formed by side chains from tryptophan and serine. J. Mol. Biol. 2010, 402, 217–229. [Google Scholar] [CrossRef] [PubMed]
- Terävä, J.; Tiainen, L.; Lamminmäki, U.; Kellokumpu-Lehtinen, P.-L.; Pettersson, K.; Gidwani, K. Lectin nanoparticle assays for detecting breast cancer-associated glycovariants of cancer antigen 15-3 (CA15-3) in human plasma. PLoS ONE 2019, 14, e0219480. [Google Scholar] [CrossRef] [PubMed]
- Machado, M., Jr.; Guelli, S.M.A.G.U.; Ferreira Morgado, A.; Caldas, P.G.; Ptak, F.; Prioli, R. Influence of cellulose fibers and fibrils on nanoscale friction in kraft paper. Cellulose 2016, 23, 2653–2661. [Google Scholar] [CrossRef]
- Esenturk, E.N.; Walker, A.R.H. Surface-enhanced Raman scattering spectroscopy via gold nanostars. J. Raman Spectrosc. 2009, 40, 86–91. [Google Scholar] [CrossRef]
- Weiss, A.; Haran, G. Time-dependent single-molecule Raman scattering as a probe of surface dynamics. J. Phys. Chem. B 2001, 105, 12348–12354. [Google Scholar] [CrossRef]
- Miranda, A.M.; Castilho-Almeida, E.W.; Martins Ferreira, E.H.; Moreira, G.F.; Achete, C.A.; Armond, R.A.; Dos Santos, H.F.; Jorio, A. Line shape analysis of the Raman spectra from pure and mixed biofuels esters compounds. Fuel 2014, 115, 118–125. [Google Scholar] [CrossRef]
- Chisanga, M.; Muhamadali, H.; Ellis, D.I.; Goodacre, R. Surface-enhanced Raman scattering (SERS) in microbiology: Illumination and enhancement of the microbial world. Appl. Spectrosc. 2018, 72, 987–1000. [Google Scholar] [CrossRef]
- Ma, M.; Zhang, J.; Liu, Y.; Wang, X.; Han, B. Advances in the clinical application of Raman spectroscopy in breast cancer. Appl. Spectrosc. Rev. 2024, 59, 1459–1493. [Google Scholar] [CrossRef]
- Jenkins, A.L.; Larsen, R.A.; Williams, T.B. Characterization of amino acids using Raman Spectroscopy. Spectrochim. Acta Part A Mol. Biomol. Spectrosc. 2005, 61, 1585–1594. [Google Scholar] [CrossRef]
- Santos, J.J.; Leal, J.; Dias, L.A.P.; Toma, S.H.; Corio, P.; Genezini, F.A.; Katti, K.V.; Araki, K.; Lugão, A.B. Bovine serum albumin conjugated gold-198 nanoparticles as model to evaluate damage caused by ionizing radiation to biomolecules. ACS Appl. Nano Mater. 2018, 1, 5062–5070. [Google Scholar] [CrossRef]
- Miura, T.; Thomas, G.J., Jr. Raman spectroscopy of proteins and their assemblies. In Proteins: Structure, Function, and Engineering; Subcellular Biochemistry; Springer: Boston, MA, USA, 1995; Volume 24, pp. 55–99. [Google Scholar]
- Zhu, G.; Zhu, X.; Fan, Q.; Wan, X. Raman spectra of amino acids and their aqueous solutions. Spectrochim. Acta Part A Mol. Biomol. Spectrosc. 2011, 78, 1187–1195. [Google Scholar] [CrossRef] [PubMed]
- Li, H.; Thomas, G.J., Jr. Studies of virus structure by Raman spectroscopy. Cysteine conformation and sulfhydryl interactions in proteins and viruses. 1. Correlation of the Raman sulfur-hydrogen band with hydrogen bonding and intramolecular geometry in model compounds. J. Am. Chem. Soc. 1991, 113, 456–462. [Google Scholar] [CrossRef]
- McNay, G.; Eustace, D.; Smith, W.E.; Faulds, K.; Graham, D. Surface-Enhanced Raman Scattering (SERS) and Surface-Enhanced Resonance Raman Scattering (SERRS): A review of applications. Appl. Spectrosc. 2011, 65, 825–837. [Google Scholar] [CrossRef] [PubMed]
- Kang, T.; Hong, S.; Choi, Y.; Lee, L.P. The effect of thermal gradients in SERS spectroscopy. Small 2010, 6, 2649–2652. [Google Scholar] [CrossRef]
- Chen, H.; Lin, Z.; Mo, L.; Wu, T.; Tan, C. Near-infrared spectroscopy as a diagnostic tool for distinguishing between normal and malignant colorectal tissues. BioMed Res. Int. 2015, 2015, 472197. [Google Scholar] [CrossRef]
- Lambert, J. Chapter 10: Infrared and Raman Spectrometries: Vibrational Spectrometries. In Introduction to Organic Spectroscopy; Macmillan: New York, NY, USA, 1987; pp. 174–177. [Google Scholar]
- Smith, B. An IR spectral interpretation potpourri: Carbohydrates and alkynes. Spectroscopy 2017, 32, 18–24. [Google Scholar]
- Mo, W.; Ke, Q.; Zhou, M.; Xie, G.; Huang, J.; Gao, F.; Ni, S.; Yang, X.; Qi, D.; Wang, A.; et al. Combined morphological and spectroscopic diagnostic of HER2 expression in breast cancer tissues based on label-free Surface-enhanced Raman scattering. Anal. Chem. 2023, 95, 3019–3027. [Google Scholar] [CrossRef]
- Zanchi, C.; Giuliani, L.; Lucotti, A.; Pistaffa, M.; Trusso, S.; Neri, F.; Tommasini, M.; Ossi, P.M. On the performance of laser-synthesized, SERS-based sensors for drug detection. Appl. Surf. Sci. 2020, 507, 145109. [Google Scholar] [CrossRef]
- Pérez, A.; Prada, Y.A.; Cabanzo, R.; González, C.I.; Mejía-Ospino, E. Diagnosis of chagas disease from human blood serum using surface-enhanced Raman scattering (SERS) spectroscopy and chemometric methods. Sens. Bio-Sens. Res. 2018, 21, 40–45. [Google Scholar] [CrossRef]
- Varga-Obieta, E.; Martinez-Espinosa, J.; Martinez-Zerga, B.; Aguilar-Lemarroy, A.; Gonzalez-Solfs, J. Breast cancer detection based on serum sample surface enhanced Raman spectroscopy. Lasers Med. Sci. 2016, 17, 1317–1324. [Google Scholar] [CrossRef]
- Fazio, B.; D’aNdrea, C.; Foti, A.; Messina, E.; Irrera, A.; Donato, M.G.; Villari, V.; Micali, N.; Maragò, O.M.; Gucciardi, P.G. SERS detection of biomolecules at physiological pH via aggregation of gold nanorods mediated by optical forces and plasmonic heating OPEN. Sci. Rep. 2016, 6, 26952. [Google Scholar] [CrossRef] [PubMed]
- Guo, C.; Guo, X.; Chu, W.; Jiang, N.; Li, H. Spectroscopic study of conformation changes of bovine serum albumin in aqueous environment. Chin. Chem. Lett. 2019, 30, 1302–1306. [Google Scholar] [CrossRef]
- Hopkinson, J.; Newbery, J. Spectroscopic and Structural Studies of Biomaterials I: Proteins; Twardowski, J., Ed.; Sigma: Wilmslow, UK, 1988; pp. 32–37. [Google Scholar]
- Li, Y.; Wang, Z.; Mu, X.; Ma, A.; Guo, S. Raman tags: Novel optical probes for intracellular sensing and imaging. Biotechnology 2017, 35, 168–177. [Google Scholar] [CrossRef]
- Bonifacio, A.; Cervo, S.; Sergo, V. Label-free surface-enhanced Raman spectroscopy of biofluids: Fundamental aspects and diagnostic applications. Anal. Bioanal. Chem. 2015, 407, 8265–8277. [Google Scholar] [CrossRef] [PubMed]
- Tan, Y.; Yan, B.; Xue, L.; Li, Y.; Luo, X.; Ji, P. Surface-enhanced Raman spectroscopy of blood serum based of gold nanoparticles for the diagnosis of the squamous cell carcinoma. Lipids Health Dis. 2017, 16, 73. [Google Scholar] [CrossRef]

| Age. | HER-II (IHC Test) | CA 15-3 Concentration (U/mL) | Cancer Stage | Inventory Code |
|---|---|---|---|---|
| 68 | 2+ | 14 | Early | 2399645 |
| 33 | 3+ (I) | 22 | IIB-Early | 2372644 |
| 74 | 3+ (II) | N/A | IIIB-Locally Advanced | 201608071 |
| 64 | 3+ (III) | N/A | IV-Meta | HUMANSRM-0004591 |
| 61 | POS | N/A | IV-Meta | 2572228 |
| Age. | CA 15-3 Concentration (U/mL) | HER-II (IHC Test) | Cancer Stage | Inventory Code |
|---|---|---|---|---|
| 75 | 10 | Negative | IA-Early | 2399632 |
| 72 | 20 | Negative | IIIA-Locally Advanced | 2722228 |
| 33 | 22 | 3+ (1) | IIB-Early | 2372644 |
| 62 | 27 | N/A | IV (Meta) | 202105740 |
| 41 | 29 | N/A | IIB-Early | HUMANSRM-)-104805 |
| 76 | 47 | N/A | IIA-Early | 2356746 |
| 51 | 50 | N/A | IIIC-Locally Advanced | HUMANSRM-0118596 |
| Line | Rq (nm) | Ra (nm) | Rsk |
|---|---|---|---|
| Red | 86.867 | 78.876 | 0.015 |
| Green | 39.405 | 33.045 | 0.914 |
| Tentative Assignment | Wavenumber (cm−1) |
|---|---|
| S-S stretch disulfide | 400–500 |
| Ring modes of aromatic amino acids in proteins | 505, 559 |
| C-I stretch iodine derives | 515, 850 |
| C=O in amides | 535–615 |
| O-C-O in carboxylic acids | 590–700 |
| Phenylalanine | 622 |
| Tyrosine | 642, 640–650 |
| C-H out-of-plane bending vibration modes | 675–850 |
| Tryptophan, δ(-C-H) | 722, 779 |
| O-H out-of-plane bending | 786 |
| Tyrosine | 830–840 |
| Glycine, alanine v (C-N-C) assigned to the symmetric C-N-C stretching mode | 850–900 |
| C-H and phenolic O-H bending | 950–1250 |
| C-H, out-of-plane bending | 965–980 |
| Tyrosine | 1000 |
| Backbone vibrations | 1006 |
| Phenylalanine | 1000–1010, 1103 |
| C–O stretching | 1034 |
| C–C stretching in lipids | 1076 |
| Tyrosine ring breathing mode | 1154 |
| C–O stretching in lipids | 1180 |
| C–C stretching in lipids | 1210 |
| Amide III | 1220 |
| β-Sheet structures | 1230–1245 |
| Amide III bands | 1245–1270 |
| Phenolic C-O stretching | 1260 |
| C–C stretching in lipids | 1267 |
| Amide III bands | 1260–1310 |
| α-Helical domains related to the amide III band | 1278 |
| CH2 twisting and wagging in phospholipids | 1302–1304 |
| O-H in-plane vibration | 1352 |
| COO− symmetric stretching: fatty acids, proteins | 1392–1396 |
| CH2 and CH3 deformation modes (lipids, proteins) | 1440–1455 |
| Protein amide II band | 1507 |
| COO− stretching in carboxylates | 1554 |
| Amide II (β-sheet protein); N-H primary and secondary amines and amides (stretching and bending) | 1547–1640 |
| COO- in carboxylic acid salts | 1560–1610 |
| NH2 in primary amines | 1590–1650 |
| C-O asymmetric stretching; -COO− carboxylate | 1610–1540 |
| Tryptophan ν(C=C), tyrosine | 1620 |
| N-H in primary amides | 1620–1650 |
| C=O stretching in secondary amide (amide I) | 1630–1680 |
| C=O stretching in primary amide (amide I) | 1650–1670 |
| Amide I, α helix | 1655–1665 |
| β-Sheet structures | 1665–1680 |
| C=O stretching and N-H bending | 1690–1700 |
| C=O stretching in guanine | 1700–1702 |
| C=O stretching in lipids | 1717, 1746 |
| C-N amines, N-H primary and secondary amines and amides (stretch and bend), NH3 amine, and O-H stretching | 1920–2300 |
| N=C stretching | 2115–2175 |
| C≡C or C≡N stretching | 2200–2260 |
| N=C=O asymmetric Stretching in isocyanate | 2271 |
| P-H stretching | 2280–2410 |
| -NH3+ amine I | 2350–2750 |
| CH2 symmetric stretching in lipids | 2854 |
| CH3 symmetric stretching: proteins, lipids, triglycerides | 2873–2880 |
| CH2 asymmetric stretching in lipids and proteins | 2890 |
| CH2 asymmetric stretching | 2921–2926 |
| CH2 antisymmetric stretching in lipids | 2934 |
| O-H stretching in carbohydrates | 2744 |
| CH2 antisymmetric stretching in lipids | 2882 |
| C-H stretching: carbohydrates, lipids, proteins | 2800–3300 |
| CH3 asymmetric stretching: proteins, lipids, triglycerides | 2957–2959 |
| CH stretching in proteins | 2996 |
| O-H stretching | 3200–3400 |
| N-H vibration | 3236 |
| N-H stretching in primary amides, -NH2 in aromatic amines | 3250–3500 |
| Sample | Measured Concentration (ng/mL) | Intensity (a.u) | Corresponding Stage |
|---|---|---|---|
| 2+ | 14 | 6.0 | Early |
| 3+ (I) | 28 | 10.24 | IIB-Early |
| 3+ (II) | 33 | 11.95 | IIIB- Loc. Adv. |
| 3+ (III) | 36 | 12.88 | IV- Meta |
| POS | 40 | 14.13 | IV- Meta |
| U/mL | Wavenumber (cm−1) | Tentative Assignment |
|---|---|---|
| 10 | 1346 2219 | O-H in-plane vibration C≡C, C≡N stretching |
| 20 | 2477 3297 | NH3+ O-H stretching |
| 22 | 3445 | N-H stretching, NH2 aromatic amines |
| 27 | 1972 2107 2683 | C-N amines C-N amines NH3+ |
| 29 | 1453 2286 2356 | CH2 and CH3 deformations O-H stretching -NH3+ I amine |
| 47 | 867 1540 2603 3120 3262 | Glycine, alanine Amide-II NH3+ amine C-H stretching N-H stretching, NH2 in aromatic amines |
| 50 | 570 596 880 1967 3438 | C=O in amides C=O in amides Glycine, alanine C-N amines, N-H primary N-H stretching in primary amides, NH2 in aromatic amines |
| Sample | Actual Concentration (U/mL) | Measured Concentration (U/mL) | Intensity (a.u) |
|---|---|---|---|
| 1 | 10 | 4 | 8 |
| 2 | 20 | 19.70 | 10 |
| 3 | 22 | 24.5 | 10.75 |
| 4 | 27 | 25 | 10.9 |
| 5 | 29 | 31.7 | 11.4 |
| 6 | 47 | 43.5 | 12.85 |
| 7 | 50 | 45 | 13 |
Disclaimer/Publisher’s Note: The statements, opinions and data contained in all publications are solely those of the individual author(s) and contributor(s) and not of MDPI and/or the editor(s). MDPI and/or the editor(s) disclaim responsibility for any injury to people or property resulting from any ideas, methods, instructions or products referred to in the content. |
© 2025 by the authors. Licensee MDPI, Basel, Switzerland. This article is an open access article distributed under the terms and conditions of the Creative Commons Attribution (CC BY) license (https://creativecommons.org/licenses/by/4.0/).
Share and Cite
Khosroshahi, M.E.; Gaoiran, C.; Umashanker, V.; Veeru, H.; Panday, P. Dual-Oriented Targeted Nanostructured SERS Label-Free Immunosensor for Detection, Quantification, and Analysis of Breast Cancer Biomarker Concentrations in Blood Serum. Biosensors 2025, 15, 447. https://doi.org/10.3390/bios15070447
Khosroshahi ME, Gaoiran C, Umashanker V, Veeru H, Panday P. Dual-Oriented Targeted Nanostructured SERS Label-Free Immunosensor for Detection, Quantification, and Analysis of Breast Cancer Biomarker Concentrations in Blood Serum. Biosensors. 2025; 15(7):447. https://doi.org/10.3390/bios15070447
Chicago/Turabian StyleKhosroshahi, Mohammad E., Christine Gaoiran, Vithurshan Umashanker, Hayagreev Veeru, and Pranav Panday. 2025. "Dual-Oriented Targeted Nanostructured SERS Label-Free Immunosensor for Detection, Quantification, and Analysis of Breast Cancer Biomarker Concentrations in Blood Serum" Biosensors 15, no. 7: 447. https://doi.org/10.3390/bios15070447
APA StyleKhosroshahi, M. E., Gaoiran, C., Umashanker, V., Veeru, H., & Panday, P. (2025). Dual-Oriented Targeted Nanostructured SERS Label-Free Immunosensor for Detection, Quantification, and Analysis of Breast Cancer Biomarker Concentrations in Blood Serum. Biosensors, 15(7), 447. https://doi.org/10.3390/bios15070447