Research Progress of Graphene and Its Derivatives towards Exhaled Breath Analysis


Abstract
:1. Introduction
2. Sensing Principle
2.1. Charge Transfer Response Mechanism
2.2. Response Mechanism of Field-Effect Transistor
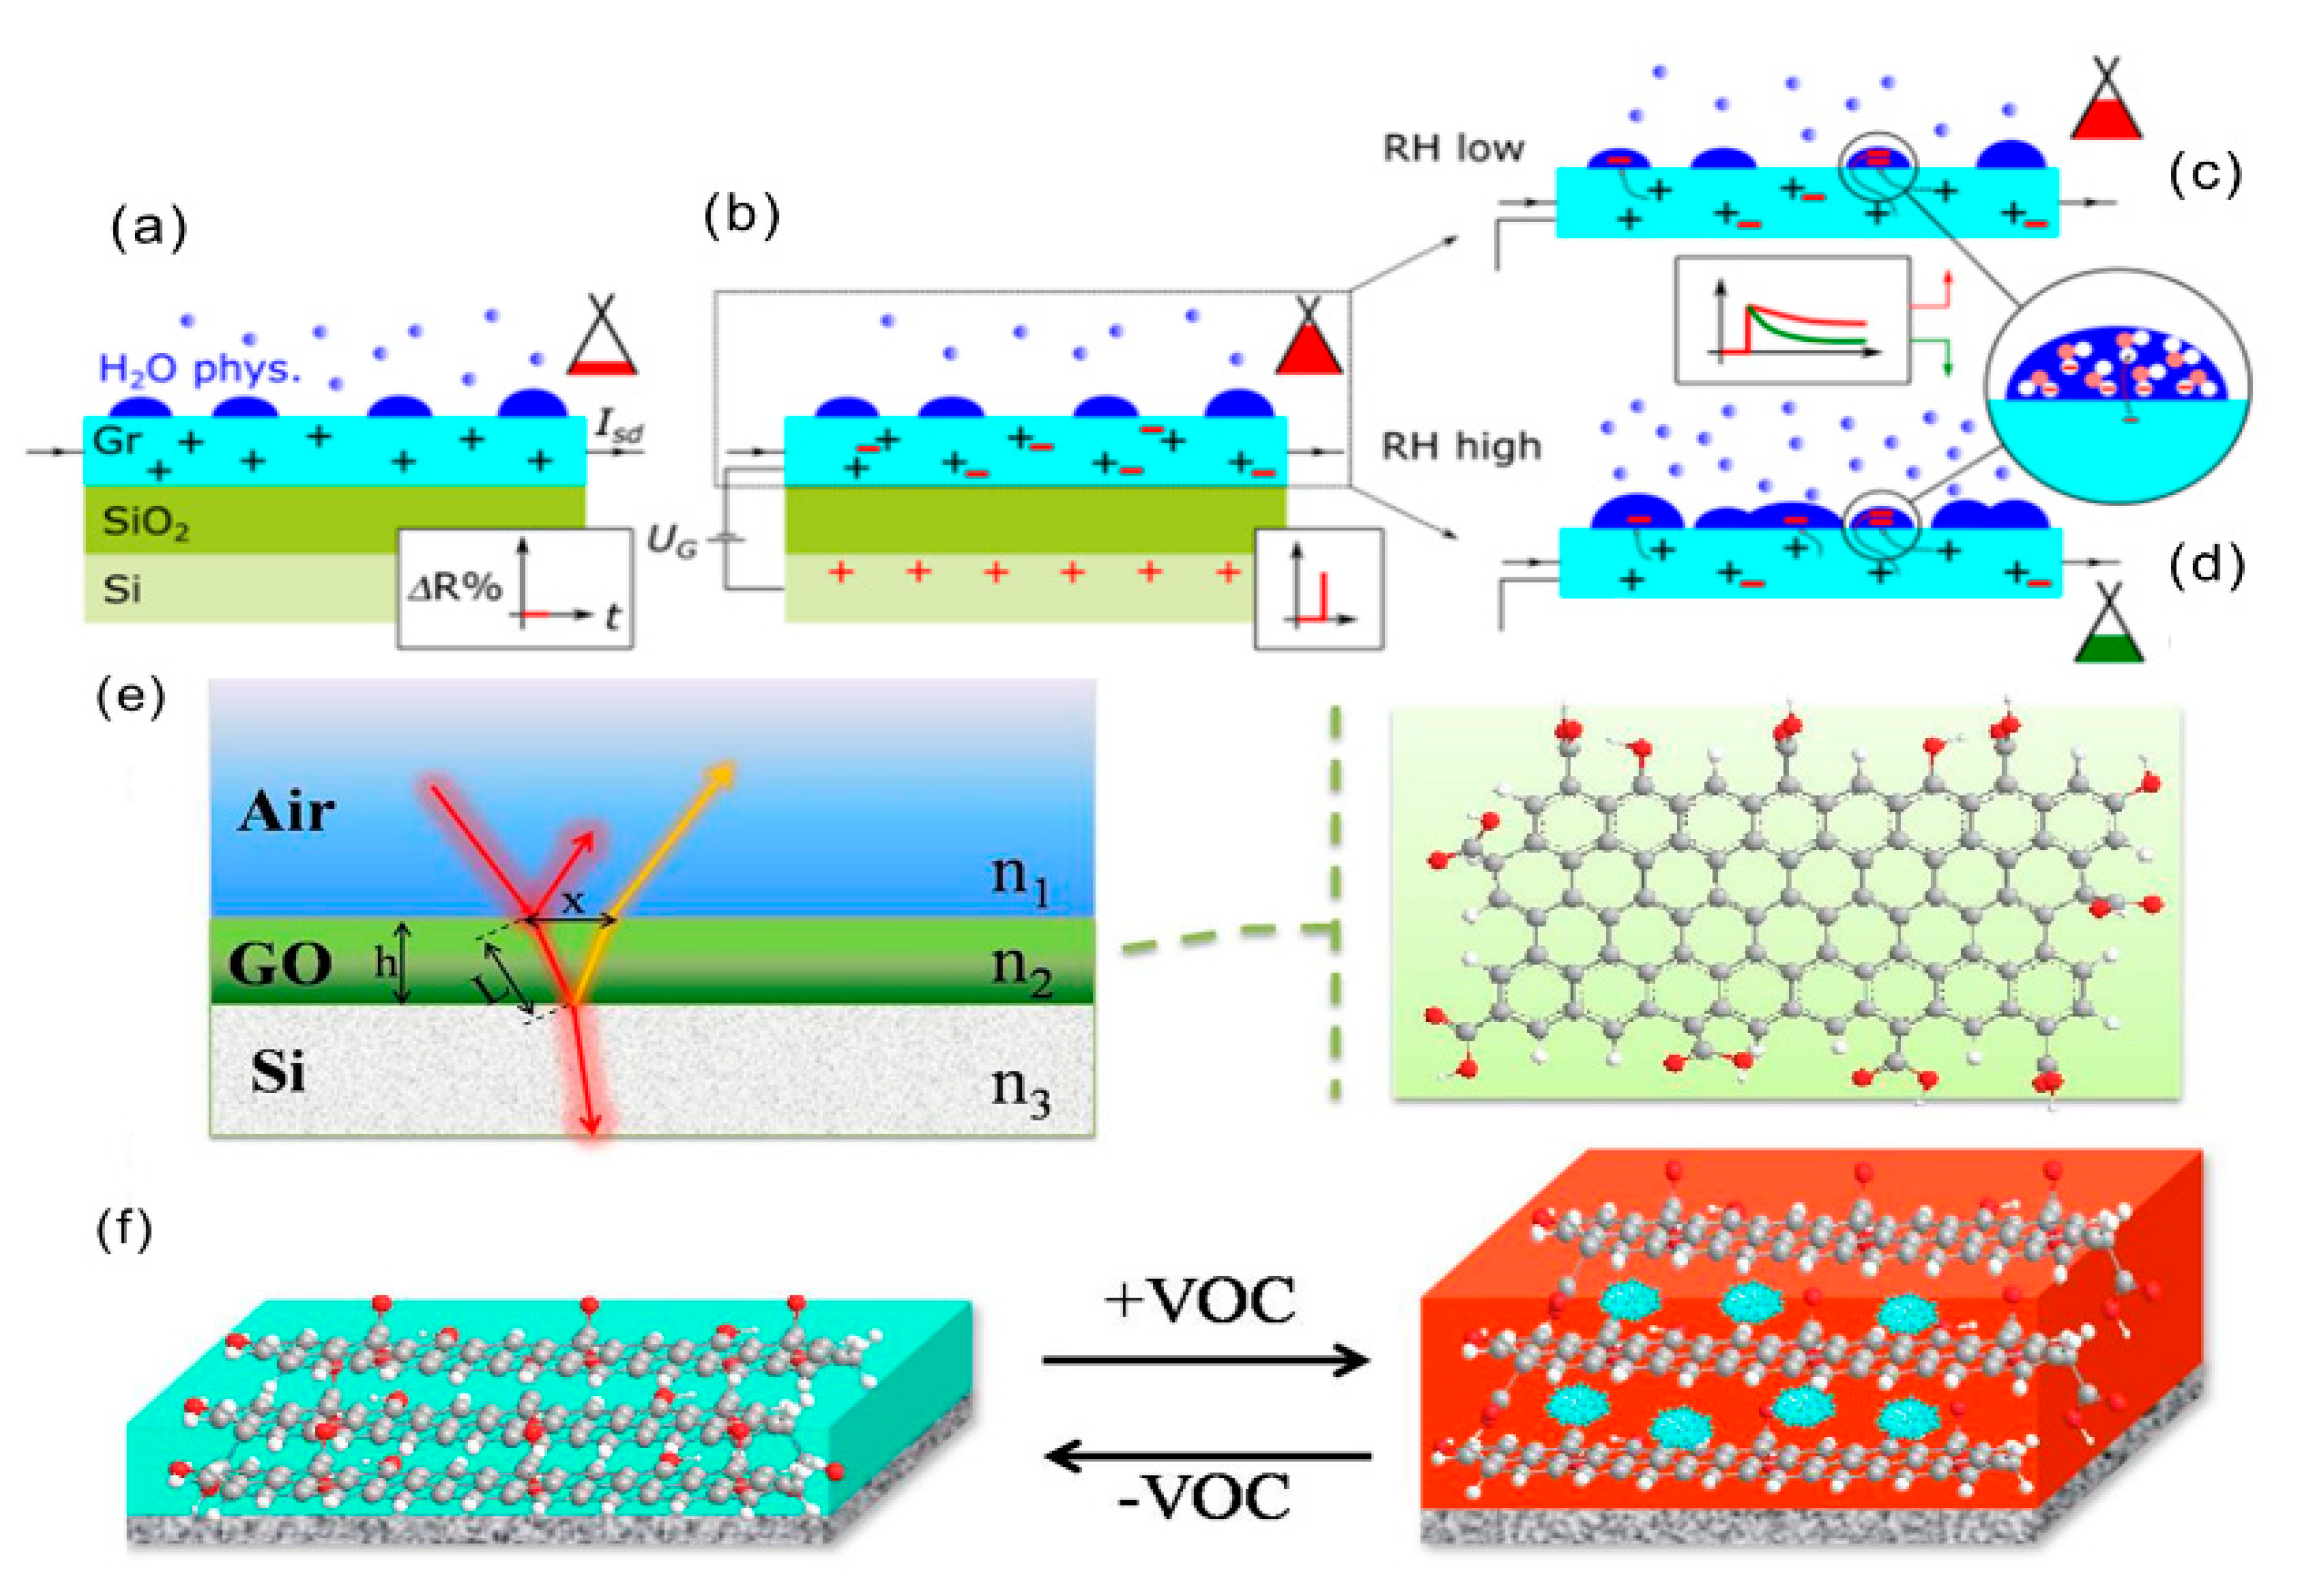
2.3. Thin-Film Interference Response Mechanism
3. Gas Monitoring for Medical Diagnosis
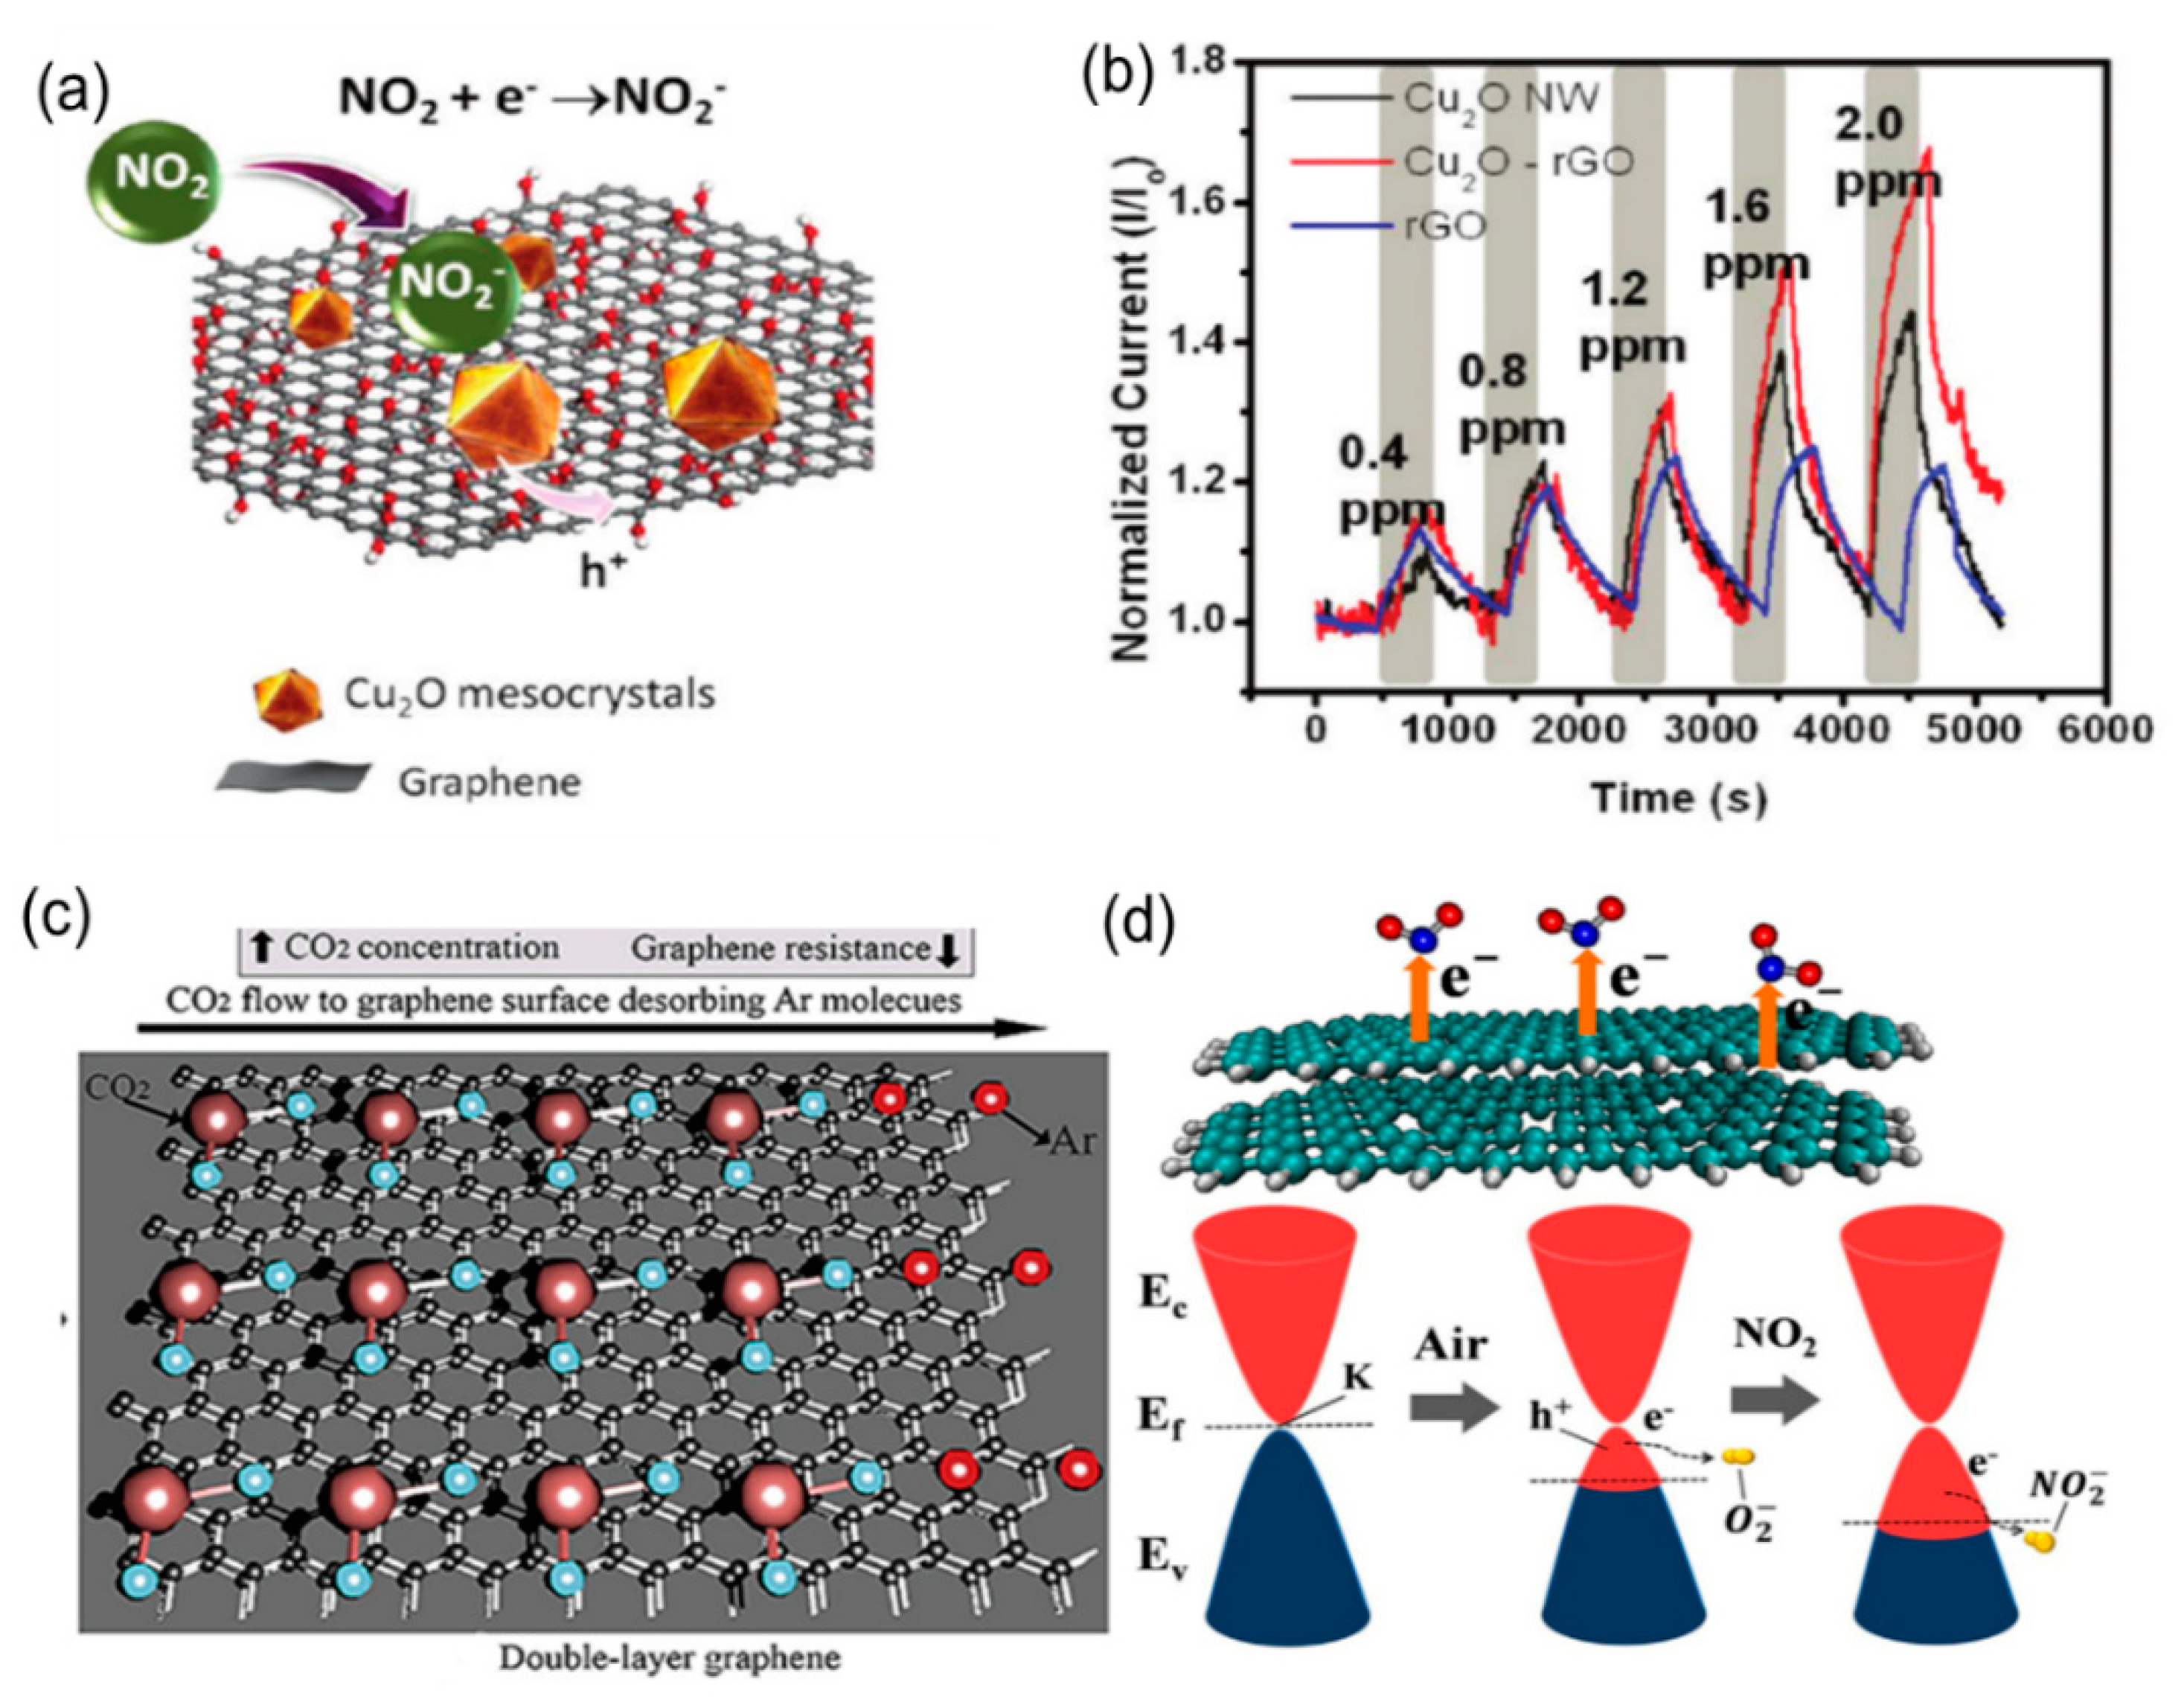
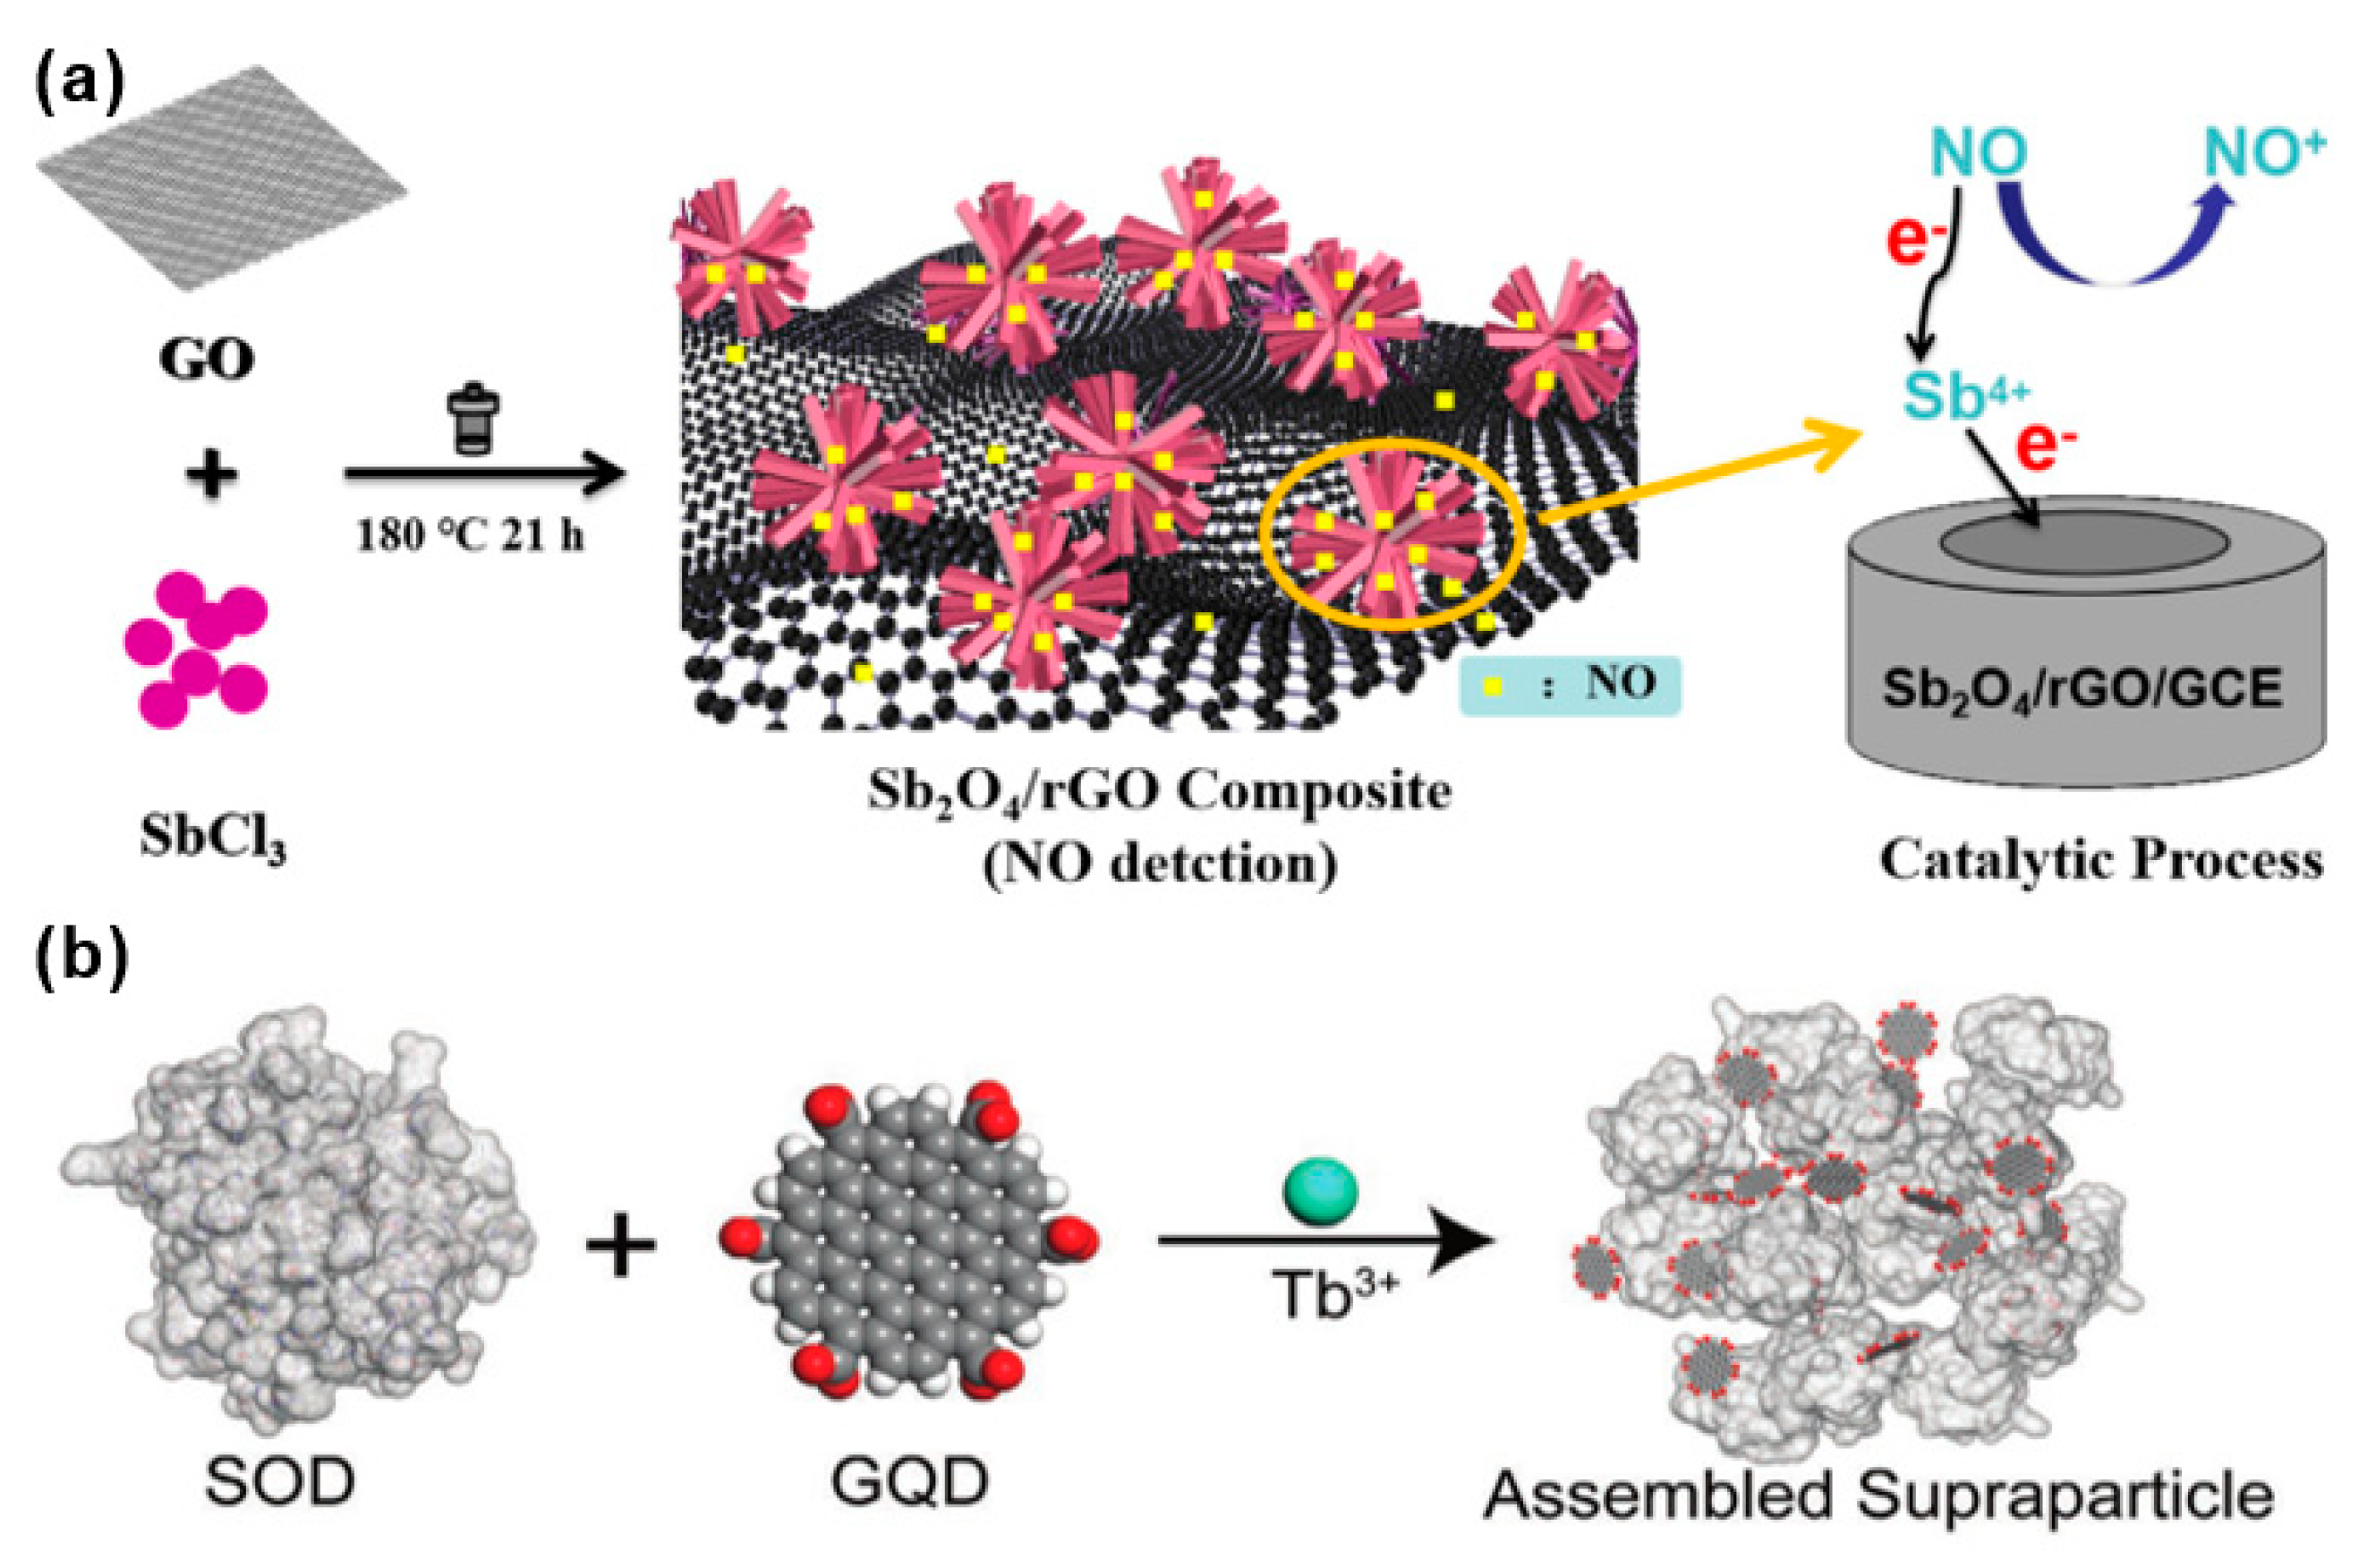
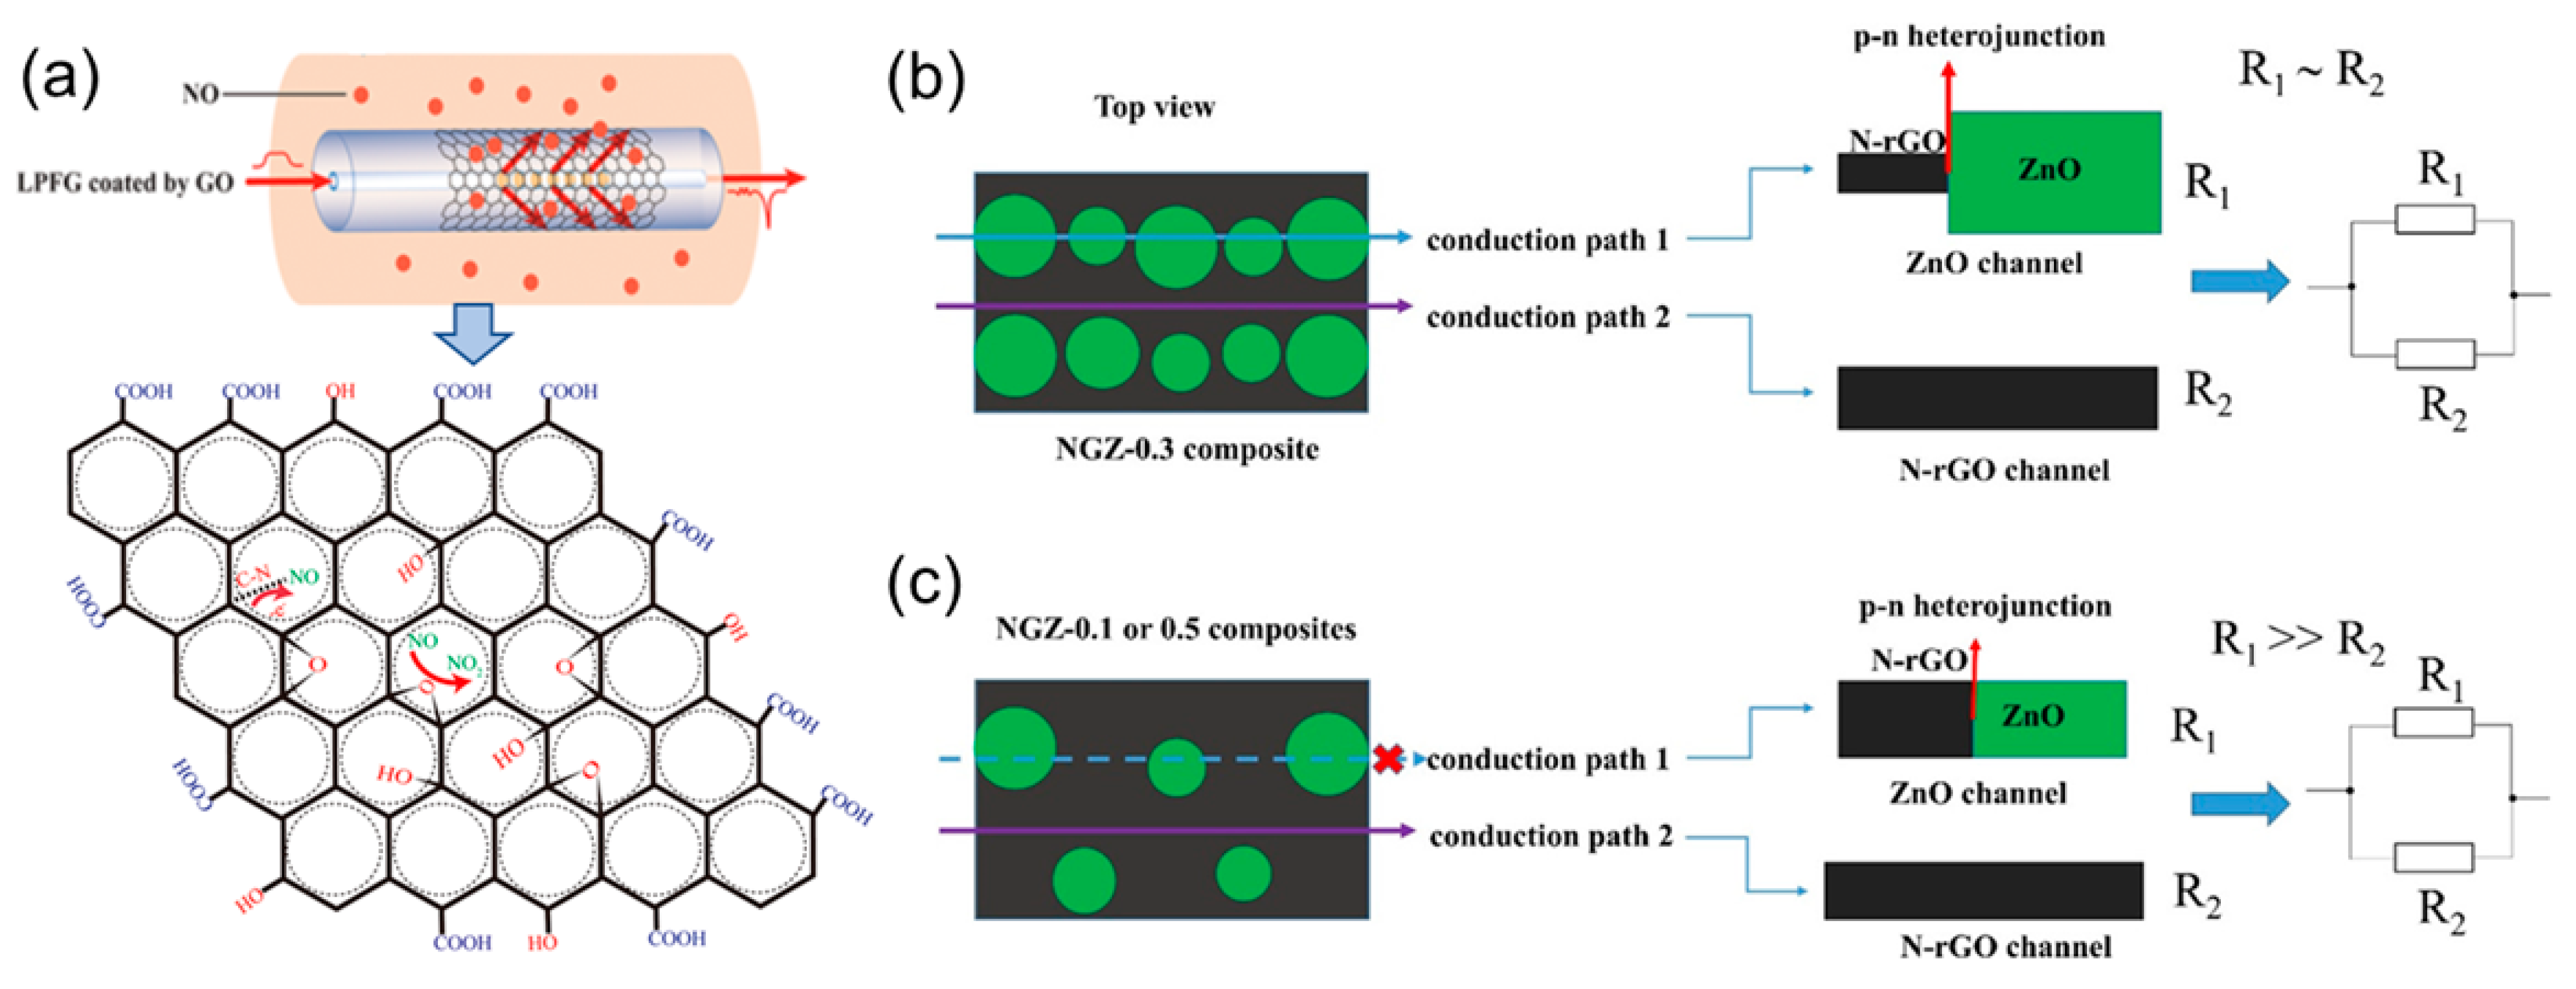
3.1. Nitric Oxide
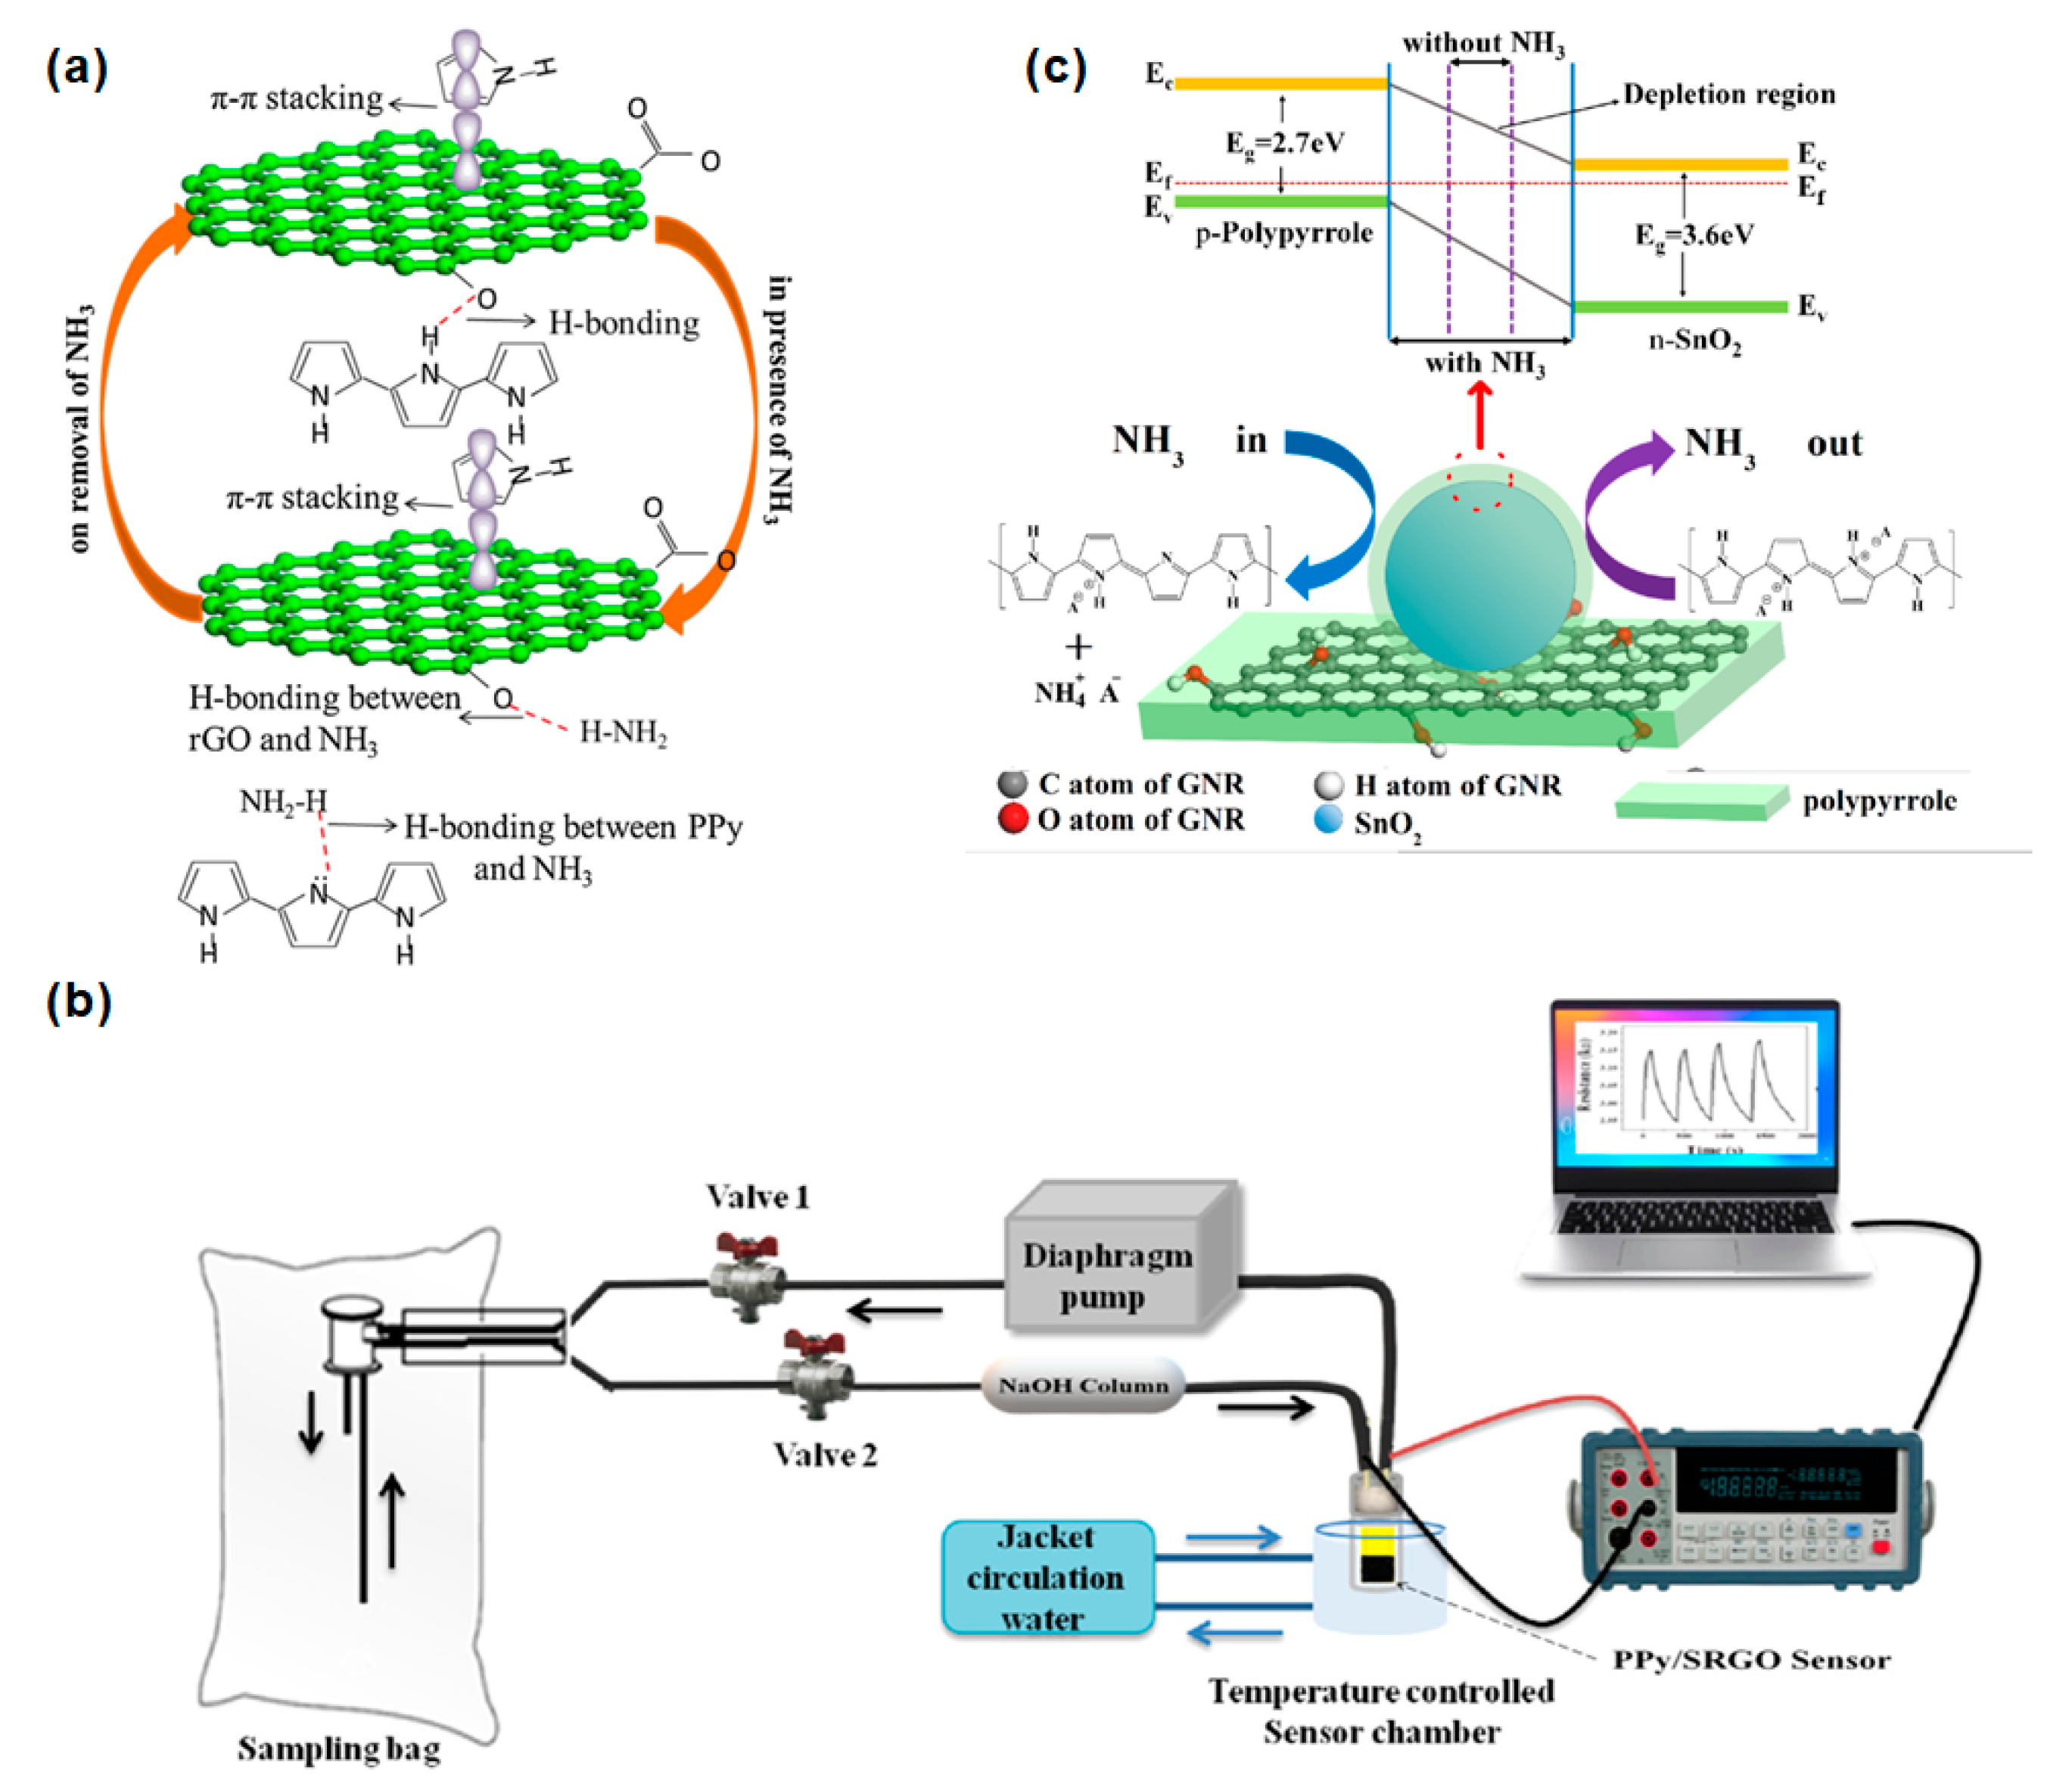
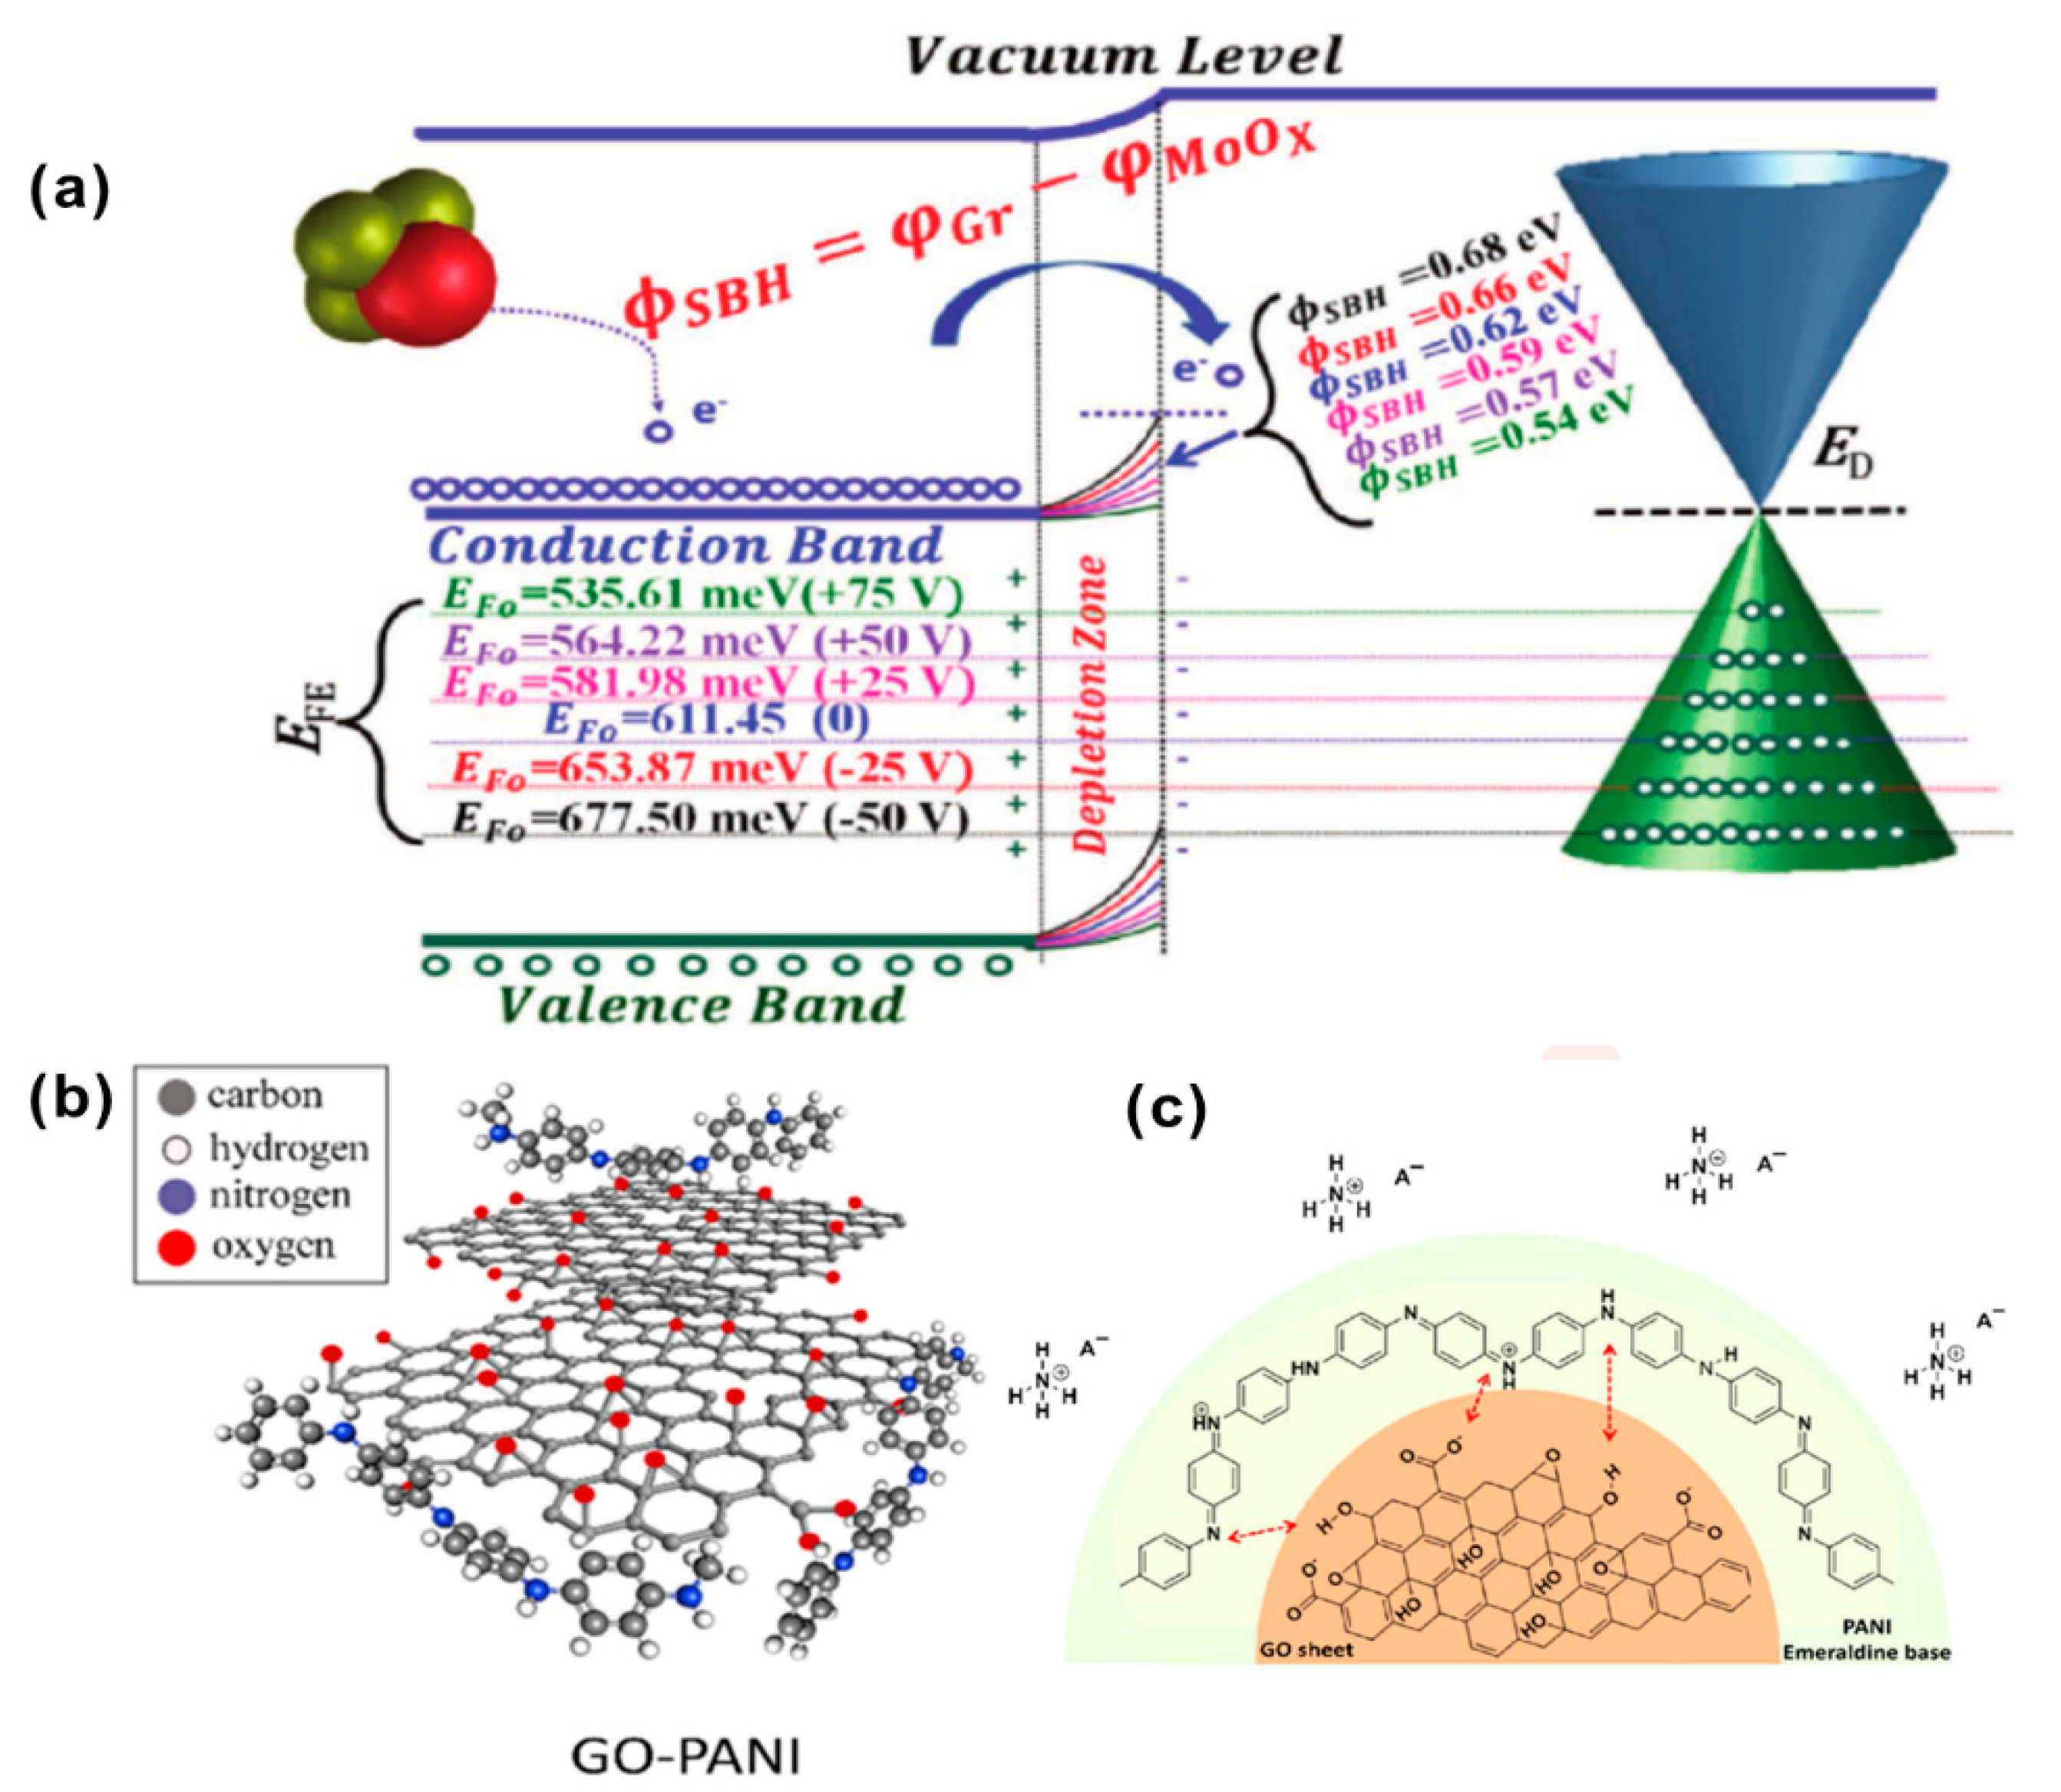
3.2. Nitrogen Hydride
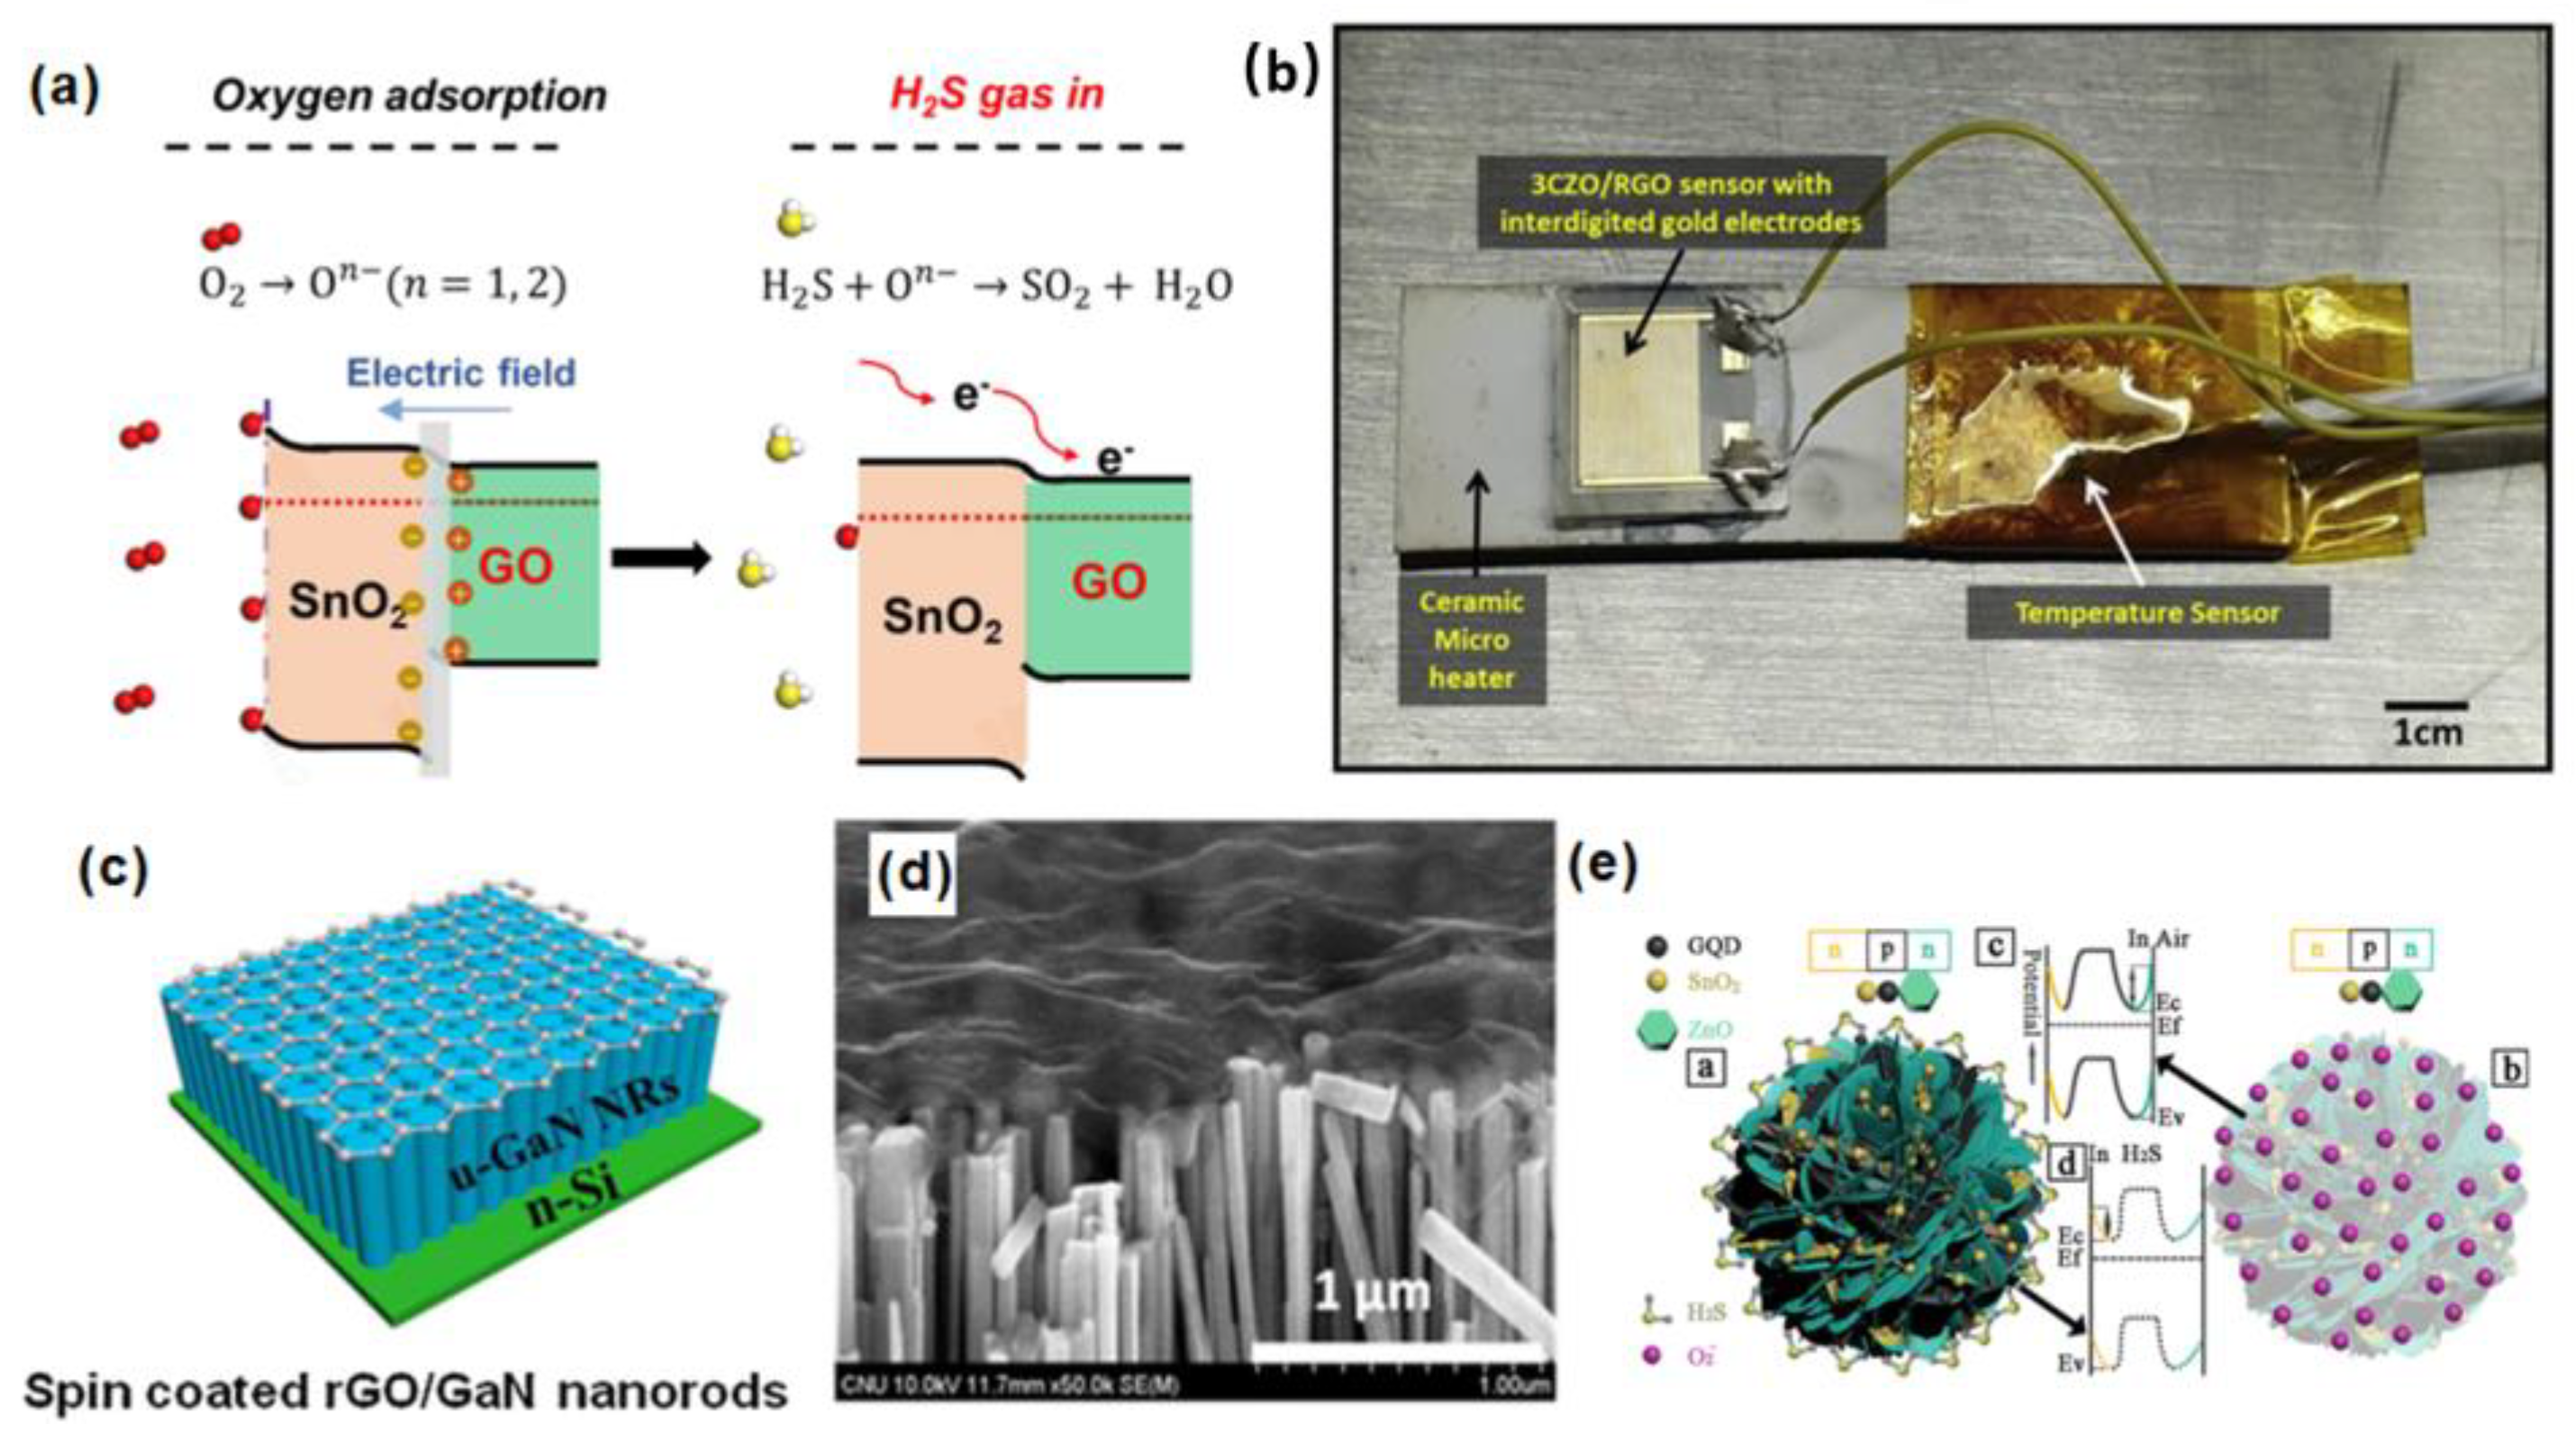
3.3. Sulfide Gas

| Material | Gas | Detection Limit | Response/Recover Time (s) | References |
|---|---|---|---|---|
| SnO2@GO | H2S | 200 ppb | 9/23 (54%RH) | [75] |
| H2S | 6/21 (93.6%RH) | |||
| ZnO/rGO | H2S | 136 ppb | 14/32 | [76] |
| rGO/GaN | H2S | 100 ppm | ~800 | [77] |
| (rGO) –NiO(NiOBNG) | H2S | 1 ppm | 31/49 | [78] |
| H2S | 20 ppm | 38/44 | ||
| H2S | 50 ppm | 28/75 | ||
| β–Ga2O3/rGO | H2S | 3 ppm | N.A. | [79] |
| WO3/rGO | H2S | 32.7 ppb | 340/180 | [80] |
| GQD–SnO2 QNP/ZnO | H2S | 0.1 ppm | 14/13 | [81] |
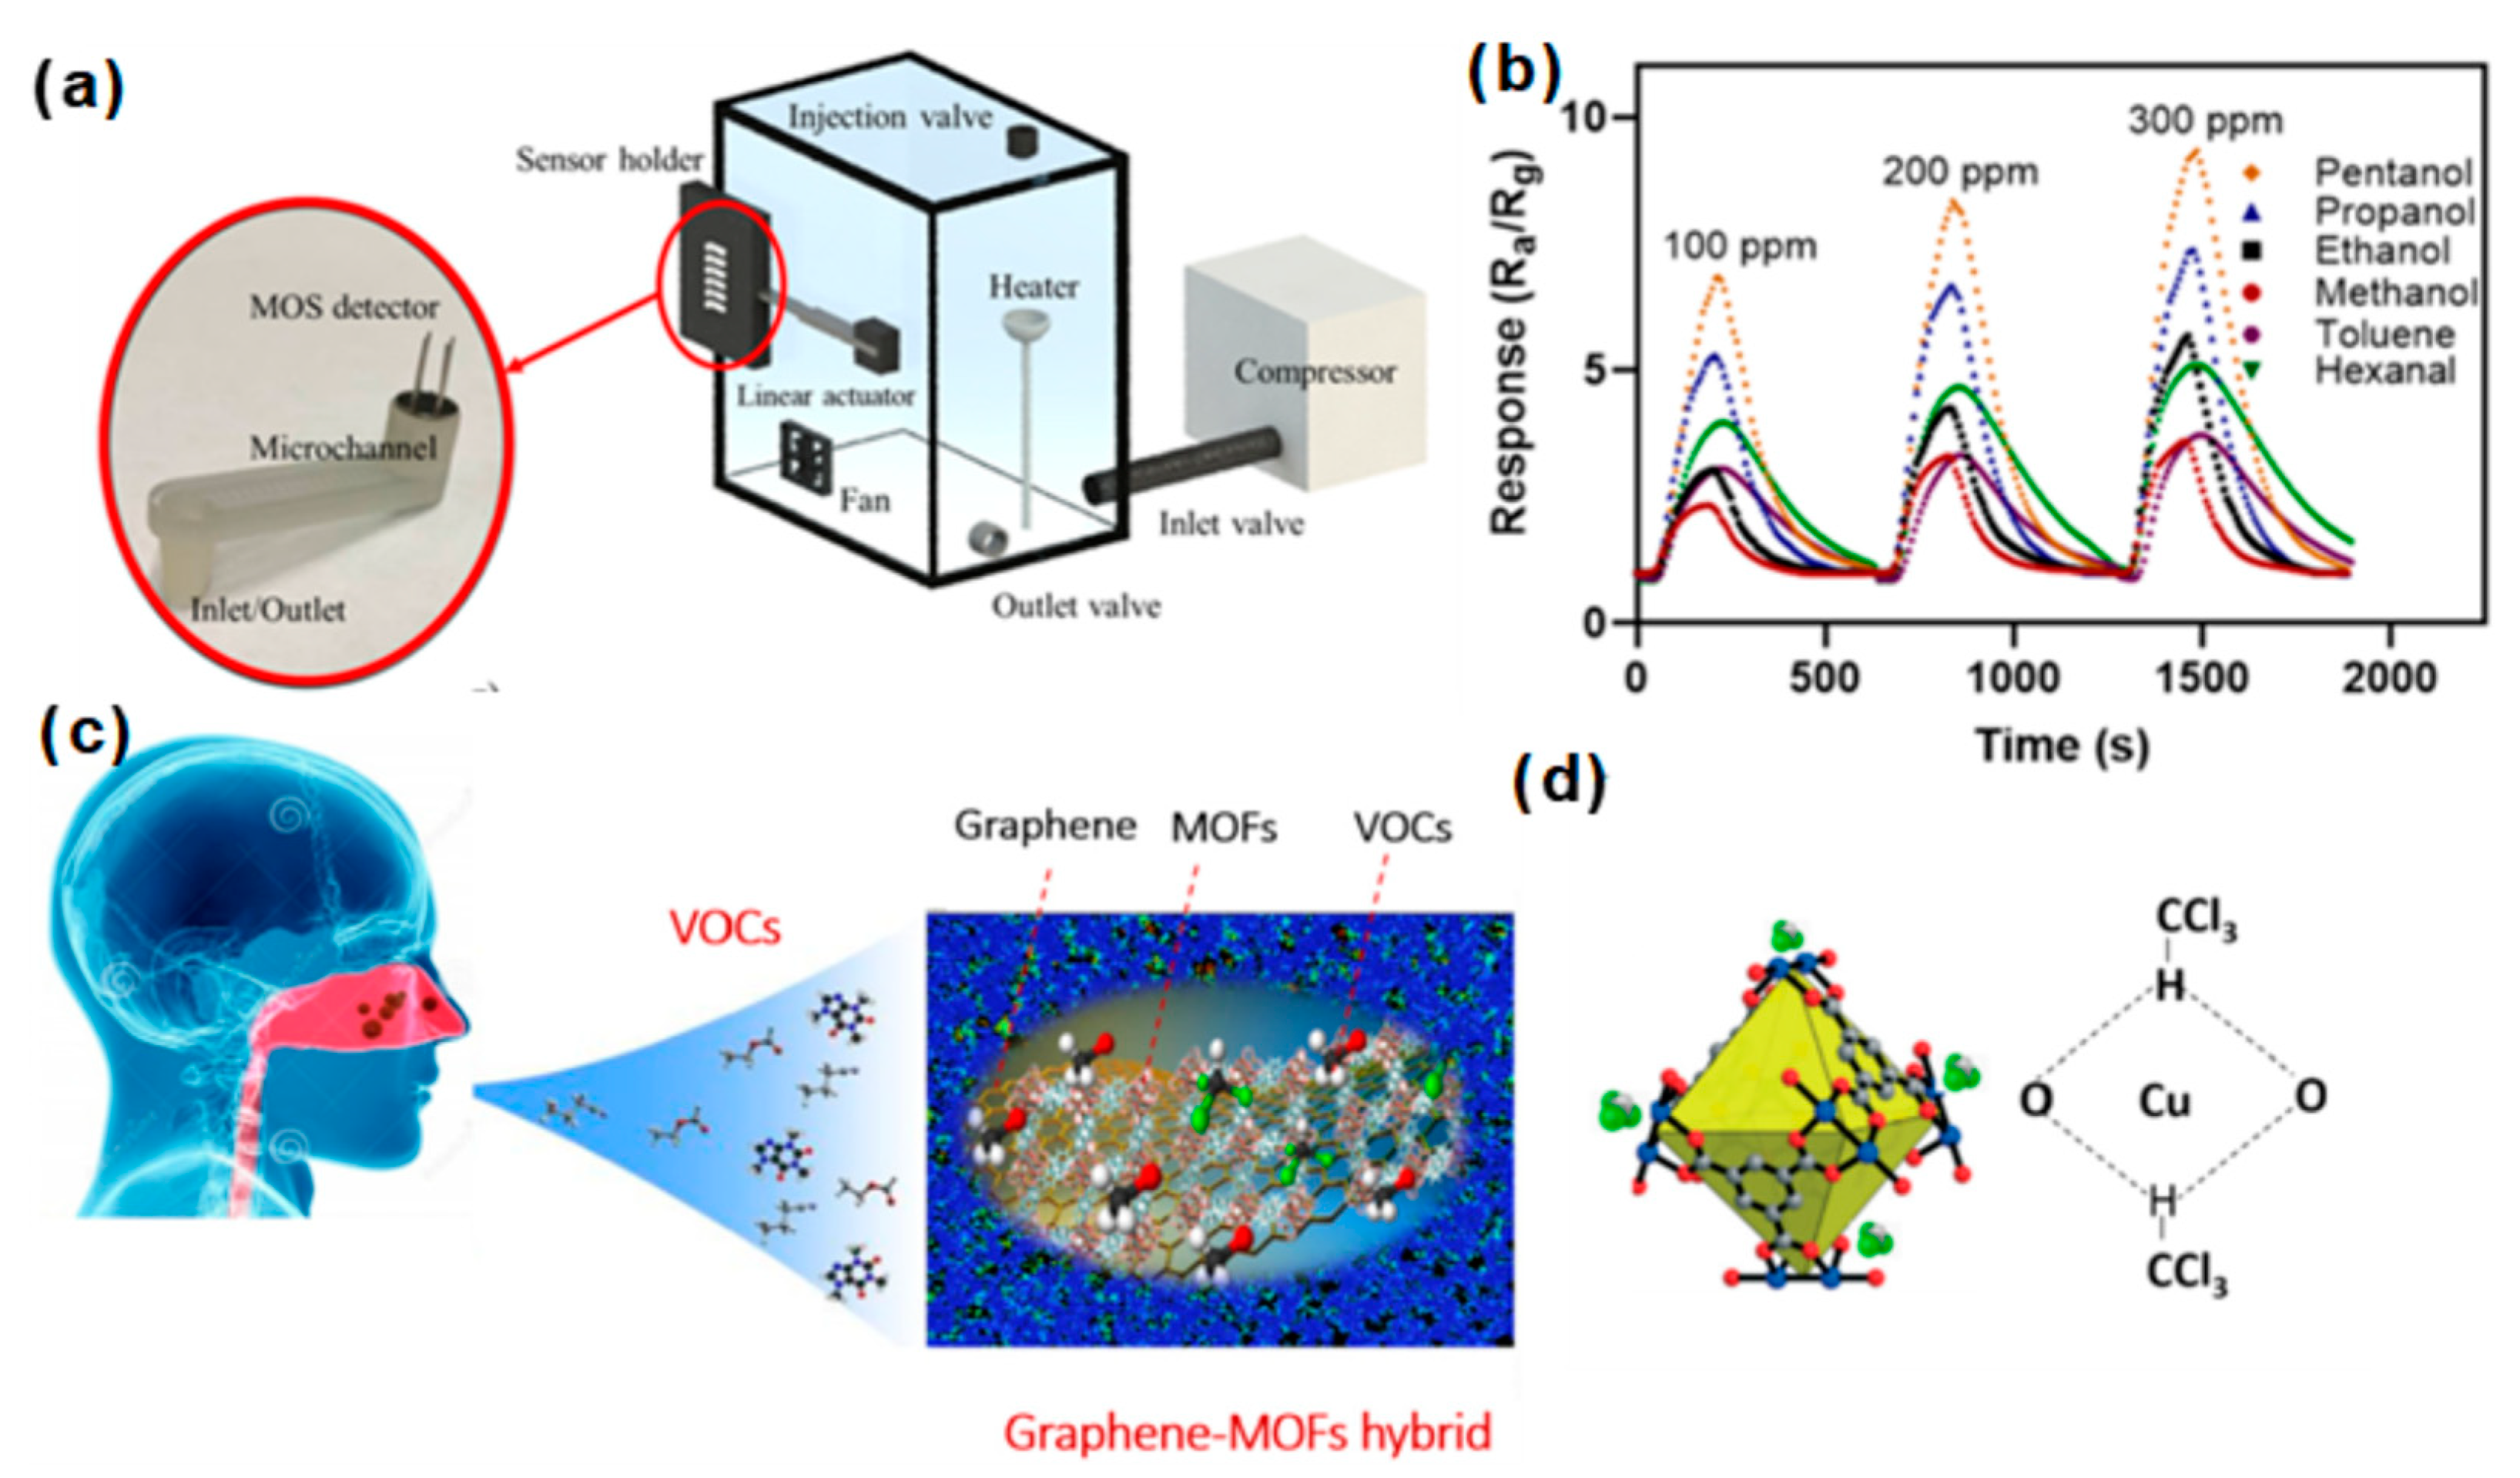
3.4. VOCs
4. Conclusions and Perspectives
Author Contributions
Funding
Conflicts of Interest
References
- Jia, Z.; Patra, A.; Kutty, V.K.; Venkatesan, T. Critical Review of Volatile Organic Compound Analysis in Breath and In Vitro Cell Culture for Detection of Lung Cancer. Metabolites 2019, 9, 52. [Google Scholar] [CrossRef] [Green Version]
- Krilaviciute, A.; Stock, C.; Leja, M.; Brenner, H. Potential of non-invasive breath tests for preselecting individuals for invasive gastric cancer screening endoscopy. J. Breath Res. 2018, 12, 036009. [Google Scholar] [CrossRef]
- Opitz, P.; Herbarth, O. The volatilome-investigation of volatile organic metabolites (VOM) as potential tumor markers in patients with head and neck squamous cell carcinoma (HNSCC). J. Otolaryngol. Head Neck Surg. 2018, 47, 42. [Google Scholar] [CrossRef]
- Hu, H.; Yang, X.; Guo, X.; Khaliji, K.; Biswas, S.R.; Garcia de Abajo, F.J.; Low, T.; Sun, Z.; Dai, Q. Gas identification with graphene plasmons. Nat. Commun. 2019, 10, 1131. [Google Scholar] [CrossRef]
- Sharma, N.; Sharma, V.; Sharma, S.K.; Sachdev, K. Gas sensing behaviour of green synthesized reduced graphene oxide (rGO) for H2 and NO. Mater. Lett. 2019, 236, 444–447. [Google Scholar] [CrossRef]
- Das, T.; Das, S.; Karmakar, M.; Chakraborty, S.; Saha, D.; Pal, M. Novel barium hexaferrite based highly selective and stable trace ammonia sensor for detection of renal disease by exhaled breath analysis. Sens. Actuators B Chem. 2020, 325, 128765. [Google Scholar] [CrossRef]
- Shahmoradi, A.; Hosseini, A.; Akbarinejad, A.; Alizadeh, N. Noninvasive Detection of Ammonia in the Breath of Hemodialysis Patients Using a Highly Sensitive Ammonia Sensor Based on a Polypyrrole/Sulfonated Graphene Nanocomposite. Anal. Chem. 2021, 93, 6706–6714. [Google Scholar] [CrossRef]
- Yoshida, A.; Yoshimura, M.; Ohara, N.; Yoshimura, S.; Nagashima, S.; Takehara, T.; Nakayama, K. Hydrogen sulfide production from cysteine and homocysteine by periodontal and oral bacteria. J. Periodontol. 2009, 80, 1845–1851. [Google Scholar] [CrossRef] [PubMed]
- Grabowska-Polanowska, B.; Faber, J.; Skowron, M.; Miarka, P.; Pietrzycka, A.; Sliwka, I.; Amann, A. Detection of potential chronic kidney disease markers in breath using gas chromatography with mass-spectral detection coupled with thermal desorption method. J. Chromatogr. A 2013, 1301, 179–189. [Google Scholar] [CrossRef]
- Sui, L.-l.; Xu, Y.-M.; Zhang, X.-F.; Cheng, X.-L.; Gao, S.; Zhao, H.; Cai, Z.; Huo, L.-H. Construction of three-dimensional flower-like α-MoO3 with hierarchical structure for highly selective triethylamine sensor. Sens. Actuators B Chem. 2015, 208, 406–414. [Google Scholar] [CrossRef]
- Kim, K.H.; Jahan, S.A.; Kabir, E. A review of breath analysis for diagnosis of human health. TrAC Trends Anal. Chem. 2012, 33, 1–8. [Google Scholar] [CrossRef]
- Willsie, S.K. An Official ATS Clinical Practice Guideline: Interpretation of Exhaled Nitric Oxide Levels (FeNO) for Clinical Applications. Yearb. Pulm. Dis. 2012, 2012, 16. [Google Scholar] [CrossRef] [Green Version]
- Oguma, T.; Nagaoka, T.; Kurahashi, M.; Kobayashi, N.; Yamamori, S.; Tsuji, C.; Takiguchi, H.; Niimi, K.; Tomomatsu, H.; Tomomatsu, K.; et al. Clinical contributions of exhaled volatile organic compounds in the diagnosis of lung cancer. PLoS ONE 2017, 12, e0174802. [Google Scholar]
- Nag, S.; Castro, M.; Choudhary, V.; Feller, J.-F. Boosting Selectivity and Sensitivity to Biomarkers of Quantum Resistive Vapour Sensors Used for Volatolomics with Nanoarchitectured Carbon Nanotubes or Graphene Platelets Connected by Fullerene Junctions. Chemosensors 2021, 9, 66. [Google Scholar] [CrossRef]
- Sakumura, Y.; Koyama, Y.; Tokutake, H.; Hida, T.; Sato, K.; Itoh, T.; Akamatsu, T.; Shin, W. Diagnosis by Volatile Organic Compounds in Exhaled Breath from Lung Cancer Patients Using Support Vector Machine Algorithm. Sensors 2017, 17, 287. [Google Scholar] [CrossRef] [Green Version]
- Henderson, B.; Slingers, G.; Pedrotti, M.; Pugliese, G.; Malaskova, M.; Bryant, L.; Lomonaco, T.; Ghimenti, S.; Moreno, S.; Cordell, R.; et al. The peppermint breath test benchmark for PTR-MS and SIFT-MS. J. Breath Res. 2021, 15, 046005. [Google Scholar] [CrossRef]
- Agapiou, A.; Amann, A.; Mochalski, P.; Statheropoulos, M.; Thomas, C.L.P. Trace detection of endogenous human volatile organic compounds for search, rescue and emergency applications. TrAC Trends Anal. Chem. 2015, 66, 158–175. [Google Scholar] [CrossRef]
- Gessner, C.; Kuhn, H.; Toepfer, K.; Hammerschmidt, S.; Schauer, J.; Wirtz, H. Detection of p53 gene mutations in exhaled breath condensate of non-small cell lung cancer patients. Lung Cancer 2004, 43, 215–222. [Google Scholar] [CrossRef]
- Shende, P.; Vaidya, J.; Kulkarni, Y.A.; Gaud, R.S. Systematic approaches for biodiagnostics using exhaled air. J. Control. Release 2017, 268, 282–295. [Google Scholar] [CrossRef]
- Aghaei, S.M.; Aasi, A.; Farhangdoust, S.; Panchapakesan, B. Graphene-like BC6N nanosheets are potential candidates for detection of volatile organic compounds (VOCs) in human breath: A DFT study. Appl. Surf. Sci. 2021, 536, 147756. [Google Scholar] [CrossRef]
- Zhang, L.; Khan, K.; Zou, J.; Zhang, H.; Li, Y. Recent Advances in Emerging 2D Material-Based Gas Sensors: Potential in Disease Diagnosis. Adv. Mater. Interfaces 2019, 6, 1901329. [Google Scholar] [CrossRef]
- Gutes, A.; Hsia, B.; Sussman, A.; Mickelson, W.; Zettl, A.; Carraro, C.; Maboudian, R. Graphene decoration with metal nanoparticles: Towards easy integration for sensing applications. Nanoscale 2012, 4, 438–440. [Google Scholar] [CrossRef] [PubMed]
- Salehi-Khojin, A.; Estrada, D.; Lin, K.Y.; Bae, M.H.; Xiong, F.; Pop, E.; Masel, R.I. Polycrystalline graphene ribbons as chemiresistors. Adv. Mater. 2012, 24, 53–57. [Google Scholar] [CrossRef] [PubMed]
- Russo, P.A.; Donato, N.; Leonardi, S.G.; Baek, S.; Conte, D.E.; Neri, G.; Pinna, N. Room-temperature hydrogen sensing with heteronanostructures based on reduced graphene oxide and tin oxide. Angew. Chem. Int. Ed. 2012, 51, 11053–11057. [Google Scholar] [CrossRef]
- Hu, N.; Yang, Z.; Wang, Y.; Zhang, L.; Wang, Y.; Huang, X.; Wei, H.; Wei, L.; Zhang, Y. Ultrafast and sensitive room temperature NH3 gas sensors based on chemically reduced graphene oxide. Nanotechnology 2014, 25, 025502. [Google Scholar] [CrossRef]
- Gong, T.; Zhang, X.; Fu, Y.; Zhou, G.; Chi, H.; Li, T. A facile fabrication of colorimetric graphene oxide reflecting films for ultrasensitive optical gas sensing. Sens. Actuators B Chem. 2018, 261, 83–90. [Google Scholar] [CrossRef]
- Mei, Q.; Zhang, K.; Guan, G.; Liu, B.; Wang, S.; Zhang, Z. Highly efficient photoluminescent graphene oxide with tunable surface properties. Chem. Commun. 2010, 46, 7319–7321. [Google Scholar] [CrossRef]
- Chi, H.; Ze, L.J.; Zhou, X.; Wang, F. GO film on flexible substrate: An approach to wearable colorimetric humidity sensor. Dyes Pigm. 2021, 185, 108916. [Google Scholar] [CrossRef]
- Chi, H.; Xu, Z.; Duan, X.; Yang, J.; Wang, F.; Li, Z. High-Performance Colorimetric Room-Temperature NO2 Sensing Using Spin-Coated Graphene/Polyelectrolyte Reflecting Film. ACS Appl. Mater. Interfaces 2019, 11, 32390–32397. [Google Scholar] [CrossRef]
- Weimar, N.B.U. Conduction Model of Metal Oxide Gas Sensors. J. Electroceram. 2001, 7, 143–167. [Google Scholar]
- Jung, I.; Dikin, D.A.; Piner, R.D.; Ruoff, R. Tunable Electrical Conductivity of Individual Graphene Oxide Sheets Reduced at “Low” Temperatures. Nano Lett. 2008, 8, 4283–4287. [Google Scholar] [CrossRef] [PubMed]
- Deng, S.; Tjoa, V.; Fan, H.M.; Tan, H.R.; Sayle, D.C.; Olivo, M.; Mhaisalkar, S.; Wei, J.; Sow, C.H. Reduced graphene oxide conjugated Cu2O nanowire mesocrystals for high-performance NO2 gas sensor. J. Am. Chem. Soc. 2012, 134, 4905–4917. [Google Scholar] [CrossRef]
- Fan, X.; Elgamma, K.; Smith, A.D.; Östling, M.; Delin, A.; Lemme, M.C.; Niklaus, F. Humidity and CO2 gas sensing properties of double-layer graphene. Carbon 2018, 127, 576–587. [Google Scholar] [CrossRef]
- Seekaewa, Y.; Phokharatkul, D.; Wisitsoraatb, A.; Wongchoosuk, C. Highly sensitive and selective room-temperature NO2 gas sensor based on bilayer transferred chemical vapor deposited graphene. Appl. Surf. Sci. 2017, 404, 357–363. [Google Scholar] [CrossRef]
- Cazalas, E.; Childres, I.; Majcher, A.; Chung, T.-F.; Chen, Y.P.; Jovanovic, I. Hysteretic response of chemical vapor deposition graphene field effect transistors on SiC substrates. Appl. Phys. Lett. 2013, 103, 053123. [Google Scholar] [CrossRef]
- Konecny, M.; Bartosik, M.; Mach, J.; Svarc, V.; Nezval, D.; Piastek, J.; Prochazka, P.; Cahlik, A.; Sikola, T. Kelvin Probe Force Microscopy and Calculation of Charge Transport in a Graphene/Silicon Dioxide System at Different Relative Humidity. ACS Appl. Mater. Interfaces 2018, 10, 11987–11994. [Google Scholar] [CrossRef]
- Bartosik, M.; Mach, J.; Piastek, J.; Nezval, D.; Konecny, M.; Svarc, V.; Ensslin, K.; Sikola, T. Mechanism and Suppression of Physisorbed-Water-Caused Hysteresis in Graphene FET Sensors. ACS Sens. 2020, 5, 2940–2949. [Google Scholar] [CrossRef] [PubMed]
- Sobhanimatina, M.; Pourmahdian, S.; Tehranchi, M.M. Colorimetric Monitoring of Humidity by Opal Photonic Hydrogel. Polym. Test 2021, 98, 106999. [Google Scholar] [CrossRef]
- Jung, H.S.; Verwilst, P.; Kim, W.Y.; Kim, J.S. Fluorescent and colorimetric sensors for the detection of humidity or water content. Chem. Soc. Rev. 2016, 45, 1242–1256. [Google Scholar] [CrossRef]
- Nair, R.V.; Vijaya, R. Photonic crystal sensors: An overview. Prog. Quantum. Electron 2010, 34, 89–134. [Google Scholar] [CrossRef]
- Jung, S.-H.; Lee, H.T.; Park, M.J.; Lim, B.; Park, B.C.; Jung, Y.J.; Hoyoul, K.; Hwang, D.-H.; Lee, H.-i.; Park, J.M. Precisely Tunable Humidity Color Indicator Based on PhotonicPolymer Films. Macromolecules 2020, 54, 621–628. [Google Scholar] [CrossRef]
- Yu, L.; Xu, H.; Monro, T.M.; Lancaster, D.G.; Xie, Y.; Zeng, H.; Chen, G.Y.; Liu, X. Ultrafast colorimetric humidity-sensitive polyelectrolyte coating for touchless control. Mater. Horiz. 2017, 4, 72–82. [Google Scholar] [CrossRef]
- Dong, Z.; Zhang, N.; Wang, Y.; Wu, J.; Gan, Q.; Li, W. Photopatternable Nanolayered Polymeric Films with Fast Tunable Color Responses Triggered by Humidity. Adv. Funct. Mater. 2019, 29, 1904453. [Google Scholar] [CrossRef]
- Saha, A.; Tanaka, Y.; Han, Y.; Bastiaansen, C.M.; Broer, D.J.; Sijbesma, R.P. Irreversible visual sensing of humidity using a cholesteric liquid crystal. Chem. Commun. 2012, 48, 4579–4581. [Google Scholar] [CrossRef]
- Tsigara, A.; Mountrichas, G.; Gatsouli, K.; Nichelatti, A.; Pispas, S.; Madamopoulos, N.; Vainos, N.A.; Du, H.L.; Roubani-Kalantzopoulou, F. Hybrid polymer/cobalt chloride humidity sensors based on optical diffraction. Sens. Actuators B Chem. 2007, 120, 481–486. [Google Scholar] [CrossRef]
- Lassiter, J.B.; Sobhani, H.; Fan, J.A.; Kundu, J.; Capasso, F.; Nordlander, P.; Halas, N.J. Fano resonances in plasmonic nanoclusters: Geometrical and chemical tunability. Nano Lett. 2010, 10, 3184–3189. [Google Scholar] [CrossRef]
- Exline, M.C.; Stanacevic, M.; Bowman, A.S.; Gouma, P.I. Exhaled nitric oxide detection for diagnosis of COVID-19 in critically ill patients. PLoS ONE 2021, 16, e0257644. [Google Scholar] [CrossRef]
- Gao, J.; Wu, F. Association between fractional exhaled nitric oxide, sputum induction and peripheral blood eosinophil in uncontrolled asthma. Allergy Asthma Clin. Immunol. 2018, 14, 21. [Google Scholar] [CrossRef] [Green Version]
- Duong-Quy, S.; Vu-Minh, T.; Hua-Huy, T.; Tang-Thi-Thao, T.; Le-Quang, K.; Tran-Thanh, D.; Doan-Thi-Quynh, N.; Le-Dong, N.N.; Craig, T.J.; Dinh-Xuan, A.T. Study of nasal exhaled nitric oxide levels in diagnosis of allergic rhinitis in subjects with and without asthma. J. Asthma Allergy 2017, 10, 75–82. [Google Scholar] [CrossRef] [Green Version]
- Keyaerts, E.; Vijgen, L.; Chen, L.; Maes, P.; Hedenstierna, G.; Van Ranst, M. Inhibition of SARS-coronavirus infection in vitro by S-nitroso-N-acetylpenicillamine, a nitric oxide donor compound. Int. J. Infect. Dis. 2004, 8, 223–226. [Google Scholar] [CrossRef] [PubMed] [Green Version]
- Hu, L.; Gao, S.; Ding, X.; Wang, D.; Jiang, J.; Jin, J.; Jiang, L. Photothermal-Responsive Single-Walled Carbon Nanotube-Based Ultrathin Membranes for On/Off Switchable Separation of Oil-in-Water Nanoemulsions. ACS Nano 2015, 9, 4835–4842. [Google Scholar] [CrossRef]
- Zhang, P.; Liu, H.; Li, X. Plasmonic CuCo/Carbon Dots: An Unconventional Photocatalyst Used for Photocatalytic Overall Water Splitting. ACS Sustain. Chem. Eng. 2020, 8, 17979–17987. [Google Scholar] [CrossRef]
- Malinski, T. Nitric Oxide and Nitroxidative Stress in Alzheimer’s Disease. J. Alzheimer’s Dis. 2007, 11, 207–218. [Google Scholar] [CrossRef]
- Pitsikas, N. The role of nitric oxide (NO) donors in anxiety. Lights and shadows. Nitric Oxide 2018, 77, 6–11. [Google Scholar] [CrossRef]
- Jiang, S.; Cheng, R.; Wang, X.; Xue, T.; Liu, Y.; Nel, A.; Huang, Y.; Duan, X. Real-time electrical detection of nitric oxide in biological systems with sub-nanomolar sensitivity. Nat. Commun. 2013, 4, 2225. [Google Scholar] [CrossRef] [PubMed] [Green Version]
- Zhou, J.; Wu, R.; Fu, X.; Wu, J.; Mei, Q. Ratio-Adjustable Upconversion Luminescence Nanoprobe for Ultrasensitive In Vitro Diagnostics. Anal. Chem. 2021, 93, 9299–9303. [Google Scholar] [CrossRef] [PubMed]
- Deng, X.; Zou, Z.; Zhang, Y.; Gao, J.; Liang, T.; Lu, Z.; Ming Li, C. Synthesis of merit-combined antimony tetroxide nanoflowers/reduced graphene oxide to synergistically boost real-time detection of nitric oxide released from living cells for high sensitivity. J. Colloid Interface Sci. 2021, 581, 465–474. [Google Scholar] [CrossRef]
- Mathew, G.; Narayanan, N.; Abraham, D.A.; De, M.; Neppolian, B. Facile Green Approach for Developing Electrochemically Reduced Graphene Oxide-Embedded Platinum Nanoparticles for Ultrasensitive Detection of Nitric Oxide. ACS Omega 2021, 6, 8068–8080. [Google Scholar] [CrossRef] [PubMed]
- Qu, Z.B.; Zhou, X.; Zhang, M.; Shen, J.; Li, Q.; Xu, F.; Kotov, N.; Fan, C. Metal-Bridged Graphene-Protein Supraparticles for Analog and Digital Nitric Oxide Sensing. Adv. Mater. 2021, 33, e2007900. [Google Scholar] [CrossRef] [PubMed]
- Xu, B.; Huang, J.; Xu, X.; Zhou, A.; Ding, L. Ultrasensitive NO Gas Sensor Based on the Graphene Oxide-Coated Long-Period Fiber Grating. ACS Appl. Mater. Interfaces 2019, 11, 40868–40874. [Google Scholar] [CrossRef] [PubMed]
- Qiu, J.; Hu, X.; Min, X.; Quan, W.; Tian, R.; Ji, P.; Zheng, H.; Qin, W.; Wang, H.; Pan, T.; et al. Observation of Switchable Dual-Conductive Channels and Related Nitric Oxide Gas-Sensing Properties in the N-rGO/ZnO Heterogeneous Structure. ACS Appl. Mater. Interfaces 2020, 12, 19755–19767. [Google Scholar] [CrossRef] [PubMed]
- Li, W.; Geng, X.; Guo, Y.; Rong, J.; Gong, Y.; Wu, L.; Zhang, X.; Li, P.; Xu, J.; Cheng, G.; et al. Reduced Graphene Oxide Electrically Contacted Graphene Sensor for Highly Sensitive Nitric Oxide Detection. ACS Nano 2011, 5, 6955–6961. [Google Scholar] [CrossRef]
- Kim, S.; Kwak, D.H.; Choi, I.; Hwang, J.; Kwon, B.; Lee, E.; Ye, J.; Lim, H.; Cho, K.; Chung, H.J.; et al. Enhanced Gas Sensing Properties of Graphene Transistor by Reduced Doping with Hydrophobic Polymer Brush as a Surface Modification Layer. ACS Appl. Mater. Interfaces 2020, 12, 55493–55500. [Google Scholar] [CrossRef]
- Sun, J.; Shu, X.; Tian, Y.; Tong, Z.; Bai, S.; Luo, R.; Li, D.; Liu, C.C. Facile preparation of polypyrrole-reduced graphene oxide hybrid for enhancing NH3 sensing at room temperature. Sens. Actuators B Chem. 2017, 241, 658–664. [Google Scholar] [CrossRef]
- Hsieh, C.-H.; Xu, L.-H.; Wang, J.-M.; Wu, T.-M. Fabrication of polypyrrole/tin oxide/graphene nanoribbon ternary nanocomposite and its high-performance ammonia gas sensing at room temperature. Mater. Sci. Eng. B 2021, 272, 115317. [Google Scholar] [CrossRef]
- Falak, A.; Tian, Y.; Yan, L.; Xu, L.; Song, Z.; Hu, H.; Dong, F.; Adamu, B.I.; Zhao, M.; Chen, P.; et al. Ultrathin MoOx/Graphene Hybrid Field Effect Transistor Sensors Prepared Simply by a Shadow Mask Approach for Selective ppb-Level NH3 Sensing with Simultaneous Superior Response and Fast Recovery. Adv. Mater. Interfaces 2020, 7, 1902002. [Google Scholar] [CrossRef]
- Kim, Y.J.; Kang, H.J.; Moerk, C.T.; Lee, B.-T.; Choi, J.S.; Yim, J.-H. Flexible, biocompatible, and electroconductive Polyurethane foam composites coated with graphene oxide for ammonia detection. Sens. Actuators B Chem. 2021, 344, 130269. [Google Scholar] [CrossRef]
- Javadian-Saraf, A.; Hosseini, E.; Wiltshire, B.D.; Zarifi, M.H.; Arjmand, M. Graphene oxide/polyaniline-based microwave split-ring resonator: A versatile platform towards ammonia sensing. J. Hazard. Mater. 2021, 418, 126283. [Google Scholar] [CrossRef]
- Popa, C.; Petrus, M.; Bratu, A.M. Ammonia and ethylene biomarkers in the respiration of the people with schizophrenia using photoacoustic spectroscopy. J. Biomed. Opt. 2015, 20, 57006. [Google Scholar] [CrossRef]
- Wojtas, J.; Tittel, F.K.; Stacewicz, T.; Bielecki, Z.; Lewicki, R.; Mikolajczyk, J.; Nowakowski, M.; Szabra, D.; Stefanski, P.; Tarka, J. Cavity-Enhanced Absorption Spectroscopy and Photoacoustic Spectroscopy for Human Breath Analysis. Int. J. Thermophys. 2014, 35, 2215–2225. [Google Scholar] [CrossRef]
- Seerangaiyan, K.; Juch, F.; Winkel, E.G. Tongue coating: Its characteristics and role in intra-oral halitosis and general health-a review. J. Breath Res. 2018, 12, 034001. [Google Scholar] [CrossRef]
- Seemann, R.; Conceicao, M.D.; Filippi, A.; Greenman, J.; Lenton, P.; Nachnani, S.; Quirynen, M.; Roldan, S.; Schulze, H.; Sterer, N.; et al. Halitosis management by the general dental practitioner--results of an international consensus workshop. J. Breath Res. 2014, 8, 017101. [Google Scholar] [CrossRef] [PubMed] [Green Version]
- Zhang, L.; Zhou, L.; Xu, N.; Ouyang, Z. A Carbon Dioxide Bubble-Induced Vortex Triggers Co-Assembly of Nanotubes with Controlled Chirality. Angew. Chem. 2017, 129, 8303–8307. [Google Scholar] [CrossRef]
- Tong, G.; Guan, J.; Zhang, Q. In Situ Generated Gas Bubble-Directed Self-Assembly: Synthesis, and Peculiar Magnetic and Electrochemical Properties of Vertically Aligned Arrays of High-Density Co3O4 Nanotubes. Adv. Funct. Mater. 2013, 23, 2406–2414. [Google Scholar] [CrossRef]
- Song, Z.; Yan, J.; Lian, J.; Pu, W.; Jing, L.; Xu, H.; Li, H. Graphene Oxide-Loaded SnO2 Quantum Wires with Sub-4 Nanometer Diameters for Low-Temperature H2S Gas Sensing. ACS Appl. Nano Mater. 2020, 3, 6385–6393. [Google Scholar] [CrossRef]
- Shewale, P.S.; Yun, K.-S. Synthesis and characterization of Cu-doped ZnO/RGO nanocomposites for room-temperature H2S gas sensor. J. Alloys Compd. 2020, 837, 155527. [Google Scholar] [CrossRef]
- Reddeppa, M.; Park, B.-G.; Kim, M.-D.; Peta, K.R.; Chinh, N.D.; Kim, D.; Kim, S.-G.; Murali, G. H2, H2S gas sensing properties of rGO/GaN nanorods at room temperature: Effect of UV illumination. Sens. Actuators B Chem. 2018, 264, 353–362. [Google Scholar] [CrossRef]
- Shanmugasundaram, A.; Chinh, N.D.; Jeong, Y.-J.; Hou, T.F.; Kim, D.-S.; Kim, D.; Kim, Y.-B.; Lee, D.-W. Hierarchical nanohybrids of B- and N-codoped graphene/mesoporous NiO nanodisks: An exciting new material for selective sensing of H2S at near ambient temperature. J. Mater. Chem. A 2019, 7, 9263–9278. [Google Scholar] [CrossRef]
- Balasubramani, V.; Ahamed, A.N.; Chandraleka, S.; Kumar, K.K.; Kuppusamy, M.R.; Sridhar, T.M. Highly Sensitive and Selective H2S Gas Sensor Fabricated with β-Ga2O3/rGO. ECS J. Solid State Sci. Technol. 2020, 9, 055009. [Google Scholar] [CrossRef]
- Peng, F.; Wang, S.; Yu, W.; Huang, T.; Sun, Y.; Cheng, C.; Chen, X.; Hao, J.; Dai, N. Ultrasensitive ppb-level H2S gas sensor at room temperature based on WO3/rGO hybrids. J. Mater. Sci. Mater. Electron 2020, 31, 5008–5016. [Google Scholar] [CrossRef]
- Shao, S.; Chen, X.; Chen, Y.; Zhang, L.; Kim, H.W.; Kim, S.S. ZnO Nanosheets Modified with Graphene Quantum Dots and SnO2 Quantum Nanoparticles for Room-Temperature H2S Sensing. ACS Appl. Nano Mater. 2020, 3, 5220–5230. [Google Scholar] [CrossRef]
- Deji, R.; Choudhary, B.C.; Sharma, R.K. Hydrogen sulfide gas sensor using osmium doped graphene nanoribbon: An insights from DFT study. Mater. Lett. 2022, 306, 130986. [Google Scholar]
- Lord, H.; Yu, Y.; Segal, A.; Pawliszy, J. Breath Analysis and Monitoring by Membrane Extraction with Sorbent Interface. Anal. Chem. 2002, 74, 5650–5657. [Google Scholar] [CrossRef] [PubMed]
- Yu, H.; Xu, P.; Lee, D.W.; Li, X. Porous-layered stack of functionalized AuNP–rGO (gold nanoparticles–reduced graphene oxide) nanosheets as a sensing material for the micro-gravimetric detection of chemical vapor. J. Mater. Chem. A 2013, 1, 4444. [Google Scholar] [CrossRef]
- Ionescu, R.; Broza, Y.; Shaltieli, H.; Sadeh, D.; Zilberman, Y.; Feng, X.; Glass-Marmor, L.; Lejbkowicz, I.; Mullen, K.; Miller, A.; et al. Detection of multiple sclerosis from exhaled breath using bilayers of polycyclic aromatic hydrocarbons and single-wall carbon nanotubes. ACS Chem. Neurosci. 2011, 2, 687–693. [Google Scholar] [CrossRef] [PubMed] [Green Version]
- Mazzatenta, A.; Pokorski, M.; Sartucci, F.; Domenici, L.; Di Giulio, C. Volatile organic compounds (VOCs) fingerprint of Alzheimer’s disease. Respir. Physiol. Neurobiol. 2015, 209, 81–84. [Google Scholar] [CrossRef] [PubMed]
- Ghazi, M.; Janfaza, S.; Tahmooressi, H.; Tasnim, N.; Hoorfar, M. Selective detection of VOCs using microfluidic gas sensor with embedded cylindrical microfeatures coated with graphene oxide. J. Hazard. Mater. 2021, 424, 127566. [Google Scholar] [CrossRef] [PubMed]
- Lu, T.; Al-Hamry, A.; Rosolen, J.M.; Hu, Z.; Hao, J.; Wang, Y.; Adiraju, A.; Yu, T.; Matsubara, E.Y.; Kanoun, O. Flexible Impedimetric Electronic Nose for High-Accurate Determination of Individual Volatile Organic Compounds by Tuning the Graphene Sensitive Properties. Chemosensors 2021, 9, 360. [Google Scholar] [CrossRef]
- Kalidoss, R.; Umapathy, S.; Anandan, R.; Ganesh, V.; Sivalingam, Y. Comparative Study on the Preparation and Gas Sensing Properties of Reduced Graphene Oxide/SnO2 Binary Nanocomposite for Detection of Acetone in Exhaled Breath. Anal. Chem. 2019, 91, 5116–5124. [Google Scholar] [CrossRef]
- Pargoletti, E.; Verga, S.; Chiarello, G.L.; Longhi, M.; Cerrato, G.; Giordana, A.; Cappelletti, G. Exploring SnxTi1-xO2 Solid Solutions Grown onto Graphene Oxide (GO) as Selective Toluene Gas Sensors. Nanomaterials 2020, 10, 716. [Google Scholar] [CrossRef] [Green Version]
- Jia, X.; Yu, S.; Cheng, C.; Yang, J.; Li, Y.; Wang, S.; Song, H. Ag nanoparticles modified Fe3O4/reduced graphene oxide and their acetone sensing properties. Mater. Chem. Phys. 2022, 276, 125378. [Google Scholar] [CrossRef]
- Gautam, V.; Kumar, A.; Kumar, R.; Jain, V.K.; Nagpal, S. Silicon nanowires/reduced graphene oxide nanocomposite based novel sensor platform for detection of cyclohexane and formaldehyde. Mater. Sci. Semicond. Process. 2021, 123, 105571. [Google Scholar] [CrossRef]
- Tung, T.T.; Tran, M.T.; Feller, J.-F.; Castro, M.; Van Ngo, T.; Hassan, K.; Nine, M.J.; Losic, D. Graphene and metal organic frameworks (MOFs) hybridization for tunable chemoresistive sensors for detection of volatile organic compounds (VOCs) biomarkers. Carbon 2020, 159, 333–344. [Google Scholar] [CrossRef]
- Jones, A.W. Urine as a Biological Specimen for Forensic Analysis of Alcohol and Variability in the Urine-to-Blood Relationship. Toxicol. Rev. 2006, 25, 15–35. [Google Scholar] [CrossRef]
- Fan, G.T.; Yang, C.L.; Lin, C.H.; Chen, C.C.; Shih, C.H. Applications of Hadamard transform-gas chromatography/mass spectrometry to the detection of acetone in healthy human and diabetes mellitus patient breath. Talanta 2014, 120, 386–390. [Google Scholar] [CrossRef]
- Yempally, S.; Hegazy, S.M.; Aly, A.; Kannan, K.; Sadasivuni, K.K. Non-Invasive Diabetic Sensor Based on Cellulose Acetate/Graphene Nanocomposite. Macromol. Symp. 2020, 392, 2000024. [Google Scholar] [CrossRef]
| Diseases | Gas | Normal Range | Symptoms Range | References |
|---|---|---|---|---|
| bromopnea | Hydrogen sulfide | <0.1 ppm | 0.1–0.5 ppm | [8] |
| renal disease | Trimethylamine | <1.75 ppb | 1.75–38.02 ppb | [9] |
| Isoprene | 28–144 ppb | 57–329.8 ppb | [9] | |
| diabetes | Acetone | 300–900 ppb | ≥1800 ppb | [10] |
| Ammonia | 74–2935 ppb | 2935–6770 ppb | [11] | |
| lung cancer | Methanol | 157–344 ppb | >344 ppb | [12] |
| Ethanol | 96–2848 ppb | >2848 ppb | [12] | |
| Toluene | 1–18 ppb | ≥18 ppb | [13] | |
| Benzene | 1.1–3.5 ppb | >3.5 ppb | [12] | |
| asthma | Nitric oxide | <25 ppb | >50 ppb | [14] |
| cancer | Cyclohexane | 0.1–15 ppb | >15 ppb | [15] |
| Chloroform | <10 ppb | ≥10 ppb | [15] |
| Material | Gas | Detection Limit | Response/Restore Time | Reference |
|---|---|---|---|---|
| Pd–rGO | NO | 2–420 ppb | 1000 s–1 h | [62] |
| Sub–graphene–hemin | NO | 0.3 nM | 47–54 ms | [55] |
| GQD–Tb3+–SOD | NO | 600 molecules/mL | 500 s | [59] |
| LPFG coated with GO | NO | 0–400 ppm | 23.6 min/N.A. | [60] |
| N–rGO/ZnO | NO | 100 ppb | 522/303 s | [61] |
| 300 ppb | 478/410 s | |||
| 800 ppb | 284/473 s | |||
| Graphene/PS brush | NH3 | ≥4.88 ppb | 150 s/N.A. | [63] |
| PPy | NH3 | 7.6 ppm | 105/182 s | [7] |
| PPy/GO | NH3 | 0.90 ppm | 81/116 s | |
| PPy/rGO | NH3 | 0.035 ppm | 72/151 s | |
| PPy/srGO | NH3 | 0.00020 ppm | 48/234 s | |
| PPy–rGO | NH3 | 10 ppm | ~100 s | [64] |
| PPy/SnO2/GNR | NH3 | ≥0.6 ppm | ~100 s/200 s | [65] |
| MoOx/GFET | NH3 | ≥310 ppb | 356 s | [66] |
| PUF–PPy–GO | NH3 | 1.1–182 ppm | ~7/13 s | [67] |
| GO–PANI | NH3 | 1 ppm | ~5/10 min | [68] |
| Materials | Gas | Detection Limit | Response/Recovery Time (s) | References |
|---|---|---|---|---|
| Au NPs–rGO | TMA | ≥5 ppm | ~30 | [84] |
| C60–g–CNT | ethanol | ≥400 ppb | ~300/400 | [11] |
| methanol | ≥400 ppb | ~300/400 | ||
| acetone | ≥400 ppb | ~300/400 | ||
| chloroform | ≥400 ppb | ~300/400 | ||
| toluene | ≥400 ppb | ~300/400 | ||
| cyclohexane | ≥400 ppb | ~300/400 | ||
| C60–g–rGO | ethanol | ≥400 ppb | ~300/400 | [11] |
| methanol | ≥400 ppb | ~300/400 | ||
| acetone | ≥400 ppb | ~300/400 | ||
| chloroform | ≥400 ppb | ~300/400 | ||
| toluene | ≥400 ppb | ~300/400 | ||
| cyclohexane | ≥400 ppb | ~300/400 | ||
| (Parylene C and GO) MS | toluene | 100–300 ppm | 164/412 | [87] |
| eG | acetaldehyd | ≥10 ppm | N.A. | [88] |
| GO thin film | ethanol | >80 ppm | N.A. | |
| rGO/SnO2 | acetone | 0.25–30 ppm | 24/30 (5 ppm) | [89] |
| SnxTi1−xO2/GO | toluene | 100 ppb | N.A. | [90] |
| acetone | 200 ppb | N.A. | ||
| Ag/Fe3O4/rGO | acetone | 35.81–50 ppm | ~50/70 | [91] |
| SiNW/rGO | acetaldehyd | 1 ppm | 30/180 | [92] |
| cyclohexane | 1 ppm | 30/60~120 |
Publisher’s Note: MDPI stays neutral with regard to jurisdictional claims in published maps and institutional affiliations. |
© 2022 by the authors. Licensee MDPI, Basel, Switzerland. This article is an open access article distributed under the terms and conditions of the Creative Commons Attribution (CC BY) license (https://creativecommons.org/licenses/by/4.0/).
Share and Cite
Yang, X.; Chi, H.; Tian, Y.; Li, T.; Wang, Y. Research Progress of Graphene and Its Derivatives towards Exhaled Breath Analysis. Biosensors 2022, 12, 48. https://doi.org/10.3390/bios12020048
Yang X, Chi H, Tian Y, Li T, Wang Y. Research Progress of Graphene and Its Derivatives towards Exhaled Breath Analysis. Biosensors. 2022; 12(2):48. https://doi.org/10.3390/bios12020048
Chicago/Turabian StyleYang, Xinxiu, Hong Chi, Yong Tian, Tianduo Li, and Yaoguang Wang. 2022. "Research Progress of Graphene and Its Derivatives towards Exhaled Breath Analysis" Biosensors 12, no. 2: 48. https://doi.org/10.3390/bios12020048
APA StyleYang, X., Chi, H., Tian, Y., Li, T., & Wang, Y. (2022). Research Progress of Graphene and Its Derivatives towards Exhaled Breath Analysis. Biosensors, 12(2), 48. https://doi.org/10.3390/bios12020048