Article

Design of Nanoscaled Surface Morphology of TiO2–Ag2O Composite Nanorods through Sputtering Decoration Process and Their Low-Concentration NO2 Gas-Sensing Behaviors

Department of Optoelectronics and Materials Technology, National Taiwan Ocean University, Keelung 20224, Taiwan
*
Author to whom correspondence should be addressed.
Nanomaterials 2019, 9(8), 1150; https://doi.org/10.3390/nano9081150
Submission received: 1 August 2019 / Revised: 8 August 2019 / Accepted: 9 August 2019 / Published: 11 August 2019

Abstract

:
TiO2–Ag2O composite nanorods with various Ag2O configurations were synthesized by a two-step process, in which the core TiO2 nanorods were prepared by the hydrothermal method and subsequently the Ag2O crystals were deposited by sputtering deposition. Two types of the TiO2–Ag2O composite nanorods were fabricated; specifically, discrete Ag2O particle-decorated TiO2 composite nanorods and layered Ag2O-encapsulated TiO2 core–shell nanorods were designed by controlling the sputtering duration of the Ag2O. The structural analysis revealed that the TiO2–Ag2O composite nanorods have high crystallinity. Moreover, precise control of the Ag2O sputtering duration realized the dispersive decoration of the Ag2O particles on the surfaces of the TiO2 nanorods. By contrast, aggregation of the massive Ag2O particles occurred with a prolonged Ag2O sputtering duration; this engendered a layered coverage of the Ag2O clusters on the surfaces of the TiO2 nanorods. The TiO2–Ag2O composite nanorods with different Ag2O coverage morphologies were used as chemoresistive sensors for the detection of trace amounts of NO2 gas. The NO2 gas-sensing performances of various TiO2–Ag2O composite nanorods were compared with that of pristine TiO2 nanorods. The underlying mechanisms for the enhanced sensing performance were also discussed.

1. Introduction

The development of chemosensors made from semiconductor oxides has recently become a key research topic [1,2]. Therefore, the development of highly responsive sensing oxide devices toward specific harmful gases has attracted interest in industry. For the gas sensor applications, one-dimensional (1D) metal oxides usually show better performance in comparison with their thin-film or bulk counterparts because of their high surface-to-volume ratio [3,4,5,6]. In particular, gas sensors based on 1D titanium dioxide (TiO2) nanostructures have received considerable attention because they can be fabricated with diverse chemical and physical methods; moreover, TiO2 has been shown to be favorable for the detection of diverse harmful gases and volatile organic vapors at elevated temperatures [5,7,8].
Recently, combining n-type oxides with p-type semiconductor oxides to form a heterogeneous structure has attracted great attention due to this combination’s enhanced gas-sensing performance toward target gases [9,10,11]. The existence of the interfacial potential barrier at the p–n junctions of the heterogeneous structure play an important role in improving the gas-sensing performance of the constituent oxides. Several p–n junction-based sensors made from different material systems and configurations have been proposed. For examples, Woo et al. reported a discrete configuration of p-type Cr2O3 nanoparticles on the surfaces of ZnO nanowires; this p–n heterostructure enhances gas selectivity and sensitivity toward trimethylamine [11]. The decoration of NiO nanoparticles in porous SnO2 nanorods remarkably enhances the gas-sensing response to ethanol as compared with pristine SnO2, which can be attributed to the formation of NiO–SnO2 p–n heterojunctions [12]. P-type Ag2O phase-functionalized In2O3 nanowires shows an improved gas-sensing performance toward NO2 gas [13]. However, reports on the incorporation of p-type oxides into n-type TiO2 nanostructures to form a p–n junction gas sensor are limited in number.
In this study, 1D TiO2–Ag2O p–n heterogeneous structures are synthesized through the combination of hydrothermal growth and sputtering methods. Ag2O is a p-type semiconductor oxide; it has previously been used as a gas-sensing material [13]. Moreover, Ag2O crystals with various morphologies can be synthesized through chemical or physical routes [14,15,16]. Notably, Ag2O particles are mostly synthesized through chemical routes but, using such chemical routes, it is hard to control the decoration morphology of the Ag2O crystals on 1D nanostructures [15]. By contrast, the fabrication of Ag2O through a physical method (sputtering) is advantageous concerning the control of the Ag2O content, crystalline quality, and coverage morphology on 1D TiO2. In this study, two types of TiO2–Ag2O composite nanorods are synthesized. By controlling the sputtering duration of the Ag2O, discrete Ag2O particle-decorated TiO2 nanorods and Ag2O layers encapsulating TiO2 nanorods are fabricated. The Ag2O coverage morphology effects on the low-concentration NO2 gas-sensing performance of the TiO2–Ag2O p–n composite nanorods are systematically investigated in this study.

2. Materials and Methods

In this study, TiO2 nanorods were grown on fluorine-doped SnO2 (FTO) glass substrates. First, 0.25 mL of TiCl4 and 19 mL HCl were added to 11 mL deionized water and then stirred to obtain a transparent solution for the hydrothermal growth of TiO2 nanorods. The hydrothermal reaction was conducted at 180 °C for 3 h. For the preparation of TiO2–Ag2O composite nanorods, Ag2O crystals were decorated onto the surfaces of the TiO2 nanorod template via sputtering. Radiofrequency magnetron sputtering of Ag2O was conducted using a silver metallic target in an Ar/O2 (Ar:O2 = 5:2) mixed ambient. The sputtering deposition temperature of the Ag2O was maintained at 200 °C. The gas pressure during sputtering deposition was fixed at 20 mTorr and the sputtering power was fixed at 50 W for the silver target. Two sets of TiO2–Ag2O composite nanorods with Ag2O sputtering durations of 130 s and 270 s were prepared; these were represented as TiO2–Ag2O-1 and TiO2–Ag2O-2, respectively, in this study. The sample configurations of the TiO2–Ag2O-1 and TiO2–Ag2O-2 composite nanorods are shown in Figure 1.
An X-ray diffractometer (XRD; D2 PHASER, Bruker, Karlsruhe, Germany) was used to analyze the crystal structures of the TiO2–Ag2O composite nanorods. Scanning electron microscopy (SEM; S-4800, Hitachi, Tokyo, Japan) and transmission electron microscopy (HRTEM; JEM-2100F, JEOL Tokyo, Japan) were used to characterize the morphology and detailed microstructures of the composite nanorod samples. The attached energy dispersive X-ray spectroscopy (EDS) of TEM was used to investigate the composition and composition distribution of the nanorod samples. Moreover, X-ray photoelectron spectroscopy (XPS; ULVAC-PHI XPS, ULVAC, Chigasaki, Japan) was used to characterize the elemental binding states of the synthesized samples.
The response of pure TiO2 nanorods and the TiO2–Ag2O nanocomposites to NO2 was tested in a vacuum test chamber. Silver electrodes were laid on the surfaces of the samples to form electric contacts for measurements. An Agilent B2911A meter measured the resistance variation of the nanorod sensors at a constant potential of 5 V as a function of time. Constant dry air was used as the carrier gas and the desired concentration of NO2 gas (0.5, 1.5, 3.0 ppm) was introduced into the test chamber. A direct heating approach was used to operate the sensors at elevated temperatures in the range of 200–300 °C.

3. Results and Discussion

X-ray diffractometer (XRD) patterns of TiO2–Ag2O composite nanorods with various Ag
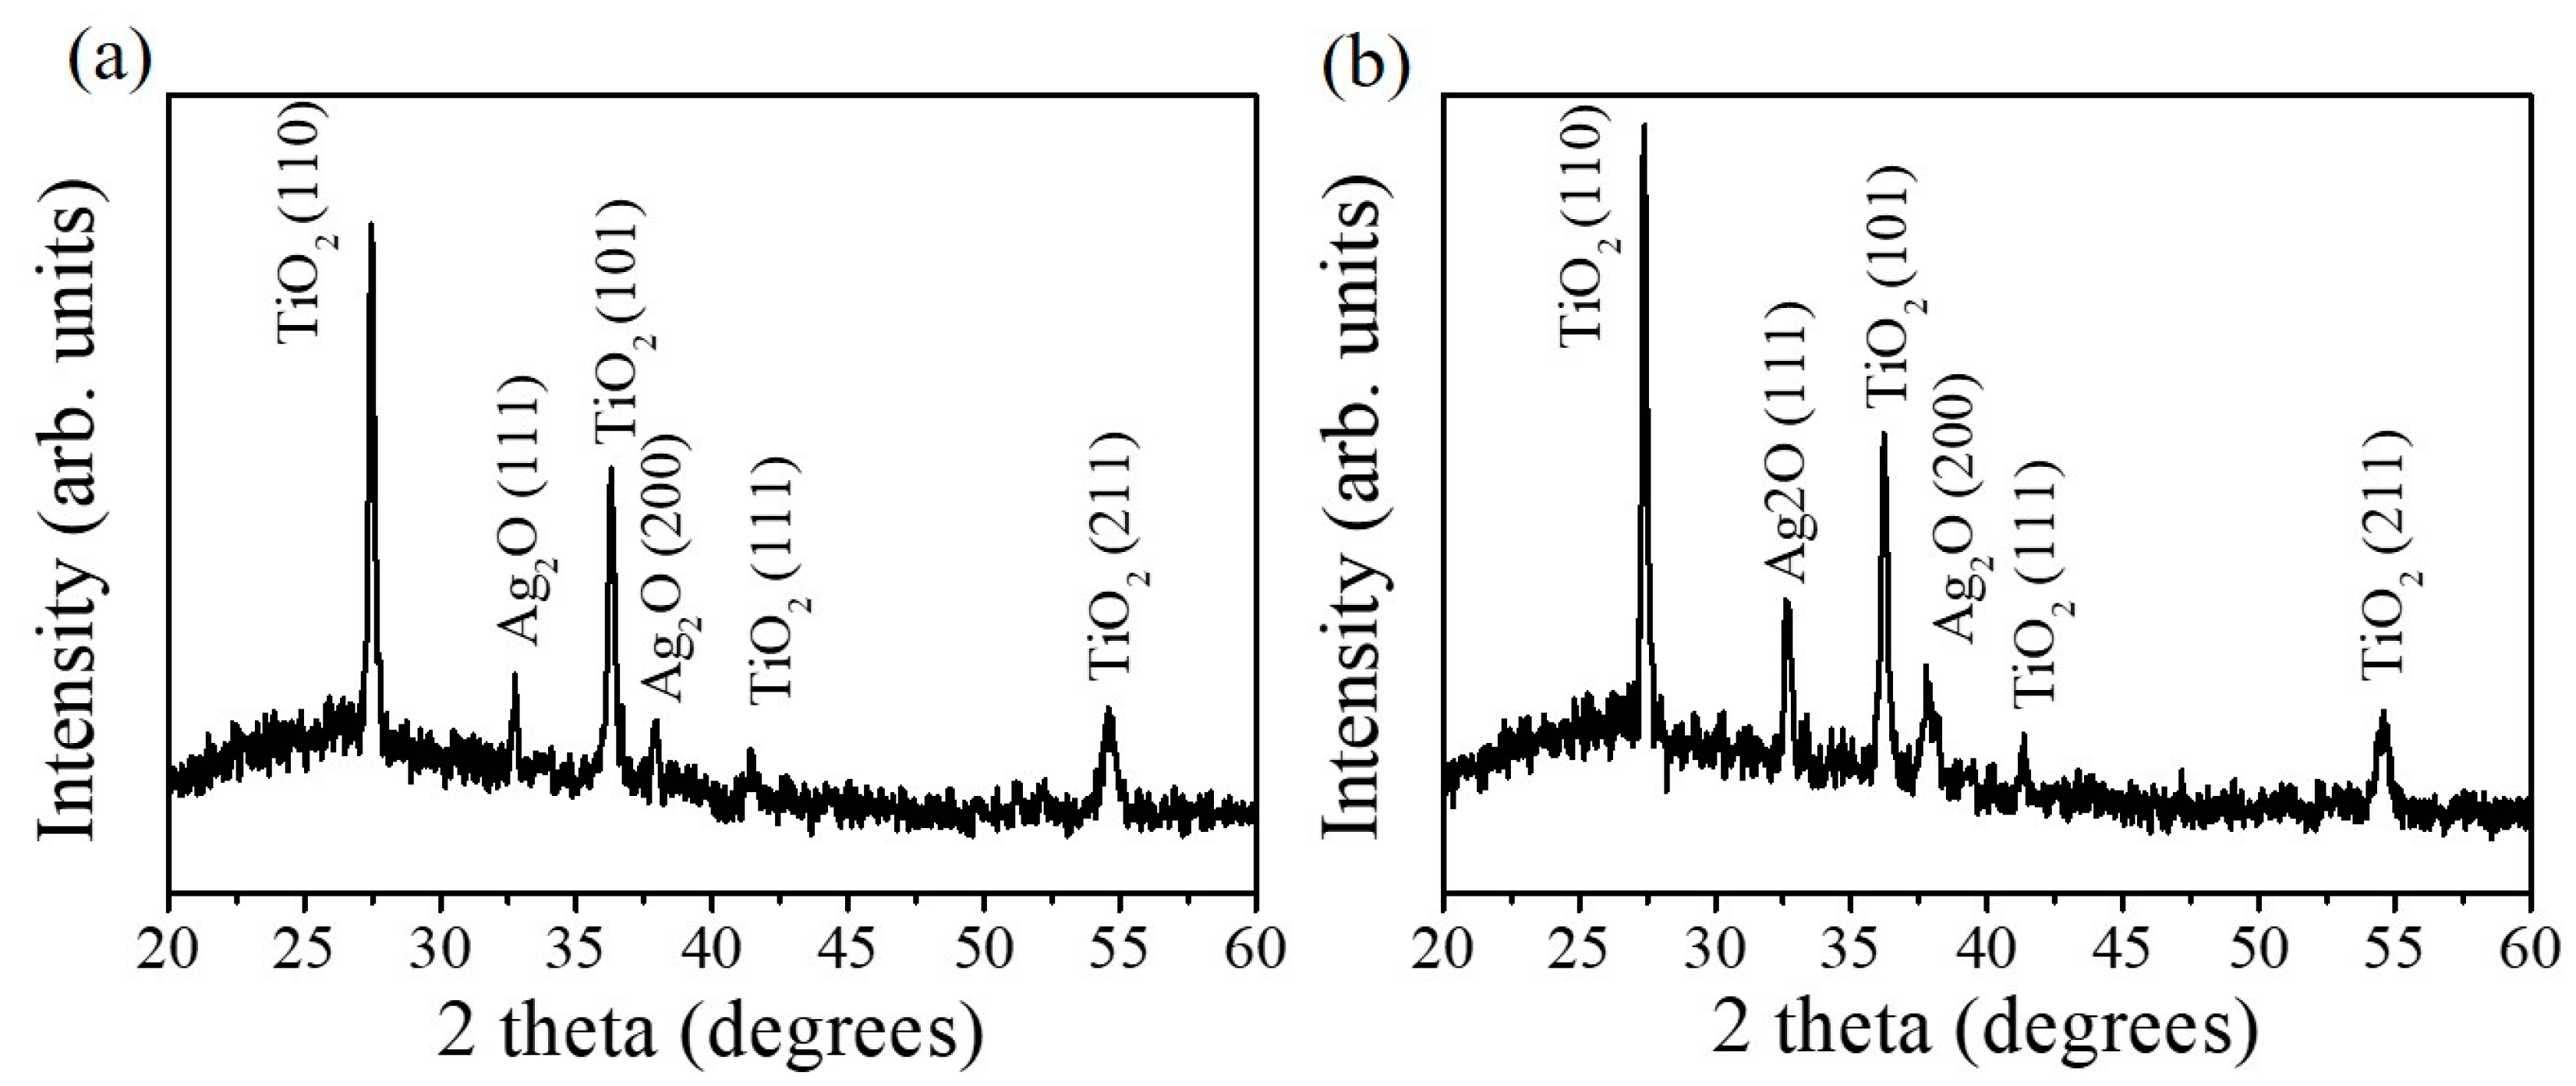
2O thin-film sputtering durations are shown in Figure 2. The distinct Bragg reflections centered at 27.46°, 36.05°, 41.22°, and 54.33° correspond to the crystallographic planes (110), (101), (111), and (211) of the rutile TiO2 phase, respectively (JCPDS no. 00-004-0551). Moreover, the Bragg reflections centered at 32.72 ° and 37.98 ° are assigned to the crystallographic planes of cubic Ag2O (111) and (200), respectively (JCPDS no. 00-012-0793). The XRD results reveal that highly crystalline rutile TiO2-cubic Ag2O composite nanorods were formed through the sputtering deposition of Ag2O thin films onto the surfaces of the TiO2 nanorods, and no other impurity peak was observed. As expected, the intensity of the Ag2O Bragg reflections peaks increased with the increase of the Ag2O thin-film sputtering duration, revealing an increased Ag2O phase content in the composite nanorods.
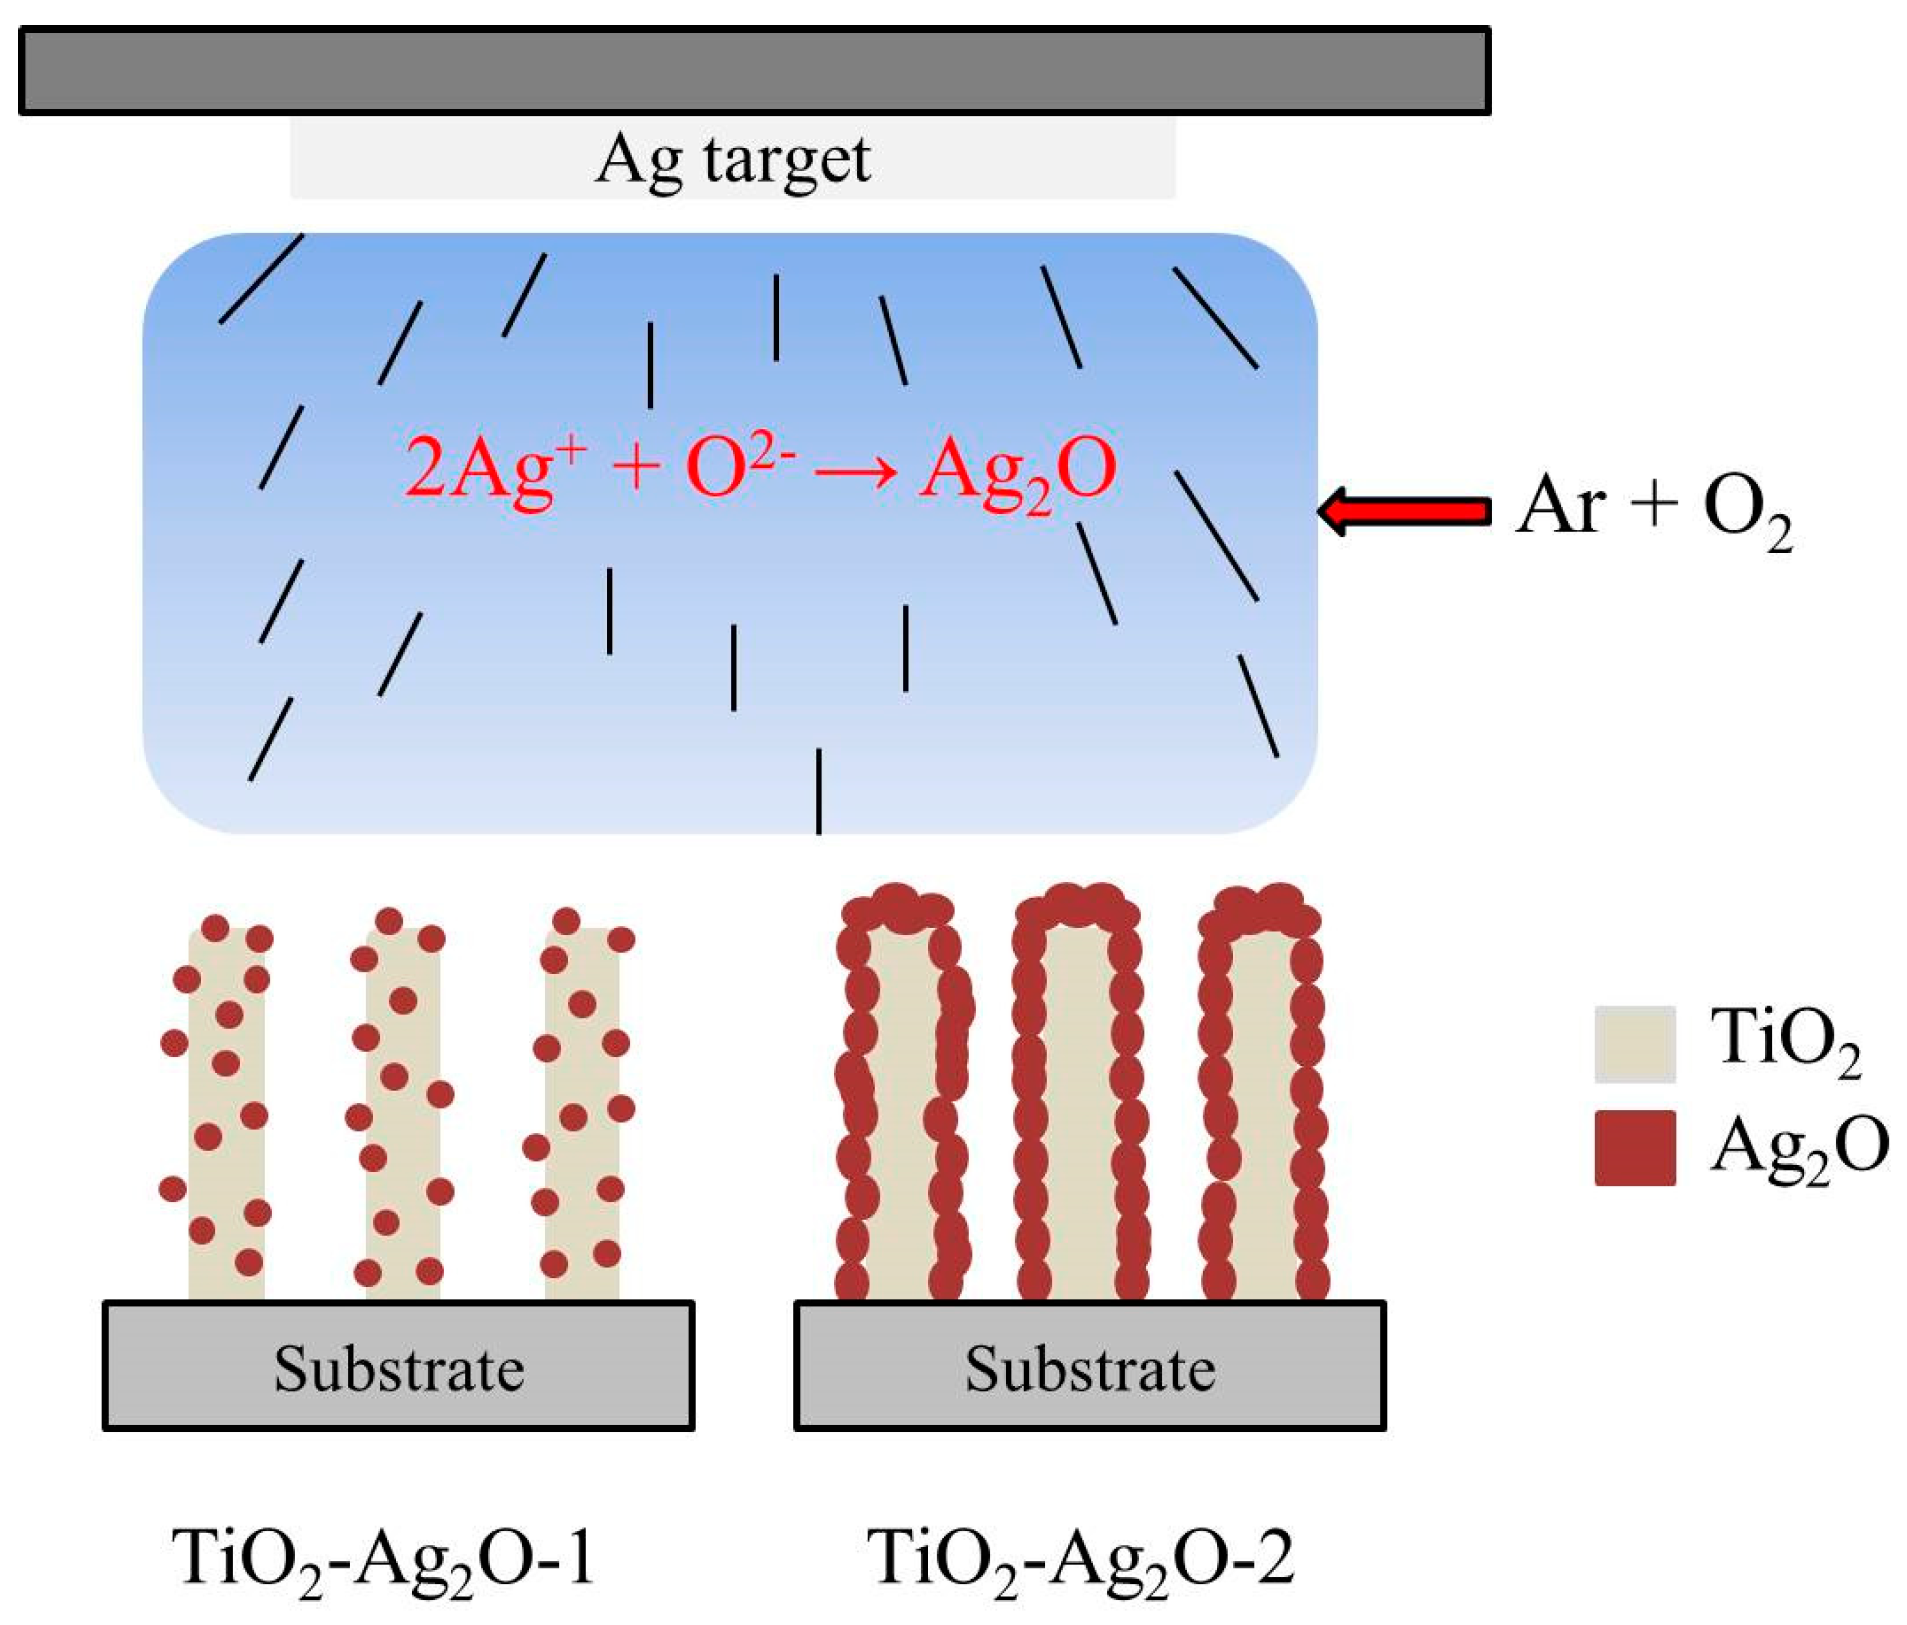
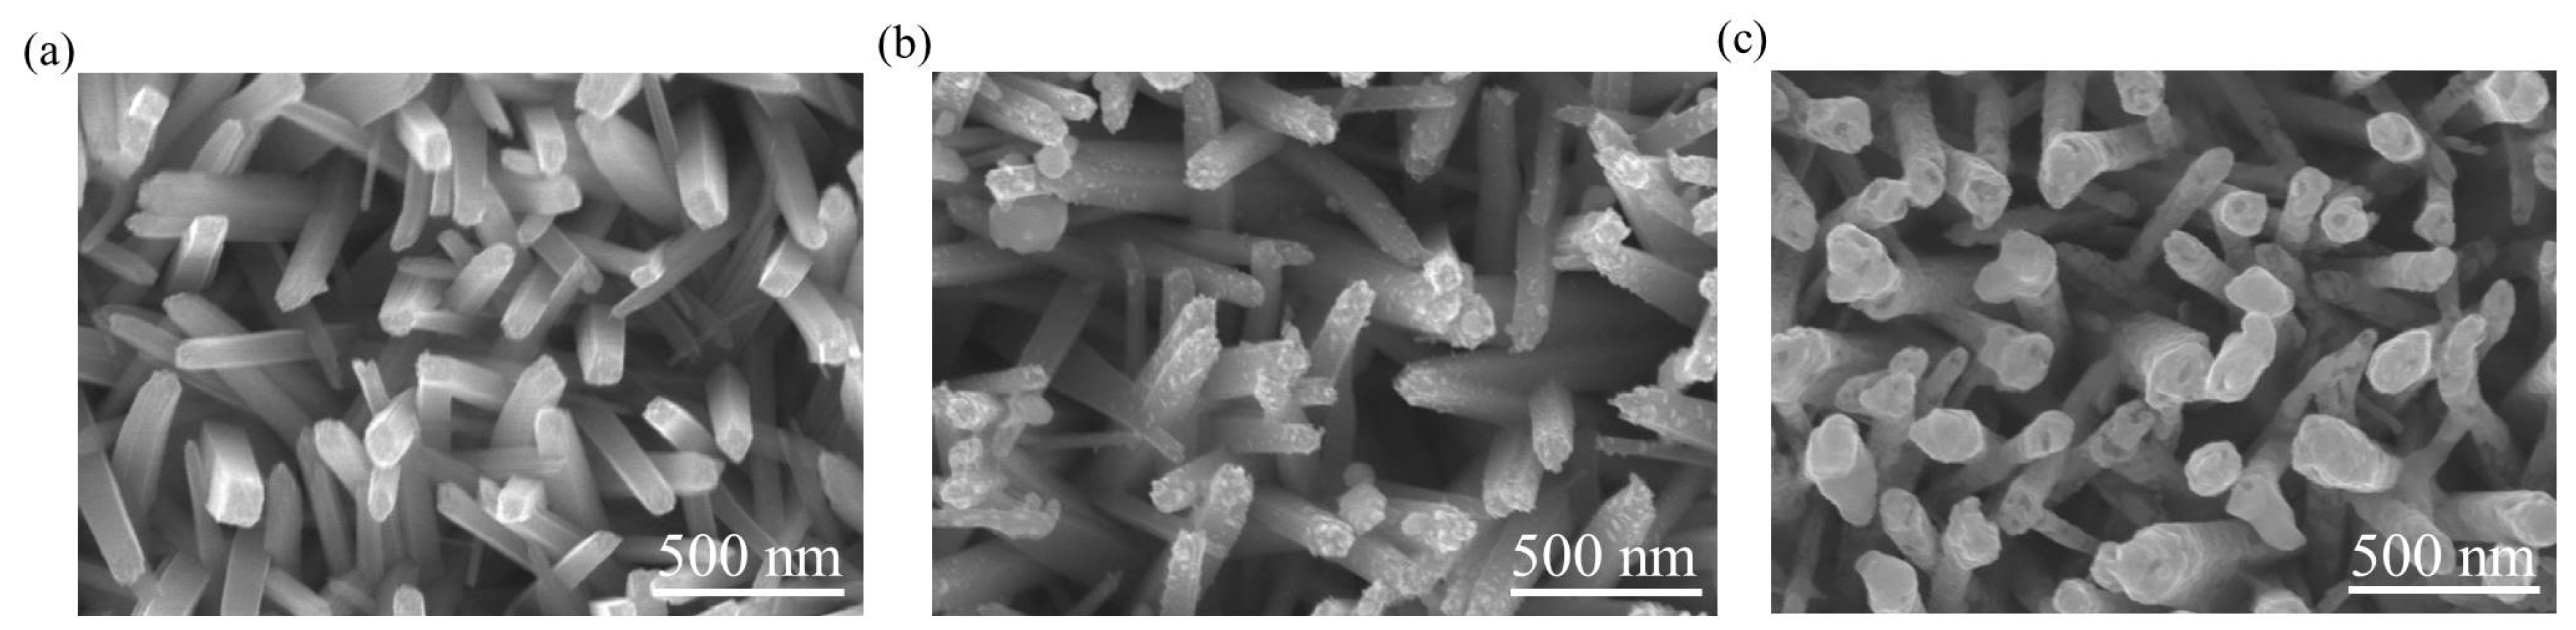
Figure 3a shows the scanning electron microscopy (SEM) image of the as-synthesized TiO2 nanorods. The TiO2 nanorods had a rectangular cross-section crystal feature with an average diameter of approximately 100 nm; the side facets of the nanorods were smooth. Figure 3b presents the SEM image of the TiO2–Ag2O-1 composite nanorods. The surface morphology of the composite nanorods reveals that a small amount of nanoparticle-like crystals was decorated onto the surfaces of the TiO2 nanorods. The nanoparticle-like crystals dispersed separately on the surfaces of the TiO2 nanorods. Figure 3c shows the SEM image of the TiO2–Ag2O-2 composite nanorods. The TiO2 nanorods were homogeneously encapsulated by the aggregation of massive Ag2O nanoparticles, resulting in the irregular-shaped cross-section crystal feature of the composite nanorods. Detailed TEM analyses were performed to further confirm the morphology change of the TiO2–Ag2O composite nanorods prepared at various Ag2O sputtering durations.
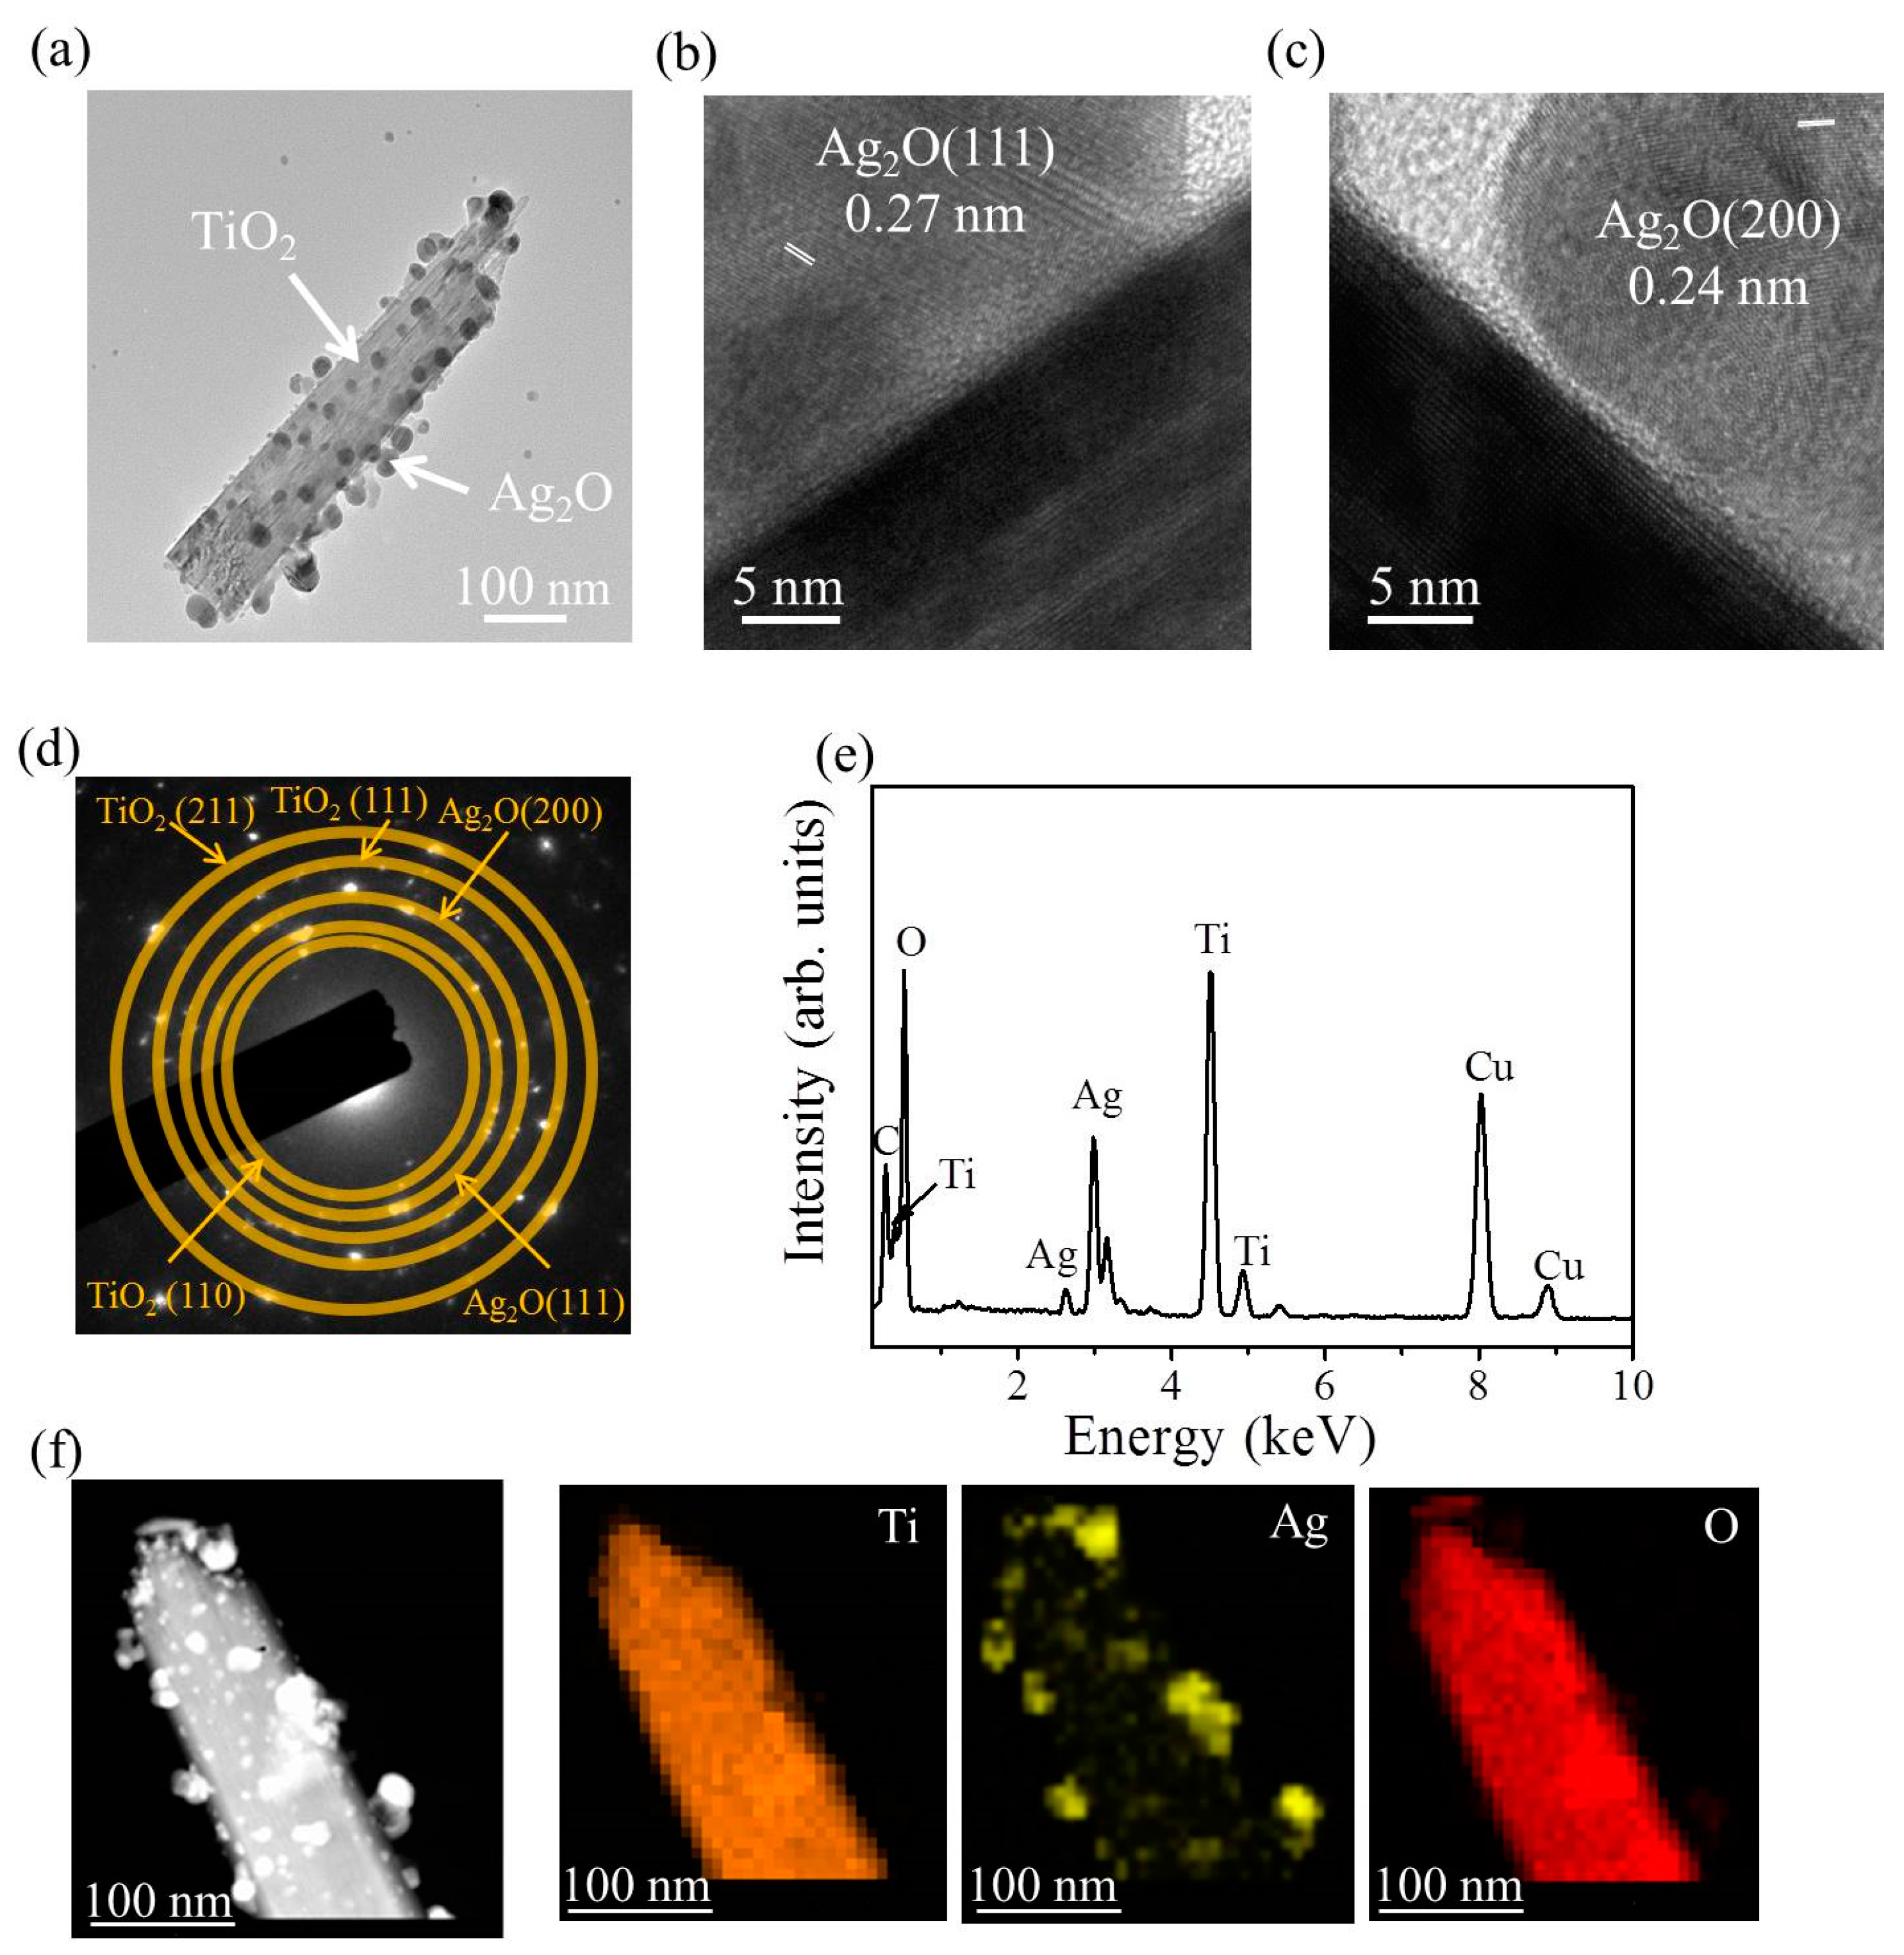
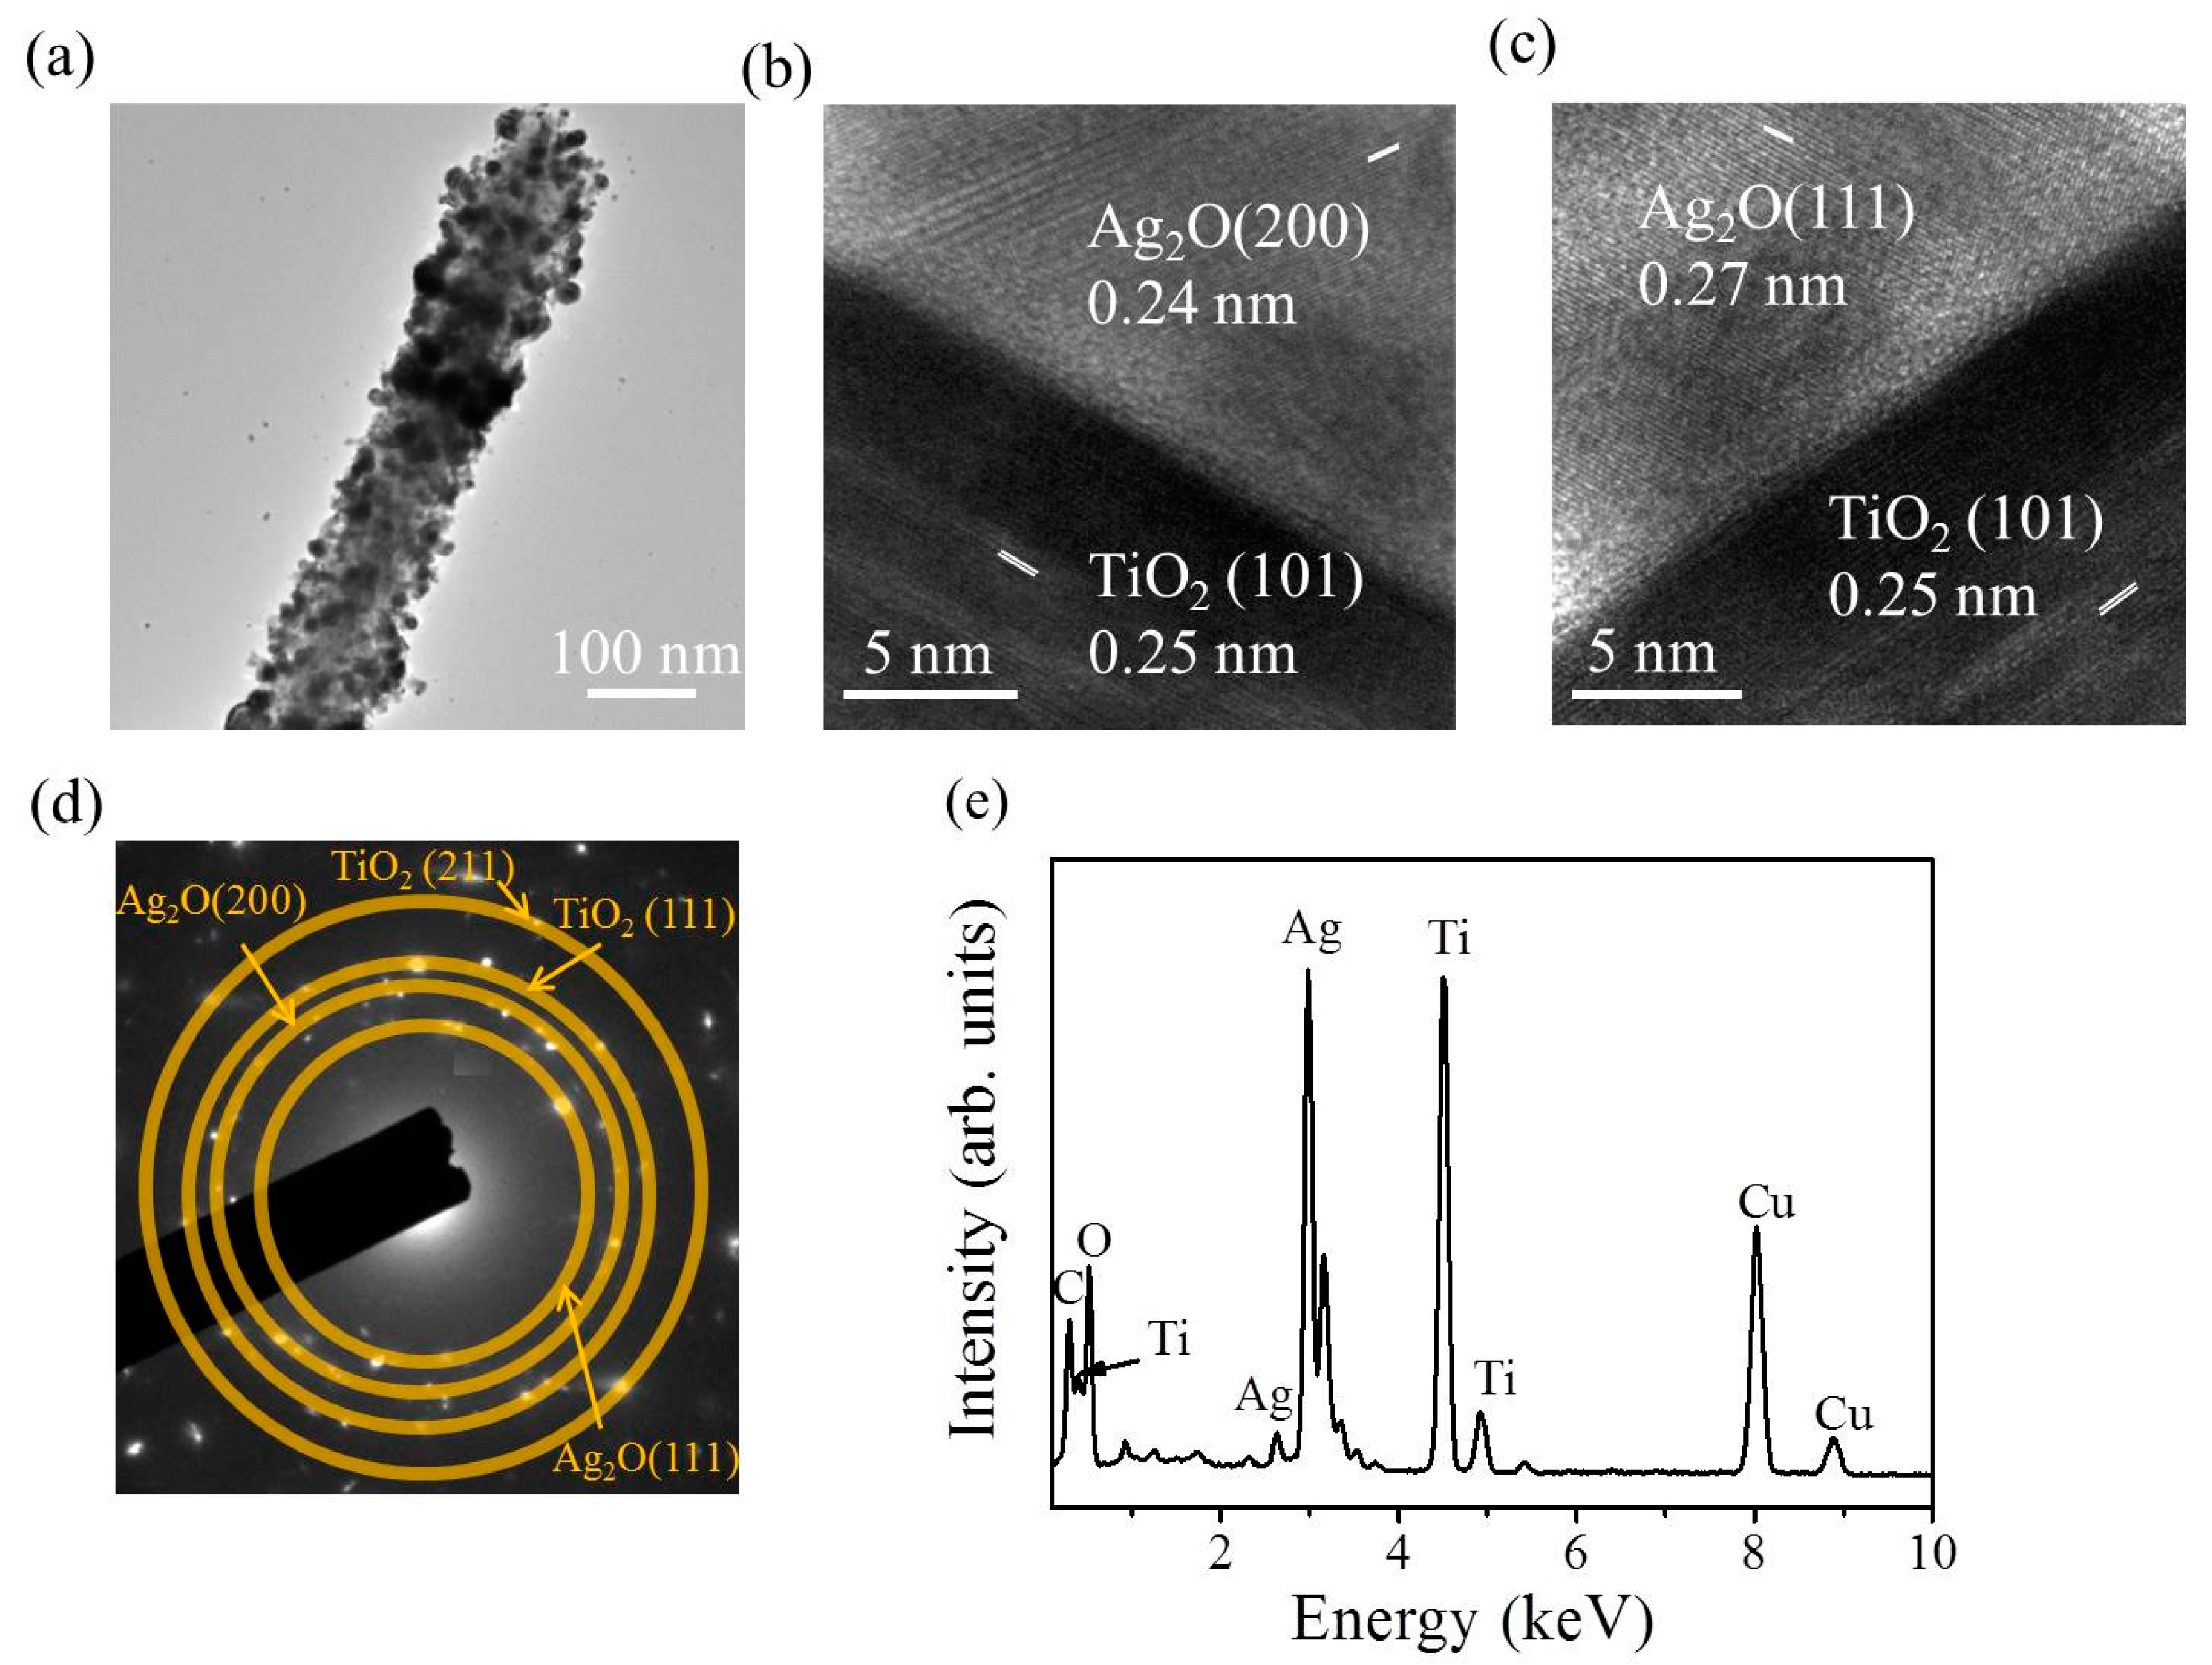
Figure 4a shows the low-magnification transmission electron microscopy (TEM) image of a TiO2–Ag2O-1 composite nanorod. A small amount of Ag2O particles was dispersedly decorated on the surface of the TiO2 nanorod via the sputtering growth of the Ag2O. The high-resolution TEM images shown in Figure 4b,c indicate distinct lattice fringes in the Ag2O particle. Moreover, the lattice fringe distance of approximately 0.24 nm was assigned to the crystallographic plane spacing of cubic Ag2O (200). Figure 4d exhibits the selected area electron diffraction (SAED) pattern of several TiO2–Ag2O-1 composite nanorods. Several clear diffraction rings associated with (111) and (200) planes of the Ag2O and (110), (111), and (211) planes of the rutile TiO2 were observed in the SAED pattern. This demonstrates the good crystallinity of the composite nanorods and indicates that these composite nanorods have a polycrystalline nature. Figure 4e presents the EDS spectrum of a TiO2–Ag2O-1 nanorod. In addition to carbon and copper signals originating from the TEM grid, Ti, Ag, and O elements were detected in the selected heterostructure and no other impurity atom was detected. The EDS elemental mapping images taken from the TiO2–Ag2O-1 nanorod are presented in Figure 4f. The Ti signals were homogeneously distributed over the region of the nanorod template. By contrast, the Ag signals were mainly distributed on the outer region of the composite nanorod; the distribution of Ag signals was discrete and randomly decorated on the TiO2 surface. A good Ag2O particle-decorated TiO2 nanorod with a dispersive particle decoration feature was obtained in the TiO2–Ag2O-1 composite nanorods.
Figure 5a shows the low-magnification TEM image of the TiO2–Ag2O-2 composite nanorod. In comparison with Figure 4a, the distribution density of the Ag2O particles on the surface of the TiO2 nanorod was denser and many particles were clustered, resulting in a rugged surface feature of the composite nanorod. The tiny Ag2O particles aggregated together and fully encapsulated the surface of the TiO2 nanorod. A clear heterointerface was observed between the TiO2 and Ag2O (Figure 5b,c). The distinct lattice fringes in the inner and outer regions of the composite nanorod in Figure 5b,c demonstrated a good crystallinity of the composite nanorod. The SAED pattern in Figure 5d supports the good crystallinity of the composite nanorods, as revealed in the high-resolution TEM images of the selected composite nanorod, and is also in agreement with the XRD result. Figure 5e shows the corresponding EDS spectrum of the TiO2–Ag2O-2 composite nanorod. Besides the carbon and copper signals and the elements of Ag, Ti, and O, no other impurity atom was detected from the selected composite nanorod. Notably, the relative intensity of the Ag signal was more intense than that of the TiO2–Ag2O-1 nanorod in Figure 4e, revealing a higher Ag content in TiO2–Ag2O-2 due to the prolonged sputtering duration of Ag2O.
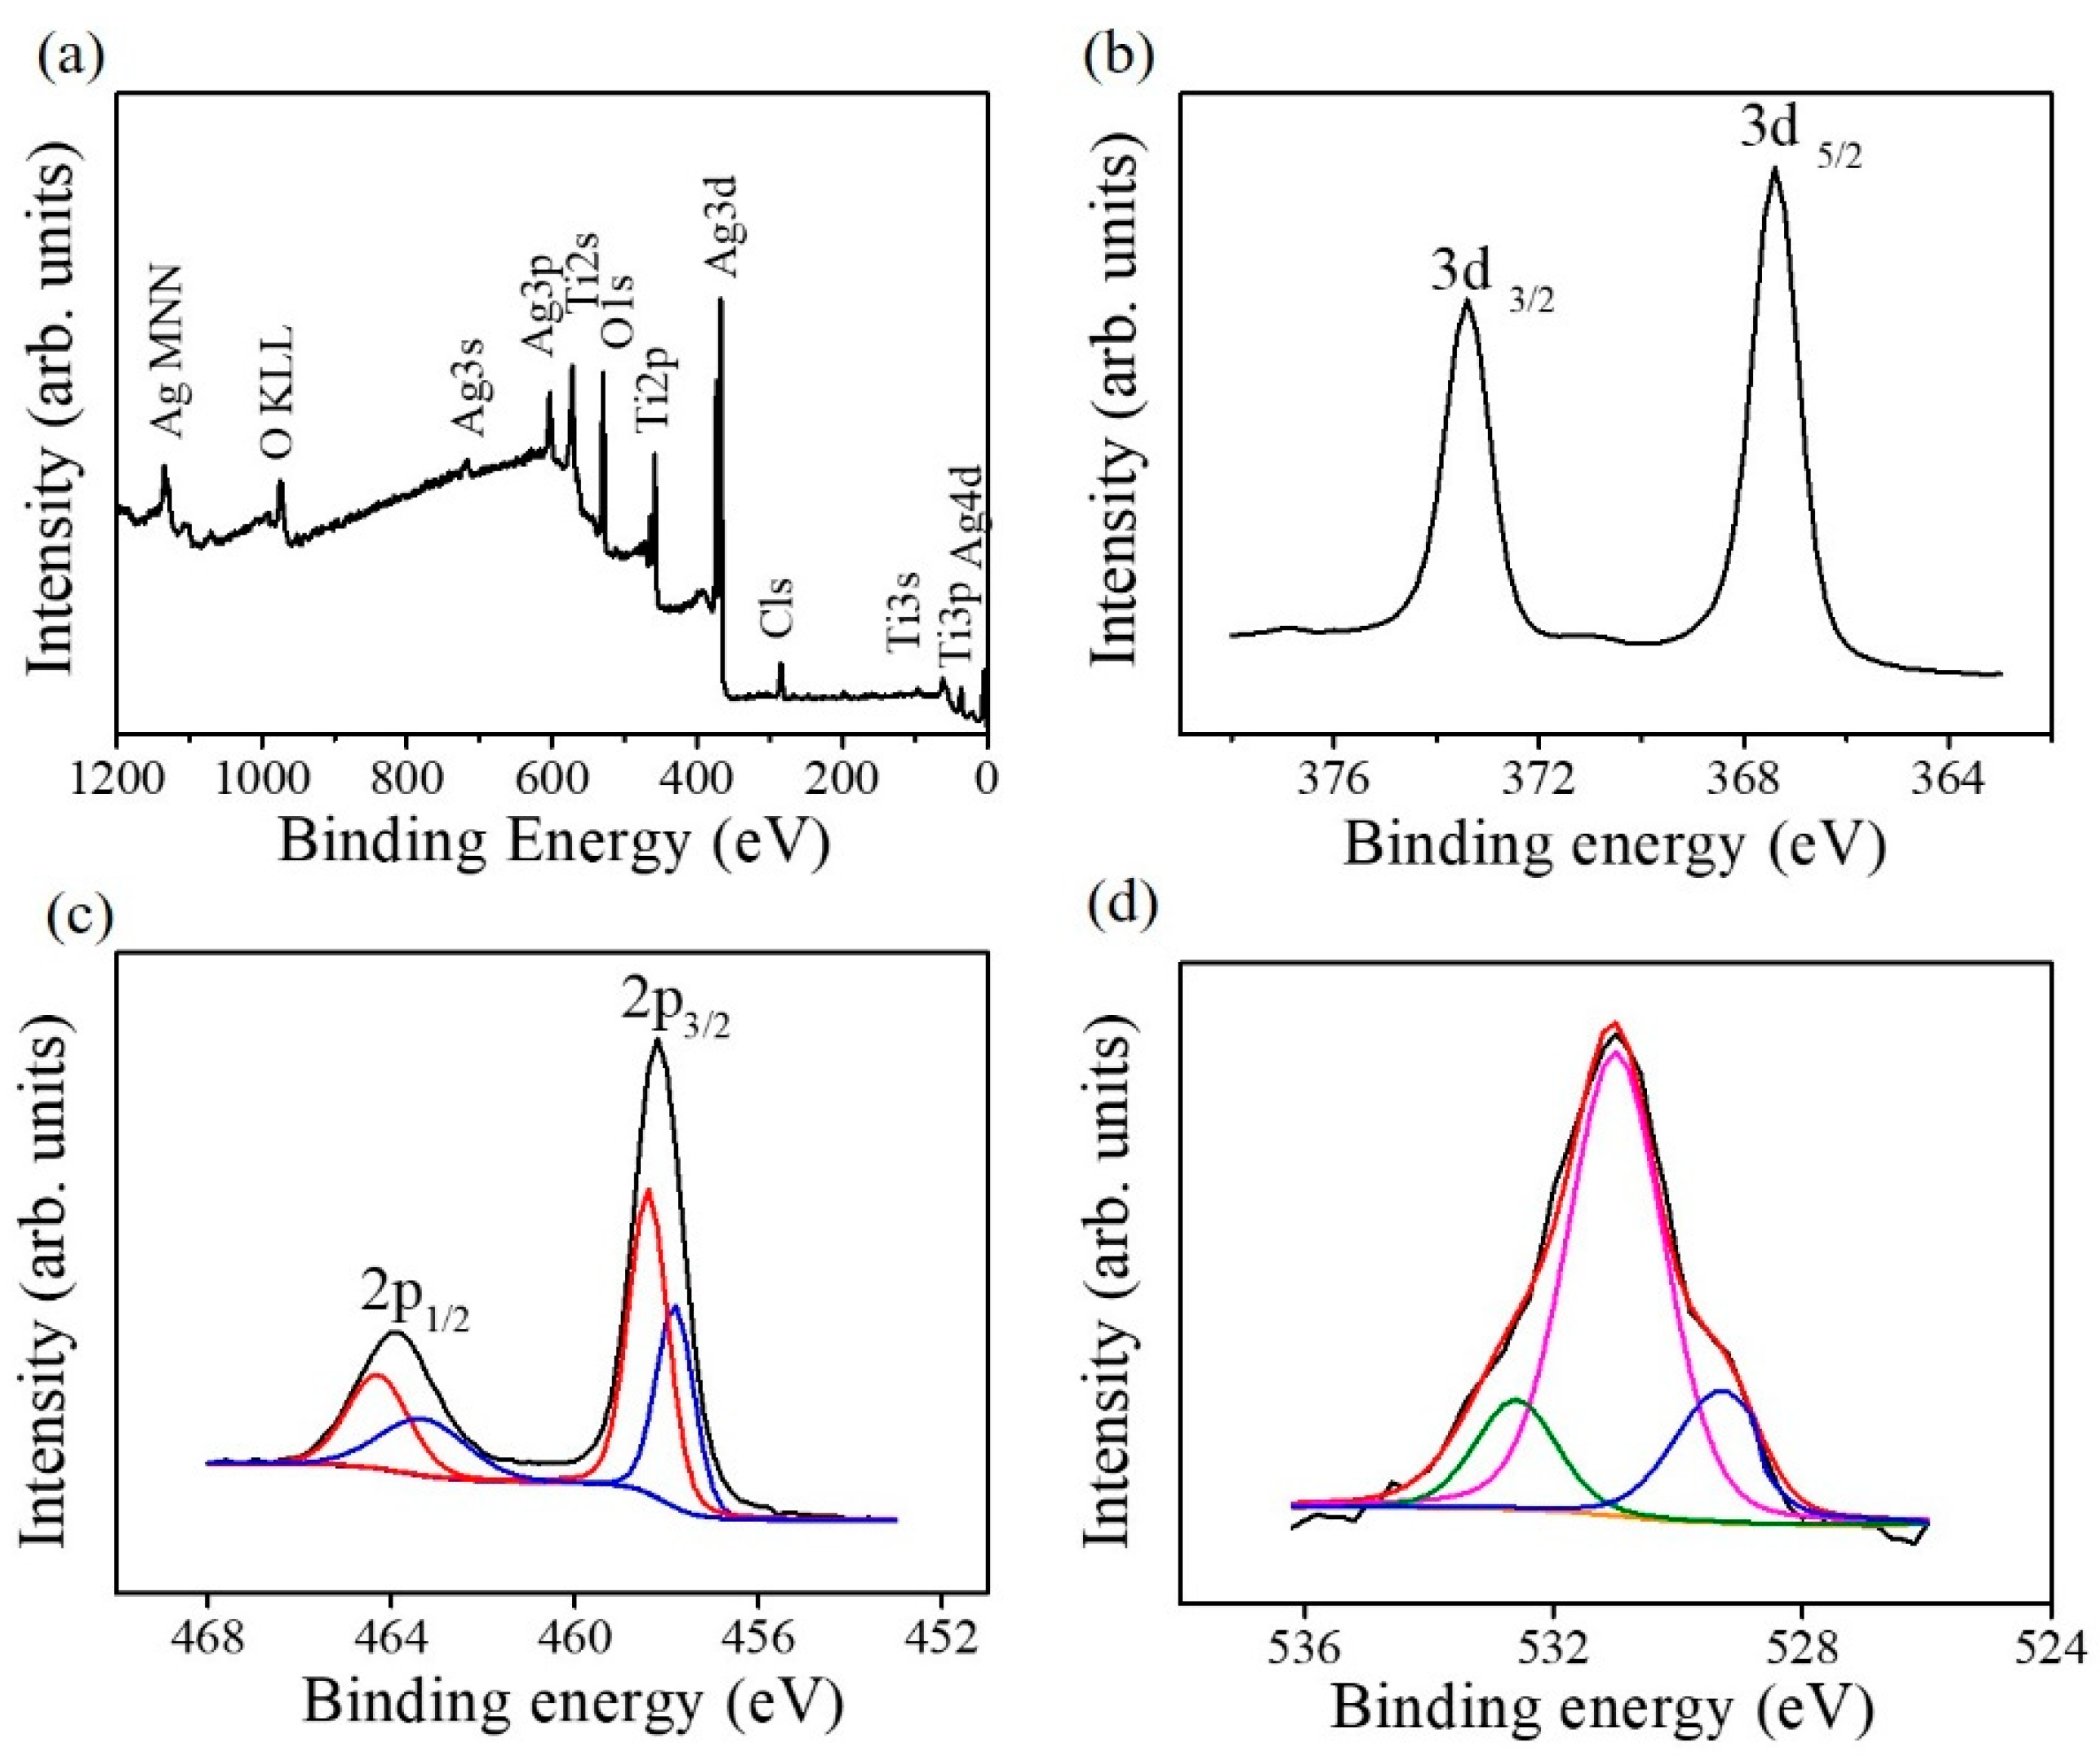
Figure 6a shows the X-ray photoelectron spectroscopy (XPS) survey scan spectrum of the TiO2–Ag2O-1 composite nanorods. The primary features include the Ti, Ag, and O peaks that originated from the TiO2–AgO composites. The trace carbon contamination on the surface of the nanorod sample originated from exposure to ambient air. No impurity atoms were detected in the nanorod sample. Figure 6b exhibits the Ag 3d core-level doublet spectrum originating from the Ag2O decorated via sputtering; two distinct features centered at approximately 367.7 and 373.7 eV respectively correspond to the Ag 3d5/2 and Ag 3d3/2 binding energies. These binding energies are consistent with the Ag–O binding values reported for the Ag2O phase [17]. This indicates that the silver exists in the Ag+ valence state in the sputtered Ag2O nanoparticles on the composite nanorods studied herein. Figure 6c displays the Ti 2p core-level doublet spectrum associated with the TiO2 nanorod template. The distinct two features were deconvoluted into four subpeaks. The subpeaks centered at 458.7 and 464.3 eV correspond to Ti 2p3/2 and Ti 2p1/2 peaks of the Ti4+ valance state, respectively. By contrast, the subpeaks with a relatively weak intensity centered at 457.6 and 463.3 eV correspond to Ti 2p3/2 for Ti 2p1/2 peaks of the Ti3+ valence state [5]. The presence of the mixed Ti4+/Ti3+ valance state indicates the possible presence of oxygen vacancies in the surfaces of the as-synthesized TiO2 nanorods [5,8]. The O1s spectrum of the composite nanorods is shown in Figure 6d. The asymmetric O1s spectrum was deconvoluted into three subpeaks centered at 532.5, 531.2, and 529.2 eV. Notably, the subpeaks centered at 529.2 and 531.2 eV are ascribed to the lattice oxygen in Ag2O and TiO2, respectively [18,19]. Moreover, the external absorbed −OH groups or water molecules on the surfaces of the composite nanorods are reflected by a subpeak at approximately 532.5 eV [20].
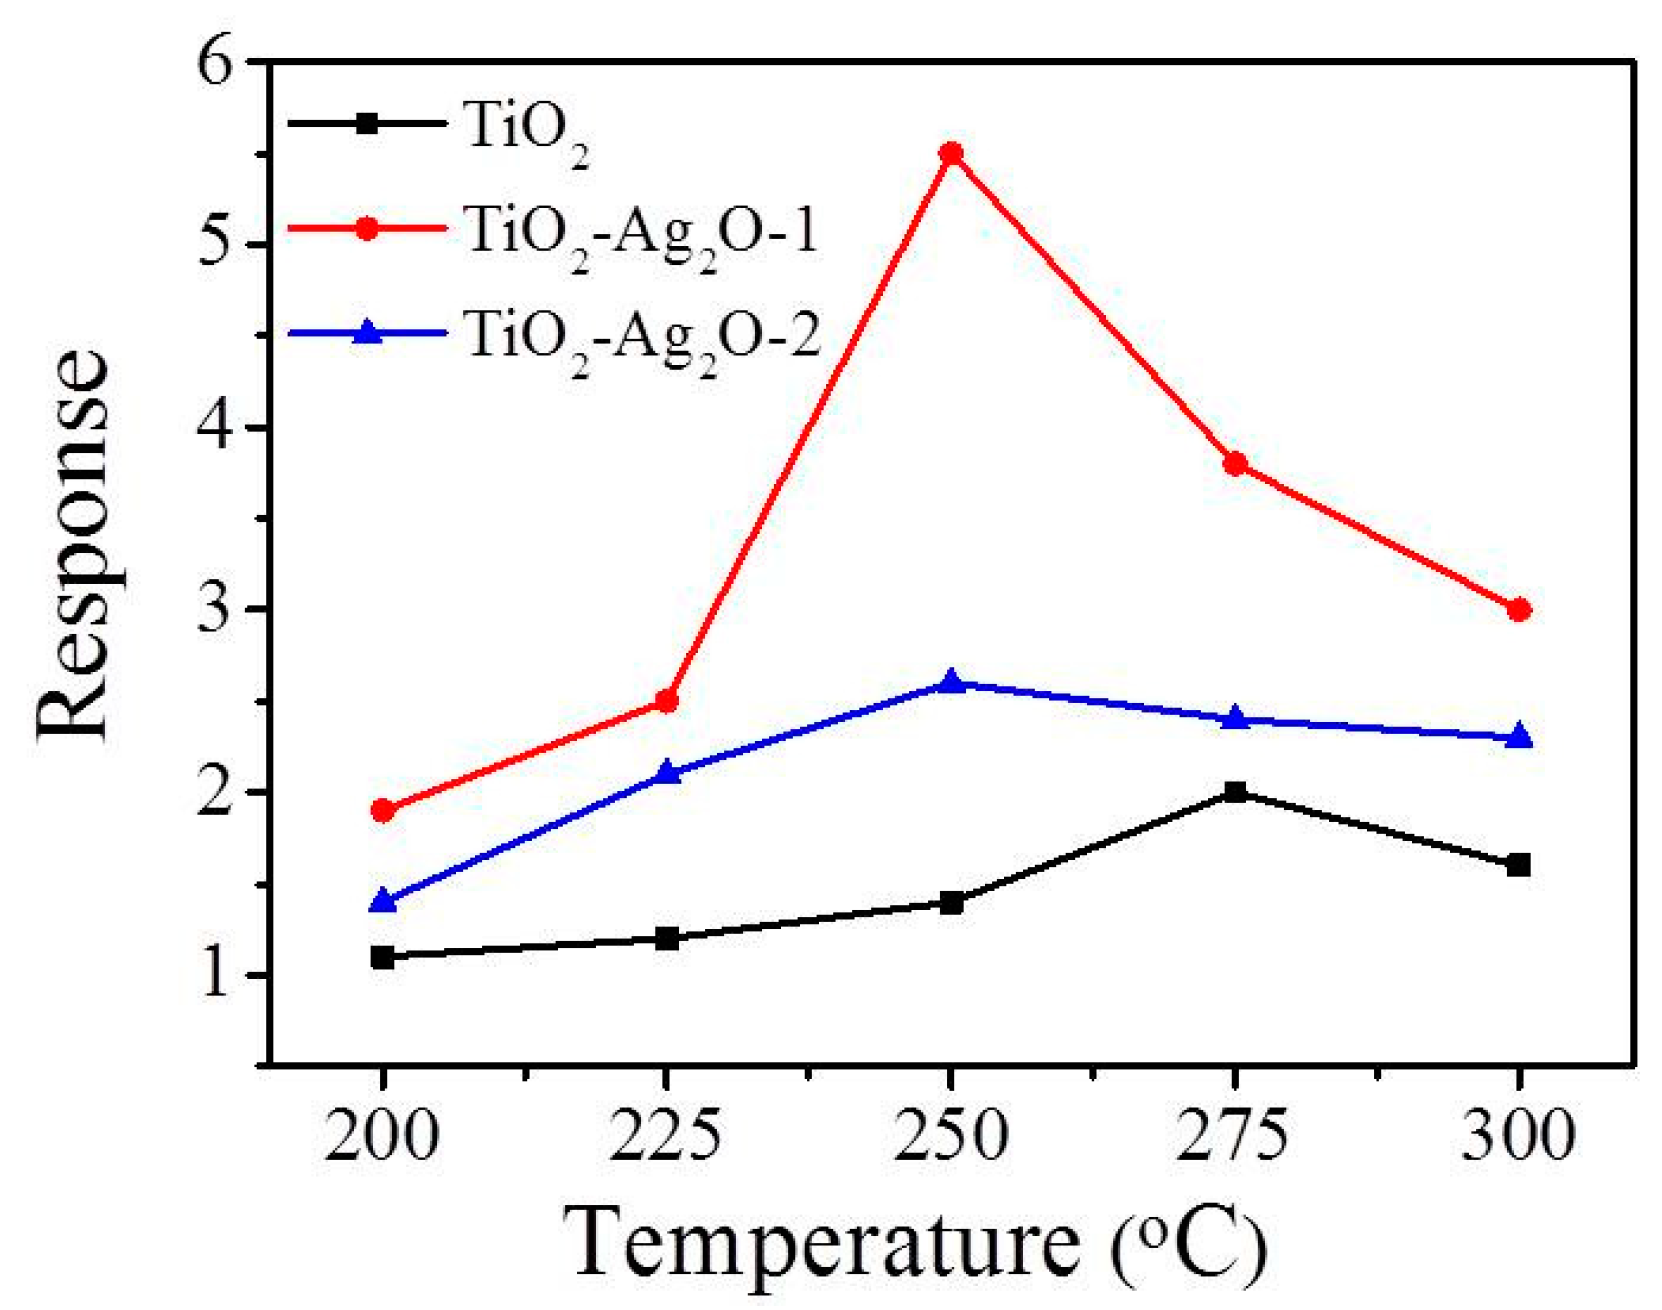
Figure 7 shows the temperature-dependent gas-sensing responses to NO2 (1.5 ppm) of gas sensors made from TiO2, TiO2–Ag2O-1, and TiO2–Ag2O-2 composite nanorods. For the NO2 target gas, the n-type gas-sensing response of nanorod-based sensors is defined as Rg/Ra and the p-type gas-sensing response of nanorod-based sensors is defined as Ra/Rg, where Rg is the sensor resistance under target gas exposure and Ra is the sensor resistance with the removal of the target gas. The optimal operating temperature of oxide sensors to obtain the highest gas-sensing response is highly associated with the balance between the chemical reactions and the gas diffusion rate of the oxide surfaces [5]. The maximum responses of the TiO2–Ag2O-1 and TiO2–Ag2O-2 sensors to NO2 were obtained at the operating temperature of 250 °C in this study. Meanwhile, a relatively high operating temperature of 275 °C was needed for the TiO2 nanorods to obtain the maximum gas-sensing response under similar gas-sensing test conditions. Notably, the gas-sensing response versus operating temperature curve of TiO2–Ag2O-1 showed a distinct summit at 250 °C, differing substantially from the curves of the TiO2 and TiO2–Ag2O-2 nanorod sensors. This result might be a sign of different gas-detecting mechanisms operating among the various nanorod-based sensors. Therefore, the optimal gas-sensing temperature of the fabricated composite nanorod sensors toward NO2 was chosen as 250 °C in this study.
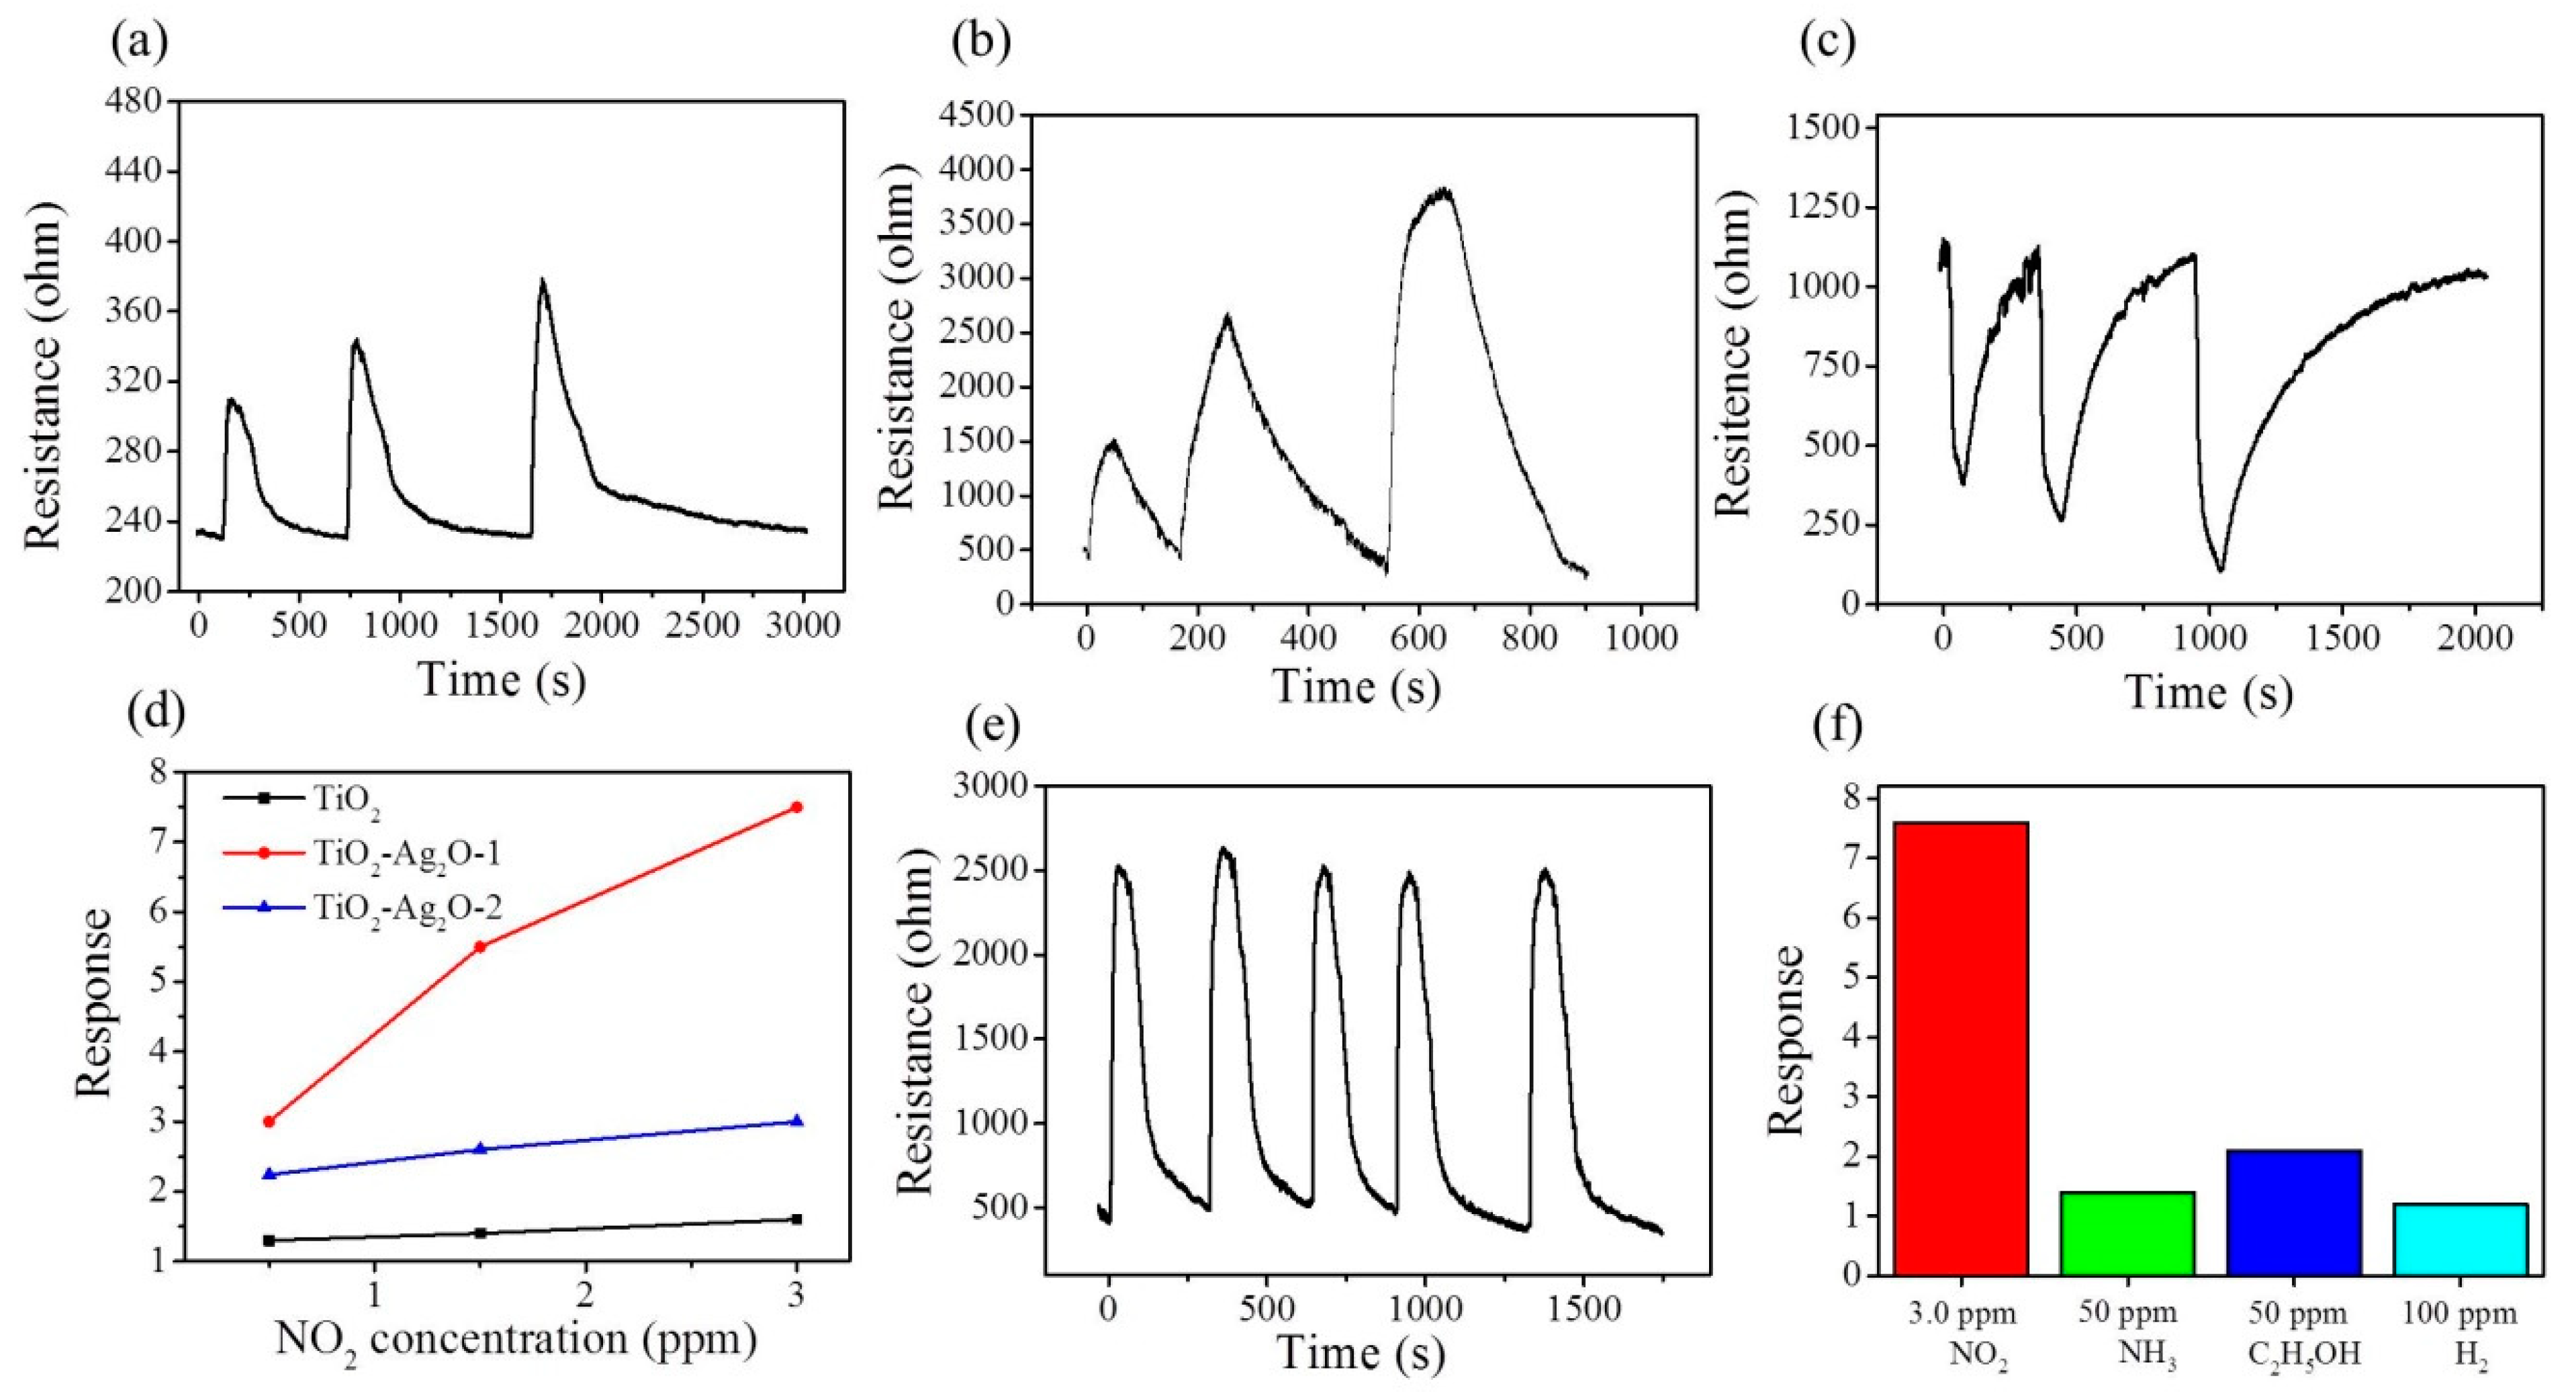
Figure 8a–c shows the dynamic NO2 gas-sensing response curves of the TiO2, TiO2–Ag2O-1, and TiO2–Ag2O-2 sensors, respectively, upon exposure to 0.5–3.0 ppm NO2. A sharp increase in sensor resistance was observed for the TiO2 and TiO2–Ag2O-1 nanorod sensors upon exposure to NO2; moreover, the sensor resistance decreased with the removal of the NO2 target gas (Figure 8a,b). By contrast, the TiO2–Ag2O-2 showed an opposite sensor resistance variation upon exposure to NO2 gas (Figure 8c). This indicates that the TiO2 and TiO2–Ag2O-1 sensors showed an n-type conduction nature and the TiO2–Ag2O-2 sensor demonstrated a p-type conduction nature during the NO2 gas-sensing tests. The aforementioned structural results reveal that the TiO2–Ag2O-1 sensor exhibited a morphology in which the Ag2O particles were dispersedly distributed on the surfaces of the TiO2 nanorods. The incomplete coverage of the Ag2O particles on the TiO2 surfaces of the TiO2–Ag2O-1 nanorods meant that, upon exposure to the NO2 target gas, the n-type conduction dominated the material’s gas-sensing behavior. By contrast, the TiO2–Ag2O-2 nanorods demonstrated a thick, full-coverage layer of Ag2O clusters or aggregations on the surfaces of the TiO2 nanorods. This morphology feature might account for the conduction and chemoresistive variation in the TiO2–Ag2O-2 sensor, which was dominated by p-type Ag2O shell layers of the composite nanorods. A similar conduction type variation due to the p-type crystal coverage effect on the p–n heterogeneous oxides has been demonstrated in a ZnO–Cr2O3 system [11]. Comparatively, the TiO2–Ag2O-1 sensor exhibited the largest degree of sensor resistance variation before and after the introduction of the NO2 gas under the given test conditions. Notably, the pristine TiO2 sensor demonstrated the lowest sensor resistance variation size upon expose to NO2 gas. The plot of NO2 gas-sensing response versus NO2 concentration for various TiO2 nanorod-based sensors is shown in Figure 8d. The NO2 gas-sensing response of the TiO2–Ag2O-1 sensor was approximately 3.1 upon exposure to 0.5 ppm NO2. Moreover, the gas-sensing response of the TiO2–Ag2O-1 sensor increased to 7.6 upon exposure to 3.0 ppm NO2. An approximate increase of the gas-sensing response by 2.4 times was observed with an increase in NO2 concentration from 0.5 ppm to 3.0 ppm by the TiO2–Ag2O-1 sensor. By contrast, the TiO2–Ag2O-2 sensor exhibited gas-sensing responses of approximately 2.2 and 3.1 upon exposure to 0.5 ppm and 3.0 ppm NO2, respectively; these response values are lower than those of the TiO2–Ag2O-1 sensor under similar test conditions. A concentration-dependent increment of the gas-sensing response for a low concentration range of 0.5–3.0 ppm NO2 was less visible for the TiO2–Ag2O-2 sensor. Notably, the gas-sensing response of the pristine TiO2 sensor at the same operating temperature did not show a response value larger than 2.0, revealing that the decoration of discrete or layered Ag2O particles or aggregations on the surfaces of TiO2 nanorods to form a p–n heterogeneous system is beneficial to the enhancement of the NO2 gas-sensing response of TiO2 nanorods. The gas-sensing response time of the nanorod-based sensors is defined as the duration required for an occurrence of a 90% change in sensor resistance upon exposure to the target gas, while the recovery time is the duration in which the sensor resistance drops by 90% from the maximal steady-state value, following the removal of the target gas. The response times for the TiO2, TiO2–Ag2O-1, and TiO2–Ag2O-2 nanorod sensors upon exposure to 0.5–3.0 ppm NO2 gas ranged from 85 to 93 s. No substantial difference in the response times of various nanorod sensors exposed to different concentrations of NO2 gas was observed. By contrast, a marked improvement in the recovery time of the TiO2 nanorods sputtered with a coating of Ag2O particles was visibly demonstrated. The recovery times of the pristine TiO2 nanorod sensor ranged from 405 to 820 s after exposure to 0.5 to 3.0 ppm NO2. Decreased recovery times were shown in the TiO2–Ag2O-2 nanorod sensor, which ranged from 191 to 280 s after exposure to 0.5 to 3.0 ppm NO2. Notably, the TiO2–Ag2O-1 nanorod sensor exhibited a substantial decrease in the recovery time upon the removal of NO2 gas; the recovery times ranged from 97 to 136 s in the NO2 concentration range of 0.5 to 3.0 ppm. The size of the Ag2O particles (or clusters) and their dispersibility are vital factors affecting gas-sensing performance, which lead to the highly effective desorption of surface-adsorbed ions with the removal of the target gas at elevated temperatures [21]. The TiO2–Ag2O-1 nanorod sensor exhibited the superior gas-sensing performance among the various nanorod sensors in this study. The cycling gas-sensing tests of the TiO2–Ag2O-1 nanorod sensor exposed to 1.5 ppm NO2 at 250 °C are shown in Figure 8e. The result indicates that the TiO2–Ag2O-1 nanorod sensor had good reproducibility during multiple cycles of response and recovery. Figure 8f shows the across selectivity profiles of the TiO2–Ag2O-1 sensor upon exposure to 100 ppm H2, 50 ppm C2H5OH, and 50 ppm NH3 gases, as well as 3.0 ppm NO2. The TiO2–Ag2O-1 sensor exhibited a highly selective gas-sensing response toward the low-concentration NO2 gas as compared to the other various target gases.
The NO2 gas-sensing performances of the sensors based on several TiO2-based composite oxides are summarized in Table 1. Compared to previous works [22,23,24,25], the TiO2–Ag2O-1 nanorod sensor herein showed superior NO2 gas-sensing performance under similar test conditions. The gas-sensing test results herein demonstrated that the TiO2–Ag2O composite nanorods decorated with discrete Ag2O particles have potential for applications as NO2 gas sensors at low concentrations. The possible surface chemisorption reactions occurring during the gas-sensing process of the TiO2–Ag2O composite nanorods upon exposure to NO2 gas are described below:
NO 2 + e NO 2 ,
NO 2 + O 2 + 2 e NO 2 + 2 O .
The NO2 molecules capture electrons from the oxide surface to form NO2 ions; this engenders the electron density variation of the oxides. By contrast, the surface-adsorbed NO2 ions are desorbed with the removal of the NO2 gas and, consequently, in this process the recovery of the initial conditions takes place. Notably, the contact of the TiO2–Ag2O oxides form p–n junctions at the hetero-interfacial regions. This additionally formed potential barrier in the TiO2–Ag2O composite nanorods explains the superior gas-sensing responses of the composite nanorods compared to that of the pristine TiO2 nanorods. A similar formation of heterogeneous p–n junctions improves the gas-sensing responses of composite nanorods, as has been demonstrated in ZnO–ZnCr2O4, ZnO–Mn3O4, and ZnO–Cr2O3 p–n composite structures [9,10,11]. Furthermore, the reasons for the NO2 gas-sensing response of the TiO2–Ag2O-1 sensor being higher than that of the TiO2–Ag
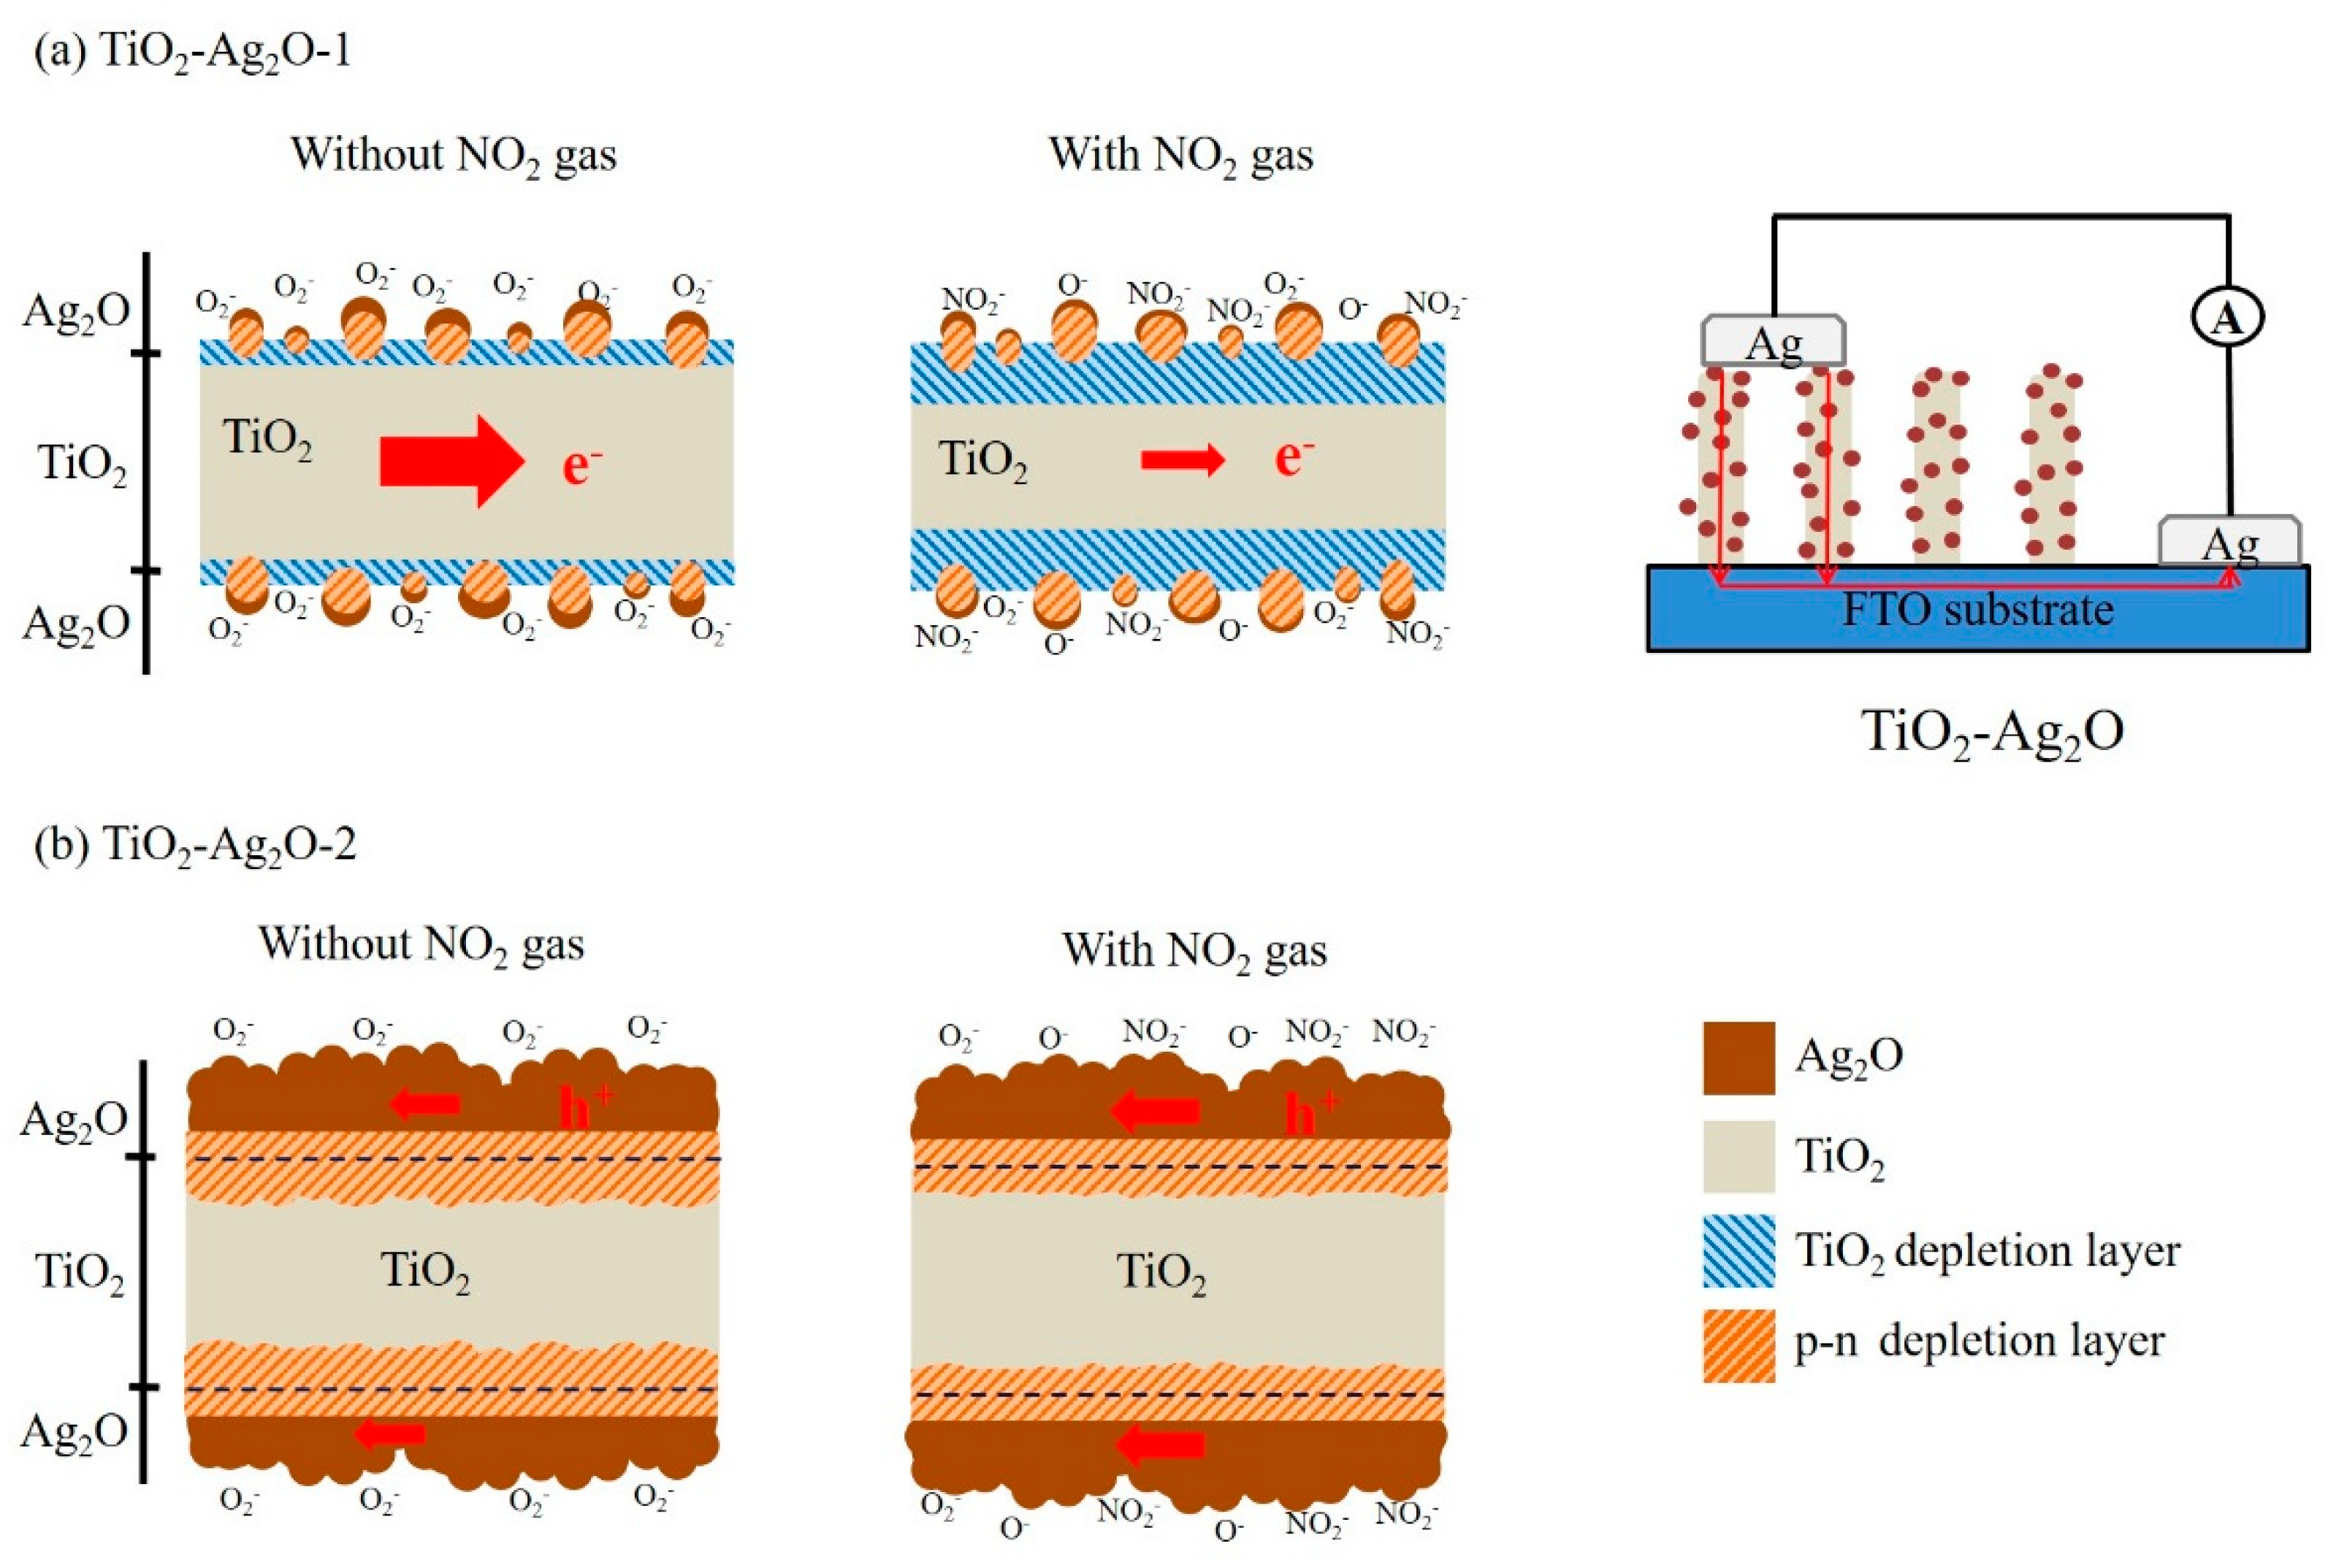
2O-2 sensor at the given test conditions are explained by the schematic mechanisms exhibited in Figure 9. The schematic of the gas sensor device is also shown in Figure 9a. When the Ag2O particles are coated on the surfaces of the TiO2 nanorods in a discrete configuration, the randomly distribution of the depletion region at the interface of the p-Ag2O and n-type TiO2 will initially narrow the space of the conducting channel along the radial direction of the TiO2 (Figure 9a). Moreover, the exposure of the free surfaces of the Ag2O particles and TiO2 rods in ambient air also initially lead to a surface hole accumulation layer and depletion layer, respectively. Furthermore, following the decoration of the Ag2O particles in a continuous layer configuration on the surfaces of the TiO2 nanorods, the conducting channel in the TiO2 will also be narrowed (Figure 9b). After introducing NO2 gas into the test chamber, the depletion region size at the TiO2–Ag2O hetero-interfacial region of the TiO2–Ag2O-1 sensor varies due to the surface-adsorbed NO2 ions. Moreover, the surface depletion region of the TiO2 nanorods is also thickened. The variation of the depletion size at different regions, further narrowing the conduction channel size of the TiO2 nanorods, results in the increased sensor resistance of the TiO2–Ag2O-1 nanorod sensor. By contrast, the TiO2–Ag2O-2 nanorod sensor exhibits a p-type conduction gas-sensing behavior in this study. This reveals that the conduction channel size in the TiO2 nanorod of the composite nanorod no longer plays a vital role affecting the chemoresistive variation upon exposure to NO2 gas. It has also been shown that in core–shell ZnO–ZnMn2O4 and ZnO–Cr2O3 nanostructures, the p–n contact regions at the hetero-interfaces no longer play significant roles in the gas-sensing reaction [10,11]. The conduction path in the Ag2O layer, by contrast, dominates the gas-sensing response of the TiO2–Ag2O-2 nanorod sensor. Notably, when the TiO2–Ag2O-2 nanorod is exposed to NO2 gas, the accumulation layer in the Ag2O layer thickens. This increases the carrier number in the p-type Ag2O layer; therefore, a decreased sensor resistance is expected. However, the surface Ag2O layer-dominated chemoresistive variation size of the TiO2–Ag2O-2 nanorod sensor is expected to be lower than that of the TiO2–Ag2O-1 nanorod sensor, which is dominated by the rugged conduction channel size in the TiO2 core region upon exposure to NO2 gas. Therefore, the superior NO2 gas-sensing performance was obtained by the TiO2–Ag2O-1 nanorod sensor in this study.

4. Conclusions

In summary, TiO2–Ag2O composite nanorods were synthesized through the combination of hydrothermal growth and sputtering methods. The structural analysis reveals that the as-synthesized TiO2–Ag2O composite nanorods have a high crystallinity. The electron microscopy analysis results demonstrate that a shorter Ag2O sputtering duration causes the formation of TiO2–Ag2O composite nanorods decorated with discrete Ag2O particles. Meanwhile, a prolonged Ag2O sputtering process engenders the aggregation of numerous Ag2O particles, which form a layered configuration on the composite nanorods. The formation of p–n junctions in the composite nanorods enhances their NO2 gas-sensing performance as compared to pristine TiO2 nanorods. Moreover, different gas-sensing mechanisms of the TiO2–Ag2O nanorods with various Ag2O coverage morphologies account for the superior NO2 gas-sensing responses of the TiO2–Ag2O-1 sensor at a low concentration range in this study.

Author Contributions

Methodology, Y.-C.L. (Yen-Chen Liu); formal analysis, Y.-C.L. (Yen-Chen Liu); writing—original draft preparation, Y.-C.L. (Yuan-Chang Liang); supervision, Y.-C.L. (Yuan-Chang Liang).

Funding

This research was funded by the Ministry of Science and Technology of Taiwan. Grant No. MOST 105-2628-E-019-001-MY3 and MOST 108-2221-E-019-034-MY3.

Conflicts of Interest

The authors declare no conflict of interest.

References

  1. Liang, Y.C.; Chao, Y. Crystal phase content-dependent functionality of dual phase SnO2–WO3 nanocomposite films via cosputtering crystal growth. RSC Adv. 2019, 9, 6482–6493. [Google Scholar] [CrossRef]
  2. Liang, Y.C.; Lee, C.M.; Loa, Y.J. Reducing gas-sensing performance of Ce-doped SnO2 thin films through a cosputtering method. RSC Adv. 2017, 7, 4724–4734. [Google Scholar] [CrossRef]
  3. Liang, Y.C.; Chao, Y. Enhancement of Acetone Gas-Sensing Responses of Tapered WO3 Nanorods through Sputtering Coating with a Thin SnO2 Coverage Layer. Nanomaterials 2019, 9, 864. [Google Scholar] [CrossRef] [PubMed]
  4. Liang, Y.C.; Chang, C.W. Improvement of Ethanol Gas-Sensing Responses of ZnO–WO3 Composite Nanorods through Annealing Induced Local Phase Transformation. Nanomaterials 2019, 9, 669. [Google Scholar] [CrossRef] [PubMed]
  5. Liang, Y.C.; Xu, N.C.; Wang, C.C.; Wei, D.H. Fabrication of Nanosized Island-Like CdO Crystallites-Decorated TiO2 Rod Nanocomposites via a Combinational Methodology and Their Low-Concentration NO2 Gas-Sensing Behavior. Materials 2017, 10, 778. [Google Scholar] [CrossRef] [PubMed]
  6. Zhao, Y.P.; Li, Y.H.; Ren, X.P.; Gao, F.; Zhao, H. The Effect of Eu Doping on Microstructure, Morphology and Methanal-Sensing Performance of Highly Ordered SnO2 Nanorods Array. Nanomaterials 2017, 7, 410. [Google Scholar] [CrossRef]
  7. Liang, Y.C.; Xu, N.C. Synthesis of TiO2–ZnS nanocomposites via sacrificial template sulfidation and their ethanol gas-sensing performance. RSC Adv. 2018, 8, 22437–22446. [Google Scholar] [CrossRef]
  8. Liang, Y.C.; Wang, C.C. Hydrothermally derived zinc sulfide sphere-decorated titanium dioxide flower-like composites and their enhanced ethanol gas-sensing performance. J. Alloys Compound. 2018, 730, 333–341. [Google Scholar] [CrossRef]
  9. Liang, Y.C.; Hsia, H.Y.; Cheng, Y.R.; Lee, C.M.; Liu, S.L.; Lina, T.Y.; Chung, C.C. Crystalline quality-dependent gas detection behaviors of zinc oxide–zinc chromite p–n heterostructures. CrystEngComm 2015, 17, 4190–4199. [Google Scholar] [CrossRef]
  10. Na, C.W.; Park, S.Y.; Chung, J.H.; Lee, J.H. Transformation of ZnO Nanobelts into Single-Crystalline Mn3O4 Nanowires. ACS Appl. Mater. Interfaces 2012, 4, 6565–6572. [Google Scholar] [CrossRef]
  11. Woo, H.S.; Na, C.W.; Kim, D.; Lee, J.H. Highly sensitive and selective trimethylamine sensor using one-dimensional ZnO–Cr2O3 hetero-nanostructures. Nanotechnology 2012, 23, 245501. [Google Scholar] [CrossRef]
  12. Suna, G.; Chen, H.L.; Li, Y.W.; Chen, Z.H.; Zhang, S.S.; Ma, G.Z.; Jia, T.K.; Cao, J.L.; Bala, H.; Wang, X.D.; et al. Synthesis and improved gas sensing properties of NiO-decorated SnO2 microflowers assembled with porous nanorods. Sens. Actuators B 2016, 233, 180–192. [Google Scholar] [CrossRef]
  13. Kim, H.W.; Na, H.G.; Kwak, D.S.; Cho, H.Y.; Kwon, Y.J. Enhanced Gas Sensing Characteristics of Ag2O-Functionalized Networked In2O3 Nanowires. Jpn. J. Appl. Phys. 2013, 52, 10MD01. [Google Scholar] [CrossRef]
  14. Rajabi, A.; Ghazali, M.J.; Mahmoudi, E.; Baghdadi, A.H.; Mohammad, A.W.; Mustafah, N.M.; Ohnmar, H.; Naicker, S.A. Synthesis, Characterization, and Antibacterial Activity of Ag2O-Loaded Polyethylene Terephthalate Fabric via Ultrasonic Method. Nanomaterials 2019, 9, 450. [Google Scholar] [CrossRef] [PubMed]
  15. Ma, S.S.; Xue, J.J.; Zhou, Y.; Zhang, Z. Photochemical synthesis of ZnO-Ag2O heterostructures with enhanced ultraviolet and visible photocatalytic activity. J. Mater. Chem. A. 2014, 2, 7272–7280. [Google Scholar] [CrossRef]
  16. Li, C.; Hsieh, J.H.; Cheng, J.C.; Huang, C.C. Optical and photoelectrochemical studies on Ag2O/TiO2 double-layer thin films. Thin Solid Films 2014, 570, 436–444. [Google Scholar] [CrossRef]
  17. Sarkar, D.B.; Ghosh, C.K.; Mukherjee, S.; Chattopadhyay, K.K. Three Dimensional Ag2O/TiO2 Type-II (p–n) Nanoheterojunctions for Superior Photocatalytic Activity. ACS Appl. Mater. Interfaces 2013, 5, 331–337. [Google Scholar] [CrossRef]
  18. Kaushik, V.K. XPS core level spectra and Auger parameters for some silver compounds. J. Electron Spectrosc. Relat. Phenom. 1991, 56, 273. [Google Scholar] [CrossRef]
  19. Ingo, G.M.; Dirè, S.; Babonneau, F. XPS studies of SiO2-TiO2 powders prepared by sol-gel process. Appl. Surf. Sci. 1993, 70, 230–234. [Google Scholar] [CrossRef]
  20. Wei, N.; Cui, H.Z.; Song, Q.; Zhang, L.; Song, X.J.; Wang, K.; Zhang, Y.F.; Li, J.; Wen, J.; Tian, J. Ag2O nanoparticle/TiO2 nanobelt heterostructures with remarkable photo-response and photocatalytic properties under UV, visible and near-infrared irradiation. Appl. Catal. B 2016, 198, 83–90. [Google Scholar] [CrossRef]
  21. Yang, T.L.; Yang, Q.Y.; Xiao, Y.; Sun, P.; Wang, Z.; Gao, Y.; Ma, J.; Sun, Y.F.; Lu, G.Y. A pulse-driven sensor based on ordered mesoporous Ag2O-SnO2 with improved H2S-sensing performance. Sens. Actuators B 2016, 228, 529–538. [Google Scholar] [CrossRef]
  22. Mohammadi, M.R.; Fray, D.J. Development of nanocrystalline TiO2–Er2O3 and TiO2–Ta2O5 thin film gas sensors: Controlling the physical and sensing properties. Sens. Actuators B 2009, 141, 76–84. [Google Scholar] [CrossRef]
  23. Epifani, M.R.; Comini, E.B.; Díaz, R.; Force, C.; Siciliano, P.T.; Faglia, G.D. TiO2 colloidal nanocrystals surface modification by V2O5 species: Investigation by 47,49Ti MAS-NMR and H2, CO and NO2 sensing properties. Appl. Surf. Sci. 2015, 351, 1169–1173. [Google Scholar] [CrossRef]
  24. Galatsis, K.; Li, Y.X.; Wlodarski, W.; Comini, E.; Faglia, G.; Sberveglieri, G. Semiconductor MoO3–TiO2 thin film gas sensors. Sens. Actuators B 2001, 77, 472–477. [Google Scholar] [CrossRef]
  25. Mohammadi, M.R.; Fray, D.J. Semiconductor TiO2–Ga2O3 thin film gas sensors derived from particulate sol–gel route. Acta Mater. 2007, 55, 4455–4466. [Google Scholar] [CrossRef]
Figure 1. Sample configurations of the TiO2–Ag2O-1 and TiO2–Ag2O-2 composite nanorods synthesized with various sputtering durations of Ag2O.
Nanomaterials 09 01150 g001
Figure 2. XRD patterns of various composite nanorods: (a) TiO2–Ag2O-1, (b) TiO2–Ag2O-2.
Nanomaterials 09 01150 g002
Figure 3. SEM images of various nanorods: (a) TiO2, (b) TiO2–Ag2O-1, (c) TiO2–Ag2O-2.
Nanomaterials 09 01150 g003
Figure 4. TEM analysis of the TiO2–Ag2O-1 composite nanorods: (a) Low-magnification TEM image of the TiO2–Ag2O-1 composite nanorod. (b,c) High-resolution TEM images taken from various regions of the composite nanorod. (d) Selected area electron diffraction (SAED) pattern of several TiO2–Ag2O-1 composite nanorods. (e) Energy dispersive X-ray spectroscopy (EDS) spectrum of the composite nanorod. (f) Ti, Ag, and O elemental mapping images taken from the selected composite nanorod.
Nanomaterials 09 01150 g004
Figure 5. TEM analysis of the TiO2–Ag2O-2 composite nanorods: (a) Low-magnification TEM image of the TiO2–Ag2O-2 composite nanorod. (b,c) High-resolution TEM images taken from various regions of the composite nanorod. (d) SAED pattern of several TiO2–Ag2O-2 composite nanorods. (e) EDS spectrum of the composite nanorod.
Nanomaterials 09 01150 g005
Figure 6. XPS analysis of the TiO2–Ag2O-1 composite nanorods: (a) Survey scan spectrum. (b) Ag 3d narrow scan spectrum. (c) Ti 2p narrow scan spectrum. The red curve is associated with the contribution of the Ti4+ valance state and the blue curve originated from the Ti3+ valence state. (d) O1s narrow scan spectrum. The blue and pink curves are ascribed to the lattice oxygen in Ag2O and TiO2, respectively. Moreover, the green curve is ascribed to external absorbed −OH groups or water molecules on the surfaces of the composite nanorods.
Nanomaterials 09 01150 g006
Figure 7. Temperature-dependent gas-sensing responses of various nanorod sensors exposed to 1.5 ppm NO2.
Nanomaterials 09 01150 g007
Figure 8. The dynamic response curves of various nanorod sensors to NO2 gas ranging from 0.5 ppm to 3.0 ppm: (a) TiO2, (b) TiO2–Ag2O-1, and (c) TiO2–Ag2O-2. (d) Summarized gas-sensing response values versus NO2 concentration for various nanorod sensors. (e) Cycling gas-sensing tests of TiO2–Ag2O-1 upon exposure to 1.5 ppm NO2 at 250 °C. (f) The across selectivity profiles of TiO2–Ag2O-1 upon exposure to various target gases.
Nanomaterials 09 01150 g008
Figure 9. Schematic illustrations for possible gas-sensing mechanisms of (a) TiO2–Ag2O-1 and (b) TiO2–Ag2O-2 toward NO2 gas.
Nanomaterials 09 01150 g009
Table 1. NO2 gas-sensing performance of various TiO2-based composites prepared using various methods in the operating temperature range of 200–300 °C [22,23,24,25].
Composite NanorodsSynthesis MethodOperating Temperature (°C)Concentration (ppm)Response (Ra/Rg)Detection Limit (ppm)Response/Recovery Time (s)
TiO2–Ag2O (this work)Hydrothermal and sputtering method2501.55.50.587/112
TiO2–Er2O3Sol-gel method200104.50.5N/A
TiO2–V2O5Sol–gel and solvothermal method20020.8N/AN/A
TiO2–MoO3Sol–gel method30022.30.5120/180
TiO2–Ga2O3Sol–gel method20022.25N/A150/270

