Article

Photothermal Performance of 2D Material-Based Nanoparticles for Biomedical Applications

1
Moscow Center for Advanced Studies, Kulakova str. 20, Moscow 123592, Russia
2
Emerging Technologies Research Center, XPANCEO, Internet City, Emmay Tower, Dubai 00000, United Arab Emirates
*
Authors to whom correspondence should be addressed.
Nanomaterials 2025, 15(12), 942; https://doi.org/10.3390/nano15120942
Submission received: 18 April 2025 / Revised: 10 June 2025 / Accepted: 12 June 2025 / Published: 18 June 2025
(This article belongs to the Special Issue Nanostructured Materials and Coatings for Biomedical Applications)

Abstract

:
Photothermal therapy (PTT) is one of the rapidly developing methods for cancer treatment based on the strong light-to-heat conversion by nanoparticles. Over the past decade, the palette of photonic materials has expanded drastically, and nanoparticle fabrication techniques can now preserve the optical response of a bulk material in produced nanoparticles. This progress potentially holds opportunities for the efficiency enhancement of PTT, which have not fully explored yet. Here we study the photothermal performance of spherical nanoparticles (SNs) composed of novel two-dimensional (2D) and conventional materials with existing or potential applications in photothermal therapy such as MoS2, PdSe2, Ti3C2, TaS2, and TiN. Using the Mie theory, we theoretically analyze the optical response of SNs across various radii of 5–100 nm in the near-infrared (NIR) region with a particular focus on the therapeutic NIR-II range (1000–1700 nm) and radii below 50 nm. Our calculations reveal distinct photothermal behaviors: Large (radius > 50 nm) nanoparticles made of van der Waals semiconductors and PdSe2 perform exceptionally well in the NIR-I range (750–950 nm) due to excitonic optical responses, while Ti3C2 nanoparticles achieve broad effectiveness across both NIR zones due to their dual dielectric/plasmonic properties. Small TiN SNs excel in the NIR-I zone due to the plasmonic response of TiN at shorter wavelengths. Notably, the van der Waals metal TaS2 emerges as the most promising photothermal transduction agent in the NIR-II region, particularly for smaller nanoparticles, due to its plasmonic resonance. Our insights lay a foundation for designing efficient photothermal transduction agents, with significant implications for cancer therapy and other biomedical applications.

1. Introduction

Photothermal therapy (PTT) is an emerging and minimally invasive therapeutic technique that utilizes photothermal transduction agents (PTAs) to convert light energy into heat for targeted tissue ablation [1,2]. This method has garnered significant interest for its potential applications in cancer treatment, where localized hyperthermia induced by PTAs can effectively destroy malignant cells while minimizing damage to the surrounding healthy tissues [3]. The efficiency of PTT depends heavily on the properties of PTAs—such as their geometry, size, composition, and biocompatibility—as well as on the characteristics of the illuminating light, including its wavelength [4]. While noble metals are widely used in PTT, alternative plasmonic materials like transition metal nitrides (TMNs) and van der Waals materials, such as transition metal dichalcogenides (TMDCs) and MXenes, whose atomic layers are weakly bound by van der Waals forces, offer several advantages, including lower toxicity [5], broad and tunable optical absorption [6], better photothermal stability [7], and cost-effectiveness [8].
Among nanoparticle morphologies, spherical nanoparticles (SNs) are particularly favored due to their ease of synthesis, enhanced cellular uptake, and lower cytotoxicity [9,10,11]. Additionally, nanoparticle size plays a crucial role in determining both the cellular uptake efficiency and the clearance rate from the bloodstream. Studies indicate that SNs with a radius of 10–50 nm offer optimal cellular uptake and prolonged circulation, thereby maximizing therapeutic efficacy [12,13,14], whereas larger nanoparticles are cleared faster by macrophages via the reticuloendothelial system. Moreover, SNs benefit from reduced aggregation. To diminish the immune response, nanoparticles are commonly covered with polyethylene glycol (PEG) [15]. Moreover, SNs benefit from reduced aggregation. At the same time, the main disadvantage of uniform SNs is the low tunability of the optical response which depends only on a single size parameter. Novel materials may help to overcome this drawback by providing an additional degree of freedom.
The selection of the operating wavelength is crucial for optimizing PTT performance. The near-infrared (NIR) region is particularly advantageous due to its deep tissue penetration and reduced scattering [16]. Within this spectrum, two therapeutic windows are recognized: the first, NIR-I, spans from 750 to 950 nm, while the second, NIR-II, lies slightly deeper into the near-infrared window from 1000 to 1700 nm [17]. NIR-II offers several benefits, including lower tissue absorption, reduced autofluorescence, and greater penetration depth [18,19]. These attributes make NIR-II an optimal spectral range for efficient photothermal heating, leading to improved therapeutic outcomes in biomedical applications. Over the last decade, considerable efforts have been spent to achieve stable production of highly crystalline SNs of van der Waals materials which preserve a strong excitonic optical response of the initial crystal [20,21,22,23]. Hence, the material palette available for nanoparticle production has significantly expanded, complicating the choice of suitable material for PTT. Novel materials feature exotic optical properties, such as record-high refractive indices and strong optical absorption in the vicinity of excitonic resonances [24,25,26]. Their potential for theranostic applications is not yet fully understood.
Beyond PTT, the enhancement of SN optical absorption is desirable for diagnostics. In particular, the efficiency of photoacoustic imaging (PAI), a hybrid imaging modality that combines the high contrast of optical imaging with the deep tissue penetration of ultrasound [27,28], strongly depends on the absorption in the near-infrared (NIR) region.
In this work, we conduct a detailed theoretical investigation of spherical nanoparticles for photothermal therapy. We identify the most effective materials, including novel van der Waals materials, for specific nanoparticle sizes (radius ≤ 100 nm) and operating wavelengths within the near-infrared (NIR) range. Special attention is given to the NIR-II region and particle radii ≤ 50 nm to optimize safety and efficacy.

2. Methods

2.1. Model for Temperature Rise

At a steady state, where the temperature no longer changes with time in a solution containing SNs of radius R, the temperature increase (ΔT) due to nanoparticles is determined by the balance between energy absorption and heat dissipation in the surrounding medium. Mathematically, this relationship is given by
Δ T = Q 0 f N V r N u A k
where Q0 = I0σabs represents the energy absorbed by a single nanoparticle (Figure 1), where σabs is the absorption cross-section calculated using Mie theory [29] implemented in the self-written software. The incident radiation intensity I0 is set to 3.2 × 10⁵ W/m2, and the nanoparticle concentration is given by fN = 4.24 × 10¹⁴ (R0/R)3 m−3 based on the conditions used by Rastinehad et al. [30] for tumor therapy. We choose the reference radius as R0 = 50 nm. The solution’s geometry is characterized by its volume (V), surface area (A), and characteristic length (r = 1 cm). The thermal conductivity of water is k = 0.63 W/(m⋅K), and the Nusselt number is approximated as Nu∼5. Aiming to compare the optical performance of nanoparticles, we fixed the above parameters and scaled the nanoparticle concentration to be inversely proportional to the nanoparticle volume, thereby making the volume concentration constant. In practice, the concentration of nanoparticles in the target tumor will depend on the administered nanoparticle dose, the way they are introduced, the blood clearance rate, and the immune response. In the case when the practical conditions differ from the parameters listed here, our calculation results can be easily adjusted using Equation (1).

2.2. Absorption Cross-Section of Small Spheres

When the nanoparticle radius R is much smaller than the wavelength of incident light (λ/R ≫ 1), the electrodynamic effects of local-field enhancement become independent of the particle size. In this regime, retardation effects leading to radiative plasmon damping are negligible, and absorption is dominated by dipole interactions. The absorption cross-section can thus be expressed analytically using static dipole polarizability of a dielectric sphere, which is given by [31,32]
α = 3 ε 0 V 0 ε ε h ε + 2 ε h
Here, V0 is the volume of the particle, and ε represents the complex dielectric function of the particle material, while εh is the dielectric constant of the host medium. The absorption cross-section is as follows:
σ a b s = 1 2 R e i ω α E 0 E * 1 2 R e E 0 H 0 * = V 0 2 π I m ( ε ) λ 9 ε h 3 / 2 R e ε + 2 ε h 2 + I m ε 2
where E0, H0, and E are the complex amplitudes of the electric and magnetic fields of the incident wave and the electric field inside the nanoparticle, respectively. Equation (3) indicates that the absorption cross-section is directly proportional to the volume of the particle, and it is related to the electrical conductivity σ of the particle material
σ = ε 0 2 π c λ I m ε
and field enhancement:
E 2 E 0 2 = 1 α 3 ε 0 V 0 2 = 9 ε h 2 R e ε + 2 ε h 2 + I m ε 2
Rearranging Equation (3) yields a more geometric-friendly form:
R e ( ε ) 2 + I m ε b / σ a b s 2 = b / σ a b s 2
where b is
b = 9 V 0 π ε h 3 / 2 / λ .
Equation (6) reveals that, in the (Re(ε), Im(ε)) plane, the geometric locus of a constant absorption cross-section (σabs) is a circle with a radius of b/σabs and a center at (−2εh, b/σabs). This geometric representation provides a powerful tool for visualizing absorption behavior, aiding in the identification of optimal material properties and wavelengths for small sizes. Note that even for small nanospheres, Equation (3) has limited applicability close to the localized plasmonic resonance at ε = −2εh, where it formally yields an infinite absorption cross-section. In our work, Im(ε) is much larger than (2πR/λ)3, so Equation (3) is accurate.

3. Results and Discussion

We evaluate the photothermal response of spherical nanoparticles in water [33] (Figure 1) using five different nanoparticle materials—TaS2 [26], MoS2 [25], PdSe2 [34], Ti3C2 [35], and TiN [36]—selected for their distinct optical properties, making them promising for photothermal therapy.

3.1. Optical Heating Patterns

To put the performance of different materials into the same perspective, we calculated the temperature rise in nanoparticles having the same wavelength-to-radius ratios λ/R as a function of the complex refractive index, where ε = Re(ε) + iIm(ε). For details on the calculations see the Methods Section. The calculation results, presented in Figure 2, reveal the formation of hot zones related to resonant heating, a phenomenon where an incident wave efficiently couples to a nanoparticle eigenmode. This coupling leads to the enhanced local electric field, hence an increased optical absorption. Note that when the Im(ε) is smaller, the field enhancement is stronger due to the higher Q-factor of the corresponding resonance; however too small Im(ε) values will diminish optical absorption. Therefore, the maximum optical absorption is achieved at an optimal value of Im(ε) where radiative losses and absorption losses become equal [37].
Within our study range of particle radii from 5 to 100 nm and operating wavelengths from 650 to 1500 nm, ratios of λ/R = 9 and 100 correspond to large and small nanoparticles, respectively. Also, we added λ/R = 16 as a transitional case between these two extremes.
For λ/R = 100 (Figure 2a), a single electric dipole resonance with Re(ε) ≈ −3.5 is observed, which represents localized surface plasmon resonance. The absorption pattern for this ratio aligns well with the predictions of Equation (3).
For λ/R = 16 (Figure 2b), the same resonance is observed but shows slightly weaker agreement with Equation (3) due to the increased influence of radiative losses which are not accounted for by static approximation. Resonance is left-shifted on the Re(ε)–Im(ε) plane, leading to a slight red shift in the plasmonic resonance. Additionally, a trace of the magnetic dipole (MD) resonance is evident near the boundary of the simulation domain.
For λ/R = 9 (Figure 2c), the larger size of the structure relative to the wavelength leads to the occurrence of multiple resonances. When a material’s excitonic resonance in dielectric function is close to the Mie resonance hotspot, it results in Mie resonance-enhanced optical absorption. At Re(ε) ≈ −3.5, both electric dipole (ED) and electric quadrupole (EQ) plasmonic resonances are observed. MD resonance appears at Re(ε) ≈ 20, and at Re(ε) ≈ 40, both ED and magnetic quadrupole (MQ) resonances are present. The optimal Im(ε) values for dipole mode resonances are higher than those of λ/R = 16 and 100 due to increased radiative losses associated with larger relative sizes. Due to the strong coupling between material’s excitonic and geometric (Mie) resonances, the wavelength corresponding to the maximal optical absorption is red-shifted. The main reason for the red shift is the decrease in Im(ε) at which the maximal optical absorption is observed when the Mie resonance gets closer to the Re(ε) of the material. As a result, the optimal wavelength is shifted closer to the transparency band of highly refractive van der Waals materials capable of supporting Mie resonances.
To get a general sense of how various 2D materials perform across different sizes and wavelengths, we analyze the electric permittivity curves of the materials in Figure 2. The performance of small nanoparticles (Figure 2a) is dictated by how far the material properties are from plasmonic resonance. In this regard, MoS2 and PdSe2 nanoparticles demonstrate low optical absorption. In contrast, the dispersion lines of TaS2 (at λ ≈ 1300 nm), Ti3C2 (at λ ≈ 700, 1500 nm), and TiN (at λ ≈ 650 nm) pass close to the resonance, resulting in strong absorption.
As follows from Figure 2c, large nanoparticles are capable of Mie resonance-enhanced optical absorption. In particular, MoS2 nanoparticles support MD resonance (Re(ε) ≈ 20), followed by ED resonance (Re(ε) ≈ 40) at λ ≲ 700 nm. PdSe2 nanoparticle heating is due to MD resonance, which is particularly pronounced in the 800–1000 nm range. Meanwhile, the optical absorption of TaS2 (λ ≈ 1300 nm), Ti3C2 (λ ≈ 700, 1500 nm), and TiN (λ ≈ 650 nm) nanoparticles is again due to plasmonic resonances (Re(ε) ≈ −3.5).

3.2. Performance of 2D Materials for Photothermal Therapy and Imaging

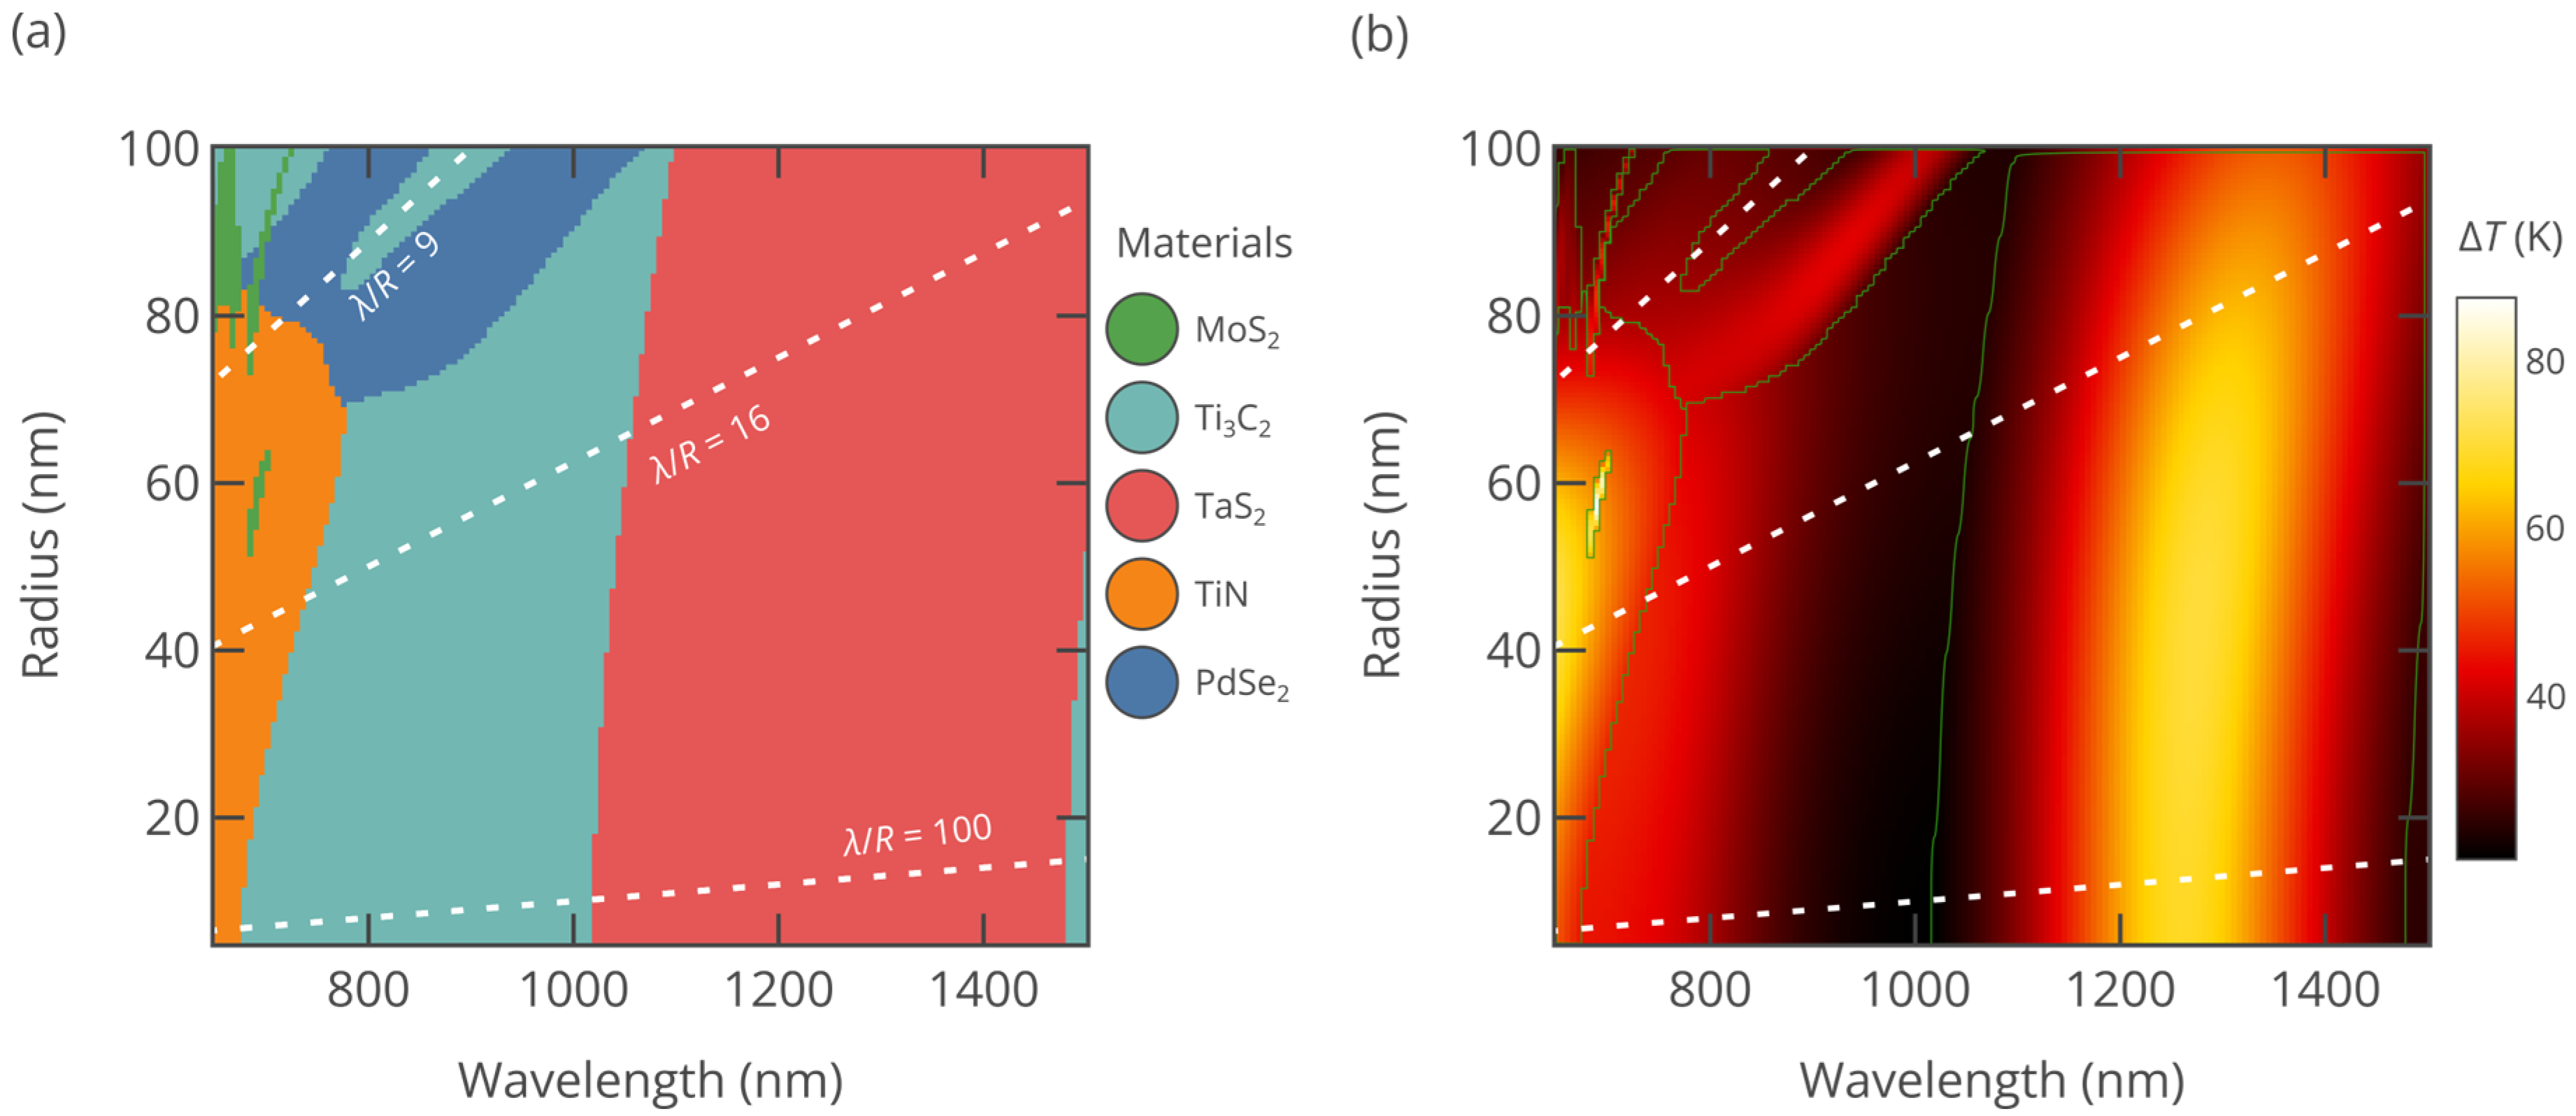
To facilitate a systematic analysis and comparison of the 2D materials mentioned before—TaS2, MoS2, PdSe2, Ti3C2, and TiN—we divide the wavelength range into the NIR-I and NIR-II regions, while particle sizes are grouped as large (“L”: R > 50 nm) or small (“S”: R ≤ 50 nm). This classification creates four distinct zones on the radius–wavelength space: L-NIR-I, S-NIR-I, L-NIR-II, and S-NIR-II. In Figure 3 we plot the top-performing 2D materials and their temperature increase (ΔT) across these zones ( σ a b s and ΔT as a function of R and λ are included in Supplementary Table S1). For effective PTT, it is required that the tissue temperature reaches about 50 °C, which translates to a temperature rise ΔT of less than 20 °C [38]. As can be seen from Figure 3, the studied materials easily surpass this threshold. Meanwhile, Figure 4 demonstrates the heating performance of different materials for large (R = 100 nm) and small (R = 35 nm) nanoparticles within both the NIR-I and NIR-II regions. Below, we assess the performance of each 2D material based on the data presented in Figure 2, Figure 3 and Figure 4.
MoS2 and other semiconducting TMDCs: MoS2, a two-dimensional TMDC, exhibits pronounced excitonic effects due to its reduced dimensionality and strong Coulomb interactions [25,26]. Strong excitonic resonance manifests as the large loop in the Re(ε)–Im(ε) plane shows strong absorption and a high dielectric constant. As a result, with this material it is possible to achieve Mie resonance-assisted optical absorption, which requires the nanoparticle radius to be larger than 50 nm (Figure 3a). In this case, nanoparticles efficiently support ED, MD, and QD resonances. Figure 4 shows that with the increase in radius, resonance is red-shifted and becomes stronger, as expected from our previous analysis based on Figure 2. Other semiconducting TMDCs, e.g., WS2, WSe2, MoSe2, and MoTe2, show similar behavior [24,26], with excitonic resonances in NIR-I and no noticeable absorption in NIR-II, which is below their bandgap. Consequently, MoS2 and other TMDCs are best in narrow wavelength regions in the L-NIR-I zone. In PTT applications MoS2 nanoparticles may benefit from remarkable photothermal stability [20].
PdSe2: Similarly to semiconducting TMDCs, PdSe2 exhibits pronounced excitonic peaks, as reported in previous studies [25], with excitonic transitions forming a distinct arch in its dielectric function line in Figure 2. In the NIR-I window and the early NIR-II region, larger PdSe2 nanoparticles effectively sustain both MD and ED resonances. Although recent analysis of PdSe2 optical and electronic properties established that it is a semimetal [39], due to the momentum mismatch between semimetallic bands, its optical behavior in the near-infrared spectral range is closer to TMDC semiconductors rather than other van der Waals semimetals such as graphene. As a result, like other TMDC semiconductors, PdSe2 demonstrates strong performance in the L-NIR-I zone.
TiN: TiN is not a van der Waals material but has attracted great interest for decades due to its high melting point, chemical durability, and good conductivity, which makes it an “alternative plasmonic material” [40]. The TiN dielectric function crosses zero in the visible range, making it plasmonic in the NIR spectra region and hence attractive for PTT [41]. TiN SNs also show low cytotoxicity and high photothermal stability [41]. Furthermore, the dielectric function shifts away from the heating hotspots in Figure 2 as the wavelength increases. These characteristics explain why TiN exhibits its superior performance primarily in the S-NIR-I zone.
On a side note, many traditional plasmonic materials, such as noble metals and aluminum, undergo plasmonic transition deep in the visible range or even UV, so their uniform spherical nanoparticles perform quite badly as PTT agents. As seen from Figure 4, uniform gold nanoparticles yield temperature rise of less than 10 K throughout the whole NIR spectral region. To improve the performance, core–shell nanoparticles [30] or hollow gold shells [42], which require more sophisticated fabrication protocols [43], should be employed. The improvement in optical absorption comes at a price of increased size—specially designed gold nanoshell particles (Auroshell) for PTT have a diameter of about 150 nm [30].
Ti3C2: Ti3C2 belongs to MXenes, layered materials obtained by the etching of MAX phases [44], where M denotes the metal, A is an A-group atom, and X is carbon or nitrogen. As shown in Figure 2, the Ti3C2 dielectric function line features a loop associated with interband transitions [35], followed by an Re(ε) value of zero crossing near 1400 nm, signifying its metallic nature. As a result, the optical absorption of Ti3C2 nanoparticles in the near-infrared (NIR) region is due to proximity to localized plasmonic resonance. In the L-NIR-I area, they also benefit from the magnetic dipole (MD) response. The dual dielectric/plasmonic response makes Ti3C2 effective across all four zones: L-NIR-I, L-NIR-II, S-NIR-I, and S-NIR-II. Cytotoxicity studies of Ti3C2 MXene sheets show that they are more harmful to cancer cells than to normal ones [45]. Overall, the biocompatibility of Ti3C2 nanoparticles requires additional studies since the chemical activity and surface groups may change during nanoparticle synthesis.
TaS2: Unlike transition metal dichalcogenides composed of group IVB and group VIB transition metal atoms, TaS2 exhibits metallic behavior [46,47]. Tantalum is a biocompatible material; tantalum compounds are in medical use for more than 50 years [48]. Recent studies of PEG-TaS2 nanosheets demonstrated no significant cytotoxicity after 24–48 h of incubation [49]. As illustrated in Figure 2, Re(ε) for TaS2 transitions from positive to negative near 1100 nm, indicating a free-electron response [26]. Unlike Ti3C2, interband transitions in the TaS2 peak in the ultraviolet range do not influence the photoresponse in NIR. Furthermore, among the materials with Re(ε) < 0 whose dispersion curves were plotted in Figure 2, TaS2 demonstrates the lowest Im(ε), attributed to its uniquely low density of scattering states in the NIR, a result of its distinctive electronic band structure [47]. The combination of low Im(ε) and the dielectric function curve passing through Re(ε) = −2εh gives rise to an unparalleled plasmonic absorption peak in the NIR-II region, which is responsible for the remarkable performance of TaS2 nanoparticles in the L-NIR-II and S-NIR-II zones.
Polydispersity: The fabrication of nanoparticles by laser technologies, such as femtosecond laser ablation or laser fragmentation, results in a relatively broad distribution of their sizes. Although the size distribution can be narrowed by separating them via centrifugation, it is near impossible to obtain nanoparticles of the same radius. In this case, the temperature rise can be found by averaging the calculated temperature rise over the radius distribution function dfN = f(R)dR as Δ T λ = 1 f N R 0 0 Δ T λ ,   R R 3 / R 0 3 f R d R . The averaging procedure smoothens the sharp features of ΔT (λ, R) such as the sharp Mie-excitonic resonances of large MoS2 nanoparticles somewhat diminishing their effectiveness. At the same time, broad plasmonic resonances of TiN, Ti3C2, and TaS2 remain unaffected by the polydispersity.
Other applications: SNs that strongly absorb light can have other applications beyond PTT. The same optical properties that make nanoparticles effective for PTT—such as their strong absorption in the NIR region—also make them well-suited for PAI, enabling simultaneous therapeutic and diagnostic applications.

3.3. In-Depth Study of the S-NIR-II Zone

To deepen our understanding of the physics underlying the S-NIR-II zone, we conduct a detailed investigation of TaS2—the most promising material among the examined 2D candidates. Our analysis unfolds in two stages: First, we compare the heating spectra obtained from both Equation (3) and Mie theory. Finally, we introduce a phenomenological model, drawing inspiration from Equations (3)–(6) and the underlying physics, to describe and explain the general behavior of the TaS2 nanoparticle in S-NIR-II.
The heating curve obtained from Equation (3) exhibits a peak temperature rise of ΔT = 78 K at a wavelength of λ = 1261 nm, while the exact curve calculated from the Mie theory shows a peak of ΔT = 70 K at λ = 1272 nm (Figure 5a). In the inset, we have the electric field enhancement at λ = 1272 nm. Given the small nanoparticle radius (R = 35 nm), the result from Equation (3) closely aligns with that of Mie theory. The observed blue shift in the peak position of Equation (3) relative to Mie theory, along with its higher temperature rise, can be attributed to the quasistatic approximation used in Equation (3), which neglects radiation losses and dynamic depolarization [50]. Indeed, according to the long-wavelength approximation [51], plasmonic resonance occurs at ε / ε h = 2 2.4 ε h 2 π R / λ 2 , which has a lower real part of dielectric permittivity; hence it is attained at a slightly higher wavelength.
As the wavelength increases, the TaS2 dispersion curve crosses the purple circles in Figure 5b with progressively smaller radii, which means a higher absorption cross-section. However, between 1200 nm and 1300 nm, this trend reverses, indicating that the absorption peak wavelength lies within this interval. A similar pattern emerges with the dashed red circles in Figure 5b, which indicate the field enhancement: as the wavelength increases, the TaS2 dispersion curve moves toward smaller radii but again reverses between 1200 nm and 1300 nm, thus locating the highest field enhancement resonance in this same wavelength range. An increase in Im(ε), represented by the dashed blue lines in Figure 5b, intensifies ohmic losses within the nanoparticle, reducing the internal-to-incident electric field ratio. As illustrated in the inset of Figure 5a, while a significant field enhancement of |E|/|E0| = 4 occurs around the nanoparticle surface at λ = 1272 nm, the internal field enhancement remains weak with |E|/|E0| = 1.6.
It should be noted that Figure 5b should not be used for the exact determination of the absorption peak, e.g., by finding the purple circle tangent to the dispersion line. According to Equations (6) and (7), the absorption associated with the circle is wavelength-dependent, so a larger circle can correspond to higher absorption if the wavelength is sufficiently smaller; thus the exact maximum is slightly blue-shifted from the tangent point. Nonetheless, it is useful for the illustration of the underlying physical mechanisms driving optical absorption in small nanoparticles.
The performance of small nanospheres is eventually determined by how small Im[ε(ω)] is when Re[ε(ω)] = −2εh. It is instructive to roughly estimate the lower limit of Im(ε). In the visible and near-infrared range, negative permittivity is achieved thanks to free electron gas in metallic materials [52]. The dispersion law of these materials is usually described by ε ω =   ε b ω ω p 2 / ω 2 + i Γ ω , where εb(ω) is the contribution of bound electrons, and the second term is the free carrier response, with ωp and Γ being the plasma frequency and scattering rate. Plasmonic resonance is determined by the following condition: 2 ε h = R e ε b ω ω p 2 / ( ω 3 + Γ 2 ω ) . At the same time, I m ε = I m ε b + Γ ω p 2 / ω 3 + Γ 2 ω , from which we immediately obtain I m ε = I m ε b + 2 ε h + R e ε b Γ / ω . From this equation, it is easy to see conditions which must be met to achieve minimal Im(ε). First, no interband transition channels should be present to ensure Im(εb) = 0. Second, Γ should be as small as possible. This value is determined by electron–phonon interactions and electron–electron scattering, and although they depend on details of electron–phonon and electron–electron coupling and the electronic density of states, a good estimate is Γ = 8 × 10¹³ s−1, which corresponds to the best-performing gold films [53]. Finally, one must achieve a minimal Re(εb) value, ideally, close to one. The main difficulty is that the influence of optical transitions at the characteristic frequency ωtr on Re(ε), according to the Kramers–Kronig relations [54], decays as 1/(ωtrω) and may result in high Re(εb) even when they are far from the interband absorption edge. A prominent illustration of this principle is MoS2 which has ε ≈ 17 in the near-infrared range. Assuming minimal possible Re(εb) = 1 and Im(εb) = 0, we obtain Im(ε) > 0.25 at a wavelength of 1300 nm, corresponding to the center of the NIR-II band. This value is an order of magnitude below that for TaS2, which gives a modest hope that even better materials for theranostic applications can be found in the future.

4. Conclusions

This study presents a comprehensive theoretical analysis of the photothermal response of spherical nanoparticles (SNs) composed of promising materials—TaS2, MoS2, PdSe2, Ti3C2, and TiN—across various sizes and near-infrared (NIR) wavelengths. These materials represent the families of TMDC semiconductors, MXenes, alternative plasmonic materials, and two-dimensional metals and semimetals. Our findings reveal distinct photothermal performance across different materials and spectral zones: MoS2 (and other TMDC semiconductors) excels in the L-NIR-I zone due to its exciton-driven effects, enabling strong magnetic dipole (MD), electric dipole (ED), and quadrupole (QD) resonances. PdSe2 also performs well in the L-NIR-I zone, driven by pronounced excitonic peaks and a metallic Drude response that enhances MD and ED resonances. TaS2 emerges as the top performer in the NIR-II region, particularly for smaller nanoparticles, due to its unique plasmonic absorption properties and minimal radiative losses. Ti3C2 demonstrates versatility across all spectral zones, supported by its dual dielectric/plasmonic response and interband transitions, while TiN shows superior performance in the S-NIR-I zone due to its plasmonic response at shorter wavelengths.
Among these materials, the van der Waals metal TaS2 stands out as the most promising candidate for photothermal therapy (PTT), achieving optimal photothermal heating efficiency in the NIR-II region. The theoretical framework developed in this study provides critical insights into the design of efficient photothermal transduction agents, underscoring the importance of material selection, nanoparticle size, and wavelength optimization. These findings advance the potential of PTT, particularly in cancer treatment, by enabling localized hyperthermia that selectively targets malignant cells while sparing healthy tissues. This research can be further developed in the direction of TaS2 and Ti3C2 nanoparticle fabrication and by testing their photothermal conversion, cytotoxicity, and biocompatibility, followed by in vivo PTT studies. Also, we predict the possibility of other materials which can outperform TaS2. This work paves the way for the development of next-generation photothermal transduction agents with enhanced therapeutic efficacy.

Supplementary Materials

The following supporting information can be downloaded at https://www.mdpi.com/article/10.3390/nano15120942/s1, Table S1. Absorption cross-section σabs and temperature rise ΔT as a function of the wavelength and nanoparticle radius for different materials.

Author Contributions

Conceptualization, A.A.V. and A.V.A.; methodology, A.A.V. and V.V.; software, A.E. and A.A.V.; investigation, A.E. and N.V.P.; writing—original draft preparation, A.E.; writing—review and editing, N.V.P. and A.A.V.; supervision, A.V.A., V.V., and A.A.V.; funding acquisition, A.A.V. All authors have read and agreed to the published version of the manuscript.

Funding

A.E., N.V.P., and A.A.V. acknowledge support by the Russian Science Foundation grant #22-79-10312.

Data Availability Statement

The original contributions presented in the study are included in the article; further inquiries can be directed to the corresponding authors.

Conflicts of Interest

The authors declare no conflicts of interest. The funders had no role in the design of the study; in the collection, analyses, or interpretation of data; in the writing of the manuscript; or in the decision to publish the results.

References

  1. Sharma, S.; Batra, S.; Chauhan, M.K.; Kumar, V. Photothermal Therapy for Cancer Treatment. In Biological and Medical Physics, Biomedical Engineering; Springer: Singapore, 2023; pp. 755–780. ISBN 9789811997853. [Google Scholar]
  2. Hong, F.; Geng, X.; Min, G.; Sun, X.; Zhang, B.; Yao, Y.; Li, R.; Wang, J.; Zhao, H.; Guo, P.; et al. Deep NIR-II Optical Imaging Combined with Minimally Invasive Interventional Photothermal Therapy for Orthotopic Bladder Cancer. Chem. Eng. J. 2022, 449, 137846. [Google Scholar] [CrossRef]
  3. Xie, X.; Gao, W.; Hao, J.; Wu, J.; Cai, X.; Zheng, Y. Self-Synergistic Effect of Prussian Blue Nanoparticles for Cancer Therapy: Driving Photothermal Therapy and Reducing Hyperthermia-Induced Side Effects. J. Nanobiotechnol. 2021, 19, 126. [Google Scholar] [CrossRef]
  4. Jaque, D.; Martínez Maestro, L.; del Rosal, B.; Haro-Gonzalez, P.; Benayas, A.; Plaza, J.L.; Martín Rodríguez, E.; García Solé, J. Nanoparticles for Photothermal Therapies. Nanoscale 2014, 6, 9494–9530. [Google Scholar] [CrossRef] [PubMed]
  5. Duan, S.; Hu, Y.; Zhao, Y.; Tang, K.; Zhang, Z.; Liu, Z.; Wang, Y.; Guo, H.; Miao, Y.; Du, H.; et al. Nanomaterials for Photothermal Cancer Therapy. RSC Adv. 2023, 13, 14443–14460. [Google Scholar] [CrossRef]
  6. Liu, G.; Yan, C.; Kuang, D.; Song, L. Broadband Optical Absorption and Photothermal Properties of Partially Disordered MoSe2 Nanospheres. Mater. Chem. Phys. 2023, 293, 126948. [Google Scholar] [CrossRef]
  7. Yu, X.; Fan, S.; Zhu, B.; El-Hout, S.I.; Zhang, J.; Chen, C. Recent Progress on Photothermal Nanomaterials: Design, Mechanism, and Applications. Green Energy Environ. 2024, in press. [Google Scholar]
  8. Lamiel, C.; Hussain, I.; Warner, J.H.; Zhang, K. Beyond Ti-Based MXenes: A Review of Emerging Non-Ti Based Metal-MXene Structure, Properties, and Applications. Mater. Today 2023, 63, 313–338. [Google Scholar] [CrossRef]
  9. Wang, L.; Jiang, X.; Ji, Y.; Bai, R.; Zhao, Y.; Wu, X.; Chen, C. Surface Chemistry of Gold Nanorods: Origin of Cell Membrane Damage and Cytotoxicity. Nanoscale 2013, 5, 8384–8391. [Google Scholar] [CrossRef] [PubMed]
  10. Chen, D.; Miao, B.; Zhu, G.; Liang, Y.; Wang, C. Controllable Synthesis and Biomedical Applications of Bismuth-Based Nanospheres: Enhanced Photothermal Therapy and CT Imaging Efficiency. Nanoscale 2025, 17, 2281–2291. [Google Scholar] [CrossRef]
  11. Chithrani, B.D.; Ghazani, A.A.; Chan, W.C.W. Determining the Size and Shape Dependence of Gold Nanoparticle Uptake into Mammalian Cells. Nano Lett. 2006, 6, 662–668. [Google Scholar] [CrossRef]
  12. Foroozandeh, P.; Aziz, A.A. Insight into Cellular Uptake and Intracellular Trafficking of Nanoparticles. Nanoscale Res. Lett. 2018, 13, 339. [Google Scholar] [CrossRef]
  13. Lu, B.; Wang, J.; Hendriks, A.J.; Nolte, T.M. Clearance of Nanoparticles from Blood: Effects of Hydrodynamic Size and Surface Coatings. Environ. Sci. Nano 2024, 11, 406–417. [Google Scholar] [CrossRef]
  14. Rejman, J.; Oberle, V.; Zuhorn, I.S.; Hoekstra, D. Size-Dependent Internalization of Particles via the Pathways of Clathrin- and Caveolae-Mediated Endocytosis. Biochem. J. 2004, 377, 159–169. [Google Scholar] [CrossRef]
  15. Zolnik, B.S.; González-Fernández, A.; Sadrieh, N.; Dobrovolskaia, M.A. Nanoparticles and the Immune System. Endocrinology 2010, 151, 458–465. [Google Scholar] [CrossRef] [PubMed]
  16. Tsai, M.-F.; Chang, S.-H.G.; Cheng, F.-Y.; Shanmugam, V.; Cheng, Y.-S.; Su, C.-H.; Yeh, C.-S. Au Nanorod Design as Light-Absorber in the First and Second Biological near-Infrared Windows for in Vivo Photothermal Therapy. ACS Nano 2013, 7, 5330–5342. [Google Scholar] [CrossRef]
  17. Hong, G.; Antaris, A.L.; Dai, H. Near-Infrared Fluorophores for Biomedical Imaging. Nat. Biomed. Eng. 2017, 1, 0010. [Google Scholar] [CrossRef]
  18. Zhang, Z.; Du, Y.; Shi, X.; Wang, K.; Qu, Q.; Liang, Q.; Ma, X.; He, K.; Chi, C.; Tang, J.; et al. NIR-II Light in Clinical Oncology: Opportunities and Challenges. Nat. Rev. Clin. Oncol. 2024, 21, 449–467. [Google Scholar] [CrossRef]
  19. He, S.; Song, J.; Qu, J.; Cheng, Z. Crucial Breakthrough of Second near-Infrared Biological Window Fluorophores: Design and Synthesis toward Multimodal Imaging and Theranostics. Chem. Soc. Rev. 2018, 47, 4258–4278. [Google Scholar] [CrossRef] [PubMed]
  20. Tselikov, G.I.; Ermolaev, G.A.; Popov, A.A.; Tikhonowski, G.V.; Panova, D.A.; Taradin, A.S.; Vyshnevyy, A.A.; Syuy, A.V.; Klimentov, S.M.; Novikov, S.M.; et al. Transition Metal Dichalcogenide Nanospheres for High-Refractive-Index Nanophotonics and Biomedical Theranostics. Proc. Natl. Acad. Sci. USA 2022, 119, e2208830119. [Google Scholar] [CrossRef]
  21. Chernikov, A.S.; Tselikov, G.I.; Gubin, M.Y.; Shesterikov, A.V.; Khorkov, K.S.; Syuy, A.V.; Ermolaev, G.A.; Kazantsev, I.S.; Romanov, R.I.; Markeev, A.M.; et al. Tunable Optical Properties of Transition Metal Dichalcogenide Nanoparticles Synthesized by Femtosecond Laser Ablation and Fragmentation. J. Mater. Chem. C 2023, 11, 3493–3503. [Google Scholar] [CrossRef]
  22. Tselikov, G.I.; Minnekhanov, A.A.; Ermolaev, G.A.; Tikhonowski, G.V.; Kazantsev, I.S.; Dyubo, D.V.; Panova, D.A.; Tselikov, D.I.; Popov, A.A.; Mazitov, A.B.; et al. Tunable Nanostructuring for van der Waals Materials. ACS Nano 2025, in press. [Google Scholar] [CrossRef]
  23. Ushkov, A.; Dyubo, D.; Belozerova, N.; Kazantsev, I.; Yakubovsky, D.; Syuy, A.; Tikhonowski, G.V.; Tselikov, D.; Martynov, I.; Ermolaev, G.; et al. Tungsten Diselenide Nanoparticles Produced via Femtosecond Ablation for SERS and Theranostics Applications. Nanomaterials 2024, 15, 4. [Google Scholar] [CrossRef] [PubMed]
  24. Vyshnevyy, A.A.; Ermolaev, G.A.; Grudinin, D.V.; Voronin, K.V.; Kharichkin, I.; Mazitov, A.; Kruglov, I.A.; Yakubovsky, D.I.; Mishra, P.; Kirtaev, R.V.; et al. Van der Waals Materials for Overcoming Fundamental Limitations in Photonic Integrated Circuitry. Nano Lett. 2023, 23, 8057–8064. [Google Scholar] [CrossRef]
  25. Ermolaev, G.A.; Stebunov, Y.V.; Vyshnevyy, A.A.; Tatarkin, D.E.; Yakubovsky, D.I.; Novikov, S.M.; Baranov, D.G.; Shegai, T.; Nikitin, A.Y.; Arsenin, A.V.; et al. Broadband Optical Properties of Monolayer and Bulk MoS2. npj 2D Mater. Appl. 2020, 4, 21. [Google Scholar] [CrossRef]
  26. Munkhbat, B.; Wróbel, P.; Antosiewicz, T.J.; Shegai, T.O. Optical Constants of Several Multilayer Transition Metal Dichalcogenides Measured by Spectroscopic Ellipsometry in the 300–1700 Nm Range: High Index, Anisotropy, and Hyperbolicity. ACS Photonics 2022, 9, 2398–2407. [Google Scholar] [CrossRef]
  27. Yang, X.; Stein, E.W.; Ashkenazi, S.; Wang, L.V. Nanoparticles for Photoacoustic Imaging. Wiley Interdiscip Rev. Nanomed. Nanobiotechnol. 2009, 1, 360–368. [Google Scholar] [CrossRef]
  28. Li, W.; Chen, X. Gold Nanoparticles for Photoacoustic Imaging. Nanomedicine 2015, 10, 299–320. [Google Scholar] [CrossRef]
  29. Fu, Q.; Sun, W. Mie Theory for Light Scattering by a Spherical Particle in an Absorbing Medium. Appl. Opt. 2001, 40, 1354–1361. [Google Scholar] [CrossRef]
  30. Rastinehad, A.R.; Anastos, H.; Wajswol, E.; Winoker, J.S.; Sfakianos, J.P.; Doppalapudi, S.K.; Carrick, M.R.; Knauer, C.J.; Taouli, B.; Lewis, S.C.; et al. Gold Nanoshell-Localized Photothermal Ablation of Prostate Tumors in a Clinical Pilot Device Study. Proc. Natl. Acad. Sci. USA 2019, 116, 18590–18596. [Google Scholar] [CrossRef]
  31. Yang, L.; Liu, Y.; Wang, Q.; Shi, H.; Li, G.; Zhang, L. The Plasmon Resonance Absorption of Ag/SiO2 Nanocomposite Films. Microelectron. Eng. 2003, 66, 192–198. [Google Scholar] [CrossRef]
  32. Barnes, W.L. Particle Plasmons: Why Shape Matters. Am. J. Phys. 2016, 84, 593–601. [Google Scholar] [CrossRef]
  33. Hale, G.M.; Querry, M.R. Optical Constants of Water in the 200-Nm to 200-Microm Wavelength Region. Appl. Opt. 1973, 12, 555–563. [Google Scholar] [CrossRef]
  34. Ermolaev, G.; Voronin, K.; Baranov, D.G.; Kravets, V.; Tselikov, G.; Stebunov, Y.; Yakubovsky, D.; Novikov, S.; Vyshnevyy, A.; Mazitov, A.; et al. Topological Phase Singularities in Atomically Thin High-Refractive-Index Materials. Nat. Commun. 2022, 13, 2049. [Google Scholar] [CrossRef]
  35. Panova, D.A.; Tselikov, G.I.; Ermolaev, G.A.; Syuy, A.V.; Zimbovskii, D.S.; Kapitanova, O.O.; Yakubovsky, D.I.; Mazitov, A.B.; Kruglov, I.A.; Vyshnevyy, A.A.; et al. Broadband Optical Properties of Ti3C2 MXene Revisited. Opt. Lett. 2024, 49, 25–28. [Google Scholar] [CrossRef]
  36. Pflüger, J.; Fink, J.; Weber, W.; Bohnen, K.P.; Crecelius, G. Dielectric Properties of TiCx,TiNx,VCx, and VNx from 1.5 to 40 eV Determined by Electron-Energy-Loss Spectroscopy. Phys. Rev. B 1984, 30, 1155–1163. [Google Scholar] [CrossRef]
  37. Zograf, G.P.; Petrov, M.I.; Makarov, S.V.; Kivshar, Y.S. All-Dielectric Thermonanophotonics. Adv. Opt. Photonics 2021, 13, 643–702. [Google Scholar] [CrossRef]
  38. Zhao, L.; Zhang, X.; Wang, X.; Guan, X.; Zhang, W.; Ma, J. Recent Advances in Selective Photothermal Therapy of Tumor. J. Nanobiotechnol. 2021, 19, 335. [Google Scholar] [CrossRef]
  39. Volkov, V.; Slavich, A.; Ermolaev, G.; Pak, N.; Grudinin, D.; Kravtsov, K.; Tatmyshevskiy, M.; Semkin, V.; Syuy, A.; Mazitov, A.; et al. All-in-One van der Waals Material for Light Detection, Guiding and Modulation. Res. Sq. 2025. [Google Scholar]
  40. Naik, G.V.; Shalaev, V.M.; Boltasseva, A. Alternative Plasmonic Materials: Beyond Gold and Silver. Adv. Mater. 2013, 25, 3264–3294. [Google Scholar] [CrossRef]
  41. Jiang, W.; Fu, Q.; Wei, H.; Yao, A. TiN Nanoparticles: Synthesis and Application as near-Infrared Photothermal Agents for Cancer Therapy. J. Mater. Sci. 2019, 54, 5743–5756. [Google Scholar] [CrossRef]
  42. Grabowska-Jadach, I.; Kalinowska, D.; Drozd, M.; Pietrzak, M. Synthesis, Characterization and Application of Plasmonic Hollow Gold Nanoshells in a Photothermal Therapy-New Particles for Theranostics. Biomed. Pharmacother. 2019, 111, 1147–1155. [Google Scholar] [CrossRef] [PubMed]
  43. Oldenburg, S.J.; Averitt, R.D.; Westcott, S.L.; Halas, N.J. Nanoengineering of Optical Resonances. Chem. Phys. Lett. 1998, 288, 243–247. [Google Scholar] [CrossRef]
  44. VahidMohammadi, A.; Rosen, J.; Gogotsi, Y. The World of Two-Dimensional Carbides and Nitrides (MXenes). Science 2021, 372, eabf1581. [Google Scholar] [CrossRef]
  45. Jastrzębska, A.M.; Szuplewska, A.; Wojciechowski, T.; Chudy, M.; Ziemkowska, W.; Chlubny, L.; Rozmysłowska, A.; Olszyna, A. In Vitro Studies on Cytotoxicity of Delaminated TiC MXene. J. Hazard. Mater. 2017, 339, 1–8. [Google Scholar] [CrossRef] [PubMed]
  46. Gjerding, M.N.; Petersen, R.; Pedersen, T.G.; Mortensen, N.A.; Thygesen, K.S. Layered van der Waals Crystals with Hyperbolic Light Dispersion. Nat. Commun. 2017, 8, 320. [Google Scholar] [CrossRef]
  47. Gjerding, M.N.; Pandey, M.; Thygesen, K.S. Band Structure Engineered Layered Metals for Low-Loss Plasmonics. Nat. Commun. 2017, 8, 15133. [Google Scholar] [CrossRef] [PubMed]
  48. Black, J. Biological Performance of Tantalum. Clin. Mater. 1994, 16, 167–173. [Google Scholar] [CrossRef]
  49. Liu, Y.; Ji, X.; Liu, J.; Tong, W.W.L.; Askhatova, D.; Shi, J. Tantalum Sulfide Nanosheets as a Theranostic Nanoplatform for Computed Tomography Imaging-Guided Combinatorial Chemo-Photothermal Therapy. Adv. Funct. Mater. 2017, 27, 1703261. [Google Scholar] [CrossRef]
  50. Meier, M.; Wokaun, A. Enhanced Fields on Large Metal Particles: Dynamic Depolarization. Opt. Lett. 1983, 8, 581–583. [Google Scholar] [CrossRef]
  51. Rasskazov, I.L.; Zakomirnyi, V.I.; Utyushev, A.D.; Carney, P.S.; Moroz, A. Remarkable Predictive Power of the Modified Long Wavelength Approximation. J. Phys. Chem. C 2021, 125, 1963–1971. [Google Scholar] [CrossRef]
  52. Khurgin, J.B. How to Deal with the Loss in Plasmonics and Metamaterials. Nat. Nanotechnol. 2015, 10, 2–6. [Google Scholar] [CrossRef] [PubMed]
  53. Yakubovsky, D.I.; Arsenin, A.V.; Stebunov, Y.V.; Fedyanin, D.Y.; Volkov, V.S. Optical Constants and Structural Properties of Thin Gold Films. Opt. Express 2017, 25, 25574–25587. [Google Scholar] [CrossRef] [PubMed]
  54. Hu, B.Y.-K. Kramers–Kronig in Two Lines. Am. J. Phys. 1989, 57, 821. [Google Scholar] [CrossRef]
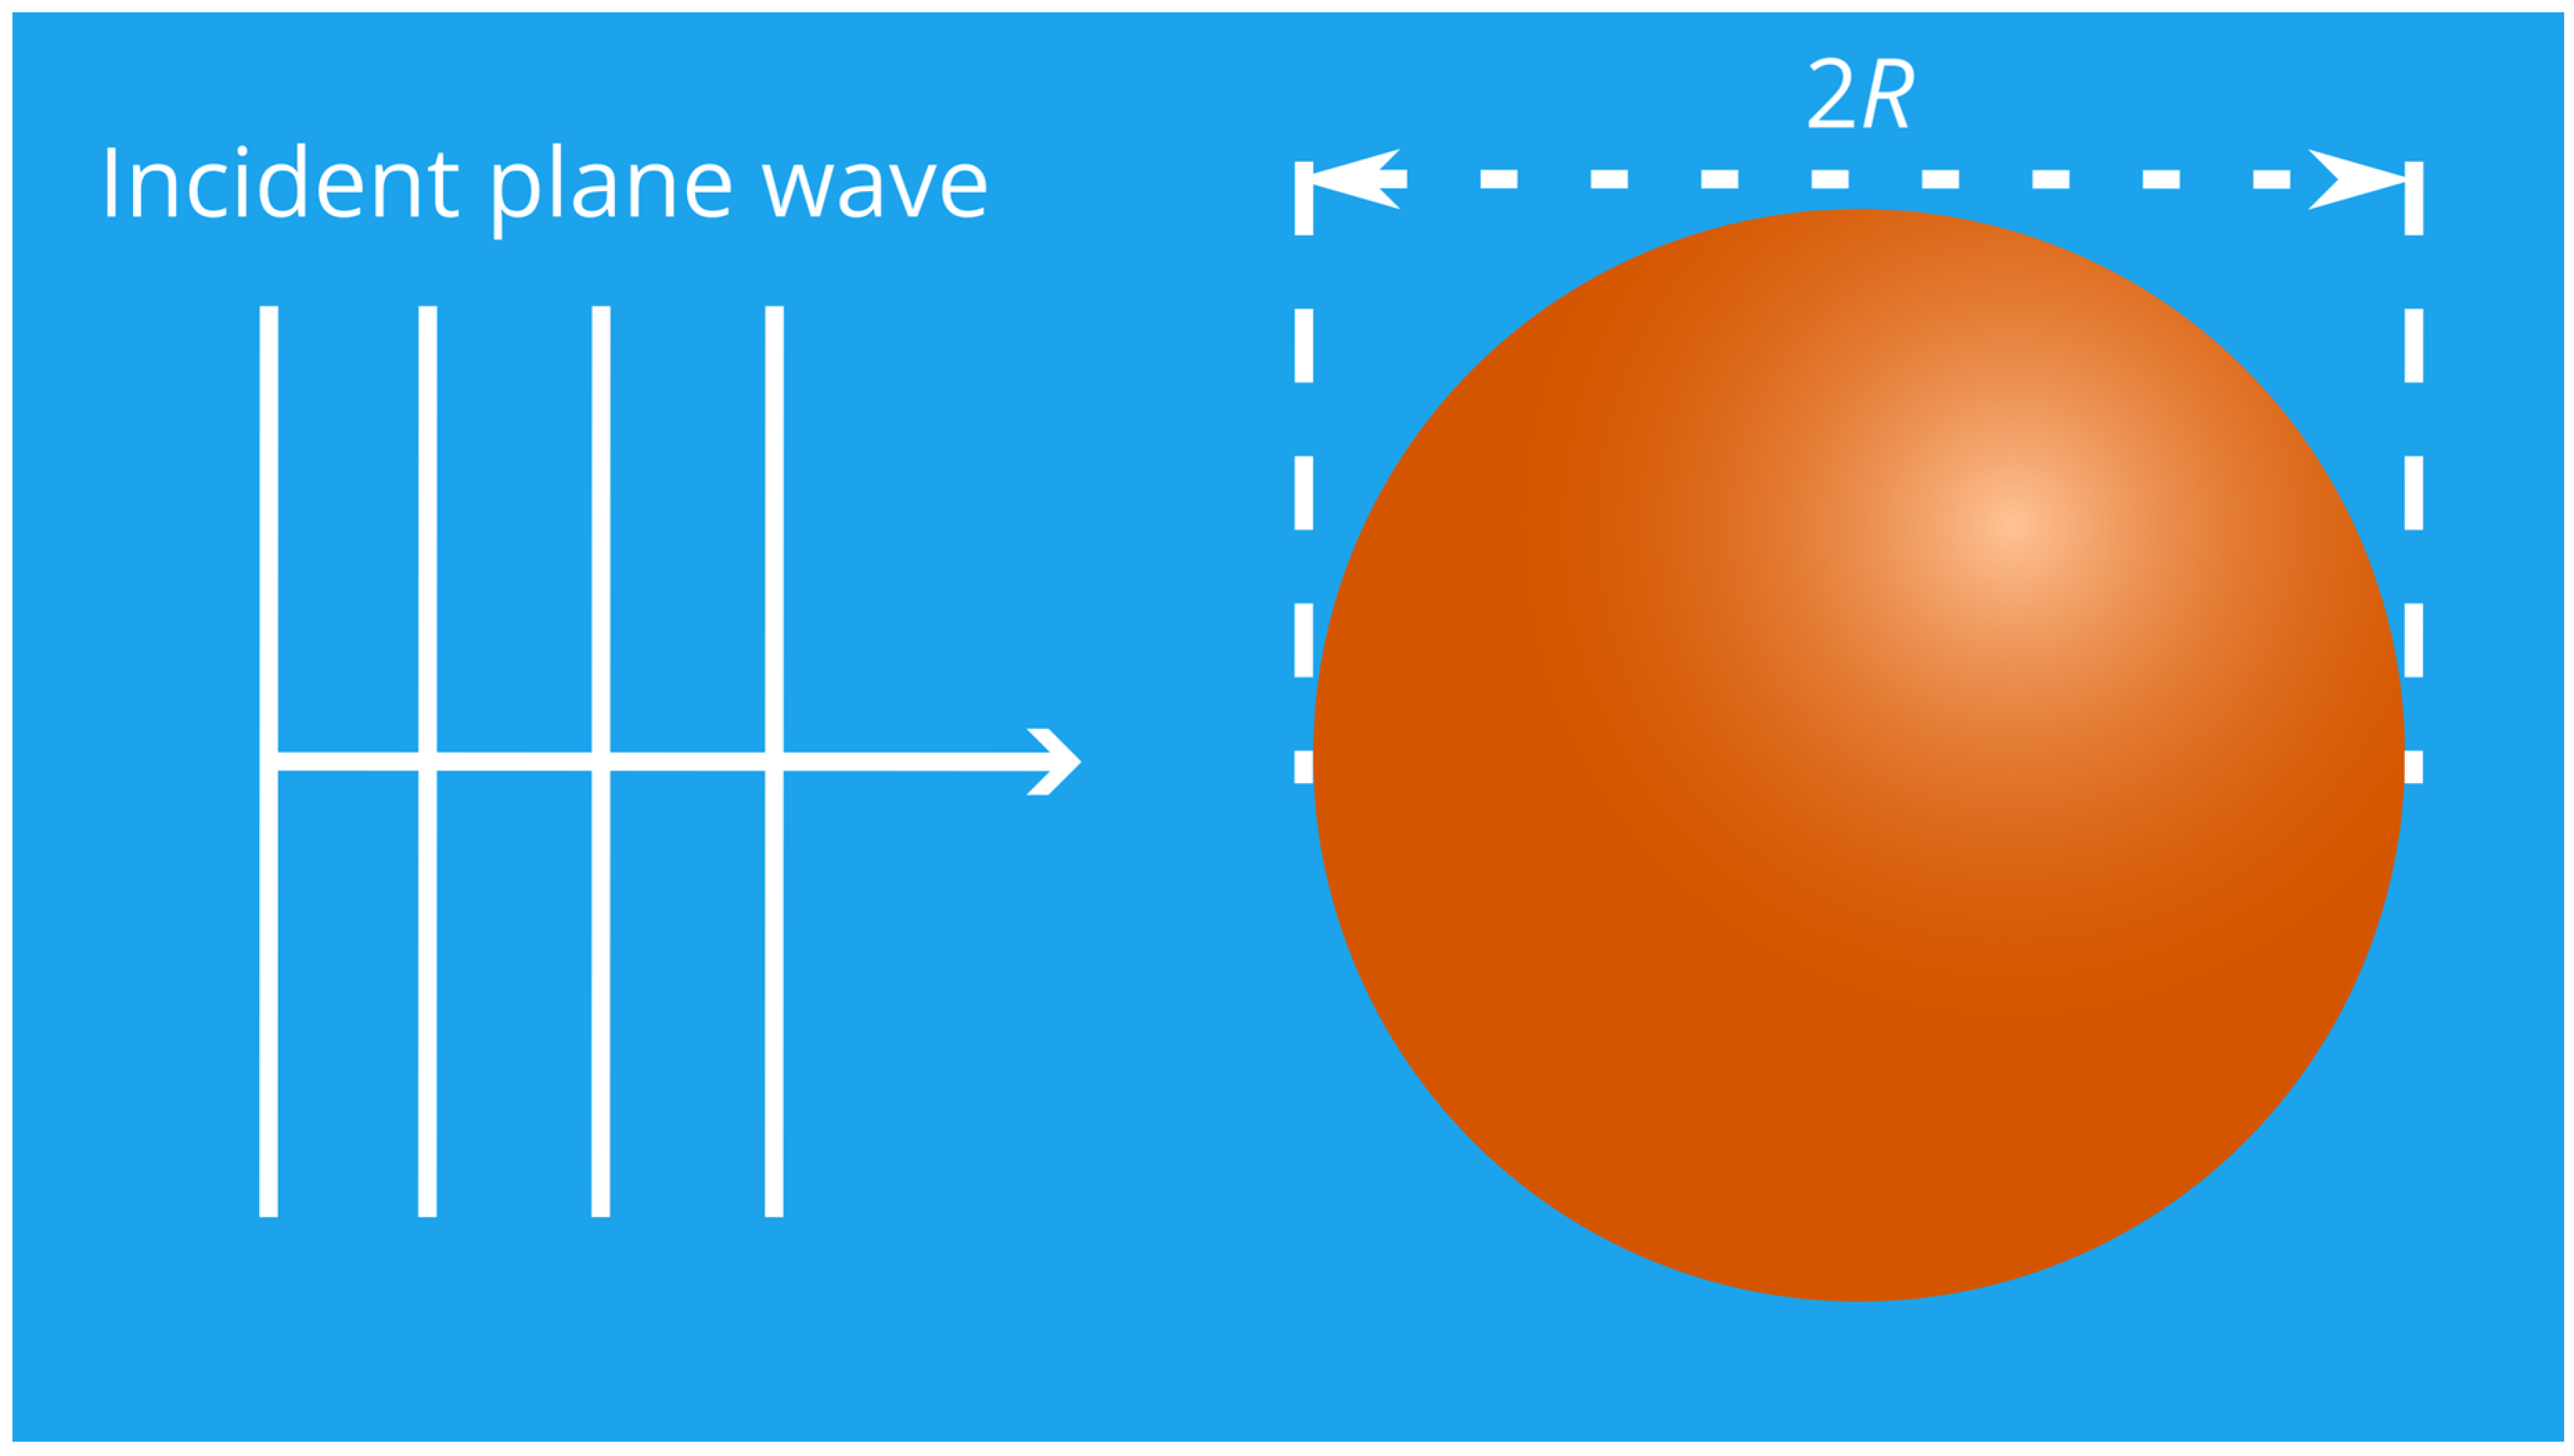
Figure 1. A plane wave incident upon a spherical nanoparticle of radius R embedded in a transparent medium.
Nanomaterials 15 00942 g001
Figure 2. Calculated heating maps for spherical nanoparticles in water (refractive index: 1.327 [33]) with fixed wavelength (λ)-to-radius (R) ratios for different real and imaginary parts of permittivity: (a) λ/R = 100, (b) λ/R = 16, and (c) λ/R = 9. Directed blue lines depict the dispersion ε(λ) of different materials. Arrow directions correspond to the increase in wavelength from 650 nm to 1500 nm. Consecutive dots are 100 nm apart in wavelength. Thin green lines are lines of equal absorption within the static approximation plotted according to Equation (6). Note that Tmax differs for panels (ac).
Nanomaterials 15 00942 g002
Figure 3. (a) Color map of the best-performing materials across radii ranging from 5 nm to 100 nm and wavelengths spanning 650 nm to 1500 nm. (b) Heating map for the selected materials. The green lines in panel (b) separate the areas of different materials. Dashed lines in panels (a,b) correspond to constant λ/R ratios in Figure 2.
Nanomaterials 15 00942 g003
Figure 4. Heating as a function of wavelength for nanoparticles with radii of (a) R = 35 nm and (b) R = 100 nm composed of various materials. For comparison we added gold nanospheres of the same radii. The host medium is water.
Nanomaterials 15 00942 g004
Figure 5. (a) Heating calculated using Mie theory for a nanoparticle with R = 35 nm (solid line) and Equation (3) (dashed line). The inset shows the electric field enhancement at λ = 1272 nm. (b) The directed blue-green line depicts the dispersion ε(λ) of TaS2 in the Re(ε)–Im(ε) plane. The arrow direction corresponds to the increase in λ from 1000 nm to 1500 nm. The solid purple lines are lines of equal absorption within the static approximation plotted according to Equation (6). The dashed blue lines are the lines of constant electrical conductivity (Equation (4)). The dashed red lines are the lines of constant electric field enhancement (Equation (5)).
Nanomaterials 15 00942 g005
Disclaimer/Publisher’s Note: The statements, opinions and data contained in all publications are solely those of the individual author(s) and contributor(s) and not of MDPI and/or the editor(s). MDPI and/or the editor(s) disclaim responsibility for any injury to people or property resulting from any ideas, methods, instructions or products referred to in the content.