

Experimental Investigation of the Viscosity and Stability of Scleroglucan-Based Nanofluids for Enhanced Oil Recovery

 ,
,  ,
,  and
and 
Abstract
1. Introduction
2. Materials and Methods
2.1. Materials and Reagents
2.2. Methods
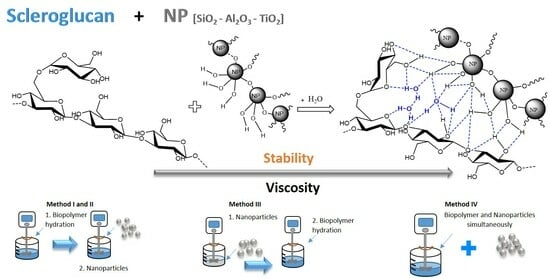
2.2.1. Nanofluid Preparation
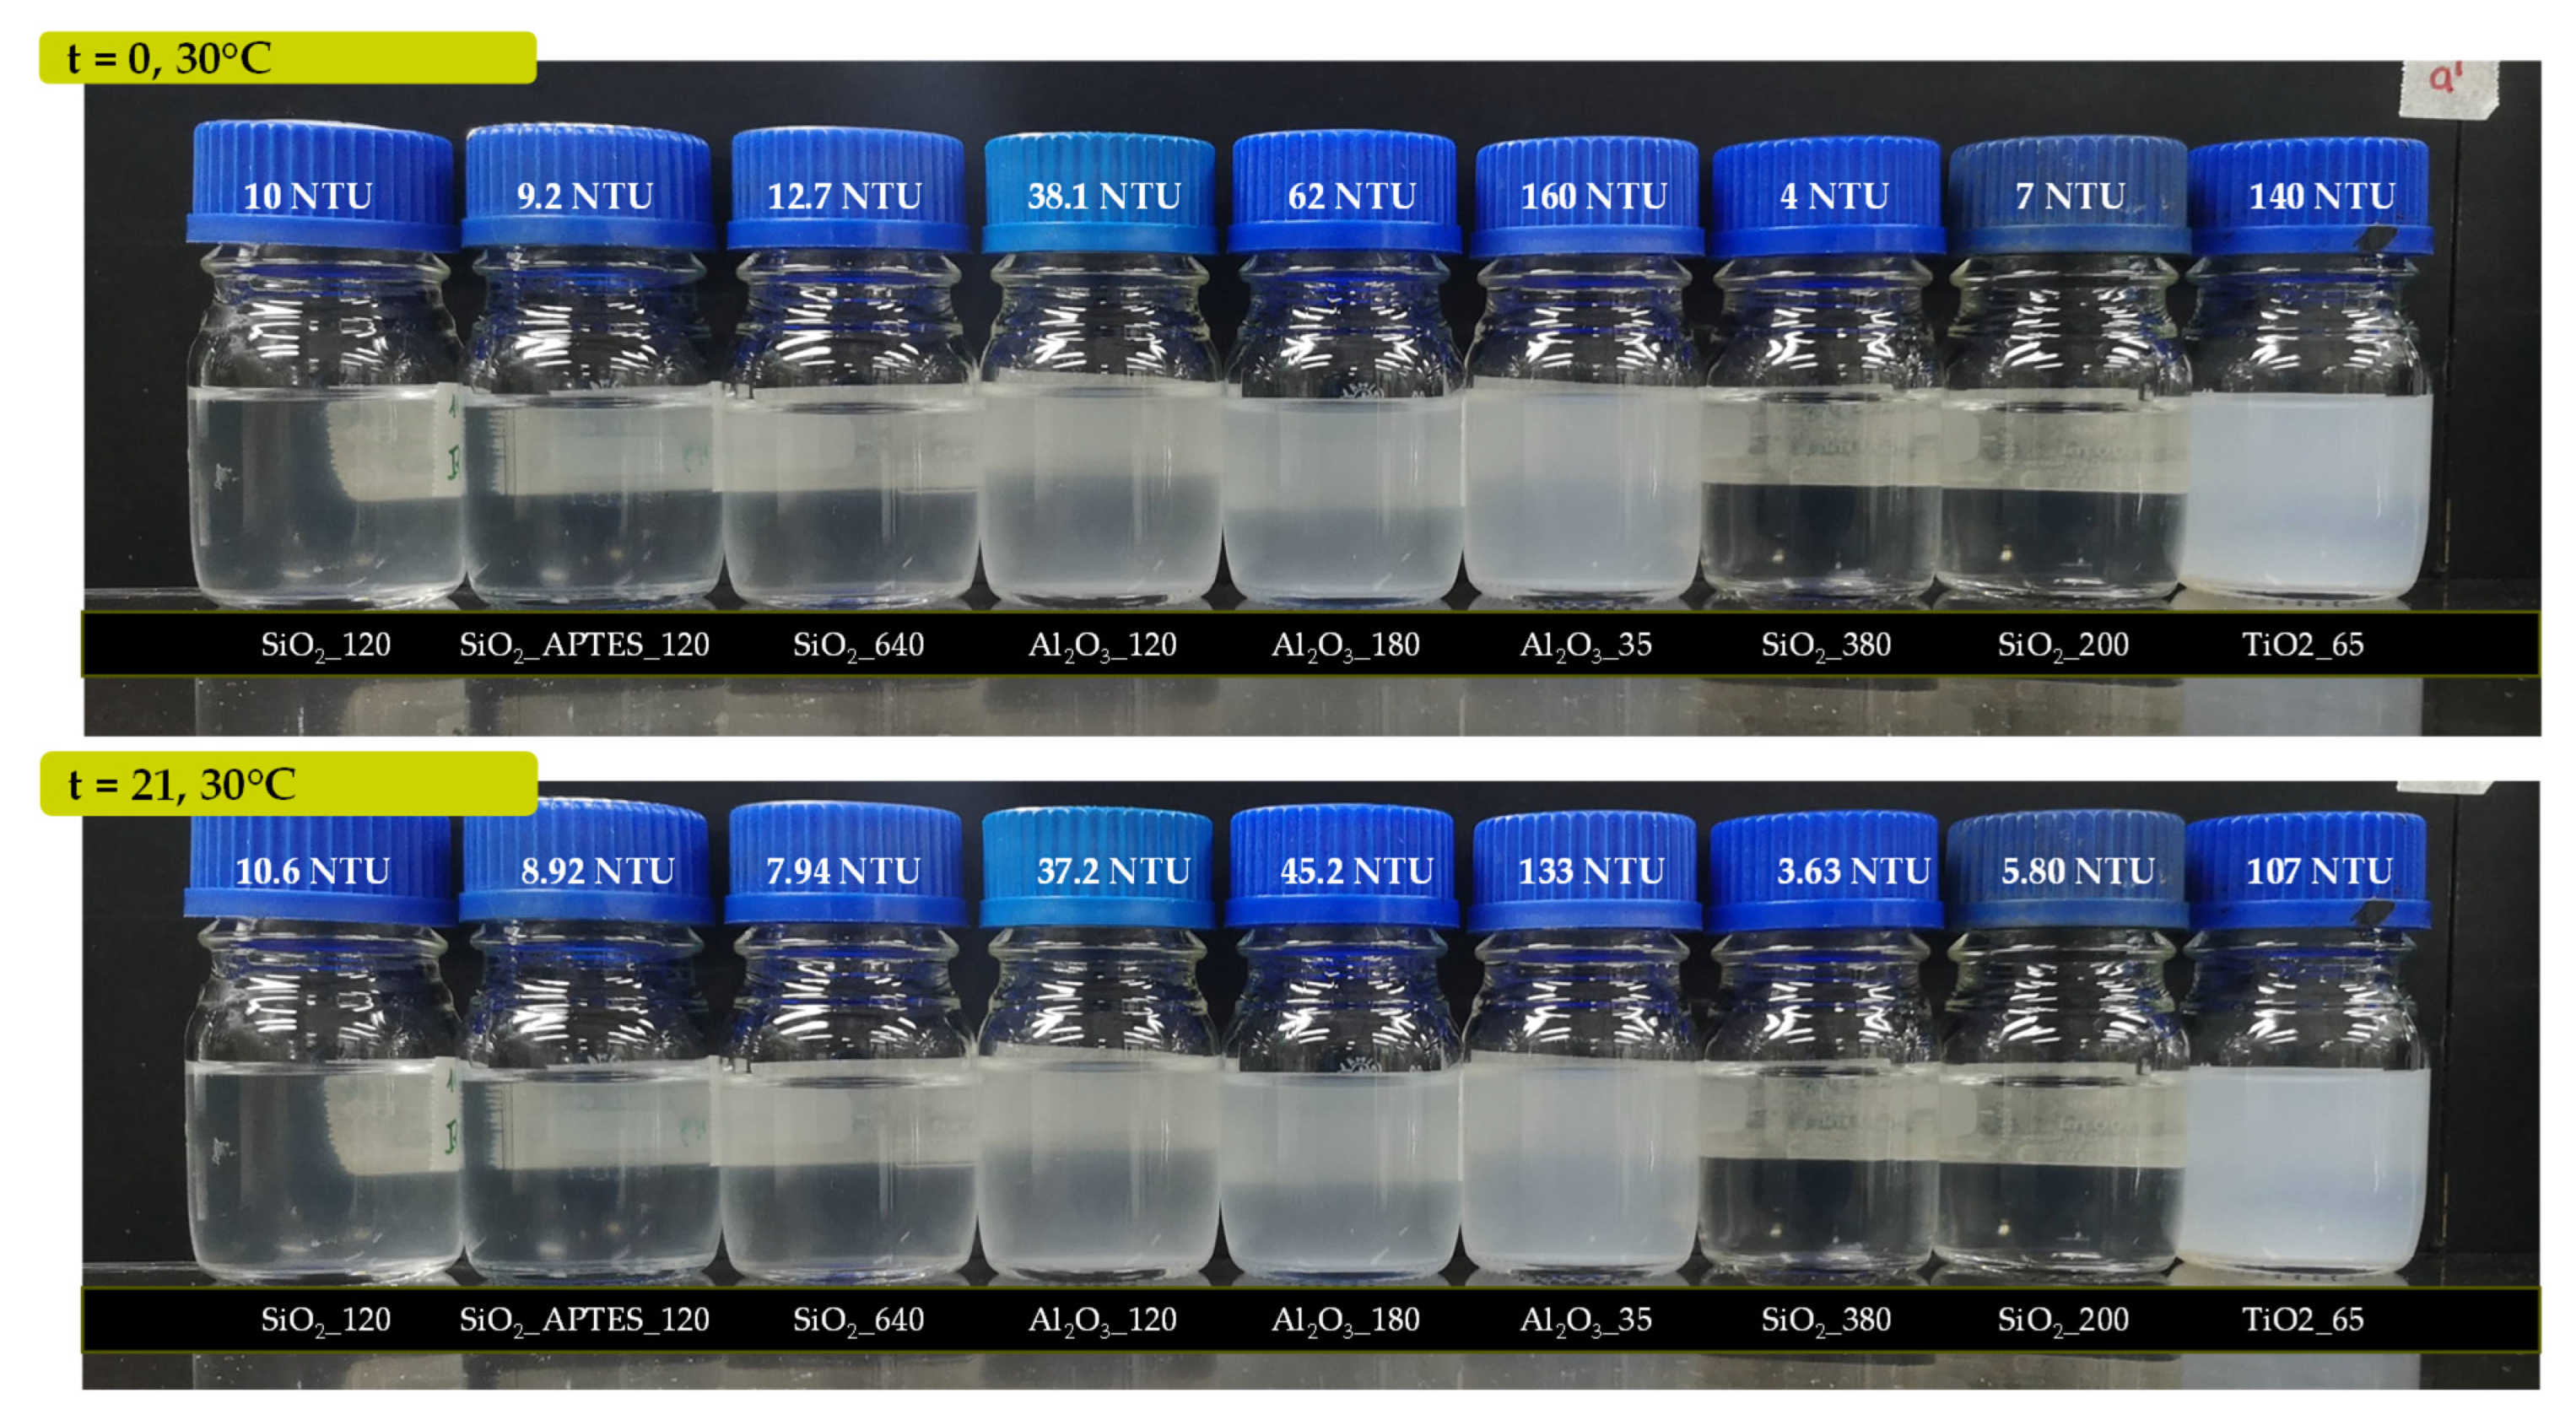
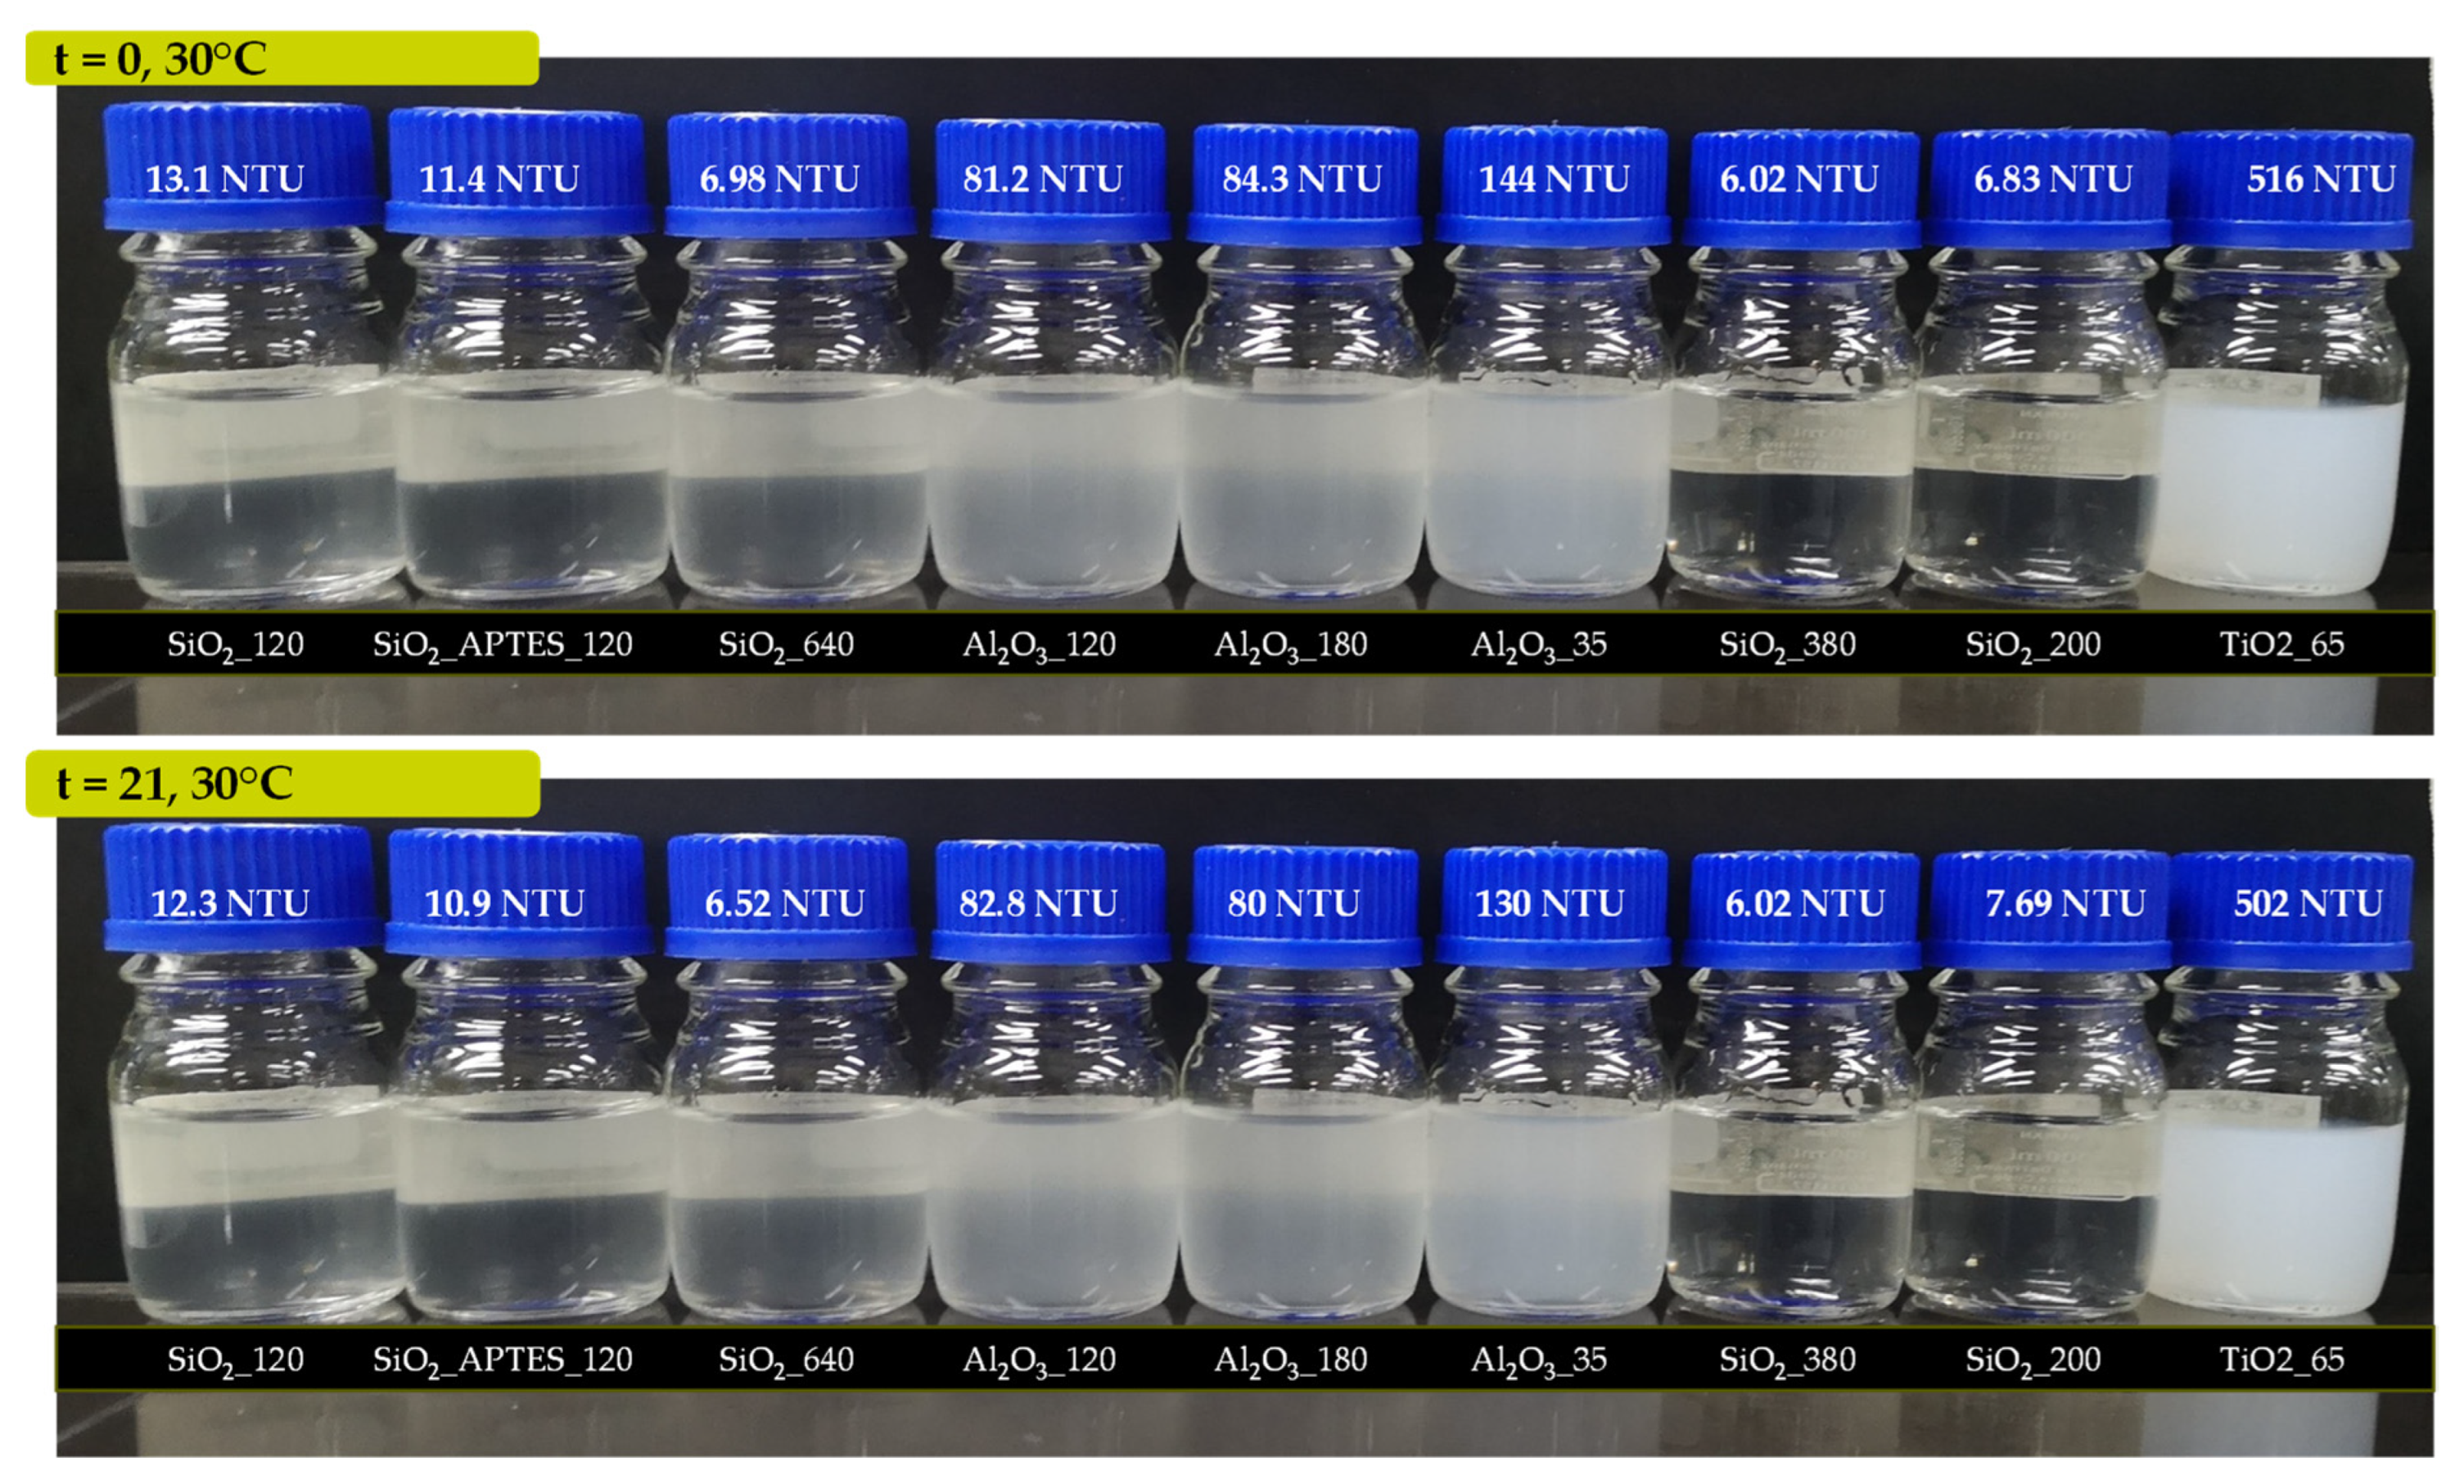
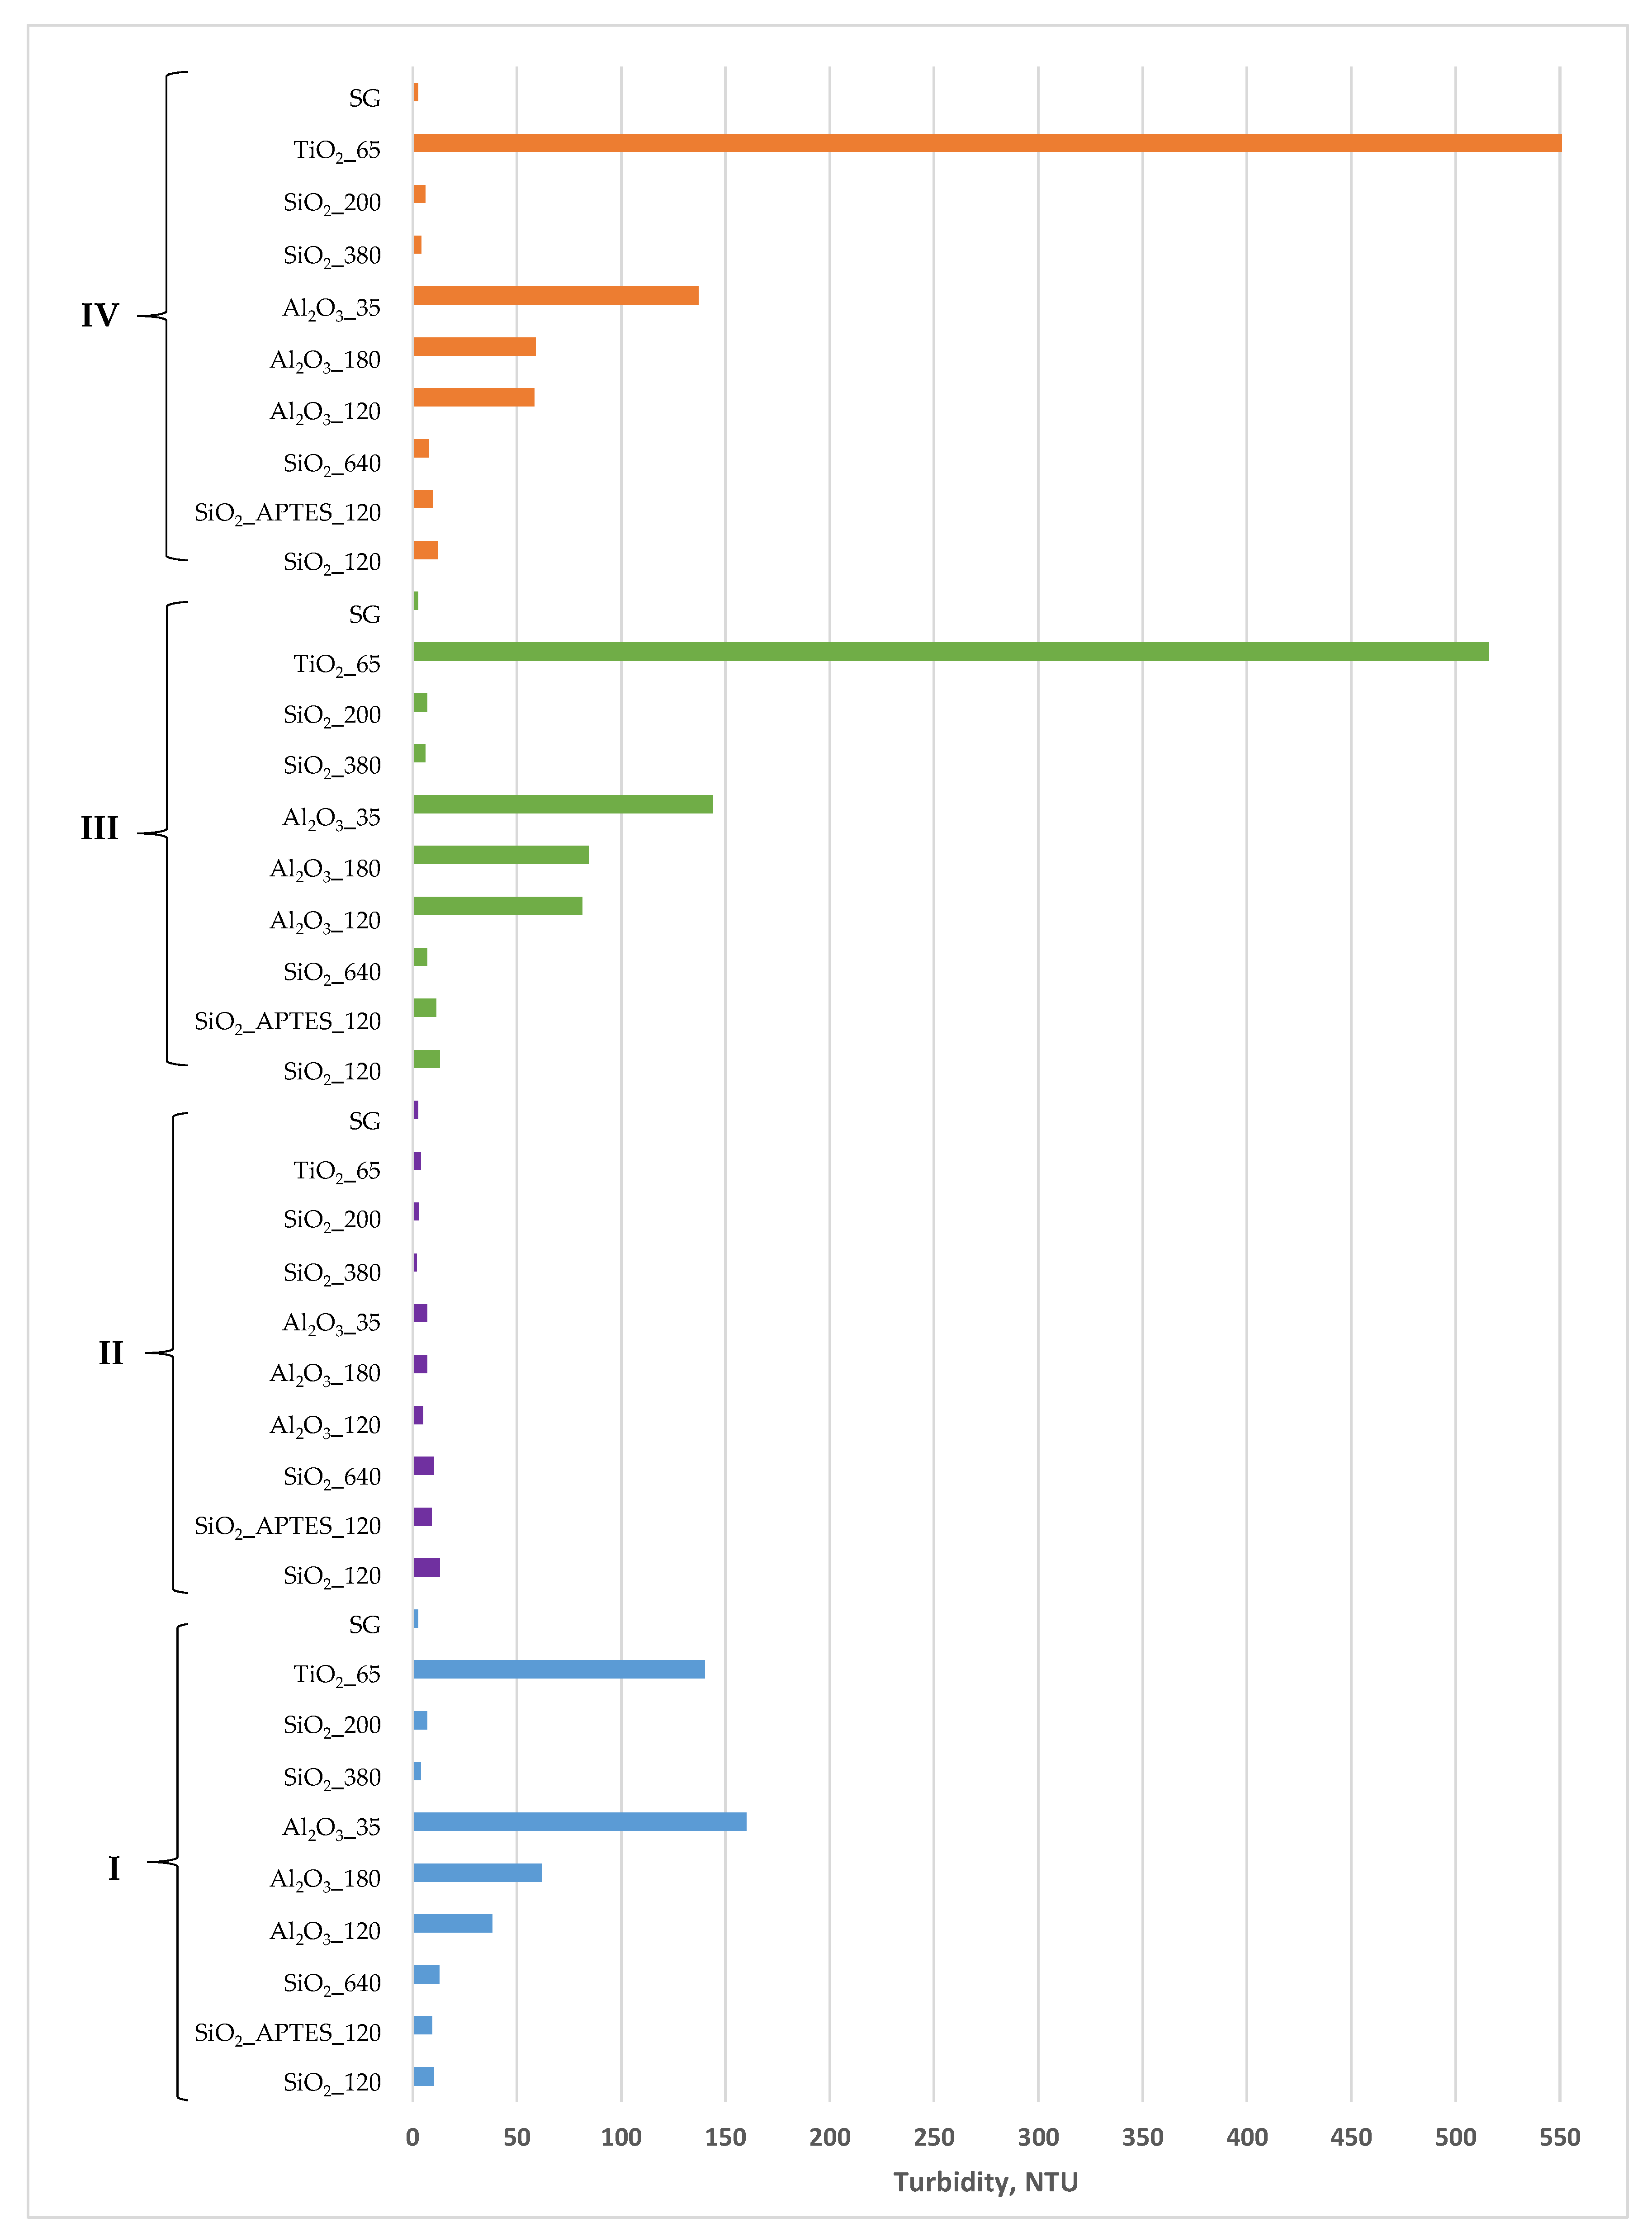
2.2.2. Turbidity Measurements
2.2.3. Viscosity Test
2.2.4. Rheological Behavior
3. Results
3.1. Nanofluid’s Viscosity
3.2. Nanofluid’s Stability
3.3. Statistical Analysis
3.4. Rheological Behavior of Nanofluid
4. Conclusions
Author Contributions
Funding
Institutional Review Board Statement
Data Availability Statement
Acknowledgments
Conflicts of Interest
Appendix A


References
- Li, X.; Zhang, F.; Liu, G. Review on polymer flooding technology. IOP Conf. Ser. Earth Environ. Sci. 2021, 675, 012199. [Google Scholar] [CrossRef]
- Babadagli, T. Development of mature oil fields—A review. J. Pet. Sci. Eng. 2007, 57, 221–246. [Google Scholar] [CrossRef]
- Manrique, E.J.; Thomas, C.P.; Ravikiran, R.; Izadi Kamouei, M.; Lantz, M.; Romero, J.L.; Alvarado, V. EOR: Current status and opportunities. In Proceedings of the SPE Improved Oil Recovery Symposium, Tulsa, OK, USA, 24–28 April 2010; Society of Petroleum Engineers: Dallas, TX, USA, 2010. [Google Scholar]
- Manrique, E.; Ahmadi, M.; Samani, S. Historical and recent observations in polymer floods: An update review. CTF-Cienc. Tecnol. Y Futuro 2017, 6, 17–48. [Google Scholar] [CrossRef]
- Alvarado, V.; Manrique, E. Enhanced oil recovery: An update review. Energies 2010, 3, 1529–1575. [Google Scholar] [CrossRef]
- Alvarado, V.; Manrique, E. Enhanced Oil Recovery: Field Planning and Development Strategies; Gulf Professional Publishing: Sebastopol, CA, USA, 2010. [Google Scholar]
- Xiangguo, L.; Bao, C.; Kun, X.; Weijia, C.; Yigang, L.; ZHANG, Y.; Xiaoyan, W.; ZHANG, J. Enhanced oil recovery mechanisms of polymer flooding in a heterogeneous oil reservoir. Pet. Explor. Dev. 2021, 48, 169–178. [Google Scholar]
- Jouenne, S. Polymer flooding in high temperature, high salinity conditions: Selection of polymer type and polymer chemistry, thermal stability. J. Pet. Sci. Eng. 2020, 195, 107545. [Google Scholar] [CrossRef]
- Jang, H.Y.; Zhang, K.; Chon, B.H.; Choi, H.J. Enhanced oil recovery performance and viscosity characteristics of polysaccharide xanthan gum solution. J. Ind. Eng. Chem. 2015, 21, 741–745. [Google Scholar] [CrossRef]
- Rellegadla, S.; Jain, S.; Agrawal, A. A holistic approach to determine the enhanced oil recovery potential of hydroxyethylcellulose, tragacanth gum and carboxymethylcellulose. J. Mol. Liq. 2021, 341, 117334. [Google Scholar] [CrossRef]
- Ahmad Wazir, N.; Abdul Manap, A.A. Schizophyllan as Potential Environmental Friendly EOR Polymer for A Selected Malaysian Field. In Proceedings of the Offshore Technology Conference Asia, Kuala Lumpur, Malaysia, 2–6 November 2020; OnePetro: Richardson, TX, USA; Society of Petroleum Engineers: Dallas, TX, USA, 2020. [Google Scholar]
- Kozlowicz, B.; Jensen, T.; Khambete, M.; Kadhum, M.J.; Garshol, F.K.; Vik, E.A.; Tomczak-Wandzel, R.; Wever, D.A.; Lomans, B.P.; Ray, C. Scleroglucan Polymer Stability: Thermal, Chemical, and Microbial. In Proceedings of the SPE Improved Oil Recovery Conference, Tulsa, OK, USA, 31 August–4 September 2020. [Google Scholar]
- Pu, W.; Shen, C.; Wei, B.; Yang, Y.; Li, Y. A comprehensive review of polysaccharide biopolymers for enhanced oil recovery (EOR) from flask to field. J. Ind. Eng. Chem. 2018, 61, 1–11. [Google Scholar] [CrossRef]
- Clinckspoor, K.-J.; Sousa-Ferreira, V.-H.d.; Barros-Zanoni-Lopes-Moreno, R.J.C.; F-Ciencia, T.y.F. Bulk rheology characterization of biopolymer solutions and discussions of their potential for enhance. CTF-Cienc. Tecnol. Y Futuro 2021, 11, 123–135. [Google Scholar] [CrossRef]
- Fournier, R.; Tiehi, J.-E.; Zaitoun, A. Laboratory study of a new EOR-Grade Scleroglucan. In Proceedings of the SPE EOR Conference at Oil and Gas West Asia, Muscat, Oman, 26–28 March 2018; OnePetro: Richardson, TX, USA, 2018. [Google Scholar]
- Rivenq, R.; Donche, A.; Nolk, C. Improved scleroglucan for polymer flooding under harsh reservoir conditions. SPE Reserv. Eng. 1992, 7, 15–20. [Google Scholar] [CrossRef]
- Kalpakci, B.; Jeans, Y.; Magri, N.; Padolewski, J. Thermal stability of scleroglucan at realistic reservoir conditions. In Proceedings of the SPE/DOE Enhanced Oil Recovery Symposium, Tulsa, OK, USA, 22–25 April 1990; Society of Petroleum Engineers: Dallas, TX, USA, 1990. [Google Scholar]
- Rodríguez-Mateus, Z.-P.; Angarita, R.-C.; Niño-Gómez, J.-A.; Corredor, L.-M.; Llanos Gallo, S.; Quintero, H.; Castro-García, R.-H.J.C.; F-Ciencia, T.y.F. Biodegradation and toxicity of scleroglucan for enhanced oil recovery. CTF-Cienc. Tecnol. Futuro 2022, 12, 5–12. [Google Scholar] [CrossRef]
- Viñarta, S.C.; François, N.J.; Daraio, M.E.; Figueroa, L.I.; Fariña, J. Sclerotium rolfsii scleroglucan: The promising behavior of a natural polysaccharide as a drug delivery vehicle, suspension stabilizer and emulsifier. Int. J. Biol. Macromol. 2007, 41, 314–323. [Google Scholar] [CrossRef] [PubMed]
- Viñarta, S.C.; Molina, O.; Figueroa, L.; Fariña, J. A further insight into the practical applications of exopolysaccharides from Sclerotium rolfsii. Food Hydrocoll. 2006, 20, 619–629. [Google Scholar] [CrossRef]
- Castillo, N.A.; Valdez, A.L.; Fariña, J.I. Microbial production of scleroglucan and downstream processing. Front. Microbiol. 2015, 6, 1106. [Google Scholar] [CrossRef]
- Seright, R.S.; Wavrik, K.E.; Zhang, G.; AlSofi, A.M. Stability and behavior in carbonate cores for new enhanced-oil-recovery polymers at elevated temperatures in hard saline brines. SPE Reserv. Eval. Eng. 2021, 24, 1–18. [Google Scholar] [CrossRef]
- Corredor, L.M.; Husein, M.M.; Maini, B.B. Effect of hydrophobic and hydrophilic metal oxide nanoparticles on the performance of xanthan gum solutions for heavy oil recovery. Nanomaterials 2019, 9, 94. [Google Scholar] [CrossRef]
- Corredor-Rojas, L.M.; Sarapardeh, A.H.; Husein, M.M.; Dong, P.M.; Maini, B.B. Rheological behavior of surface modified silica nanoparticles dispersed in Partially Hydrolyzed Polyacrylamide and Xanthan Gum solutions: Experimental measurements, mechanistic understanding, and model development. Energy Fuels 2018, 32, 10628–10638. [Google Scholar] [CrossRef]
- Cheraghian, G.; Khalili Nezhad, S.S.; Kamari, M.; Hemmati, M.; Masihi, M.; Bazgir, S. Adsorption polymer on reservoir rock and role of the nanoparticles, clay and SiO2. Int. Nano Lett. 2014, 4, 114. [Google Scholar] [CrossRef]
- Kadhum, M.J.; Swatske, D.; Weston, J.; Resasco, D.E.; Shiau, B.; Harwell, J.H. Polymer-stabilized multi-walled carbon nanotube dispersions in high-salinity brines. Energy Fuels 2017, 31, 5024–5030. [Google Scholar] [CrossRef]
- Yuan, H.; Zhang, Z.; Mi, Y.; Ye, F.; Liu, W.; Kuan, J.; Jiang, X.; Luo, Y. Demulsification of water-containing crude oil driven by environmentally friendly SiO2@ CS composite materials. Energy Fuels 2020, 34, 8316–8324. [Google Scholar] [CrossRef]
- Maurya, N.K.; Kushwaha, P.; Mandal, A. Studies on interfacial and rheological properties of water soluble polymer grafted nanoparticle for application in enhanced oil recovery. J. Taiwan Inst. Chem. Eng. 2017, 70, 319–330. [Google Scholar] [CrossRef]
- Ali, J.A.; Kolo, K.; Manshad, A.K.; Mohammadi, A.H. Recent advances in application of nanotechnology in chemical enhanced oil recovery: Effects of nanoparticles on wettability alteration, interfacial tension reduction, and flooding. Egypt. J. Pet. 2018, 27, 1371–1383. [Google Scholar] [CrossRef]
- Orodu, K.B.; Afolabi, R.O.; Oluwasijuwomi, T.D.; Orodu, O.D. Effect of aluminum oxide nanoparticles on the rheology and stability of a biopolymer for enhanced oil recovery. J. Mol. Liq. 2019, 288, 110864. [Google Scholar] [CrossRef]
- Rueda, E.; Akarri, S.; Torsæter, O.; Moreno, R.B. Experimental investigation of the effect of adding nanoparticles to polymer flooding in water-wet micromodels. Nanomaterials 2020, 10, 1489. [Google Scholar] [CrossRef]
- Corredor, L.M.; Husein, M.M.; Maini, B.B. Impact of PAM-grafted nanoparticles on the performance of hydrolyzed polyacrylamide solutions for heavy oil recovery at different salinities. Ind. Eng. Chem. Res. 2019, 58, 9888–9899. [Google Scholar] [CrossRef]
- Corredor, L.M.; Husein, M.M.; Maini, B.B. A review of polymer nanohybrids for oil recovery. Adv. Colloid Interface Sci. 2019, 272, 102018. [Google Scholar] [CrossRef]
- Khan, M.B.; Khoker, M.F.; Husain, M.; Ahmed, M.; Anwer, S. Effects of nanoparticles on rheological behavior of polyacrylamide related to enhance oil recovery. Acad. J. Polym. Sci 2018, 1, 555573. [Google Scholar]
- Orodu, O.D.; Orodu, K.B.; Afolabi, R.O.; Dafe, E.A. Rheology of Gum Arabic Polymer and Gum Arabic Coated Nanoparticle for enhanced recovery of Nigerian medium crude oil under varying temperatures. Data Brief 2018, 19, 1773–1778. [Google Scholar] [CrossRef]
- Rellegadla, S.; Bairwa, H.K.; Kumari, M.R.; Prajapat, G.; Nimesh, S.; Pareek, N.; Jain, S.; Agrawal, A. An effective approach for enhanced oil recovery using nickel nanoparticles assisted polymer flooding. Energy Fuels 2018, 32, 11212–11221. [Google Scholar] [CrossRef]
- Cao, J.; Song, T.; Zhu, Y.; Wang, S.; Wang, X.; Lv, F.; Jiang, L.; Sun, M. Application of amino-functionalized nanosilica in improving the thermal stability of acrylamide-based polymer for enhanced oil recovery. Energy Fuels 2018, 32, 246–254. [Google Scholar] [CrossRef]
- Ye, Z.; Qin, X.; Lai, N.; Peng, Q.; Li, X.; Li, C. Synthesis and performance of an acrylamide copolymer containing nano-SiO2 as enhanced oil recovery chemical. J. Chem. 2013, 2013, 437309. [Google Scholar] [CrossRef]
- Lai, N.; Guo, X.; Zhou, N.; Xu, Q. Shear resistance properties of modified Nano-SiO2/AA/AM copolymer oil displacement agent. Energies 2016, 9, 1037. [Google Scholar] [CrossRef]
- Urmi, W.T.; Rahman, M.; Kadirgama, K.; Ramasamy, D.; Maleque, M.A. An overview on synthesis, stability, opportunities and challenges of nanofluids. Mater. Today Proc. 2021, 41, 30–37. [Google Scholar] [CrossRef]
- Saha, R.; Uppaluri, R.V.; Tiwari, P. Silica Nanoparticle Assisted Polymer Flooding of Heavy Crude Oil: Emulsification, Rheology, and Wettability Alteration Characteristics. Ind. Eng. Chem. Res. 2018, 57, 6364–6376. [Google Scholar] [CrossRef]
- Rincon, D.B.; Sadtler, V.; Ojeda, R.M.; Carmes, T.R.; Marchal, P.; Avella, J.P.; Lemaitre, C. Effect of Silica Nanoparticles in Xanthan Gum Solutions: Rheological Behavior and Preparation Methods of Nanofluids. Chem. Eng. Trans. 2021, 86, 1171–1176. [Google Scholar]
- Abraham, T.W.; Sumner, E.S. Method for Solubilizing Biopolymer Solids for Enhanced Oil Recovery Applications. U.S. Patent 16/089,740, 18 April 2019. [Google Scholar]
- RubCastro-García, R.H.; LLanos-Gallo, S.; Rodríguez-Ardila, J.L.; Quintero-Perez, H.I.; Zapata, J.F.; Manrique, E. Heavy Oil and High-Temperature Polymer EOR Applications. Cienc. Tecnol. Futuro—CTF. J. Oil Gas Altern. Energy Sources 2020, 10, 73–83. [Google Scholar] [CrossRef]
- Castro, R.H.; Llanos, S.; Rodríguez, J.; Quintero, H.I.; Manrique, E. Polymers for EOR Application in High Temperature and High Viscosity Oils: Rock–Fluid Behavior. Energies 2020, 13, 5944. [Google Scholar] [CrossRef]
- Gao, X.; Huang, L.; Xiu, J.; Yi, L.; Zhao, Y. A Study on Viscosity Increasing and Rheological Properties of Novel Biopolymers in Extreme Reservoirs. Preprints 2023, 2023100462. [Google Scholar] [CrossRef]
- Giraldo, L.J.; Giraldo, M.A.; Llanos, S.; Maya, G.; Zabala, R.D.; Nassar, N.N.; Franco, C.A.; Alvarado, V.; Cortés, F.B. The effects of SiO2 nanoparticles on the thermal stability and rheological behavior of hydrolyzed polyacrylamide based polymeric solutions. J. Pet. Sci. Eng. 2017, 159, 841–852. [Google Scholar] [CrossRef]
- American Petroleum Institute. Recommended Practices for Evaluation of Polymers Used in Enhanced Oil Recovery Operations; American Petroleum Institute: Singapore, 1990. [Google Scholar]
- Wassmuth, F.; Green, K.; Arnold, W.; Cameron, N. Polymer flood application to improve heavy oil recovery at East Bodo. J. Can. Pet. Technol. 2009, 48, 55–61. [Google Scholar] [CrossRef]
- van Wageningen-Kessels, F.; Van Lint, H.; Vuik, K.; Hoogendoorn, S. Genealogy of traffic flow models. EURO J. Transp. Logist. 2015, 4, 445–473. [Google Scholar] [CrossRef]
- Carreau, P.J. Rheological equations from molecular network theories. Trans. Soc. Rheol. 1972, 16, 99–127. [Google Scholar] [CrossRef]
- Osswald, T.; Rudolph, N. Polymer Rheology; Carl Hanser: München, Germany, 2015. [Google Scholar]
- Yasuda, K. Investigation of the Analogies between Viscometric and Linear Viscoelastic Properties of Polystyrene Fluids; Massachusetts Institute of Technology: Cambridge, MA, USA, 1979. [Google Scholar]
- Hemadri, V.; Mane, N. Study of the effect of preparation parameters on thermal conductivity of metal oxide nanofluids using Taguchi method. J. Energy Syst. 2021, 5, 149–164. [Google Scholar] [CrossRef]
- Larsson, M.; Hill, A.; Duffy, J. Suspension stability; why particle size, zeta potential and rheology are important. Annu. Trans. Nord. Rheol. Soc. 2012, 20, 209–214. [Google Scholar]
- Barkhordar, A.; Ghasemiasl, R.; Armaghani, T. Statistical study and a complete overview of nanofluid viscosity correlations: A new look. J. Therm. Anal. Calorim. 2022, 147, 7099–7132. [Google Scholar] [CrossRef]
- Hu, X.; Yin, D.; Chen, X.; Xiang, G. Experimental investigation and mechanism analysis: Effect of nanoparticle size on viscosity of nanofluids. J. Mol. Liq. 2020, 314, 113604. [Google Scholar] [CrossRef]
- Keblinski, P.; Phillpot, S.; Choi, S.; Eastman, J. Mechanisms of heat flow in suspensions of nano-sized particles (nanofluids). Int. J. Heat Mass Transf. 2002, 45, 855–863. [Google Scholar] [CrossRef]
- Barnes, H.A. A Handbook of Elementary Rheology; University of Wales, Institute of Non-Newtonian Fluid Mechanics: Cardiff, UK, 2000. [Google Scholar]
- Dehkordi, S.A.H.; Golbodaqi, M.; Mortazavi-Manesh, A.; Safari, N.; Bahadoran, F.; Haghighat, M.F. Dimethyl ether from methanol on mesoporous γ-alumina catalyst prepared from surfactant free highly porous pseudo-boehmite. Mol. Catal. 2023, 538, 113004. [Google Scholar] [CrossRef]
- Hernandez, F.A.T.; Niño, J.C.L.; Moreno, R.L. Effects of salts and temperature on rheological and viscoelastic behavior of low molecular weight HPAM solutions. Rev. Fuentes 2018, 16, 19–35. [Google Scholar] [CrossRef]
- Chhabra, R.P. Non-Newtonian fluids: An introduction. In Rheology of Complex Fluids; Springer: New York, NY, USA, 2010; pp. 3–34. [Google Scholar]


| Name | Description | Supplier |
|---|---|---|
| SiO2_120 | SiO2 (20 nm, 120 m2/g, spherical, hydrophilic) | Nanostructured & Amorphous Materials Inc., Los Alamos, NM, USA |
| SiO2_APTES_120 | SiO2 (20 nm, 120 m2/g, spherical, amphiphilic, surface coated by (3-aminopropyl) triethoxysilane 2%—APTES | |
| SiO2_640 | SiO2 (20 nm, 640 m2/g, amorphous porous) | |
| Al2O3_120 | Al2O3 (10 nm, 120 m2/g, spherical, gamma, hydrophilic) | |
| Al2O3_180 | Al2O3 (20–30 nm, 180 m2/g, nearly spherical, gamma, hydrophilic) | |
| Al2O3_35 | Al2O3 (27–43 nm, 35 m2/g, mainly alpha contains 5–10% gamma, hydrophilic) | |
| SiO2_380 | SiO2 (12–15 nm, 380 m2/g, amorphous, hydrophilic) | Evonik industries, Allentown, PA, USA |
| SiO2_200 | SiO2 (12 nm, 200 m2/g, amorphous, hydrophilic) | |
| TiO2_65 | Titanium (IV) oxide (21 nm, 35–65 m2/g) | Sigma Aldrich, St. Louis, MO, USA |
| Method | Step 1 | Step 2 | Step 3 |
|---|---|---|---|
| I | Dissolve the SG powder into the brine under mechanical stirring at 500 rpm for 10 min. Then, stir the sample at 800 rpm and 40 °C for 10 min. Finally, homogenize the solution for 5 min using a high-performance immersion blender (IKA™ T 25 Digital Ultra-Turrax) | Add the NPs to the SG solution | Stir the nanofluid with the Ultra-Turrax at 20,000 rpm for 5 min |
| II | Same as described in method I (step 1) | Add the NPs to the SG solution | Stir the nanofluid with the propeller agitator at 500 rpm for 60 min |
| III | Disperse the NPs in brine and ultrasonicate the dispersions for 1 h | Same as described in method I (step 1) | - |
| IV | Add the SG powder and the NPs into the brine simultaneously. Stir the sample with a metallic blade for 10 min at 500 rpm. Then, stir the sample at 800 rpm and 40 °C for 10 min. Finally, stir the dispersion with the Ultra-Turrax at 20,000 rpm for 5 min. | - | - |
| Heating Temperature (°C) | Sample | Viscosity, cP | Viscosity Changes of the SG Solution | ||||||
|---|---|---|---|---|---|---|---|---|---|
| 0 | 7 | 14 | 21 | 0 | 7 | 14 | 21 | ||
| 30 | SiO2_120 | 63.76 | 67.14 | 67.94 | 66.98 | 4.5% | 10.0% | 11.3% | 9.8% |
| SiO2_APTES_120 | 63.56 | 64.66 | 66.96 | 67.38 | 4.2% | 6.0% | 9.7% | 10.4% | |
| SiO2_640 | 63.70 | 64.44 | 66.96 | 66.90 | 4.4% | 5.6% | 9.7% | 9.6% | |
| Al2O3_120 | 63.92 | 65.62 | 64.12 | 67.36 | 4.8% | 7.5% | 5.1% | 10.4% | |
| Al2O3_180 | 61.80 | 66.90 | 64.50 | 67.74 | 1.3% | 9.6% | 5.7% | 11.0% | |
| Al2O3_35 | 64.64 | 65.20 | 65.86 | 66.24 | 5.9% | 6.9% | 7.9% | 8.6% | |
| SiO2_380 | 62.98 | 65.70 | 65.86 | 67.18 | 3.2% | 7.7% | 7.9% | 10.1% | |
| SiO2_200 | 65.24 | 66.22 | 65.38 | 67.22 | 6.9% | 8.5% | 7.1% | 10.2% | |
| TiO2_65 | 63.70 | 64.70 | 64.36 | 65.56 | 4.4% | 6.0% | 5.5% | 7.4% | |
| SG | 61.02 | 61.00 | 62.90 | 61.70 | 0.0% | 0.0% | 3.1% | 1.1% | |
| 60 | SiO2_120 | 65.90 | 64.98 | 65.02 | 64.52 | 8.0% | 6.5% | 6.6% | 5.7% |
| SiO2_APTES_120 | 65.88 | 66.38 | 66.06 | 65.94 | 8.0% | 8.8% | 8.3% | 8.1% | |
| SiO2_640 | 64.58 | 64.40 | 64.30 | 64.02 | 5.8% | 5.5% | 5.4% | 4.9% | |
| Al2O3_120 | 64.58 | 66.80 | 65.30 | 64.94 | 5.8% | 9.5% | 7.0% | 6.4% | |
| Al2O3_180 | 64.16 | 65.06 | 67.08 | 65.70 | 5.1% | 6.6% | 9.9% | 7.7% | |
| Al2O3_35 | 63.98 | 63.98 | 64.84 | 64.44 | 4.9% | 4.9% | 6.3% | 5.6% | |
| SiO2_380 | 64.68 | 63.80 | 65.10 | 63.66 | 6.0% | 4.6% | 6.7% | 4.3% | |
| SiO2_200 | 64.10 | 65.44 | 65.60 | 64.12 | 5.0% | 7.2% | 7.5% | 5.1% | |
| TiO2_65 | 62.56 | 63.32 | 63.46 | 63.58 | 2.5% | 3.8% | 4.0% | 4.2% | |
| SG | 61.02 | 61.82 | 62.66 | 60.88 | 0.0% | 1.3% | 2.7% | −0.2% | |
| Heating Temperature (°C) | Sample | Viscosity, cP | Viscosity Changes of the SG Solution | ||||||
|---|---|---|---|---|---|---|---|---|---|
| 0 | 7 | 14 | 21 | 0 | 7 | 14 | 21 | ||
| 30 | SiO2_120 | 67.5 | 68.9 | 69.3 | 67.6 | 10.6% | 12.9% | 13.6% | 10.8% |
| SiO2_APTES_120 | 67.1 | 68.2 | 68.6 | 68.9 | 10.0% | 11.8% | 12.4% | 12.8% | |
| SiO2_640 | 66.9 | 67.9 | 67.5 | 68.7 | 9.6% | 11.2% | 10.7% | 12.6% | |
| Al2O3_120 | 68.7 | 68.9 | 68.0 | 68.0 | 12.5% | 13.0% | 11.4% | 11.4% | |
| Al2O3_180 | 70.1 | 70.3 | 69.7 | 69.5 | 14.8% | 15.2% | 14.2% | 13.9% | |
| Al2O3_35 | 66.4 | 68.2 | 68.0 | 68.4 | 8.8% | 11.8% | 11.5% | 12.1% | |
| SiO2_380 | 68.6 | 69.4 | 69.7 | 69.4 | 12.4% | 13.7% | 14.3% | 13.7% | |
| SiO2_200 | 66.0 | 67.0 | 67.1 | 67.0 | 8.1% | 9.8% | 10.0% | 9.8% | |
| TiO2_65 | 65.8 | 65.5 | 66.6 | 66.2 | 7.8% | 7.3% | 9.2% | 8.5% | |
| SG | 61.0 | 61.0 | 62.9 | 61.7 | 0.0% | 0.0% | 3.1% | 1.1% | |
| 60 | SiO2_120 | 67.5 | 68.5 | 68.8 | 68.4 | 10.6% | 12.3% | 12.7% | 12.2% |
| SiO2_APTES_120 | 66.4 | 65.7 | 67.5 | 65.7 | 8.8% | 7.7% | 10.6% | 7.7% | |
| SiO2_640 | 67.2 | 66.9 | 69.5 | 66.7 | 10.2% | 9.6% | 13.9% | 9.3% | |
| Al2O3_120 | 66.4 | 65.8 | 67.9 | 65.6 | 8.8% | 7.8% | 11.3% | 7.4% | |
| Al2O3_180 | 64.6 | 63.8 | 65.8 | 63.8 | 5.8% | 4.6% | 7.8% | 4.6% | |
| Al2O3_35 | 63.3 | 63.3 | 65.2 | 63.0 | 3.7% | 3.7% | 6.9% | 3.2% | |
| SiO2_380 | 65.2 | 65.3 | 67.3 | 65.4 | 6.9% | 7.0% | 10.3% | 7.2% | |
| SiO2_200 | 65.4 | 65.2 | 67.4 | 65.1 | 7.2% | 6.9% | 10.5% | 6.6% | |
| TiO2_65 | 63.7 | 64.1 | 65.9 | 65.2 | 4.4% | 5.0% | 8.0% | 6.9% | |
| SG | 61.0 | 61.2 | 62.7 | 60.9 | 0.0% | 0.3% | 2.7% | −0.2% | |
| Heating Temperature (°C) | Sample | Viscosity, cP | Viscosity Changes of the SG Solution | ||||||
|---|---|---|---|---|---|---|---|---|---|
| 0 | 7 | 14 | 21 | 0 | 7 | 14 | 21 | ||
| 30 | SiO2_120 | 62.1 | 66.9 | 65.7 | 64.3 | 1.8% | 9.7% | 7.7% | 5.4% |
| SiO2_APTES_120 | 63.9 | 67.9 | 66.6 | 67.3 | 4.7% | 11.3% | 9.1% | 10.3% | |
| SiO2_640 | 64.2 | 67.4 | 66.1 | 66.3 | 5.2% | 10.4% | 8.3% | 8.7% | |
| Al2O3_120 | 63.4 | 67.4 | 67.0 | 67.0 | 3.9% | 10.5% | 9.7% | 9.7% | |
| Al2O3_180 | 63.7 | 68.3 | 67.3 | 66.8 | 4.4% | 12.0% | 10.4% | 9.5% | |
| Al2O3_35 | 64.7 | 66.7 | 65.9 | 66.8 | 6.0% | 9.3% | 8.1% | 9.5% | |
| SiO2_380 | 64.8 | 67.8 | 67.6 | 68.8 | 6.2% | 11.2% | 10.8% | 12.7% | |
| SiO2_200 | 63.6 | 64.6 | 62.4 | 63.0 | 4.3% | 5.9% | 2.3% | 3.3% | |
| TiO2_65 | 62.6 | 65.4 | 63.4 | 65.9 | 2.6% | 7.1% | 3.9% | 8.0% | |
| SG | 61.0 | 61.0 | 62.9 | 61.7 | 0.0% | 0.0% | 3.1% | 1.1% | |
| 60 | SiO2_120 | 65.2 | 63.8 | 63.2 | 63.3 | 6.9% | 4.6% | 3.6% | 3.7% |
| SiO2_APTES_120 | 64.9 | 63.9 | 63.9 | 64.0 | 6.3% | 4.7% | 4.7% | 4.9% | |
| SiO2_640 | 64.3 | 64.3 | 63.8 | 62.8 | 5.4% | 5.3% | 4.5% | 3.0% | |
| Al2O3_120 | 63.6 | 63.9 | 63.8 | 62.7 | 4.2% | 4.7% | 4.6% | 2.7% | |
| Al2O3_180 | 63.1 | 64.3 | 64.1 | 62.7 | 3.3% | 5.3% | 5.1% | 2.7% | |
| Al2O3_35 | 63.8 | 64.8 | 64.4 | 63.4 | 4.6% | 6.2% | 5.5% | 4.0% | |
| SiO2_380 | 63.3 | 61.5 | 64.0 | 62.0 | 3.7% | 0.8% | 4.9% | 1.6% | |
| SiO2_200 | 63.6 | 62.2 | 63.5 | 62.7 | 4.3% | 1.9% | 4.1% | 2.8% | |
| TiO2_65 | 62.4 | 62.9 | 63.9 | 63.1 | 2.2% | 3.1% | 4.7% | 3.5% | |
| SG | 61.0 | 61.6 | 62.7 | 60.9 | 0.0% | 1.0% | 2.7% | −0.2% | |
| Heating Temperature (°C) | Sample | Viscosity, cP | Viscosity Changes of the SG Solution | ||||||
|---|---|---|---|---|---|---|---|---|---|
| 0 | 7 | 14 | 21 | 0 | 7 | 14 | 21 | ||
| 30 | SiO2_120 | 65.7 | 67.6 | 65.2 | 65.9 | 7.6% | 10.8% | 6.9% | 7.9% |
| SiO2_APTES_120 | 63.0 | 64.2 | 64.0 | 64.5 | 3.3% | 5.1% | 4.9% | 5.7% | |
| SiO2_640 | 65.1 | 64.6 | 65.3 | 64.6 | 6.6% | 5.9% | 6.9% | 5.9% | |
| Al2O3_120 | 64.3 | 65.0 | 66.5 | 66.5 | 5.3% | 6.5% | 9.0% | 9.0% | |
| Al2O3_180 | 62.7 | 64.4 | 64.7 | 65.4 | 2.7% | 5.5% | 6.0% | 7.2% | |
| Al2O3_35 | 64.4 | 64.6 | 65.9 | 65.0 | 5.5% | 5.8% | 8.1% | 6.5% | |
| SiO2_380 | 65.0 | 64.8 | 67.6 | 64.7 | 6.5% | 6.2% | 10.8% | 6.0% | |
| SiO2_200 | 65.4 | 66.0 | 62.4 | 65.6 | 7.2% | 8.1% | 2.3% | 7.5% | |
| TiO2_65 | 61.4 | 63.5 | 63.4 | 63.7 | 0.7% | 4.1% | 3.9% | 4.4% | |
| SG | 61.0 | 61.0 | 62.9 | 61.7 | 0.0% | 0.0% | 3.1% | 1.1% | |
| 60 | SiO2_120 | 63.5 | 63.0 | 62.1 | 61.4 | 4.1% | 3.3% | 1.8% | 0.6% |
| SiO2_APTES_120 | 62.6 | 60.9 | 60.4 | 60.1 | 2.6% | −0.3% | −1.0% | −1.5% | |
| SiO2_640 | 64.1 | 62.1 | 62.0 | 61.0 | 5.0% | 1.8% | 1.5% | 0.0% | |
| Al2O3_120 | 63.1 | 62.8 | 63.9 | 63.2 | 3.4% | 2.9% | 4.8% | 3.5% | |
| Al2O3_180 | 63.2 | 63.1 | 63.5 | 63.2 | 3.6% | 3.4% | 4.0% | 3.5% | |
| Al2O3_35 | 62.4 | 61.9 | 62.0 | 62.4 | 2.2% | 1.5% | 1.6% | 2.3% | |
| SiO2_380 | 63.1 | 61.5 | 62.2 | 61.7 | 3.5% | 0.8% | 2.0% | 1.1% | |
| SiO2_200 | 61.3 | 62.1 | 60.3 | 60.6 | 0.4% | 1.7% | −1.2% | −0.8% | |
| TiO2_65 | 61.1 | 62.1 | 61.5 | 62.9 | 0.2% | 1.7% | 0.8% | 3.0% | |
| SG | 61.0 | 60.8 | 62.7 | 60.9 | 0.0% | −0.4% | 2.7% | −0.2% | |
| Method | Sample | Turbidity | |
|---|---|---|---|
| 0 min after Preparation | 21 Days after Preparation | ||
| I | SiO2_120 | 10.0 | 10.6 |
| SiO2_APTES_120 | 9.2 | 8.9 | |
| SiO2_640 | 12.7 | 7.9 | |
| Al2O3_120 | 38.1 | 37.2 | |
| Al2O3_180 | 62.0 | 45.2 | |
| Al2O3_35 | 160.0 | 133.0 | |
| SiO2_380 | 4.0 | 3.6 | |
| SiO2_200 | 7.0 | 5.8 | |
| TiO2_65 | 140.0 | 107.0 | |
| SG | 2.6 | 2.7 | |
| II | SiO2_120 | 13.0 | 10.6 |
| SiO2_APTES_120 | 9.0 | 7.2 | |
| SiO2_640 | 10.0 | 6.3 | |
| Al2O3_120 | 5.0 | 3.7 | |
| Al2O3_180 | 7.0 | 6.1 | |
| Al2O3_35 | 7.0 | 5.1 | |
| SiO2_380 | 2.0 | 2.4 | |
| SiO2_200 | 3.0 | 3.1 | |
| TiO2_65 | 4.0 | 3.4 | |
| SG | 2.6 | 2.7 | |
| III | SiO2_120 | 13.1 | 12.3 |
| SiO2_APTES_120 | 11.4 | 10.9 | |
| SiO2_640 | 7.0 | 6.5 | |
| Al2O3_120 | 81.2 | 82.8 | |
| Al2O3_180 | 84.3 | 80.0 | |
| Al2O3_35 | 144.0 | 130.0 | |
| SiO2_380 | 6.0 | 6.0 | |
| SiO2_200 | 6.8 | 7.7 | |
| TiO2_65 | 516.0 | 502.0 | |
| SG | 2.6 | 2.7 | |
| IV | SiO2_120 | 11.8 | 5.7 |
| SiO2_APTES_120 | 9.5 | 4.6 | |
| SiO2_640 | 7.9 | 5.5 | |
| Al2O3_120 | 58.4 | 48.1 | |
| Al2O3_180 | 59.1 | 44.2 | |
| Al2O3_35 | 137.0 | 111.0 | |
| SiO2_380 | 4.0 | 4.8 | |
| SiO2_200 | 6.0 | 6.2 | |
| TiO2_65 | 593.0 | 350.0 | |
| SG | 2.6 | 2.7 | |
| Experiment | Preparation Method | Standing Time | Heating Temperature | Nanoparticle Type | Viscosity, cP |
|---|---|---|---|---|---|
| 1 | I | −1 | −1 | SiO2_120 | 64.5 |
| 2 | II | −1 | −1 | SiO2_120 | 65.7 |
| 3 | I | 1 | −1 | SiO2_120 | 66.3 |
| 4 | II | 1 | −1 | SiO2_120 | 67.4 |
| 5 | I | −1 | 1 | SiO2_120 | 65.9 |
| 6 | II | −1 | 1 | SiO2_120 | 67.5 |
| 7 | I | 1 | 1 | SiO2_120 | 64.5 |
| 8 | II | 1 | 1 | SiO2_120 | 67.1 |
| 9 | I | −1 | −1 | SiO2_120 | 63.8 |
| 10 | II | −1 | −1 | SiO2_APTES_120 | 67.5 |
| 11 | I | 1 | −1 | SiO2_APTES_120 | 67 |
| 12 | II | 1 | −1 | SiO2_APTES_120 | 67.6 |
| 13 | I | −1 | 1 | SiO2_APTES_120 | 65.9 |
| 14 | II | −1 | 1 | SiO2_APTES_120 | 67.5 |
| 15 | I | 1 | 1 | SiO2_APTES_120 | 64.5 |
| 16 | II | 1 | 1 | SiO2_APTES_120 | 68.4 |
| 17 | I | −1 | −1 | SiO2_120 | 66.3 |
| 18 | II | −1 | −1 | SiO2_120 | 65.8 |
| 19 | I | 1 | −1 | SiO2_120 | 67.06 |
| 20 | II | 1 | −1 | SiO2_120 | 68.5 |
| 21 | I | −1 | 1 | SiO2_120 | 65.9 |
| 22 | II | −1 | 1 | SiO2_120 | 66.4 |
| 23 | I | 1 | 1 | SiO2_120 | 65.9 |
| 24 | II | 1 | 1 | SiO2_120 | 66.2 |
| 25 | I | −1 | −1 | SiO2_120 | 63.6 |
| 26 | II | −1 | −1 | SiO2_APTES_120 | 67.1 |
| 27 | I | 1 | −1 | SiO2_APTES_120 | 67.4 |
| 28 | II | 1 | −1 | SiO2_APTES_120 | 68.9 |
| 29 | I | −1 | 1 | SiO2_APTES_120 | 65.9 |
| 30 | II | −1 | 1 | SiO2_APTES_120 | 66.4 |
| 31 | I | 1 | 1 | SiO2_APTES_120 | 65.9 |
| 32 | II | 1 | 1 | SiO2_APTES_120 | 65.7 |
| Item | Degree of Freedom | Sum of Squares | Mean Square | F-Value | p-Value |
|---|---|---|---|---|---|
| Preparation method | 1 | 17.024 | 17.024 | 15.882 | 0.00046 |
| Standing time | 1 | 5.009 | 5.009 | 4.673 | 0.03967 |
| Temperature | 1 | 0.738 | 0.738 | 0.689 | 0.41391 |
| Nanoparticle type | 1 | 0.108 | 0.108 | 0.101 | 0.75324 |
| Residual | 27 | 28.94 | 1.072 |
| Parameter | SG Solution | Nanofluid SG + SiO2_120 |
|---|---|---|
| (cP) | 132.36 | 149.22 |
| (s) | 0.3358 | 0.4607 |
| 0.3530 | 0.3728 |
Disclaimer/Publisher’s Note: The statements, opinions and data contained in all publications are solely those of the individual author(s) and contributor(s) and not of MDPI and/or the editor(s). MDPI and/or the editor(s) disclaim responsibility for any injury to people or property resulting from any ideas, methods, instructions or products referred to in the content. |
© 2024 by the authors. Licensee MDPI, Basel, Switzerland. This article is an open access article distributed under the terms and conditions of the Creative Commons Attribution (CC BY) license (https://creativecommons.org/licenses/by/4.0/).
Share and Cite
Castro, R.H.; Corredor, L.M.; Llanos, S.; Causil, M.A.; Arias, A.; Pérez, E.; Quintero, H.I.; Romero Bohórquez, A.R.; Franco, C.A.; Cortés, F.B. Experimental Investigation of the Viscosity and Stability of Scleroglucan-Based Nanofluids for Enhanced Oil Recovery. Nanomaterials 2024, 14, 156. https://doi.org/10.3390/nano14020156
Castro RH, Corredor LM, Llanos S, Causil MA, Arias A, Pérez E, Quintero HI, Romero Bohórquez AR, Franco CA, Cortés FB. Experimental Investigation of the Viscosity and Stability of Scleroglucan-Based Nanofluids for Enhanced Oil Recovery. Nanomaterials. 2024; 14(2):156. https://doi.org/10.3390/nano14020156
Chicago/Turabian StyleCastro, Rubén H., Laura M. Corredor, Sebastián Llanos, María A. Causil, Adriana Arias, Eduar Pérez, Henderson I. Quintero, Arnold R. Romero Bohórquez, Camilo A. Franco, and Farid B. Cortés. 2024. "Experimental Investigation of the Viscosity and Stability of Scleroglucan-Based Nanofluids for Enhanced Oil Recovery" Nanomaterials 14, no. 2: 156. https://doi.org/10.3390/nano14020156
APA StyleCastro, R. H., Corredor, L. M., Llanos, S., Causil, M. A., Arias, A., Pérez, E., Quintero, H. I., Romero Bohórquez, A. R., Franco, C. A., & Cortés, F. B. (2024). Experimental Investigation of the Viscosity and Stability of Scleroglucan-Based Nanofluids for Enhanced Oil Recovery. Nanomaterials, 14(2), 156. https://doi.org/10.3390/nano14020156