

Factors Influencing the Repeated Transient Optical Droplet Vaporization Threshold and Lifetimes of Phase Change, Perfluorocarbon Nanodroplets


 and
and
Abstract
1. Introduction
2. Materials and Methods
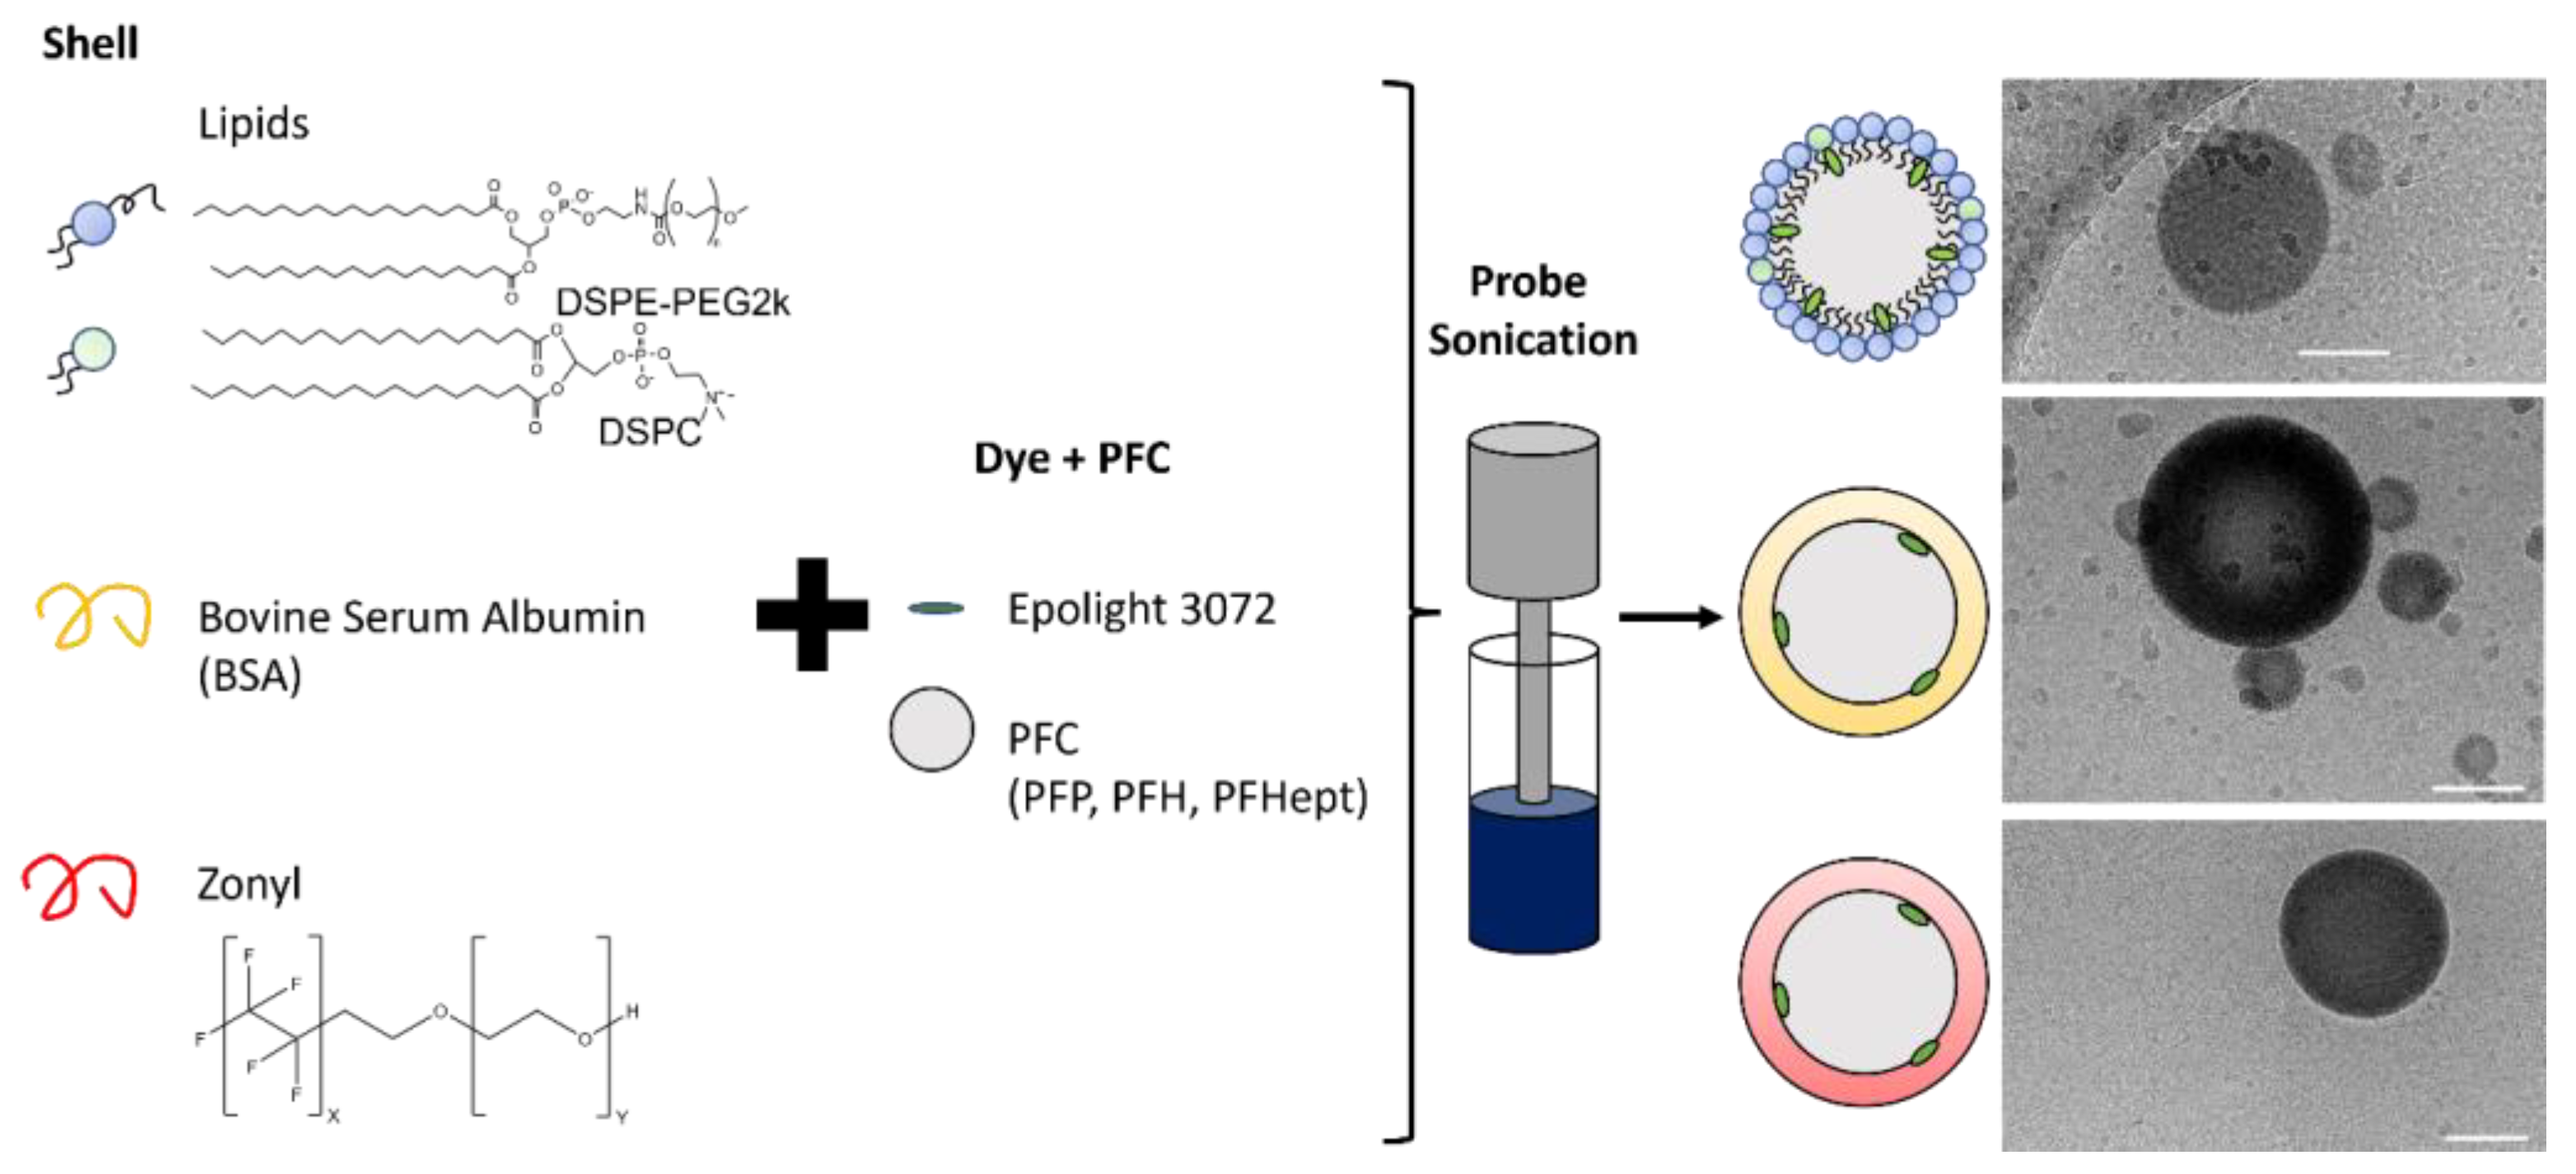
2.1. Nanodroplet Synthesis and Characterization
2.2. Cryo-Transmission Electron Microscopy Sample Preparation and Data Acquisition
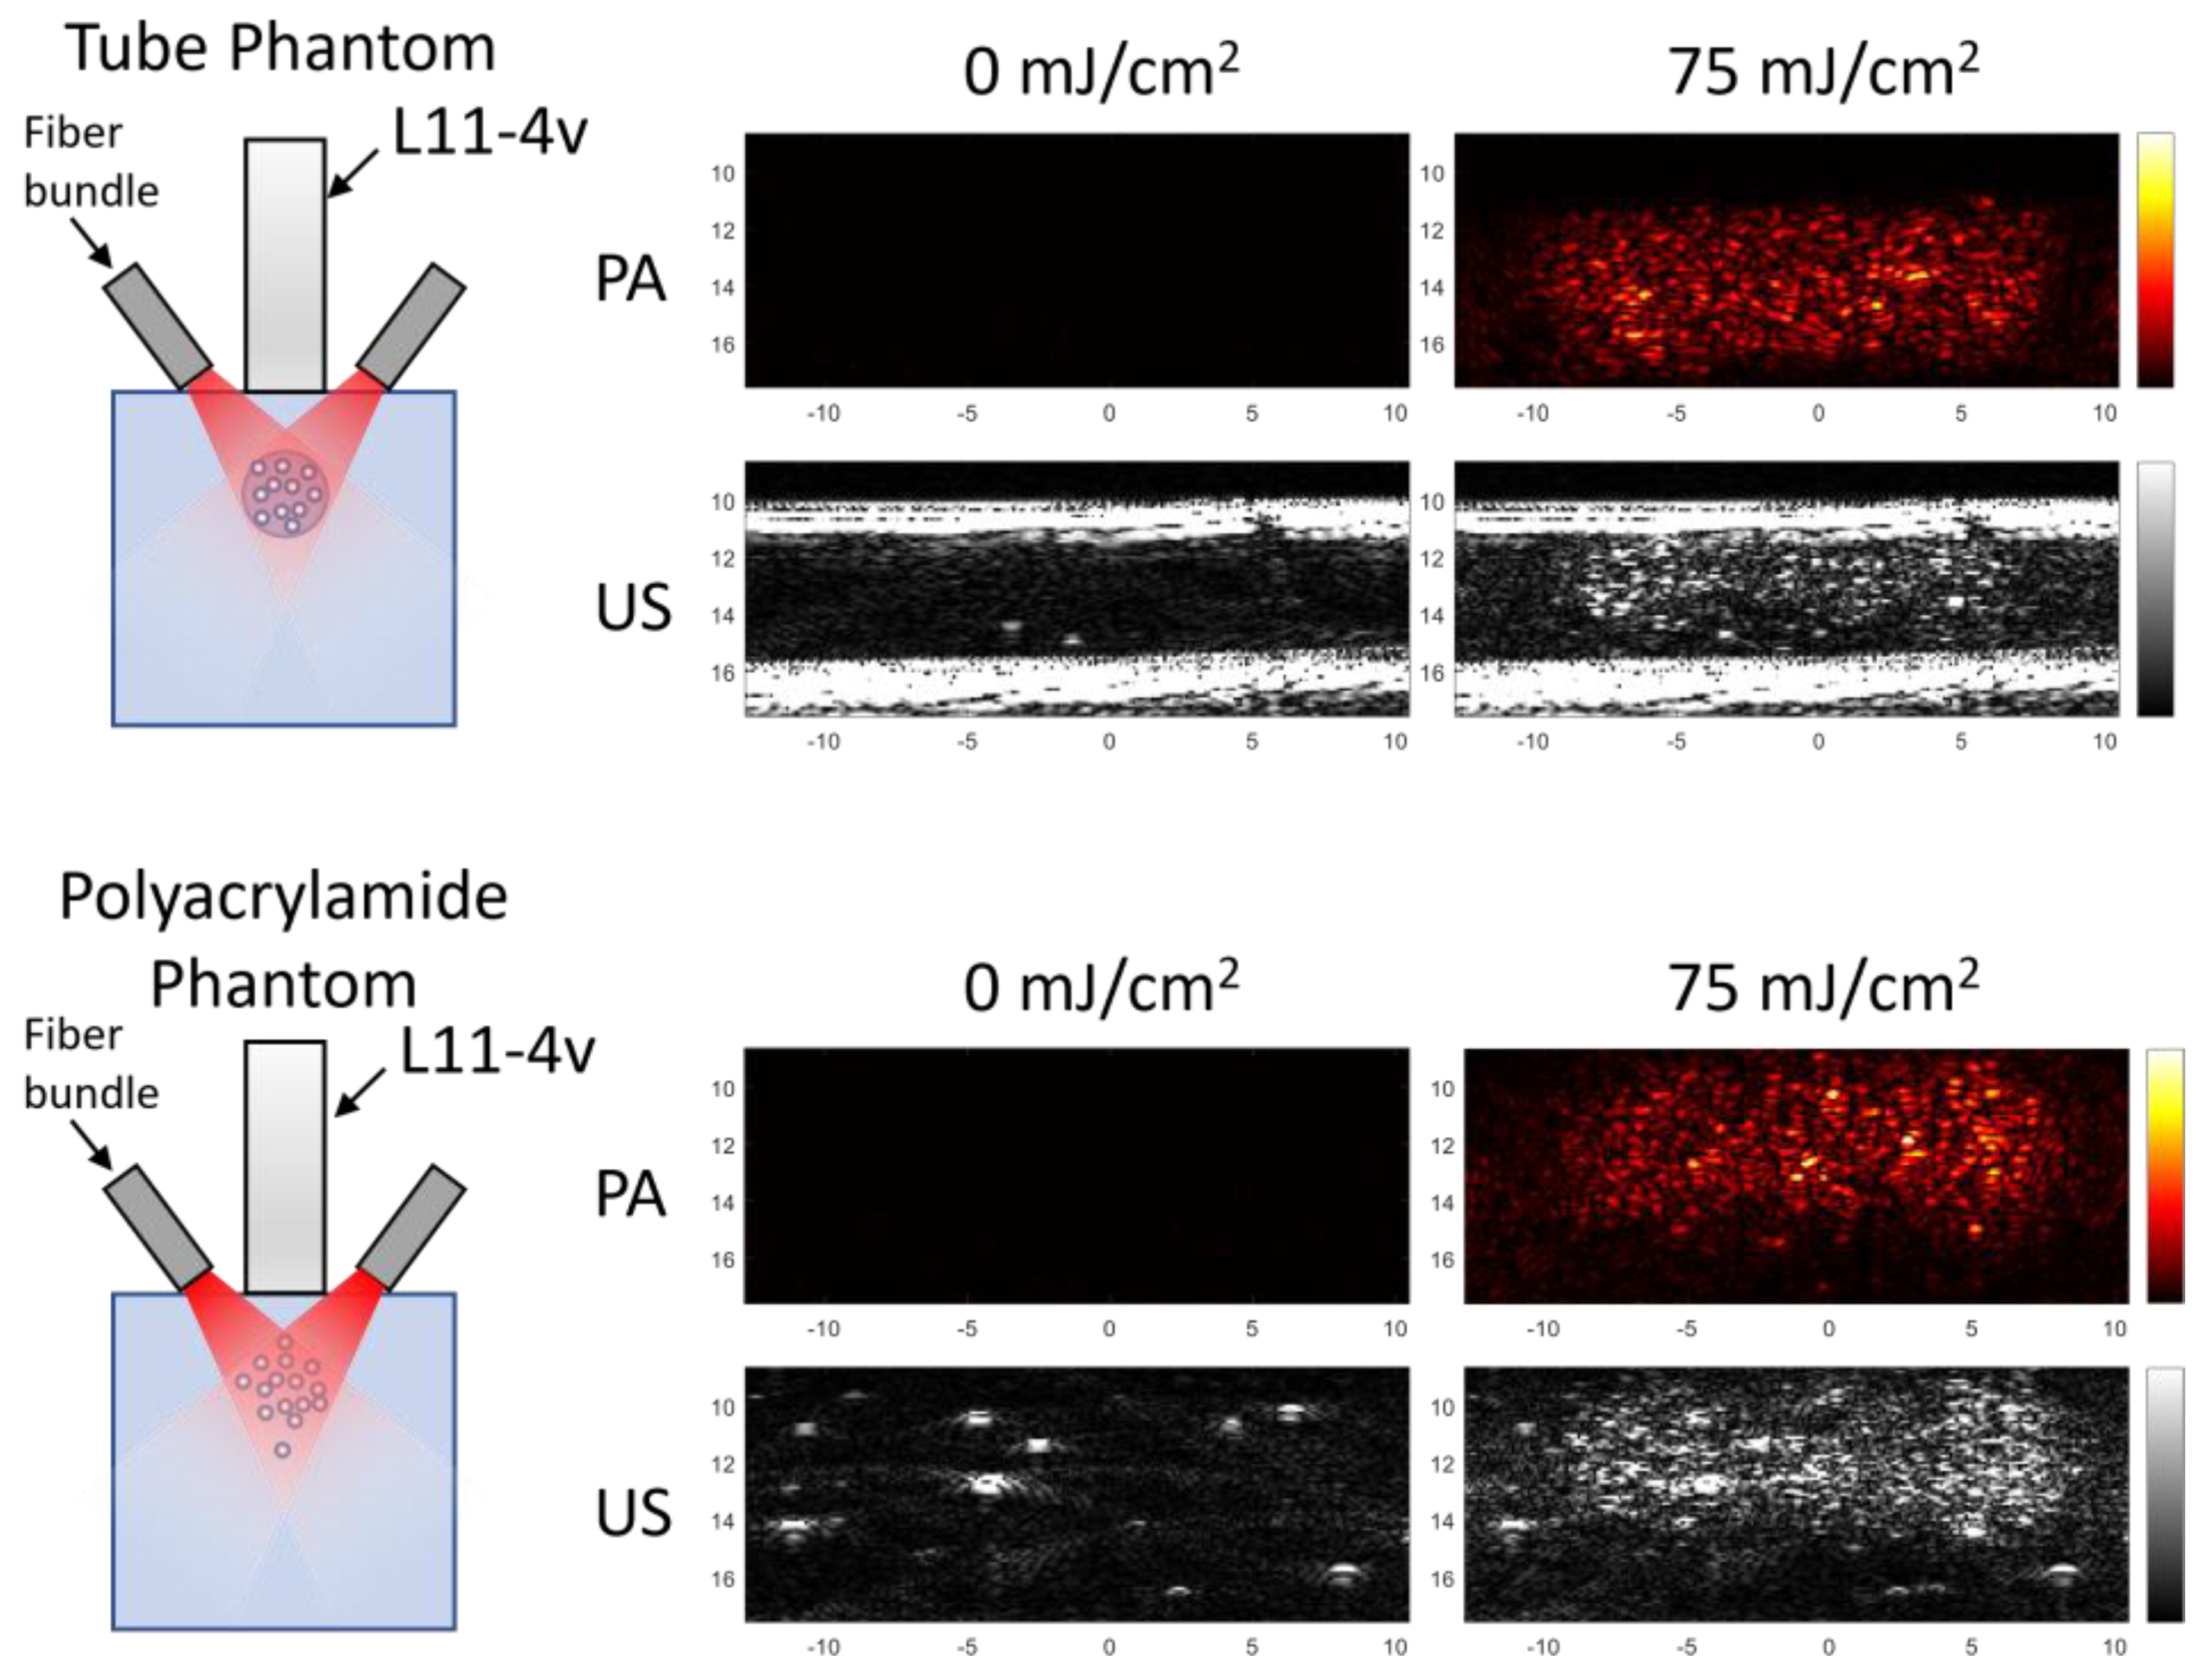
2.3. Phantom Preparation and Imaging Setup

| Experiment | Phantom Type | Core | Shell | Temperature (°C) | Laser PRF (Hz) |
|---|---|---|---|---|---|
| Preconditioning (Figure 2) | Tube | PFH | Lipid | 37 | 10 |
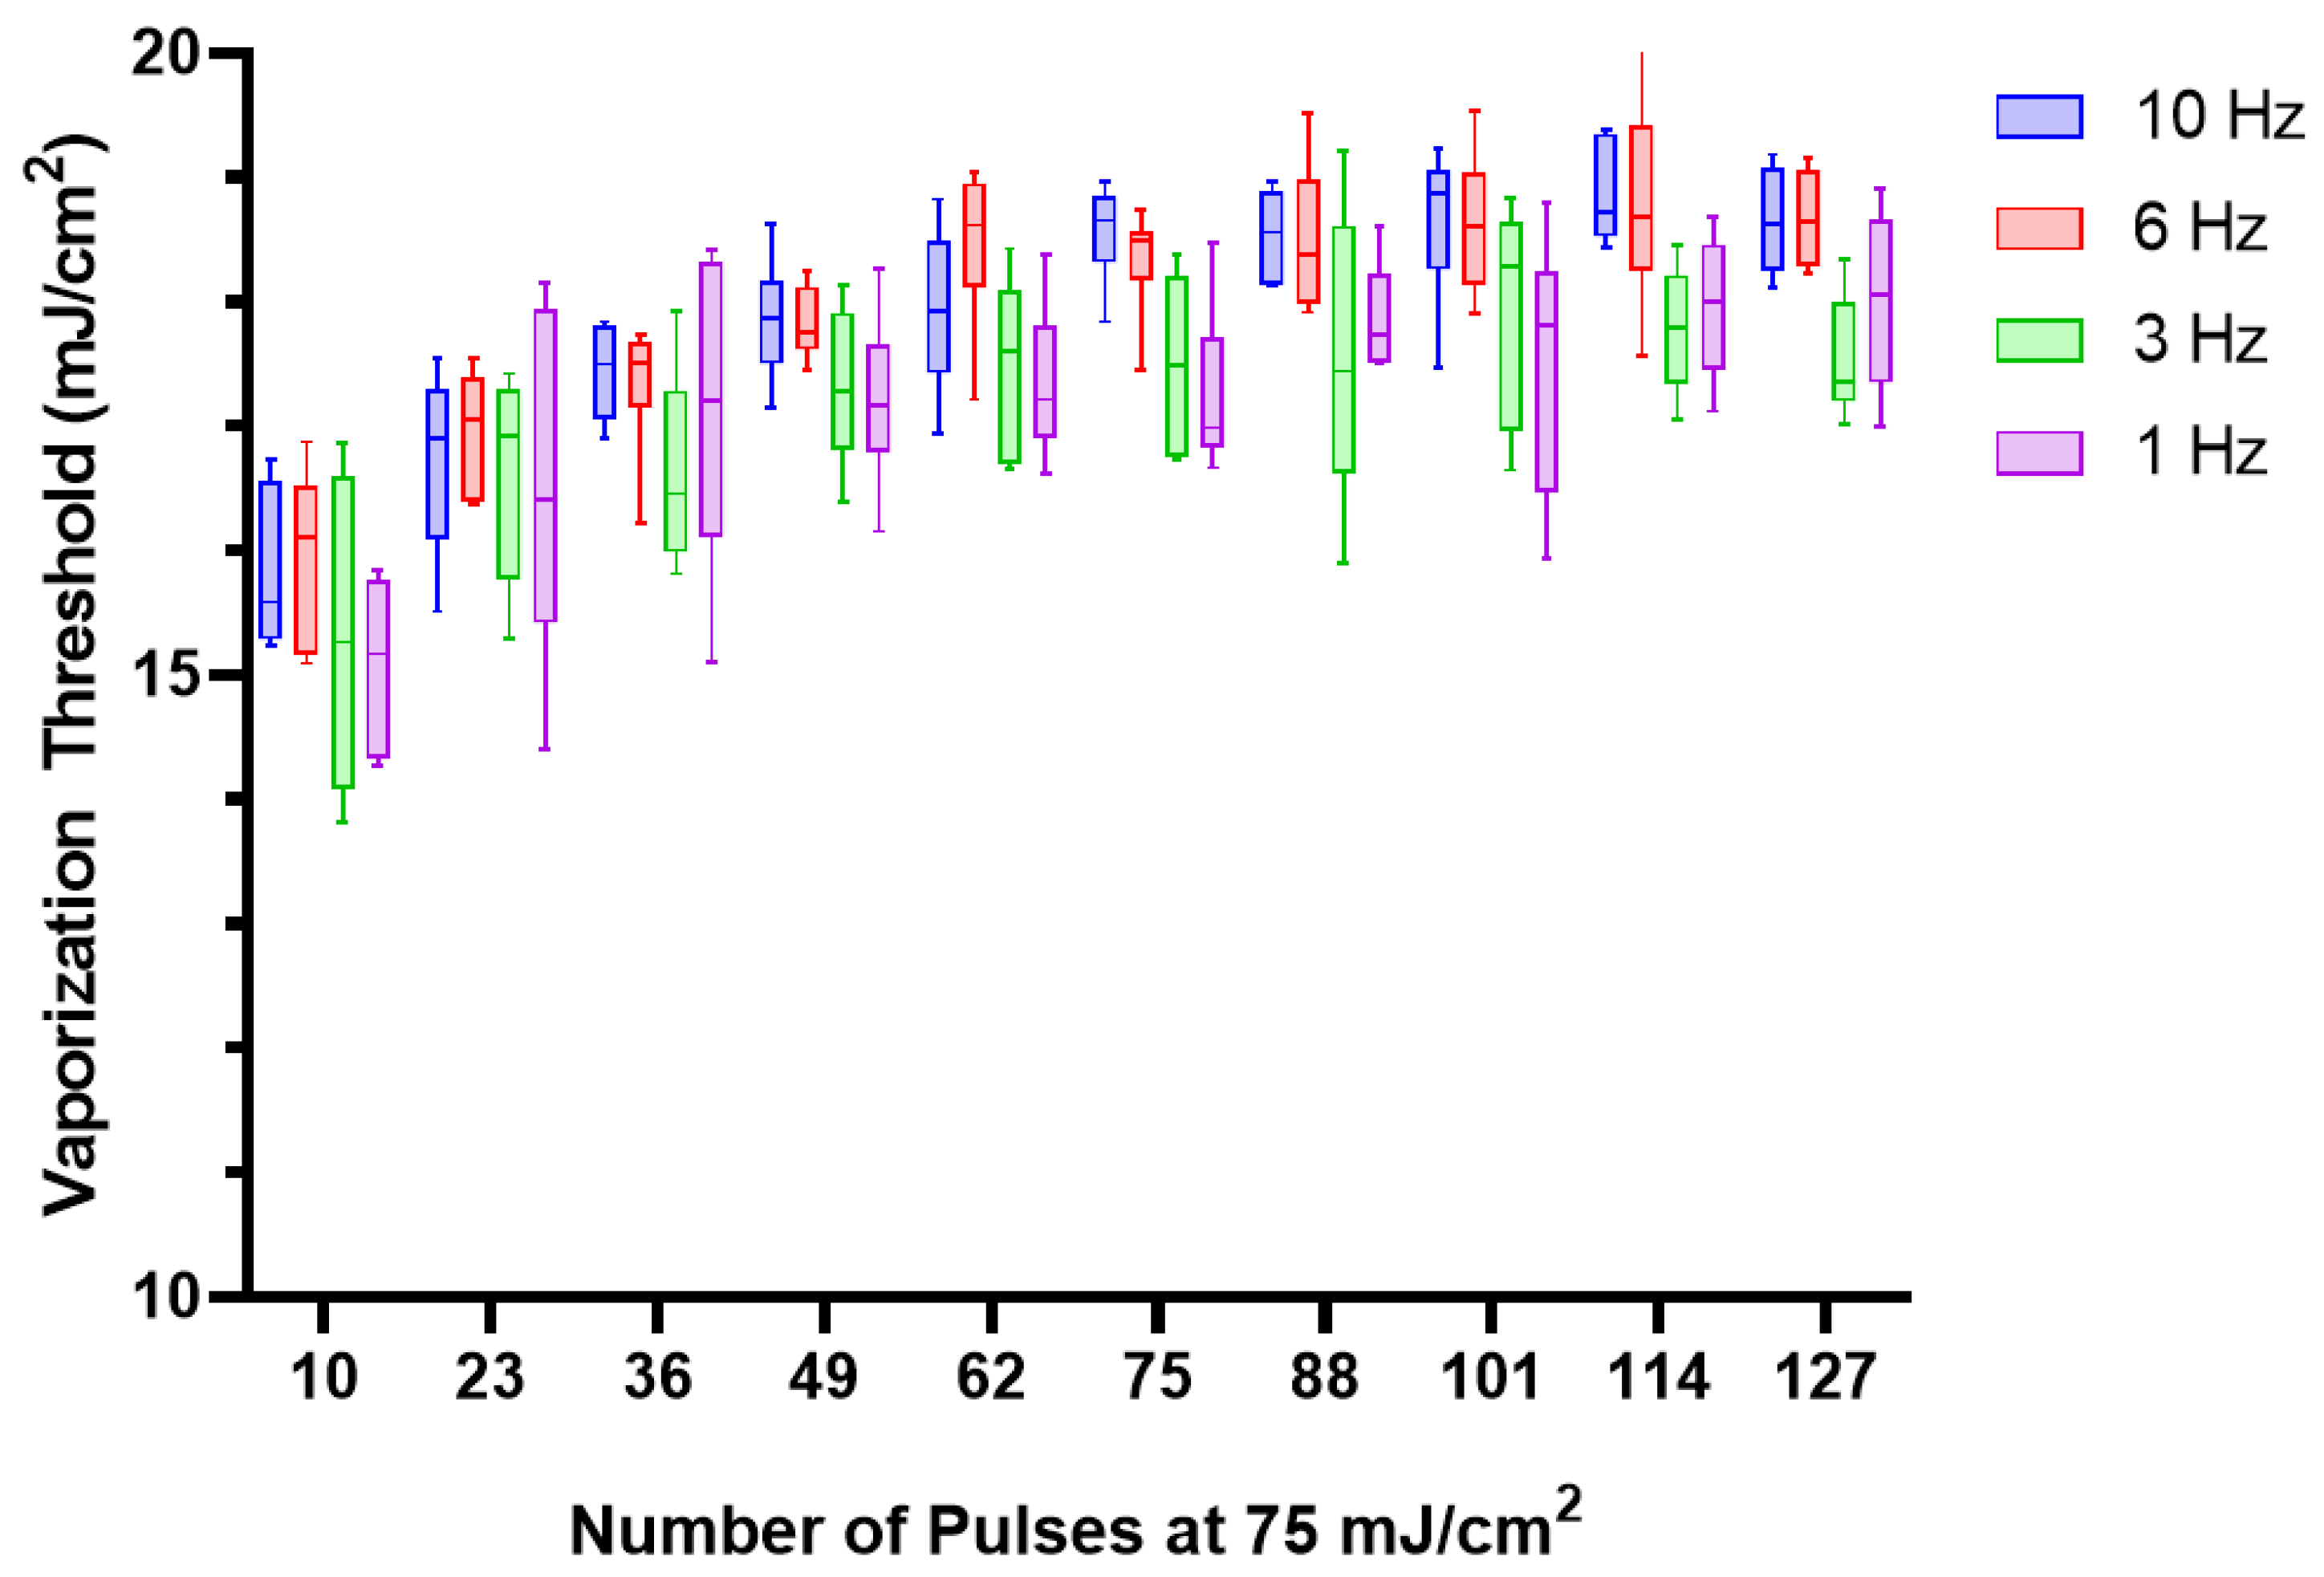
| PRF Variation (Figure 3) | Polyacrylamide | PFH | Lipid | 37 | 1, 3, 6, 10 |
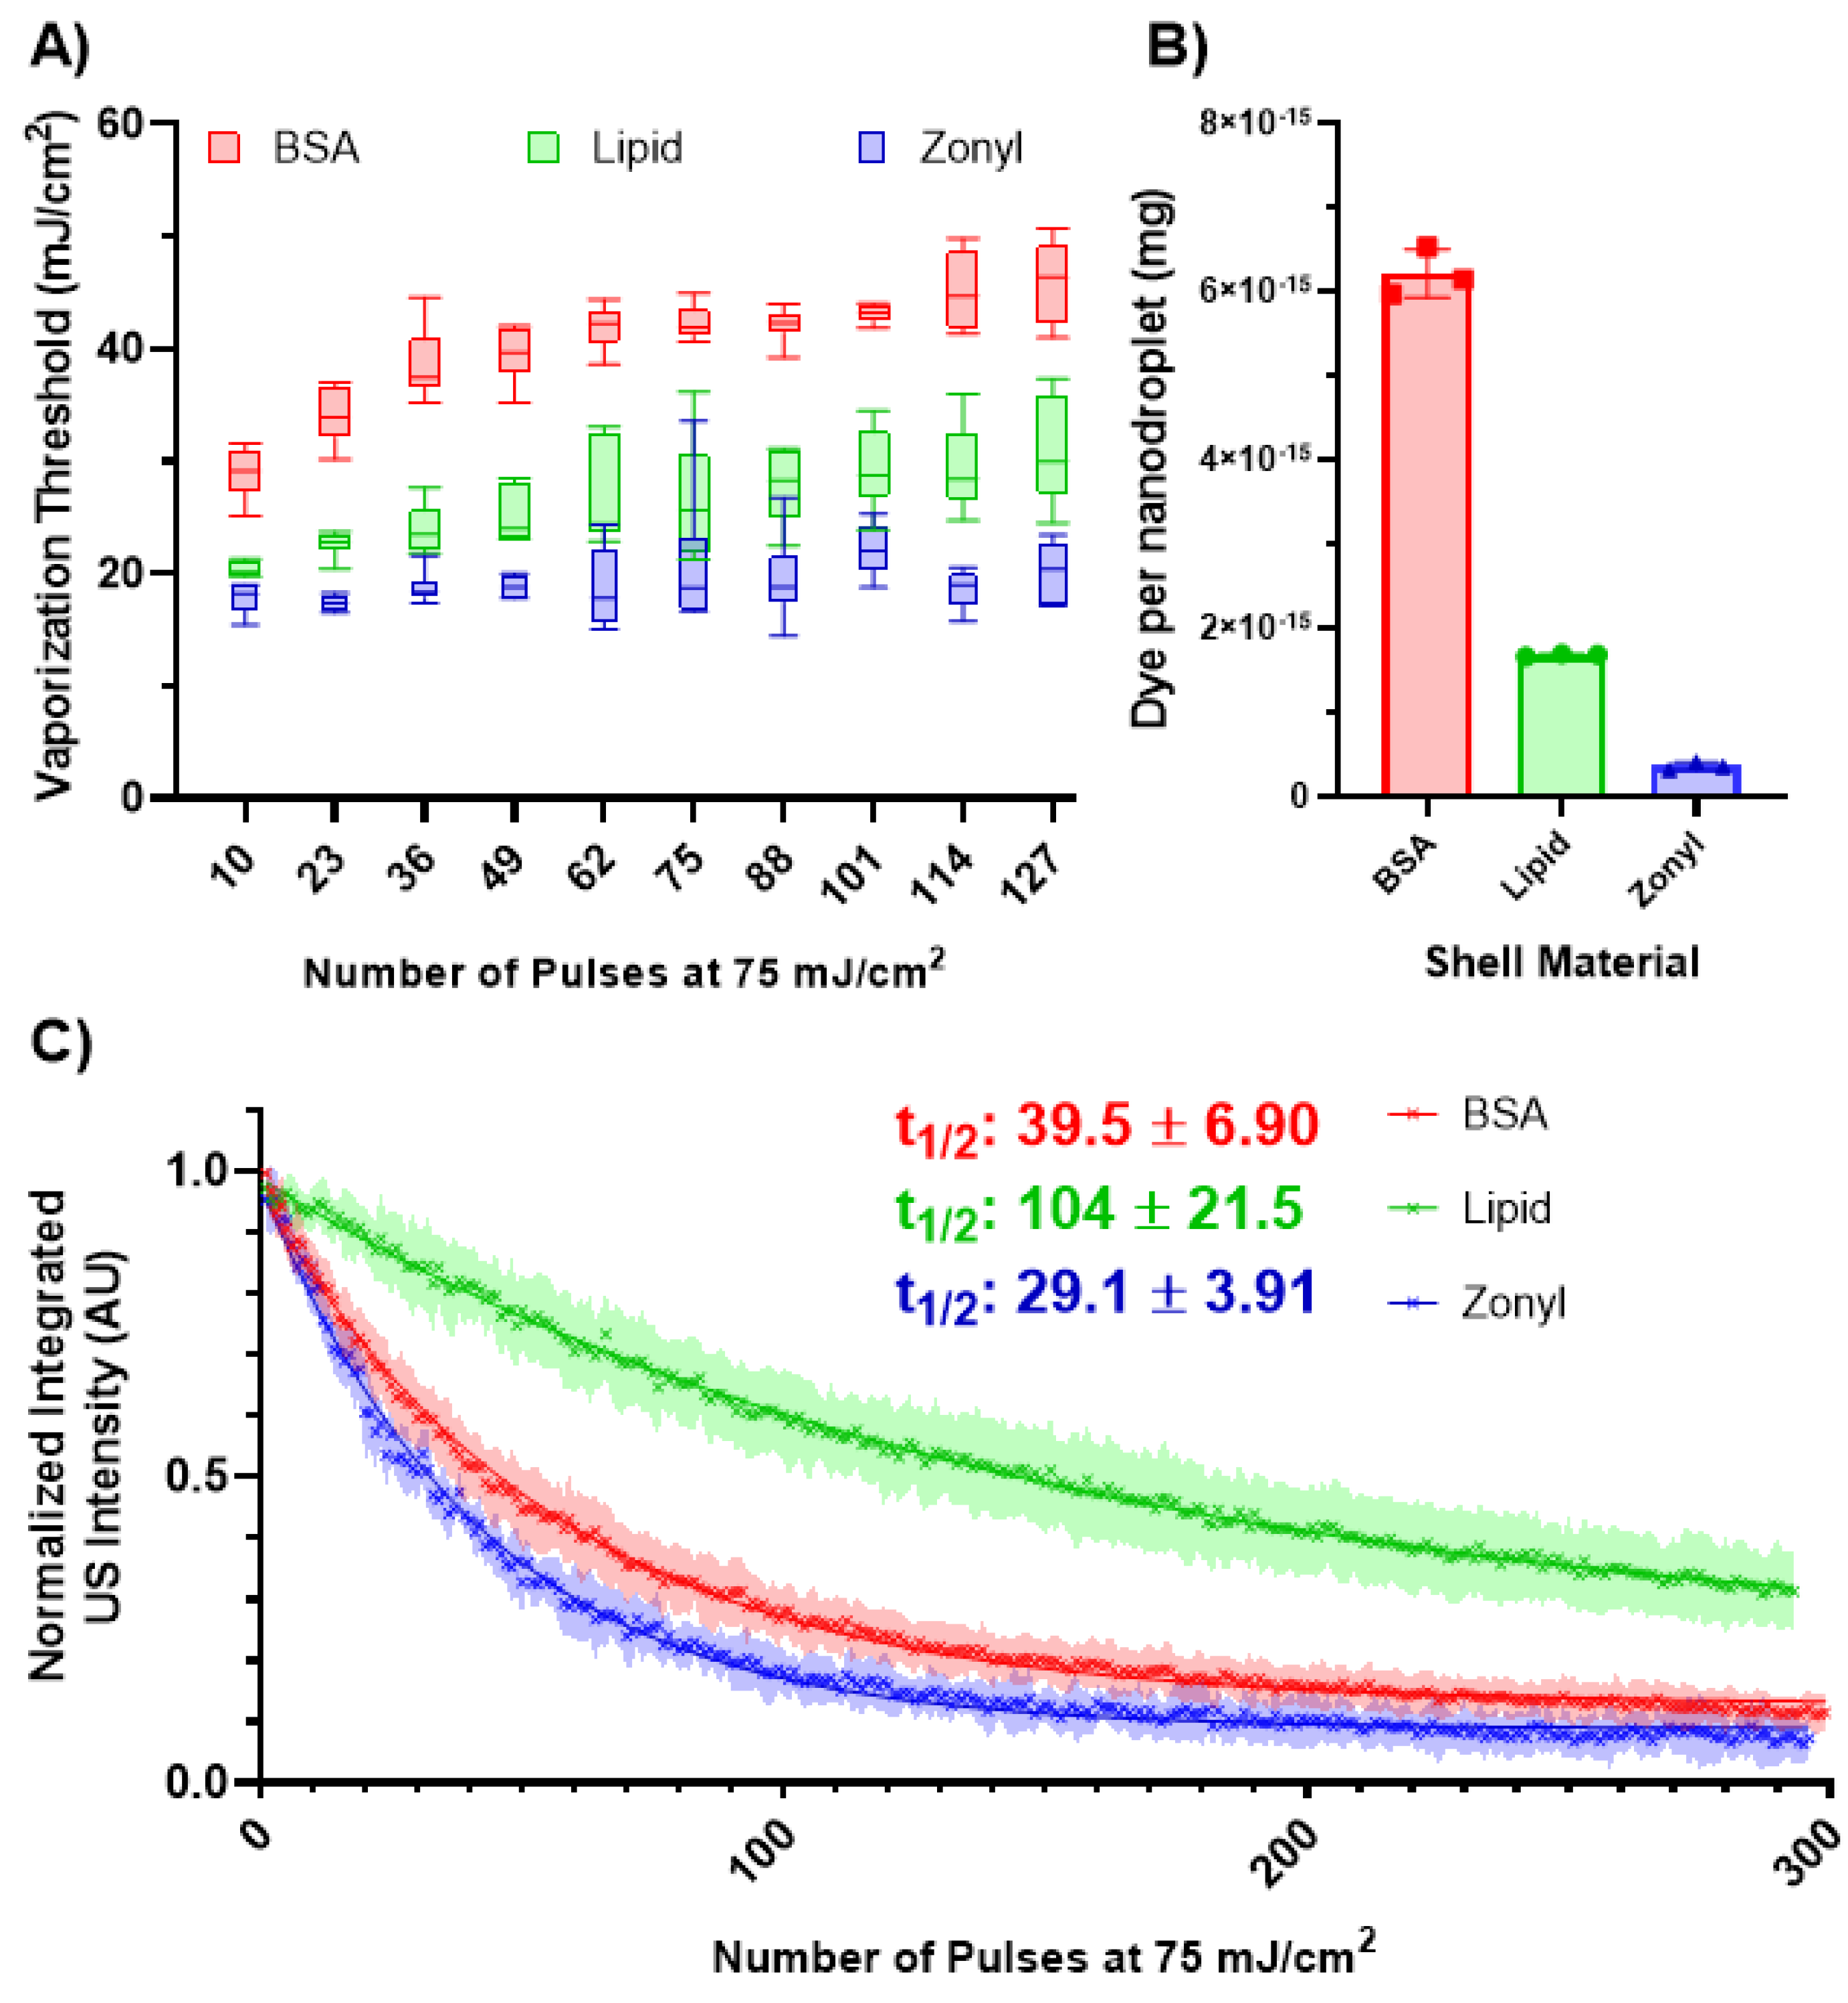
| Shell Variation (Figure 4) | Tube | PFH | Lipid, BSA, Zonyl | RT 1 | 10 |
| Environment Variation (Figure 5) | Tube and Polyacrylamide | PFH | Lipid | 37 | 10 |
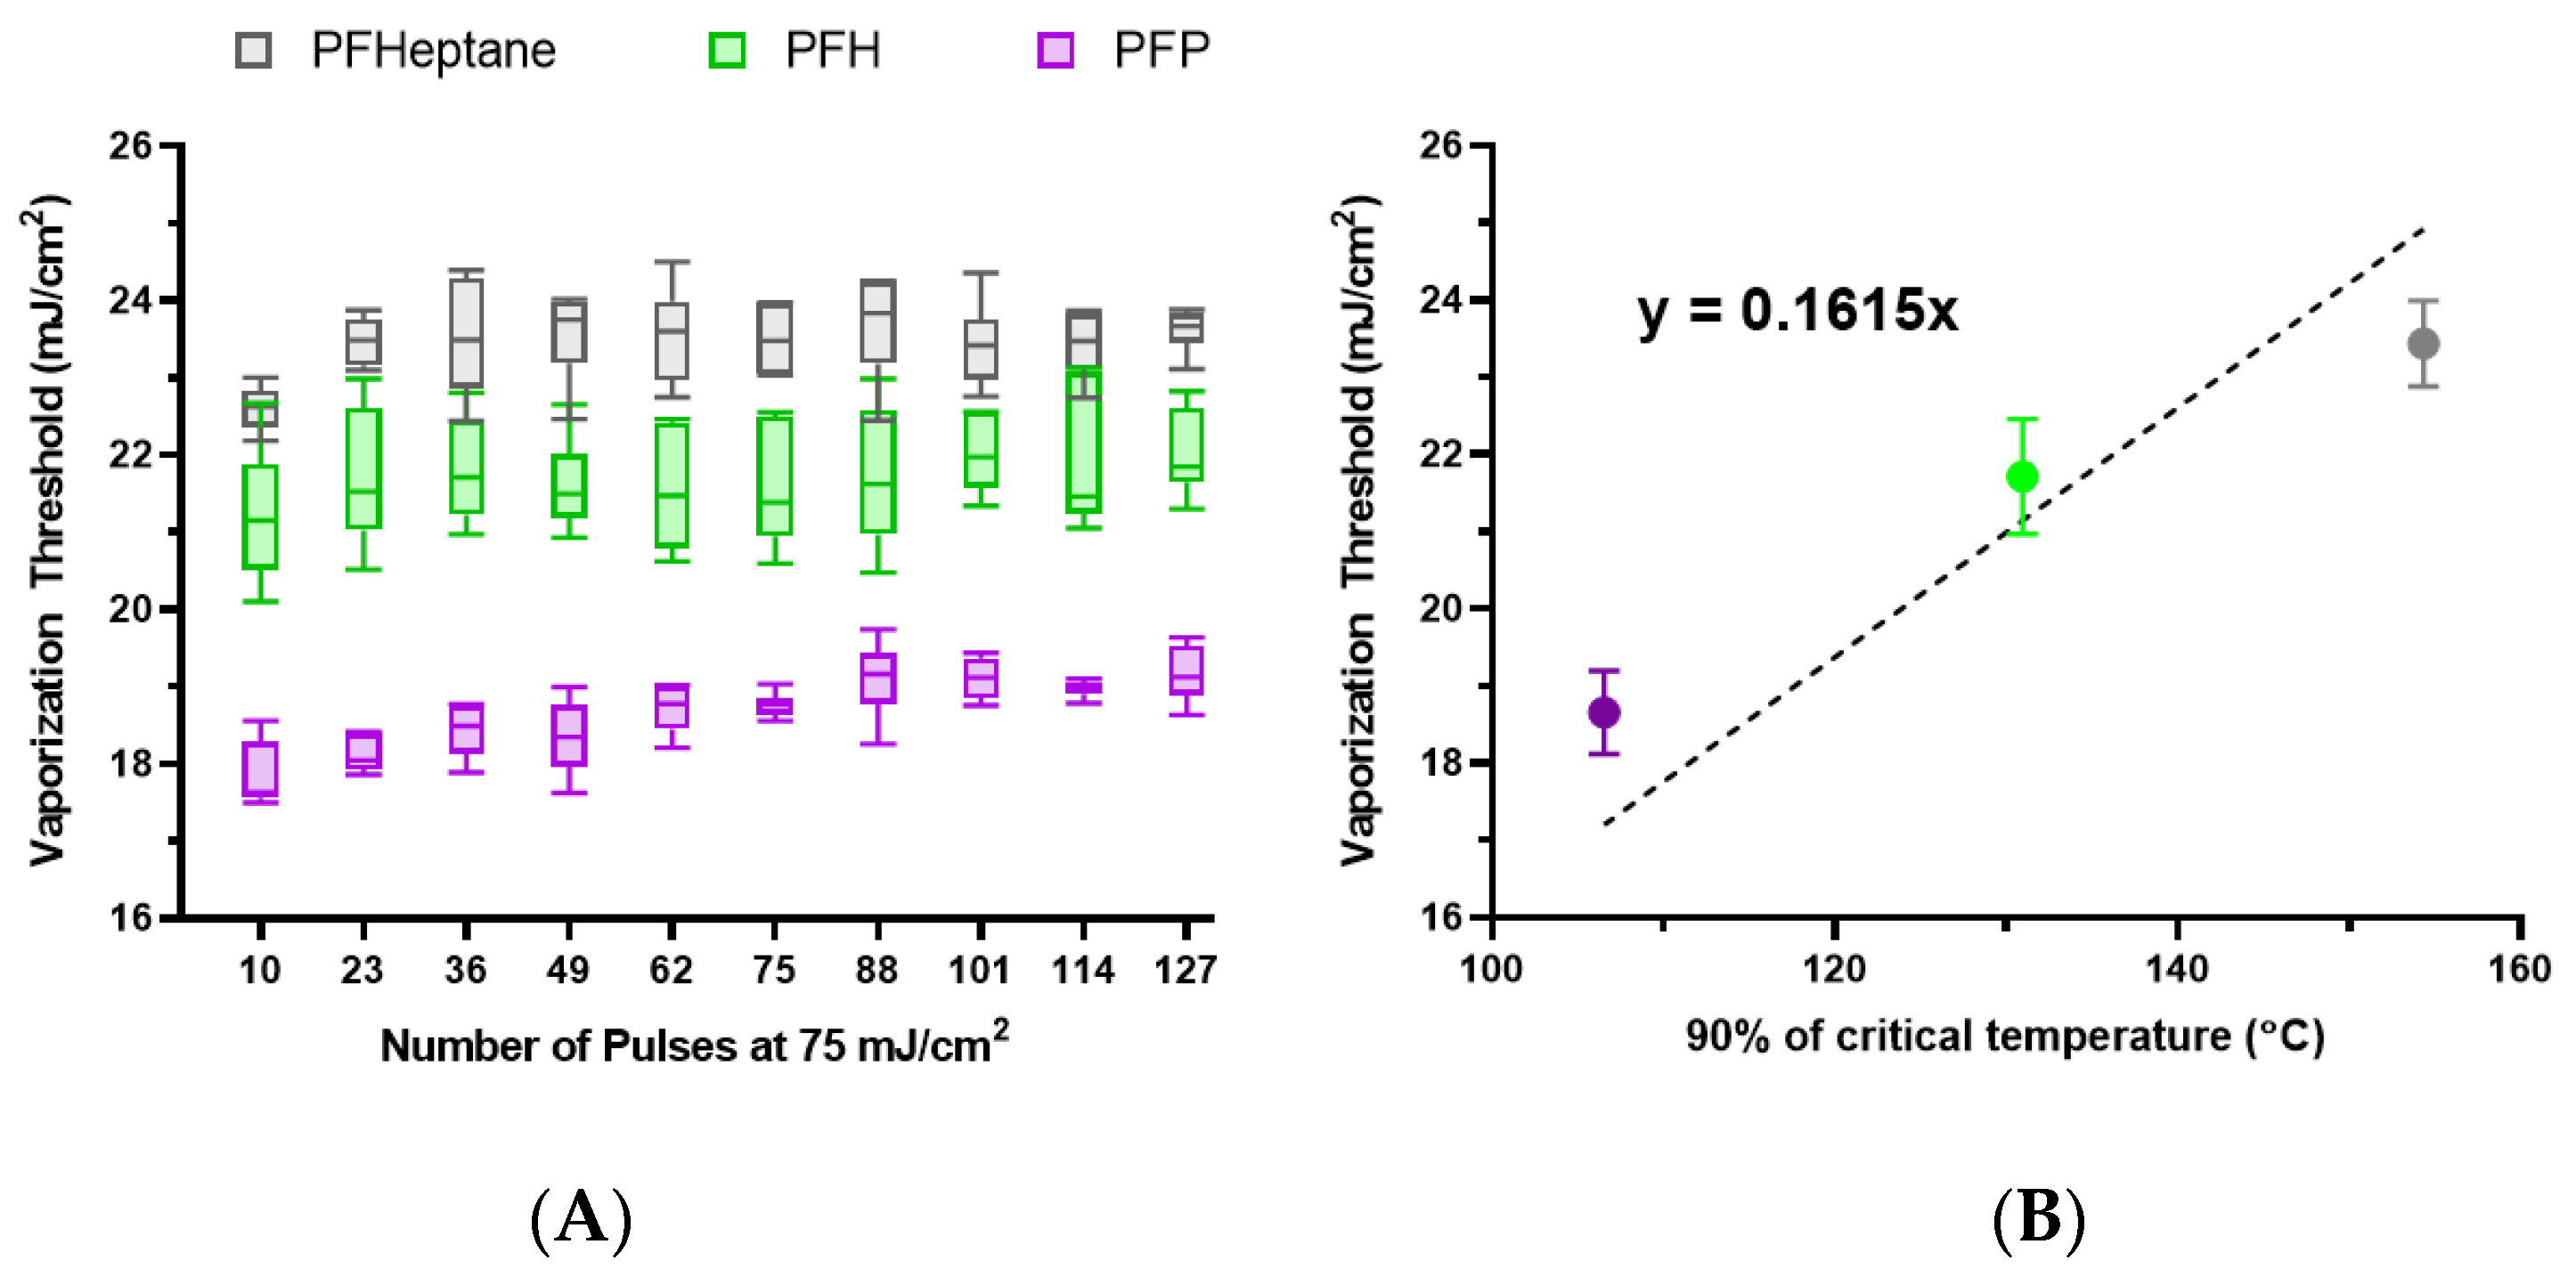
| Core Variation (Figure 6) | Polyacrylamide | PFP, PFH, PFHept | Lipid | 0 2 | 10 |
2.4. Data Processing
3. Results and Discussion
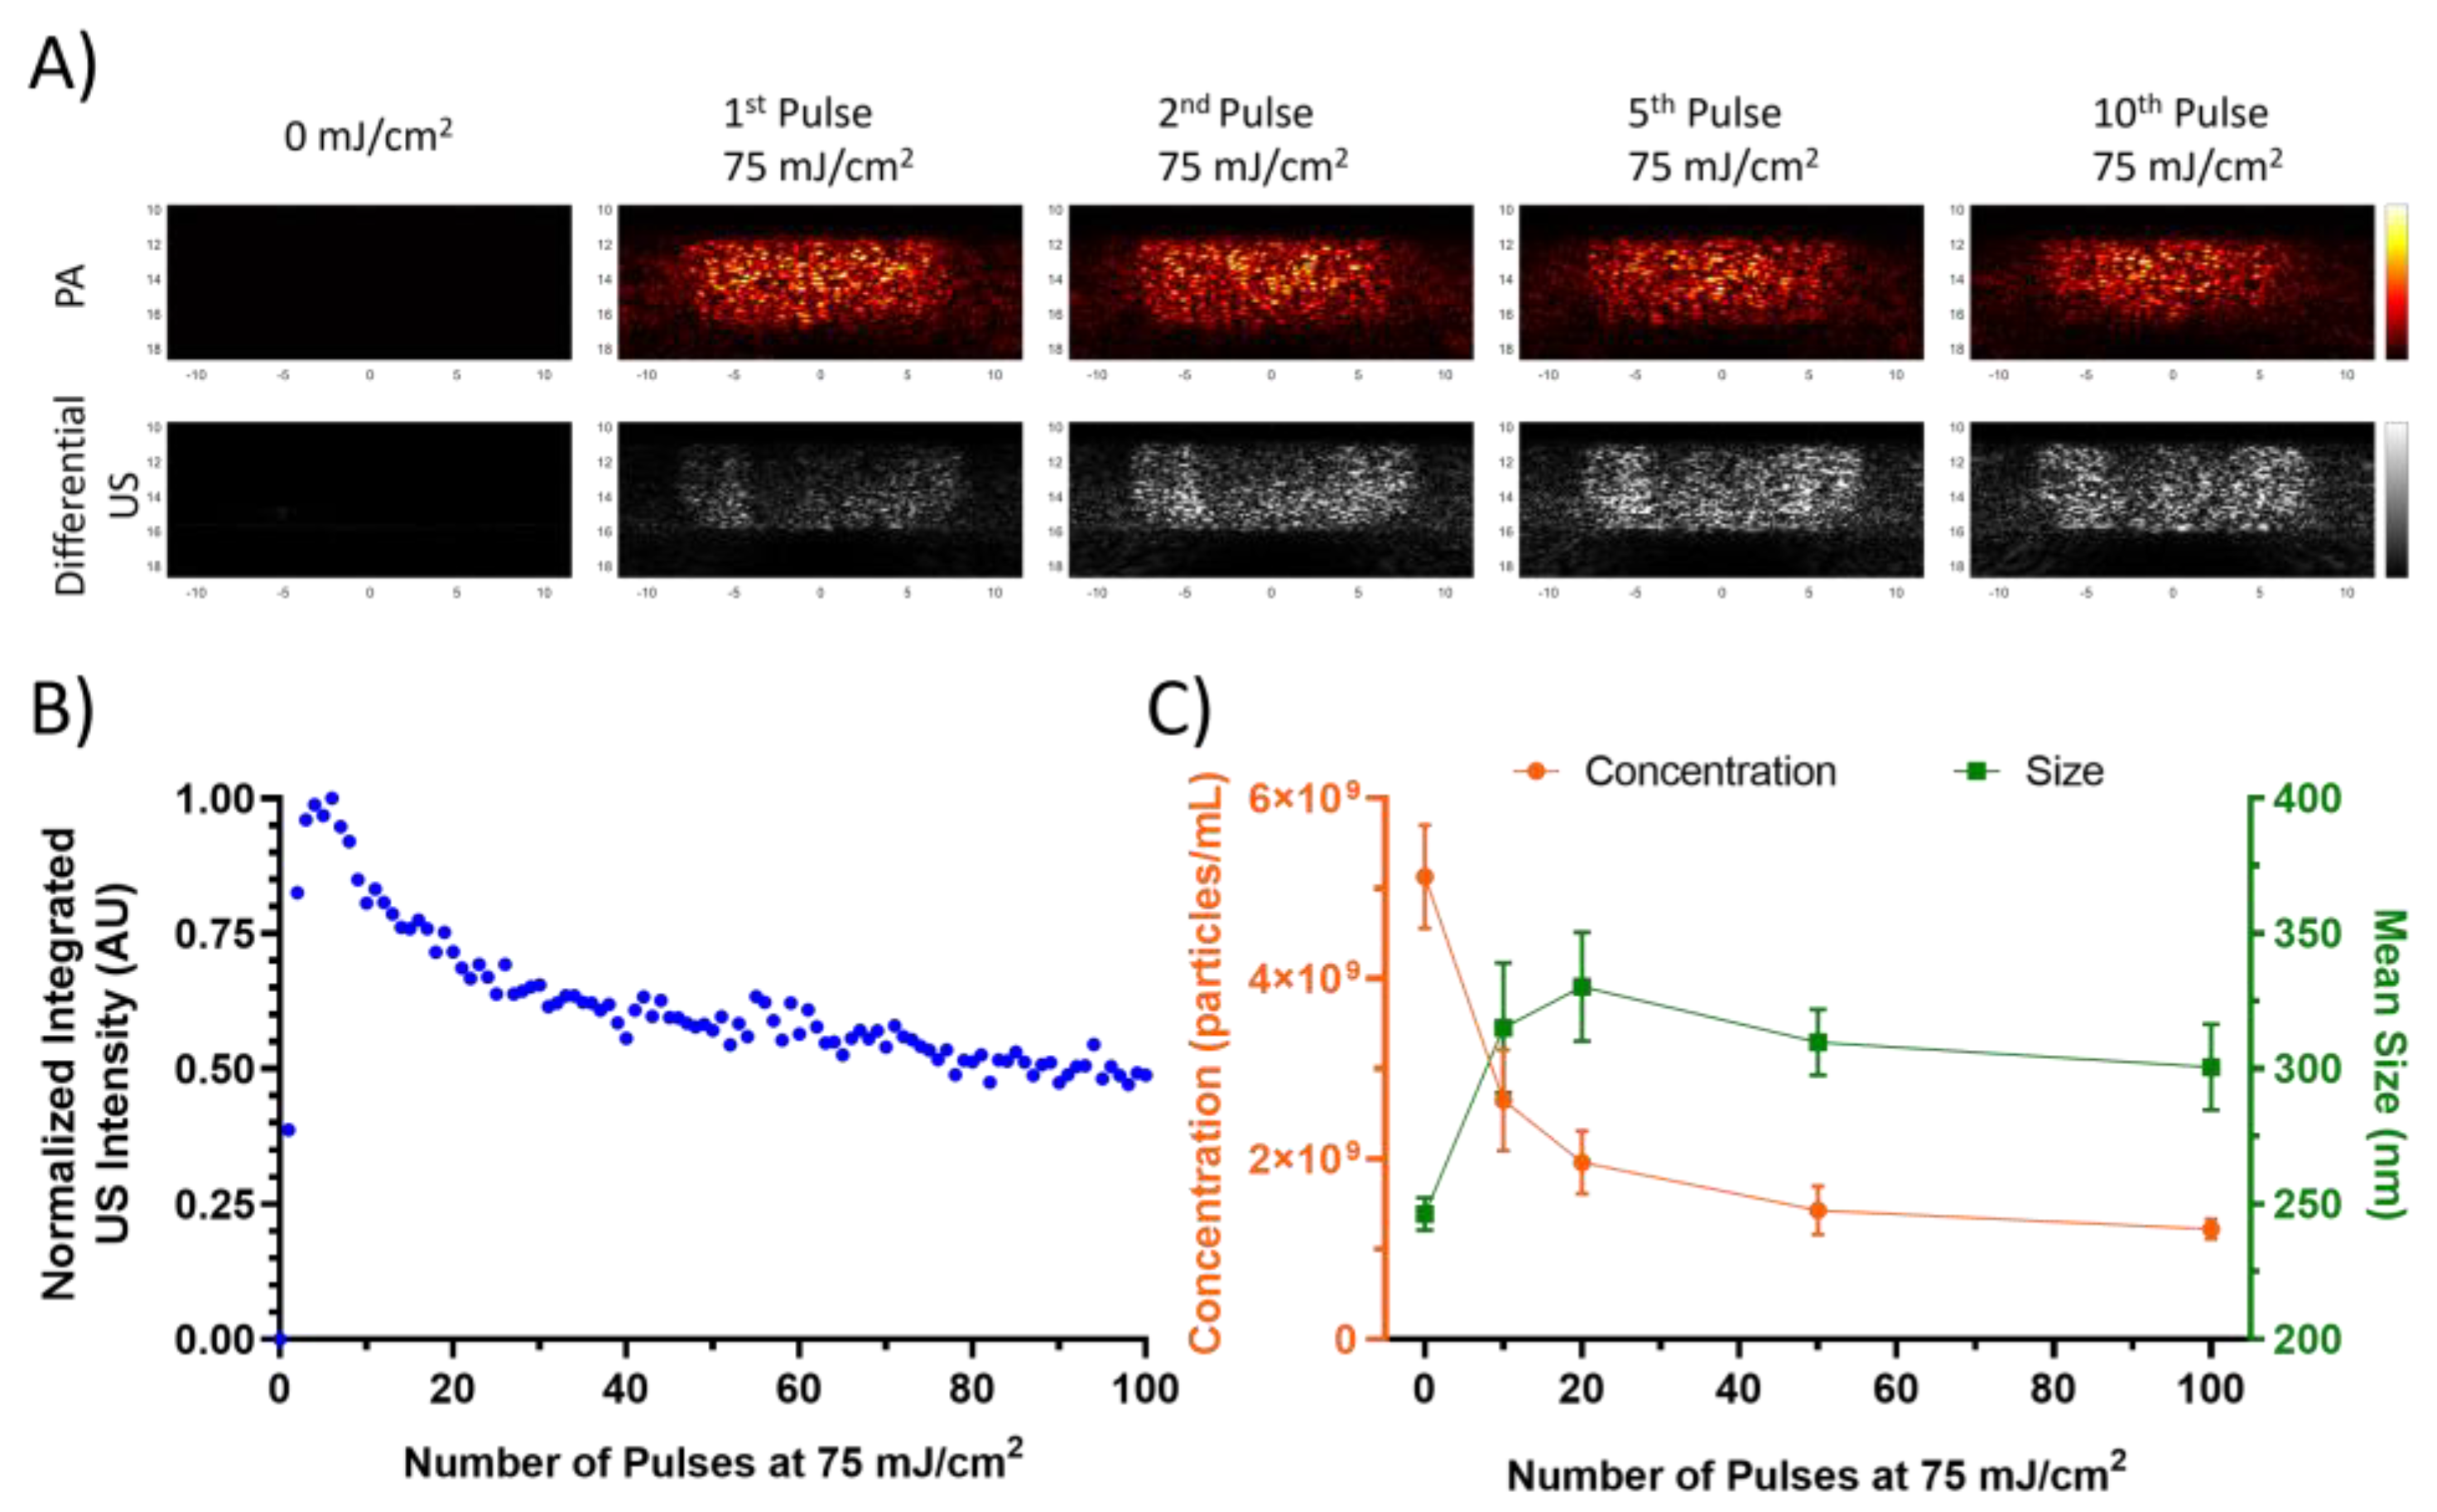
3.1. Preconditioning

3.2. PRF Variation

3.3. Shell Variation

3.4. Environmental Variation

3.5. Core Variation

4. Conclusions
Supplementary Materials
Author Contributions
Funding
Data Availability Statement
Acknowledgments
Conflicts of Interest
References
- Ferrara, K.; Pollard, R.; Borden, M. Ultrasound Microbubble Contrast Agents: Fundamentals and Application to Gene and Drug Delivery. Annu. Rev. Biomed. Eng. 2007, 9, 415–447. [Google Scholar] [CrossRef]
- Kripfgans, O.D.; Fowlkes, J.B.; Miller, D.L.; Eldevik, O.P.; Carson, P.L. Acoustic Droplet Vaporization for Therapeutic and Diagnostic Applications. Ultrasound Med. Biol. 2000, 26, 1177–1189. [Google Scholar] [CrossRef] [PubMed]
- Wilson, K.; Homan, K.; Emelianov, S. Biomedical Photoacoustics beyond Thermal Expansion Using Triggered Nanodroplet Vaporization for Contrast-Enhanced Imaging. Nat. Commun. 2012, 3, 618. [Google Scholar] [CrossRef] [PubMed]
- Dove, J.D.; Mountford, P.A.; Murray, T.W.; Borden, M.A. Engineering Optically Triggered Droplets for Photoacoustic Imaging and Therapy. Biomed. Opt. Express 2014, 5, 4417. [Google Scholar] [CrossRef]
- Sheeran, P.S.; Luois, S.H.; Mullin, L.B.; Matsunaga, T.O.; Dayton, P.A. Design of Ultrasonically-Activatable Nanoparticles Using Low Boiling Point Perfluorocarbons. Biomaterials 2012, 33, 3262–3269. [Google Scholar] [CrossRef] [PubMed]
- Strohm, E.; Rui, M.; Gorelikov, I.; Matsuura, N.; Kolios, M. Vaporization of Perfluorocarbon Droplets Using Optical Irradiation. Biomed. Opt. Express 2011, 2, 1432. [Google Scholar] [CrossRef] [PubMed]
- Rapoport, N. Phase-Shift, Stimuli-Responsive Perfluorocarbon Nanodroplets for Drug Delivery to Cancer: Phase-Shift Perfluorocarbon Nanoemulsions. WIREs Nanomed. Nanobiotechnol. 2012, 4, 492–510. [Google Scholar] [CrossRef]
- Santiesteban, D.Y.; Hallam, K.A.; Yarmoska, S.K.; Emelianov, S.Y. Color-Coded Perfluorocarbon Nanodroplets for Multiplexed Ultrasound and Photoacoustic Imaging. Nano Res. 2019, 12, 741–747. [Google Scholar] [CrossRef]
- Hallam, K.A.; Donnelly, E.M.; Karpiouk, A.B.; Hartman, R.K.; Emelianov, S.Y. Laser-Activated Perfluorocarbon Nanodroplets: A New Tool for Blood Brain Barrier Opening. Biomed. Opt. Express 2018, 9, 4527. [Google Scholar] [CrossRef] [PubMed]
- Chen, C.C.; Sheeran, P.S.; Wu, S.-Y.; Olumolade, O.O.; Dayton, P.A.; Konofagou, E.E. Targeted Drug Delivery with Focused Ultrasound-Induced Blood-Brain Barrier Opening Using Acoustically-Activated Nanodroplets. J. Control. Release 2013, 172, 795–804. [Google Scholar] [CrossRef]
- Wu, S.-Y.; Fix, S.M.; Arena, C.B.; Chen, C.C.; Zheng, W.; Olumolade, O.O.; Papadopoulou, V.; Novell, A.; Dayton, P.A.; Konofagou, E.E. Focused Ultrasound-Facilitated Brain Drug Delivery Using Optimized Nanodroplets: Vaporization Efficiency Dictates Large Molecular Delivery. Phys. Med. Biol. 2018, 63, 035002. [Google Scholar] [CrossRef] [PubMed]
- Liu, W.-W.; Liu, S.-W.; Liou, Y.-R.; Wu, Y.-H.; Yang, Y.-C.; Wang, C.-R.C.; Li, P.-C. Nanodroplet-Vaporization-Assisted Sonoporation for Highly Effective Delivery of Photothermal Treatment. Sci. Rep. 2016, 6, 24753. [Google Scholar] [CrossRef] [PubMed]
- Chen, Q.; Yu, J.; Kim, K. Review: Optically-Triggered Phase-Transition Droplets for Photoacoustic Imaging. Biomed. Eng. Lett. 2018, 8, 223–229. [Google Scholar] [CrossRef] [PubMed]
- Asami, R.; Kawabata, K. Repeatable Vaporization of Optically Vaporizable Perfluorocarbon Droplets for Photoacoustic Contrast Enhanced Imaging. In Proceedings of the 2012 IEEE International Ultrasonics Symposium, Dresden, Germany, 7–10 October 2012; IEEE: Piscataway, NJ, USA, 2012; pp. 1200–1203. [Google Scholar]
- Luke, G.P.; Hannah, A.S.; Emelianov, S.Y. Super-Resolution Ultrasound Imaging In Vivo with Transient Laser-Activated Nanodroplets. Nano Lett. 2016, 16, 2556–2559. [Google Scholar] [CrossRef]
- Hannah, A.S.; Luke, G.P.; Emelianov, S.Y. Blinking Phase-Change Nanocapsules Enable Background-Free Ultrasound Imaging. Theranostics 2016, 6, 1866–1876. [Google Scholar] [CrossRef]
- Zhu, Y.I.; Yoon, H.; Zhao, A.X.; Emelianov, S.Y. Leveraging the Imaging Transmit Pulse to Manipulate Phase-Change Nanodroplets for Contrast-Enhanced Ultrasound. IEEE Trans. Ultrason. Ferroelectr. Freq. Control 2019, 66, 692–700. [Google Scholar] [CrossRef]
- Spatarelu, C.-P.; Van Namen, A.; Luke, G.P. Optically Activatable Double-Drug-Loaded Perfluorocarbon Nanodroplets for On-Demand Image-Guided Drug Delivery. ACS Appl. Nano Mater. 2021, 4, 8026–8038. [Google Scholar] [CrossRef]
- Aliabouzar, M.; Kripfgans, O.D.; Brian Fowlkes, J.; Fabiilli, M.L. Bubble Nucleation and Dynamics in Acoustic Droplet Vaporization: A Review of Concepts, Applications, and New Directions. Z. Med. Phys. 2023, in press. [Google Scholar] [CrossRef]
- Wu, Q.; Mannaris, C.; May, J.P.; Bau, L.; Polydorou, A.; Ferri, S.; Carugo, D.; Evans, N.D.; Stride, E. Investigation of the Acoustic Vaporization Threshold of Lipid-Coated Perfluorobutane Nanodroplets Using Both High-Speed Optical Imaging and Acoustic Methods. Ultrasound Med. Biol. 2021, 47, 1826–1843. [Google Scholar] [CrossRef]
- Fabiilli, M.L.; Haworth, K.J.; Fakhri, N.H.; Kripfgans, O.D.; Carson, P.L.; Fowlkes, J.B. The Role of Inertial Cavitation in Acoustic Droplet Vaporization. IEEE Trans. Ultrason. Ferroelectr. Freq. Control 2009, 56, 1006–1017. [Google Scholar] [CrossRef]
- Porter, T.; Zhang, P. Temperature and Size-Dependence of the Vaporization Threshold of Phase-Shift Emulsions. J. Acoust. Soc. Am. 2008, 123, 2997. [Google Scholar] [CrossRef]
- Yu, J.; Chen, X.; Villanueva, F.S.; Kim, K. Vaporization and Recondensation Dynamics of Indocyanine Green-Loaded Perfluoropentane Droplets Irradiated by a Short Pulse Laser. Appl. Phys. Lett. 2016, 109, 243701. [Google Scholar] [CrossRef]
- Lajoinie, G.; Gelderblom, E.; Chlon, C.; Böhmer, M.; Steenbergen, W.; de Jong, N.; Manohar, S.; Versluis, M. Ultrafast Vapourization Dynamics of Laser-Activated Polymeric Microcapsules. Nat. Commun. 2014, 5, 3671. [Google Scholar] [CrossRef] [PubMed]
- Si, T.; Li, G.; Wu, Q.; Zhu, Z.; Luo, X.; Xu, R.X. Optical Droplet Vaporization of Nanoparticle-Loaded Stimuli-Responsive Microbubbles. Appl. Phys. Lett. 2016, 108, 111109. [Google Scholar] [CrossRef]
- Yarmoska, S.K.; Yoon, H.; Emelianov, S.Y. Lipid Shell Composition Plays a Critical Role in the Stable Size Reduction of Perfluorocarbon Nanodroplets. Ultrasound Med. Biol. 2019, 45, 1489–1499. [Google Scholar] [CrossRef]
- Hannah, A.; Luke, G.; Wilson, K.; Homan, K.; Emelianov, S. Indocyanine Green-Loaded Photoacoustic Nanodroplets: Dual Contrast Nanoconstructs for Enhanced Photoacoustic and Ultrasound Imaging. ACS Nano 2014, 8, 250–259. [Google Scholar] [CrossRef] [PubMed]
- Yoon, H.; Hallam, K.A.; Yoon, C.; Emelianov, S.Y. Super-Resolution Imaging with Ultrafast Ultrasound Imaging of Optically Triggered Perfluorohexane Nanodroplets. IEEE Trans. Ultrason. Ferroelectr. Freq. Control 2018, 65, 2277–2285. [Google Scholar] [CrossRef] [PubMed]
- Namen, A.V.; Jandhyala, S.; Jordan, T.; Luke, G.P. Repeated Acoustic Vaporization of Perfluorohexane Nanodroplets for Contrast-Enhanced Ultrasound Imaging. IEEE Trans. Ultrason. Ferroelectr. Freq. Control 2021, 68, 3497–3506. [Google Scholar] [CrossRef]
- Li, D.S.; Yoon, S.J.; Pelivanov, I.; Frenz, M.; O’Donnell, M.; Pozzo, L.D. Polypyrrole-Coated Perfluorocarbon Nanoemulsions as a Sono-Photoacoustic Contrast Agent. Nano Lett. 2017, 17, 6184–6194. [Google Scholar] [CrossRef]
- Astafyeva, K.; Somaglino, L.; Desgranges, S.; Berti, R.; Patinote, C.; Langevin, D.; Lazeyras, F.; Salomir, R.; Polidori, A.; Contino-Pépin, C.; et al. Perfluorocarbon Nanodroplets Stabilized by Fluorinated Surfactants: Characterization and Potentiality as Theranostic Agents. J. Mater. Chem. B 2015, 3, 2892–2907. [Google Scholar] [CrossRef]
- Fernandes, D.A.; Fernandes, D.D.; Li, Y.; Wang, Y.; Zhang, Z.; Rousseau, D.; Gradinaru, C.C.; Kolios, M.C. Synthesis of Stable Multifunctional Perfluorocarbon Nanoemulsions for Cancer Therapy and Imaging. Langmuir 2016, 32, 10870–10880. [Google Scholar] [CrossRef] [PubMed]
- Rapoport, N.; Christensen, D.A.; Kennedy, A.M.; Nam, K.-H. Cavitation Properties of Block Copolymer Stabilized Phase-Shift Nanoemulsions Used as Drug Carriers. Ultrasound Med. Biol. 2010, 36, 419–429. [Google Scholar] [CrossRef] [PubMed]
- Reznik, N.; Seo, M.; Williams, R.; Bolewska-Pedyczak, E.; Lee, M.; Matsuura, N.; Gariepy, J.; Foster, F.S.; Burns, P.N. Optical Studies of Vaporization and Stability of Fluorescently Labelled Perfluorocarbon Droplets. Phys. Med. Biol. 2012, 57, 7205–7217. [Google Scholar] [CrossRef]
- Silwal, A.; Upadhyay, A.; Shakya, G.; Inzunza-Ibarra, M.; Murray, T.; Ding, X.; Borden, M.A. Photoacoustic Vaporization of Endoskeletal Droplets Loaded with Zinc Naphthalocyanine. Langmuir 2023, 39, 168–176. [Google Scholar] [CrossRef]
- Chattaraj, R.; Goldscheitter, G.M.; Yildirim, A.; Goodwin, A.P. Phase Behavior of Mixed Lipid Monolayers on Perfluorocarbon Nanoemulsions and Its Effect on Acoustic Contrast. RSC Adv. 2016, 6, 111318–111325. [Google Scholar] [CrossRef] [PubMed]
- Zhang, Z.; Taylor, M.; Kaval, N.; Park, Y.C. Phase-Transition Temperature of Gold-Nanorod-Coated Nanodroplets to Microbubbles by Pulsed Laser. J. Phys. Chem. A 2019, 123, 4844–4852. [Google Scholar] [CrossRef]
- Quay, S. Phase Shift Colloids as Ultrasound Contrast Agents 198AD. US5707606A, 27 May 2003. [Google Scholar]
- Kandadai, M.A.; Mohan, P.; Lin, G.; Butterfield, A.; Skliar, M.; Magda, J.J. Comparison of Surfactants Used to Prepare Aqueous Perfluoropentane Emulsions for Pharmaceutical Applications. Langmuir 2010, 26, 4655–4660. [Google Scholar] [CrossRef] [PubMed]
- Sheeran, P.S.; Luois, S.; Dayton, P.A.; Matsunaga, T.O. Formulation and Acoustic Studies of a New Phase-Shift Agent for Diagnostic and Therapeutic Ultrasound. Langmuir 2011, 27, 10412–10420. [Google Scholar] [CrossRef] [PubMed]
- Dunlap, R.D.; Murphy, C.J.; Bedford, R.G. Some Physical Properties of Perfluoro-n-Hexane. J. Am. Chem. Soc. 1958, 80, 83–85. [Google Scholar] [CrossRef]
- Mountford, P.A.; Borden, M.A. On the Thermodynamics and Kinetics of Superheated Fluorocarbon Phase-Change Agents. Adv. Colloid Interface Sci. 2016, 237, 15–27. [Google Scholar] [CrossRef]
- Mountford, P.A.; Thomas, A.N.; Borden, M.A. Thermal Activation of Superheated Lipid-Coated Perfluorocarbon Drops. Langmuir 2015, 31, 4627–4634. [Google Scholar] [CrossRef] [PubMed]
- Huang, Y.; Vezeridis, A.M.; Wang, J.; Wang, Z.; Thompson, M.; Mattrey, R.F.; Gianneschi, N.C. Polymer-Stabilized Perfluorobutane Nanodroplets for Ultrasound Imaging Agents. J. Am. Chem. Soc. 2017, 139, 15–18. [Google Scholar] [CrossRef] [PubMed]
- Grinstaff, M.W.; Suslick, K.S. Air-Filled Proteinaceous Microbubbles: Synthesis of an Echo-Contrast Agent. Proc. Natl. Acad. Sci. USA 1991, 88, 7708–7710. [Google Scholar] [CrossRef] [PubMed]
- Pollice, R.; Chen, P. Origin of the Immiscibility of Alkanes and Perfluoroalkanes. J. Am. Chem. Soc. 2019, 141, 3489–3506. [Google Scholar] [CrossRef]
- Dayton, P.A.; Morgan, K.E.; Klibanov, A.L.; Brandenburger, G.H.; Ferrara, K.W. Optical and Acoustical Observations of the Effects of Ultrasound on Contrast Agents. IEEE Trans. Ultrason. Ferroelectr. Freq. Control 1999, 46, 220–232. [Google Scholar] [CrossRef] [PubMed]
- Helfield, B.; Black, J.J.; Qin, B.; Pacella, J.; Chen, X.; Villanueva, F.S. Fluid Viscosity Affects the Fragmentation and Inertial Cavitation Threshold of Lipid-Encapsulated Microbubbles. Ultrasound Med. Biol. 2016, 42, 782–794. [Google Scholar] [CrossRef] [PubMed]
- Reznik, N.; Shpak, O.; Gelderblom, E.C.; Williams, R.; De Jong, N.; Versluis, M.; Burns, P.N. The Efficiency and Stability of Bubble Formation by Acoustic Vaporization of Submicron Perfluorocarbon Droplets. Ultrasonics 2013, 53, 1368–1376. [Google Scholar] [CrossRef]
- Butcher, D.T.; Alliston, T.; Weaver, V.M. A Tense Situation: Forcing Tumour Progression. Nat. Rev. Cancer 2009, 9, 108–122. [Google Scholar] [CrossRef]
- Jandhyala, S.; Van Namen, A.; Spatarelu, C.-P.; Luke, G.P. EGFR-Targeted Perfluorohexane Nanodroplets for Molecular Ultrasound Imaging. Nanomaterials 2022, 12, 2251. [Google Scholar] [CrossRef]
- Chudal, L.; de Gracia Lux, C.; Lux, J.; Mattrey, R. Acoustic Vaporization of Internalized Superheated Perfluorocarbon Nanodroplets for Imaging and Macrophage Function Modulation. J. Acoust. Soc. Am. 2021, 150, A53. [Google Scholar] [CrossRef]
- Chudal, L.; de Gracia Lux, C.; Lux, J.; Mattrey, R. In Vivo Ultrasound Imaging of Macrophages Using Acoustic Vaporization of Internalized Superheated Nanodroplets. J. Acoust. Soc. Am. 2022, 152, A79. [Google Scholar] [CrossRef]
- Xu, Z.; Liu, H.; Tian, H.; Yan, F. Real-Time Imaging Tracking of Engineered Macrophages as Ultrasound-Triggered Cell Bombs for Cancer Treatment. Adv. Funct. Mater. 2020, 30, 1910304. [Google Scholar] [CrossRef]
- Pradhan, S.; Keller, K.A.; Sperduto, J.L.; Slater, J.H. Fundamentals of Laser-Based Hydrogel Degradation and Applications in Cell and Tissue Engineering. Adv. Healthc. Mater. 2017, 6, 1700681. [Google Scholar] [CrossRef]
- Aliabouzar, M.; Kumar, K.N.; Sarkar, K. Effects of Droplet Size and Perfluorocarbon Boiling Point on the Frequency Dependence of Acoustic Vaporization Threshold. J. Acoust. Soc. Am. 2019, 145, 1105–1116. [Google Scholar] [CrossRef] [PubMed]
- Wei, C.; Xia, J.; Lombardo, M.; Perez, C.; Arnal, B.; Larson-Smith, K.; Pelivanov, I.; Matula, T.; Pozzo, L.; O’Donnell, M. Laser-Induced Cavitation in Nanoemulsion with Gold Nanospheres for Blood Clot Disruption: In Vitro Results. Opt. Lett. 2014, 39, 2599. [Google Scholar] [CrossRef] [PubMed]
- Ermakov, G.V.; Skripov, V.P. Saturation Line, Critical Parameters, and Attainable Superheating of the Perfluoroparaffins. Russ. J. Phys. Chem. 1967, 41, 39–43. [Google Scholar]
- Mousa, A.H.N. Study of Vapor Pressure and Critical Properties of Perfluoro-n-Hexane. J. Chem. Eng. Data 1978, 23, 133–134. [Google Scholar] [CrossRef]
- Steele, W.V.; Chirico, R.D.; Knipmeyer, S.E.; Nguyen, A. Vapor Pressure, Heat Capacity, and Density along the Saturation Line, Measurements for Dimethyl Isophthalate, Dimethyl Carbonate, 1,3,5-Triethylbenzene, Pentafluorophenol, 4-Tert-Butylcatechol, α-Methylstyrene, and N,N′-Bis(2-Hydroxyethyl)Ethylenediamine. J. Chem. Eng. Data 1997, 42, 1008–1020. [Google Scholar] [CrossRef]
- Boudou, T.; Ohayon, J.; Picart, C.; Pettigrew, R.I.; Tracqui, P. Nonlinear Elastic Properties of Polyacrylamide Gels: Implications for Quantification of Cellular Forces. Biorheology 2009, 46, 191–205. [Google Scholar] [CrossRef]
- Zhang, X.; Greenleaf, J.F. Estimation of Tissue’s Elasticity with Surface Wave Speed. J. Acoust. Soc. Am. 2007, 122, 2522. [Google Scholar] [CrossRef]
- Loupas, T.; Powers, J.T.; Gill, R.W. An Axial Velocity Estimator for Ultrasound Blood Flow Imaging, Based on a Full Evaluation of the Doppler Equation by Means of a Two-Dimensional Autocorrelation Approach. IEEE Trans. Ultrason. Ferroelect. Freq. Contr. 1995, 42, 672–688. [Google Scholar] [CrossRef]


Disclaimer/Publisher’s Note: The statements, opinions and data contained in all publications are solely those of the individual author(s) and contributor(s) and not of MDPI and/or the editor(s). MDPI and/or the editor(s) disclaim responsibility for any injury to people or property resulting from any ideas, methods, instructions or products referred to in the content. |
© 2023 by the authors. Licensee MDPI, Basel, Switzerland. This article is an open access article distributed under the terms and conditions of the Creative Commons Attribution (CC BY) license (https://creativecommons.org/licenses/by/4.0/).
Share and Cite
Zhao, A.X.; Zhu, Y.I.; Chung, E.; Lee, J.; Morais, S.; Yoon, H.; Emelianov, S. Factors Influencing the Repeated Transient Optical Droplet Vaporization Threshold and Lifetimes of Phase Change, Perfluorocarbon Nanodroplets. Nanomaterials 2023, 13, 2238. https://doi.org/10.3390/nano13152238
Zhao AX, Zhu YI, Chung E, Lee J, Morais S, Yoon H, Emelianov S. Factors Influencing the Repeated Transient Optical Droplet Vaporization Threshold and Lifetimes of Phase Change, Perfluorocarbon Nanodroplets. Nanomaterials. 2023; 13(15):2238. https://doi.org/10.3390/nano13152238
Chicago/Turabian StyleZhao, Andrew X., Yiying I. Zhu, Euisuk Chung, Jeehyun Lee, Samuel Morais, Heechul Yoon, and Stanislav Emelianov. 2023. "Factors Influencing the Repeated Transient Optical Droplet Vaporization Threshold and Lifetimes of Phase Change, Perfluorocarbon Nanodroplets" Nanomaterials 13, no. 15: 2238. https://doi.org/10.3390/nano13152238
APA StyleZhao, A. X., Zhu, Y. I., Chung, E., Lee, J., Morais, S., Yoon, H., & Emelianov, S. (2023). Factors Influencing the Repeated Transient Optical Droplet Vaporization Threshold and Lifetimes of Phase Change, Perfluorocarbon Nanodroplets. Nanomaterials, 13(15), 2238. https://doi.org/10.3390/nano13152238