
Biomolecular Adsorprion at ZnS Nanomaterials: A Molecular Dynamics Simulation Study of the Adsorption Preferences, Effects of the Surface Curvature and Coating


Abstract
1. Introduction
2. Simulation Models and Methods
2.1. Models
- ZnS (110) Slabs
- ZnS Nanoparticles
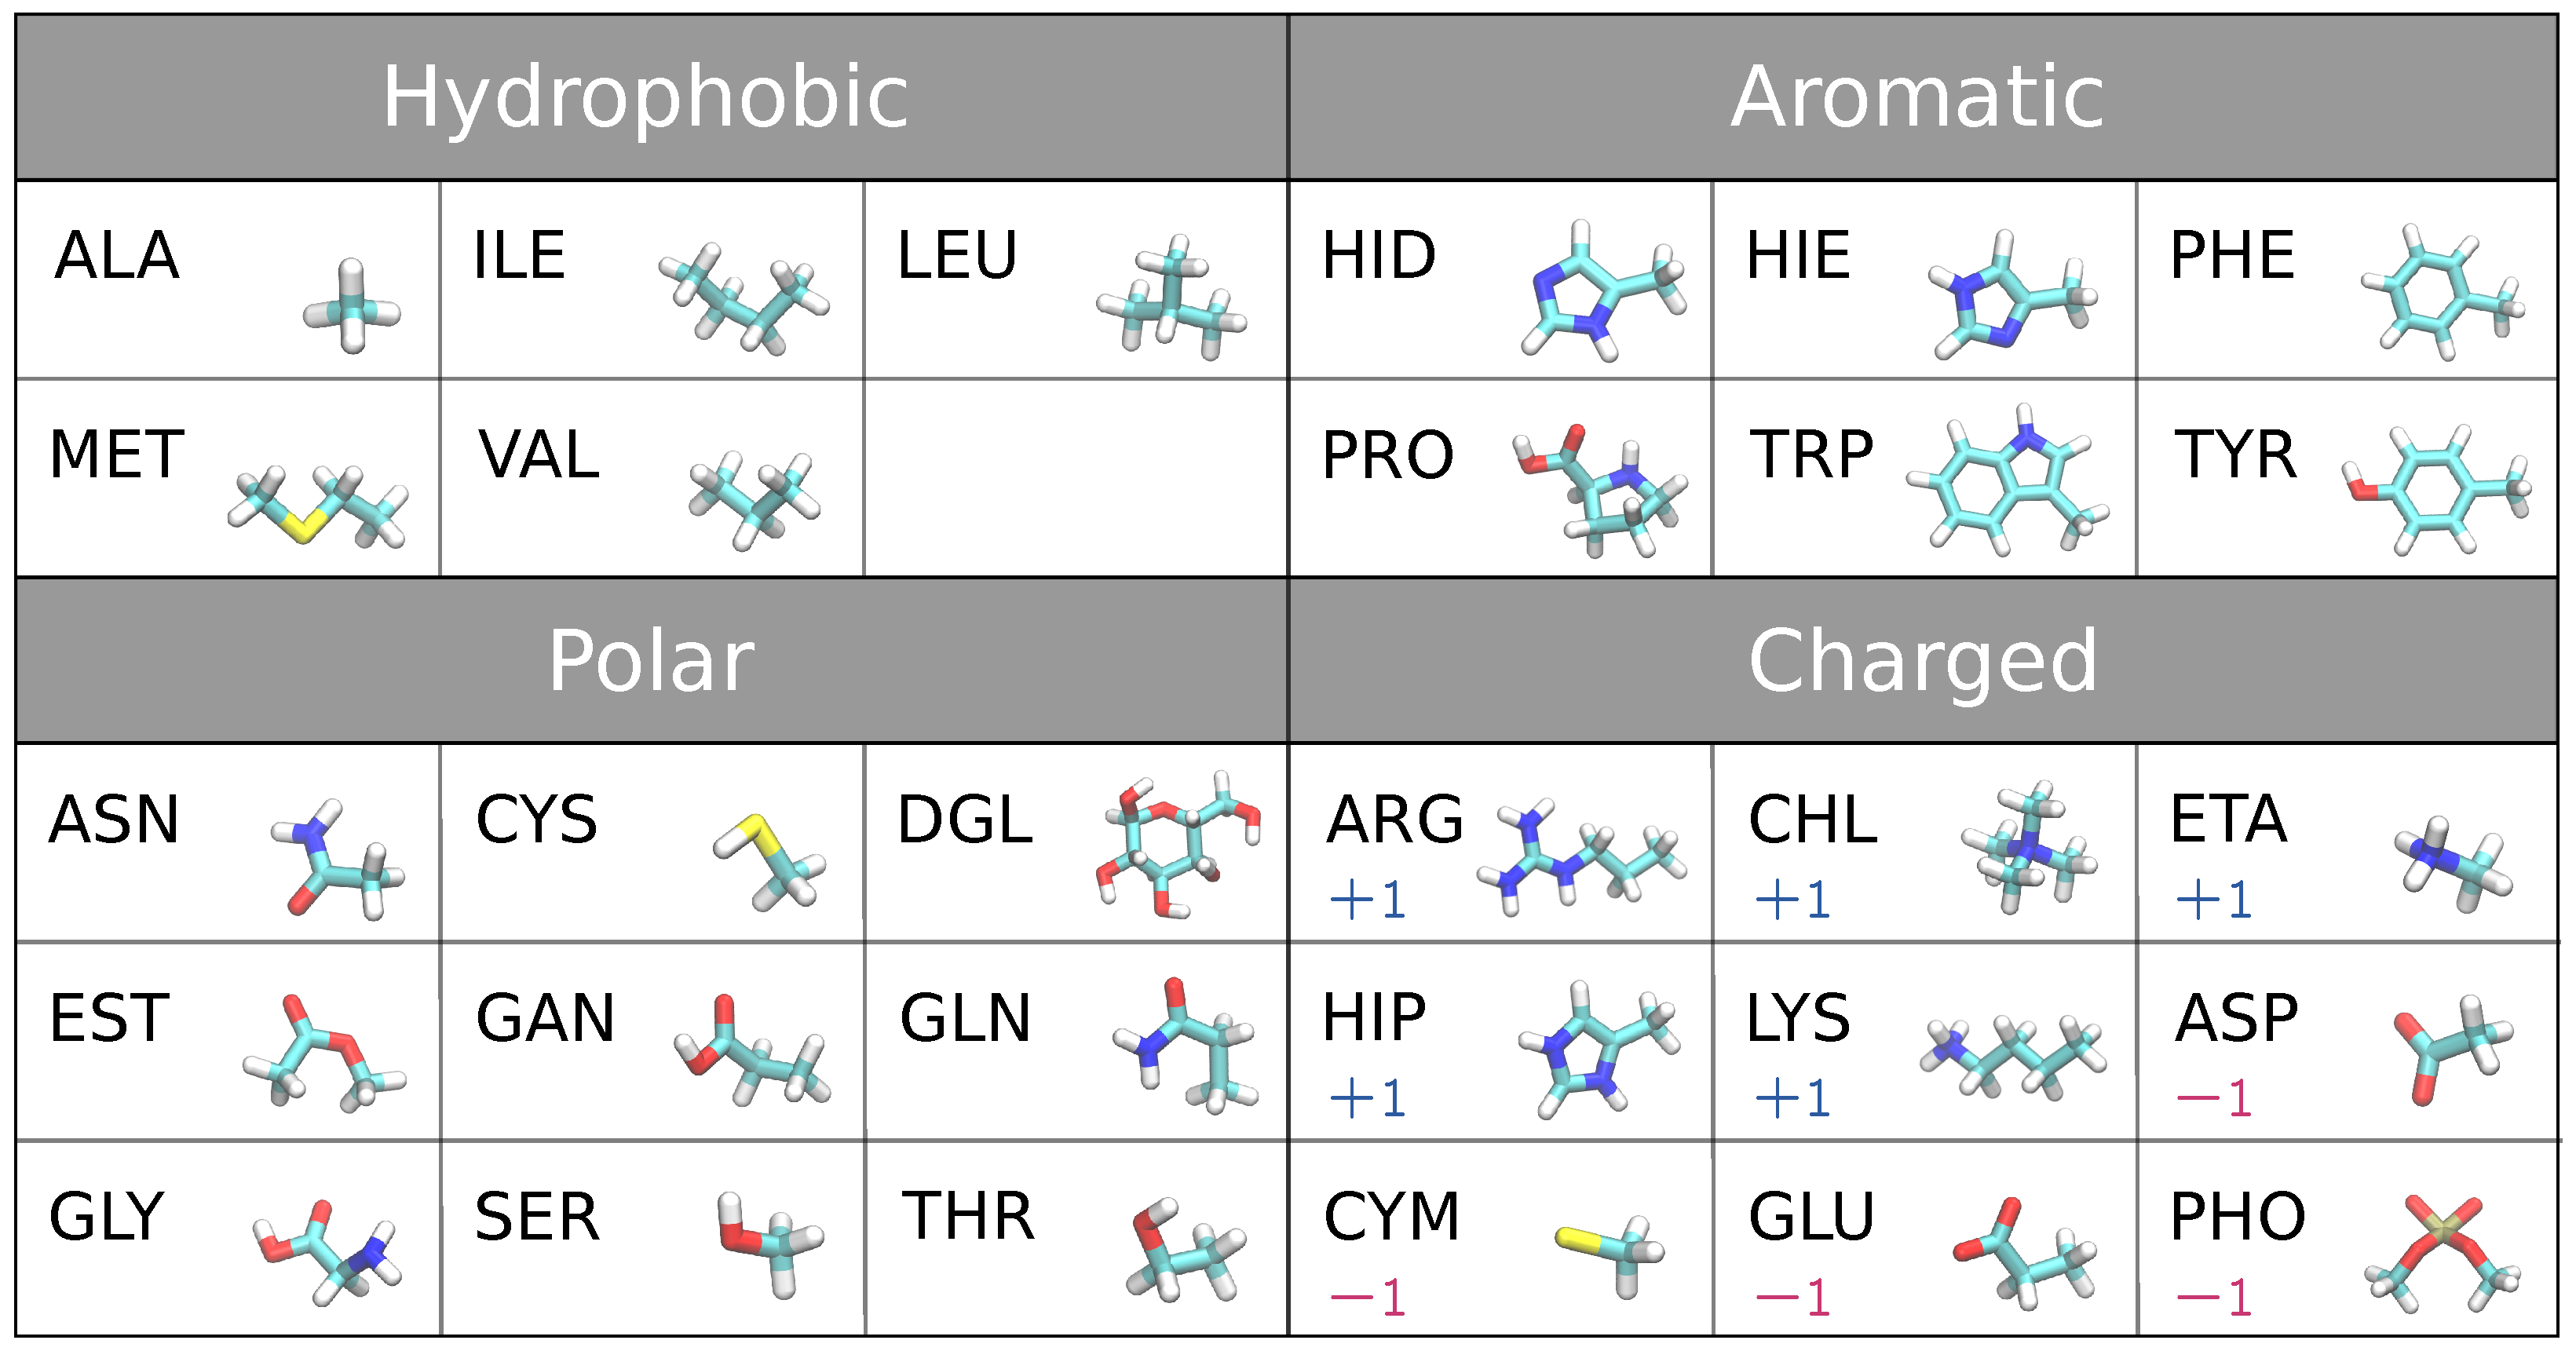
- Biomolecules
- Coating
2.2. Force Fields
2.3. Methods
2.3.1. Free Energy Calculations
2.3.2. Simulation Protocols
3. Results and Discussion
3.1. Binding Preferences of Biomolecules to Pristine ZnS Nanosurfaces
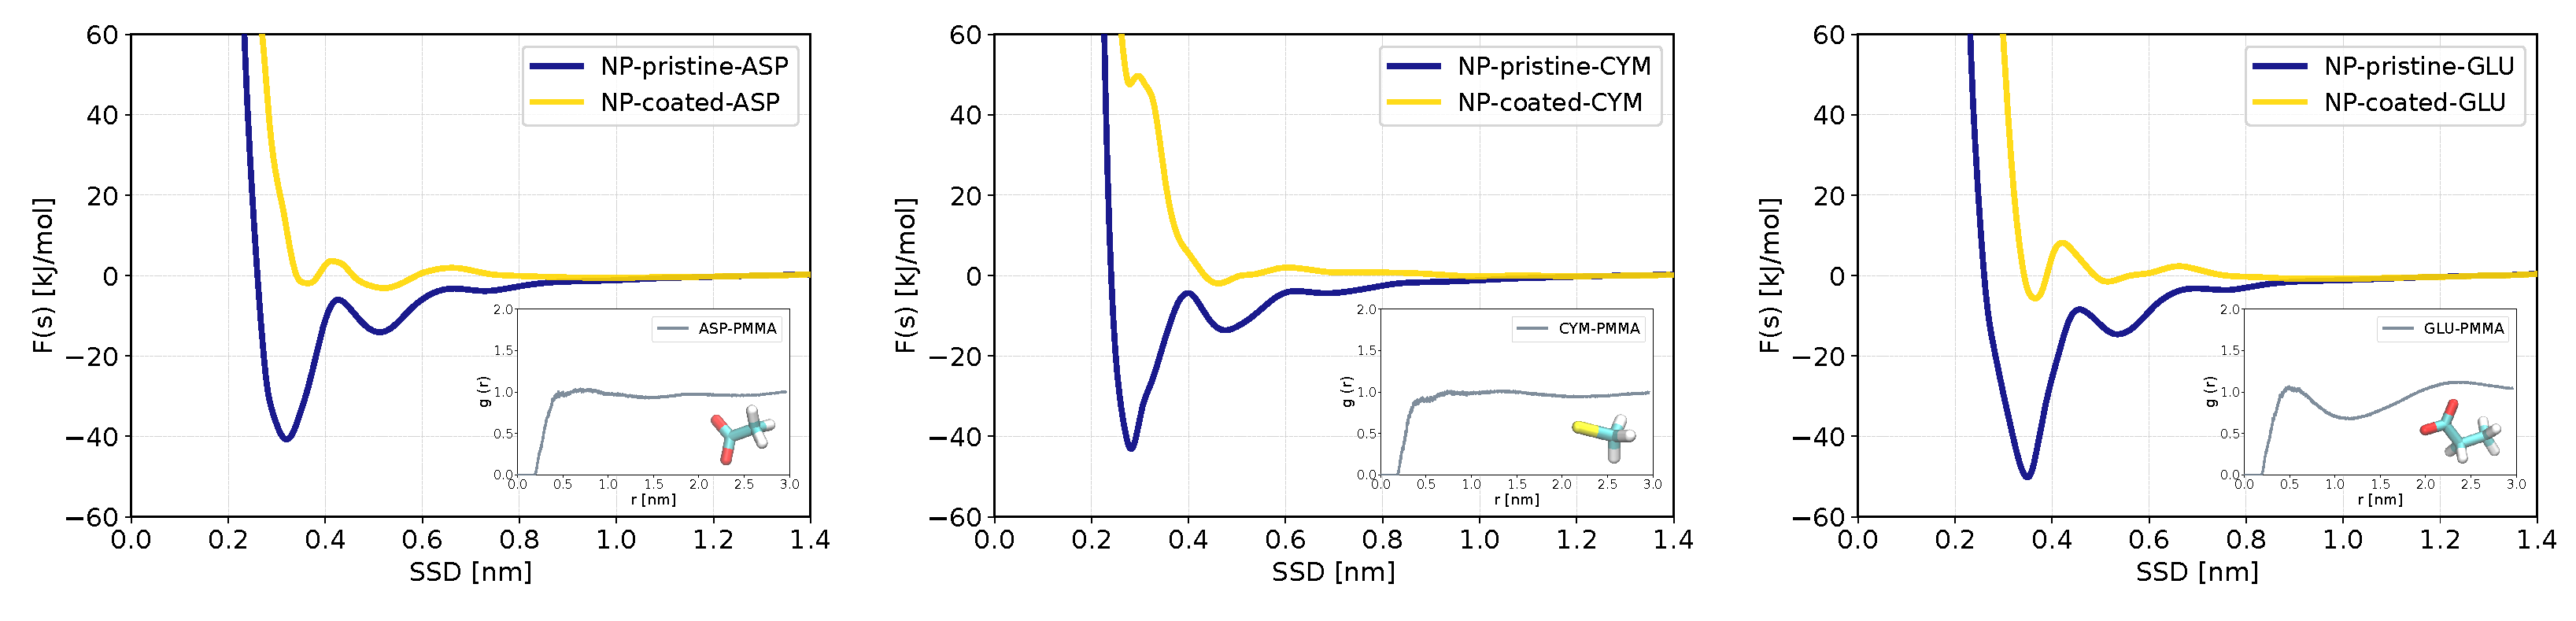
3.2. Potential of Mean Force and Binding Configurations of Biomolecules at Pristine ZnS (110) Surface and Nanoparticle
3.3. Binding Preferences of Biomolecules to PMMA-Coated ZnS (110) Slab and ZnS Nanoparticle
3.4. Influence of Solvation Shell on Binding Preferences of Biomolecules to ZnS (110) Slab and ZnS Nanoparticle
4. Conclusions
Supplementary Materials
Author Contributions
Funding
Institutional Review Board Statement
Informed Consent Statement
Data Availability Statement
Conflicts of Interest
Abbreviations
| CV | Collective variable |
| MD | Molecular dynamics |
| MetaD | Metadynamics |
| PMMA | poly-methylmethacrylate |
| PMF | Potential of mean force |
| RDF | Radial distribution function |
| QD | Quantum dot |
| SSD | Surface separation distance |
References
- Schwirn, K.; Tietjen, L.; Beer, I. Why are nanomaterials different and how can they be appropriately regulated under REACH? Environ. Sci. Eur. 2014, 26, 1–9. [Google Scholar] [CrossRef]
- Guisbiers, G.; Mejía-Rosales, S.; Leonard Deepak, F. Nanomaterial properties: Size and shape dependencies. J. Nanomater. 2012, 20, 180976. [Google Scholar] [CrossRef]
- Gatoo, M.A.; Naseem, S.; Arfat, M.Y.; Mahmood Dar, A.; Qasim, K.; Zubair, S. Physicochemical properties of nanomaterials: Implication in associated toxic manifestations. BioMed Res. Int. 2014, 2014, 498420. [Google Scholar] [CrossRef]
- Patil, S.P.; Burungale, V.V. Physical and Chemical Properties of Nanomaterials. In Nanomedicines for Breast Cancer Theranostics; Elsevier: Amsterdam, The Netherlands, 2020; pp. 17–31. [Google Scholar]
- Resch-Genger, U.; Grabolle, M.; Cavaliere-Jaricot, S.; Nitschke, R.; Nann, T. Quantum dots versus organic dyes as fluorescent labels. Nat. Methods 2008, 5, 763–775. [Google Scholar] [CrossRef]
- Torchynska, T.; Vorobiev, Y. Semiconductor II-VI quantum dots with interface states and their biomedical applications. In Advanced Biomedical Engineering; IntechOpen: Rijeka, Croatia, 2011. [Google Scholar]
- Kairdolf, B.A.; Smith, A.M.; Stokes, T.H.; Wang, M.D.; Young, A.N.; Nie, S. Semiconductor quantum dots for bioimaging and biodiagnostic applications. Ann. Rev. Analyt. Chem. 2013, 6, 143. [Google Scholar] [CrossRef] [PubMed]
- Murcia, M.J.; Shaw, D.L.; Long, E.C.; Naumann, C.A. Fluorescence correlation spectroscopy of CdSe/ZnS quantum dot optical bioimaging probes with ultra-thin biocompatible coatings. Opt. Commun. 2008, 281, 1771–1780. [Google Scholar] [CrossRef]
- Martynenko, I.; Litvin, A.; Purcell-Milton, F.; Baranov, A.; Fedorov, A.; Gun’Ko, Y. Application of semiconductor quantum dots in bioimaging and biosensing. J. Mater. Chem. B 2017, 5, 6701–6727. [Google Scholar] [CrossRef]
- Michalet, X.; Pinaud, F.; Lacoste, T.D.; Dahan, M.; Bruchez, M.P.; Alivisatos, A.P.; Weiss, S. Properties of fluorescent semiconductor nanocrystals and their application to biological labeling. Single Mol. 2001, 2, 261–276. [Google Scholar] [CrossRef]
- Hoshino, A.; Manabe, N.; Fujioka, K.; Suzuki, K.; Yasuhara, M.; Yamamoto, K. Use of fluorescent quantum dot bioconjugates for cellular imaging of immune cells, cell organelle labeling, and nanomedicine: Surface modification regulates biological function, including cytotoxicity. J. Artif. Organs 2007, 10, 149–157. [Google Scholar] [CrossRef] [PubMed]
- Zhang, C.y.; Johnson, L.W. Quantifying RNA- Peptide Interaction by Single-quantum Dot-Based Nanosensor: An Approach for Drug Screening. Analyt. Chem. 2007, 79, 7775–7781. [Google Scholar] [CrossRef] [PubMed]
- Gupta, R.; Xie, H. Nanoparticles in daily life: Applications, toxicity and regulations. J. Environ. Pathol. Toxicol. Oncol. 2018, 37, 209–230. [Google Scholar] [CrossRef]
- Egbuna, C.; Parmar, V.K.; Jeevanandam, J.; Ezzat, S.M.; Patrick-Iwuanyanwu, K.C.; Adetunji, C.O.; Khan, J.; Onyeike, E.N.; Uche, C.Z.; Akram, M.; et al. Toxicity of nanoparticles in biomedical application: Nanotoxicology. J. Toxicol. 2021, 2021, 9954443. [Google Scholar] [CrossRef]
- Chen, N.; He, Y.; Su, Y.; Li, X.; Huang, Q.; Wang, H.; Zhang, X.; Tai, R.; Fan, C. The cytotoxicity of cadmium-based quantum dots. Biomaterials 2012, 33, 1238–1244. [Google Scholar] [CrossRef]
- Ipe, B.I.; Lehnig, M.; Niemeyer, C.M. On the generation of free radical species from quantum dots. Small 2005, 1, 706–709. [Google Scholar] [CrossRef]
- Kirchner, C.; Liedl, T.; Kudera, S.; Pellegrino, T.; Muñoz Javier, A.; Gaub, H.E.; Stölzle, S.; Fertig, N.; Parak, W.J. Cytotoxicity of colloidal CdSe and CdSe/ZnS nanoparticles. Nano Lett. 2005, 5, 331–338. [Google Scholar] [CrossRef]
- Sukhanova, A.; Bozrova, S.; Sokolov, P.; Berestovoy, M.; Karaulov, A.; Nabiev, I. Dependence of nanoparticle toxicity on their physical and chemical properties. Nanoscale Res. Lett. 2018, 13, 1–21. [Google Scholar] [CrossRef] [PubMed]
- Liu, L.; Sun, M.; Li, Q.; Zhang, H.; Alvarez, P.J.; Liu, H.; Chen, W. Genotoxicity and cytotoxicity of cadmium sulfide nanomaterials to mice: Comparison between nanorods and nanodots. Env. Eng. Sci. 2014, 31, 373–380. [Google Scholar] [CrossRef] [PubMed]
- Su, Y.; He, Y.; Lu, H.; Sai, L.; Li, Q.; Li, W.; Wang, L.; Shen, P.; Huang, Q.; Fan, C. The cytotoxicity of cadmium based, aqueous phase–synthesized, quantum dots and its modulation by surface coating. Biomaterials 2009, 30, 19–25. [Google Scholar] [CrossRef]
- Baranowska-Korczyc, A.; Kościński, M.; Coy, E.L.; Grześkowiak, B.F.; Jasiurkowska-Delaporte, M.; Peplińska, B.; Jurga, S. ZnS coating for enhanced environmental stability and improved properties of ZnO thin films. RSC Adv. 2018, 8, 24411–24421. [Google Scholar] [CrossRef]
- Melinte, V.; Stroea, L.; Chibac-Scutaru, A.L. Polymer nanocomposites for photocatalytic applications. Catalysts 2019, 9, 986. [Google Scholar] [CrossRef]
- Agarwal, S.; Saxena, N.S.; Kumar, V. Study on effective thermal conductivity of zinc sulphide/poly (methyl methacrylate) nanocomposites. Appl. Nanosci. 2015, 5, 697–702. [Google Scholar] [CrossRef]
- Cheng, Y.; Lin, Z.; Lü, H.; Zhang, L.; Yang, B. ZnS nanoparticles well dispersed in ethylene glycol: Coordination control synthesis and application as nanocomposite optical coatings. Nanotechnology 2014, 25, 115601. [Google Scholar] [CrossRef] [PubMed]
- Beaune, G.; Tamang, S.; Bernardin, A.; Bayle-Guillemaud, P.; Fenel, D.; Schoehn, G.; Vinet, F.; Reiss, P.; Texier, I. Luminescence of polyethylene glycol coated CdSeTe/ZnS and InP/ZnS nanoparticles in the presence of copper cations. ChemPhysChem 2011, 12, 2247–2254. [Google Scholar] [CrossRef] [PubMed]
- Li, Y.; Zhang, S.; Gao, L.; Chen, W.; Gao, L.; Zhang, W.; Cui, J.; Yan, S. The preparation and characterization of ZnS/PMMA nanocomposites. Synth. React. Inorganic, Met.-Org. Nano-Met. Chem. 2014, 44, 942–945. [Google Scholar] [CrossRef]
- Kole, A.; Gupta, S.; Kumbhakar, P.; Ramamurthy, P. Nonlinear optical second harmonic generation in ZnS quantum dots and observation on optical properties of ZnS/PMMA nanocomposites. Opt. Commun. 2014, 313, 231–237. [Google Scholar] [CrossRef]
- Ajibade, P.A.; Mbese, J.Z. Synthesis and characterization of metal sulfides nanoparticles/poly (methyl methacrylate) nanocomposites. Int. J. Polym. Sci. 2014, 2014, 752394. [Google Scholar] [CrossRef]
- Hammani, S.; Barhoum, A.; Bechelany, M. Fabrication of PMMA/ZnO nanocomposite: Effect of high nanoparticles loading on the optical and thermal properties. J. Mater. Sci. 2018, 53, 1911–1921. [Google Scholar] [CrossRef]
- Nayak, D.; Choudhary, R.; Kandulna, R.; Mandal, G. Investigation of structural, optical and electrical performance of ZnS sensitized PMMA nanocomposite as an emissive layer for OLED application. In Proceedings of the AIP Conference Proceedings. AIP Publishing LLC, Jodhpur, India, 18–22 December 2019; Volume 2100, p. 020017. [Google Scholar]
- Wei, S.; Sampathi, J.; Guo, Z.; Anumandla, N.; Rutman, D.; Kucknoor, A.; James, L.; Wang, A. Nanoporous poly (methyl methacrylate)-quantum dots nanocomposite fibers toward biomedical applications. Polymer 2011, 52, 5817–5829. [Google Scholar] [CrossRef]
- Leigh, J.A. Use of PMMA in expansion dental implants. J. Biomed. Mater. Res. 1975, 9, 233–242. [Google Scholar] [CrossRef]
- Scarano, A.; Orsini, T.; Di Carlo, F.; Valbonetti, L.; Lorusso, F. Graphene-doped poly (methyl-methacrylate)(PMMA) implants: A micro-CT and histomorphometrical study in rabbits. Int. J. Molec. Sci. 2021, 22, 1441. [Google Scholar] [CrossRef]
- Oungeun, P.; Rojanathanes, R.; Pinsornsak, P.; Wanichwecharungruang, S. Sustaining antibiotic release from a poly (methyl methacrylate) bone-spacer. ACS Omega 2019, 4, 14860–14867. [Google Scholar] [CrossRef] [PubMed]
- Van Vugt, T.A.; Arts, J.J.; Geurts, J.A. Antibiotic-loaded polymethylmethacrylate beads and spacers in treatment of orthopedic infections and the role of biofilm formation. Front. Microbiol. 2019, 10, 1626. [Google Scholar] [CrossRef] [PubMed]
- Rouse, I.; Power, D.; Brandt, E.G.; Schneemilch, M.; Kotsis, K.; Quirke, N.; Lyubartsev, A.P.; Lobaskin, V. First principles characterisation of bio–nano interface. Phys. Chem. Chem. Phys. 2021, 23, 13473–13482. [Google Scholar] [CrossRef]
- Power, D.; Rouse, I.; Poggio, S.; Brandt, E.; Lopez, H.; Lyubartsev, A.; Lobaskin, V. A multiscale model of protein adsorption on a nanoparticle surface. Model. Simul. Mater. Sci. Eng. 2019, 27, 084003. [Google Scholar] [CrossRef]
- Afantitis, A.; Melagraki, G.; Isigonis, P.; Tsoumanis, A.; Varsoua, D.D.; Valsami-Jones, E.; Papadiamantis, A.; Ellis, L.J.A.; Sarimveis, H.; Doganis, P.; et al. NanoSolveIT Project: Driving nanoinformatics research to develop innovative and integrated tools for in silico nanosafety assessment. Comput. Struct. Biotechnol. J. 2020, 18, 583–602. [Google Scholar] [CrossRef]
- Zhu, S.; Chen, Y.; Khan, W.A.; Xu, H.; Wang, F.; Xia, M. In-Depth Study of Heavy Metal Removal by an Etidronic Acid Functionalized Layered Double Hydroxide. ACS Appl. Mater. Interfaces 2022, 14, 7450–7463. [Google Scholar] [CrossRef]
- Figueiredo, M.P.; Borrego-Sanchez, A.; Pimentel, C.; de la Luz, A.P.; Viseras, C.; Sainz-Diaz, C.I. Experimental and Theoretical Studies on the Intercalation of Naproxen into the Mg2Al and Zn2Al Layered Double Hydroxides by Ion Exchange Reaction. J. Pharmac. Sci. 2022, 111, 2369–2377. [Google Scholar] [CrossRef]
- Michaelis, M.; Delle Piane, M.; Rothenstein, D.; Perry, C.C.; Colombi Ciacchi, L. Lessons from a Challenging System: Accurate Adsorption Free Energies at the Amino Acid/ZnO Interface. J. Chem. Theory Comput. 2021, 17, 4420–4434. [Google Scholar] [CrossRef]
- Nawrocki, G.; Cieplak, M. Interactions of aqueous amino acids and proteins with the (110) surface of ZnS in molecular dynamics simulations. J. Chem. Phys. 2014, 140, 095101. [Google Scholar] [CrossRef]
- Hosseinzadeh, G.; Maghari, A.; Farniya, S.M.F.; Keihan, A.H.; Moosavi-Movahedi, A.A. Interaction of insulin with colloidal ZnS quantum dots functionalized by various surface capping agents. Mater. Sci. Eng. C 2017, 77, 836–845. [Google Scholar] [CrossRef]
- Brandt, E.G.; Lyubartsev, A.P. Molecular dynamics simulations of adsorption of amino acid side chain analogues and a titanium binding peptide on the TiO2 (100) surface. J. Phys. Chem. C 2015, 119, 18126–18139. [Google Scholar] [CrossRef]
- Xue, M.; Sampath, J.; Gebhart, R.N.; Haugen, H.J.; Lyngstadaas, S.P.; Pfaendtner, J.; Drobny, G. Studies of dynamic binding of amino acids to TiO2 nanoparticle surfaces by solution NMR and molecular dynamics simulations. Langmuir 2020, 36, 10341–10350. [Google Scholar] [CrossRef] [PubMed]
- Liu, S.; Meng, X.Y.; Perez-Aguilar, J.M.; Zhou, R. An In Silico study of TiO2 nanoparticles interaction with twenty standard amino acids in aqueous solution. Sci. Rep. 2016, 6, 1–10. [Google Scholar] [CrossRef]
- Hoefling, M.; Iori, F.; Corni, S.; Gottschalk, K.E. The conformations of amino acids on a gold (111) surface. ChemPhysChem 2010, 11, 1763–1767. [Google Scholar] [CrossRef]
- Shao, Q.; Hall, C.K. Binding preferences of amino acids for gold nanoparticles: A molecular simulation study. Langmuir 2016, 32, 7888–7896. [Google Scholar] [CrossRef] [PubMed]
- Dutta, S.; Bellucci, L.; Agostini, M.; Gagliardi, M.; Corni, S.; Cecchini, M.; Brancolini, G. Atomistic simulations of gold surface functionalization for nanoscale biosensors applications. Nanotechnology 2020, 32, 095702. [Google Scholar] [CrossRef]
- Yokoo, N.; Togashi, T.; Umetsu, M.; Tsumoto, K.; Hattori, T.; Nakanishi, T.; Ohara, S.; Takami, S.; Naka, T.; Abe, H.; et al. Direct and selective immobilization of proteins by means of an inorganic material-binding peptide: Discussion on functionalization in the elongation to material-binding peptide. J. Phys. Chem. B 2010, 114, 480–486. [Google Scholar] [CrossRef]
- Hosseinzadeh, G.; Maghari, A.; Saboury, A.A.; Moosavi-Movahedi, A.A. Unfolding of insulin at the surface of ZnO quantum dots. Int. J. Biol. Macromol. 2016, 86, 169–176. [Google Scholar] [CrossRef]
- Nawrocki, G.; Cieplak, M. Amino acids and proteins at ZnO–water interfaces in molecular dynamics simulations. Phys. Chem. Chem. Phys. 2013, 15, 13628–13636. [Google Scholar] [CrossRef]
- Bachmann, M.; Goede, K.; Beck-Sickinger, A.G.; Grundmann, M.; Irbäck, A.; Janke, W. Microscopic mechanism of specific peptide adhesion to semiconductor substrates. Angew. Chem. Int. Ed. 2010, 49, 9530–9533. [Google Scholar] [CrossRef] [PubMed]
- Whaley, S.R.; English, D.; Hu, E.L.; Barbara, P.F.; Belcher, A.M. Selection of peptides with semiconductor binding specificity for directed nanocrystal assembly. Nature 2000, 405, 665–668. [Google Scholar] [CrossRef] [PubMed]
- Namsani, S.; Nair, N.N.; Singh, J.K. Interaction potential models for bulk ZnS, ZnS nanoparticle, and ZnS nanoparticle-PMMA from first-principles. J. Comput. Chem. 2015, 36, 1176–1186. [Google Scholar] [CrossRef] [PubMed]
- Saeedimasine, M.; Brandt, E.G.; Lyubartsev, A.P. Atomistic Perspective on Biomolecular Adsorption on Functionalized Carbon Nanomaterials under Ambient Conditions. J. Phys. Chem. B 2021, 125, 416–430. [Google Scholar] [CrossRef]
- Rouse, I.; Lobaskin, V. Machine-learning based prediction of small molecule—Surface interaction potentials. Faraday Discuss. 2022; just accepted. [Google Scholar] [CrossRef]
- Wang, J.; Wolf, R.M.; Caldwell, J.W.; Kollman, P.A.; Case, D.A. Development and testing of a general amber force field. J. Comput. Chem. 2004, 25, 1157–1174. [Google Scholar] [CrossRef]
- Sousa da Silva, A.W.; Vranken, W.F. Acpype—Antechamber Python Parser Interface. BMC Res. Notes 2012, 5, 367. [Google Scholar] [CrossRef]
- Laio, A.; Parrinello, M. Escaping free-energy minima. Proc. Nat. Acad. Sci. USA 2002, 99, 12562–12566. [Google Scholar] [CrossRef]
- Abraham, M.J.; Murtola, T.; Schulz, R.; Páll, S.; Smith, J.C.; Hess, B.; Lindahl, E. GROMACS: High performance molecular simulations through multi-level parallelism from laptops to supercomputers. SoftwareX 2015, 1–2, 19–25. [Google Scholar] [CrossRef]
- Páll, S.; Abraham, M.J.; Kutzner, C.; Hess, B.; Lindahl, E. Tackling exascale software challenges in molecular dynamics simulations with GROMACS. In Proceedings of the International Conference on Exascale Applications and Software, Stockholm, Sweden, 2–3 April 2014; Springer: Berlin/Heidelberg, Germany, 2014; pp. 3–27. [Google Scholar]
- The PLUMED Consortium. Promoting transparency and reproducibility in enhanced molecular simulations. Nat. Methods 2019, 16, 670–673. [Google Scholar] [CrossRef]
- Tribello, G.A.; Bonomi, M.; Branduardi, D.; Camilloni, C.; Bussi, G. PLUMED 2: New feathers for an old bird. Comput. Phys. Commun. 2014, 185, 604–613. [Google Scholar] [CrossRef]
- Bonomi, M.; Branduardi, D.; Bussi, G.; Camilloni, C.; Provasi, D.; Raiteri, P.; Donadio, D.; Marinelli, F.; Pietrucci, F.; Broglia, R.A.; et al. PLUMED: A portable plugin for free-energy calculations with molecular dynamics. Comput. Phys. Commun. 2009, 180, 1961–1972. [Google Scholar] [CrossRef]
- Agosta, L.; Brandt, E.G.; Lyubartsev, A. Improved Sampling in Ab Initio Free Energy Calculations of Biomolecules at Solid–Liquid Interfaces: Tight-Binding Assessment of Charged Amino Acids on TiO2 Anatase (101). Computation 2020, 8, 12. [Google Scholar] [CrossRef]
- Berendsen, H.J.; Postma, J.V.; Van Gunsteren, W.F.; DiNola, A.; Haak, J.R. Molecular dynamics with coupling to an external bath. J. Chem. Phys. 1984, 81, 3684–3690. [Google Scholar] [CrossRef]
- Essmann, U.; Perera, L.; Berkowitz, M.L.; Darden, T.; Lee, H.; Pedersen, L.G. A smooth particle mesh Ewald method. J. Chem. Phys. 1995, 103, 8577–8593. [Google Scholar] [CrossRef]
- Darden, T.; York, D.; Pedersen, L. Particle mesh Ewald: An N·logN method for Ewald sums in large systems. J. Chem. Phys. 1993, 98, 10089–10092. [Google Scholar] [CrossRef]
- Gondikas, A.P.; Jang, E.K.; Hsu-Kim, H. Influence of amino acids cysteine and serine on aggregation kinetics of zinc and mercury sulfide colloids. J. Colloid Interface Sci. 2010, 347, 167–171. [Google Scholar] [CrossRef]
- Mofokeng, T.P.; Moloto, M.J.; Shumbula, P.M.; Nyamukamba, P.; Mubiayi, P.K.; Takaidza, S.; Marais, L. Antimicrobial activity of amino acid-capped zinc and copper sulphide nanoparticles. J. Nanotechnol. 2018, 2018, 4902675. [Google Scholar] [CrossRef]
- Iwasaki, T.; Maruyama, M.; Niwa, T.; Sawada, T.; Serizawa, T. Design of peptides with strong binding affinity to poly (methyl methacrylate) resin by use of molecular simulation-based materials informatics. Polym. J. 2021, 53, 1439–1449. [Google Scholar] [CrossRef]
- Agosta, L.; Brandt, E.G.; Lyubartsev, A.P. Diffusion and Reaction Pathways of Water Near Fully Hydrated TiO2 Surfaces From Ab Initio Molecular Dynamics. J. Chem. Phys. 2017, 147, 024704. [Google Scholar] [CrossRef]
- Quaranta, V.; Behler, J.; Hellström, M. Structure and dynamics of the liquid–water/zinc-oxide interface from machine learning potential simulations. J. Phys. Chem. C 2018, 123, 1293–1304. [Google Scholar] [CrossRef]
- Zangi, R.; Engberts, J.B. Physisorption of hydroxide ions from aqueous solution to a hydrophobic surface. J. Am. Chem. Soc. 2005, 127, 2272–2276. [Google Scholar] [CrossRef]
- Govind Rajan, A.; Sresht, V.; Pádua, A.A.; Strano, M.S.; Blankschtein, D. Dominance of dispersion interactions and entropy over electrostatics in determining the wettability and friction of two-dimensional MoS2 surfaces. ACS Nano 2016, 10, 9145–9155. [Google Scholar] [CrossRef]
- Leroy, F.; Müller-Plathe, F. Rationalization of the behavior of solid- liquid surface free energy of water in Cassie and Wenzel wetting states on rugged solid surfaces at the nanometer scale. Langmuir 2011, 27, 637–645. [Google Scholar] [CrossRef]
- Giovambattista, N.; Debenedetti, P.G.; Rossky, P.J. Effect of surface polarity on water contact angle and interfacial hydration structure. J. Phys. Chem. B 2007, 111, 9581–9587. [Google Scholar] [CrossRef]
- Pinaud, F.; King, D.; Moore, H.P.; Weiss, S. Bioactivation and cell targeting of semiconductor CdSe/ZnS nanocrystals with phytochelatin-related peptides. J. Am. Chem. Soc. 2004, 126, 6115–6123. [Google Scholar] [CrossRef]


| Bond potential | kb (kJ/mol) | r0 (Å) | |
| Zn–S | 92,000 | 1.6 | |
| Angular potential | (kJ/mol) | () | |
| S–Zn–S | 274.022 | 109.47 | |
| Zn–S–Zn | 274.022 | 109.47 | |
| Non-bonded | Charge (e) | σ (Å) | ε (kJ/mol) |
| Zn | 2.0 | 3.816 | 0.022 |
| S | −2.0 | 4.27 | 1.087 |
| Special LJ parameters | |||
| Zn *-O | 1.75 | 86.00 | |
| S *-O | 5.80 | 0.01 |
| Adsorbate | Code | NS-Pristine | NS-Coated | NP-Pristine | NP-Coated |
|---|---|---|---|---|---|
| SCA of alanine | ALA | 0.2 | −2.1 ± 0.6 | 0.7 | – |
| SCA of arginine | ARG | 0.1 ± 0.1 | −0.3 ± 0.2 | 0.8 | – |
| SCA of aspargine | ASN | 0.0 ± 0.1 | −0.2 ± 0.4 | 0.7 | – |
| SCA of aspartic acid | ASP | −2.9 ± 0.2 | 0.3 ± 0.2 | −30.3 ± 2.3 | −0.4 ± 0.4 |
| SCA of cysteine ion | CYM | −3.7 ± 0.7 | 0.4 ± 0.1 | −31.1 ± 7.4 | 0.2 |
| SCA of cysteine | CYS | 0.0 | −3.2 ± 0.6 | 0.6 | – |
| SCA of glutamine | GLN | 0.1 | −1.0 ± 0.4 | 0.7 ± 0.1 | – |
| SCA of glutamic acid | GLU | −2.5 ± 0.1 | −0.5 ± 0.2 | −39.1 ± 4.8 | −1.0 ± 4.6 |
| SCA of histidine | HID | 0.0 ± 0.1 | −2.8 ± 0.3 | 0.6 | – |
| SCA of histidine | HIE | 0.0 ± 0.1 | −3.0 ± 0.5 | 0.5 | – |
| SCA of histidine | HIP | 0.1 ± 0.1 | 0.2 ± 0.1 | 0.8 | – |
| SCA of isoleucine | ILE | 0.0 | −7.4 ± 0.9 | 0.7 | – |
| SCA of leucine | LEU | 0.2 | −7.7 ± 0.1 | 0.6 | – |
| SCA of lysine | LYS | 0.3 | 0.4 ± 0.1 | 0.8 | – |
| SCA of methionine | MET | 0.1 | −5.9 ± 0.7 | 0.6 | – |
| SCA of phenylalanine | PHE | 0.2 | −6.6 ± 0.7 | 0.6 | – |
| SCA of serine | SER | 0.3 | −0.4 ± 0.5 | 0.7 | – |
| SCA of threonine | THR | 0.2 | −1.3 ± 0.4 | 0.7 | – |
| SCA of tryptophan | TRP | 0.0 | −6.6 ± 0.8 | 0.5 ± 0.1 | – |
| SCA of tyrosine | TYR | 0.3 ± 0.1 | −8.7 ± 1.1 | 0.6 | – |
| SCA of valine | VAL | 0.0 | −4.7 ± 0.8 | 0.6 | – |
| SCA glutamic acid (neutral) | GAN | 0.0 ± 0.1 | −1.9 ± 0.4 | 0.5 | – |
| SCA of glycine (amino acid) | GLY | −0.8 ± 0.1 | −0.3 ± 0.1 | 0.2 | – |
| proline (amino acid) | PRO | 0.1 ± 0.1 | −2.5 ± 0.4 | 0.3 ± 0.1 | – |
| choline group of lipid | CHL | 0.0 ± 0.1 | 0.4 ± 0.1 | 0.9 | – |
| phosphate group of lipid | PHO | −1.1 ± 0.2 | 0.0 ± 0.2 | −1.5 ± 0.2 | −0.4 |
| etanolamine group of lipid | ETA | 0.2 ± 0.3 | 0.4 ± 0.1 | 1.3 ± 0.2 | – |
| ester group of lipid | EST | 0.0 | −2.6 ± 0.4 | 0.5 ± 0.1 | – |
| D-glucose | DGL | −1.7 ± 0.2 | −2.0 ± 0.5 | 0.2 ± 0.1 | – |
Disclaimer/Publisher’s Note: The statements, opinions and data contained in all publications are solely those of the individual author(s) and contributor(s) and not of MDPI and/or the editor(s). MDPI and/or the editor(s) disclaim responsibility for any injury to people or property resulting from any ideas, methods, instructions or products referred to in the content. |
© 2023 by the authors. Licensee MDPI, Basel, Switzerland. This article is an open access article distributed under the terms and conditions of the Creative Commons Attribution (CC BY) license (https://creativecommons.org/licenses/by/4.0/).
Share and Cite
Rahmani, R.; Lyubartsev, A.P. Biomolecular Adsorprion at ZnS Nanomaterials: A Molecular Dynamics Simulation Study of the Adsorption Preferences, Effects of the Surface Curvature and Coating. Nanomaterials 2023, 13, 2239. https://doi.org/10.3390/nano13152239
Rahmani R, Lyubartsev AP. Biomolecular Adsorprion at ZnS Nanomaterials: A Molecular Dynamics Simulation Study of the Adsorption Preferences, Effects of the Surface Curvature and Coating. Nanomaterials. 2023; 13(15):2239. https://doi.org/10.3390/nano13152239
Chicago/Turabian StyleRahmani, Roja, and Alexander P. Lyubartsev. 2023. "Biomolecular Adsorprion at ZnS Nanomaterials: A Molecular Dynamics Simulation Study of the Adsorption Preferences, Effects of the Surface Curvature and Coating" Nanomaterials 13, no. 15: 2239. https://doi.org/10.3390/nano13152239
APA StyleRahmani, R., & Lyubartsev, A. P. (2023). Biomolecular Adsorprion at ZnS Nanomaterials: A Molecular Dynamics Simulation Study of the Adsorption Preferences, Effects of the Surface Curvature and Coating. Nanomaterials, 13(15), 2239. https://doi.org/10.3390/nano13152239