
Understanding of the Electrochemical Behavior of Lithium at Bilayer-Patched Epitaxial Graphene/4H-SiC

 , ,
, ,  ,
,  ,
,
Abstract
1. Introduction
2. Materials and Methods
3. Results and Discussion
3.1. Quality of Bilayer-Patched Epitaxial Graphene on 4H-SiC
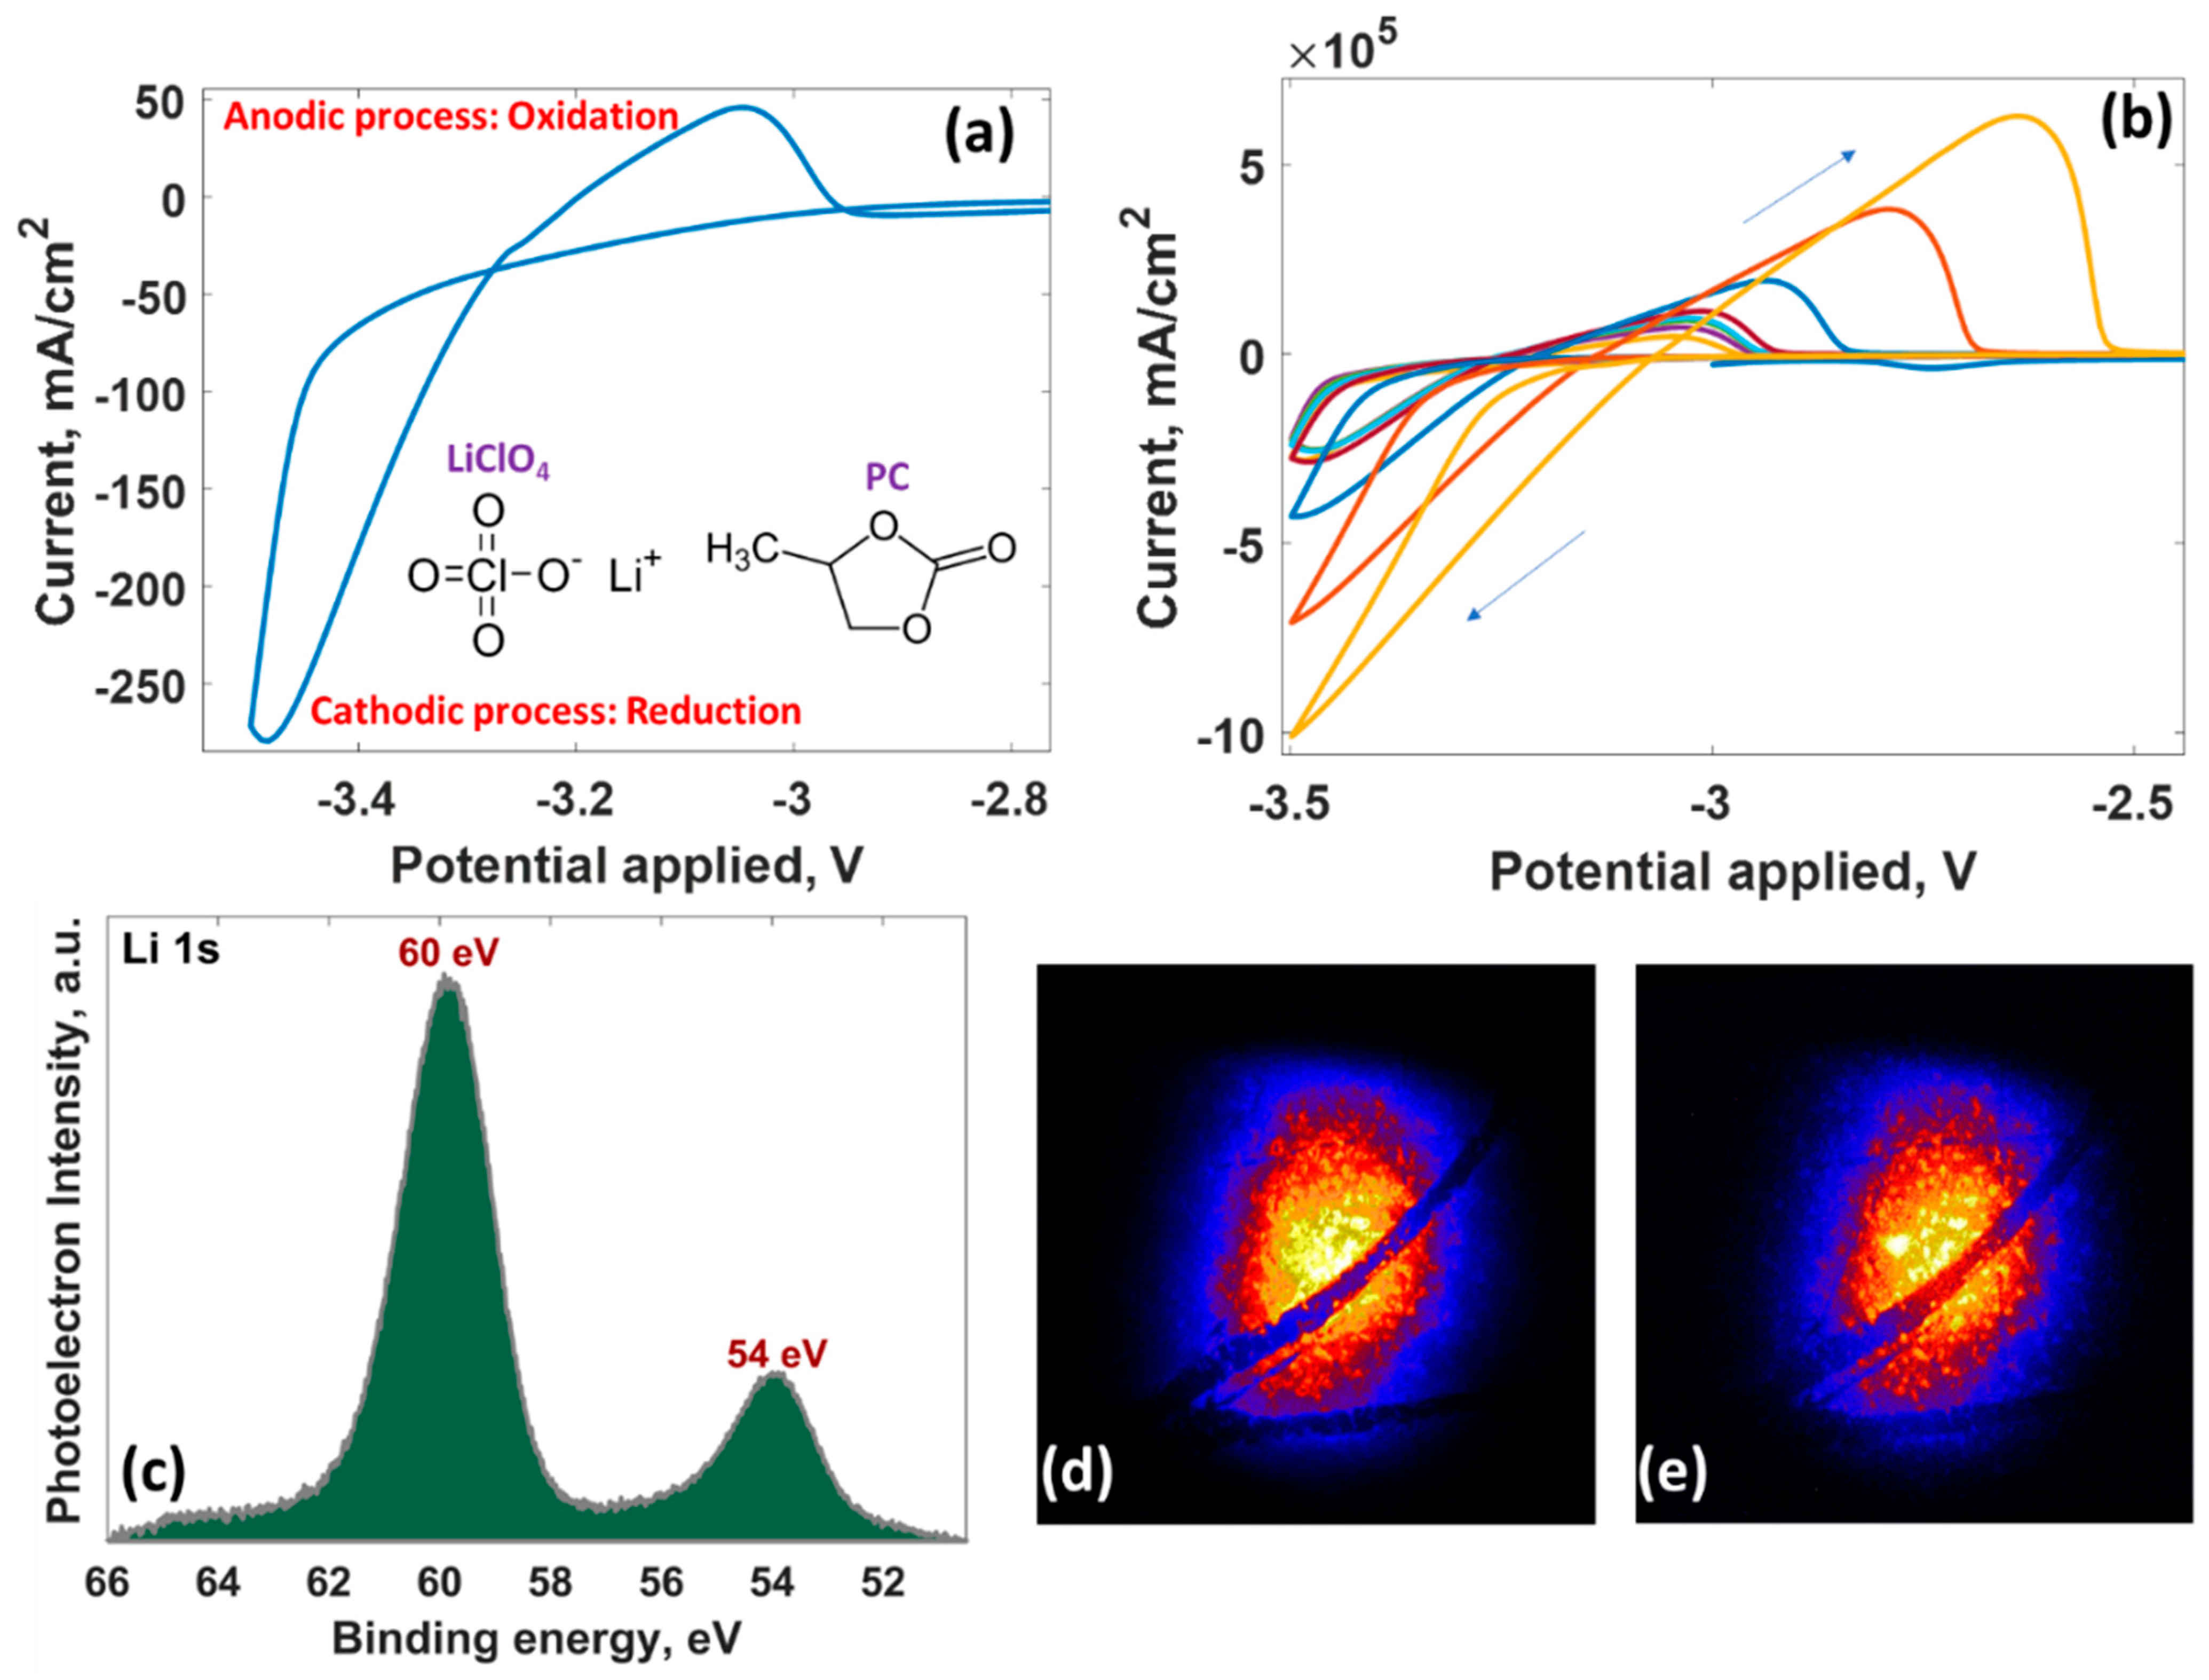
3.2. Cyclic Voltammetry Measurements
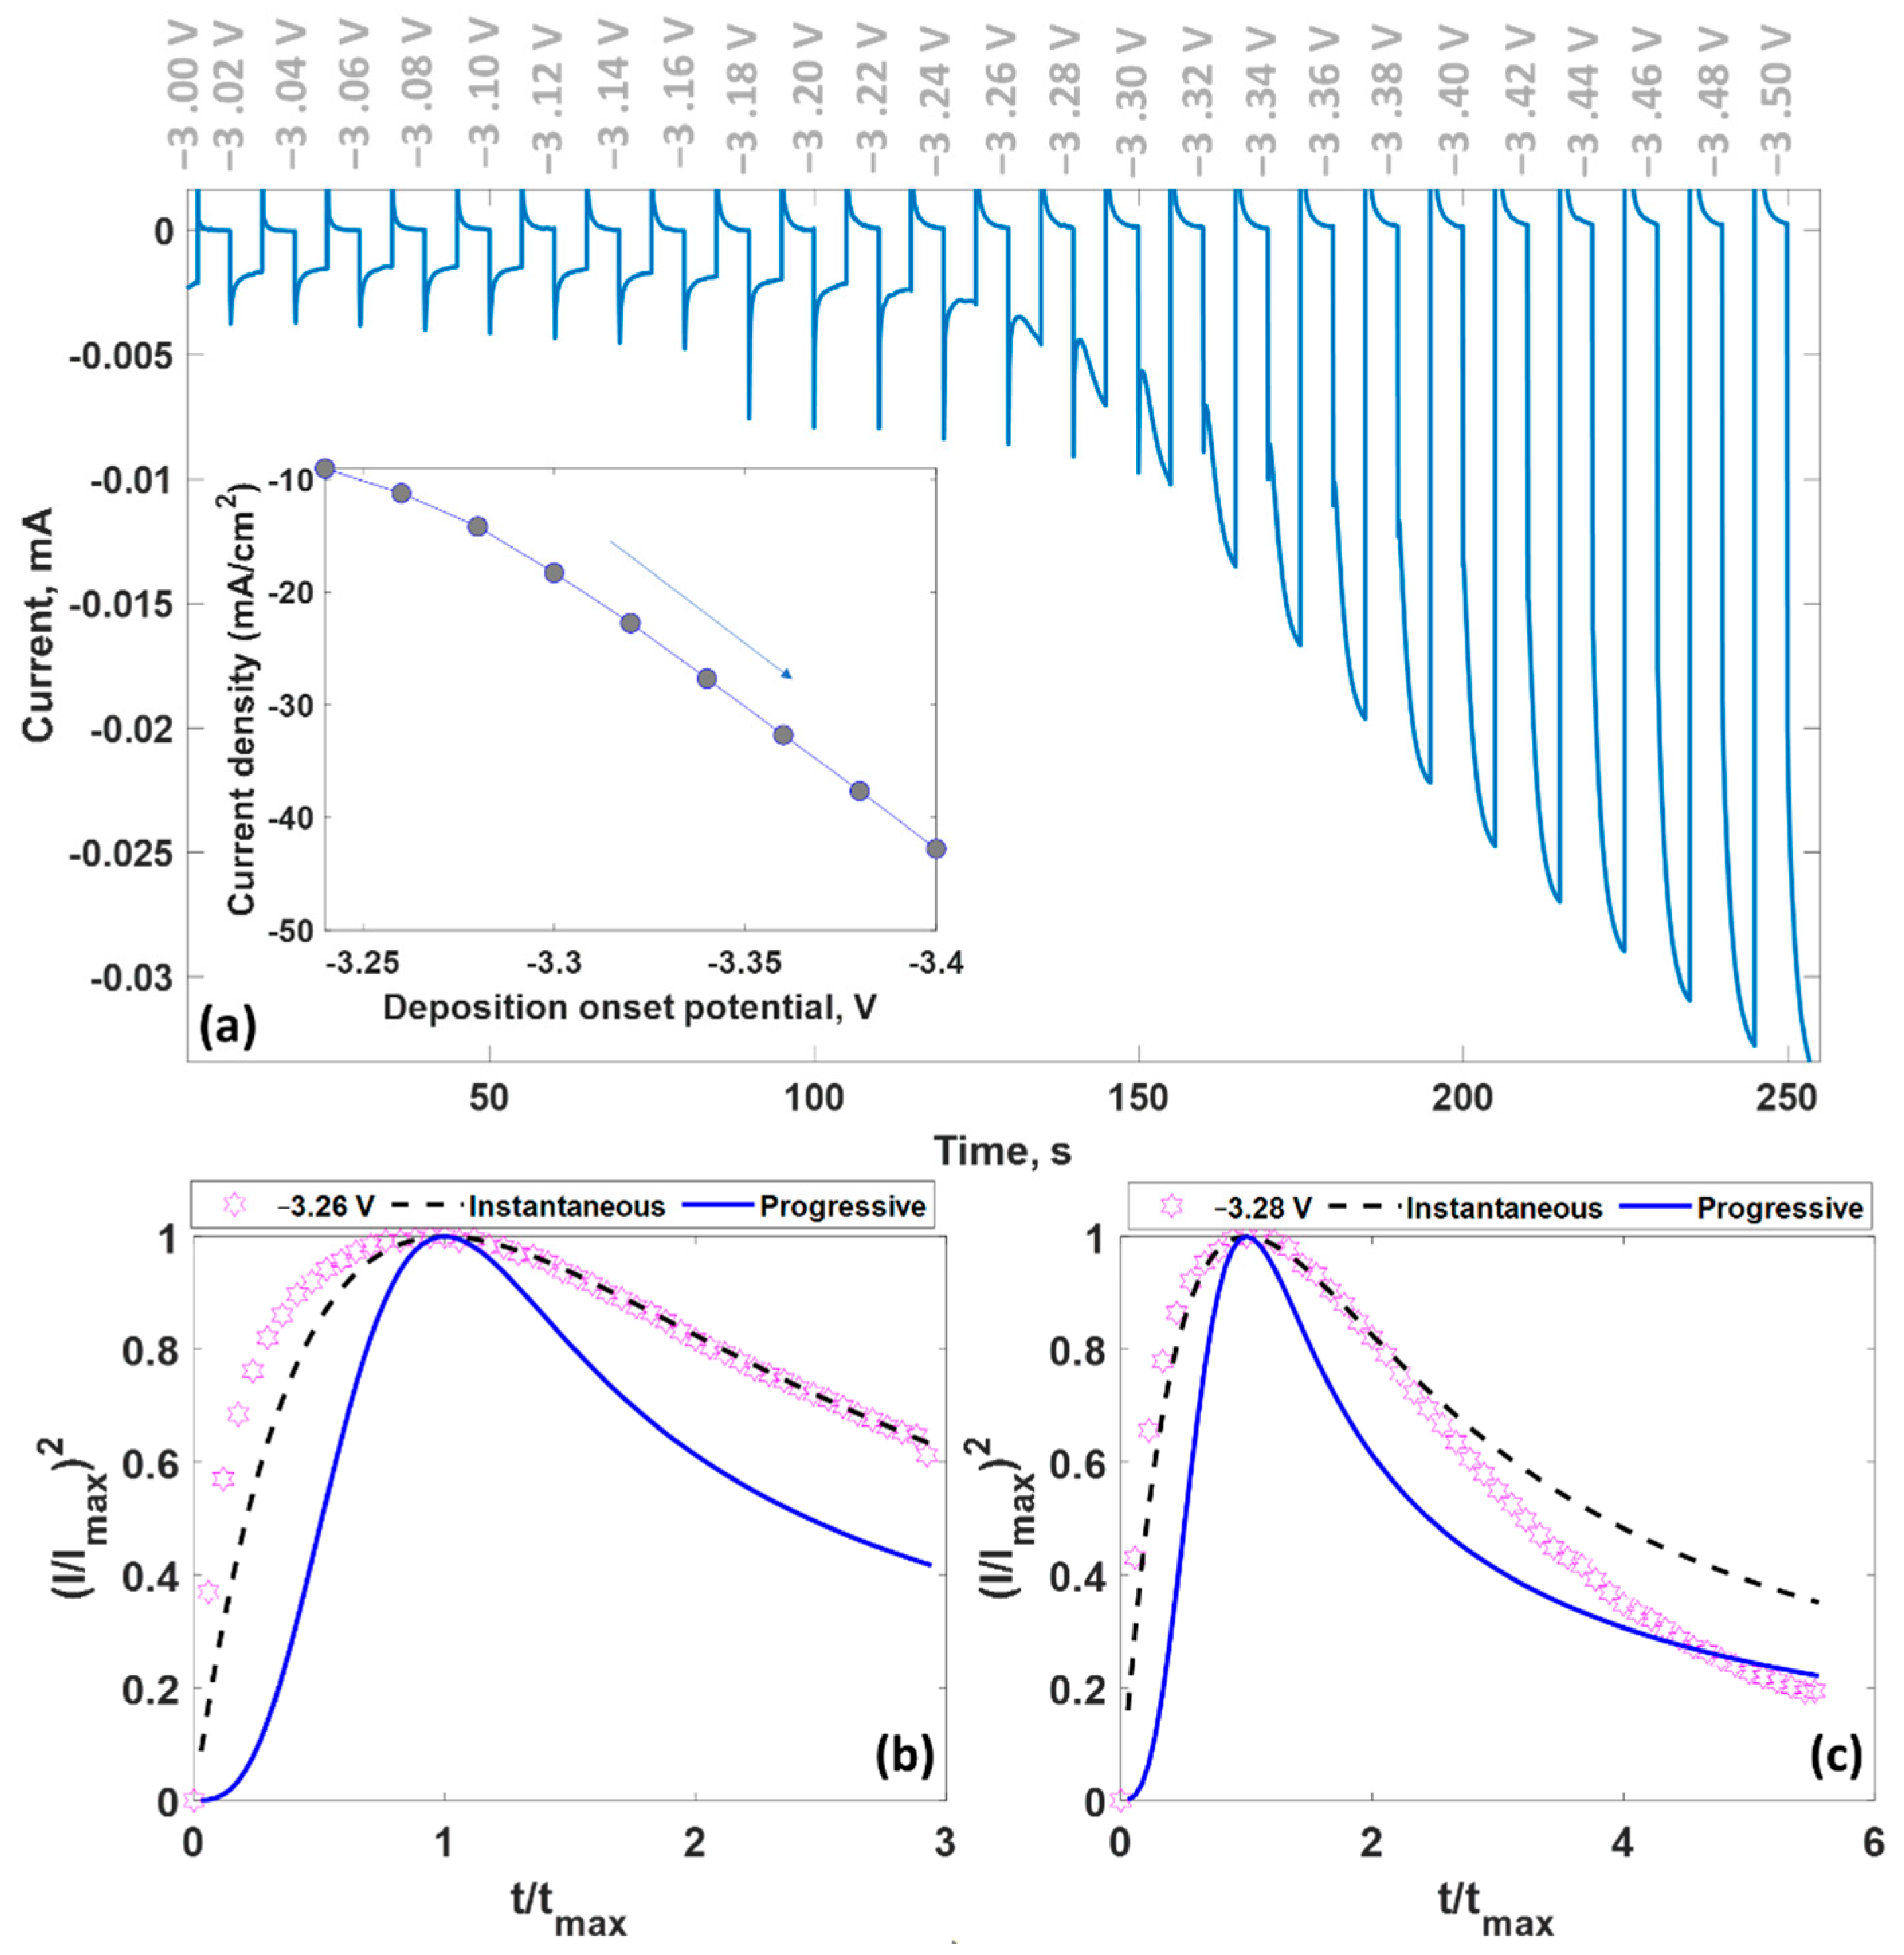
3.3. Chronoamperometry Measurements
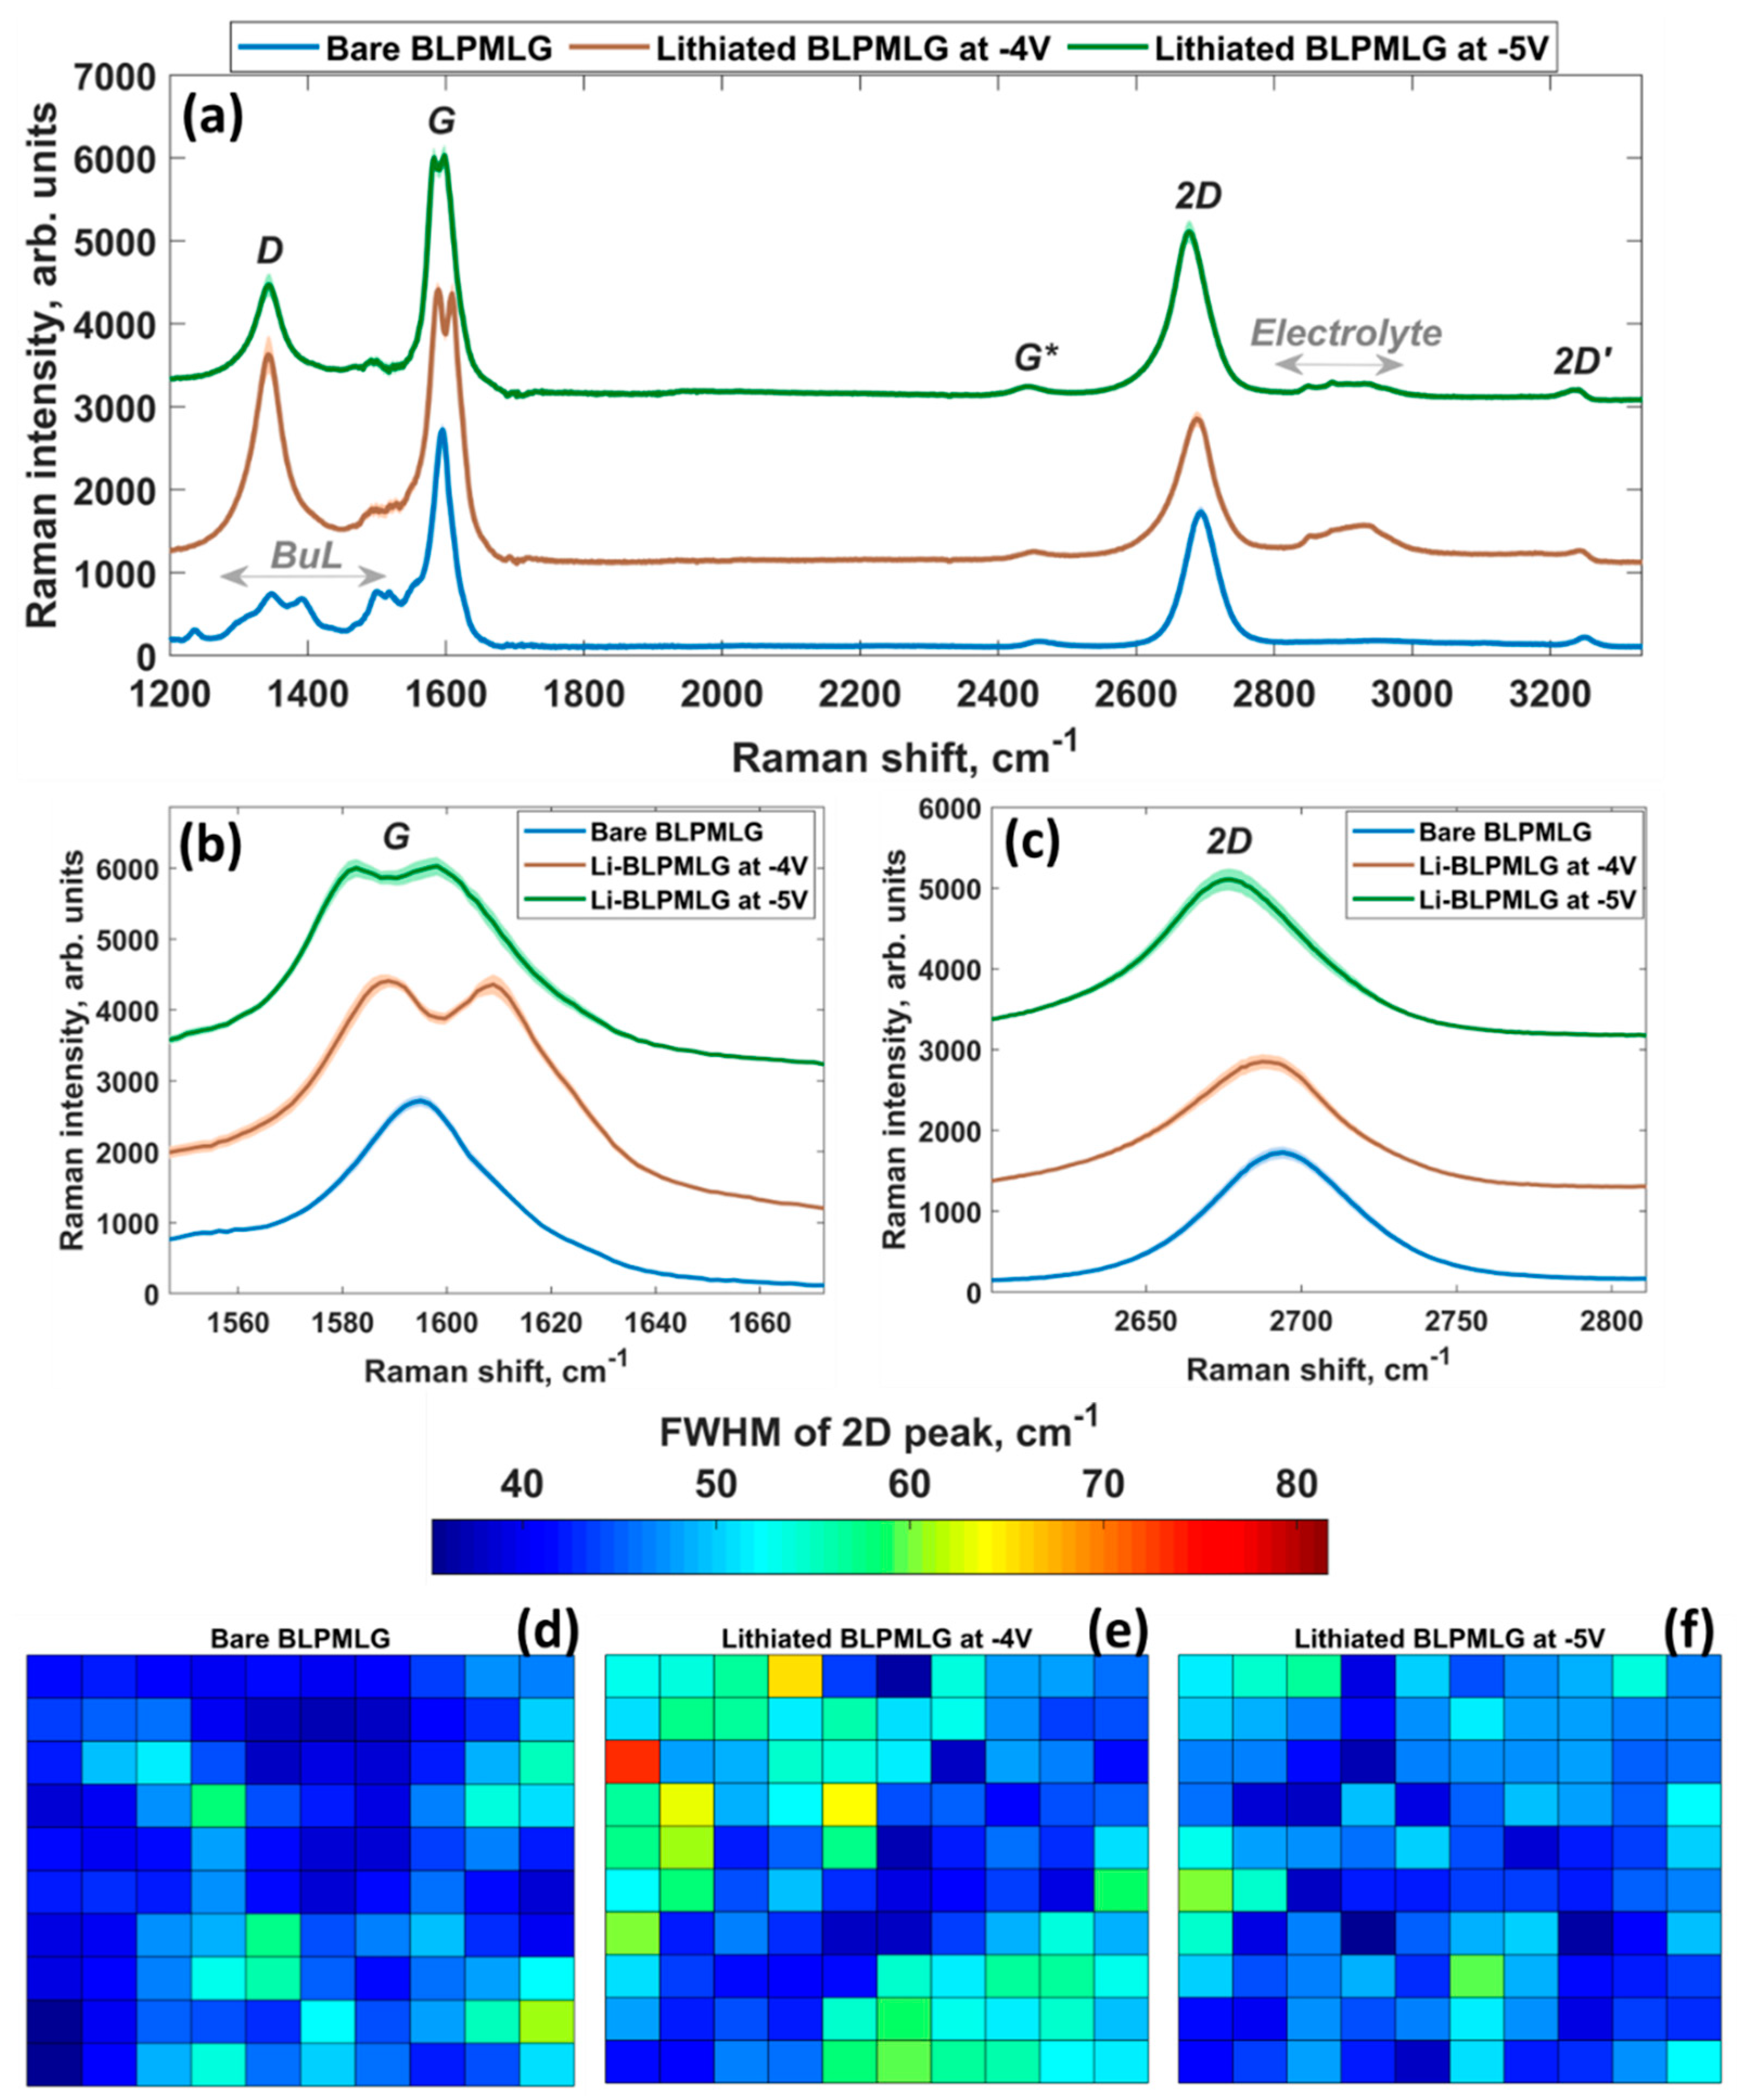
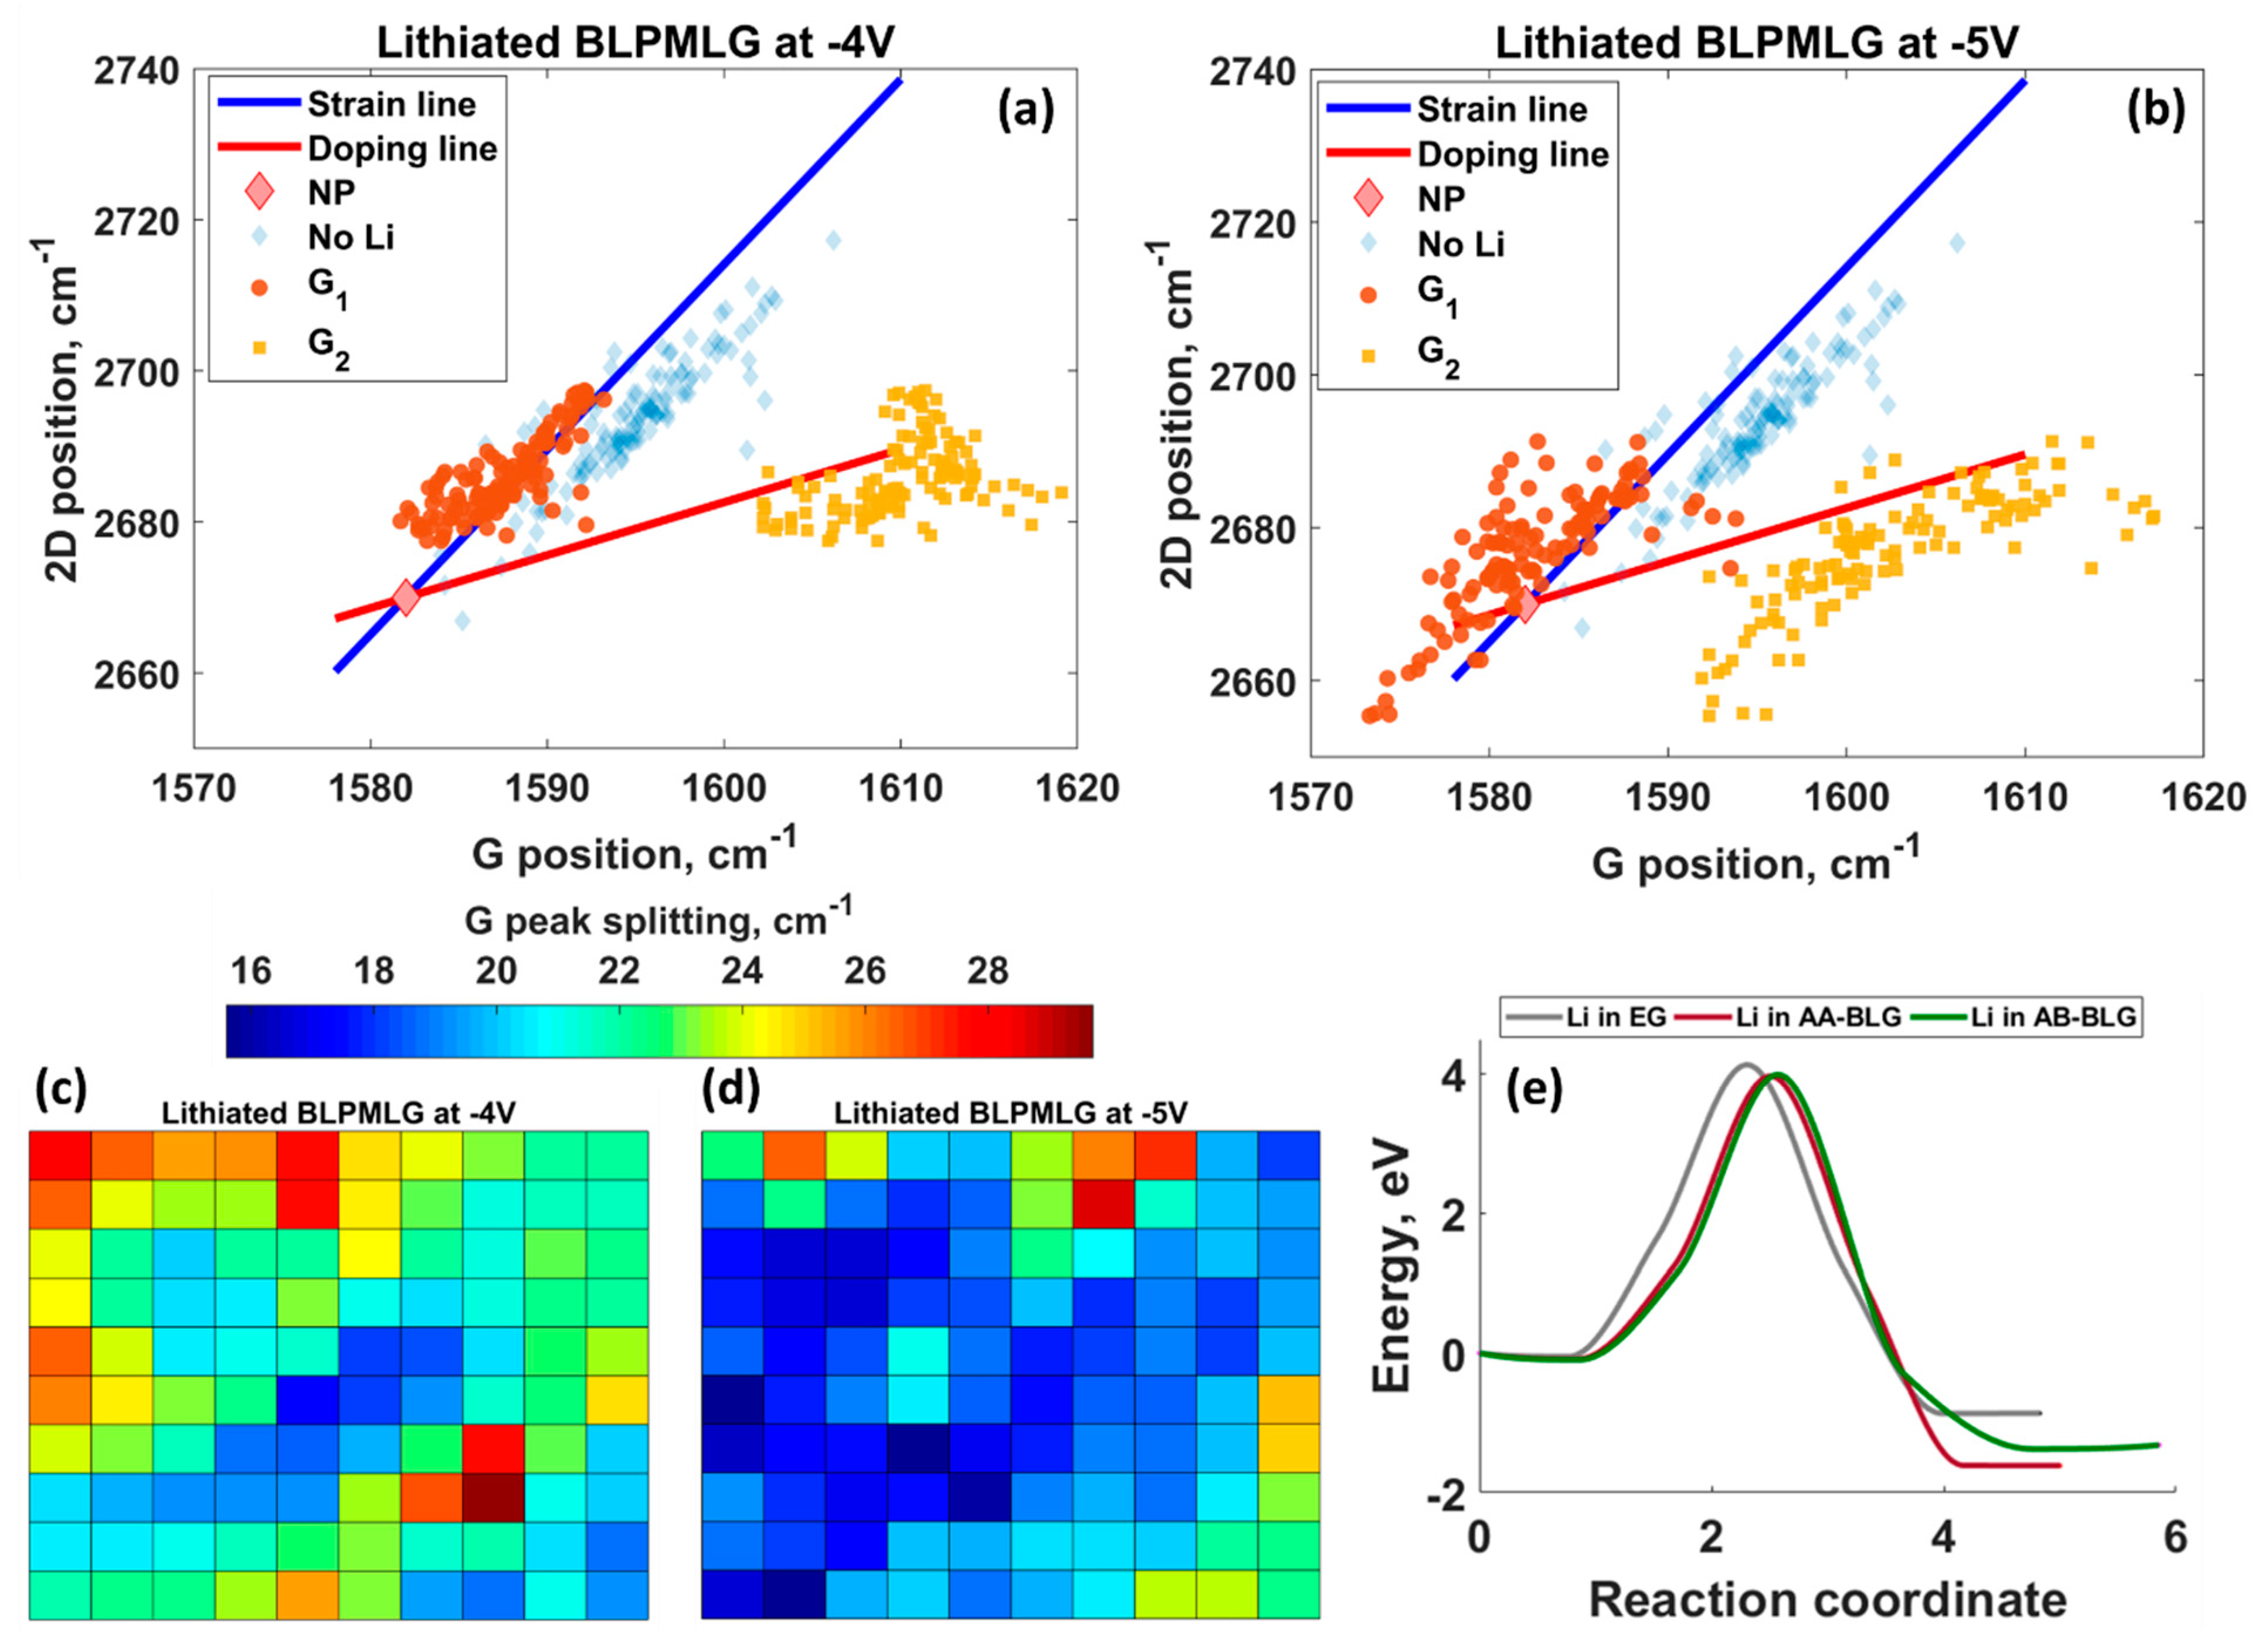
3.4. Raman Probing of Lithiated Bilayer-Patched Epitaxial Graphene
4. Conclusions
Supplementary Materials
Author Contributions
Funding
Institutional Review Board Statement
Informed Consent Statement
Data Availability Statement
Acknowledgments
Conflicts of Interest
References
- Kim, T.; Song, W.; Son, D.-Y.; Ono, L.K.; Qi, Y. Lithium-ion batteries: Outlook on present, future, and hybridized technologies. J. Mater. Chem. A 2019, 7, 2942–2964. [Google Scholar] [CrossRef]
- Liu, K.; Liu, Y.; Lin, D.; Pei, A.; Cui, Y. Materials for lithium-ion battery safety. Sci. Adv. 2018, 4, eaas9820. [Google Scholar] [CrossRef] [PubMed]
- Zhang, C. Fast charge in cold climates. Nat. Energy 2018, 3, 613. [Google Scholar] [CrossRef]
- Yang, X.-G.; Zhang, G.; Ge, S.; Wang, C.-Y. Fast charging of lithium-ion batteries at all temperatures. Proc. Natl. Acad. Sci. USA 2018, 115, 7266–7271. [Google Scholar] [CrossRef] [PubMed]
- Ma, J.; Sung, J.; Hong, J.; Chae, S.; Kim, N.; Choi, S.-H.; Nam, G.; Son, Y.; Kim, S.Y.; Ko, M.; et al. Towards maximized volumetric capacity via pore-coordinated design for large-volume-change lithium-ion battery anodes. Nat. Commun. 2019, 10, 47. [Google Scholar] [CrossRef] [PubMed]
- Available online: https://www.nobelprize.org/prizes/chemistry/2019/press-release/ (accessed on 9 October 2019).
- Li, M.; Lu, J.; Chen, Z.; Amine, K. 30 Years of Lithium-Ion Batteries. Adv. Mater. 2018, 30, 1800561. [Google Scholar] [CrossRef]
- Bin, D.; Wen, Y.; Wang, Y.; Xia, Y. The development in aqueous lithium-ion batteries. J. Energy Chem. 2018, 27, 1521–1535. [Google Scholar] [CrossRef]
- Mauger, A.; Julien, C.M.; Paolella, A.; Armand, M.; Zaghib, K. A comprehensive review of lithium salts and beyond for rechargeable batteries: Progress and perspectives. Mater. Sci. Eng. R 2018, 134, 1–21. [Google Scholar] [CrossRef]
- Zhang, X.-Q.; Zhao, C.-Z.; Huang, J.-Q.; Zhang, Q. Recent Advances in Energy Chemical Engineering of Next-Generation Lithium Batteries. Engineering 2018, 4, 831–847. [Google Scholar] [CrossRef]
- Wang, Q.; Jiang, L.; Yu, Y.; Sun, J. Progress of enhancing the safety of lithium ion battery from the electrolyte aspect. Nano Energy 2019, 55, 93–114. [Google Scholar] [CrossRef]
- Zhao, Y.; Stein, P.; Bai, Y.; Al-Siraj, M.; Yang, Y.; Xu, B.-X. A review on modeling of electro-chemo-mechanics in lithium-ion batteries. J. Power Sources 2019, 413, 259–283. [Google Scholar] [CrossRef]
- Mayyas, A.; Steward, D.; Mann, M. The case for recycling: Overview and challenges in the material supply chain for automotive li-ion batteries. Sustain. Mater. Technol. 2019, 19, e00087. [Google Scholar] [CrossRef]
- Zhu, M.; Wu, J.; Wang, Y.; Song, M.; Long, L.; Siyal, S.H.; Yang, X.; Sui, G. Recent advances in gel polymer electrolyte for high-performance lithium batteries. J. Energy Chem. 2019, 37, 126–142. [Google Scholar] [CrossRef]
- Xu, L.; Tang, S.; Cheng, Y.; Wang, K.; Liang, J.; Liu, C.; Cao, Y.-C.; Wei, F.; Mai, L. Interfaces in Solid-State Lithium Batteries. Joule 2018, 2, 1991–2015. [Google Scholar] [CrossRef]
- Goriparti, S.; Miele, E.; De Angelis, F.; Di Fabrizio, E.; Zaccaria, R.P.; Capiglia, C. Review on recent progress of nanostructured anode materials for Li-ion batteries. J. Power Sources 2014, 257, 421–443. [Google Scholar] [CrossRef]
- Huang, Q.; Loveridge, M.J.; Genieser, R.; Lain, M.J.; Bhagat, R. Electrochemical Evaluation and Phase-related Impedance Studies on Silicon–Few Layer Graphene (FLG) Composite Electrode Systems. Sci. Rep. 2018, 8, 1386. [Google Scholar] [CrossRef]
- Nan, X.; Liu, C.; Zhang, C.; Ma, W.; Wang, K.; Li, Z.; Cao, G. A new anode material for high performance lithium-ion batteries: V2(PO4)O/C. J. Mater. Chem. A 2016, 4, 9789–9796. [Google Scholar] [CrossRef]
- Yasin, G.; Arif, M.; Mehtab, T.; Lu, X.; Yu, D.; Muhammad, N.; Nazir, M.T.; Song, H. Understanding and suppression strategies toward stable Li metal anode for safe lithium batteries. Energy Storage Mater. 2020, 25, 644–678. [Google Scholar] [CrossRef]
- Yasin, G.; Arif, M.; Ma, J.; Ibraheem, S.; Yu, D.; Zhang, L.; Liu, D.; Dai, L. Self-templating synthesis of heteroatom-doped large-scalable carbon anodes for high-performance lithium-ion batteries. Inorg. Chem. Front. 2022, 9, 1058–1069. [Google Scholar] [CrossRef]
- Fei, H.; Xu, T.; Chen, Y. Novel Manganese Adipate Nanoparticles as Stable Anode Materials for Lithium-ion Batteries. Int. J. Electrochem. Sci. 2018, 13, 9574–9582. [Google Scholar] [CrossRef]
- Erickson, E.M.; Ghanty, C.; Aurbach, D. New Horizons for Conventional Lithium Ion Battery Technology. J. Phys. Chem. Lett. 2014, 5, 3313–3324. [Google Scholar] [CrossRef] [PubMed]
- Nesper, R.; von Schnering, H.G. Li21Si5, a Zintl phase as well as a Hume-Rothery phase. J. Solid State Chem. 1987, 70, 48–57. [Google Scholar] [CrossRef]
- Beaulieu, L.Y.; Hatchard, T.D.; Bonakdarpour, A.; Fleischauer, M.D.; Dahn, J.R. Reaction of Li with Alloy Thin Films Studied by In Situ AFM. J. Electrochem. Soc. 2003, 150, A1457–A1464. [Google Scholar] [CrossRef]
- Hou, L.; Zheng, H.; Cui, R.; Jiang, Y.; Li, Q.; Jiang, X.; Gao, J.; Gao, F. Silicon carbon nanohybrids with expandable space: A high-performance lithium battery anodes. Microporous Mesoporous Mater. 2019, 275, 42–49. [Google Scholar] [CrossRef]
- Yi, X.; Yu, W.-J.; Tsiamtsouri, M.A.; Zhang, F.; He, W.; Dai, Q.; Hu, S.; Tong, H.; Zheng, J.; Zhang, B.; et al. Highly conductive C-Si@G nanocomposite as a high-performance anode material for Li-ion batteries. Electrochim. Acta 2019, 295, 719–725. [Google Scholar] [CrossRef]
- Chen, Y.; Bao, L.; Du, N.; Yang, T.; Mao, Q.; Lu, X.; Lin, Y.; Ji, Z. In situ synthesis of carbon doped porous silicon nanocomposites as high-performance anodes for lithium-ion batteries. Nanotechnology 2019, 30, 035602. [Google Scholar] [CrossRef]
- Li, P.; Zhao, G.; Zheng, X.; Xu, X.; Yao, C.; Sun, W.; Dou, S.X. Recent progress on silicon-based anode materials for practical lithium-ion battery applications. Energy Storage Mater. 2018, 15, 422–446. [Google Scholar] [CrossRef]
- Yu, K.; Zhang, H.; Qi, H.; Gao, X.; Liang, J.; Liang, C. Rice Husk as the Source of Silicon/Carbon Anode Material and Stable Electrochemical Performance. ChemistrySelect 2018, 3, 5439–5444. [Google Scholar] [CrossRef]
- Zhuang, X.; Zhang, Y.; He, L.; Zhu, Y.; Tian, Q.; Guo, X.; Chen, J.; Li, L.; Wang, Q.; Song, G.; et al. Scalable synthesis of nano-Si embedded in porous C and its enhanced performance as anode of Li-ion batteries. Electrochim. Acta 2017, 249, 166–172. [Google Scholar] [CrossRef]
- Tang, J.; Dysart, A.D.; Kim, D.H.; Saraswat, R.; Shaver, G.M.; Pol, V.G. Fabrication of Carbon/Silicon Composite as Lithium-ion Anode with Enhanced Cycling Stability. Electrochim. Acta 2017, 247, 626–633. [Google Scholar] [CrossRef]
- Jiang, Y.; Chen, S.; Mu, D.; Wu, B.; Liu, Q.; Zhao, Z.; Wu, F. A three-dimensional network structure Si/C anode for Li-ion batteries. J. Mater. Sci. 2017, 52, 10950–10958. [Google Scholar] [CrossRef]
- Liu, W.-R.; Wang, J.-H.; Wu, H.-C.; Shieh, D.-T.; Yang, M.-H.; Wu, N.-L.; Chiang, P.-C.J.; Lin, J.-C. Electrochemical Characterizations on Si and C-Coated Si Particle Electrodes for Lithium-Ion Batteries. J. Electrochem. Soc. 2005, 152, A1719–A1725. [Google Scholar] [CrossRef]
- Ng, S.-H.; Wang, J.; Wexler, D.; Konstantinov, K.; Guo, Z.-P.; Liu, H.-K. Highly Reversible Lithium Storage in Spheroidal Carbon-Coated Silicon Nanocomposites as Anodes for Lithium-Ion Batteries. Angew. Chem. Int. Ed. 2006, 45, 6896–6899. [Google Scholar] [CrossRef]
- Capitani, G.C.; Di Pierro, S.; Tempesta, G. The 6H-SiC structure model: Further refinement from SCXRD data from a terrestrial moissanite. Am. Miner. 2007, 92, 403–407. [Google Scholar] [CrossRef]
- Li, H.; Yu, H.; Zhang, X.; Guo, G.; Hu, J.; Dong, A.; Yang, D. Bowl-like 3C-SiC Nanoshells Encapsulated in Hollow Graphitic Carbon Spheres for High-Rate Lithium-Ion Batteries. Chem. Mater. 2016, 28, 1179–1186. [Google Scholar] [CrossRef]
- Lipson, A.L.; Chattopadhyay, S.; Karmel, H.J.; Fister, T.T.; Emery, J.D.; Dravid, V.P.; Thackeray, M.M.; Fenter, P.A.; Bedzyk, M.J.; Hersam, M.C. Enhanced Lithiation of Doped 6H Silicon Carbide (0001) via High Temperature Vacuum Growth of Epitaxial Graphene. J. Phys. Chem. C 2012, 116, 20949–20957. [Google Scholar] [CrossRef]
- Yi, X.; Zhang, Y.; He, W.; Zhang, X.; Yang, G.; Wang, Z.; Wang, Y.; Cheng, Q. Low-Temperature Synthesis of Graphene/SiC Nanocomposite Anodes with Super-Long Cycling Stability. ChemElectroChem 2017, 4, 1320–1326. [Google Scholar] [CrossRef]
- Yang, Y.; Ren, J.-G.; Wang, X.; Chui, Y.-S.; Wu, Q.-H.; Chen, X.; Zhang, W. Graphene encapsulated and SiC reinforced silicon nanowires as an anode material for lithium ion batteries. Nanoscale 2013, 5, 8689–8694. [Google Scholar] [CrossRef]
- Chen, Z.; Zhou, M.; Cao, Y.; Ai, X.; Yang, H.; Liu, J. In Situ Generation of Few-Layer Graphene Coatings on SnO2-SiC Core-Shell Nanoparticles for High-Performance Lithium-Ion Storage. Adv. Energy Mater. 2012, 2, 95–102. [Google Scholar] [CrossRef]
- Tang, X.; Sun, Z.; Liang, J.; Zhao, J.; Cheng, H.-M.; Zhuo, S.; Li, F. A high tenacity electrode by assembly of a soft sorbent and a hard skeleton for lithium–sulfur batteries. J. Mater. Chem. A 2017, 5, 22459–22464. [Google Scholar] [CrossRef]
- Chattopadhyay, S.; Lipson, A.L.; Karmel, H.J.; Emery, J.D.; Fister, T.T.; Fenter, P.A.; Hersam, M.C.; Bedzyk, M.J. In Situ X-ray Study of the Solid Electrolyte Interphase (SEI) Formation on Graphene as a Model Li-ion Battery Anode. Chem. Mater. 2012, 24, 3038–3043. [Google Scholar] [CrossRef]
- Virojanadara, C.; Zakharov, A.A.; Watcharinyanon, S.; Yakimova, R.; Johansson, L.I. A low-energy electron microscopy and x-ray photo-emission electron microscopy study of Li intercalated into graphene on SiC(0001). New J. Phys. 2010, 12, 125015. [Google Scholar] [CrossRef]
- Fiori, S.; Murata, Y.; Veronesi, S.; Rossi, A.; Coletti, C.; Heun, S. Li-intercalated graphene on SiC(0001): An STM study. Phys. Rev. B 2017, 96, 125429. [Google Scholar] [CrossRef]
- Khademi, A.; Sajadi, E.; Dosanjh, P.; Bonn, D.A.; Folk, J.A.; Stöhr, A.; Starke, U.; Forti, S. Alkali doping of graphene: The crucial role of high-temperature annealing. Phys. Rev. B 2016, 94, 201405. [Google Scholar] [CrossRef]
- Li, Y.; Zhou, G.; Li, J.; Wu, J.; Gu, B.-L.; Duan, W. Lithium Intercalation Induced Decoupling of Epitaxial Graphene on SiC(0001): Electronic Property and Dynamic Process. J. Phys. Chem. C 2011, 115, 23992–23997. [Google Scholar] [CrossRef]
- Virojanadara, C.; Watcharinyanon, S.; Zakharov, A.A.; Johansson, L.I. Epitaxial graphene on6H-SiCand Li intercalation. Phys. Rev. B 2010, 82, 205402. [Google Scholar] [CrossRef]
- Endo, Y.; Ichinokura, S.; Akiyama, R.; Takayama, A.; Sugawara, K.; Nomura, K.; Takahashi, T.; Hasegawa, S. Weak localization in bilayer graphene with Li-intercalation/desorption. J. Phys. Condens. Matter 2018, 30, 305701. [Google Scholar] [CrossRef]
- Johansson, L.I.; Xia, C.; Virojanadara, C. Li induced effects in the core level and π-band electronic structure of graphene grown on C-face SiC. J. Vac. Sci. Technol. A 2015, 33, 061405. [Google Scholar] [CrossRef]
- Bisti, F.; Profeta, G.; Vita, H.; Donarelli, M.; Perrozzi, F.; Sheverdyaeva, P.M.; Moras, P.; Horn, K.; Ottaviano, L. Electronic and geometric structure of graphene/SiC(0001) decoupled by lithium intercalation. Phys. Rev. B 2015, 91, 245411. [Google Scholar] [CrossRef]
- Watcharinyanon, S.; Johansson, L.; Zakharov, A.; Virojanadara, C. Studies of Li intercalation of hydrogenated graphene on SiC(0001). Surf. Sci. 2012, 606, 401–406. [Google Scholar] [CrossRef]
- Virojanadara, C.; Watcharinyanon, S.; Zakharov, A.A.; Yakimova, R.; Johansson, L.I. Studies of Li Intercalation into Epitaxial Graphene on SiC(0001). Mater. Sci. Forum 2012, 717–720, 653–656. [Google Scholar] [CrossRef]
- Shtepliuk, I.; Yakimova, R. Interaction of H and Li with epitaxial graphene on SiC: A comparative analysis by first principles study. Appl. Surf. Sci. 2021, 568, 150988. [Google Scholar] [CrossRef]
- Caffrey, N.M.; Johansson, L.I.; Xia, C.; Armiento, R.; Abrikosov, I.A.; Jacobi, C. Structural and electronic properties of Li-intercalated graphene on SiC(0001). Phys. Rev. B 2016, 93, 195421. [Google Scholar] [CrossRef]
- Sugawara, K.; Takahashi, T. Electronic Structure of Graphene and Related Materials Studied by ARPES. J. Vac. Soc. Jpn. 2014, 57, 416–422. [Google Scholar] [CrossRef][Green Version]
- Li, Y. Gate-independent energy gap in noncovalently intercalated bilayer graphene on SiC(0001). Phys. Rev. B 2016, 94, 245144. [Google Scholar] [CrossRef]
- Kaloni, T.P.; Cheng, Y.; Kahaly, M.U.; Schwingenschlögl, U. Charge carrier density in Li-intercalated graphene. Chem. Phys. Lett. 2012, 534, 29–33. [Google Scholar] [CrossRef]
- Lu, D.; Xiao, Y.; Yan, X.H.; Yang, Y.R. Density functional calculations of Lithium-doped few-layer ABA-stacked graphene supported on Pt and Si-terminated SiC surfaces. Chem. Phys. Lett. 2011, 515, 263–268. [Google Scholar] [CrossRef]
- Lu, D.; Yan, X.; Xiao, Y.; Yang, Y. Charge distributions of Li-doped few-layer graphenes on C-terminated SiC surfaces. Phys. B Condens. Matter 2011, 406, 4296–4299. [Google Scholar] [CrossRef]
- Denis, P.A. Structure and chemical reactivity of lithium-doped graphene on hydrogen-saturated silicon carbide. J. Mater. Sci. 2016, 52, 1348–1356. [Google Scholar] [CrossRef]
- Deretzis, I.; La Magna, A. Role of covalent and metallic intercalation on the electronic properties of epitaxial graphene on SiC(0001). Phys. Rev. B Condens. Matter 2011, 115, 235426. [Google Scholar] [CrossRef]
- Sun, C.; Wang, Y.-J.; Gu, H.; Fan, H.; Yang, G.; Ignaszak, A.; Tang, X.; Liu, D.; Zhang, J. Interfacial coupled design of epitaxial Graphene@SiC Schottky junction with built-in electric field for high-performance anodes of lithium ion batteries. Nano Energy 2020, 77, 105092. [Google Scholar] [CrossRef]
- Ryu, M.; Lee, P.; Kim, J.; Park, H.; Chung, J. Band gap engineering for single-layer graphene by using slow Li+ions. Nanotechnology 2016, 27, 31LT03. [Google Scholar] [CrossRef] [PubMed]
- Zhao, S.Y.F.; Elbaz, G.A.; Bediako, D.K.; Yu, C.; Efetov, D.K.; Guo, Y.; Ravichandran, J.; Min, K.-A.; Hong, S.; Taniguchi, T.; et al. Controlled Electrochemical Intercalation of Graphene/h-BN van der Waals Heterostructures. Nano Lett. 2017, 18, 460–466. [Google Scholar] [CrossRef]
- Kruskopf, M.; Pierz, K.; Wundrack, S.; Stosch, R.; Dziomba, T.; Kalmbach, C.-C.; Müller, A.; Baringhaus, J.; Tegenkamp, C.; Ahlers, F.J.; et al. Epitaxial graphene on SiC: Modification of structural and electron transport properties by substrate pretreatment. J. Phys. Condens. Matter 2015, 27, 185303. [Google Scholar] [CrossRef] [PubMed]
- Yazdi, G.R.; Vasiliauskas, R.; Iakimov, T.; Zakharov, A.; Syväjärvi, M.; Yakimova, R. Growth of large area monolayer graphene on 3C-SiC and a comparison with other SiC polytypes. Carbon 2013, 57, 477–484. [Google Scholar] [CrossRef]
- Yakimova, R.; Iakimov, T.; Syväjärvi, M. Process for Growth of Graphene. U.S. Patent 9,150,417 B2, 6 October 2015. [Google Scholar]
- Ivanov, I.G.; Hassan, J.U.; Iakimov, T.; Zakharov, A.A.; Yakimova, R.; Janzen, E. Layer-number determination in graphene on SiC by reflectance mapping. Carbon 2014, 77, 492–500. [Google Scholar] [CrossRef]
- Giannazzo, F.; Sonde, S.; Raineri, V.; Rimini, E. Screening Length and Quantum Capacitance in Graphene by Scanning Probe Microscopy. Nano Lett. 2008, 9, 23–29. [Google Scholar] [CrossRef] [PubMed]
- Vagin, M.Y.; Sekretaryova, A.N.; Ivanov, I.G.; Håkansson, A.; Iakimov, T.; Syväjärvi, M.; Yakimova, R.; Lundström, I.; Eriksson, M. Monitoring of epitaxial graphene anodization. Electrochim. Acta 2017, 238, 91–98. [Google Scholar] [CrossRef]
- Shtepliuk, I.; Vagin, M.; Ivanov, I.G.; Iakimov, T.; Yazdi, G.R.; Yakimova, R. Lead (Pb) interfacing with epitaxial graphene. Phys. Chem. Chem. Phys. 2018, 20, 17105–17116. [Google Scholar] [CrossRef]
- Soler, J.M.; Artacho, E.; Gale, J.D.; García, A.; Junquera, J.; Ordejón, P.; Sánchez-Portal, D. The SIESTA method for ab initio order-Nmaterials simulation. J. Phys. Condens. Matter 2002, 14, 2745–2779. [Google Scholar] [CrossRef]
- Perdew, J.P.; Burke, K.; Ernzerhof, M. Generalized gradient approximation made simple. Phys. Rev. Lett. 1996, 77, 3865–3868. [Google Scholar] [CrossRef] [PubMed]
- Shtepliuk, I.; Giannazzo, F.; Yakimova, R. Epitaxial Graphene on 4H-SiC (0001) as a Versatile Platform for Materials Growth: Mini-Review. Appl. Sci. 2021, 11, 5784. [Google Scholar] [CrossRef]
- Shtepliuk, I.; Ivanov, I.G.; Pliatsikas, N.; Iakimov, T.; Beshkova, M.; Sarakinos, K.; Yakimova, R. Exploring the Interface Landscape of Noble Metals on Epitaxial Graphene. Phys. Status Solidi A 2021, 218, 2000673. [Google Scholar] [CrossRef]
- Shtepliuk, I.; Ivanov, I.G.; Pliatsikas, N.; Iakimov, T.; Lara-Avila, S.; Kim, K.H.; Ben Sedrine, N.; Kubatkin, S.E.; Sarakinos, K.; Yakimova, R. Clustering and Morphology Evolution of Gold on Nanostructured Surfaces of Silicon Carbide: Implications for Catalysis and Sensing. ACS Appl. Nano Mater. 2021, 4, 1282–1293. [Google Scholar] [CrossRef]
- Available online: https://departments.icmab.es/leem/siesta/Pseudopotentials/ (accessed on 20 January 2017).
- Minamitani, E.; Arafune, R.; Frederiksen, T.; Suzuki, T.; Shahed, S.M.F.; Kobayashi, T.; Endo, N.; Fukidome, H.; Watanabe, S.; Komeda, T. Atomic-scale characterization of the interfacial phonon in graphene/SiC. Phys. Rev. B 2017, 96, 155431. [Google Scholar] [CrossRef]
- Varchon, F.; Feng, R.; Hass, J.; Li, X.; Nguyen, B.N.; Naud, C.; Mallet, P.; Veuillen, J.-Y.; Berger, C.; Conrad, E.H.; et al. Electronic Structure of Epitaxial Graphene Layers on SiC: Effect of the Substrate. Phys. Rev. Lett. 2007, 99, 126805. [Google Scholar] [CrossRef]
- Mattausch, A.; Pankratov, O. Density functional study of graphene overlayers on SiC. Phys. Status Solidi B 2008, 245, 1425–1435. [Google Scholar] [CrossRef]
- Available online: https://docs.siesta-project.org/projects/siesta/tutorials/neb/ (accessed on 1 July 2021).
- Zhan, C.; Neal, J.; Wu, J.; Jiang, D.-E. Quantum Effects on the Capacitance of Graphene-Based Electrodes. J. Phys. Chem. C 2015, 119, 22297–22303. [Google Scholar] [CrossRef]
- Liu, Y.; Wang, Y.M.; Yakobson, B.I.; Wood, B.C. Assessing Carbon-Based Anodes for Lithium-Ion Batteries: A Universal Description of Charge-Transfer Binding. Phys. Rev. Lett. 2014, 113, 028304. [Google Scholar] [CrossRef]
- Song, W.; Scholtis, E.S.; Sherrell, P.C.; Tsang, D.K.H.; Ngiam, J.; Lischner, J.; Fearn, S.; Bemmer, V.; Mattevi, C.; Klein, N.; et al. Electronic structure influences on the formation of the solid electrolyte interphase. Energy Environ. Sci. 2020, 13, 4977–4989. [Google Scholar] [CrossRef]
- Lee, D.S.; Riedl, C.; Krauss, B.; von Klitzing, K.; Starke, U.; Smet, J.H. Raman Spectra of Epitaxial Graphene on SiC and of Epitaxial Graphene Transferred to SiO2. Nano Lett. 2008, 8, 4320–4325. [Google Scholar] [CrossRef] [PubMed]
- Hao, Y.; Wang, Y.; Wang, L.; Ni, Z.; Wang, Z.; Wang, R.; Koo, C.K.; Shen, Z.; Thong, J.T.L. Probing layer number and stacking order of few-layer graphene by Raman spectroscopy. Small 2010, 6, 195–200. [Google Scholar] [CrossRef] [PubMed]
- Wood, K.N.; Teeter, G. XPS on Li-Battery-Related Compounds: Analysis of Inorganic SEI Phases and a Methodology for Charge Correction. ACS Appl. Energy Mater. 2018, 1, 4493–4504. [Google Scholar] [CrossRef]
- Scharifker, B.; Hills, G. Theoretical and experimental studies of multiple nucleation. Electrochim. Acta 1983, 28, 879–889. [Google Scholar] [CrossRef]
- Shtepliuk, I.; Vagin, M.; Yakimova, R. Electrochemical Deposition of Copper on Epitaxial Graphene. Appl. Sci. 2020, 10, 1405. [Google Scholar] [CrossRef]
- Shtepliuk, I.; Vagin, M.; Yakimova, R. Insights into the Electrochemical Behavior of Mercury on Graphene/SiC Electrodes. C J. Carbon Res. 2019, 5, 51. [Google Scholar] [CrossRef]
- Ziegler, J.C.; Wielgosz, R.I.; Kolb, D.M. Pb deposition on n-Si(111) electrodes. Electrochim. Acta 1999, 45, 827–833. [Google Scholar] [CrossRef]
- Persson, K.; Sethuraman, V.A.; Hardwick, L.J.; Hinuma, Y.; Meng, Y.S.; van der Ven, A.; Srinivasan, V.; Kostecki, R.; Ceder, G. Lithium Diffusion in Graphitic Carbon. J. Phys. Chem. Lett. 2010, 1, 1176–1180. [Google Scholar] [CrossRef]
- He, J.; Gu, Y.; Wang, W.; Wang, J.; Chen, Z.; He, H.; Wu, Q.; Yan, J.; Mao, B. Structures of Solid-Electrolyte Interphases and Impacts on Initial-Stage Lithium Deposition in Pyrrolidinium-Based Ionic Liquids. ChemElectroChem 2020, 8, 62–69. [Google Scholar] [CrossRef]
- Norimatsu, W.; Kusunoki, M. Structural features of epitaxial graphene on SiC {0 0 0 1} surfaces. J. Phys. D Appl. Phys. 2014, 47, 094017. [Google Scholar] [CrossRef]
- Krause, A.; Tkacheva, O.; Omar, A.; Langklotz, U.; Giebeler, L.; Dörfler, S.; Fauth, F.; Mikolajick, T.; Weber, W.M. In Situ Raman Spectroscopy on Silicon Nanowire Anodes Integrated in Lithium Ion Batteries. J. Electrochem. Soc. 2019, 166, A5378–A5385. [Google Scholar] [CrossRef]
- Luo, D.; Zheng, L.; Zhang, Z.; Li, M.; Chen, Z.; Cui, R.; Shen, Y.; Li, G.; Feng, R.; Zhang, S.; et al. Constructing multifunctional solid electrolyte interface via in-situ polymerization for dendrite-free and low N/P ratio lithium metal batteries. Nat. Commun. 2021, 12, 186. [Google Scholar] [CrossRef] [PubMed]
- Bruna, M.; Borini, S. Observation of RamanG-band splitting in top-doped few-layer graphene. Phys. Rev. B 2010, 81, 125421. [Google Scholar] [CrossRef]
- Lin, S.S.; Chen, B.G.; Pan, C.T.; Hu, S.; Tian, P.; Tong, L.M. Unintentional doping induced splitting of G peak in bilayer graphene. Appl. Phys. Lett. 2011, 99, 233110. [Google Scholar] [CrossRef]
- Kim, N.; Kim, K.S.; Jung, N.; Brus, L.; Kim, P. Synthesis and Electrical Characterization of Magnetic Bilayer Graphene Intercalate. Nano Lett. 2011, 11, 860–865. [Google Scholar] [CrossRef]


| Potential, V | Time, s | Maximum Current Density, A/cm2 | Mechanism | Diffusion Coefficient, ×10−6 cm2∙s−1 | Nuclei Number Density, ×107 cm−2 |
|---|---|---|---|---|---|
| −3.24 | 2.6 | −0.0090 | instantaneous | 0.5595 | 0.0674 |
| −3.26 | 1.7 | −0.0112 | instantaneous | 0.5651 | 0.1021 |
| −3.28 | 0.9 | −0.0142 | instantaneous | 0.4782 | 0.2279 |
| −3.3 | 0.6 | −0.0183 | instantaneous | 0.5294 | 0.3088 |
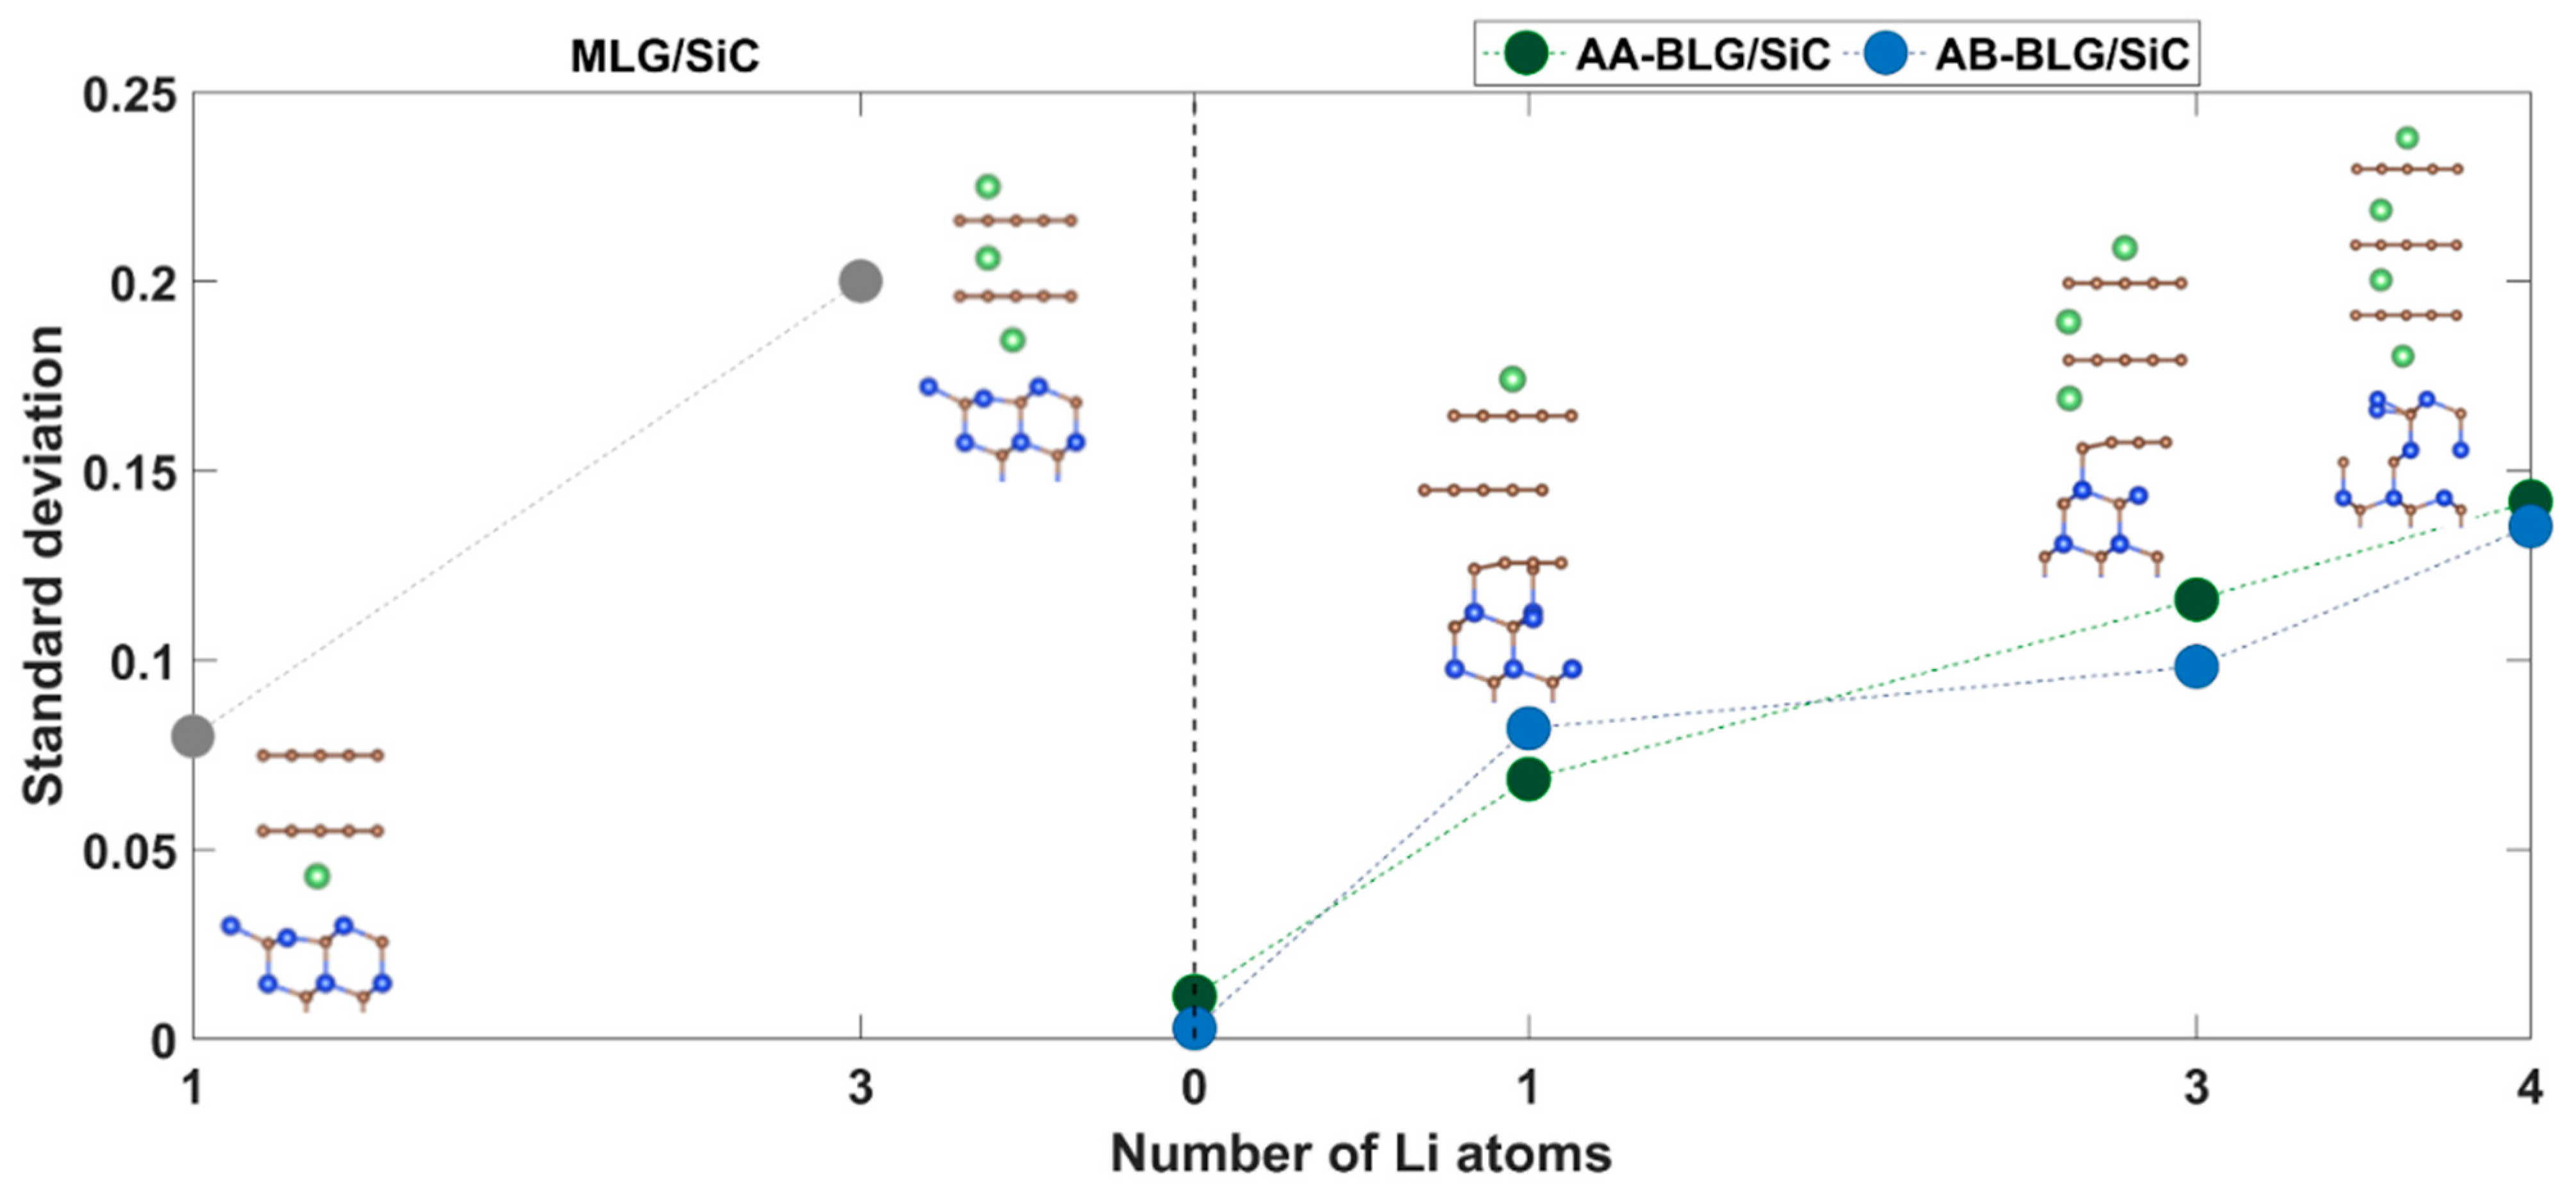
| Electrode | Adsorption Energy, eV | Adsorption Height, Å | Charge on Lithium, e− | ||
|---|---|---|---|---|---|
| Uncorrected | BSSE-Corrected | Hirshfeld | Voronoi | ||
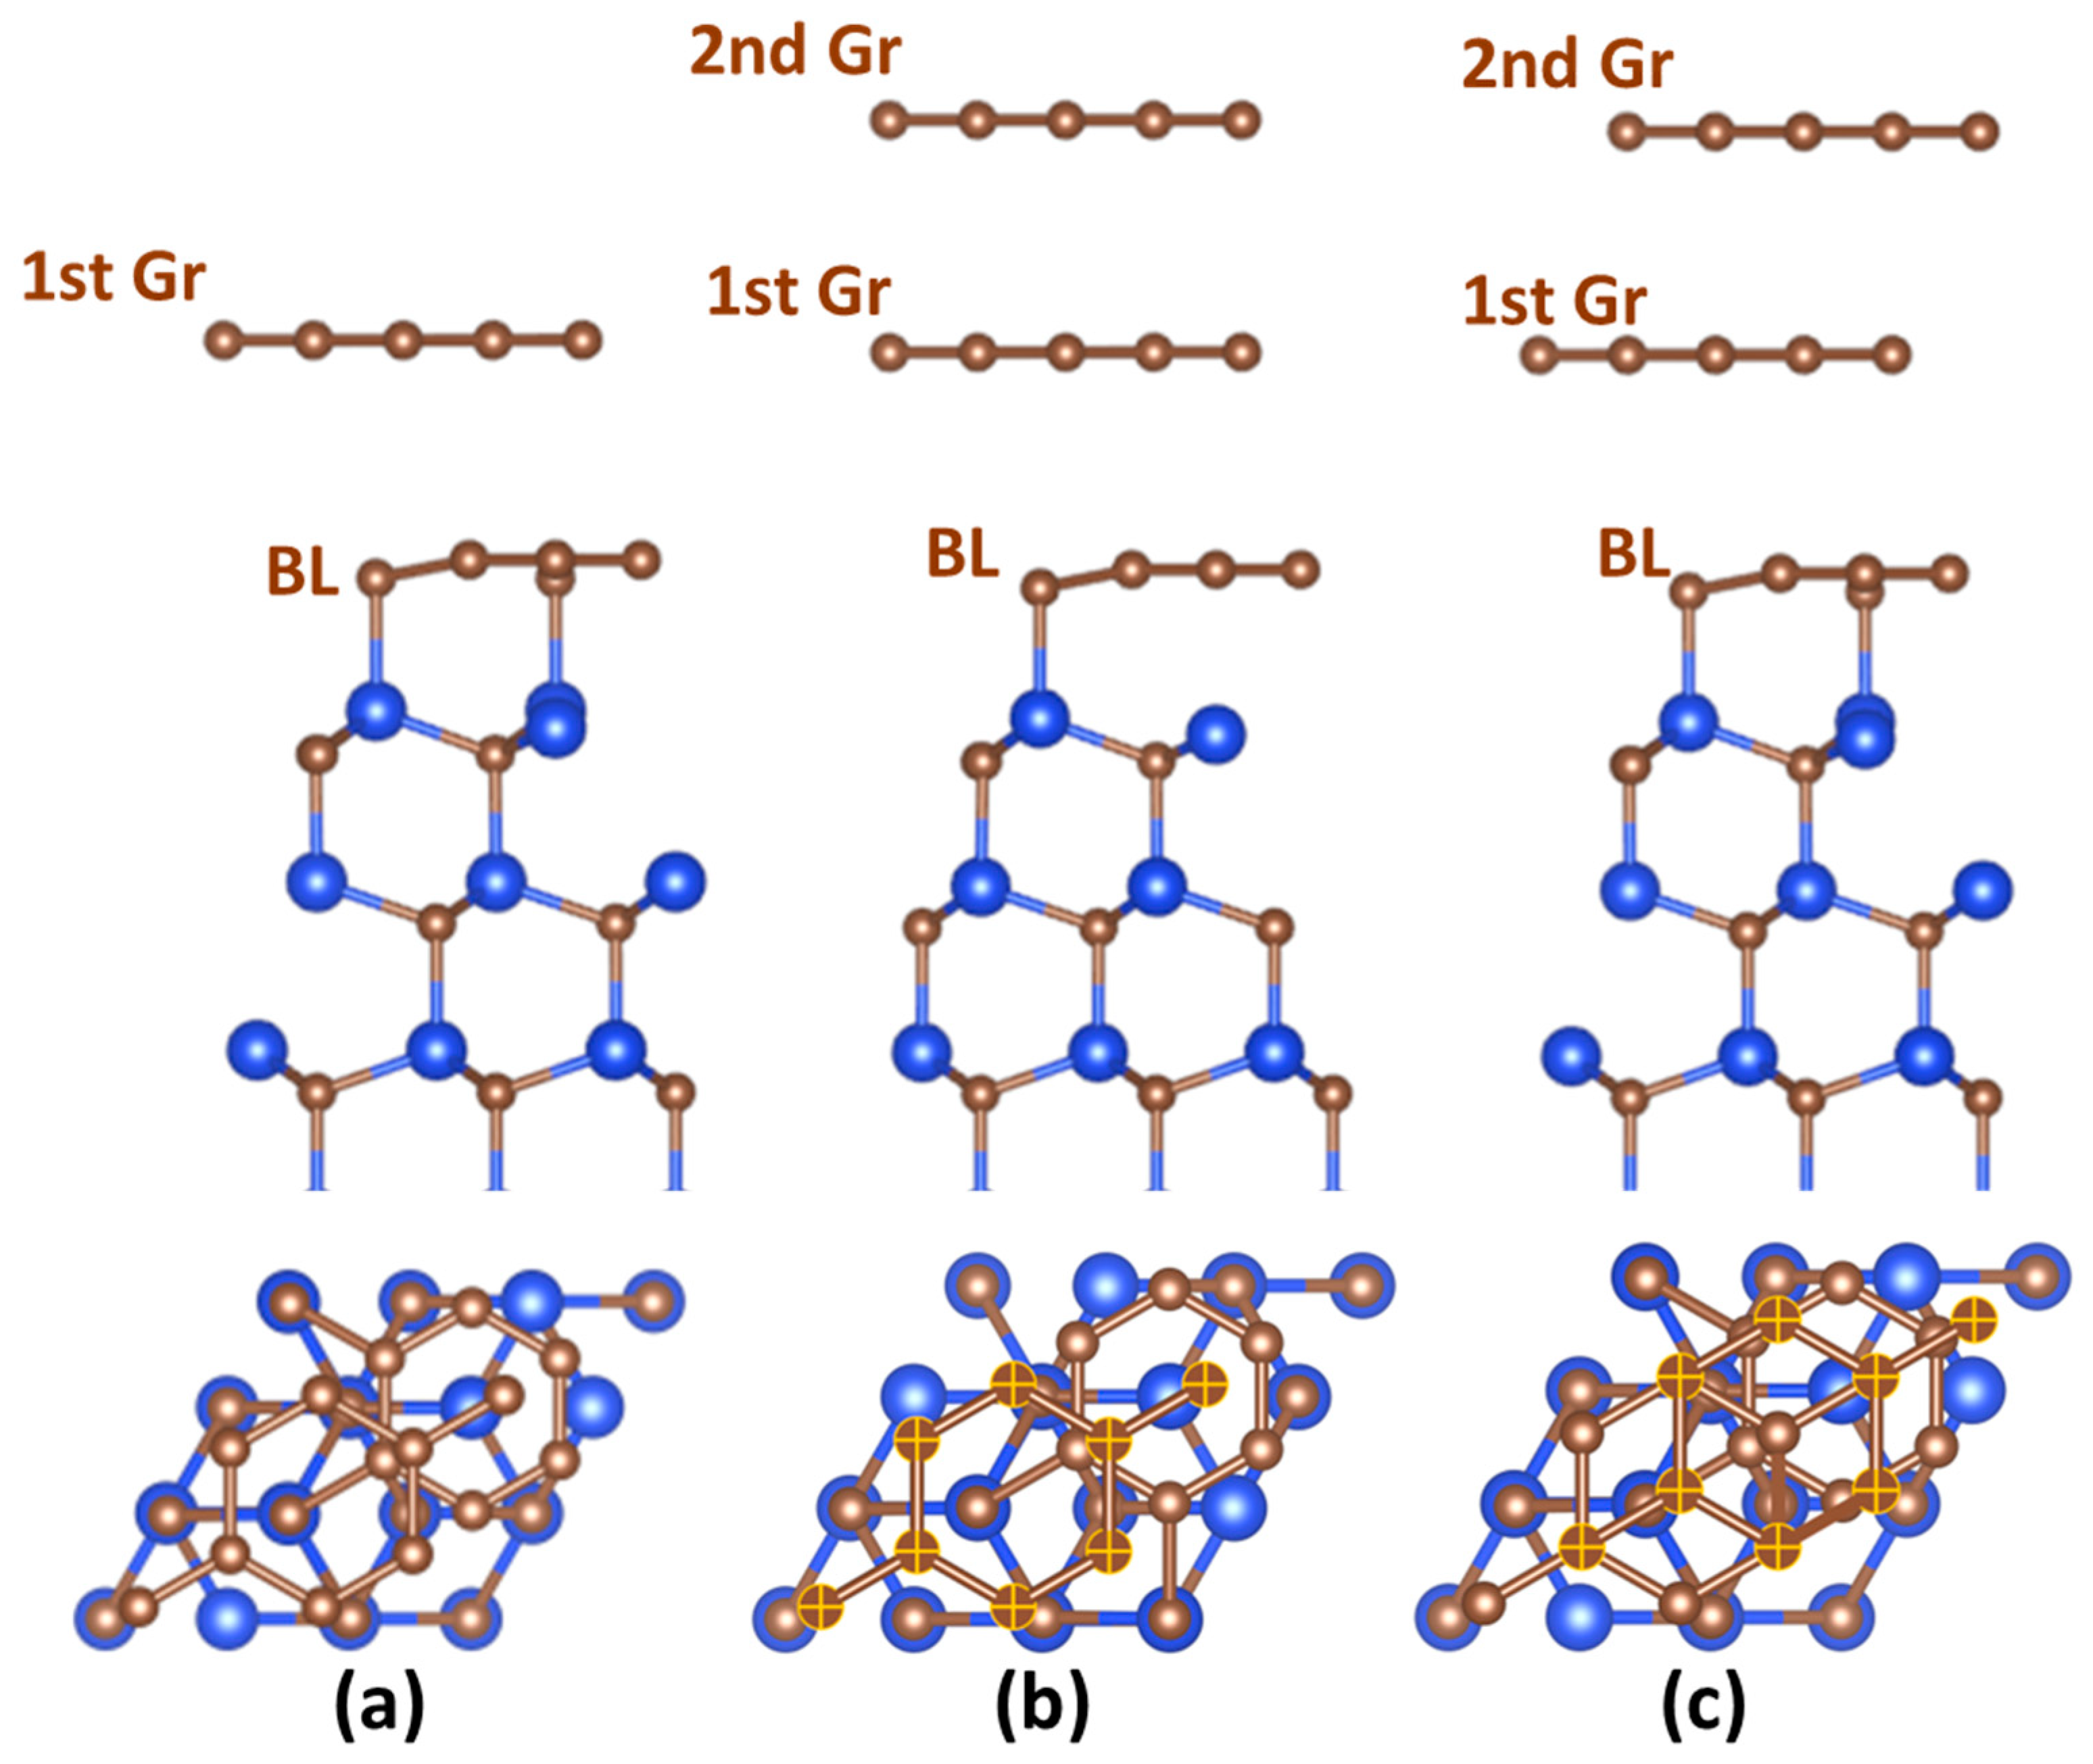
| MLG/SiC | 1.2161 | 0.9468 | 1.6939 | 0.201 | 0.217 |
| AA-BLG/SiC | 1.2802 | 1.0075 | 1.6803 | 0.209 | 0.224 |
| AB-BLG/SiC | 1.2051 | 0.9338 | 1.6973 | 0.198 | 0.213 |
Publisher’s Note: MDPI stays neutral with regard to jurisdictional claims in published maps and institutional affiliations. |
© 2022 by the authors. Licensee MDPI, Basel, Switzerland. This article is an open access article distributed under the terms and conditions of the Creative Commons Attribution (CC BY) license (https://creativecommons.org/licenses/by/4.0/).
Share and Cite
Shtepliuk, I.; Vagin, M.; Khan, Z.; Zakharov, A.A.; Iakimov, T.; Giannazzo, F.; Ivanov, I.G.; Yakimova, R. Understanding of the Electrochemical Behavior of Lithium at Bilayer-Patched Epitaxial Graphene/4H-SiC. Nanomaterials 2022, 12, 2229. https://doi.org/10.3390/nano12132229
Shtepliuk I, Vagin M, Khan Z, Zakharov AA, Iakimov T, Giannazzo F, Ivanov IG, Yakimova R. Understanding of the Electrochemical Behavior of Lithium at Bilayer-Patched Epitaxial Graphene/4H-SiC. Nanomaterials. 2022; 12(13):2229. https://doi.org/10.3390/nano12132229
Chicago/Turabian StyleShtepliuk, Ivan, Mikhail Vagin, Ziyauddin Khan, Alexei A. Zakharov, Tihomir Iakimov, Filippo Giannazzo, Ivan G. Ivanov, and Rositsa Yakimova. 2022. "Understanding of the Electrochemical Behavior of Lithium at Bilayer-Patched Epitaxial Graphene/4H-SiC" Nanomaterials 12, no. 13: 2229. https://doi.org/10.3390/nano12132229
APA StyleShtepliuk, I., Vagin, M., Khan, Z., Zakharov, A. A., Iakimov, T., Giannazzo, F., Ivanov, I. G., & Yakimova, R. (2022). Understanding of the Electrochemical Behavior of Lithium at Bilayer-Patched Epitaxial Graphene/4H-SiC. Nanomaterials, 12(13), 2229. https://doi.org/10.3390/nano12132229