
Preparation of Metal Nitride Particles Using Arc Discharge in Liquid Nitrogen


Abstract
1. Introduction
2. Experimental Section
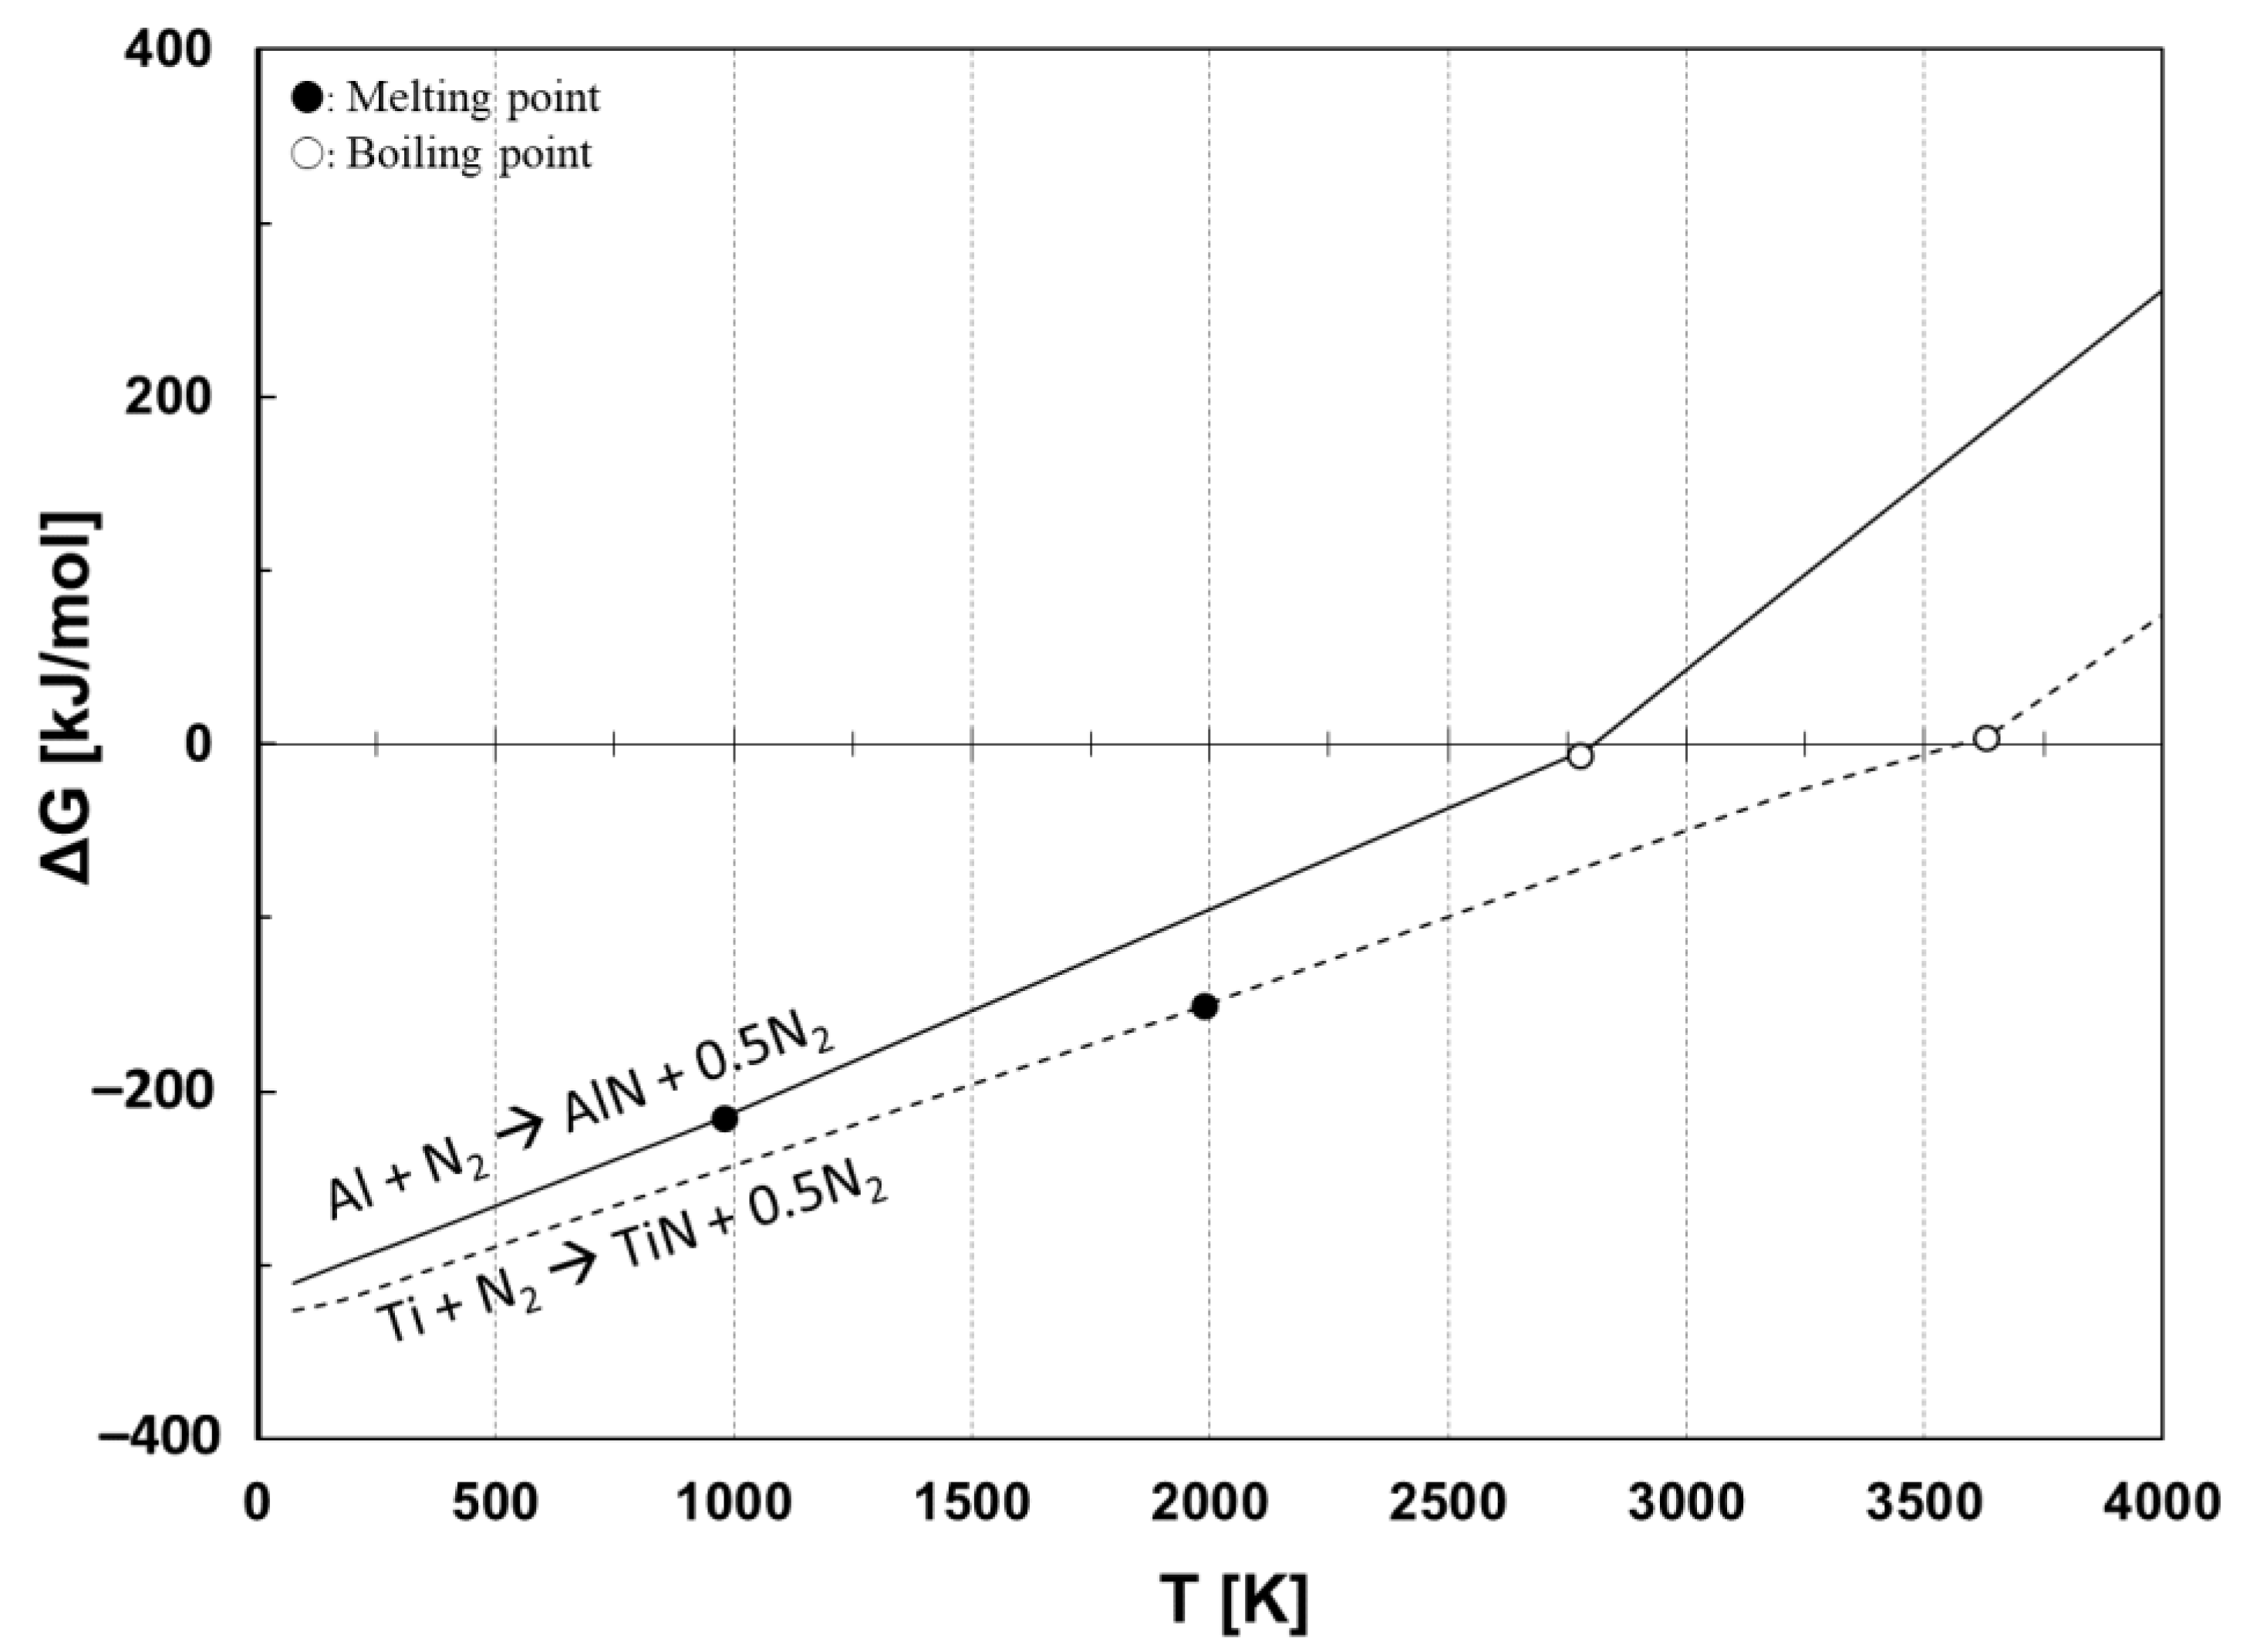
2.1. Selection of Metal Electrodes
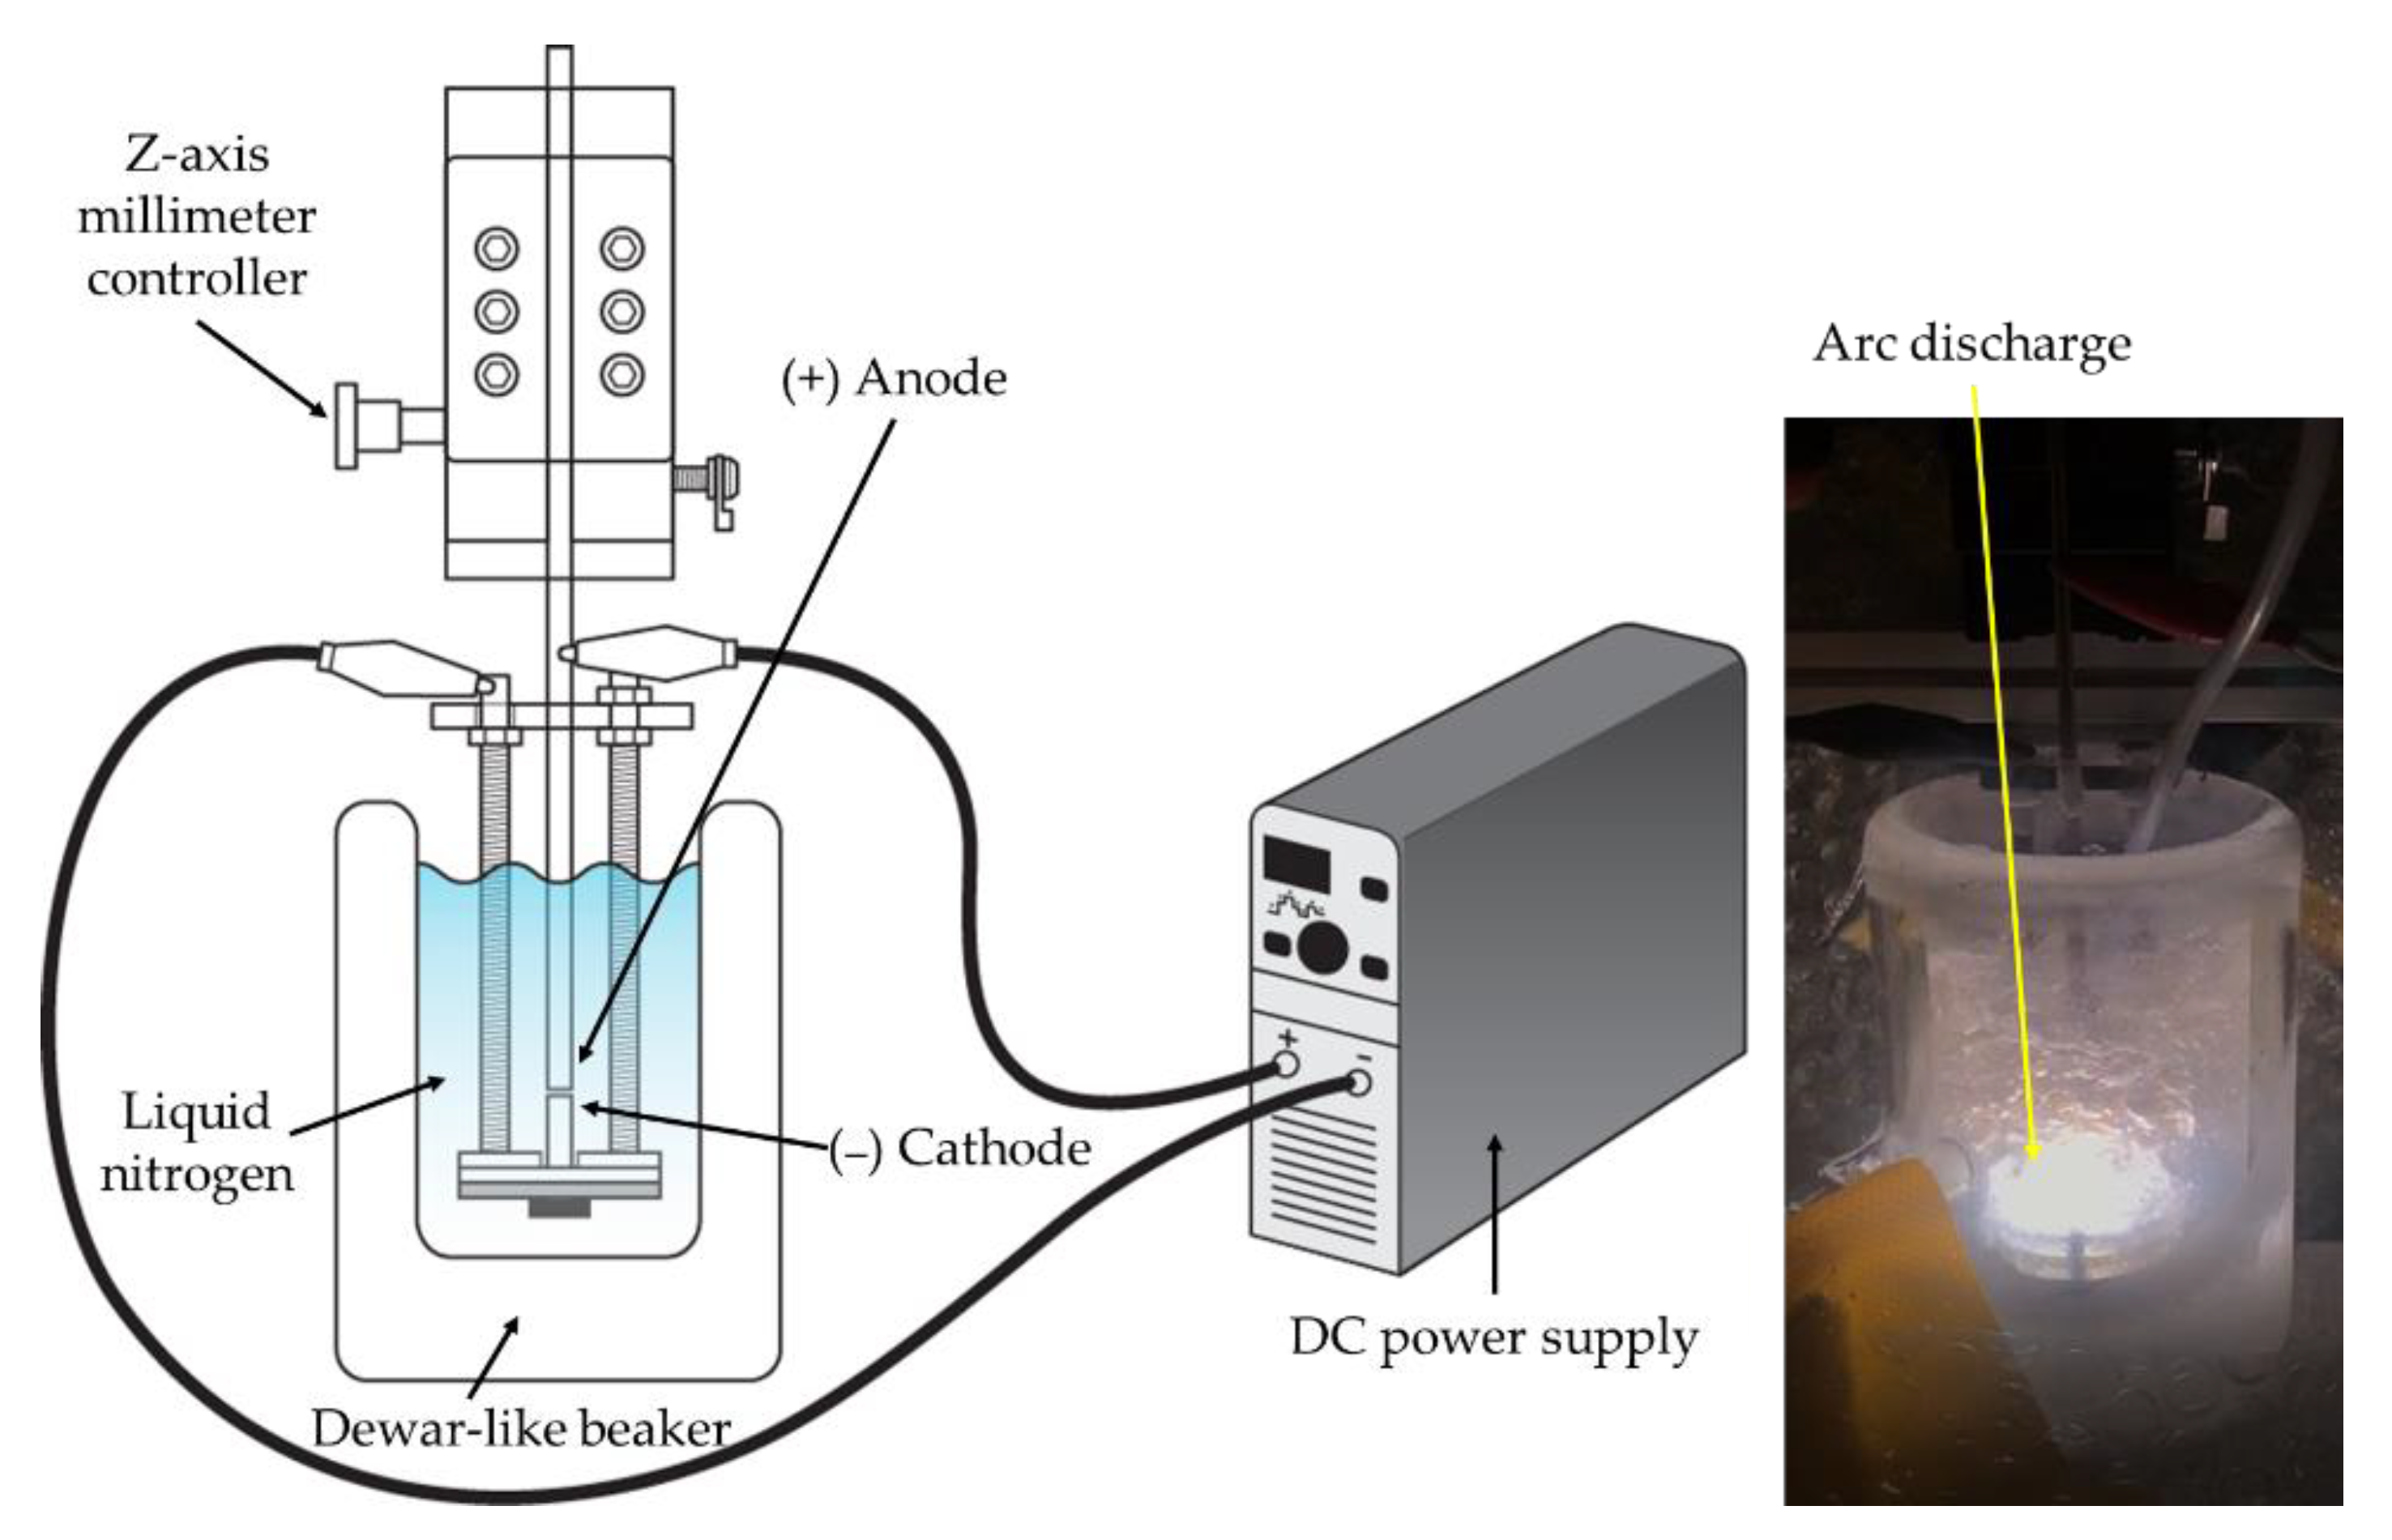
2.2. Preparation of Metal Nitride Particles
2.3. Characterization
3. Results
3.1. Morphologies of the Prepared Particles in Liquid Nitrogen Discharge
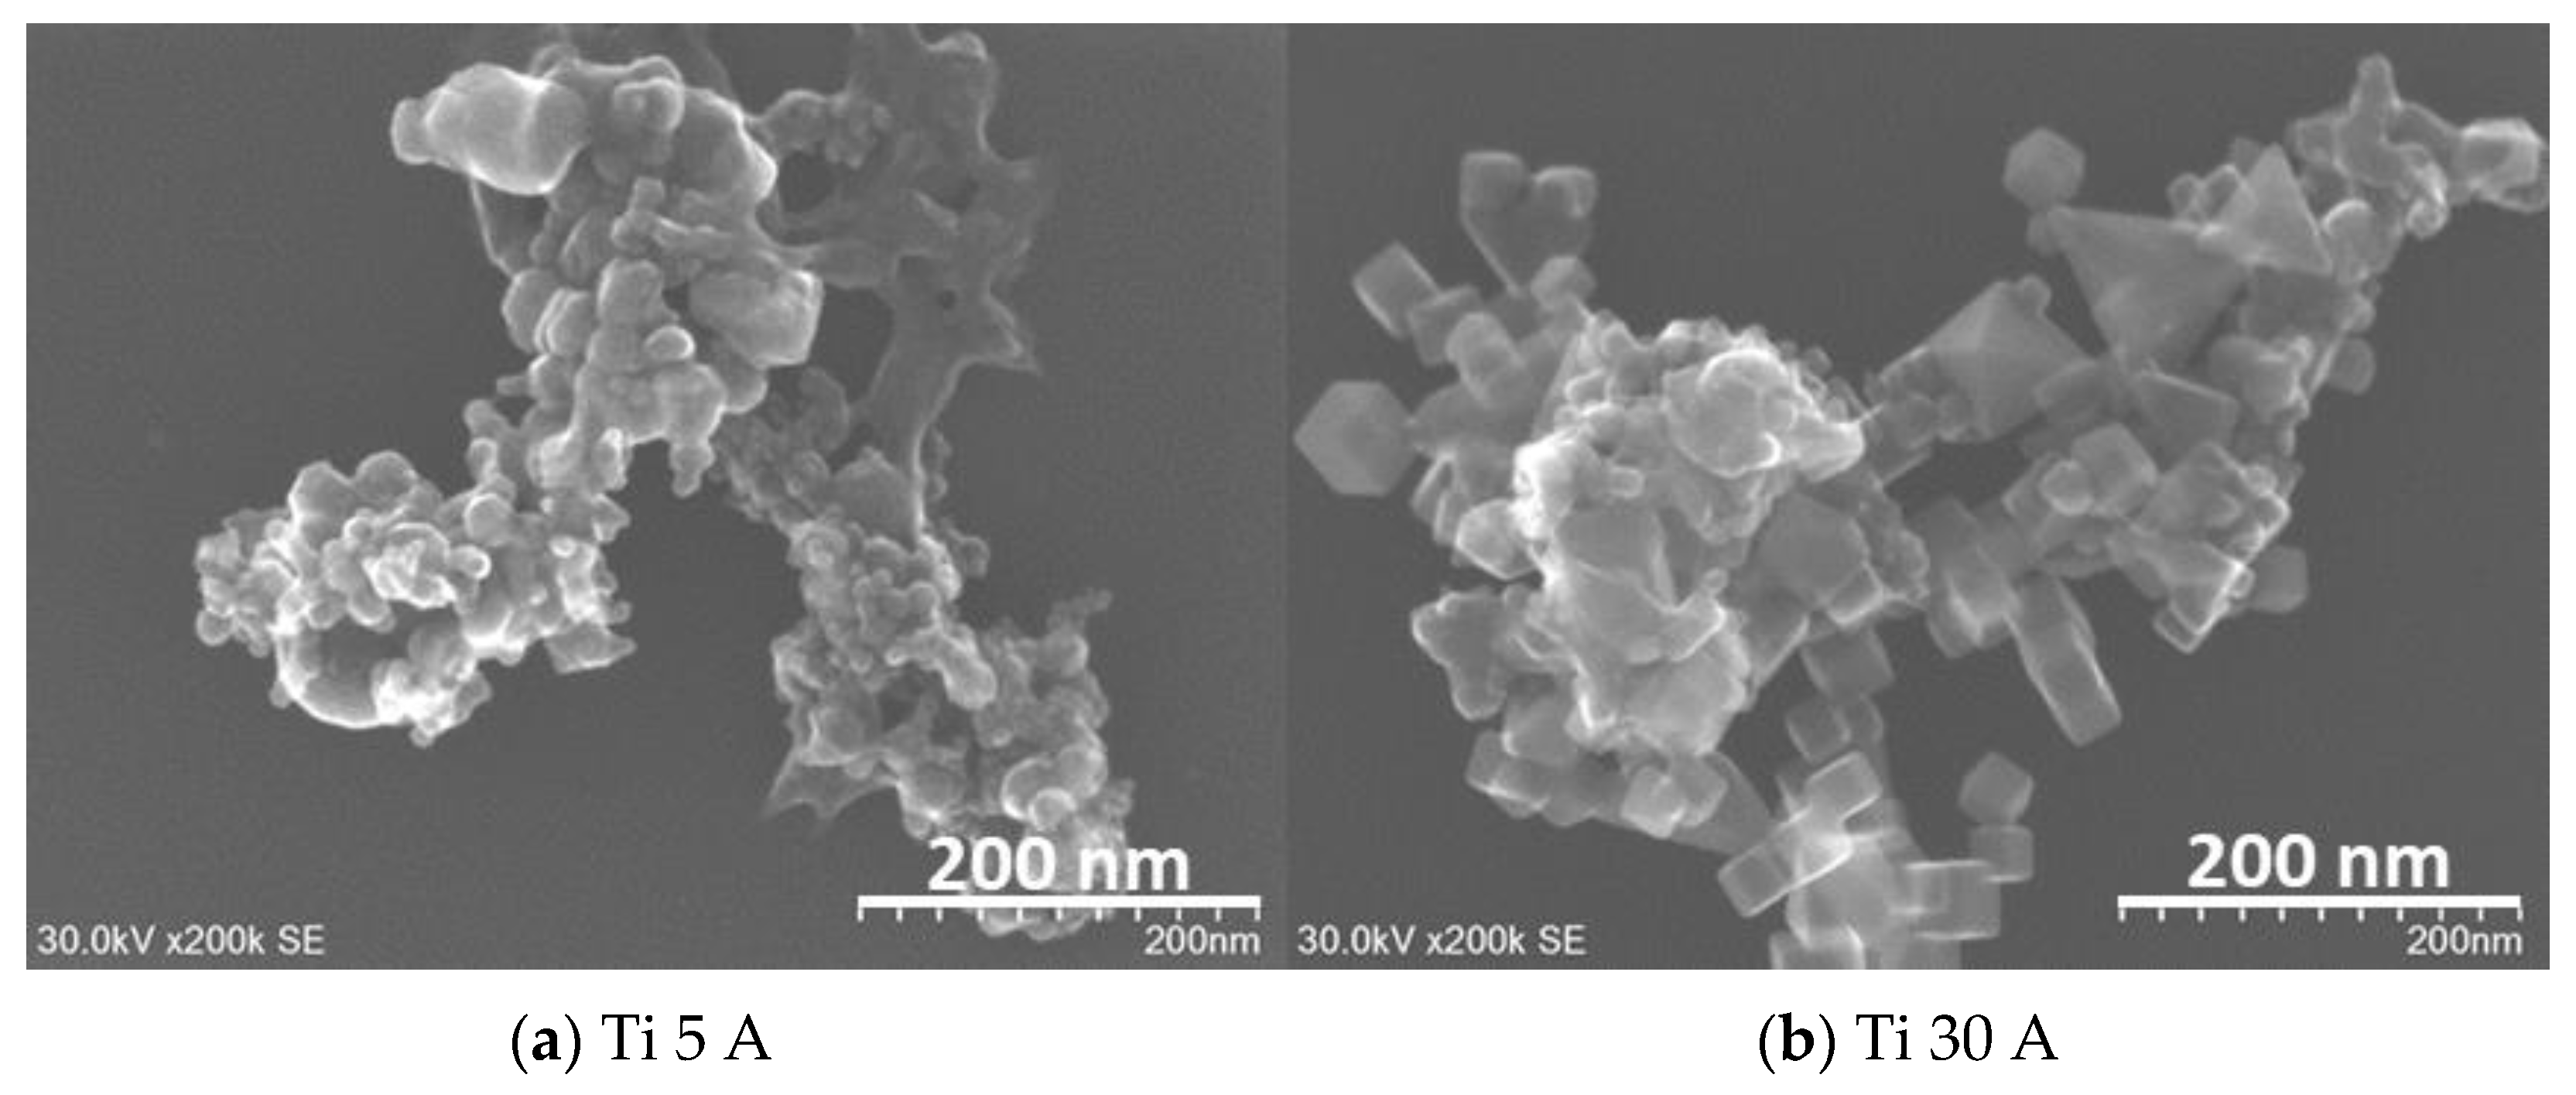
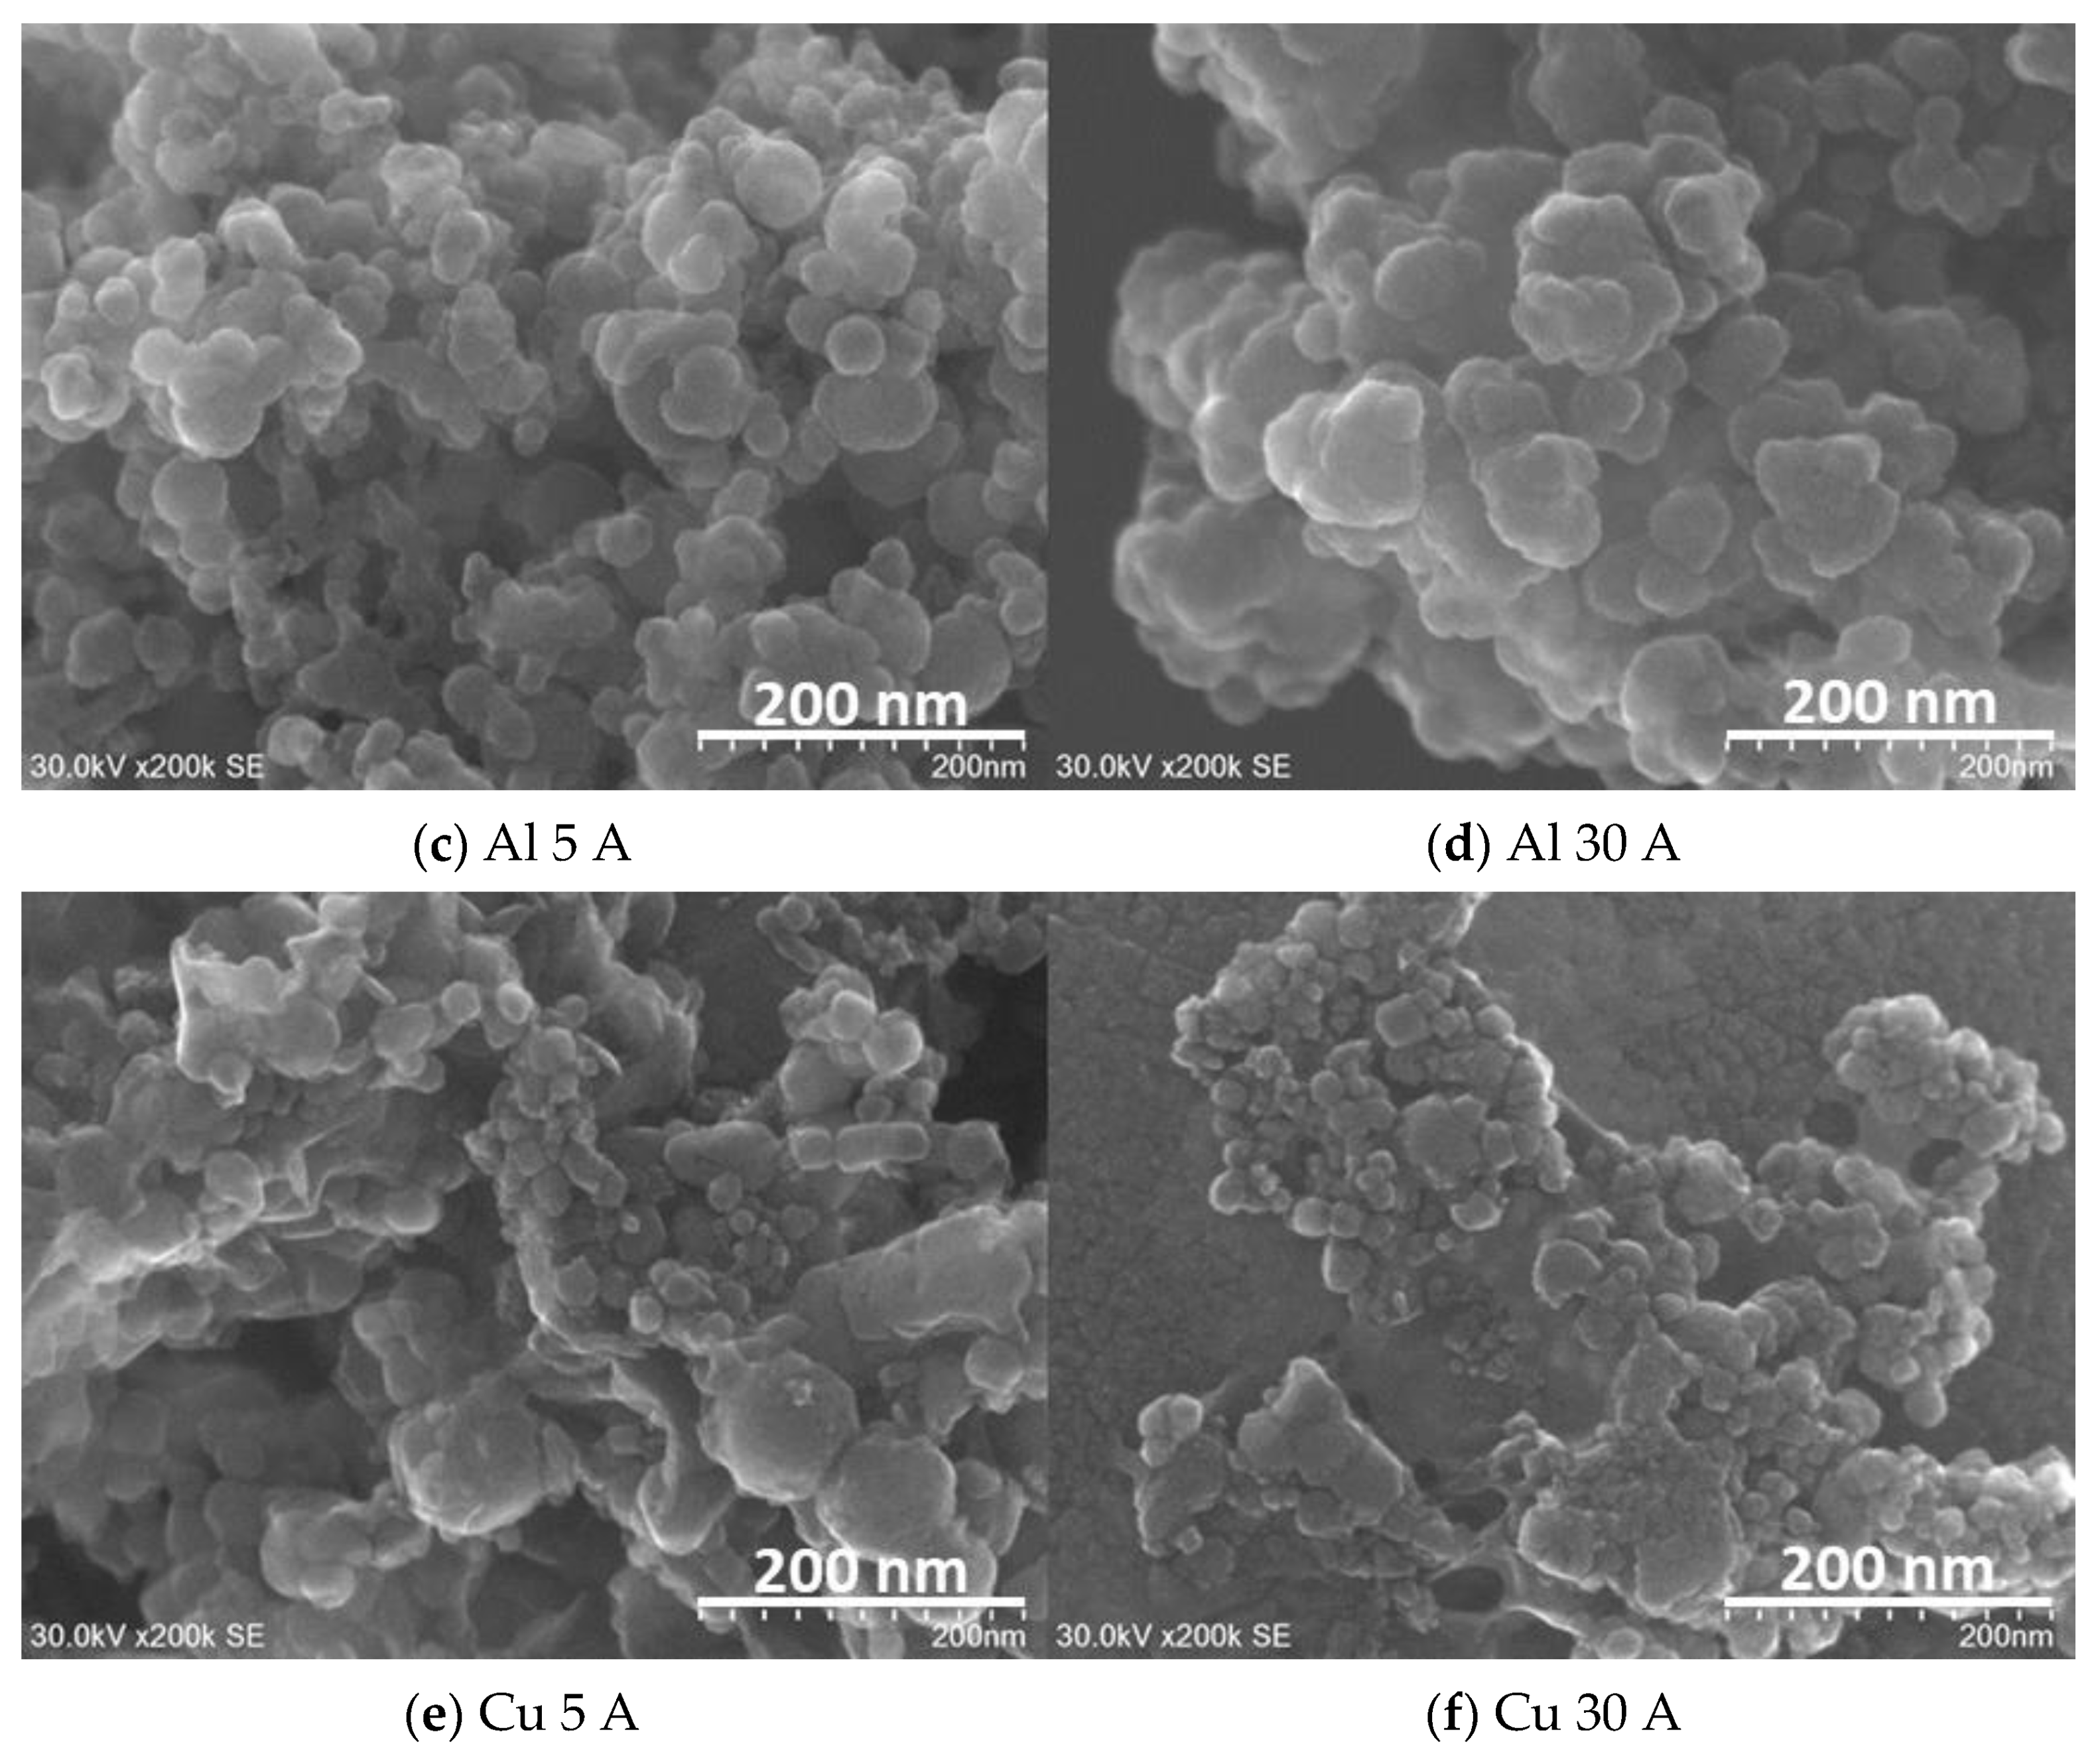
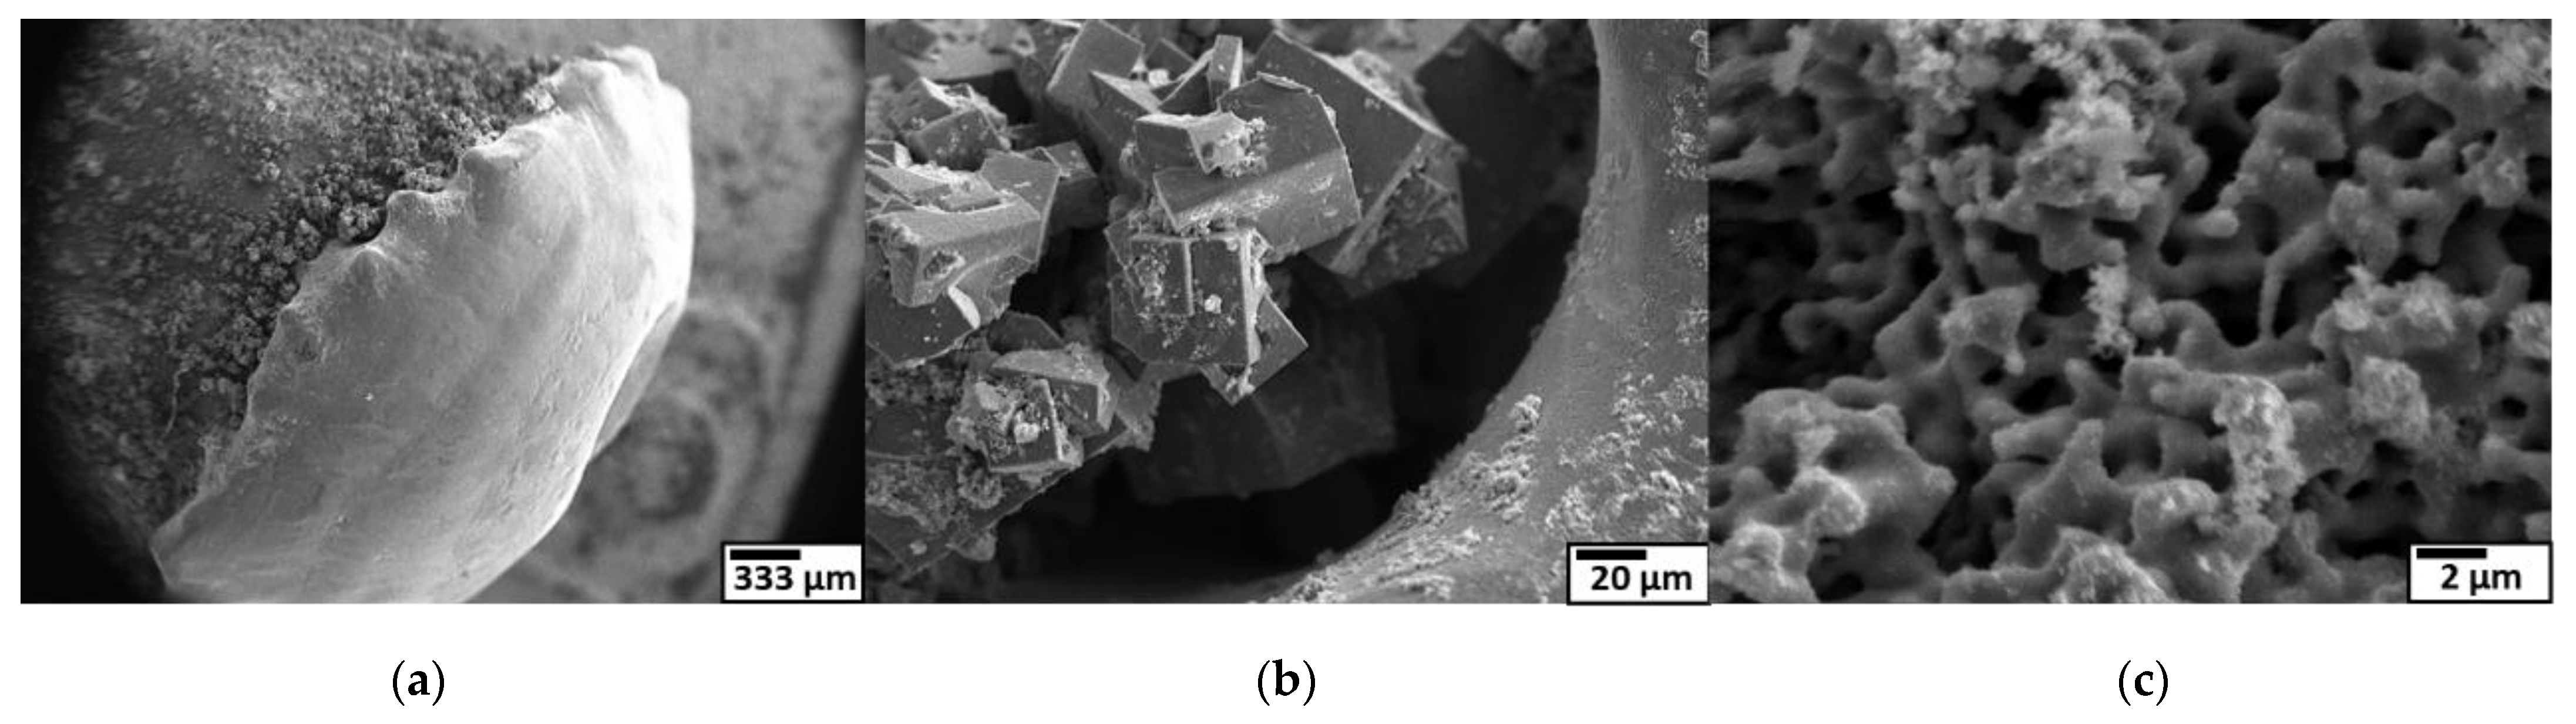
3.1.1. FE-SEM Observation
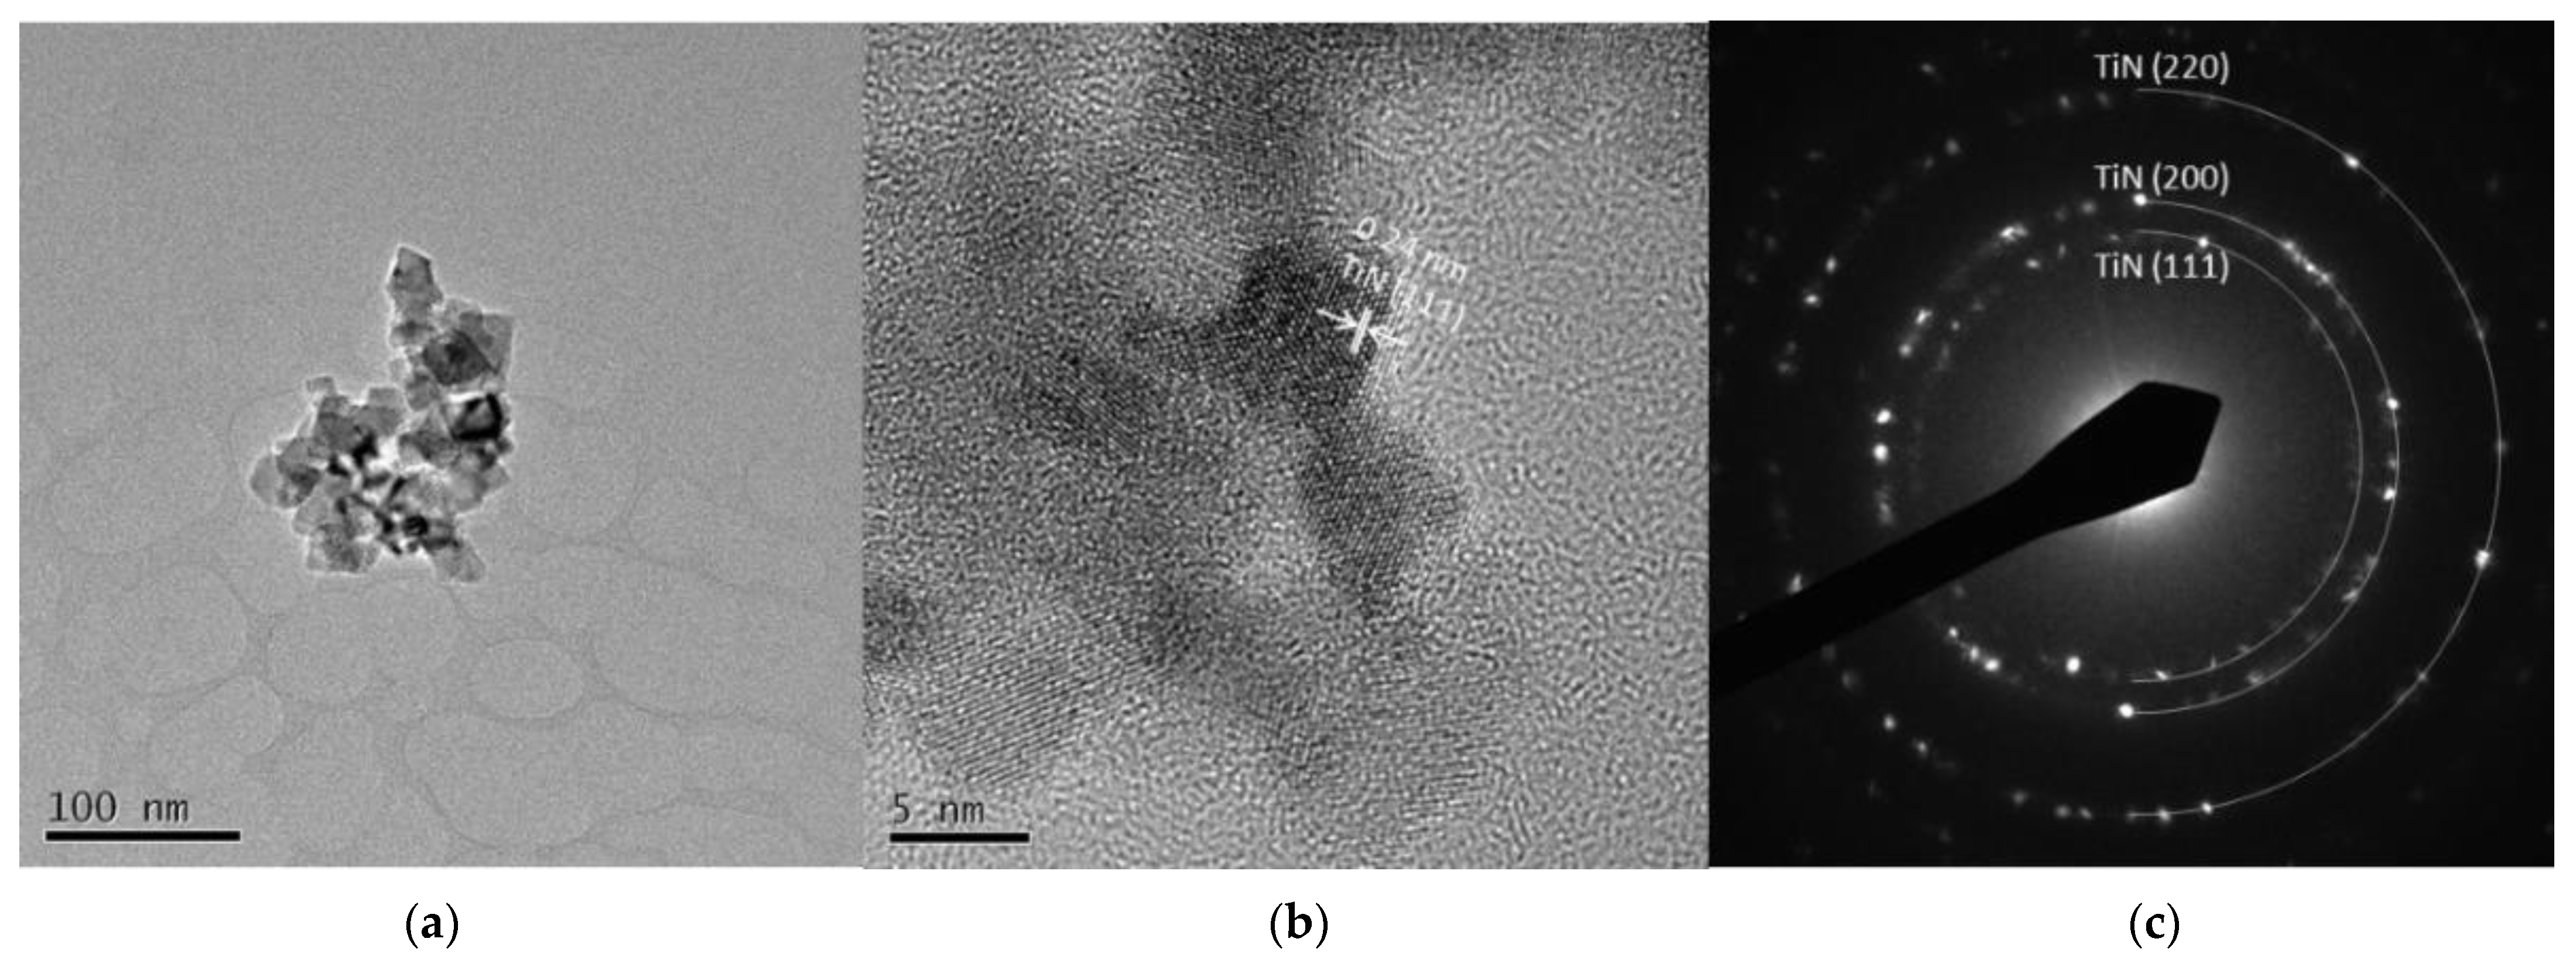
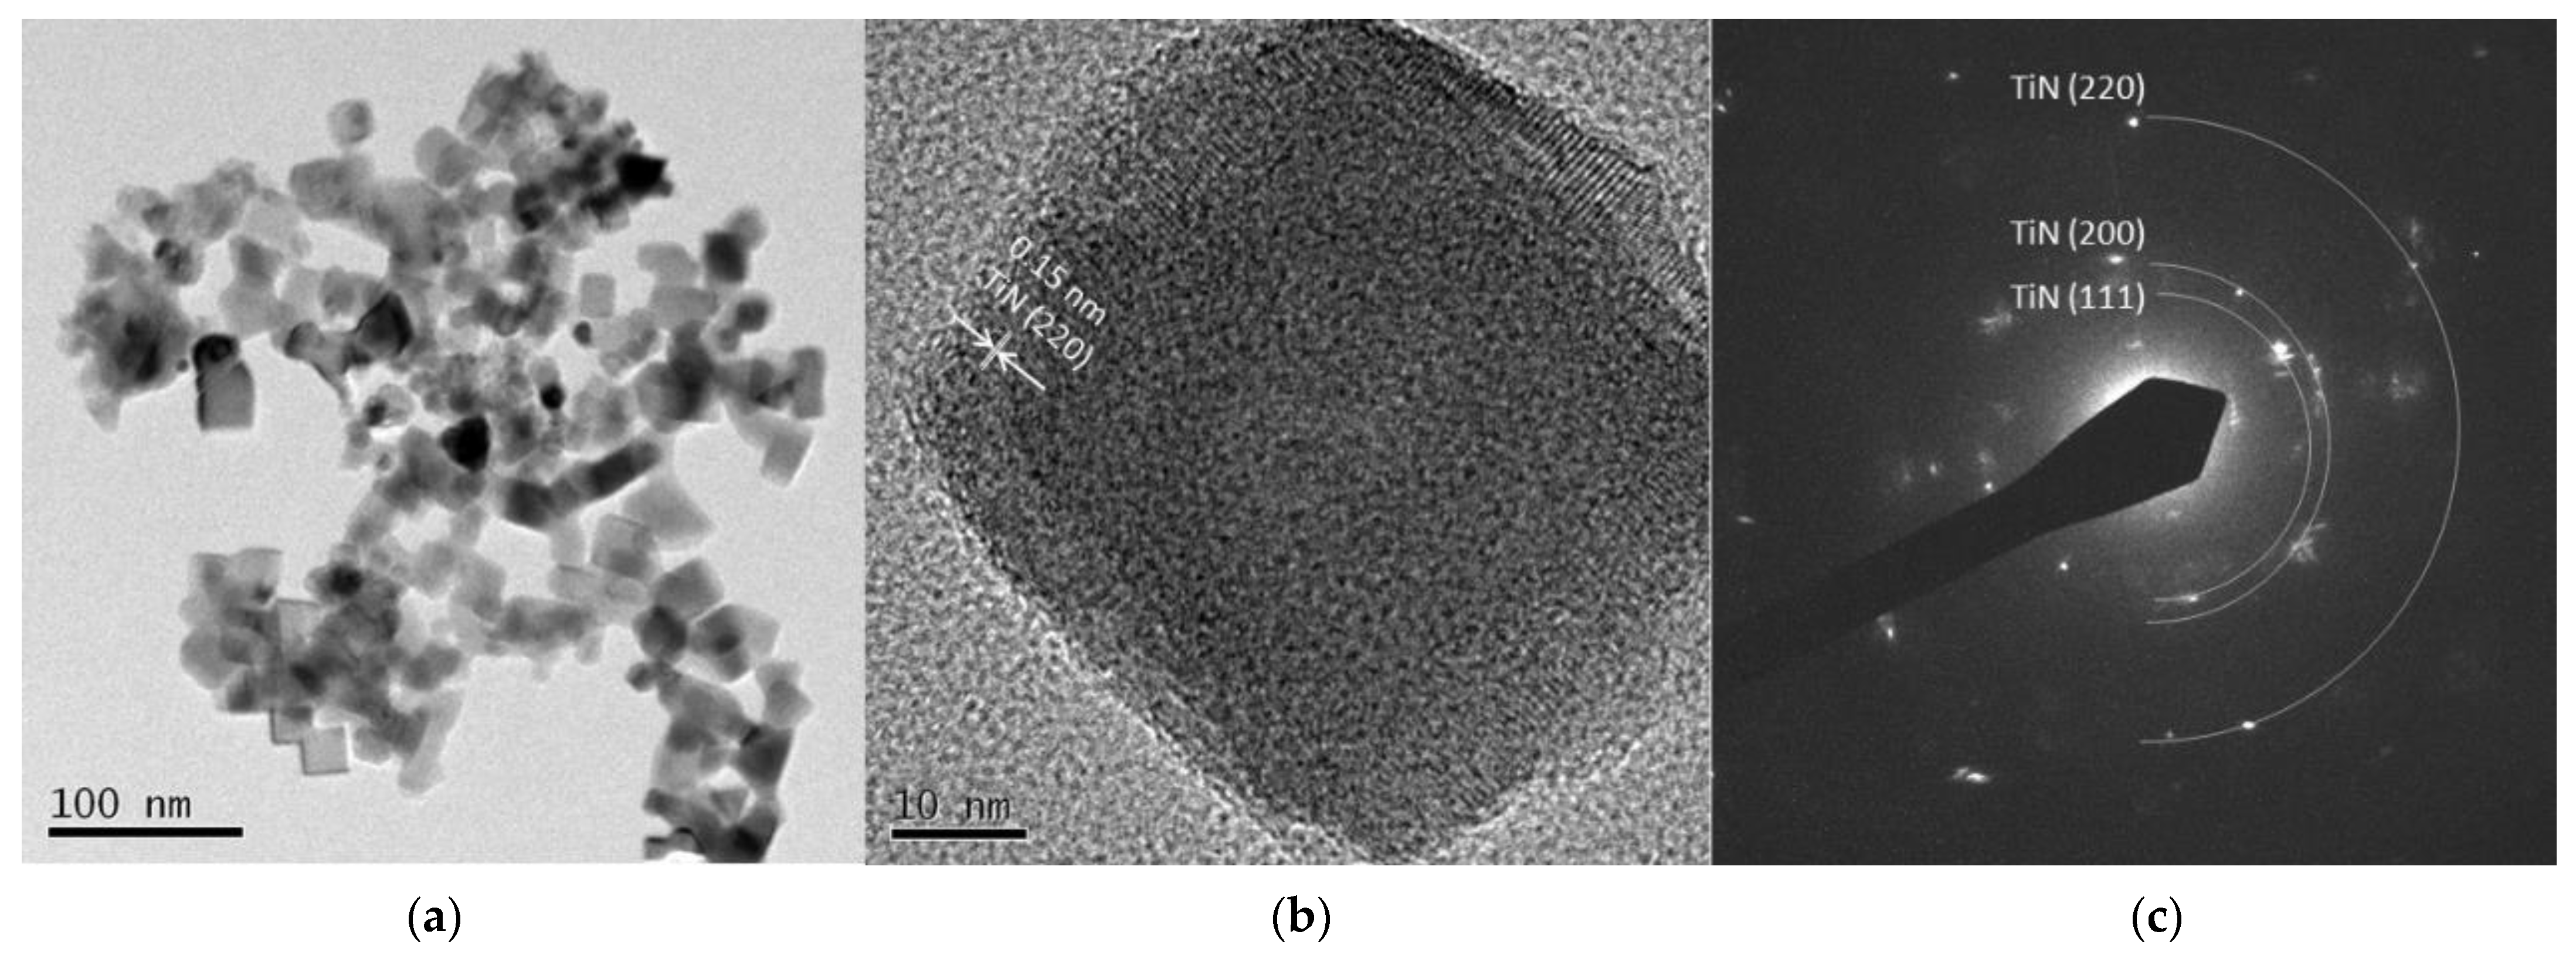
3.1.2. FE-TEM Observation
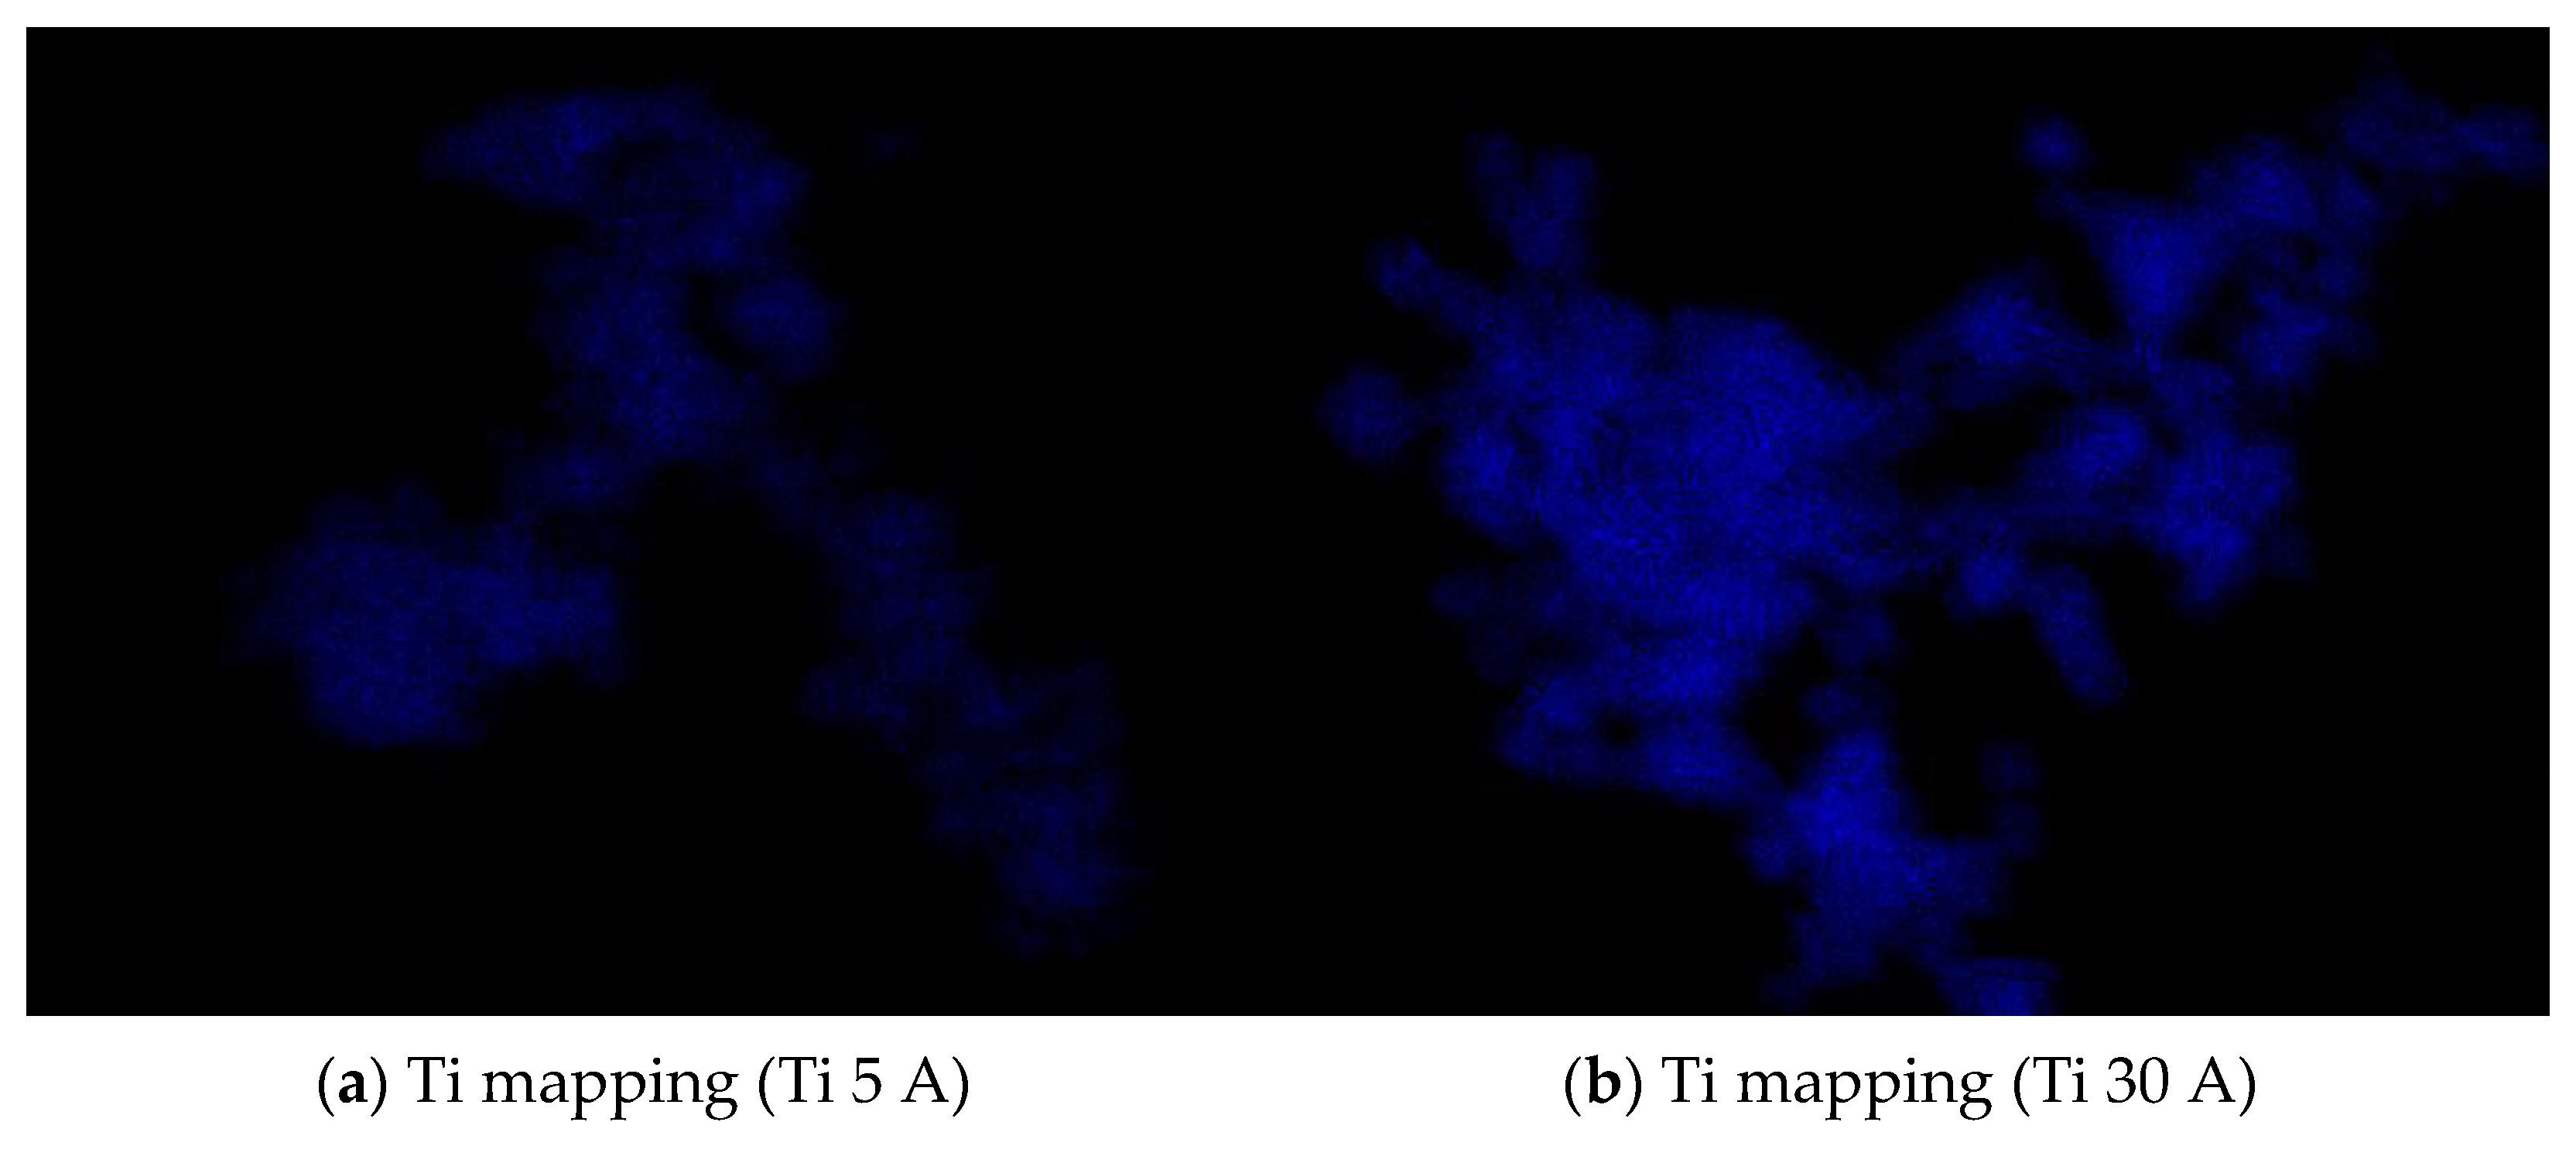
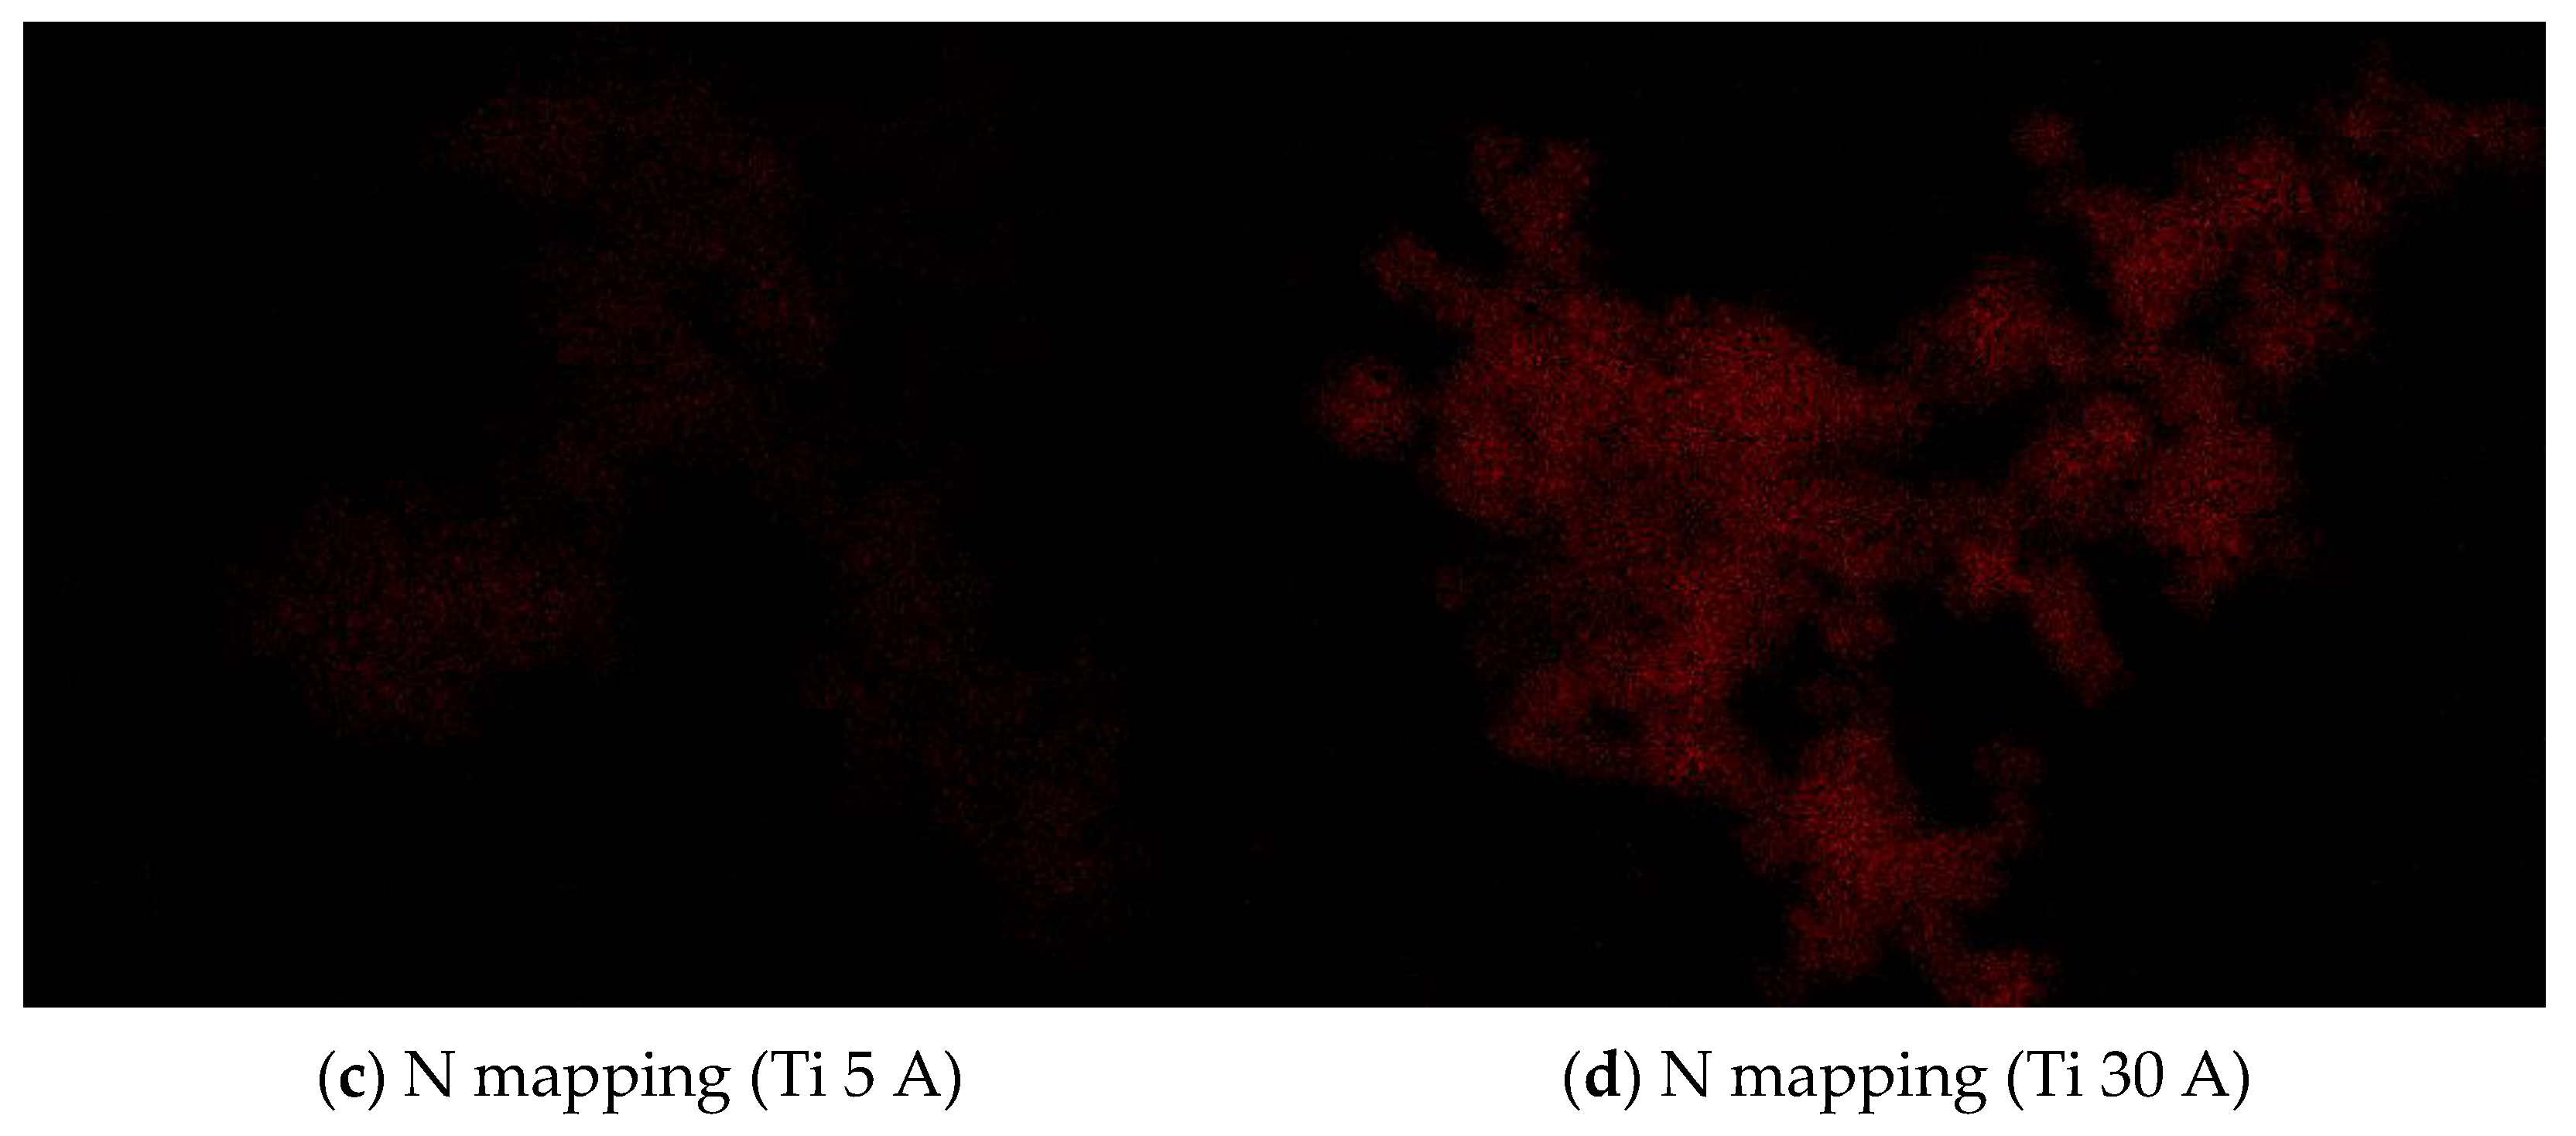
Ti 5 A and Ti 30 A
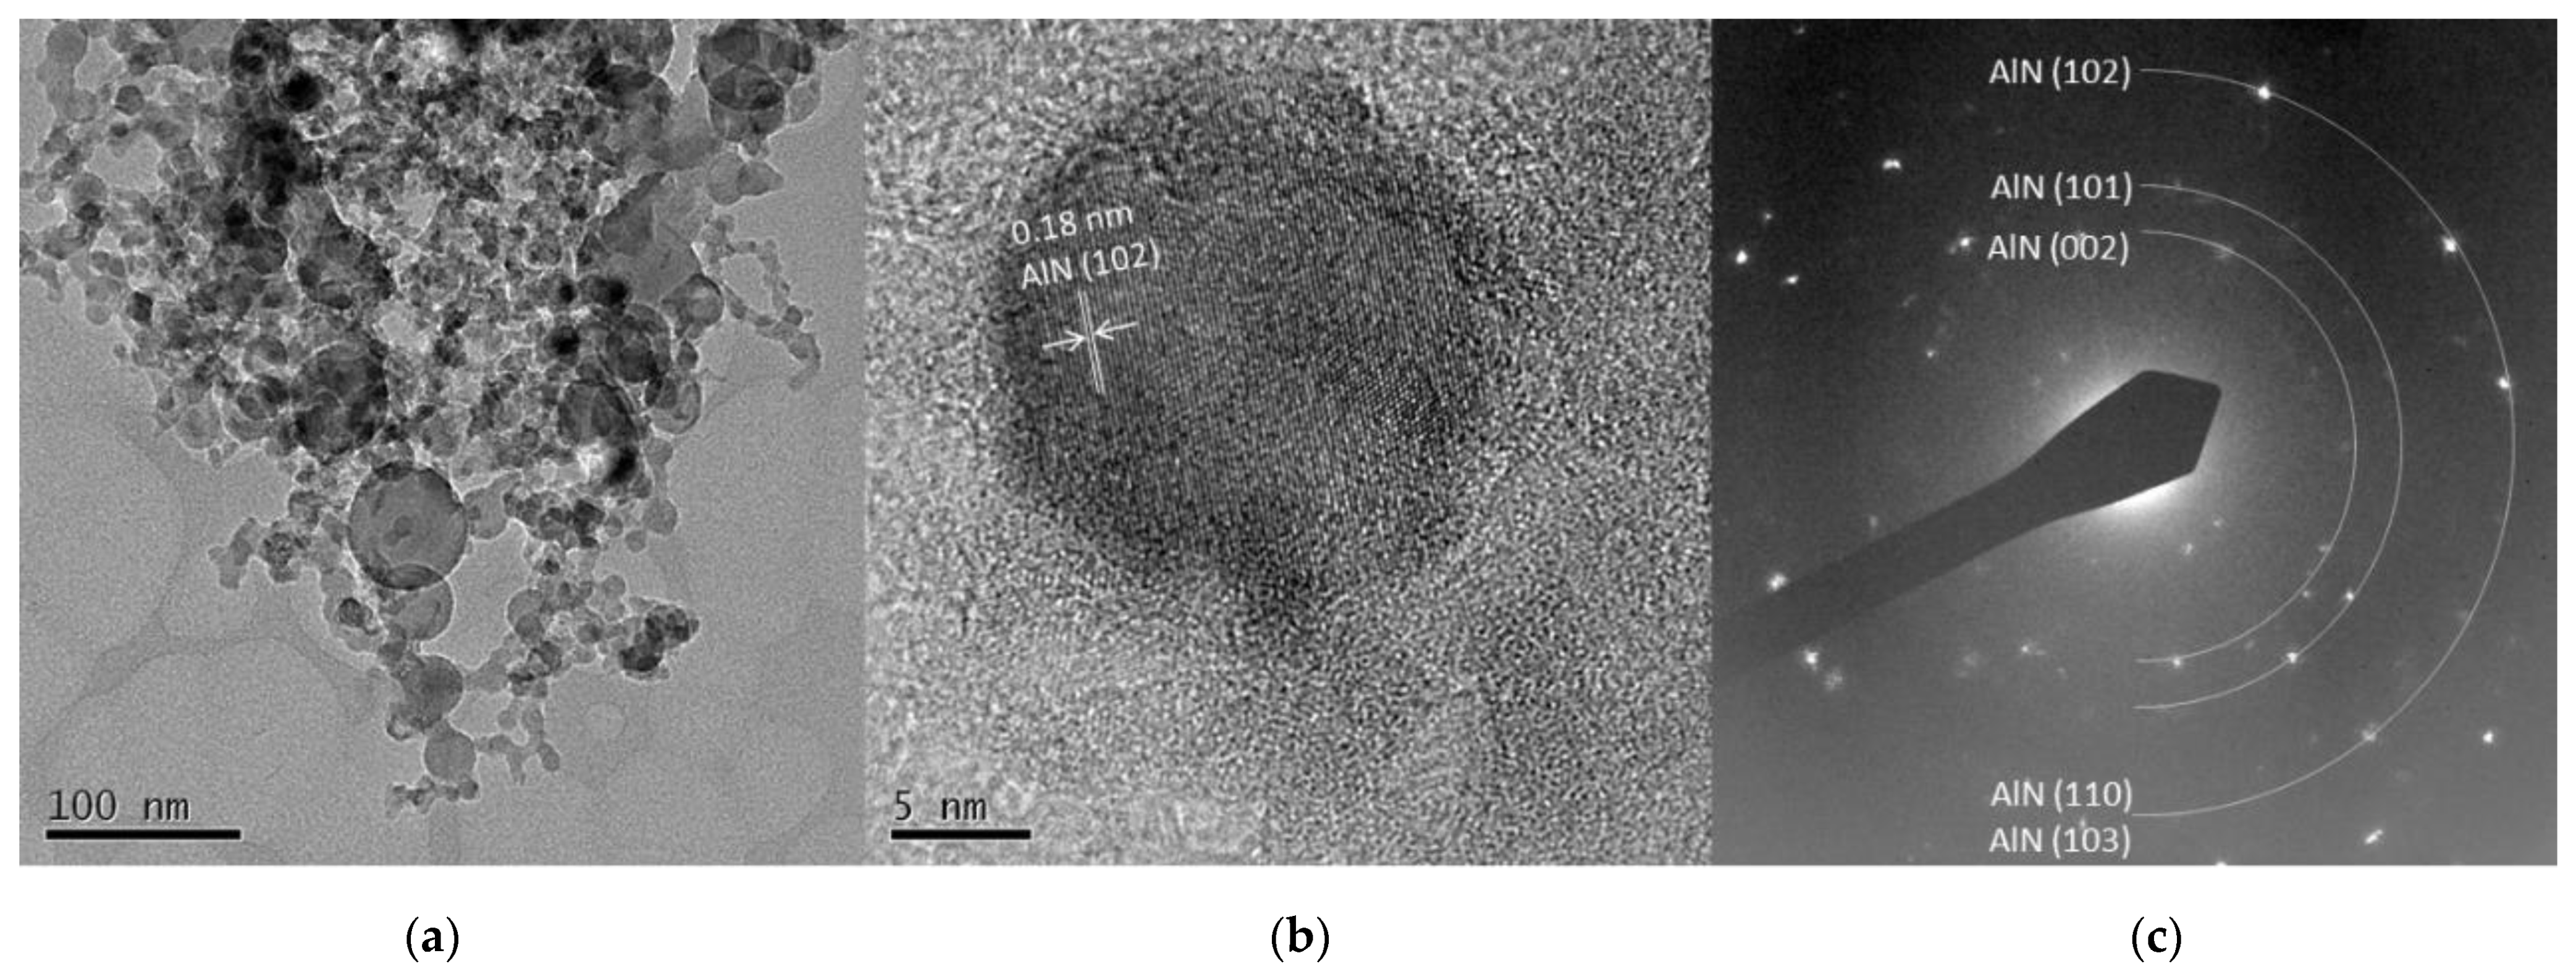
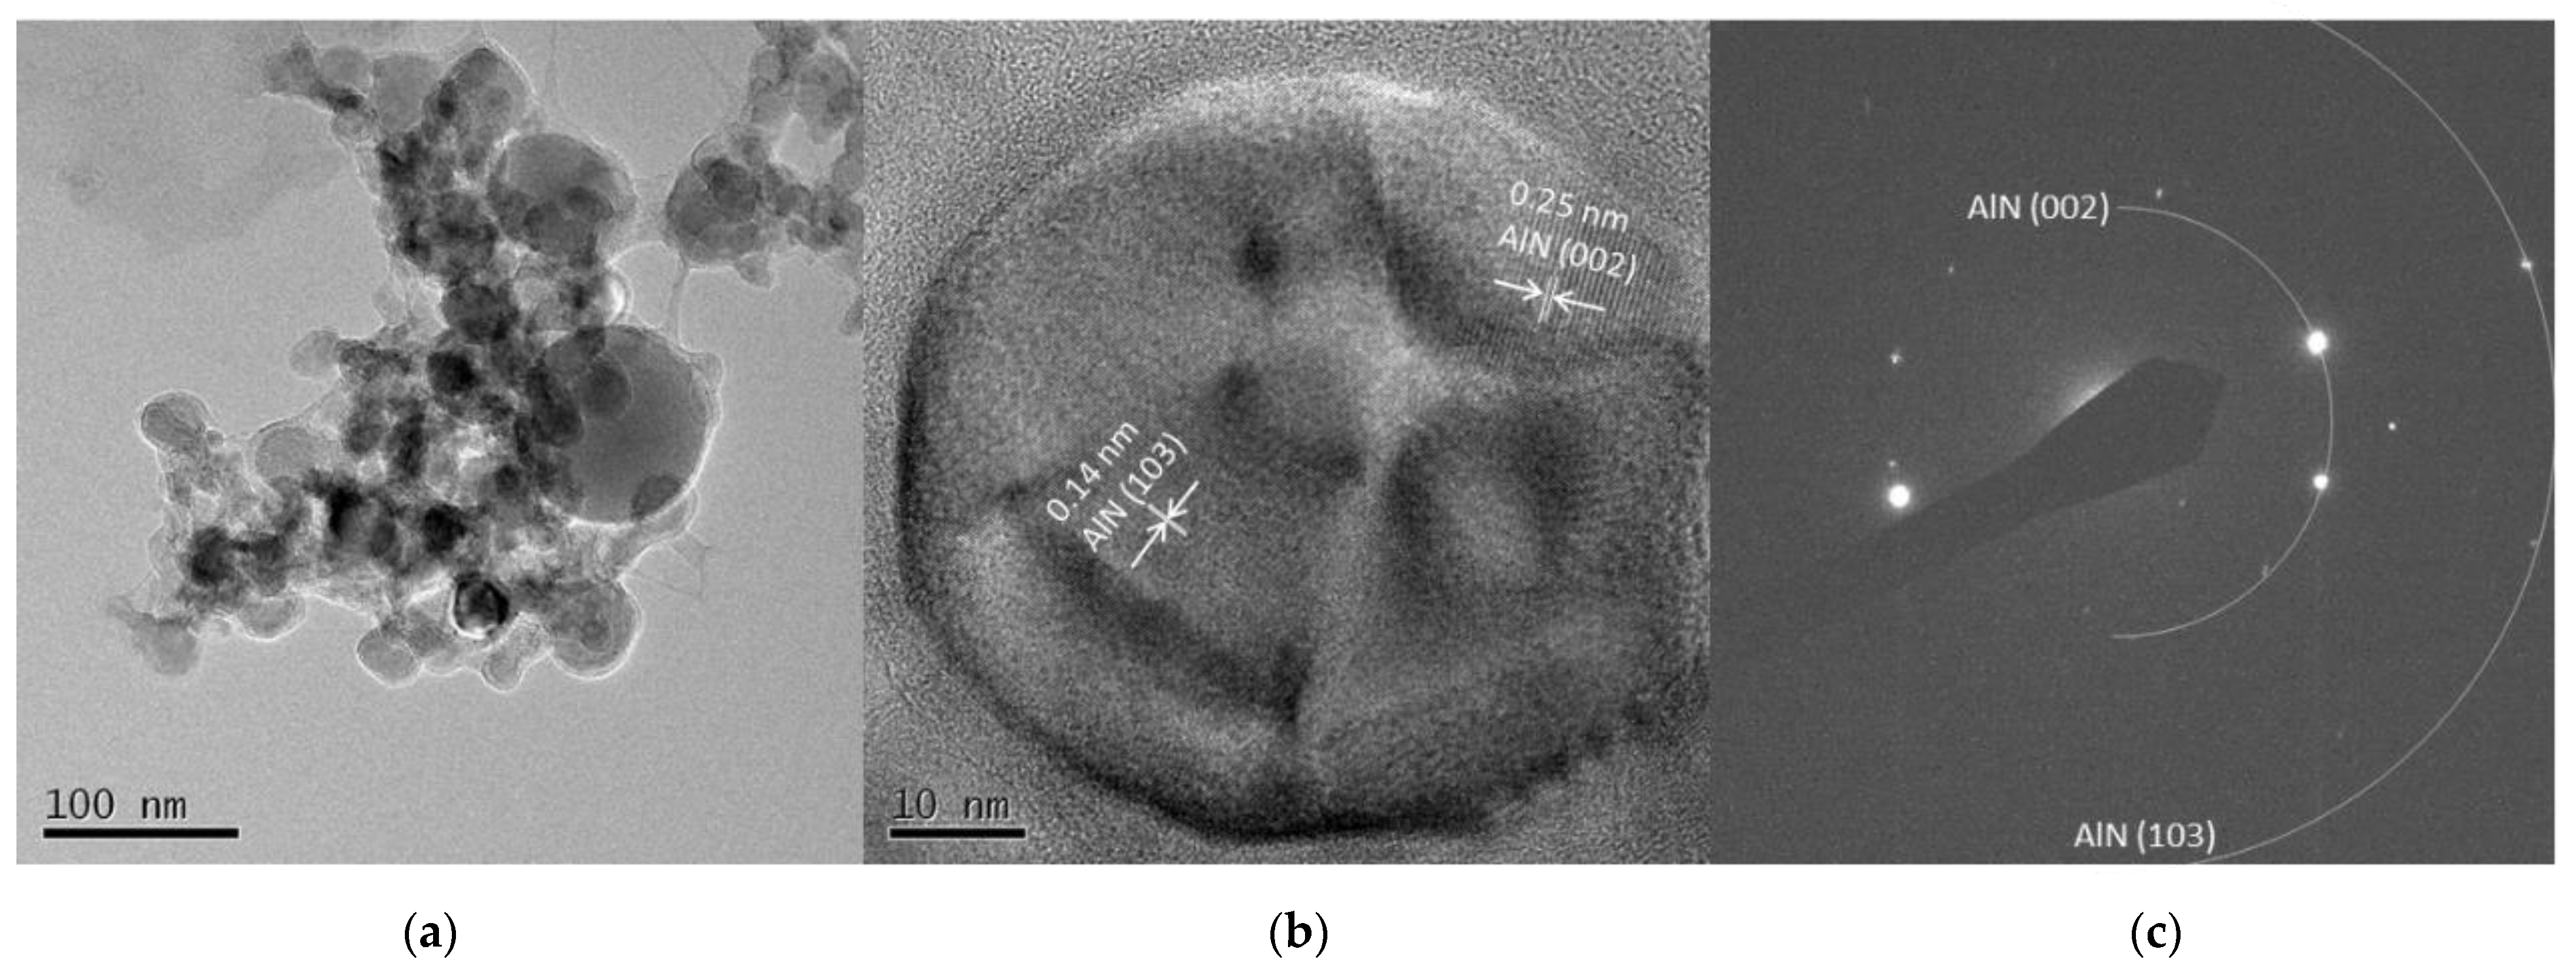
Al 5 A and Al 30 A
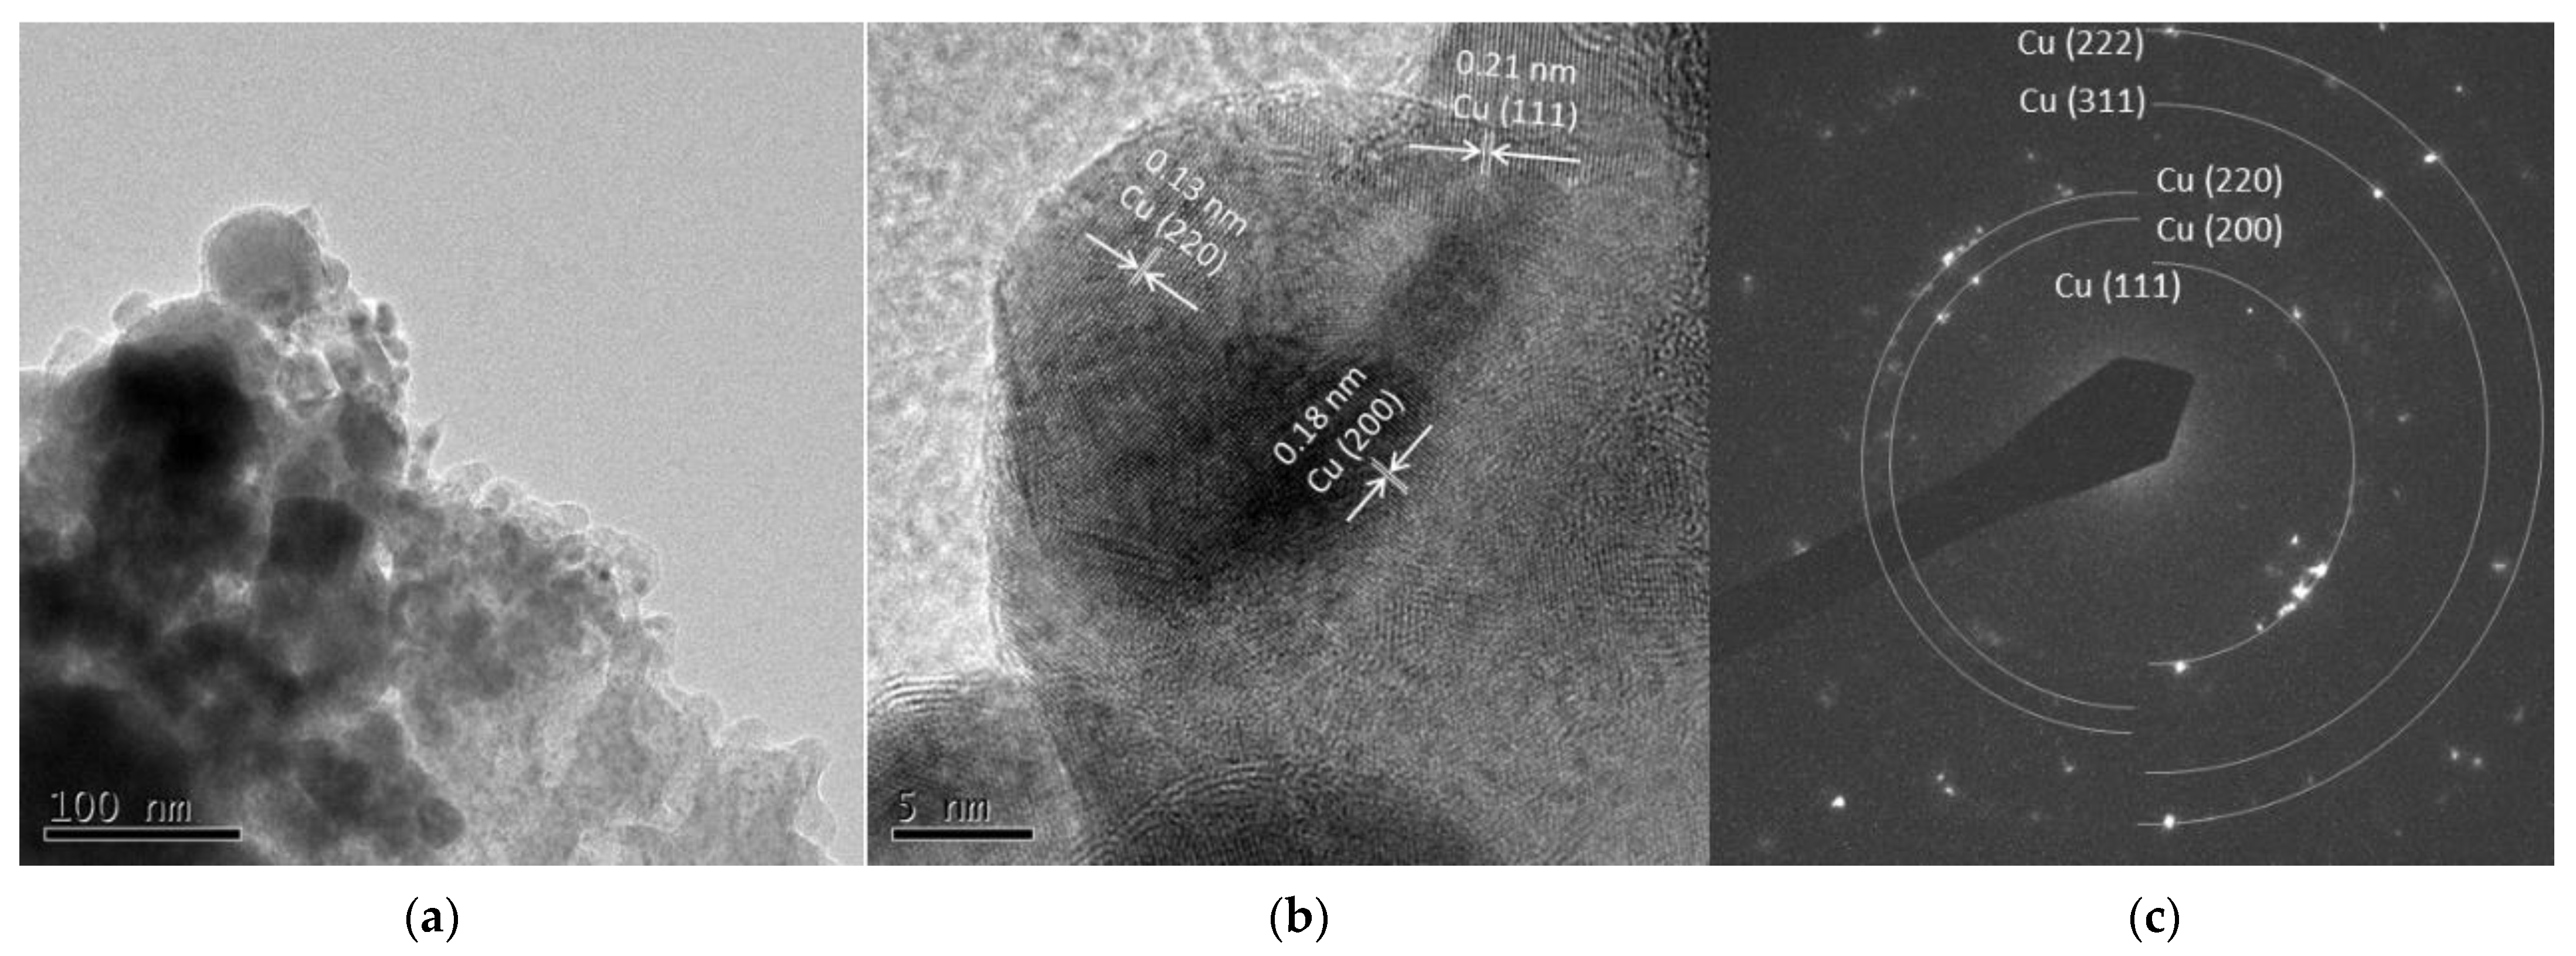
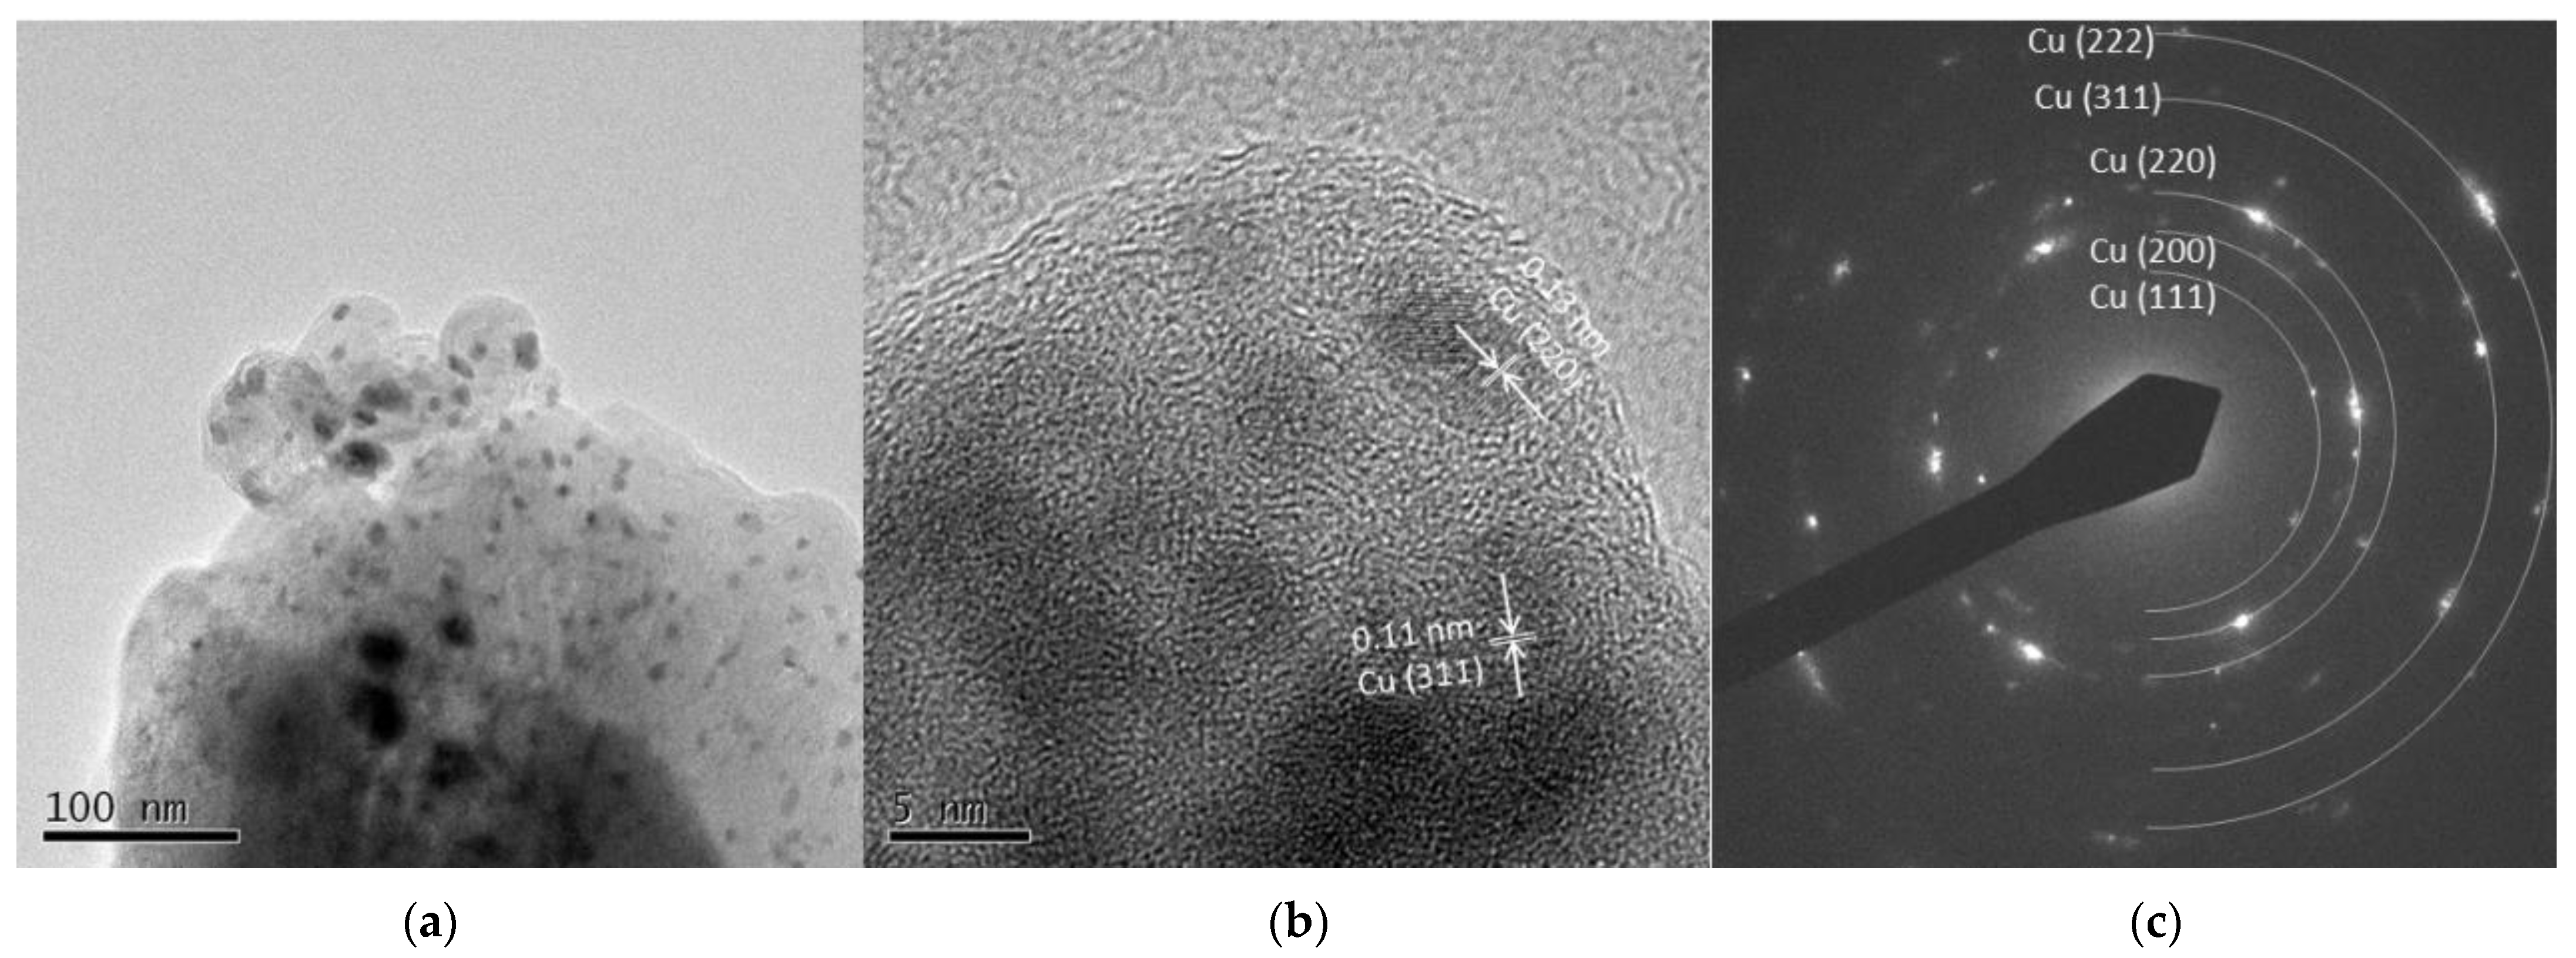
Cu 5 A and Cu 30 A
3.2. Crystallite Phase of the Synthesized Particles in Liquid Nitrogen Discharge
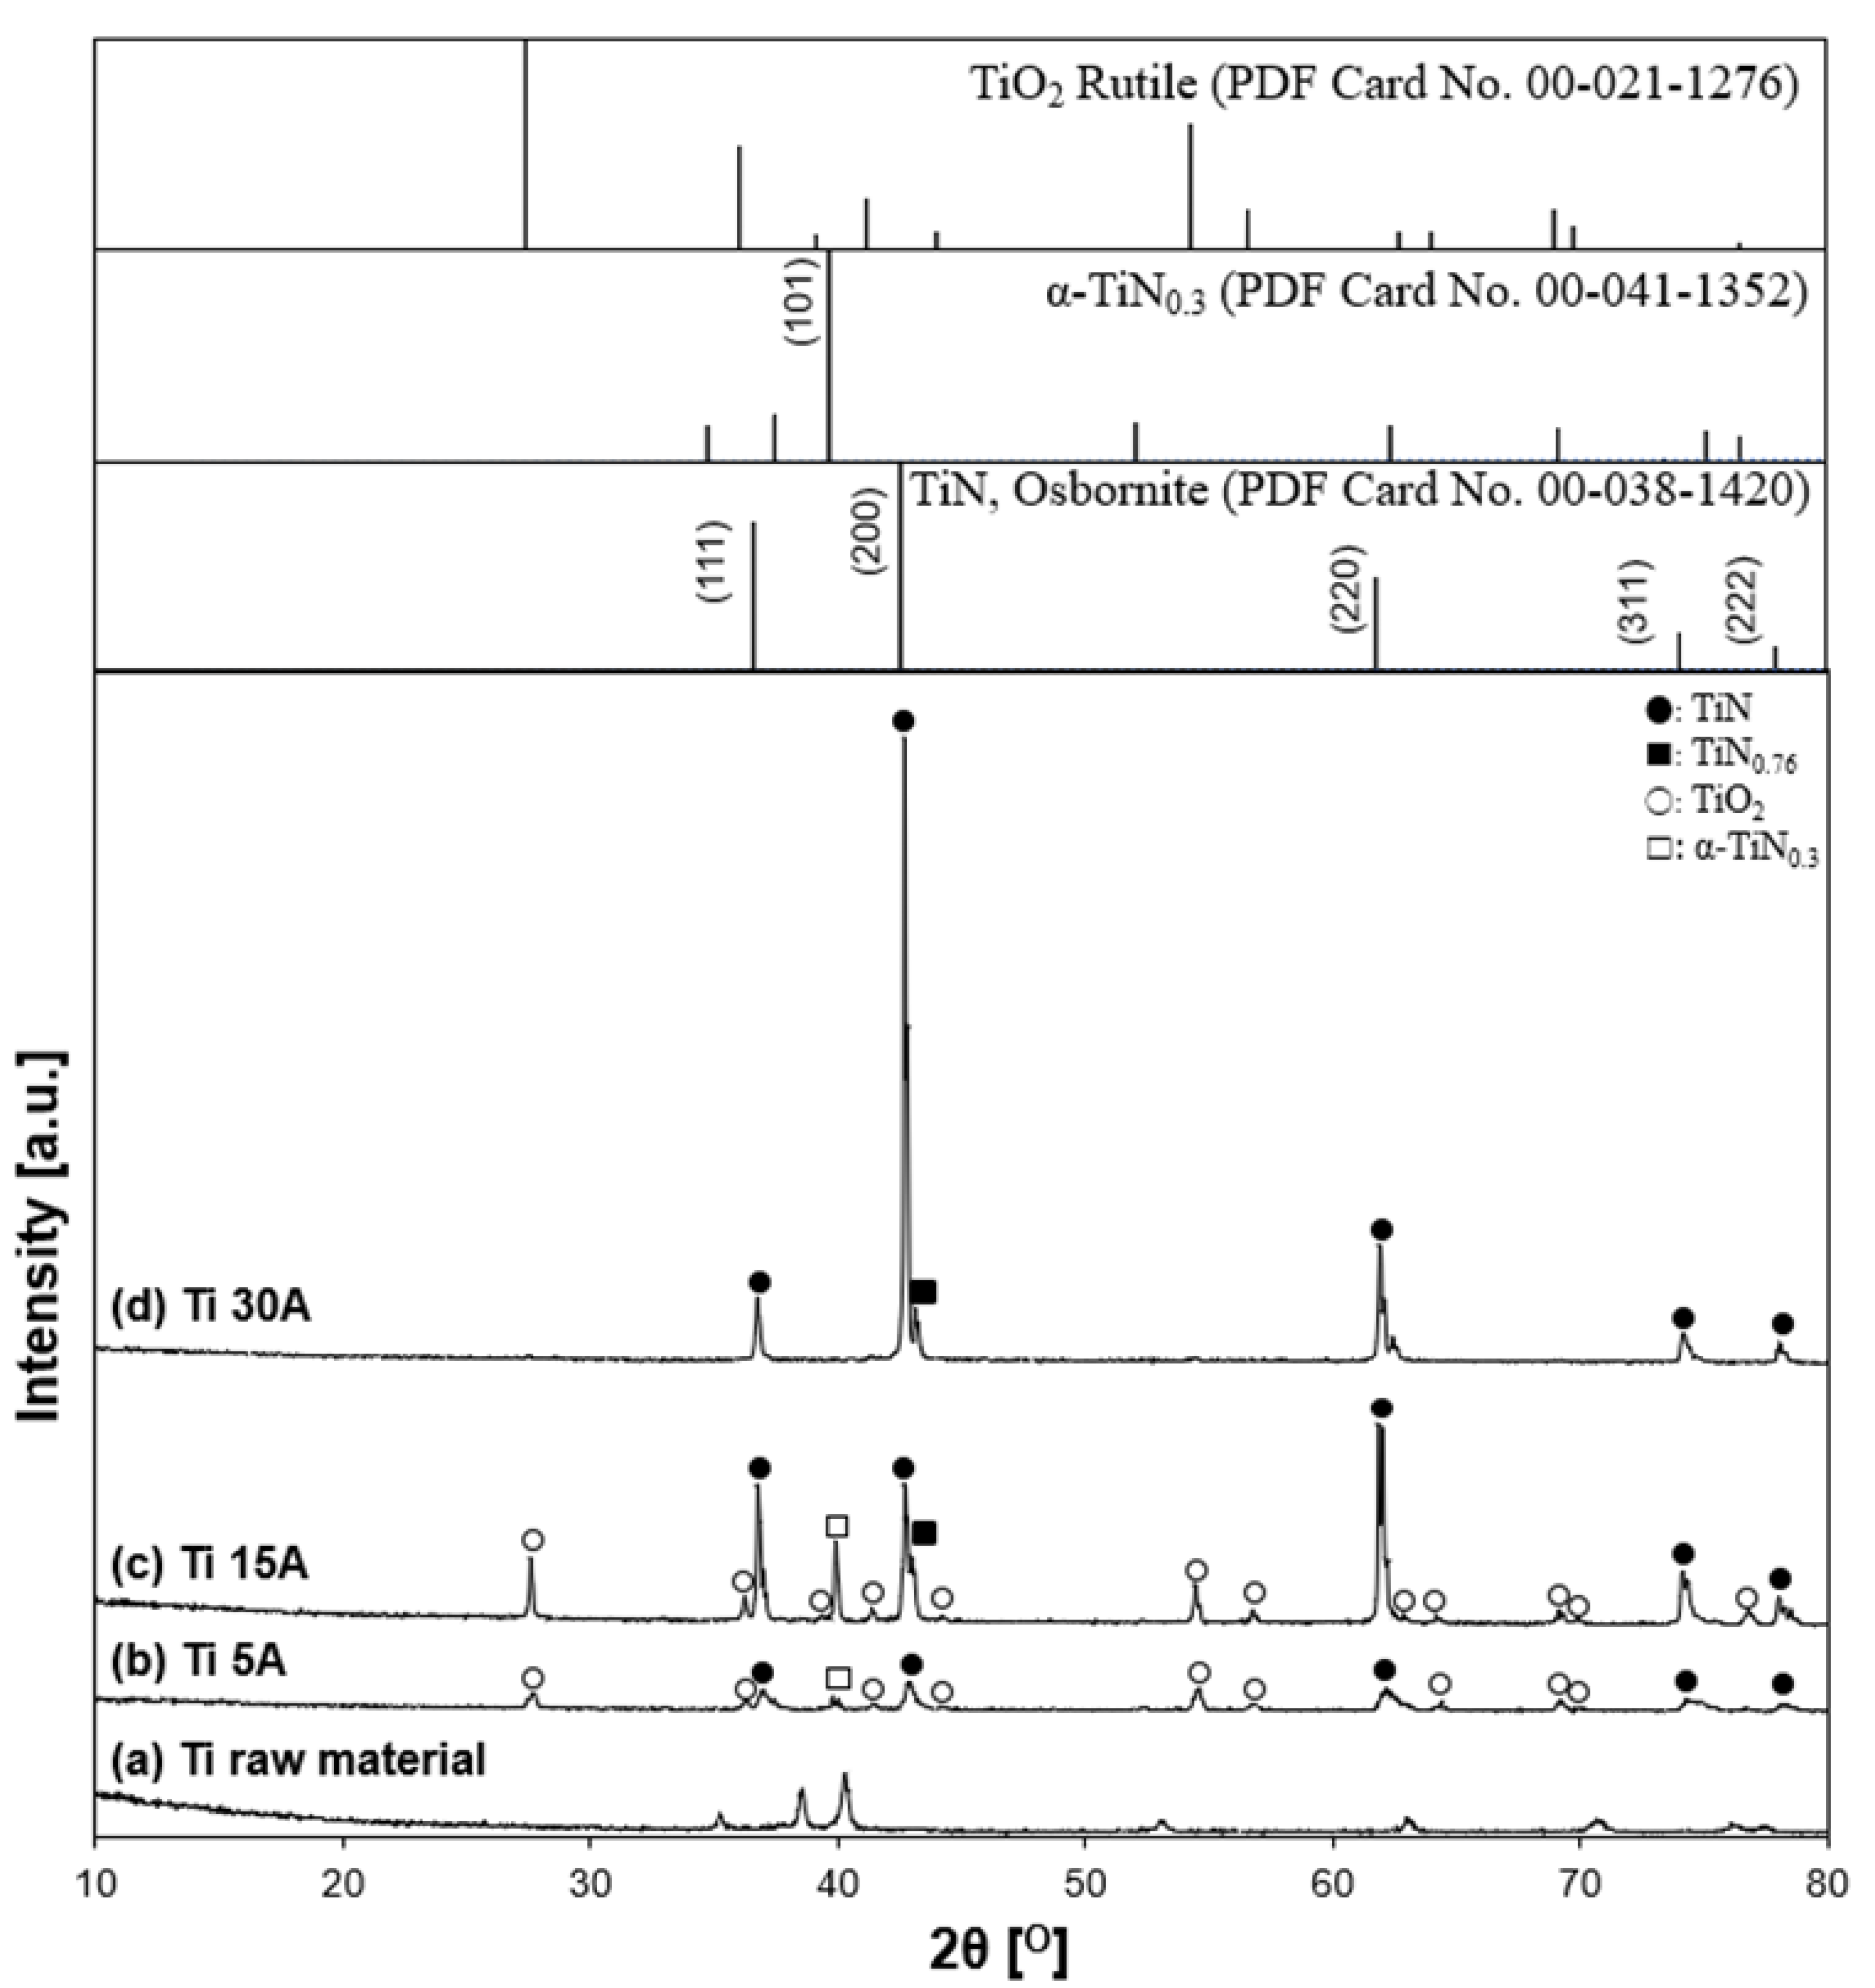
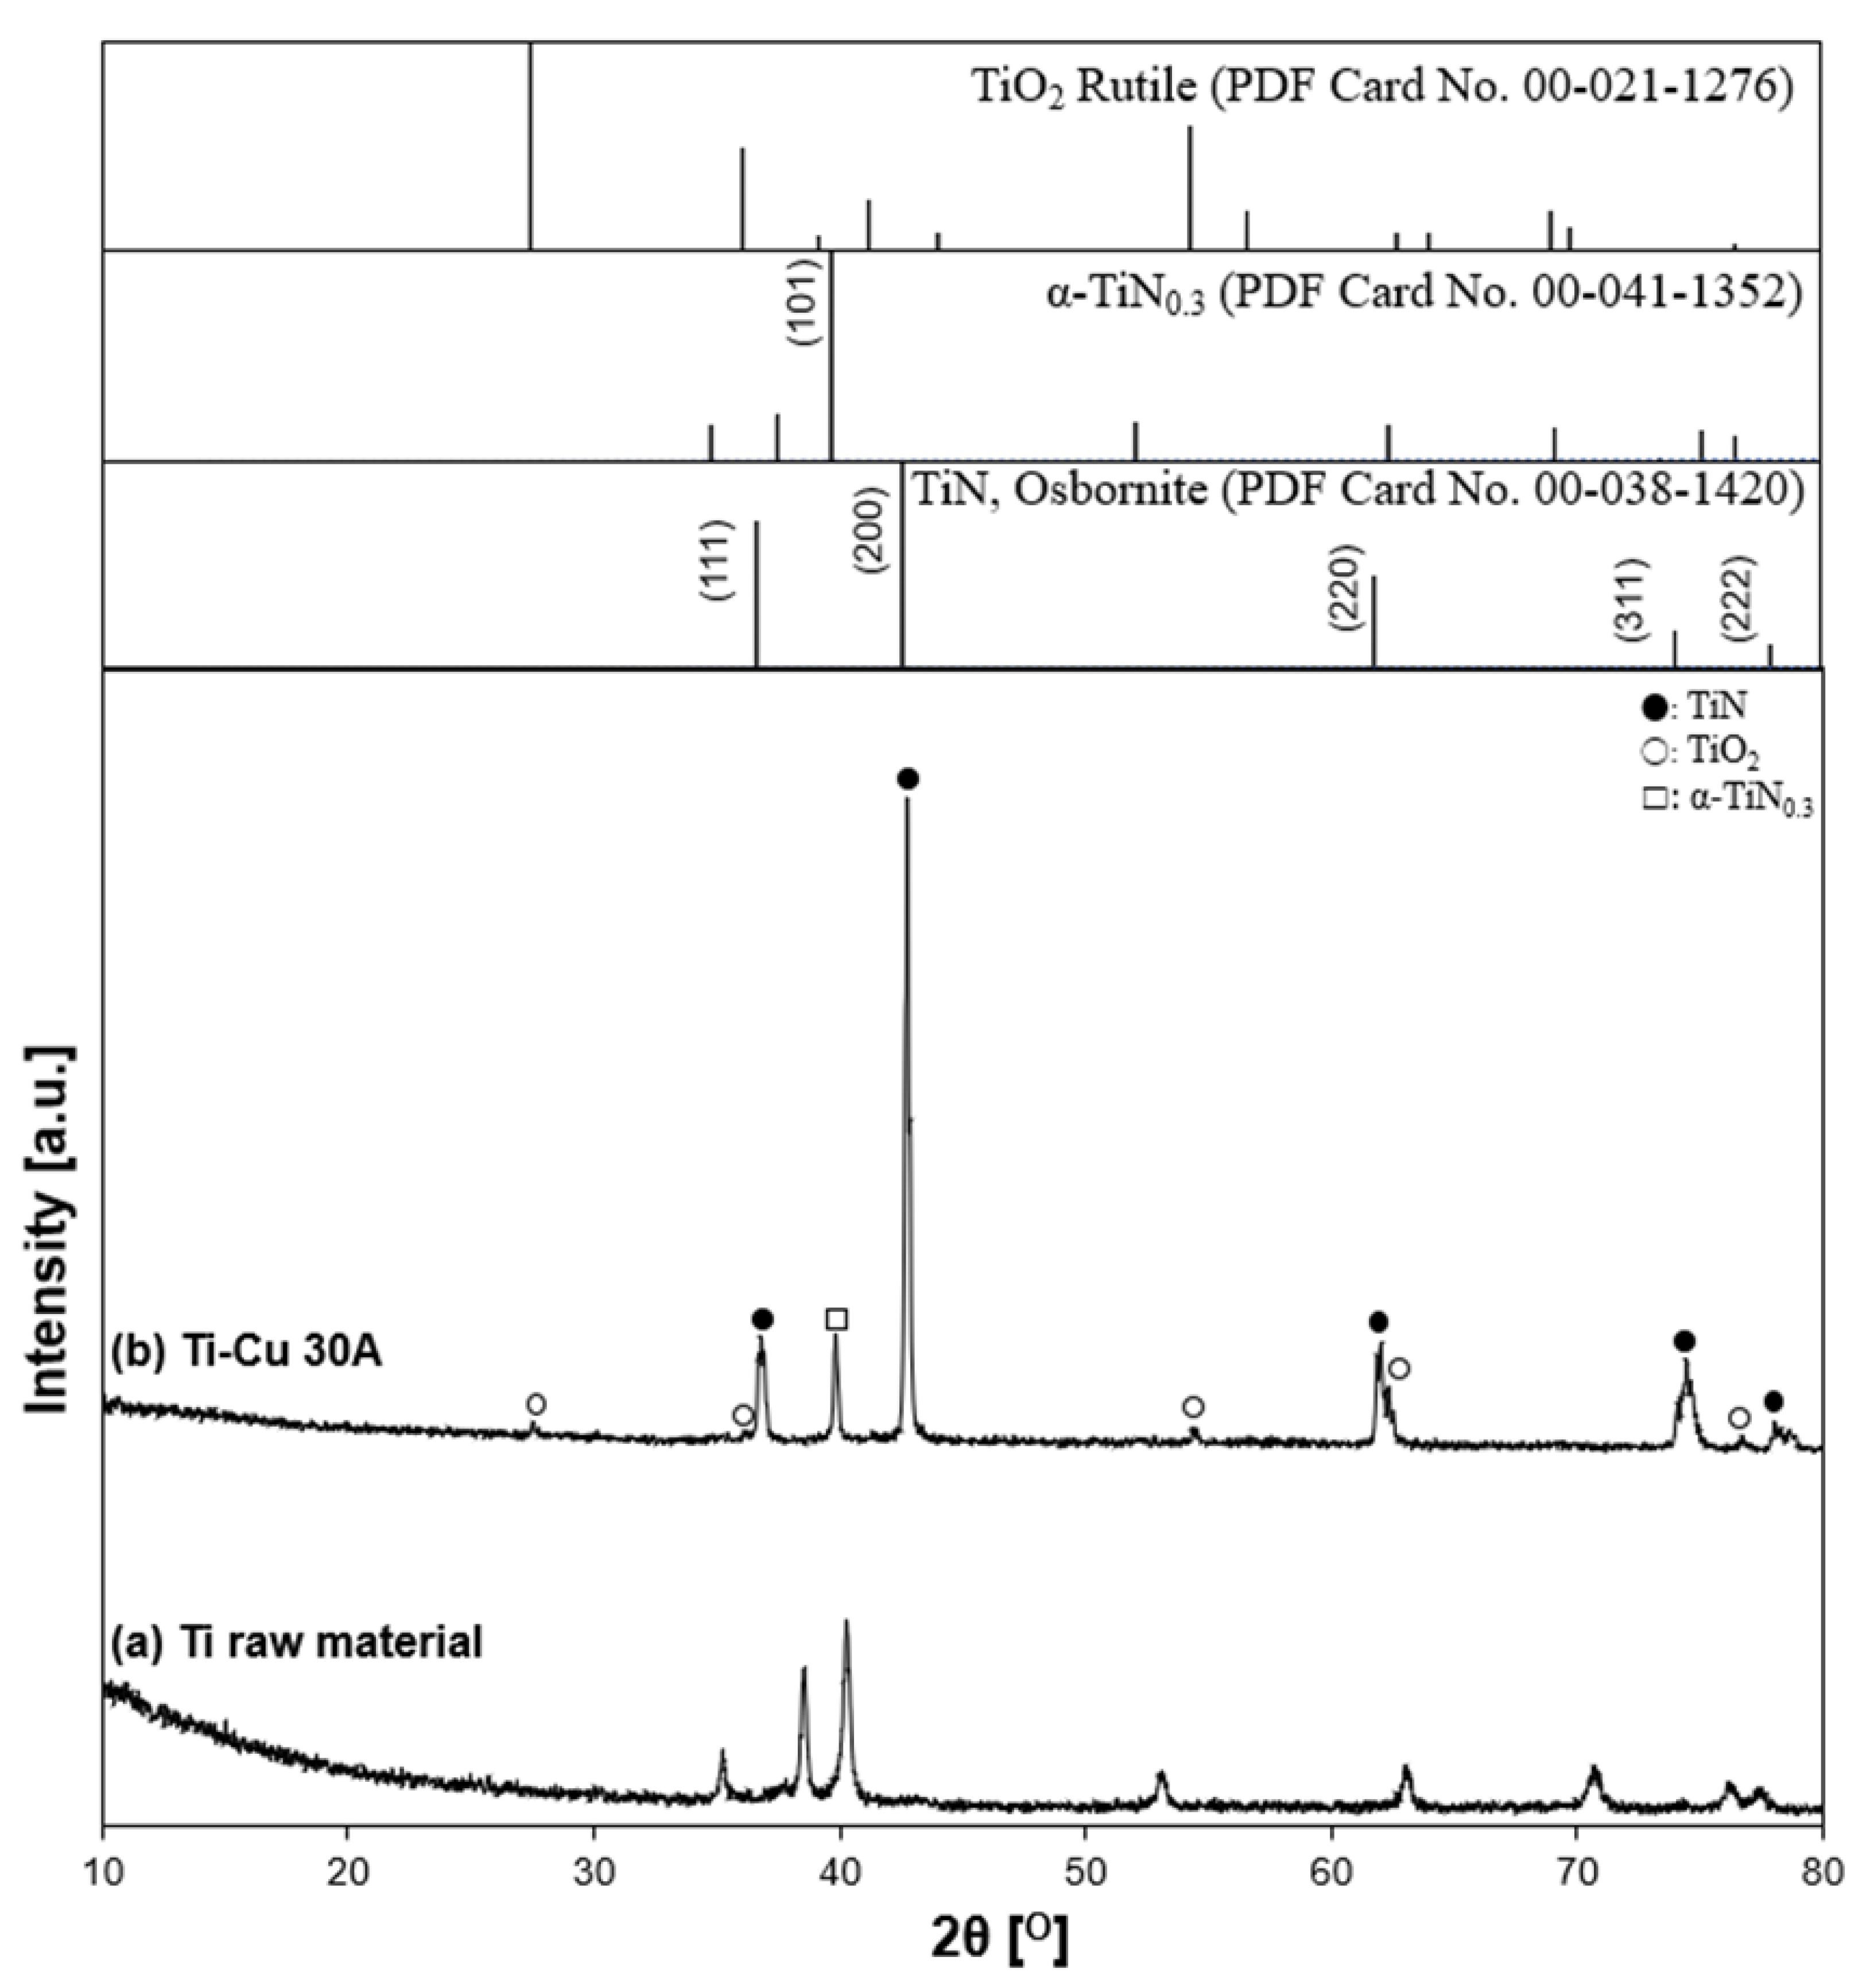
3.2.1. Crystallite Phase of the Synthesized TiN Particles
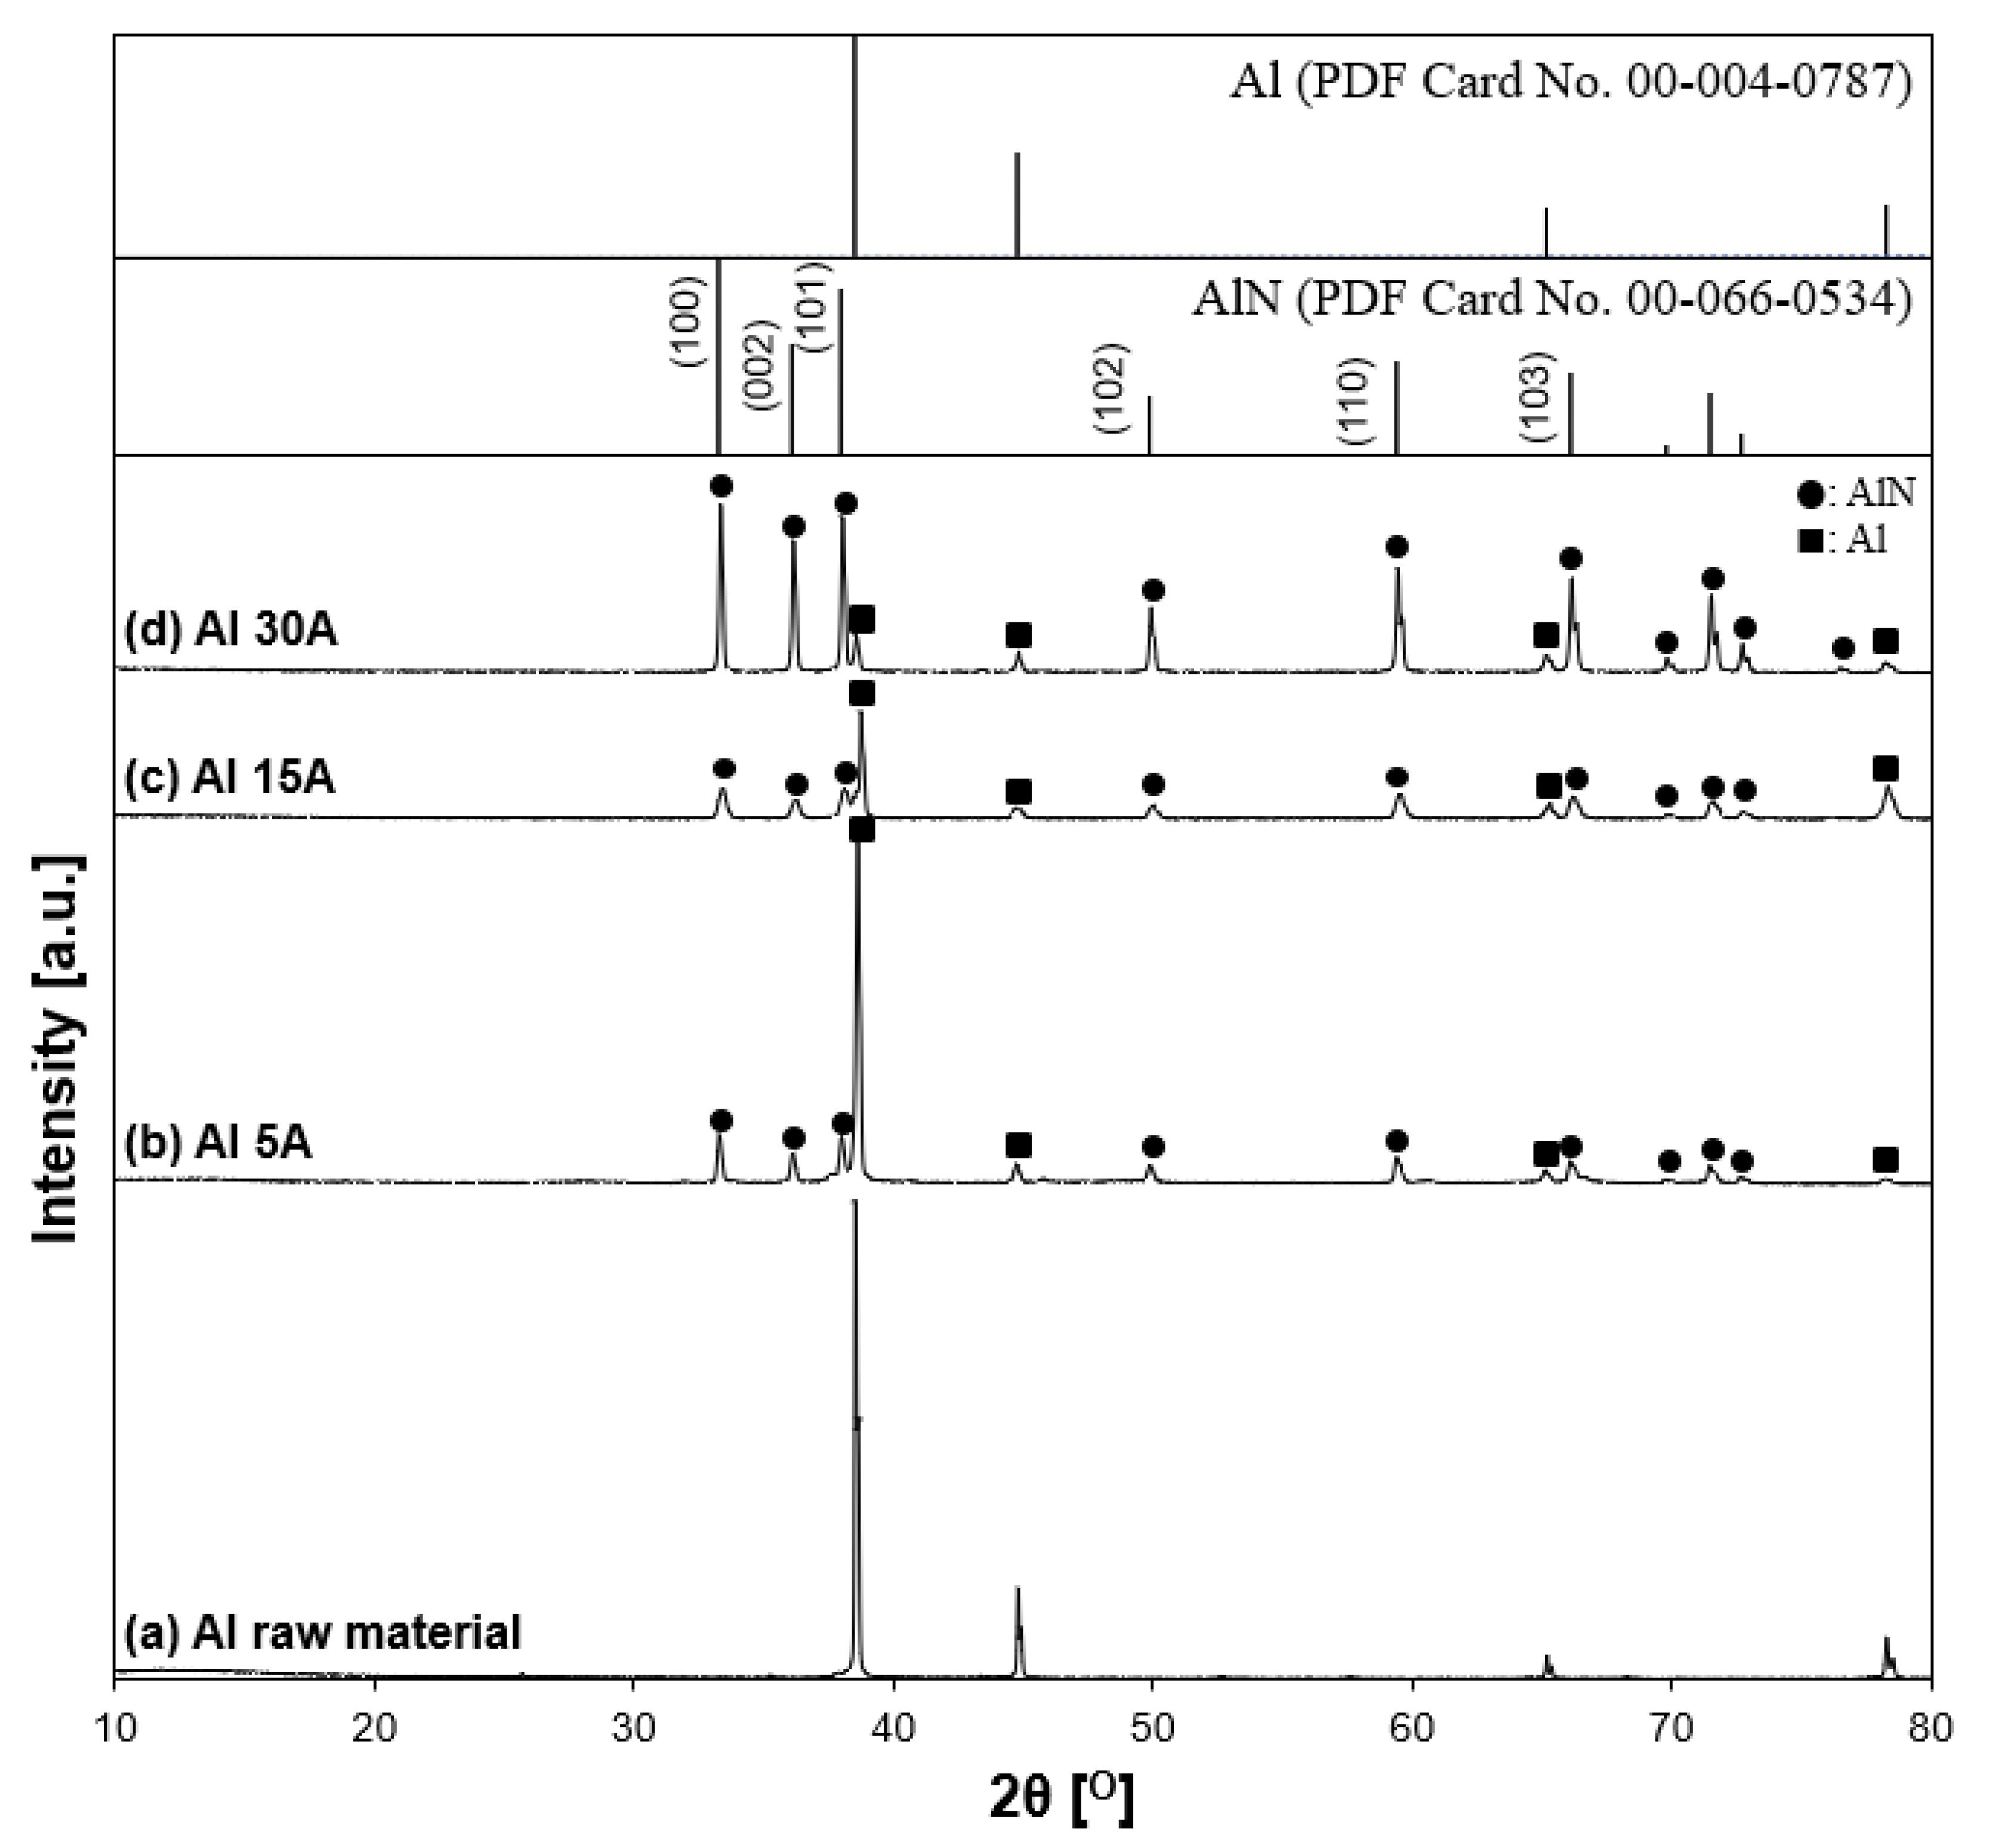
3.2.2. Crystallite Phase of the Synthesized Al/AlN Particles
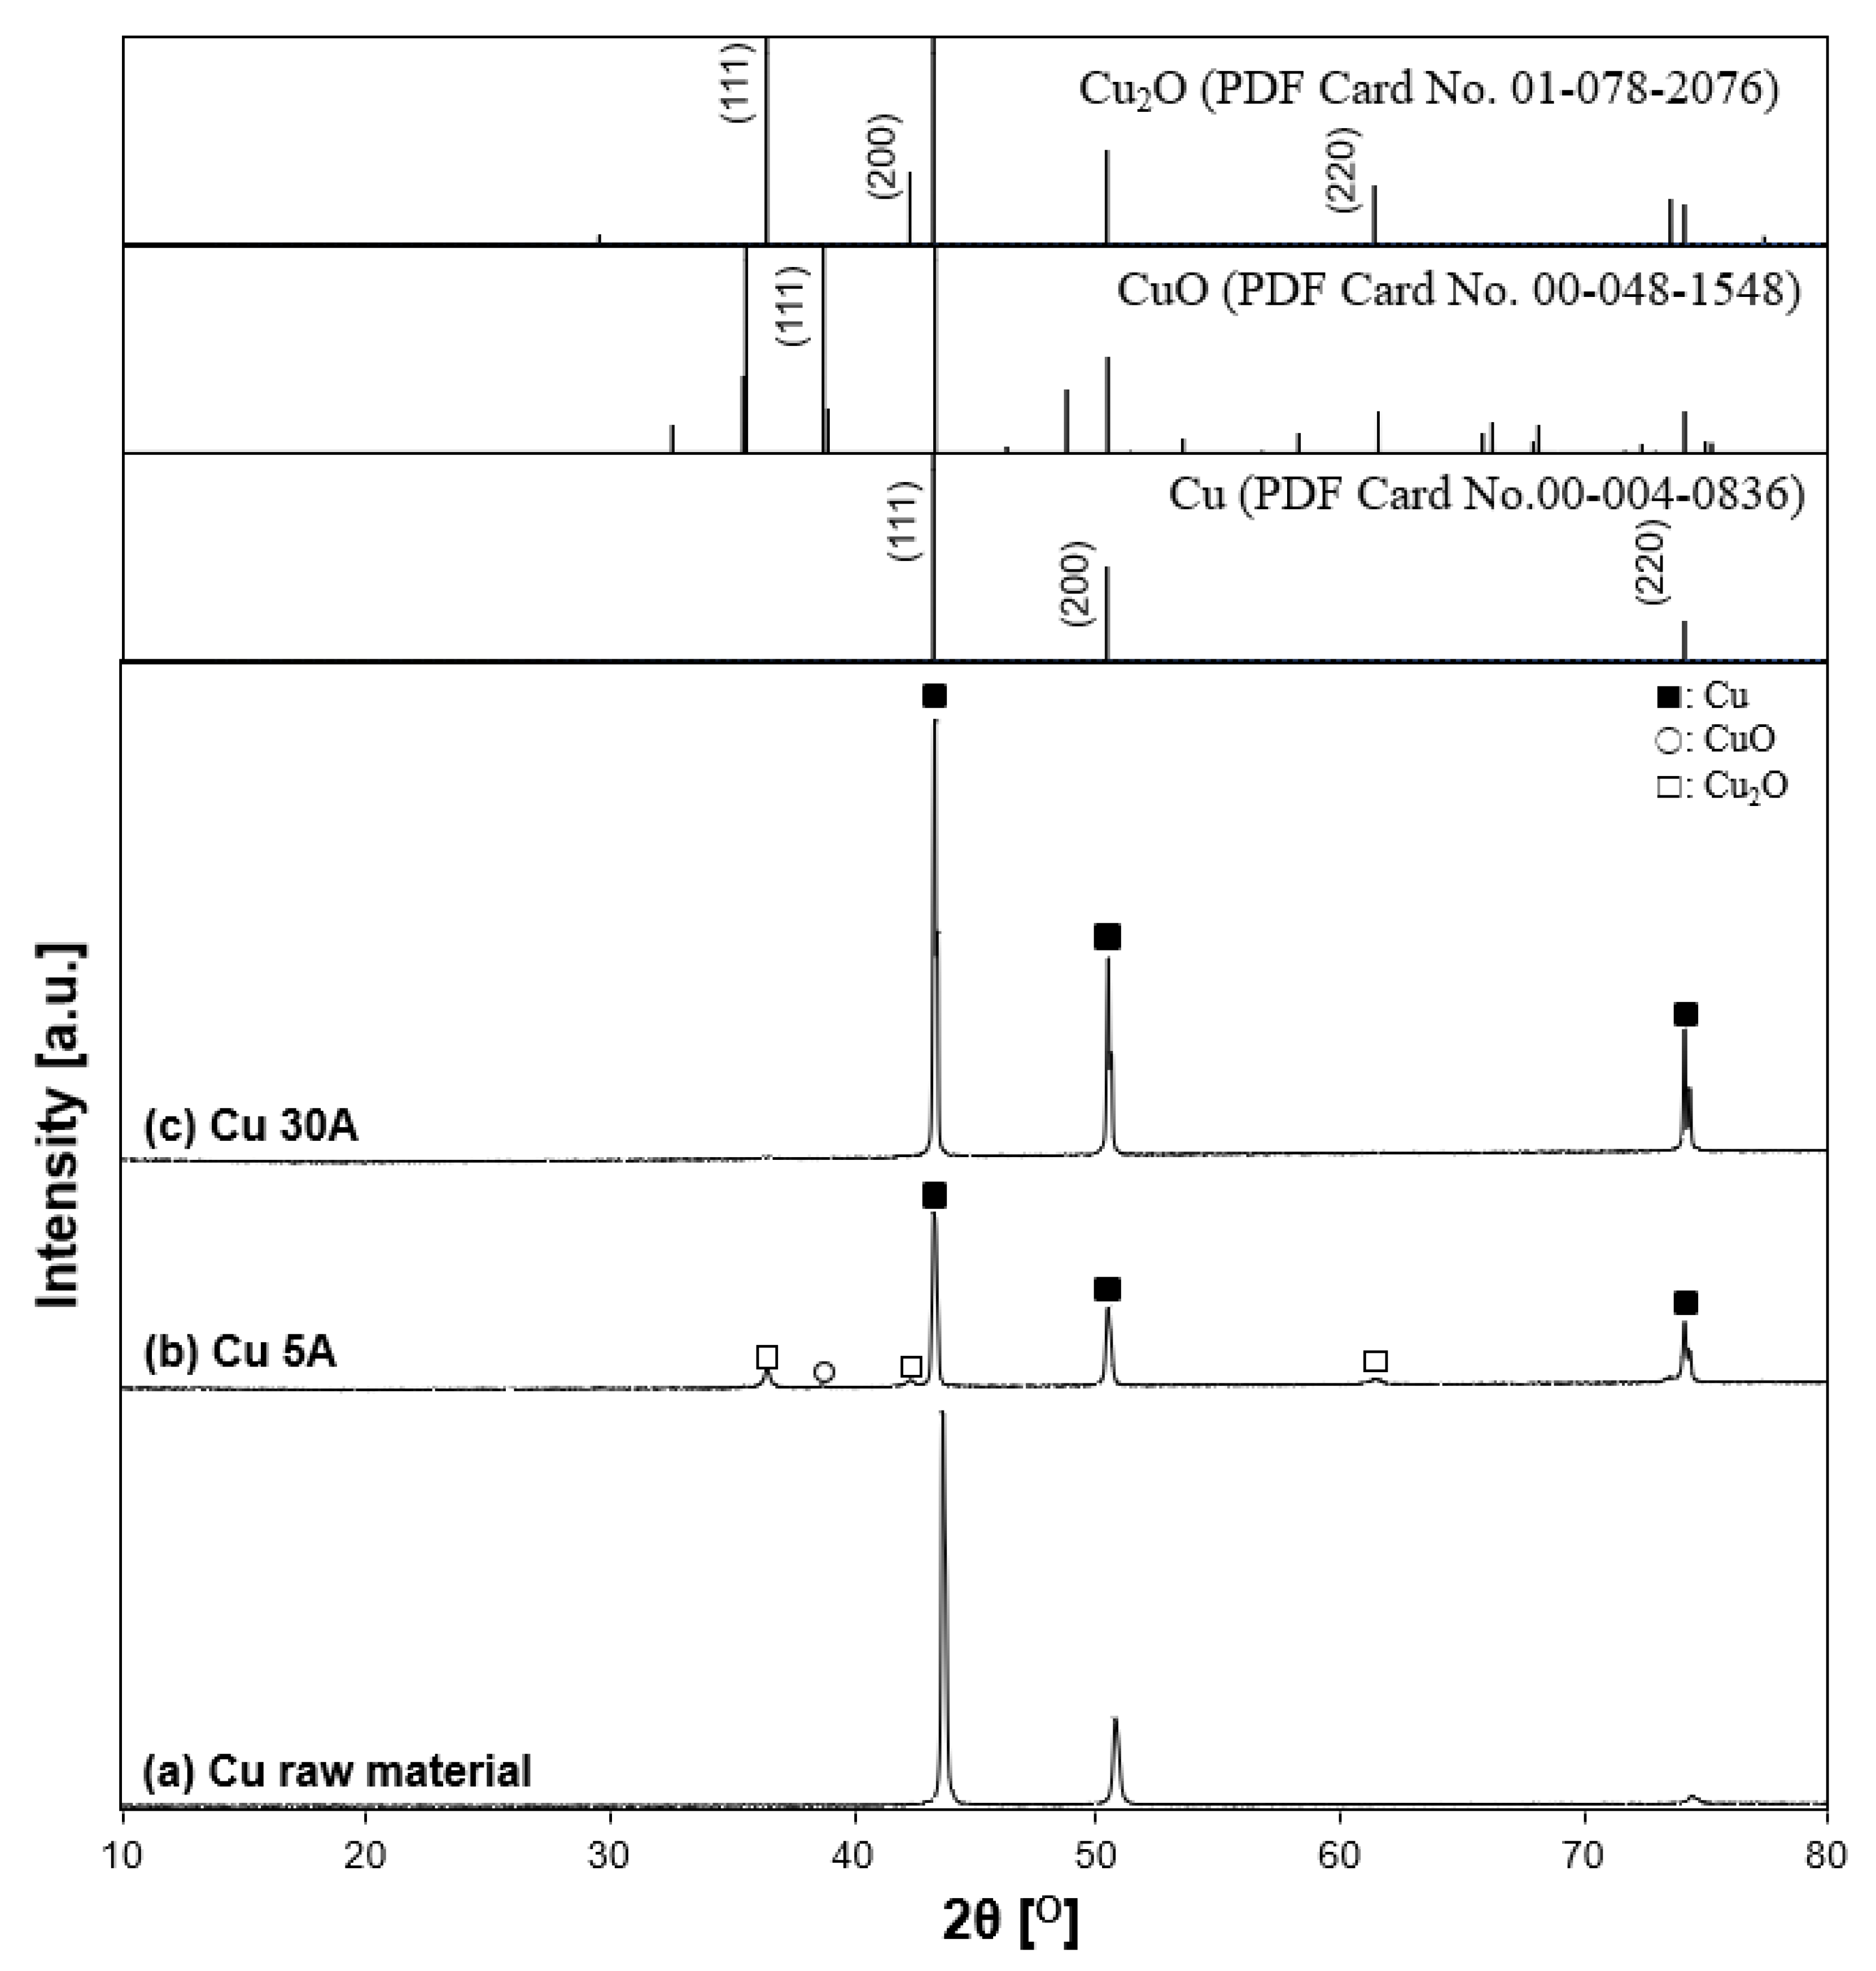
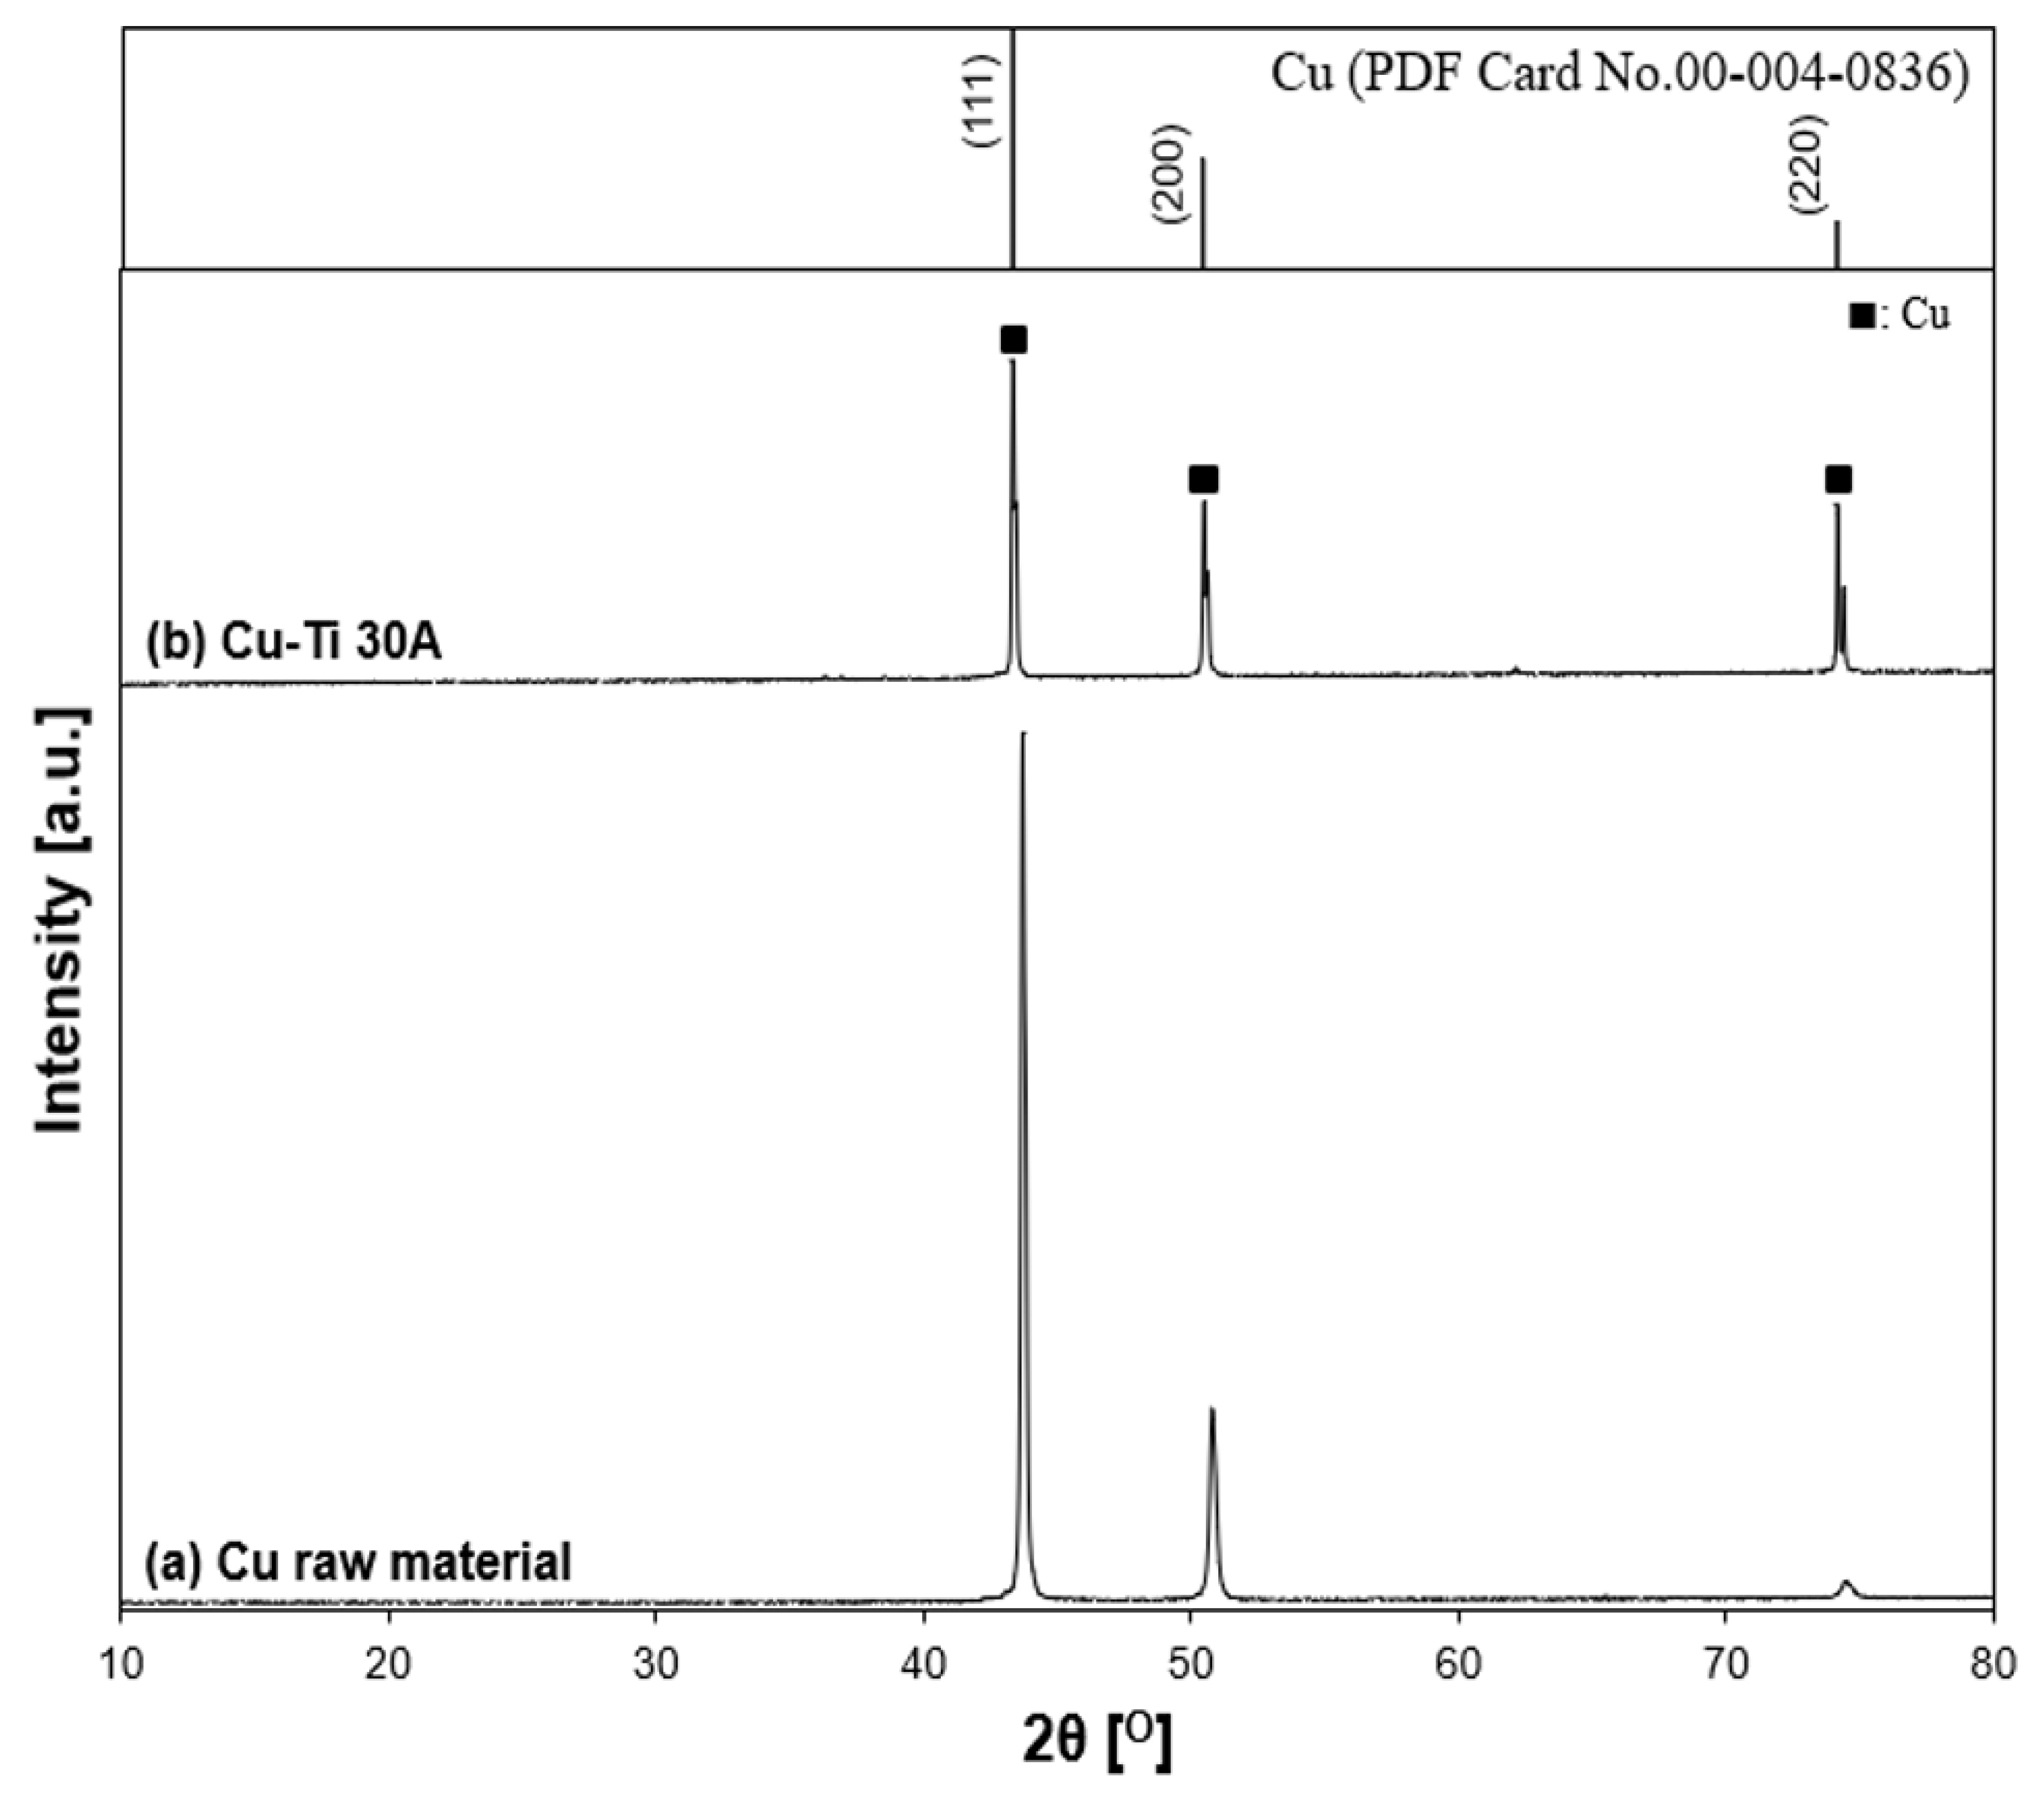
3.2.3. Crystallite Phase of the Prepared Cu Particles
3.3. Particle Preparation Using Different Electrode Combinations
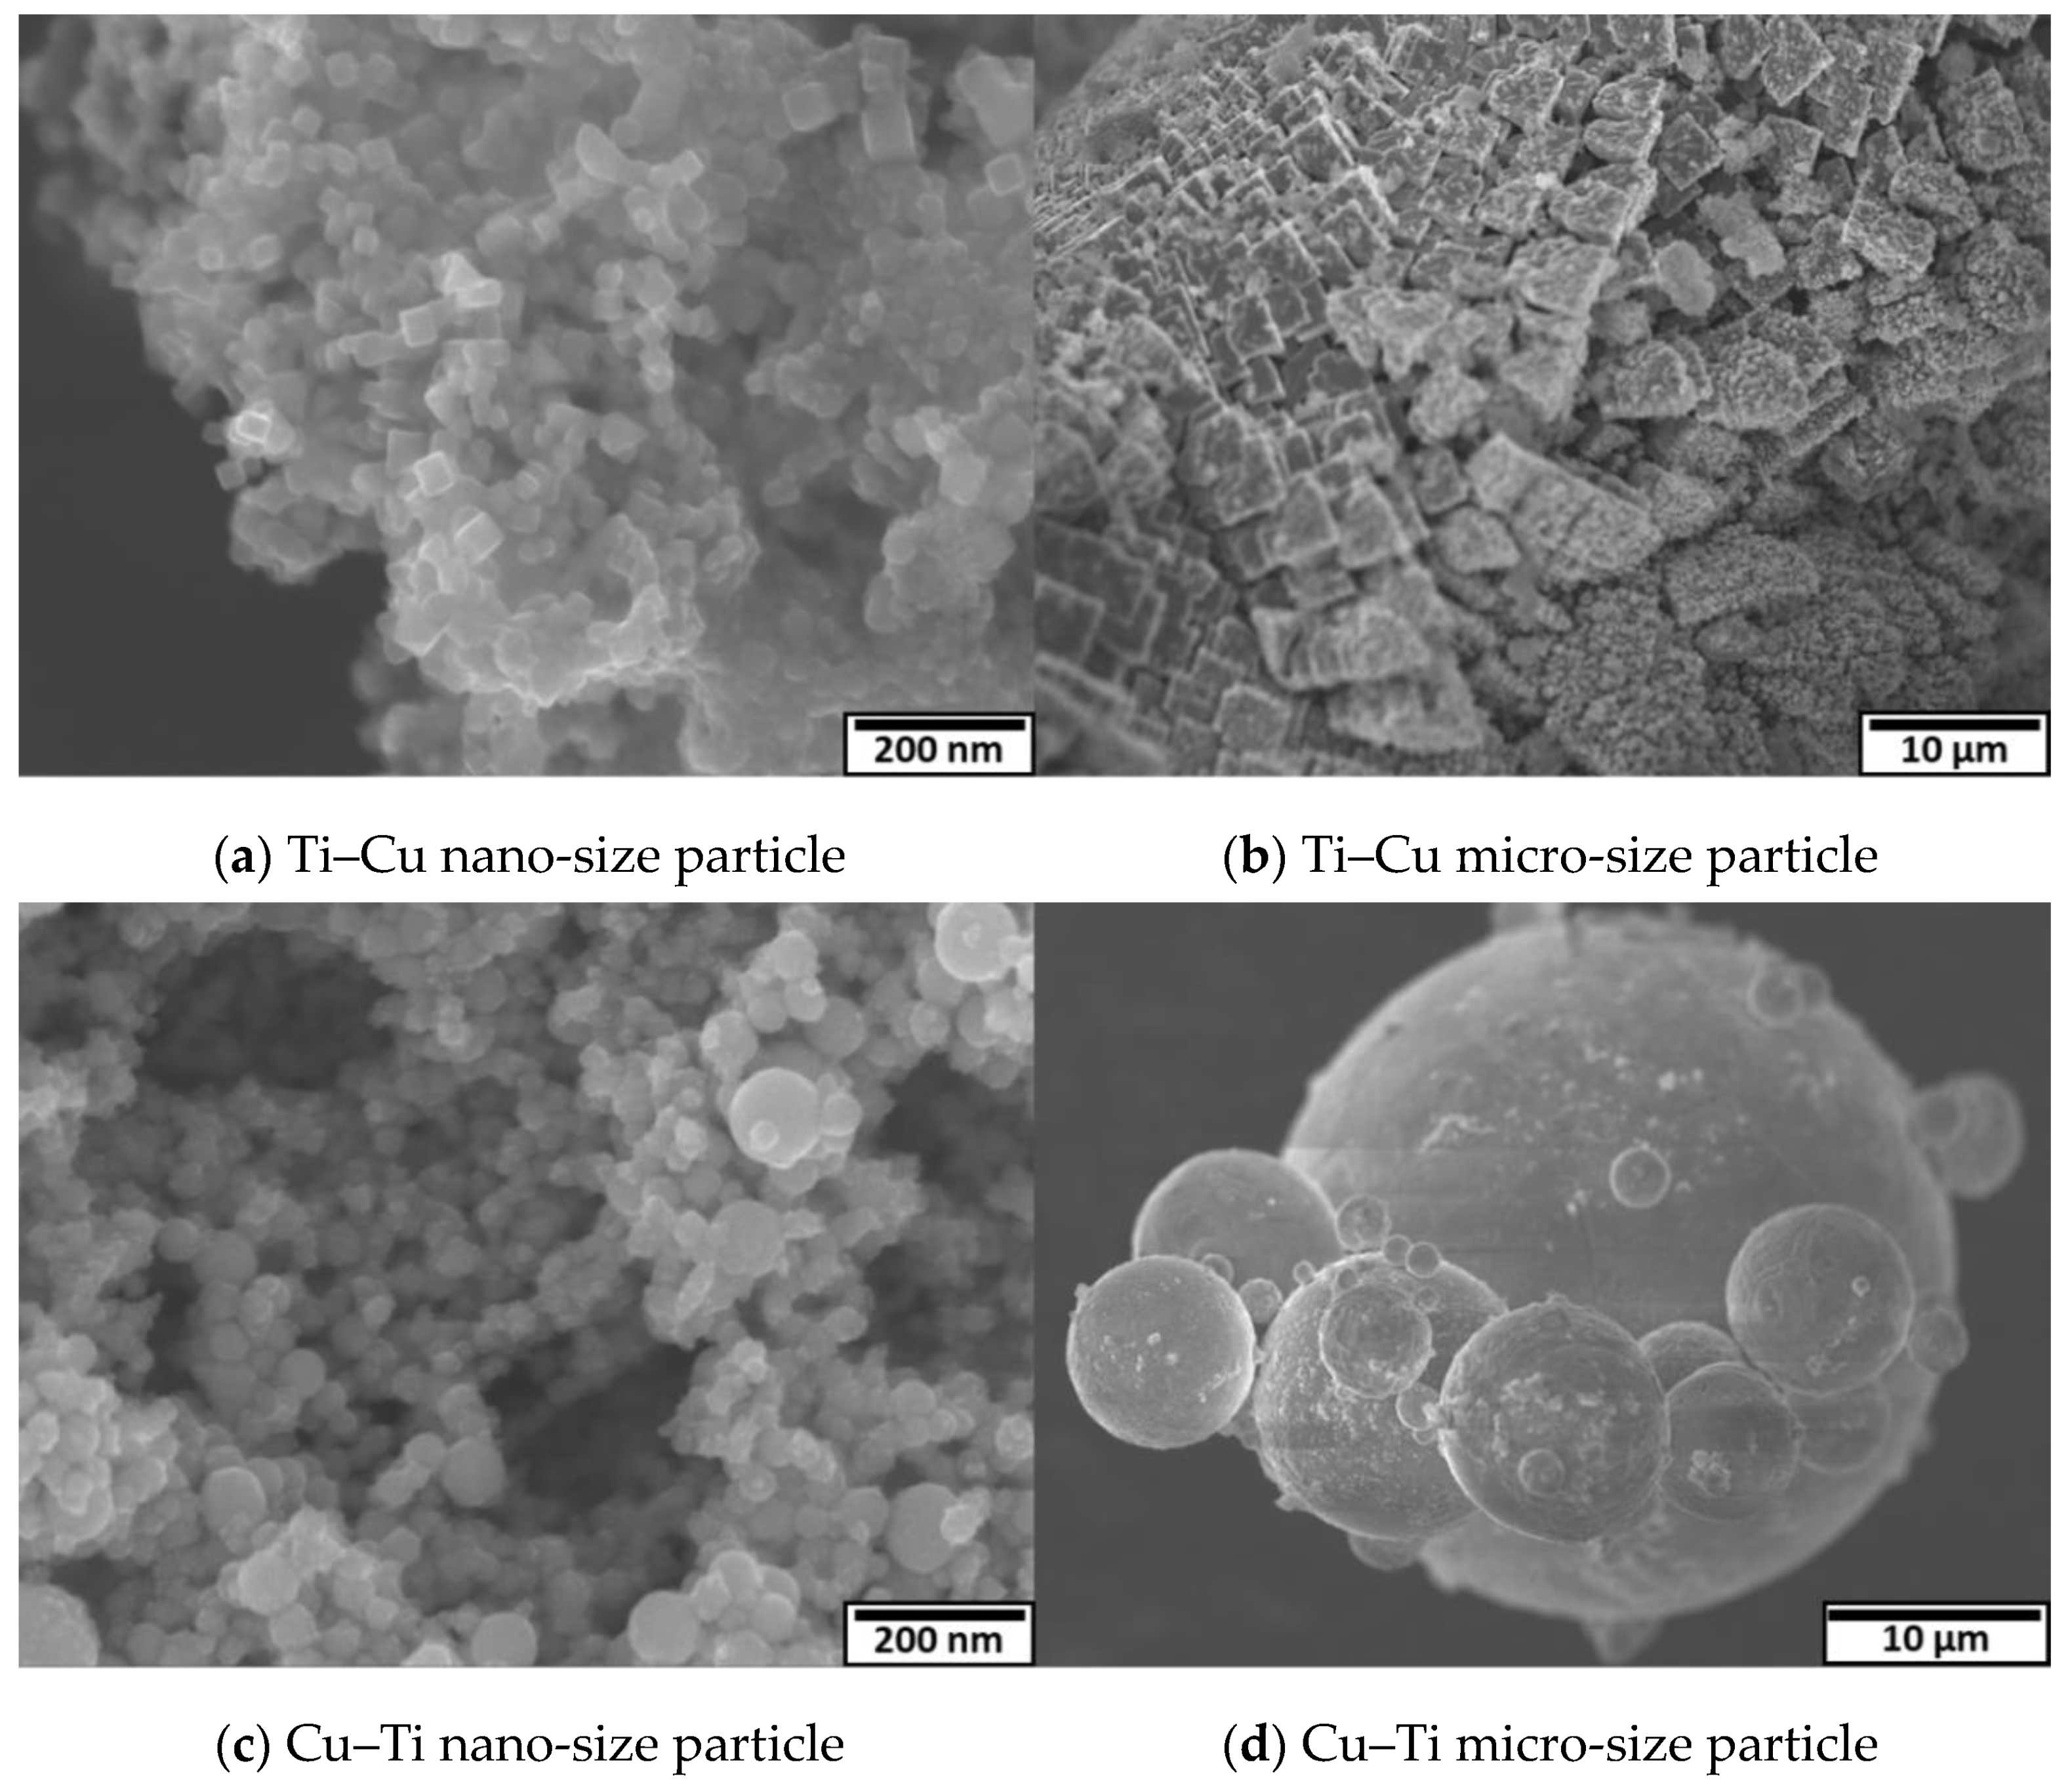
3.3.1. Morphologies of the Prepared Particles
3.3.2. Crystallite Phase of the Synthesized Particles
4. Discussion
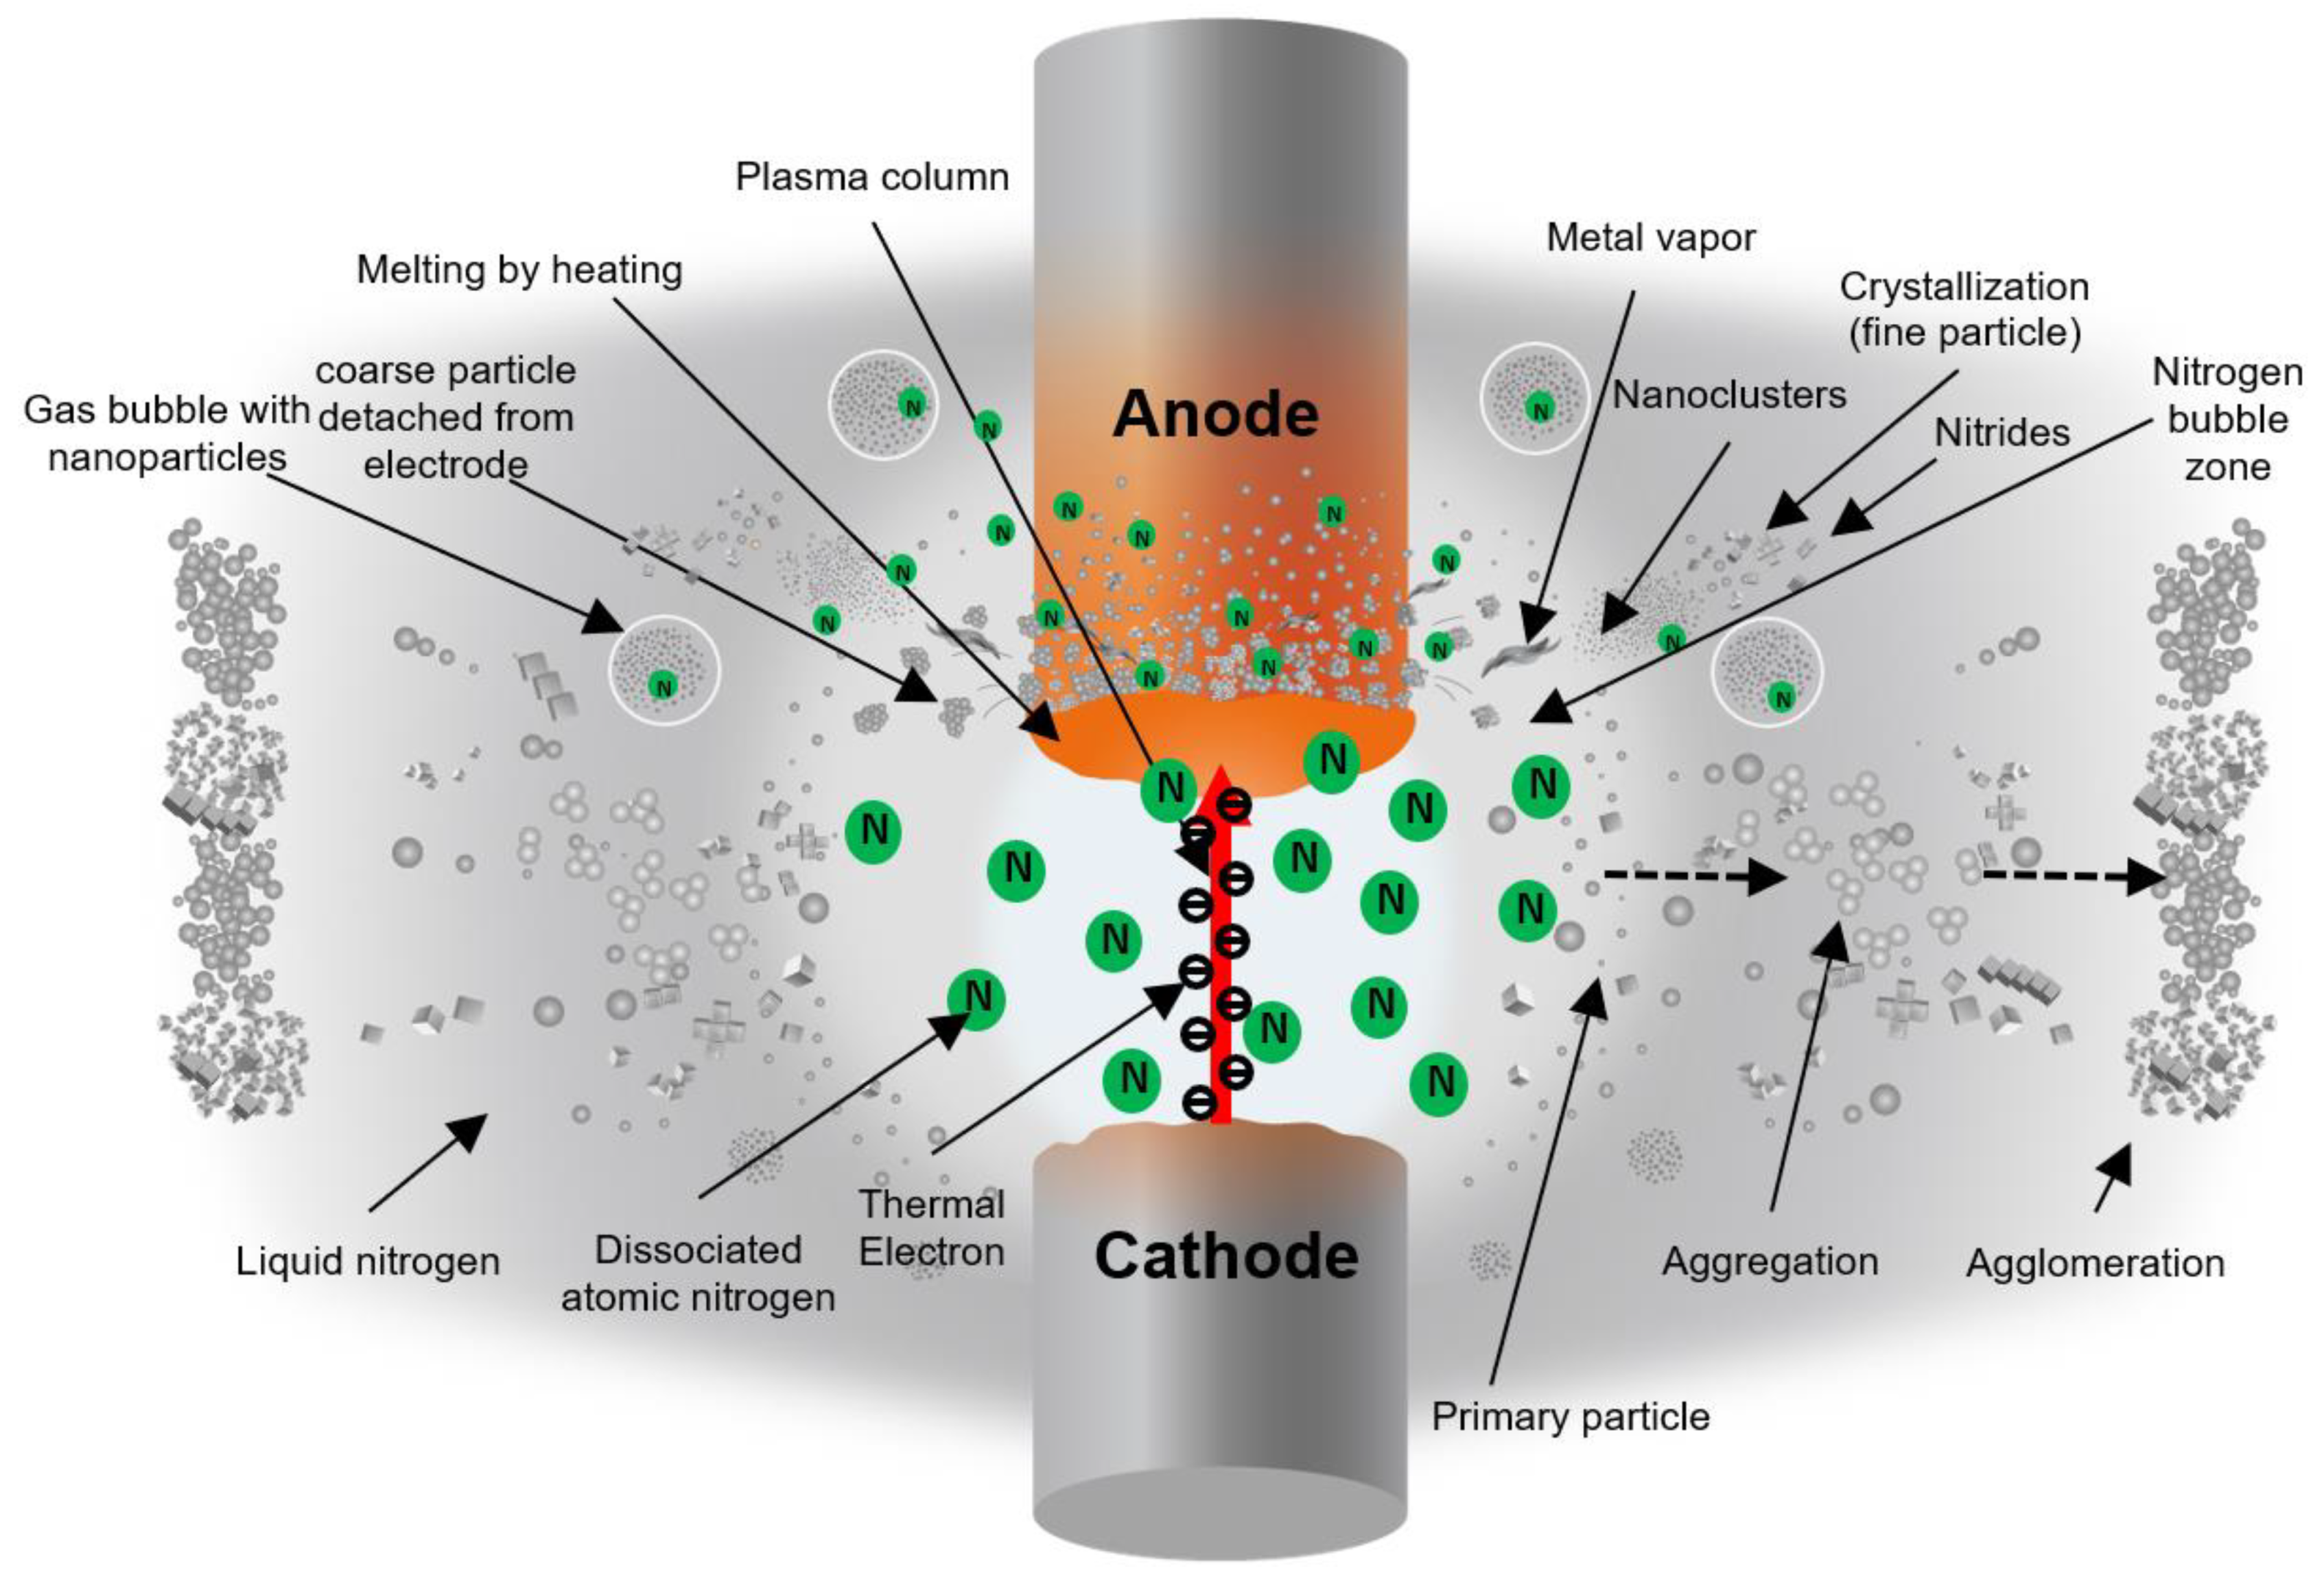
4.1. Mechanism of Formation Phenomena of Nitride Particles
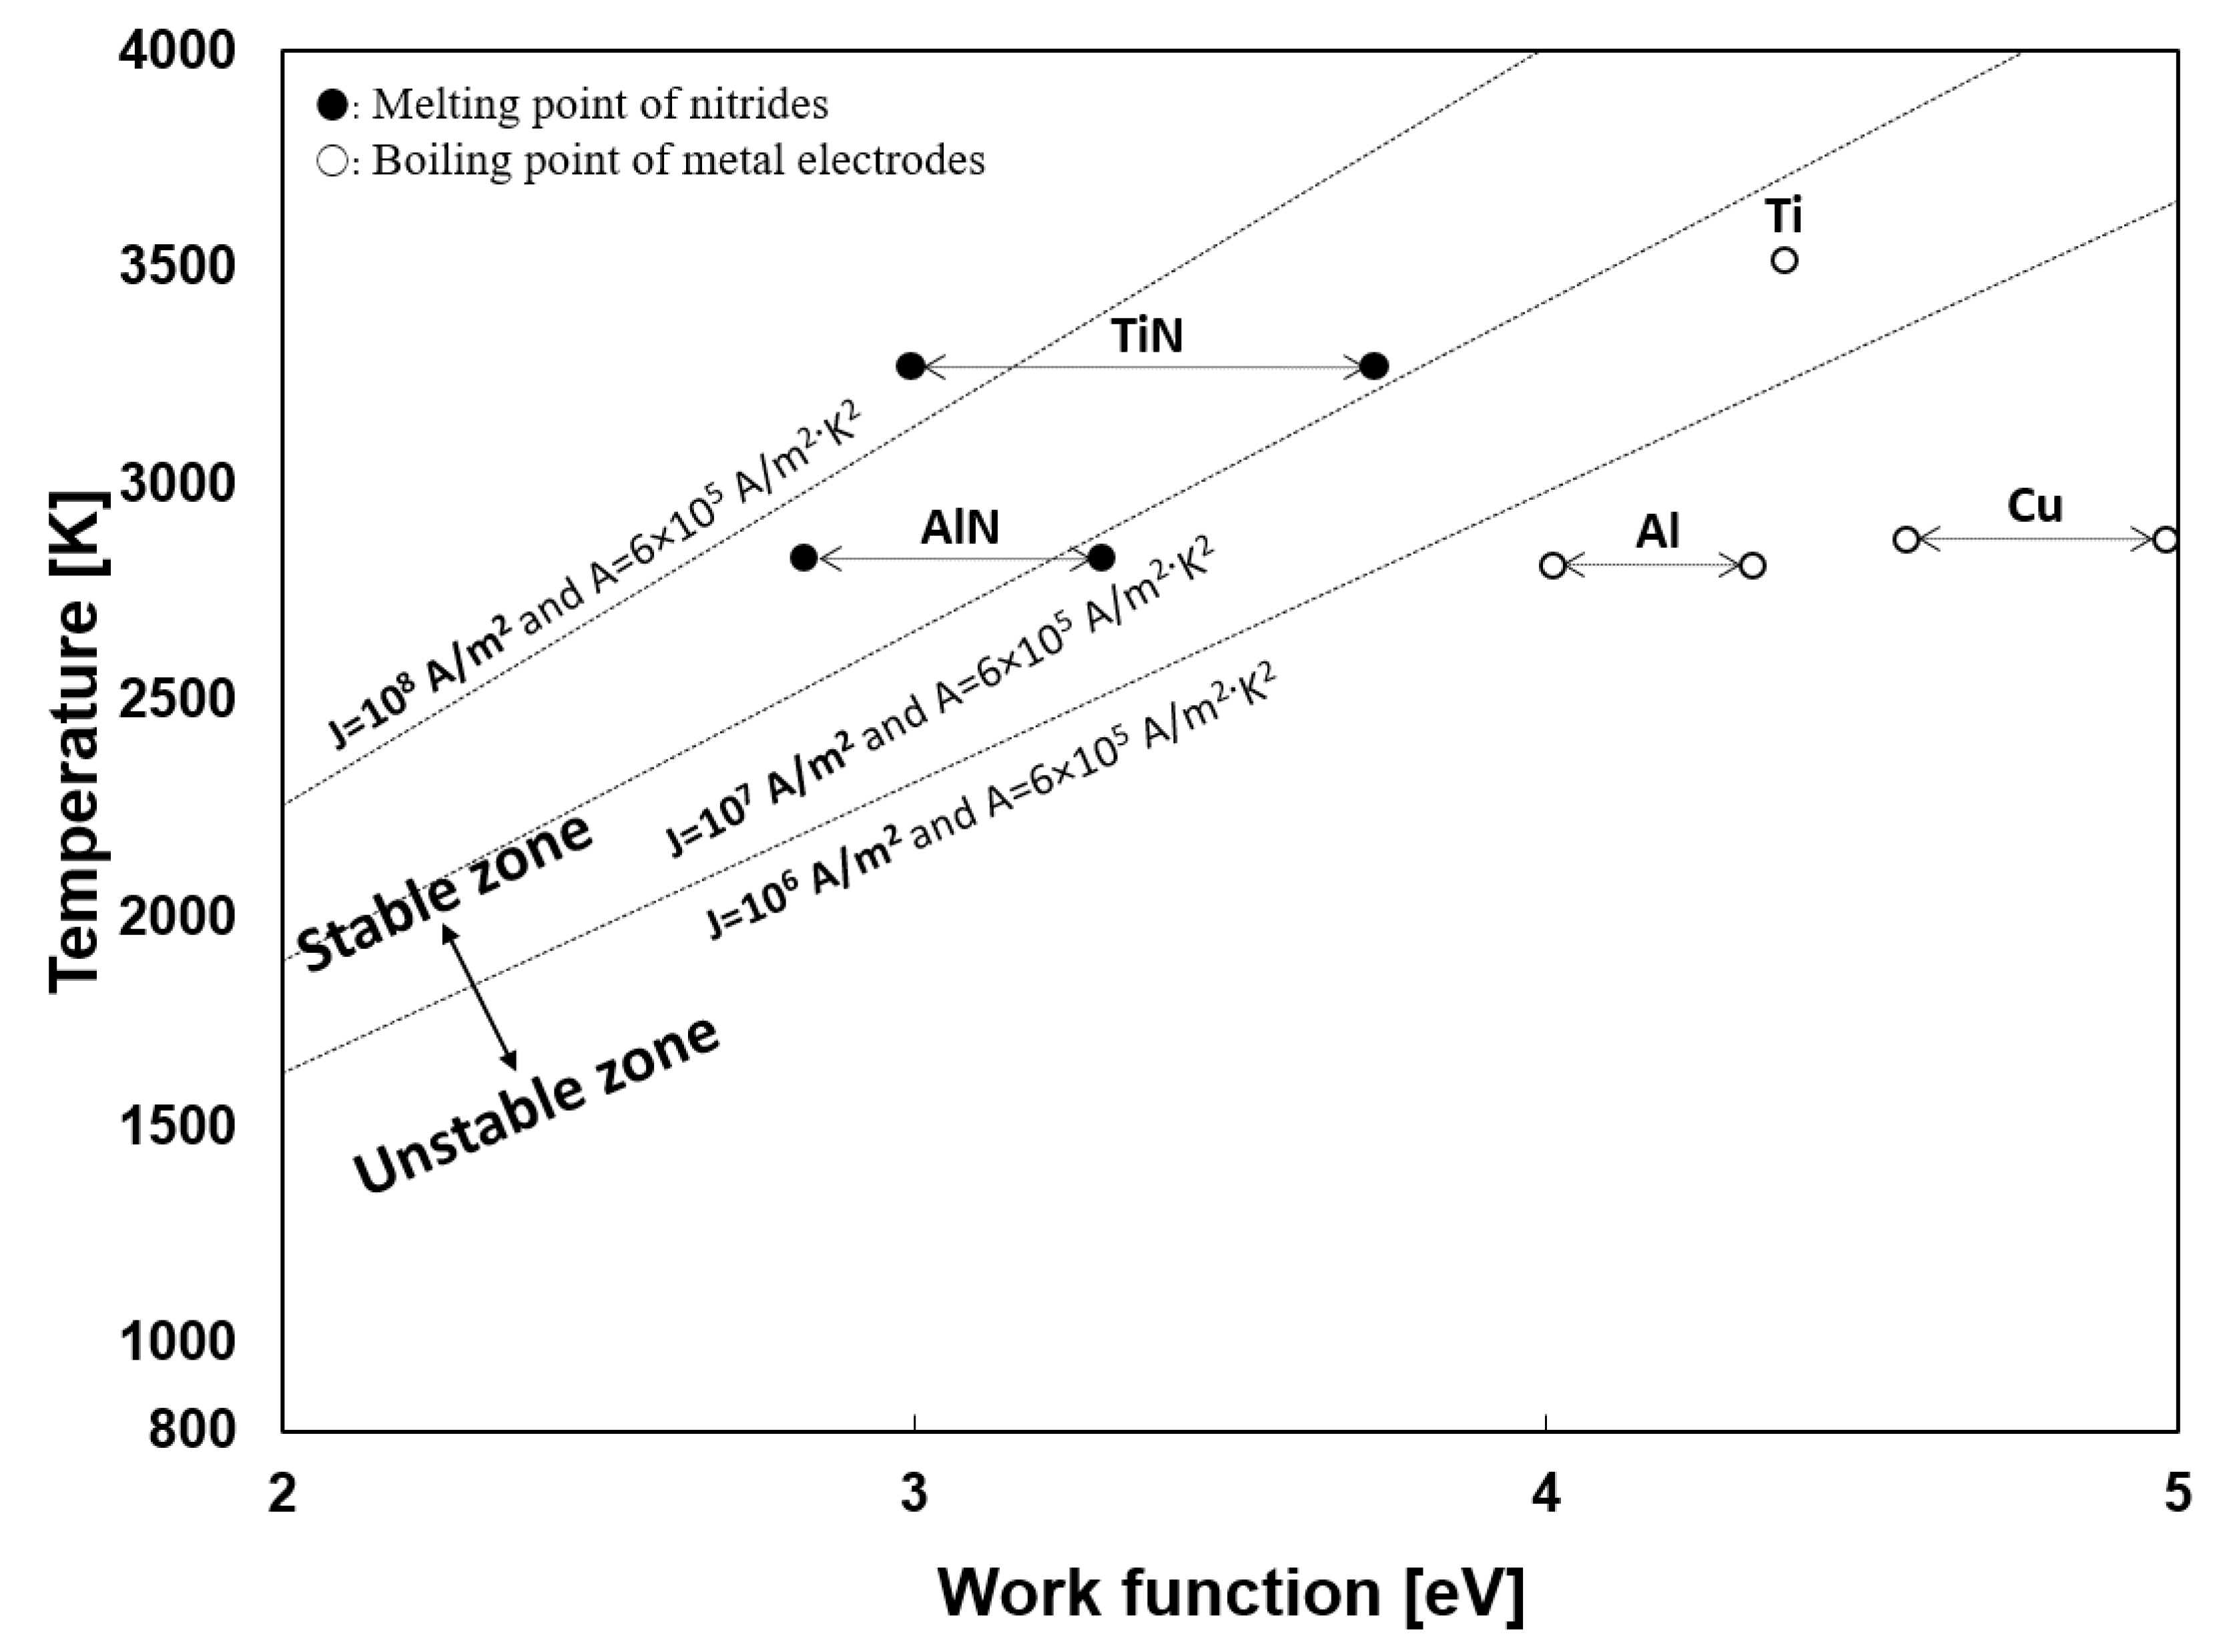
4.2. Thermion Emission from the Cathode
5. Conclusions
Author Contributions
Funding
Conflicts of Interest
References
- Niewa, R.; Disalvo, F.J. Recent developments in nitride chemistry. Chem. Mater. 1998, 10, 2733–2752. [Google Scholar] [CrossRef]
- Marchand, R.; Tessier, F.; DiSalvo, J. New routes to transition metal nitrides: Preparation and characterization of new phases. J. Mater. Chem. 1999, 9, 297–304. [Google Scholar] [CrossRef]
- Selvaduray, G.; Sheet, L. Aluminium nitride: Review of synthesis methods. Mater. Sci. Technol. 1993, 9, 463–473. [Google Scholar] [CrossRef]
- Rasaki, S.A.; Zhang, B.; Anbalgam, K.; Thomas, T.; Yang, M. Synthesis and application of nano-structured metal nitrides and carbides: A review. Prog. Solid State Chem. 2018, 50, 1–15. [Google Scholar] [CrossRef]
- Hargreaves, J.S.J. Heterogeneous catalysis with metal nitrides. Coord. Chem. Rev. 2013, 257, 2015–2031. [Google Scholar] [CrossRef]
- Dongil, A.B. Recent progress on transition metal nitrides nanoparticles as heterogeneous catalysts. Nanomaterials 2019, 9, 1111. [Google Scholar] [CrossRef]
- Niewa, R.; Jacobs, H. Group V and VI alkali nitride metalates: A growing class of compounds with structures related to silicate chemistry. Chem. Rev. 1996, 96, 2053–2062. [Google Scholar] [CrossRef] [PubMed]
- Asgraf, I.; Iqbal, M. A comprehensive review on the synthesis and energy applications of nano-structured metal nitrides. Front. Mater. 2020, 7, 181. [Google Scholar] [CrossRef]
- Oh, S.M.; Park, D.W. Preparation of AlN fine powder by thermal plasma processing. Thin Solid Films 1998, 316, 189–194. [Google Scholar] [CrossRef]
- Kim, T.H.; Choi, S.S.; Park, D.W. Effects of NH3 flow rate on the thermal plasma synthesis of AlN nanoparticles. J. Korean Phys. Soc. 2013, 63, 1864–1870. [Google Scholar] [CrossRef]
- Bora, B.; Aomoa, N.; Kakati, M.; Bhuyan, H. Studies on a supersonic thermal plasma expansion process for synthesis of titanium nitride nanoparticles. Powder Technol. 2013, 246, 413–418. [Google Scholar] [CrossRef]
- Kakati, M.; Bora, B.; Sarma, S.; Saikia, B.J.; Shripathi, T.; Deshpande, U.; Dubey, A.; Ghosh, G.; Das, A.K. Synthesis of titanium oxide and titanium nitride nano-particles with narrow size distribution by supersonic thermal plasma expansion. Vacuum 2008, 82, 833–841. [Google Scholar] [CrossRef]
- Antipas, G.S.E. Plasma-spray Synthesis and Characterization of Ti-based Nitride and Oxide Nanogranules. Mater. Res. 2014, 17, 1213–1218. [Google Scholar] [CrossRef][Green Version]
- Saito, G.; Akiyama, T. Nanomaterial synthesis using plasma generation in liquid. J. Nanomater. 2015, 16, 123696. [Google Scholar] [CrossRef]
- Chen, Q.; Li, J.; Li, Y. A review of plasma–liquid interactions for nanomaterial synthesis. J. Phys. D Appl. Phys. 2015, 48, 424005. [Google Scholar] [CrossRef]
- Allagui, A.; Baranova, E.A.; Wüthrich, R. Synthesis of Ni and Pt nanomaterials by cathodic contact glow discharge electrolysis in acidic and alkaline media. Electrochim. Acta 2013, 93, 137. [Google Scholar] [CrossRef]
- Xie, S.Y.; Ma, Z.J.; Wang, C.F.; Lin, S.C.; Jiang, Z.Y.; Huang, R.B.; Zheng, L.S. Preparation and self-assembly of copper nanoparticles via discharge of copper rod electrodes in a surfactant solution: A combination of physical and chemical processes. J. Solid State Chem. 2004, 177, 3743. [Google Scholar] [CrossRef]
- Levchenko, I.; Bazaka, K.; Baranov, O.; Sankaran, R.M.; Nomine, A.; Belmonte, T.; Xu, S. Lightning under water: Diverse reactive environments and evidence of synergistic effects for material treatment and activation. Appl. Phys. Rev. 2018, 5, 021103. [Google Scholar] [CrossRef]
- Wang, R.; Zuo, S.; Wu, D.; Zhang, J.; Zhu, W.; Becker, K.H.; Fang, J. Microplasma-Assisted Synthesis of Colloidal Gold Nanoparticles and Their Use in the Detection of Cardiac Troponin I (cTn-I). Plasma Process. Polym. 2014, 12, 380. [Google Scholar] [CrossRef]
- Yan, T.; Zhong, X.; Rider, A.E.; Lu, Y.; Furman, S.A.; Ostrikov, K. Microplasma-chemical synthesis and tunable real-time plasmonic responses of alloyed AuxAg1−x nanoparticles. Chem. Commun. 2014, 50, 3144. [Google Scholar] [CrossRef] [PubMed]
- Mariotti, D.; Patel, J.; Švrček, V.; Maguire, P. Plasma–Liquid Interactions at Atmospheric Pressure for Nanomaterials Synthesis and Surface Engineering. Plasma Process. Polym. 2012, 9, 1074–1085. [Google Scholar] [CrossRef]
- Huang, X.Z.; Zhong, X.X.; Lu, Y.; Li, Y.S.; Rider, A.E.; Furman, S.A.; Ostrikov, K. Plasmonic Ag nanoparticles via environment-benign atmospheric microplasma electrochemistry. Nanotechnology 2013, 24, 095604. [Google Scholar] [CrossRef] [PubMed]
- Koo, I.G.; Lee, M.S.; Shim, J.H.; Ahn, J.H.; Lee, W.M. Platinum nanoparticles prepared by a plasma-chemical reduction method. J. Mater. Chem. 2005, 15, 4125. [Google Scholar] [CrossRef]
- Chen, Q.; Kaneko, T.; Hatakeyama, R. Synthesis of Superfine Ethanol-Soluble CoO Nanoparticles via Discharge Plasma in Liquid. Appl. Phys. 2012, 5, 096201. [Google Scholar] [CrossRef]
- Kim, S.J.; Kim, B.H.; Chung, M.C.; Ahn, H.G.; Kim, S.C.; Kim, H.G.; Jung, S.C. The Synthesis of Nickel Nanoparticles by Liquid Phase Plasma Processing. J. Nanosci. Nanotechnol. 2013, 13, 1997–2000. [Google Scholar] [CrossRef] [PubMed]
- Burakov, V.S.; Savastenko, N.A.; Tarasenko, N.V.; Nevar, E.A. Synthesis of nanoparticles using a pulsed electrical discharge in a liquid. J. Appl. Spectrosc. 2008, 75, 114. [Google Scholar] [CrossRef]
- Saito, G.; Hosokai, S.; Tsubota, M.; Akiyama, T. Synthesis of copper/copper oxide nanoparticles by solution plasma. J. Appl. Phys. 2011, 110, 023302. [Google Scholar] [CrossRef]
- Richmonds, C.; Sankaran, R.M. Plasma-liquid electrochemistry: Rapid synthesis of colloidal metal nanoparticles by microplasma reduction of aqueous cations. Appl. Phys. Lett. 2008, 93, 131501. [Google Scholar] [CrossRef]
- Tarasenko, N.; Nevar, A.; Nedelko, M. Properties of zinc-oxide nanoparticles synthesized by electrical-discharge technique in liquids. Phys. Status Solidi A 2010, 207, 2319. [Google Scholar] [CrossRef]
- Kabbara, H.; Noël, C.; Ghanbaja, J.; Hussein, K.; Mariotti, D.; Švrček, V.; Belmonte, T. Synthesis of nanocrystals by discharges in liquid nitrogen from Si–Sn sintered electrode. Sci. Rep. 2015, 5, 17477. [Google Scholar] [CrossRef]
- Belmonte, T.; Hamdan, A.; Kosior, F.; Noël, C.; Henrion, G. Interaction of discharges with electrode surfaces in dielectric liquids: Application to nanoparticle synthesis. J. Phys. D Appl. Phys. 2014, 47, 224016. [Google Scholar] [CrossRef]
- Yao, W.T.; Yu, S.H.; Zhou, Y.; Jiang, J.; Wu, Q.S.; Zhang, L.; Jiang, J. Formation of Uniform CuO Nanorods by Spontaneous Aggregation: Selective Synthesis of CuO, Cu2O, and Cu Nanoparticles by a Solid−Liquid Phase Arc Discharge Process. J. Phys. Chem. B 2005, 109, 14011. [Google Scholar] [CrossRef]
- Du, C.M.; Xiao, M.D. Cu2O nanoparticles synthesis by Microplasma. Sci. Rep. 2014, 4, 7339. [Google Scholar] [CrossRef] [PubMed]
- Lo, C.H.; Tsung, T.T.; Chen, L.C. Shape-controlled synthesis of Cu-based nanofluid using submerged arc nanoparticle synthesis system (SANSS). J. Cryst. Growth 2005, 277, 636. [Google Scholar] [CrossRef]
- Pootawang, P.; Saito, N.; Lee, S.Y. Discharge time dependence of a solution plasma process for colloidal copper nanoparticle synthesis and particle characteristics. Nanotechnology 2013, 24, 055604. [Google Scholar] [CrossRef]
- Satsuta, T.; Hasegawa, M.; Harada, N.; Shigeo, A. Preparation of metal powders utilizing electric discharge in liquid nitrogen. J. Jpn. Inst. Met. 1993, 57, 296–300. [Google Scholar] [CrossRef][Green Version]
- Kabbara, H.; Ghanbajaa, J.; Noël, C.; Belmonte, T. Synthesis of Cu@ZnO core–shell nanoparticles by spark discharges in liquid nitrogen. Nano-Struct. Nano-Objects 2017, 10, 22–29. [Google Scholar] [CrossRef]
- Trad, M.; Nominé, A.; Noël, C.; Ghanbaja, J.; Tabbal, M.; Belmonte, T. Evidence of alloy formation in CoNi nanoparticles synthesized by nanosecond-pulsed discharges in liquid nitrogen. Plasma Process. Polym. 2020, 17, 1900255. [Google Scholar] [CrossRef]
- Belmonte, T.; Kabbara, H.; Noël, C.; Pflieger, R. Analysis of Zn I emission lines observed during a spark discharge in liquid nitrogen for zinc nanosheet synthesis. Plasma Sources Sci. Technol. 2018, 27, 074004. [Google Scholar] [CrossRef]
- Kabbara, H.; Ghanbaja, J.; Noël, C.; Belmonte, T. Nano-objects synthesized from Cu, Ag and Cu28Ag72 electrodes by submerged discharges in liquid nitrogen. Mater. Chem. Phys. 2018, 217, 371–378. [Google Scholar] [CrossRef]
- Trad, M.; Nominé, A.; Tarasenka, N.; Ghanbaja, J.; Noël, C.; Tabbal, M.; Belmonte, T. Synthesis of Ag and Cd nanoparticles by nanosecond-pulsed discharge in liquid nitrogen. Front. Chem. Sci. Eng. 2019, 13, 360–368. [Google Scholar] [CrossRef]
- Hamdana, A.; Kabbara, H.; Noël, C.; Ghanbaja, J.; Redjaimia, A.; Belmonte, T. Synthesis of two-dimensional lead sheets by spark discharge in liquid nitrogen. Particuology 2018, 40, 152–159. [Google Scholar] [CrossRef]
- Sano, N.; Ukita, S. One-step synthesis of Pt-supported carbon nanohorns for fuel cell electrode by arc plasma in liquid nitrogen. Mater. Chem. Phys. 2006, 99, 447–450. [Google Scholar] [CrossRef]
- Charinpanitkul, T.; Tanthapanichakoon, W.; Sano, N. Carbon nanostructures synthesized by arc discharge between carbon and iron electrodes in liquid nitrogen. Curr. Appl. Phys. 2009, 9, 629–632. [Google Scholar] [CrossRef]
- Fink, S.; Noe, M.; Zwecker, V.; Leibfried, T. Lightning impulse breakdown voltage of liquid nitrogen under the influence of heating. J. Phys. Conf. Ser. 2010, 234, 032011. [Google Scholar] [CrossRef]
- Fink, S.; Kim, H.-R.; Mueller, R.; Noe, M.; Zwecker, V. AC Breakdown Voltage of Liquid Nitrogen Depending on Gas Bubbles and Pressure. In Proceedings of the 2014 ICHVE International Conference on High Voltage Engineering and Application, Poznan, Poland, 8–11 September 2014; pp. 1–4. [Google Scholar]
- Kim, W.; Park, J.-S.; Suh, C.-Y.; Cho, S.-W.; Lee, S.; Shon, I.-J. Synthesis of TiN Nanoparticles by Explosion of Ti Wire in Nitrogen Gas. Mater. Trans. 2009, 50, 2897–2899. [Google Scholar] [CrossRef]
- Hokamotoa, K.; Wada, N.; Tomoshige, R.; Kai, S.; Ujimoto, Y. Synthesis of TiN powders through electrical wire explosion in liquid nitrogen. J. Alloys Compd. 2009, 485, 573–576. [Google Scholar] [CrossRef]
- Shin, D.H.; Hong, Y.C.; Uhm, H.S. Production of Nanocrystalline Titanium Nitride Powder by Atmospheric Microwave Plasma Torch in Hydrogen/Nitrogen Gas. J. Am. Ceram. Soc. 2005, 88, 2736–2739. [Google Scholar] [CrossRef]
- Oh, U.C.; Je, J.H. Effects of strain energy on the preferred orientation of TiN thin films. J. Appl. Phys. 1993, 74, 1692. [Google Scholar] [CrossRef]
- Zhao, J.P.; Wang, X.; Chen, Z.Y.; Yang, S.Q.; Shi, T.S.; Liu, X.H. Overall energy model for preferred growth of TiN films during filtered arc deposition. J. Phys. D Appl. Phys. 1997, 30, 5–12. [Google Scholar] [CrossRef]
- Wriedt, H.A.; Murray, J.L. The N-Ti (Nitrogen-Titanium) system. Bull. Alloy Phase Diagr. 1987, 8, 378–388. [Google Scholar] [CrossRef]
- Ushio, M. Arc discharge and electrode phenomena. Pure Appl. Chem. 1988, 60, 809–814. [Google Scholar] [CrossRef]
- Crowell, C.R. The Richardson constant for thermionic emission in Schottky barrier diodes. Solid-State Electron. 1965, 8, 395–399. [Google Scholar] [CrossRef]
- Koeck, F.A.M.; Nemanich, R.J. Low temperature onset for thermionic emitters based on nitrogen incorporated UNCD films. Diam. Relat. Mater. 2009, 18, 232–234. [Google Scholar] [CrossRef]
- Dilip, K.D.; Olukunle, C.O. Modified Richardson-Dushman equation and modeling thermionic emission from monolayer graphene. In Proceedings of the SPIE Volume 9927-14, Nanoengineering: Fabrication, Properties, Optics, and Devices XIII, San Diego, CA, USA, 30–31 August 2016; Campo, E.M., Dobisz, E.A., Eldada, L.A., Eds.; SPIE: Washington, DC, USA, 1955. [Google Scholar] [CrossRef]
- David, R.L. Section 12: Properties of solids, Electron work function of the elements. In Handbook of Chemistry and Physics, 89th ed.; CRC Press: Boca Raton, FL, USA, 2008; pp. 12–124. [Google Scholar]
- Michaelson, H.B. The work function of the elements and its periodicity. J. Appl. Phys. 1977, 48, 4729. [Google Scholar] [CrossRef]
- Smithells, J.C.J. 18 Electron emission. In Metals Reference Book, 7th ed.; Butterworth-Heinemann: London, UK, 1967. [Google Scholar]
- Patsalas, P.; Kalfagiannis, N.; Kassavetis, S.; Abadias, G.; Bellas, D.V.; Lekka, C.; Lidorikis, E. Conductive nitrides: Growth principles, optical and electronic properties, and their perspectives in photonics and plasmonics. Mater. Sci. Eng. R Rep. 2018, 123, 1–55. [Google Scholar] [CrossRef]
- Mezzi, A.; Soltani, P.; Kaciulis, S.; Bellucci, A.; Girolami, M.; Mastellone, M.; Trucchi, D.M. Investigation of work function and chemical composition of thin films of borides and nitrides. Surf. Interface Anal. 2018, 50, 1138–1144. [Google Scholar] [CrossRef]


| Content | Conditions | |
|---|---|---|
| Dielectric medium | Liquid nitrogen | |
| Electrode material | Titanium rod, aluminum rod, and copper rod | |
| Power supply | DC | |
| Power mode | Low-power mode | High-power mode |
| Applied current [A] | 5 | 30 |
| Material–material (+) anode–(−) cathode | Ti–Ti Al–Al Cu–Cu | Ti–Ti Al–Al Cu–Cu Ti–Cu Cu–Ti |
| Sample | Shape | Average Size (Min.~Max.) | Standard Deviation |
|---|---|---|---|
| Ti 5 A | Sphere | 30 nm (6~95 nm) | 22.4 |
| Ti 30 A | Cubic | 43 nm (13~139 nm) | 22.5 |
| Al 5 A | Sphere | 26 nm (10~45 nm) | 6.7 |
| Al 30 A | Sphere | 46 nm (10~79 nm) | 15.6 |
| Sample Name | Lattice Parameter (Å) | Calculated Nitrogen Content (at.%) |
|---|---|---|
| Ti 5 A | 4.2201 | 37.2 |
| Ti 15 A | 4.2288 | 42.6 |
| Ti 30 A | 4.2334 | 45.3 |
Publisher’s Note: MDPI stays neutral with regard to jurisdictional claims in published maps and institutional affiliations. |
© 2021 by the authors. Licensee MDPI, Basel, Switzerland. This article is an open access article distributed under the terms and conditions of the Creative Commons Attribution (CC BY) license (https://creativecommons.org/licenses/by/4.0/).
Share and Cite
Park, Y.S.; Kodama, S.; Sekiguchi, H. Preparation of Metal Nitride Particles Using Arc Discharge in Liquid Nitrogen. Nanomaterials 2021, 11, 2214. https://doi.org/10.3390/nano11092214
Park YS, Kodama S, Sekiguchi H. Preparation of Metal Nitride Particles Using Arc Discharge in Liquid Nitrogen. Nanomaterials. 2021; 11(9):2214. https://doi.org/10.3390/nano11092214
Chicago/Turabian StylePark, Yoon Sik, Satoshi Kodama, and Hidetoshi Sekiguchi. 2021. "Preparation of Metal Nitride Particles Using Arc Discharge in Liquid Nitrogen" Nanomaterials 11, no. 9: 2214. https://doi.org/10.3390/nano11092214
APA StylePark, Y. S., Kodama, S., & Sekiguchi, H. (2021). Preparation of Metal Nitride Particles Using Arc Discharge in Liquid Nitrogen. Nanomaterials, 11(9), 2214. https://doi.org/10.3390/nano11092214