
Acetaldehyde Adsorption Characteristics of Ag/ACF Composite Prepared by Liquid Phase Plasma Method

 ,
, 

Abstract
:
1. Introduction
2. Materials and Methods
2.1. Materials
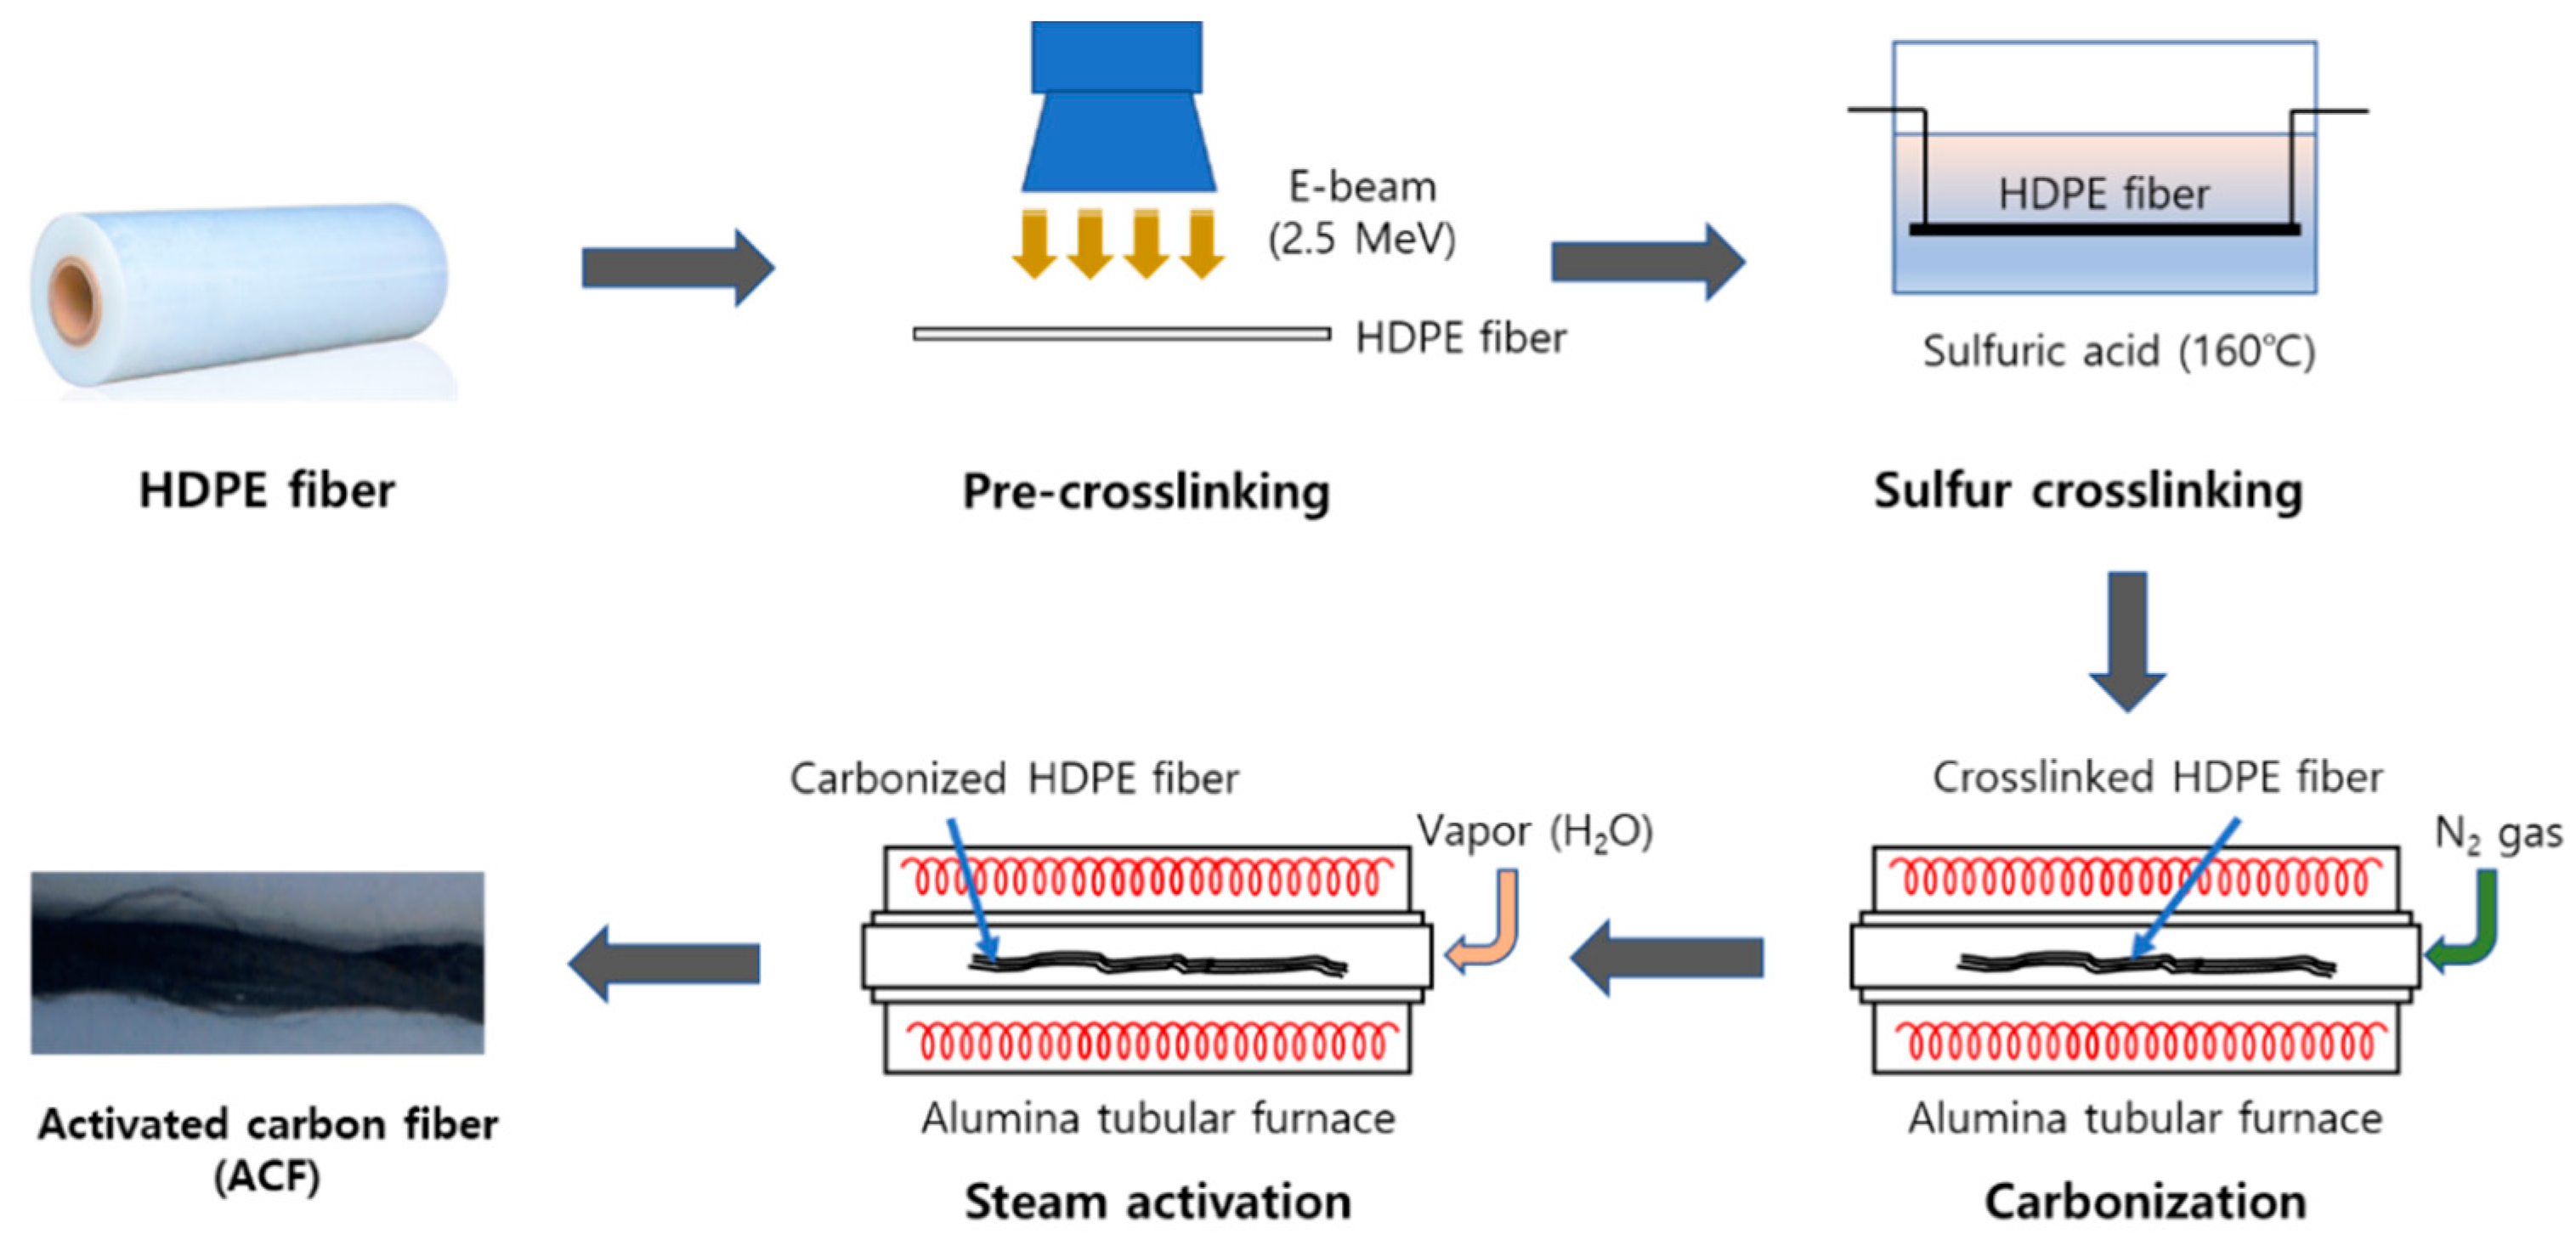
2.2. Preparation of Aactivated Ccarbon Fiber
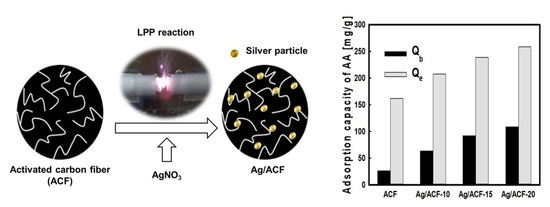
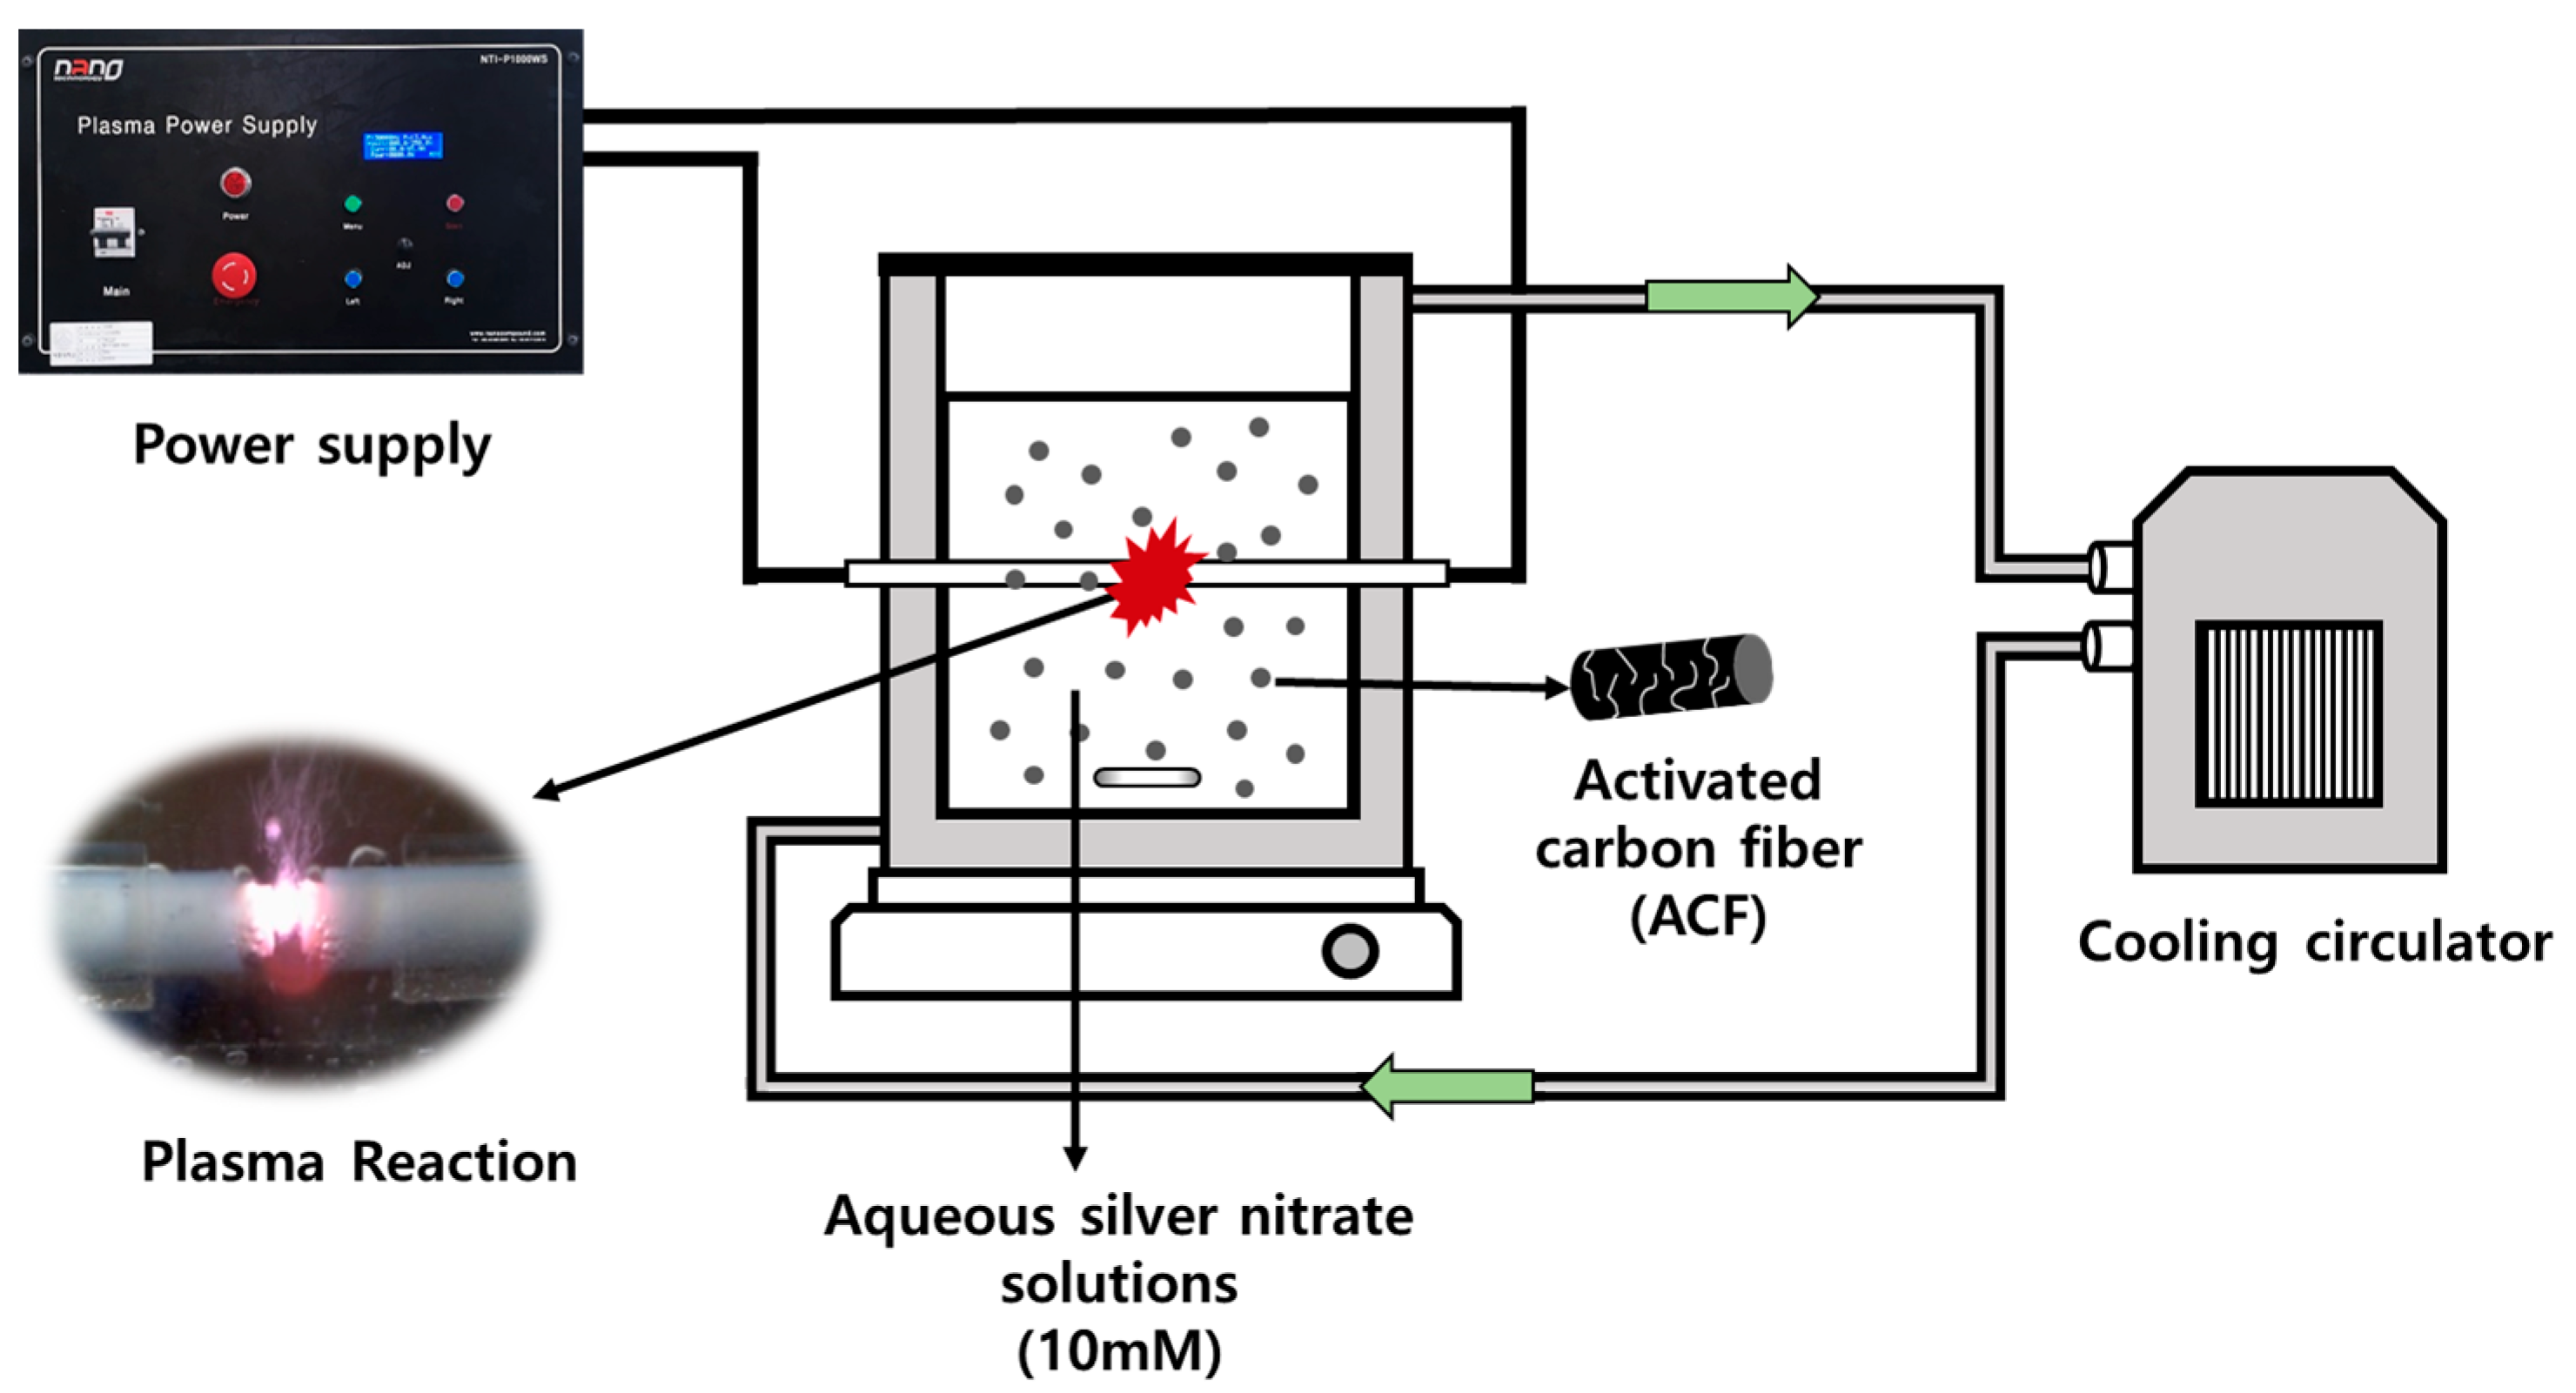
2.3. Preparation of Silver Nanoparticle Precipitated ACF
2.4. Acetaldehyde Adsorption Experiment
2.5. Characterization of Ag/ACF Composite
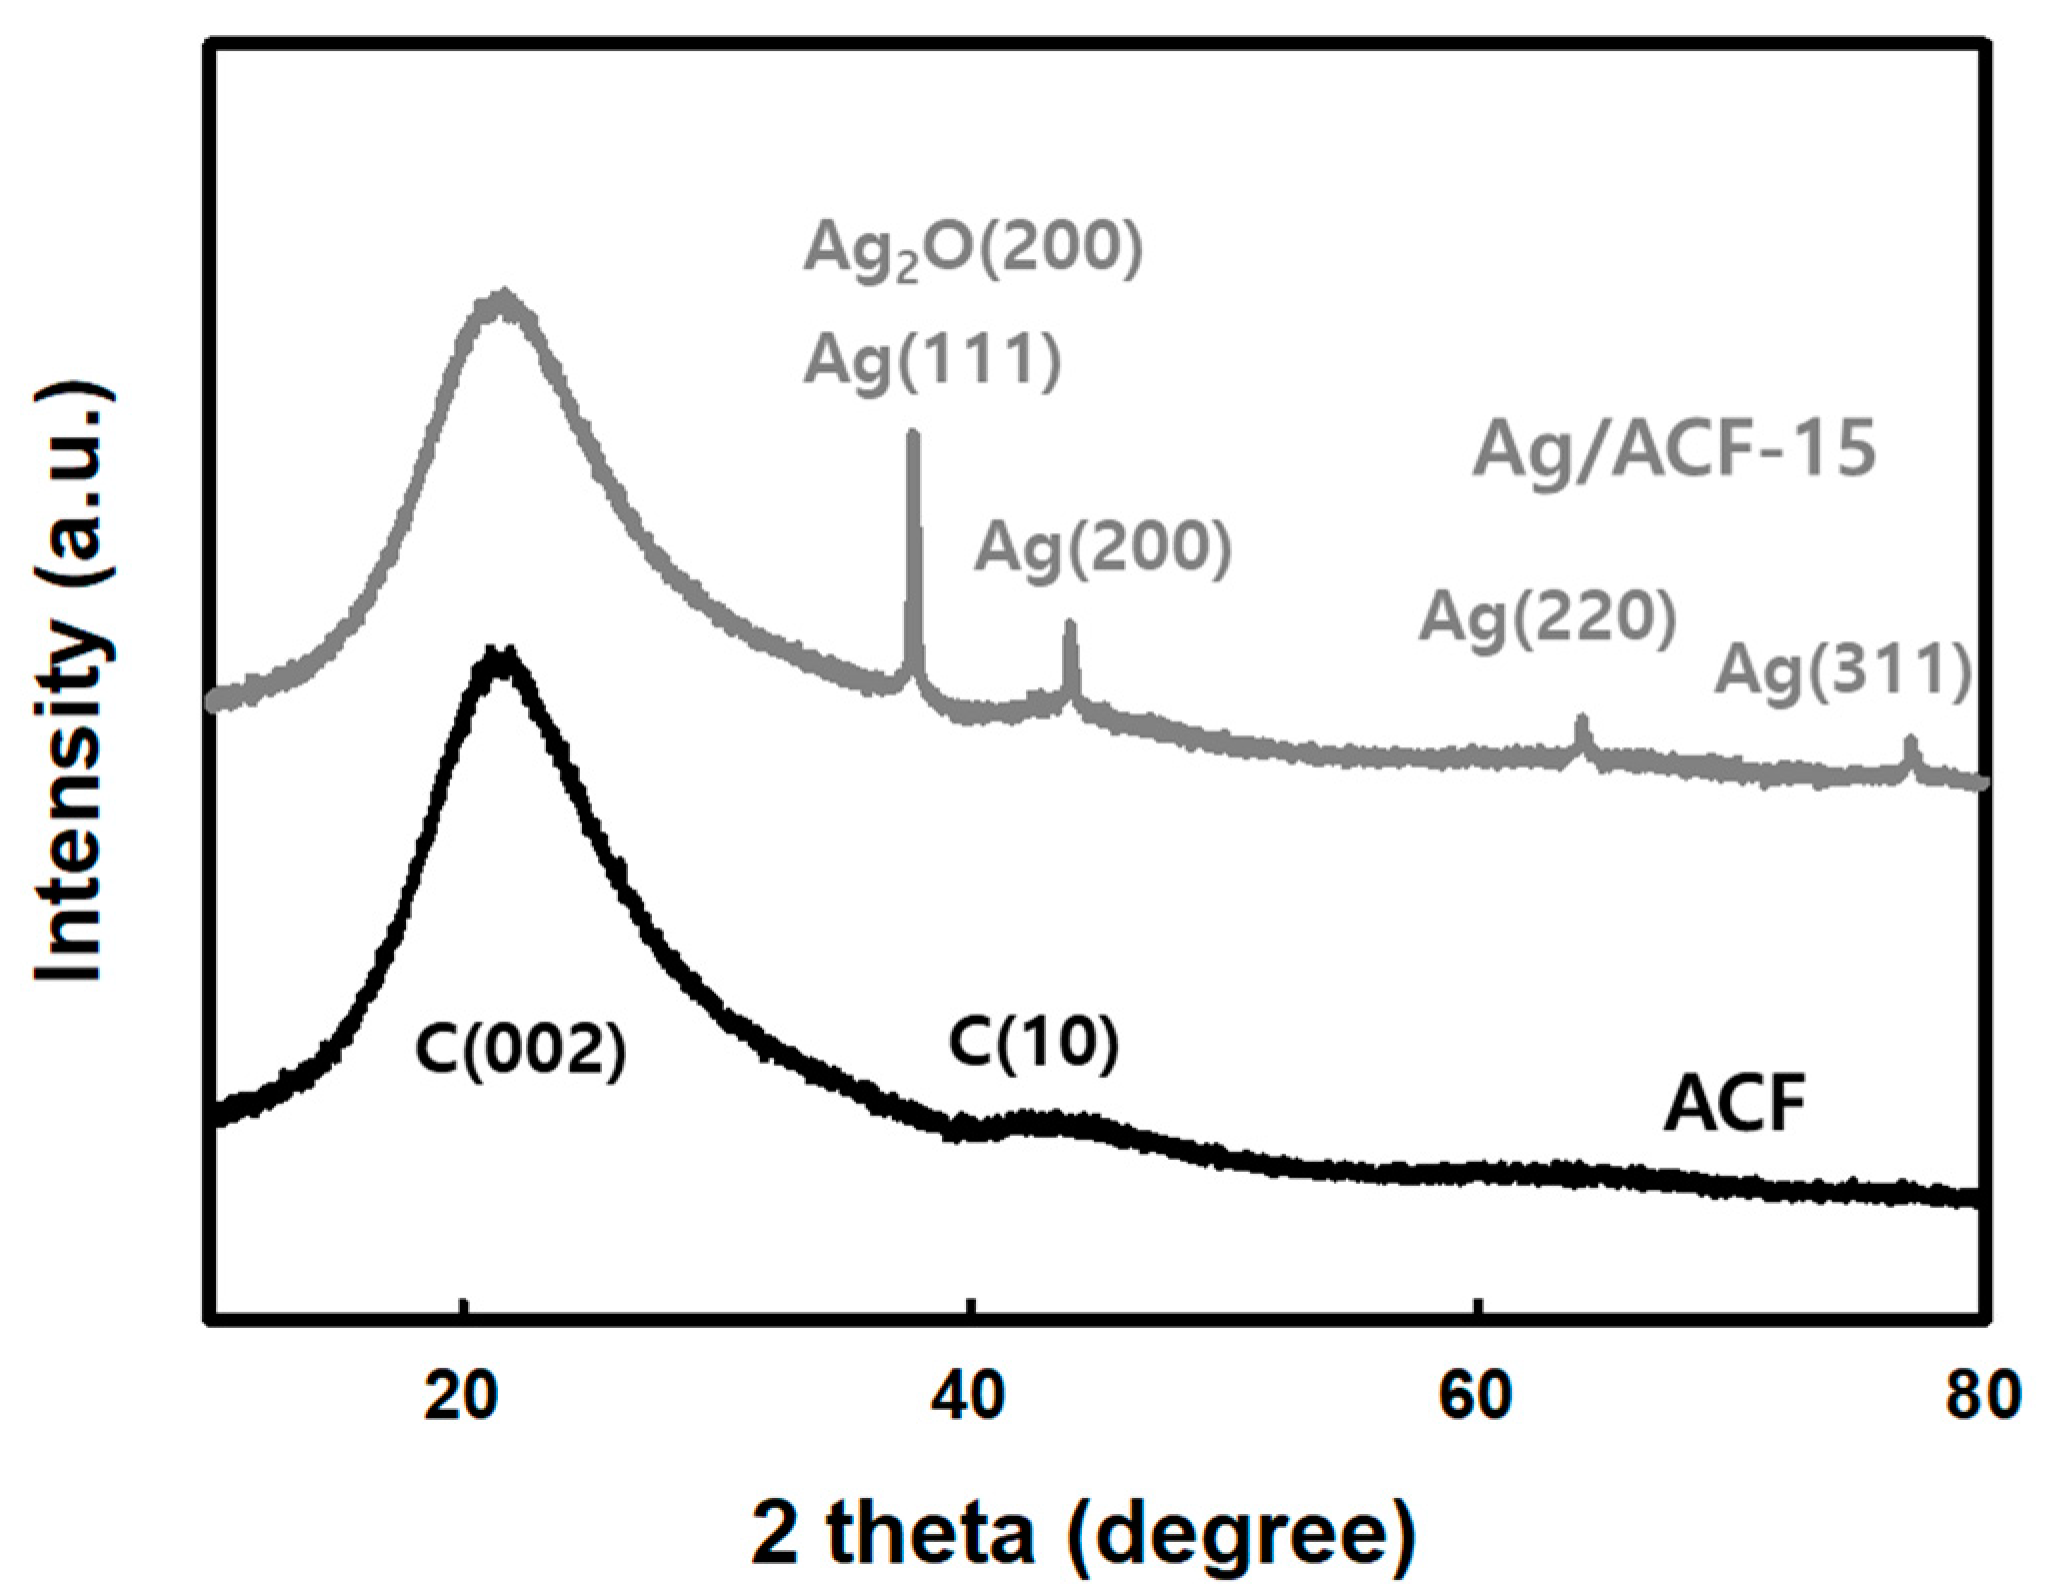
3. Results
4. Conclusions
Author Contributions
Funding
Data Availability Statement
Conflicts of Interest
References
- El-Sayed, Y.; Bandosz, T.J. A Study of Acetaldehyde Adsorption on Activated Carbons. J. Colloid Interface Sci. 2001, 242, 44–51. [Google Scholar] [CrossRef]
- Singh, M.; Zhou, N.; Paul, D.K.; Klabunde, K.J. IR spectral evidence of aldol condensation: Acetaldehyde adsorption over TiO2 surface. J. Catal. 2008, 260, 371–379. [Google Scholar] [CrossRef]
- Tabakoff, B.; Anderson, R.A.; Ritzmann, R.F. Brain acetaldehyde after ethanol administration. Biochem. Pharmacol. 1976, 25, 1305–1309. [Google Scholar] [CrossRef]
- Dellarco, V.L. A mutagenicity assessment of acetaldehyde. Mutat. Res. Rev. Genet. 1988, 195, 1–20. [Google Scholar] [CrossRef]
- Park, S.H.; Yaqub, M.; Lee, S.H.; Lee, W.T. Adsorption of acetaldehyde from air by activated carbon and carbon fibers. Environ. Eng. Res. 2022, 27, 200549. [Google Scholar] [CrossRef]
- Yamashita, K.; Noguchi, M.; Mizukoshi, A.; Yanagisawa, Y. Acetaldehyde Removal from Indoor Air through Chemical Absorption Using L-Cysteine. Int. J. Environ. Res. Public Health 2010, 7, 3489–3498. [Google Scholar] [CrossRef] [Green Version]
- Rengga, W.D.P.; Chafidz, A.; Sudibandriyo, M.; Nasikin, M.; Abasaeed, A.E. Silver nano-particles deposited on bamboo-based activated carbon for removal of formaldehyde. J. Environ. Chem. Eng. 2017, 5, 1657–1665. [Google Scholar] [CrossRef]
- Wang, H.; Jusys, Z.; Behm, R.J. Ethanol and Acetaldehyde Adsorption on a Carbon-Supported Pt Catalyst: A Comparative DEMS Study. Fuel Cells 2004, 4, 113–125. [Google Scholar] [CrossRef]
- Wu, G.; Stacchiola, D.; Collins, M.; Tysoe, W.T. The Adsorption and reaction of Acetaldehyde on clean Ag (111). Surf. Rev. Lett. 2000, 7, 271–275. [Google Scholar] [CrossRef]
- Chang, S.M.; Hu, S.C.; Shiue, A.; Lee, P.Y.; Leggett, G. Adsorption of silver nano-particles modified activated carbon filter media for indoor formaldehyde removal. Chem. Phys. Lett. 2020, 757, 137864. [Google Scholar] [CrossRef]
- Sun, S.H.; Jung, S.C. Facile synthesis of bimetallic Ni-Cu nanoparticles using liquid phase plasma method. Korean J. Chem. Eng. 2016, 33, 1075–1079. [Google Scholar] [CrossRef]
- Kim, S.C.; Park, Y.K.; Kim, B.H.; Kim, H.G.; Lee, W.J.; Lee, H.; Jung, S.C. Facile precipitation of tin oxide nanoparticles on graphene sheet by liquid phase plasma method for enhanced electrochemical properties. Korean J. Chem. Eng. 2018, 35, 750–756. [Google Scholar] [CrossRef]
- Ki, S.J.; Park, Y.K.; Kim, J.S.; Lee, W.J.; Lee, H.; Jung, S.C. Facile preparation of tungsten oxide doped TiO2 photocatalysts using liquid phase plasma process for enhanced degradation of diethyl phthalate. Chem. Eng. J. 2019, 377, 120087. [Google Scholar] [CrossRef]
- Lee, H.; Park, I.S.; Bang, H.J.; Park, Y.K.; Kim, H.G.; Ha, H.H.; Kim, B.J.; Jung, S.C. Fabrication of Gd-La codoped TiO2 composite via a liquid phase plasma method and its application as visible-light photocatalysts. Appl. Surf. Sci. 2019, 471, 893–899. [Google Scholar] [CrossRef]
- Ki, S.J.; Lee, H.; Park, Y.K.; Kim, S.J.; An, K.H.; Jung, S.C. Assessing the electrochemical performance of a supercapacitor electrode made of copper oxide and activated carbon using liquid phase plasma. Appl. Surf. Sci. 2018, 446, 243–249. [Google Scholar] [CrossRef]
- Chung, K.H.; Park, H.W.; Jeon, K.J.; Park, Y.K.; Jung, S.C. Irradiation of liquid phase plasma on photocatalytic decomposition of acetic acid-containing wastewater over metal oxide photocatalysts. Catal. Today 2018, 307, 131–139. [Google Scholar] [CrossRef]
- Lee, H.; Park, S.H.; Seo, S.G.; Kim, S.J.; Kim, S.C.; Park, Y.K.; Jung, S.C. Preparation and characterization of copper nanoparticles via the liquid phase plasma method. Curr. Nanosci. 2014, 10, 7–10. [Google Scholar] [CrossRef]
- Park, Y.K.; Kim, B.J.; Kim, S.C.; You, C.S.; Choi, J.W.; Park, J.G.; Lee, H.; Jung, S.C. Decomposition of naproxen by plasma in liquid process with TiO2 photocatslysts and hydrogen peroxide. Environ. Res. 2021, 195, 110899. [Google Scholar] [CrossRef]
- Shuaub, U.; Hussain, T.; Ahmad, R.; Zakaullah, M.; Mubarik, F.E.; Muntaha, S.T.; Ashraf, S. Plasma-liquid synthesis of silver nanoparticles and their antibacterial and antifungal applications. Mater. Res. Express 2020, 7, 035015. [Google Scholar] [CrossRef] [Green Version]
- Paula, F.G.F.; Campello-Gomez, I.; Ortega, P.F.R.; Rodriguea-Reinoso, F.; Martinez-Escandell, M.; Silvestre-Albero, J. Structural Flexibility in Activated Carbon Materials Prepared under Harsh Activation Conditions. Materials 2019, 12, 1988. [Google Scholar] [CrossRef] [Green Version]
- D’Lima, L.; Phadke, M.; Ashok, V.D. Biogenic silver and silver oxide hybrid nanoparticles: A potential antimicrobial against multi drug-resistant Pseudomonas aeruginosa. New J. Chem. 2020, 44, 4935–4941. [Google Scholar] [CrossRef]
- Li, M.; Xue, J. Integrated Synthesis of Nitrogen-Doped Mesoporous Carbon from Melamine Resins with Superior Performance in Supercapacitors. J. Phys. Chem. C 2014, 118, 2507–2517. [Google Scholar] [CrossRef]
- Sadri, R.; Hosseini, M.; Kazi, S.N.; Bagheri, S.; Zubir, N.; Solangi, K.H.; Zaharinie, T.; Badarudin, A. A bio-based, facile approach for the preparation of covalently functionalized carbon nanotubes aqueous suspensions and their potential as heat transfer fluids. J. Colloid Interface Sci. 2017, 504, 115–123. [Google Scholar] [CrossRef] [PubMed]
- Salvadori, M.R.; Ando, R.A.; Oller Nascimentoc, C.A.; Correa, B. Dead biomass of Amazon yeast: A new insight into bioremediation and recovery of silver by intracellular synthesis of nanoparticles. J. Environ. Sci. Health A 2017, 52, 1112–1120. [Google Scholar] [CrossRef] [PubMed]
- Parvizi, R.; Azad, S.; Dashtian, K.; Ghaedi, M.; Heidari, H. Natural Source-Based Graphene as Sensitising Agents for Air Quality Monitoring. Sci. Rep. 2019, 9, 3798. [Google Scholar] [CrossRef] [Green Version]
- Prieto, P.; Nistor, V.; Nouneh, K.; Oyama, M.; Abd-Lefdil, M.; Diaz, R. XPS study of silver, nickel and bimetallic silver–nickel nanoparticles prepared by seed-mediated growth. Appl. Surf. Sci. 2012, 258, 8807–8813. [Google Scholar] [CrossRef]
- Kaspar, T.C.; Droubay, T.; Chamber, S.A.; Bagus, P.S. Spectroscopic Evidence for Ag(III) in Highly Oxidized Silver Films by X-ray Photoelectron Spectroscopy. J. Phys. Chem. C 2010, 114, 21562–21571. [Google Scholar] [CrossRef]
- Ferraria, A.M.; Carapeto, A.P.; Rego, A.M.B. X-ray photoelectron spectroscopy: Silver salts revisited. Vacuum 2012, 86, 1988–1991. [Google Scholar] [CrossRef]
- Zhou, K.; Li, L.; Ma, X.; Mo, Y.; Chen, R.; Li, H.; Li, H. Activated carbons modified by magnesium oxide as highly efficient sorbents for acetone. RSC Adv. 2018, 8, 2922–2932. [Google Scholar] [CrossRef] [Green Version]
- Ji, H.Z.; Feng, X.F.; Wu, Y.F.; Li, L.G.; Li, X.; Liu, X. Composite of biomass and lead resistent Aspergillus Oryzae for highly efficient aqueous phase Pb (II) adsorption. Environ. Prog. Sustain. 2017, 36, 1658–1666. [Google Scholar] [CrossRef]
- Baur, G.B.; Yuranov, I.; Kiwi-Minsker, L. Activated carbon fibers modified by metal oxide as effective structured adsorbents for acetaldehyde. Catal. Today 2015, 249, 252–258. [Google Scholar] [CrossRef]
- Khaleel, A.; Kapoor, P.N.; Klabunde, K.J. Nanocrystalline metal oxides as new adsorbents for air purification. Nanostruct. Mater. 1999, 11, 459–468. [Google Scholar] [CrossRef]
- Hu, Q.; Xie, Y.; Zhang, Z. Modification of breakthrough models in a continuous-flow fixed-bed column: Mathematical characteristics of breakthrough curves and rate profiles. Sep. Purif. Technol. 2020, 238, 116399. [Google Scholar] [CrossRef]
- Bohart, G.S.; Adams, E.Q. Some aspects of the behavior of charcoal with respect to chlorine. J. Am. Chem. Soc. 1920, 42, 523–529. [Google Scholar] [CrossRef] [Green Version]
- Thomas, H.C. Heterogeneous ion exchange in a flowing system. J. Am. Chem. Soc. 1944, 66, 1664–1666. [Google Scholar] [CrossRef]
- Yoon, Y.H.; Nelson, J.H. Application of gas adsorption kinetics I. A theoretical model for respirator cartridge service life. Am. Ind. Hyg. Assoc. J. 1984, 45, 509–516. [Google Scholar] [CrossRef] [PubMed]
- Yan, G.Y.; Viraraghavan, T.; Chen, M. A new model for heavy metal removal in a biosorption column. Adsorpt. Sci. Technol. 2001, 19, 25–43. [Google Scholar] [CrossRef]
- Clark, R.M. Evaluating the cost and performance of field scale granular activated carbon systems. Environ. Sci. Technol. 1987, 21, 573–580. [Google Scholar] [CrossRef]
- Hu, Q.; Huang, Q.; Yang, D.; Liu, H. Prediction of breakthrough curves in a fixed-bed column based on normalized Gudermannian and error functions. J. Mol. Liq. 2021, 323, 115061. [Google Scholar] [CrossRef]
- Nelder, J.A.; Mead, R. A simplex method for function minimization. Comput. J. 1965, 7, 308–313. [Google Scholar] [CrossRef]


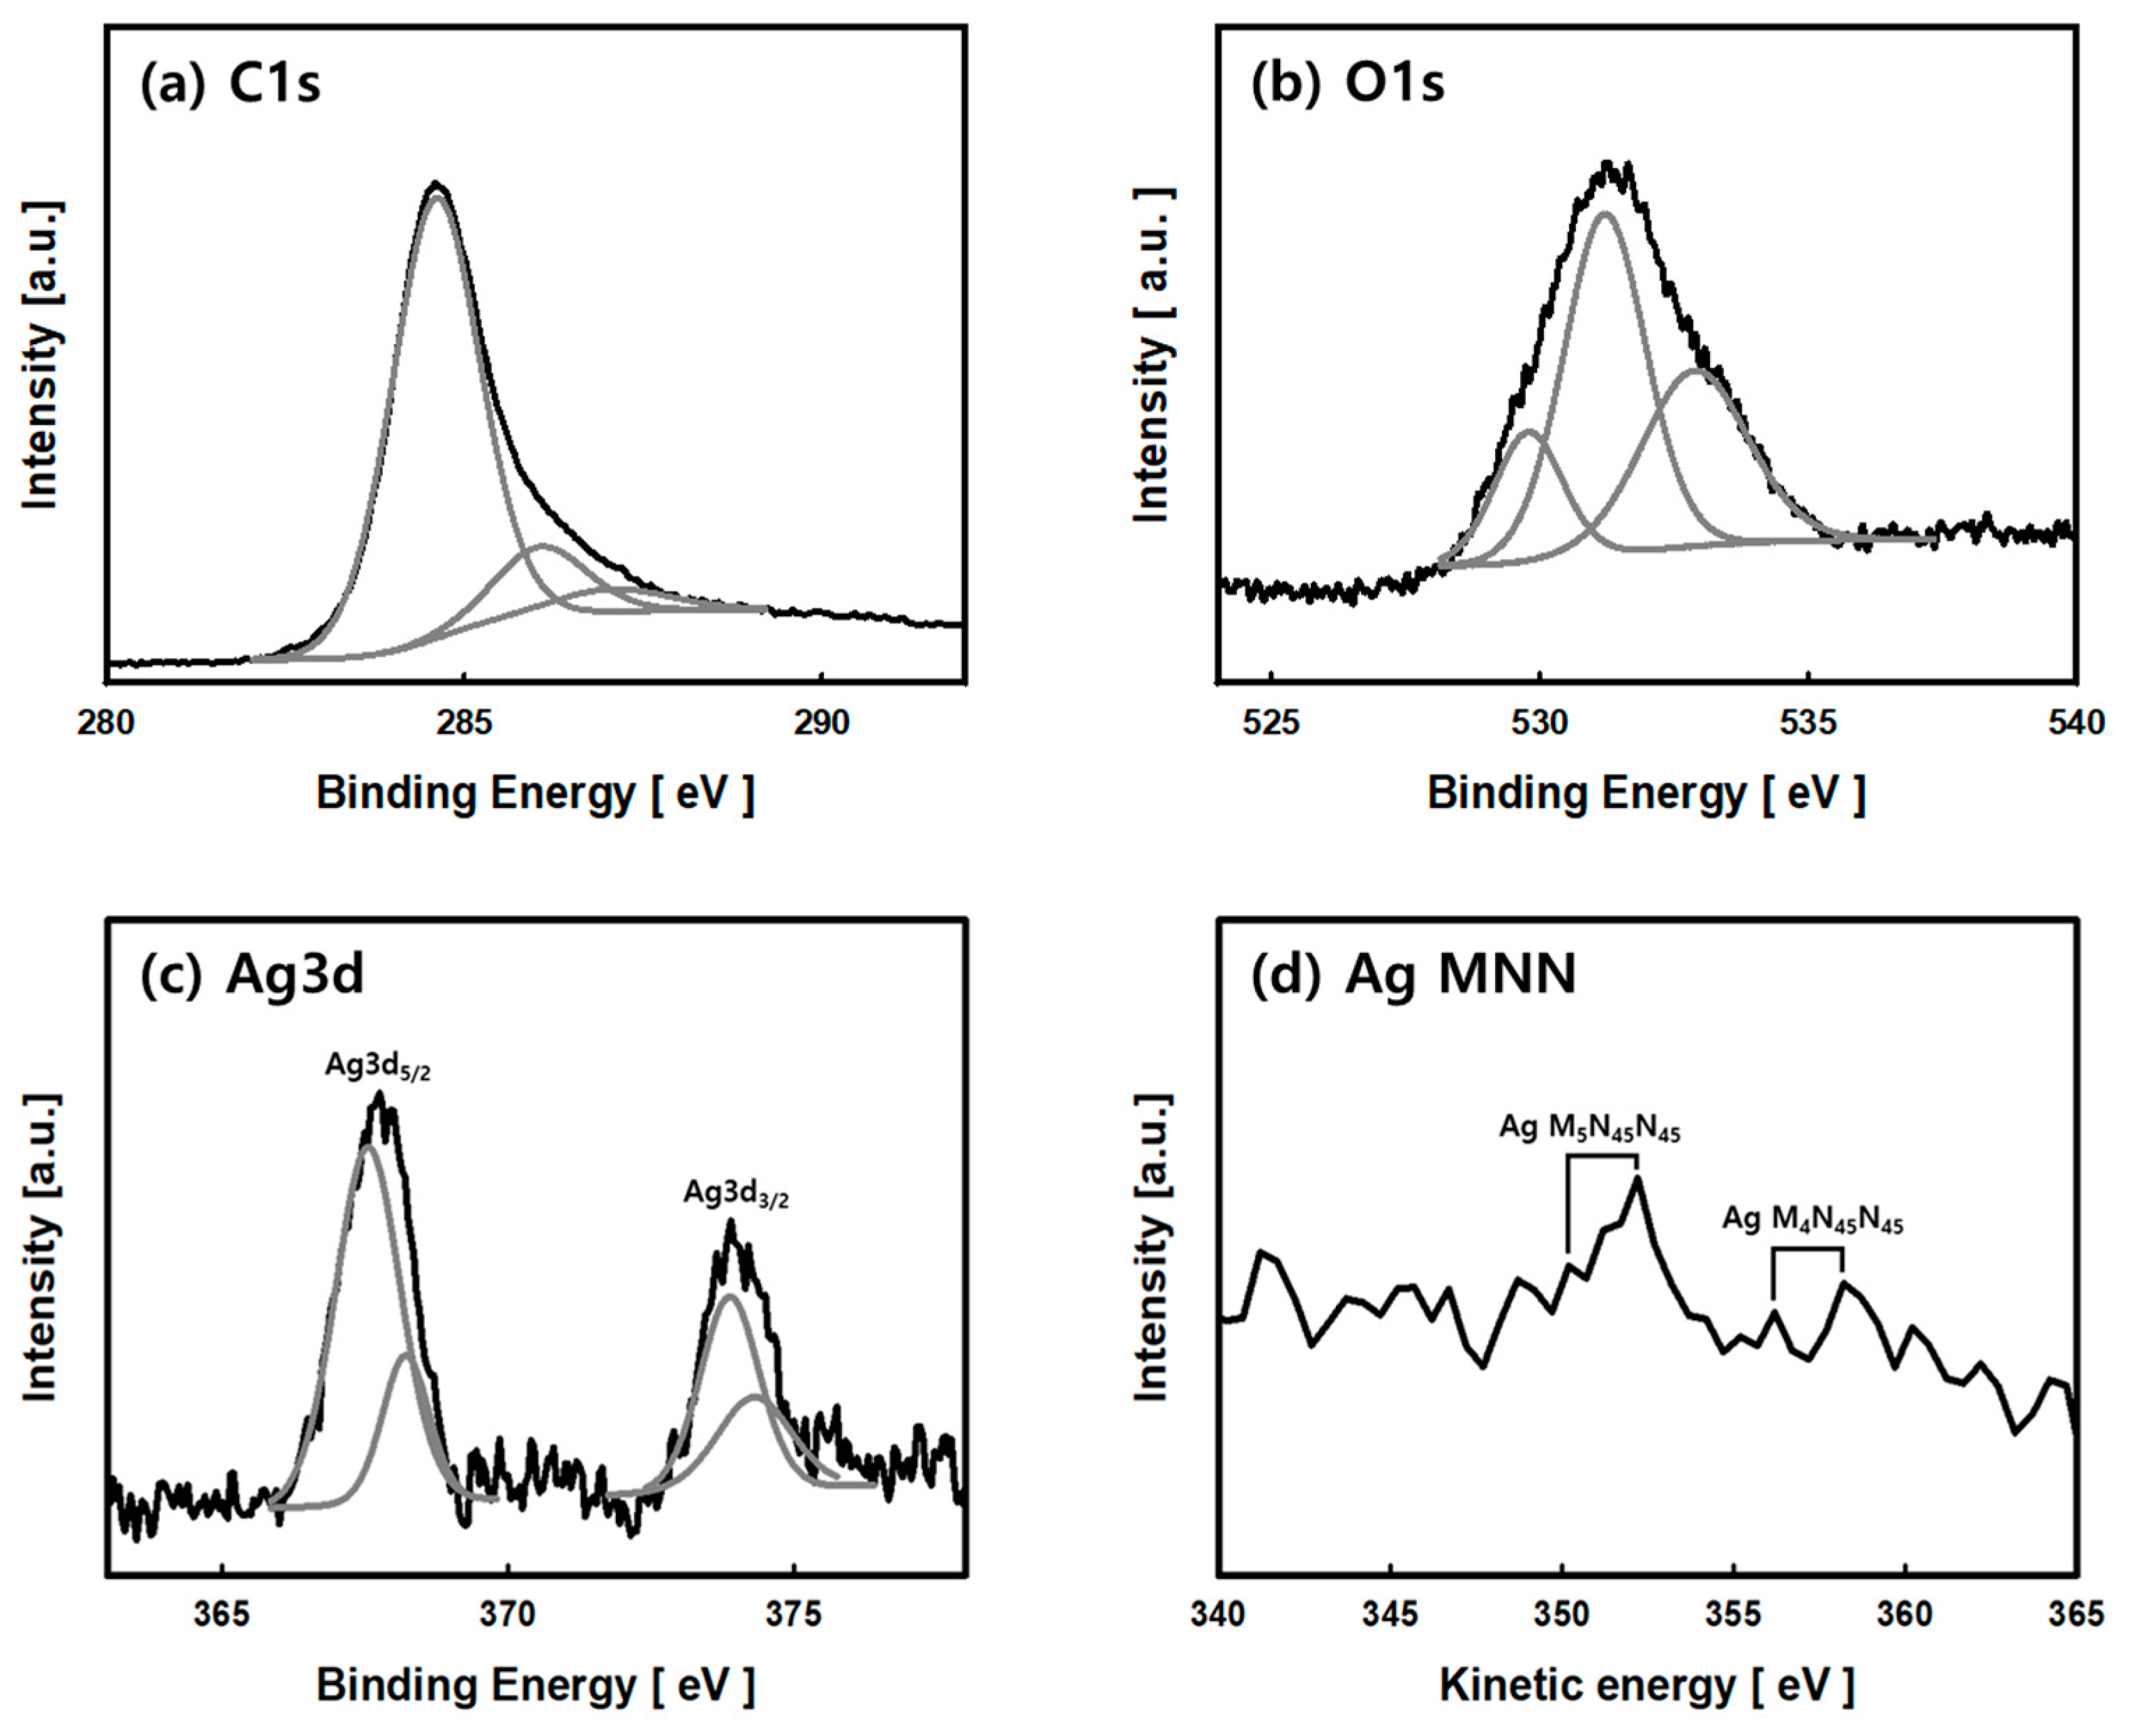
| Sample | Initial Conc. of Precursor (mM) | Atomic Composition (%) | ||
|---|---|---|---|---|
| C | O | Ag | ||
| ACF | 0 | 96.57 | 3.43 | 0.00 |
| Ag/ACF-10 | 10 | 93.63 | 4.84 | 1.53 |
| Ag/ACF-15 | 15 | 92.11 | 5.42 | 2.47 |
| Ag/ACF-20 | 20 | 90.92 | 5.81 | 3.27 |
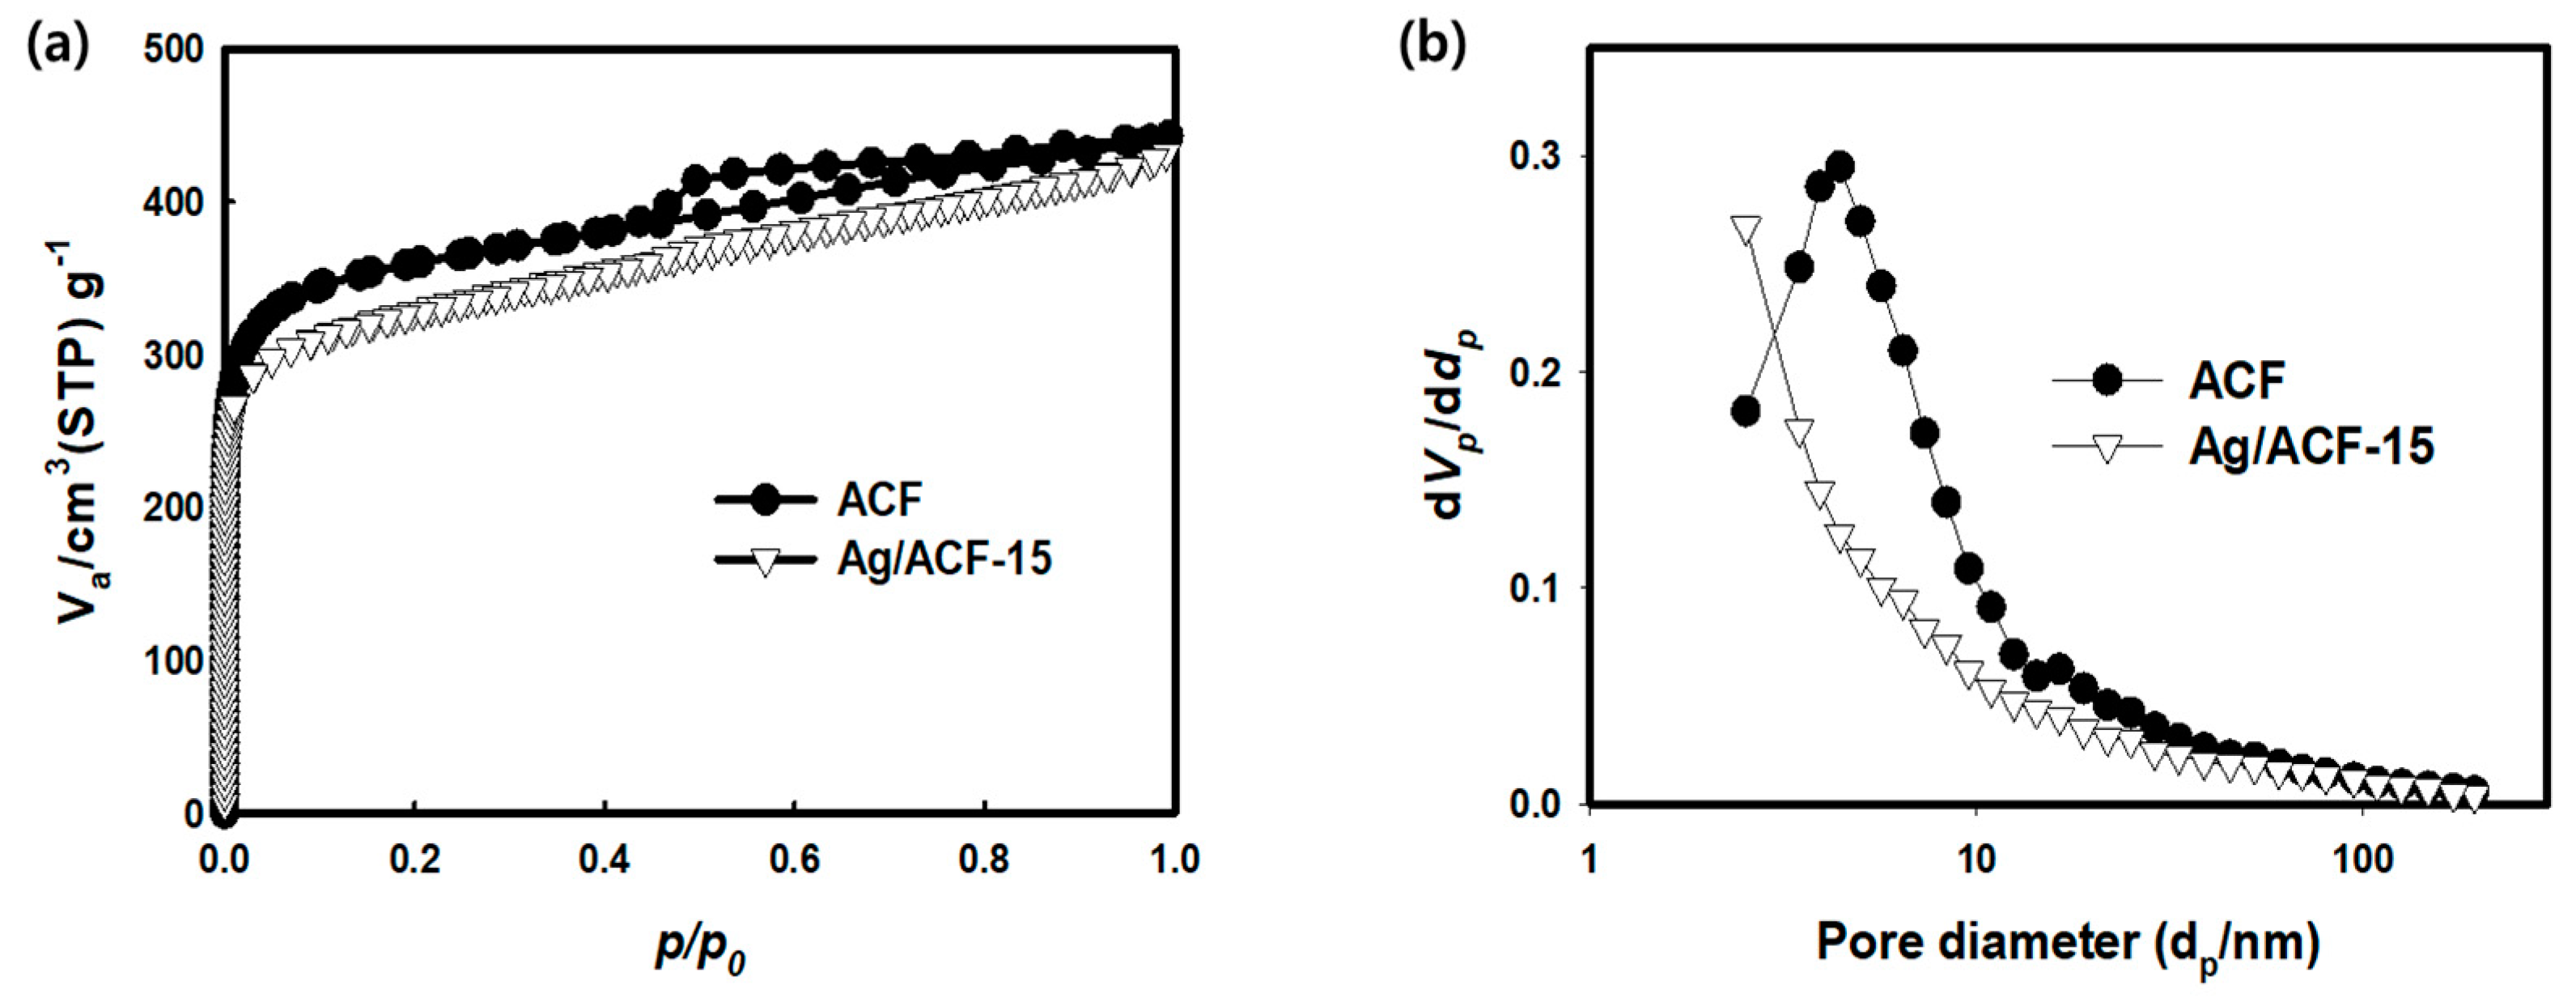
| Sample | SBET 1 (m2/g) | VTotal 2 (cm3/g) | VMicro 3 (cm3/g) | VMeso 4 (cm3/g) | Mesopore Ratio 5 (%) | Pore Diameter 6 (nm) |
|---|---|---|---|---|---|---|
| ACF | 1462 | 0.6844 | 0.4856 | 0.1988 | 29.05 | 4.42 |
| Ag/ACF-10 | 1316 | 0.6438 | 0.4771 | 0.1667 | 25.89 | 3.96 |
| Ag/ACF-15 | 1264 | 0.6296 | 0.4734 | 0.1562 | 24.80 | 4.03 |
| Ag/ACF-20 | 1208 | 0.6127 | 0.4702 | 0.1425 | 23.52 | 4.02 |
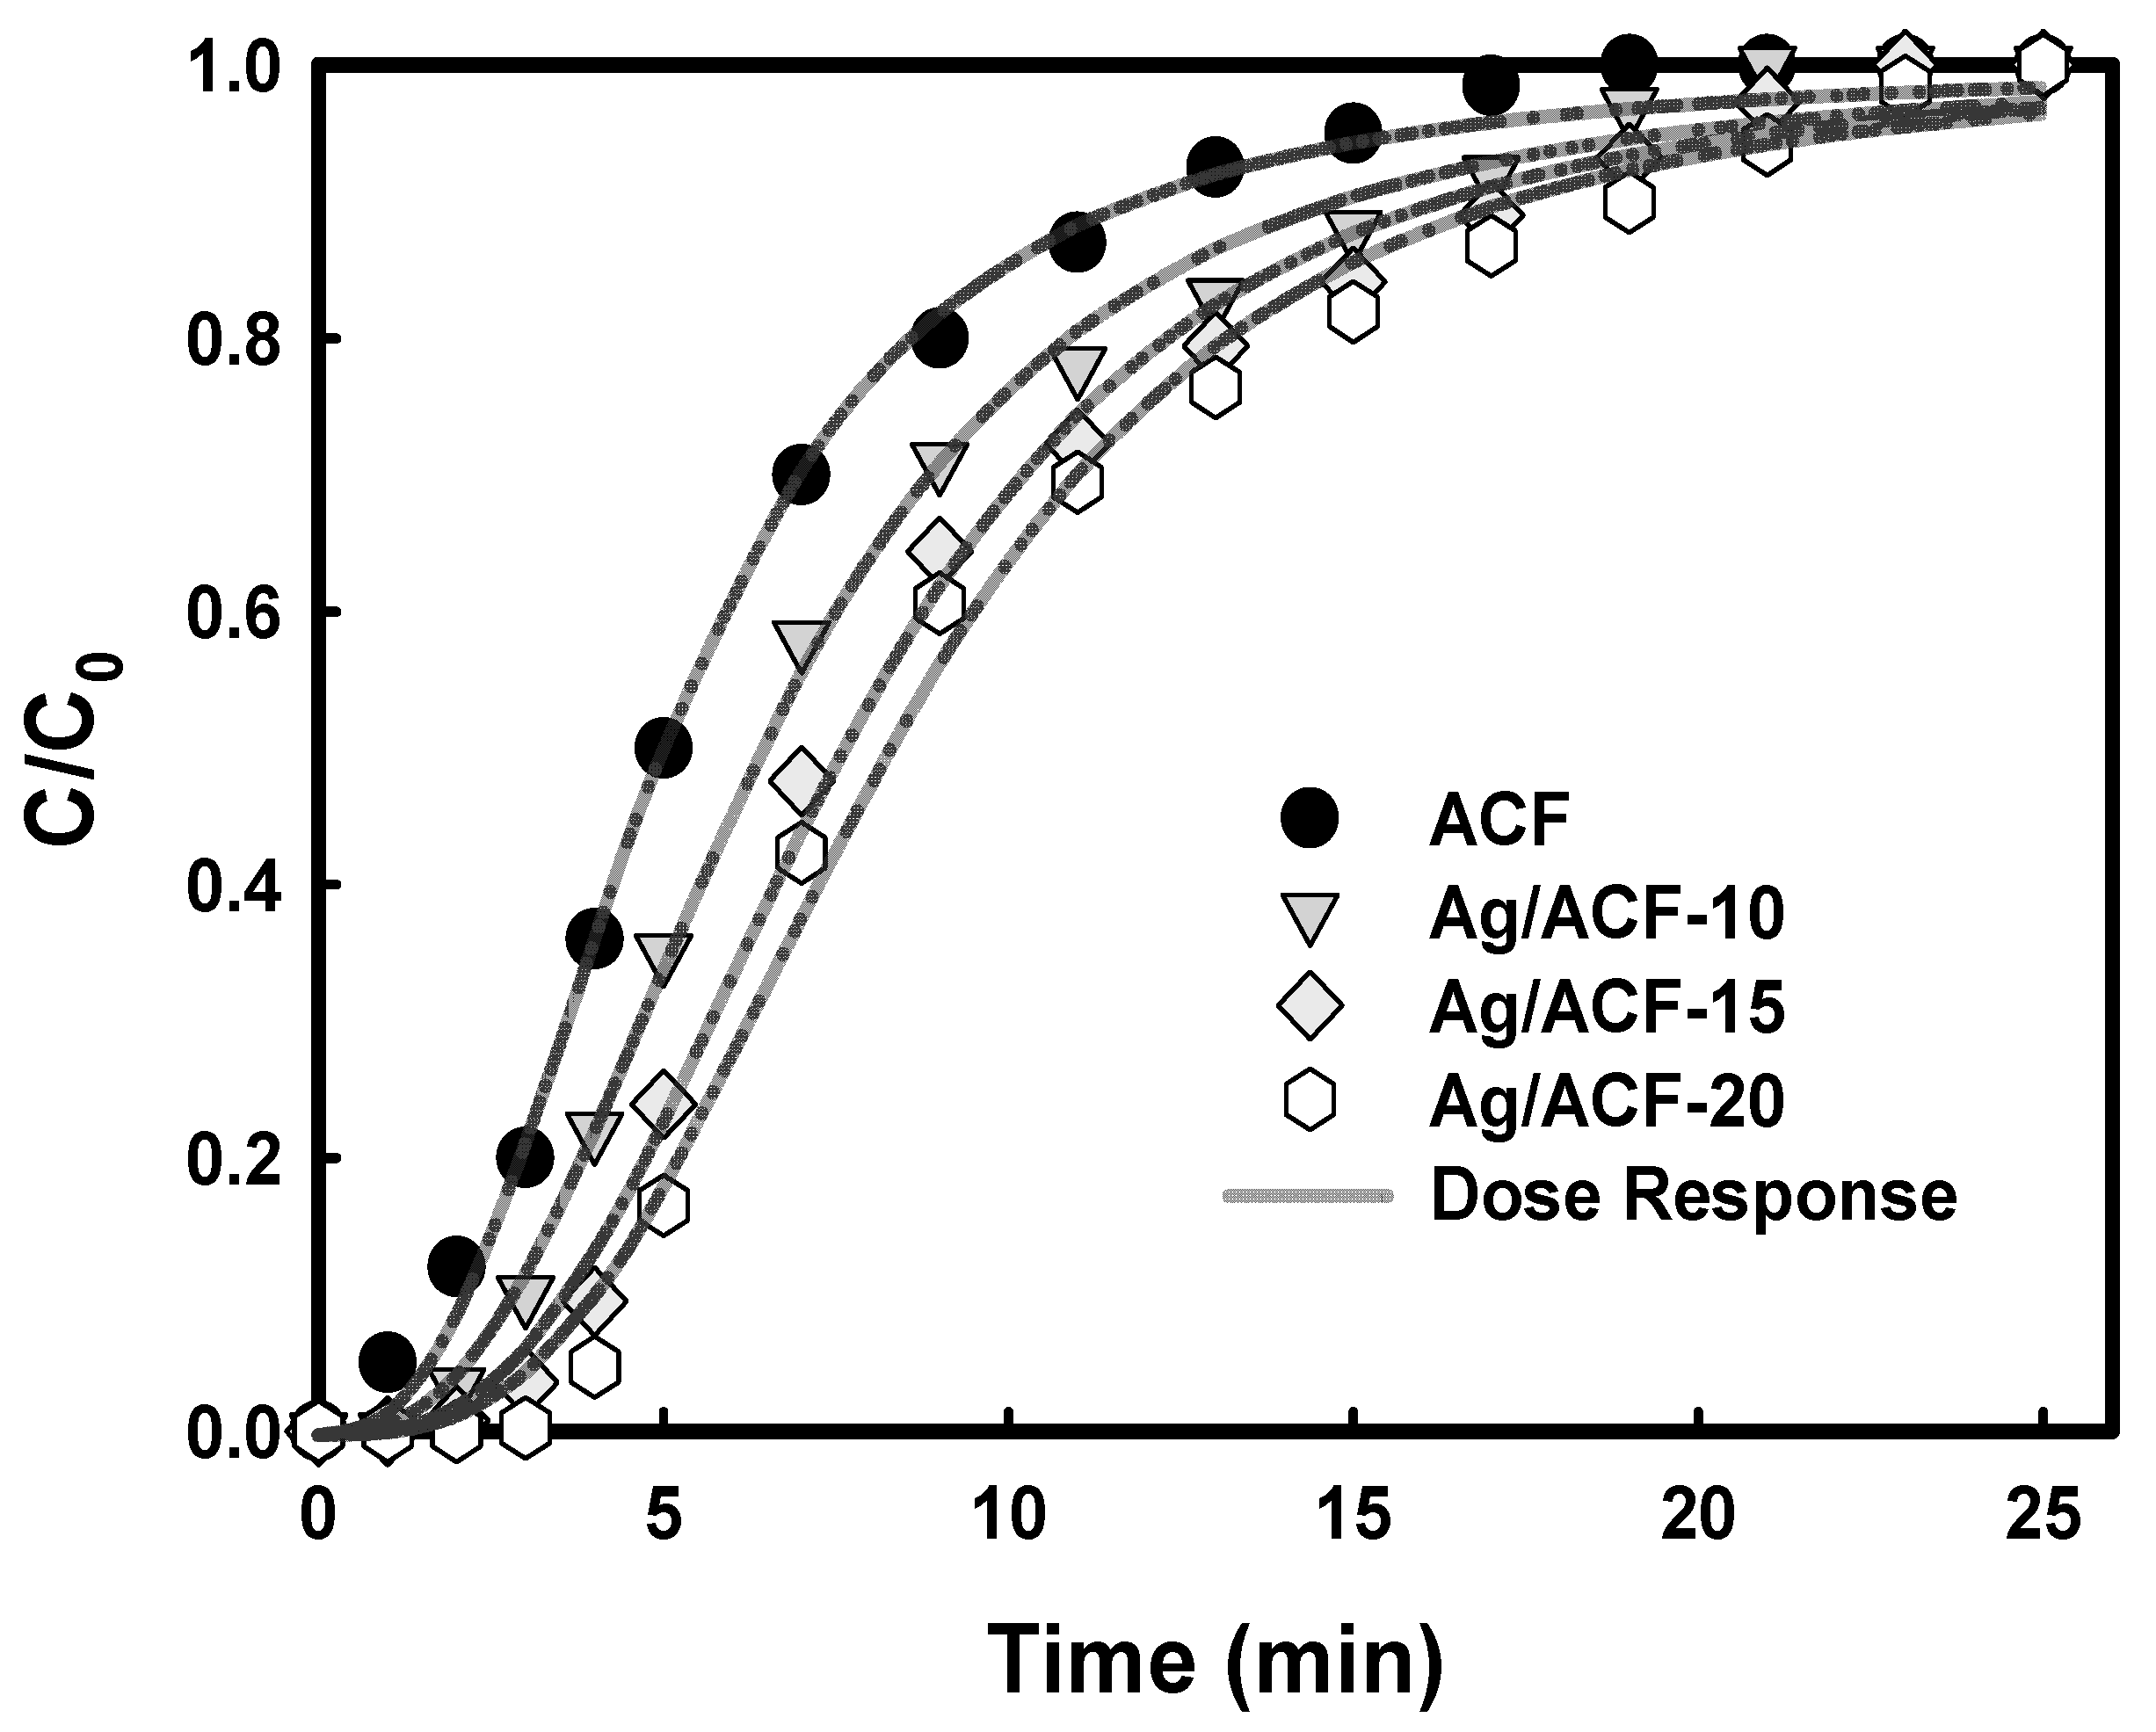
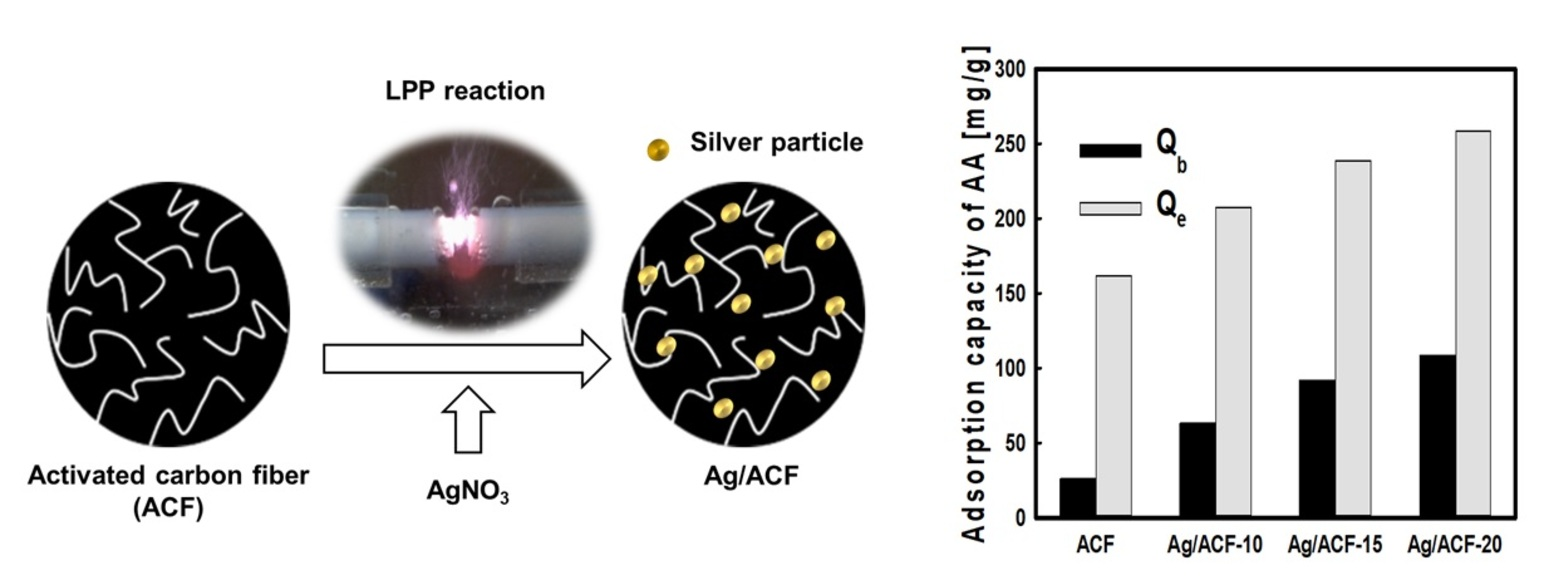
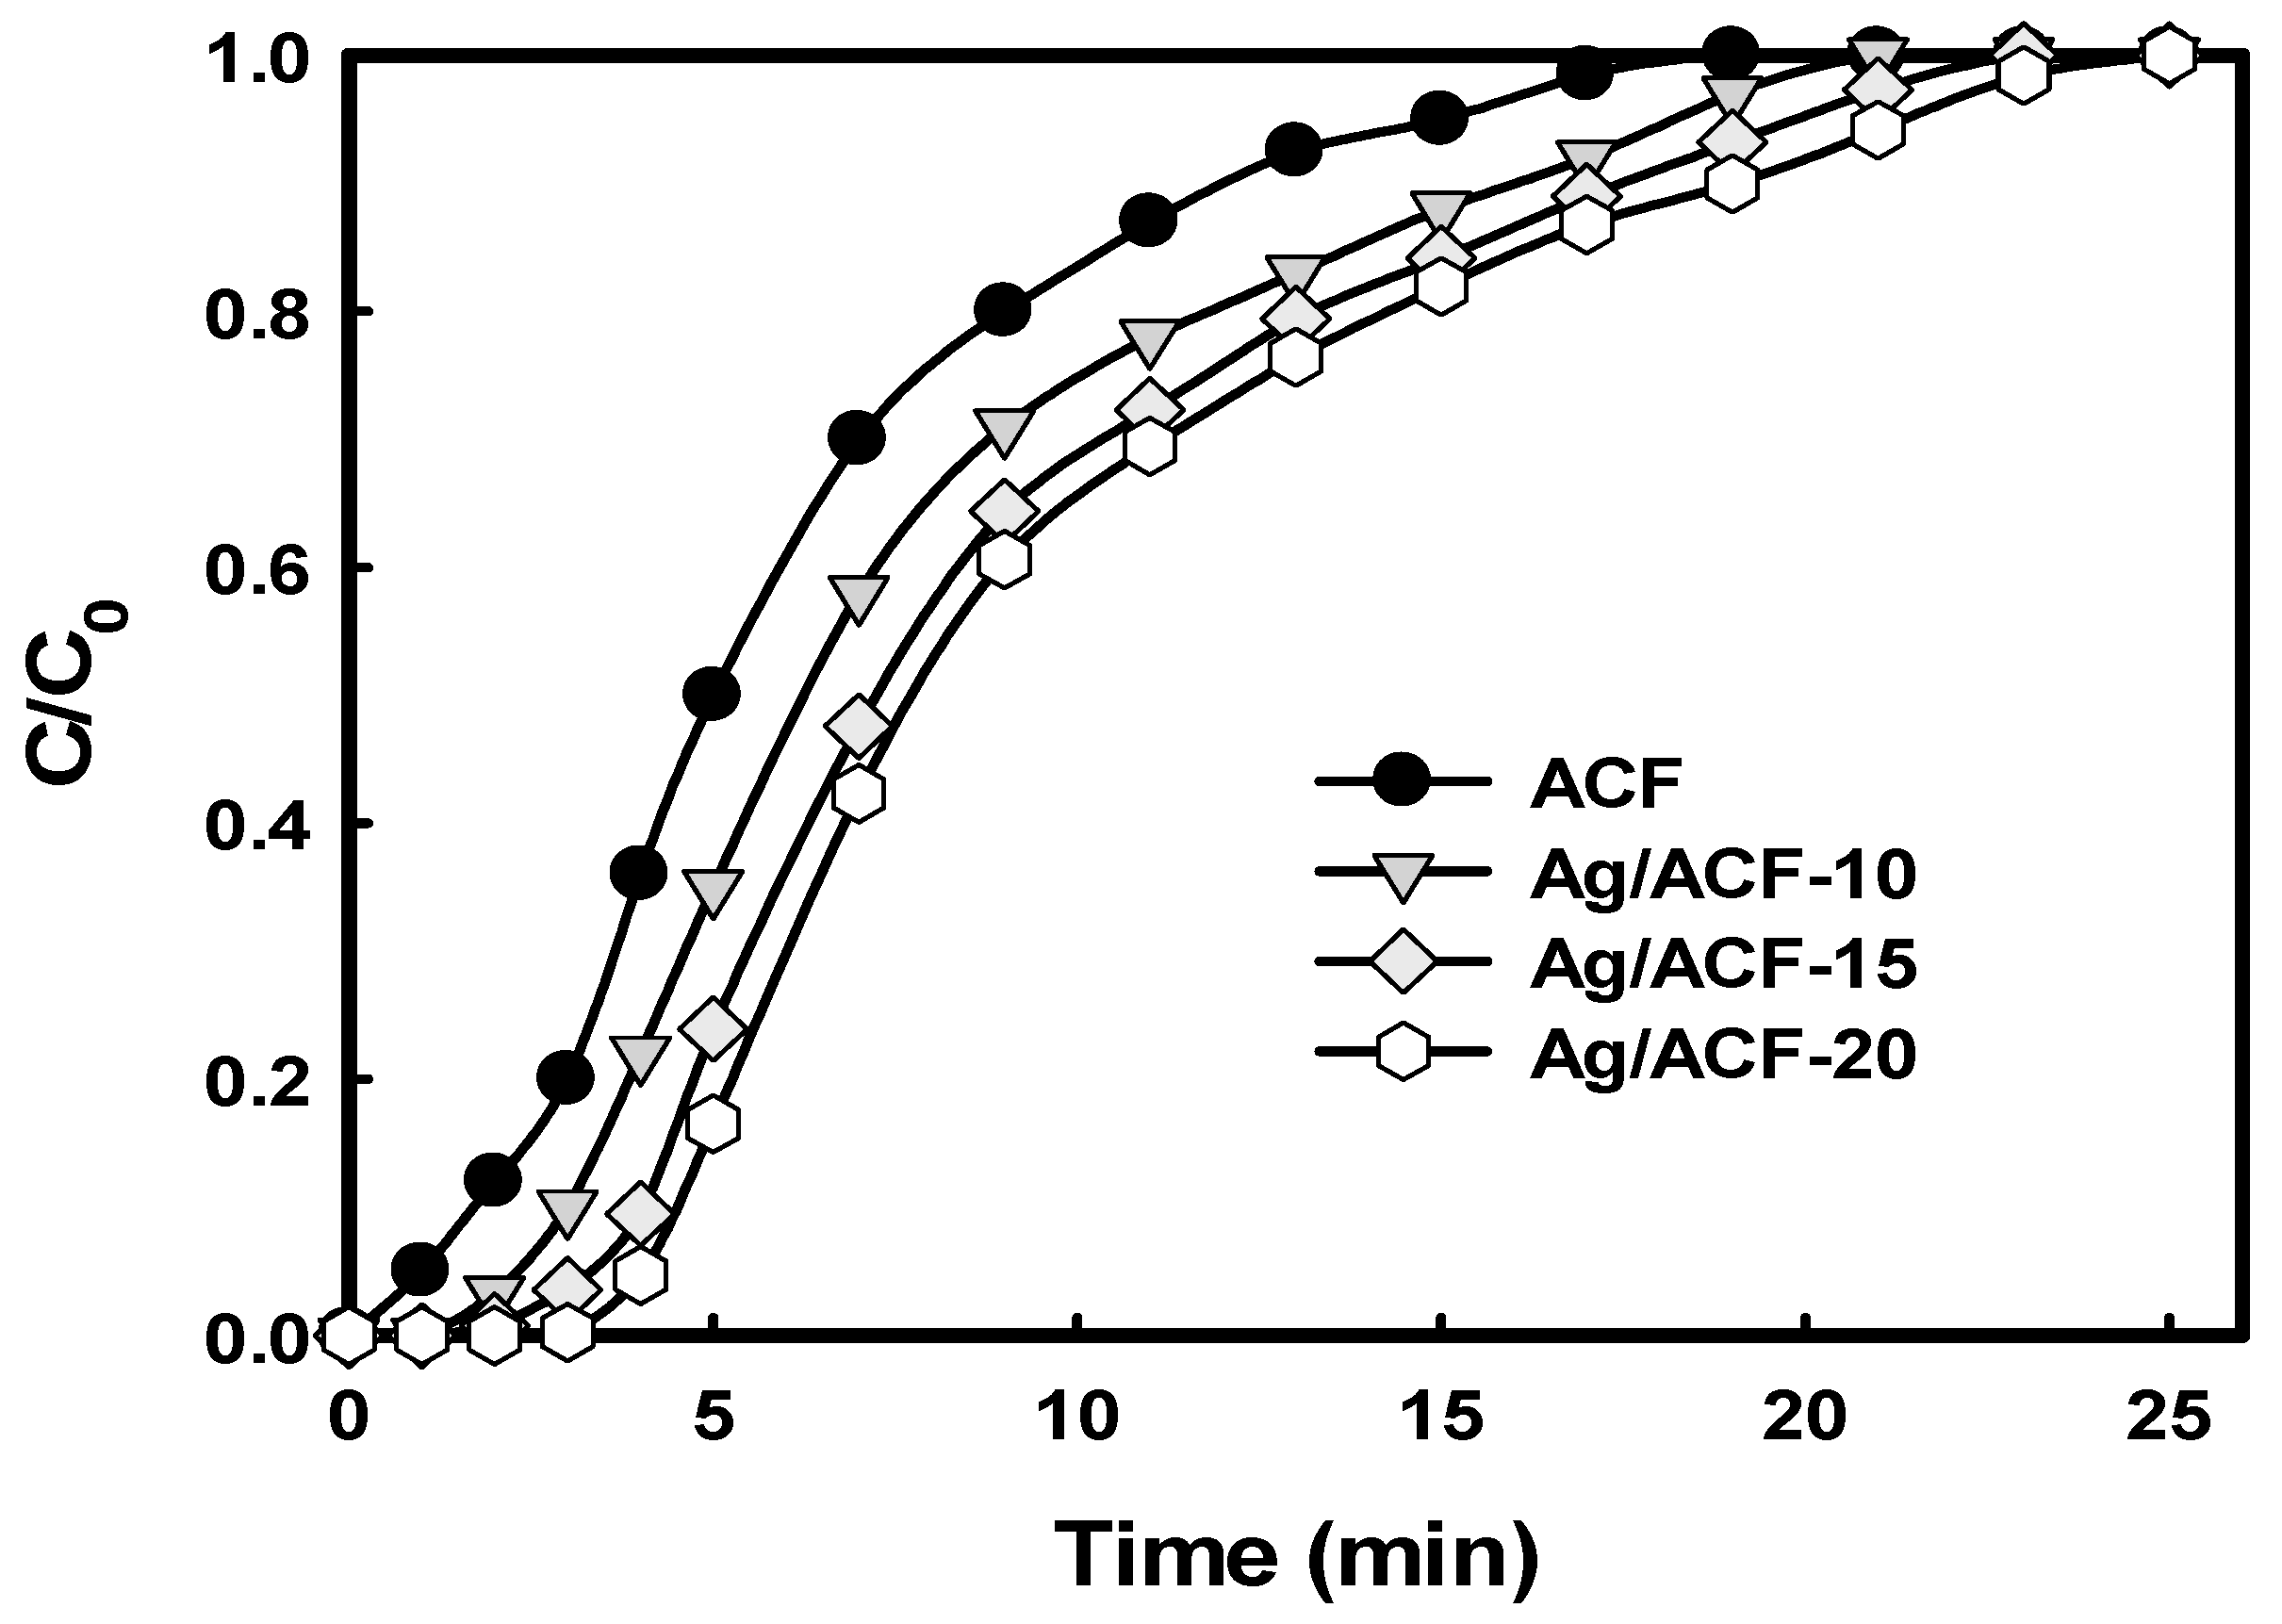
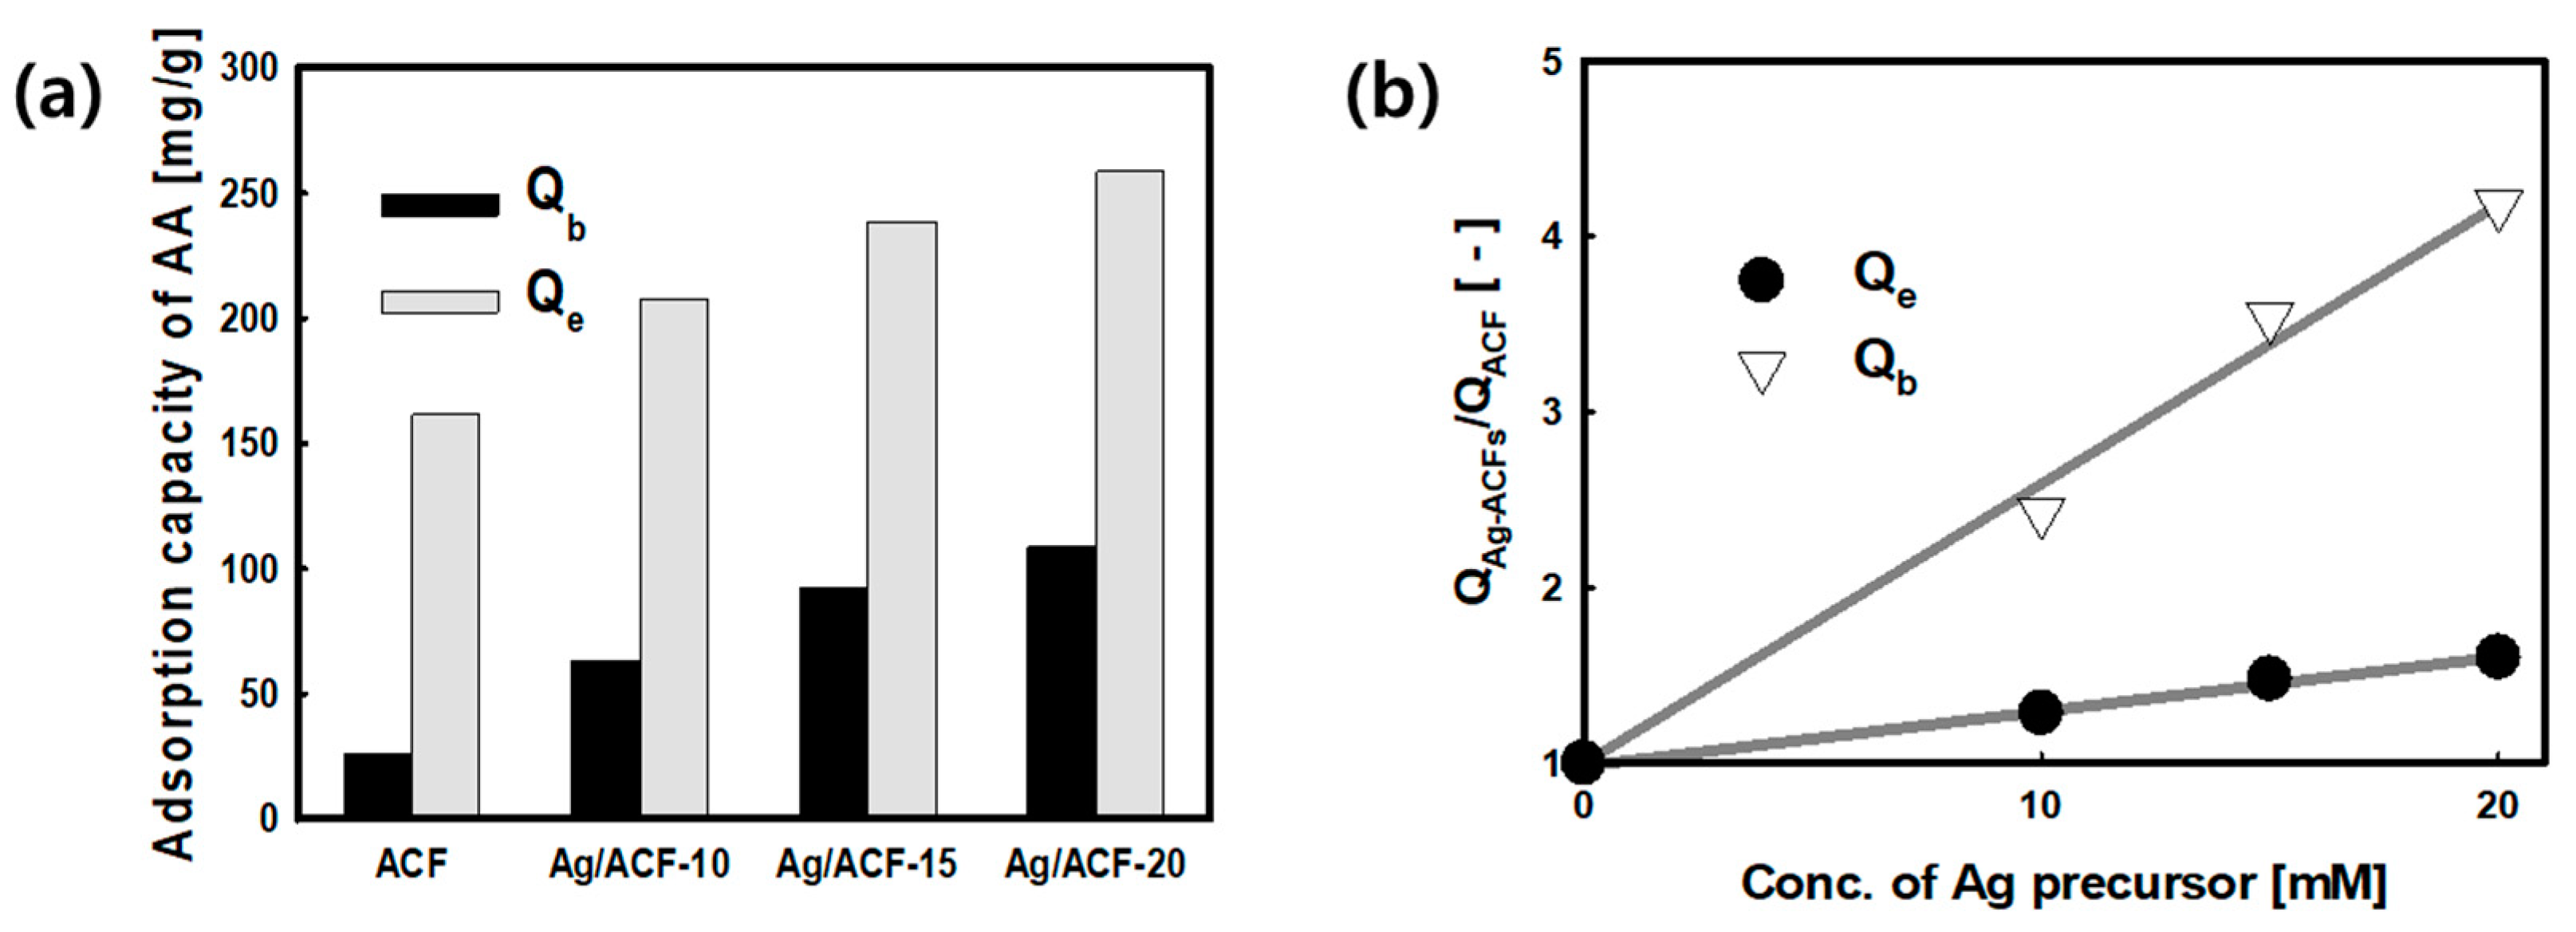
| Sample | tb 1 (min) | te 2 (min) | Qb 3 (mg/g) | Qe 4 (mg/g) | %Rb 5 | %Re 6 | h_MTZ 7 (cm) |
|---|---|---|---|---|---|---|---|
| ACF | 1.0 | 19.0 | 26.0 | 161.6 | 97.5 | 31.9 | 0.42 |
| Ag/ACF-10 | 2.4 | 21.0 | 63.1 | 207.5 | 98.6 | 37.1 | 0.35 |
| Ag/ACF-15 | 3.5 | 23.0 | 92.1 | 238.8 | 98.7 | 38.9 | 0.31 |
| Ag/ACF-20 | 4.1 | 25.0 | 108.6 | 258.7 | 99.4 | 38.8 | 0.29 |
| Model | Parameter | ACF | Ag/ACF-10 | Ag/ACF-15 | Ag/ACF-20 |
|---|---|---|---|---|---|
| Bohart–Adams 1 | kBA (L/mg min) | 2.443 × 10⁻² | 2.044×10⁻² | 1.936 × 10⁻² | 1.876 × 10⁻² |
| N0 (mg/L) | 1.018 × 10⁵ | 1.101×10⁵ | 1.216 × 10⁵ | 1.272 × 10⁵ | |
| R2 | 0.989 | 0.979 | 0.977 | 0.972 | |
| Thomas 2 | kTh (L/mg min) | 2.443 × 10⁻² | 2.044 × 10⁻² | 1.936 × 10⁻² | 1.876 × 10⁻² |
| Q0 (mg/g) | 146.9 | 158.9 | 175.5 | 183.6 | |
| R2 | 0.989 | 0.979 | 0.977 | 0.972 | |
| Yoon–Nelson 3 | kYN (1/min) | 5.509 | 7.123 | 8.308 | 8.968 |
| (min) | 0.489 | 0.409 | 0.387 | 0.375 | |
| R2 | 0.989 | 0.979 | 0.977 | 0.972 | |
| Dose–Response 4 | a | 2.565 | 2.652 | 2.902 | 3.001 |
| QF(mg/g) | 133.3 | 171.6 | 203.0 | 220.9 | |
| R2 | 0.997 | 0.997 | 0.996 | 0.994 | |
| Clark 5 | B | 0.288 | 0.247 | 0.163 | 0.115 |
| r (1/min) | 0.339 | 0.278 | 0.263 | 0.251 | |
| n | 1.067 | 1.052 | 1.029 | 1.019 | |
| R2 | 0.997 | 0.992 | 0.991 | 0.989 |
Publisher’s Note: MDPI stays neutral with regard to jurisdictional claims in published maps and institutional affiliations. |
© 2021 by the authors. Licensee MDPI, Basel, Switzerland. This article is an open access article distributed under the terms and conditions of the Creative Commons Attribution (CC BY) license (https://creativecommons.org/licenses/by/4.0/).
Share and Cite
Kim, B.-J.; An, K.-H.; Shim, W.-G.; Park, Y.-K.; Park, J.; Lee, H.; Jung, S.-C. Acetaldehyde Adsorption Characteristics of Ag/ACF Composite Prepared by Liquid Phase Plasma Method. Nanomaterials 2021, 11, 2344. https://doi.org/10.3390/nano11092344
Kim B-J, An K-H, Shim W-G, Park Y-K, Park J, Lee H, Jung S-C. Acetaldehyde Adsorption Characteristics of Ag/ACF Composite Prepared by Liquid Phase Plasma Method. Nanomaterials. 2021; 11(9):2344. https://doi.org/10.3390/nano11092344
Chicago/Turabian StyleKim, Byung-Joo, Kay-Hyeok An, Wang-Geun Shim, Young-Kwon Park, Jaegu Park, Heon Lee, and Sang-Chul Jung. 2021. "Acetaldehyde Adsorption Characteristics of Ag/ACF Composite Prepared by Liquid Phase Plasma Method" Nanomaterials 11, no. 9: 2344. https://doi.org/10.3390/nano11092344
APA StyleKim, B.-J., An, K.-H., Shim, W.-G., Park, Y.-K., Park, J., Lee, H., & Jung, S.-C. (2021). Acetaldehyde Adsorption Characteristics of Ag/ACF Composite Prepared by Liquid Phase Plasma Method. Nanomaterials, 11(9), 2344. https://doi.org/10.3390/nano11092344