
pH Sensitive Dextran Coated Fluorescent Nanodiamonds as a Biomarker for HeLa Cells Endocytic Pathway and Increased Cellular Uptake


Abstract
1. Introduction
2. Materials and Methods
2.1. Materials
2.2. Cell Culture
2.3. FND Characterization
2.4. SEM Imaging
2.5. Cell Viability
2.6. Cellular Uptake of FNDs70
2.7. FNDs Subcellular Location
3. Results and Discussion
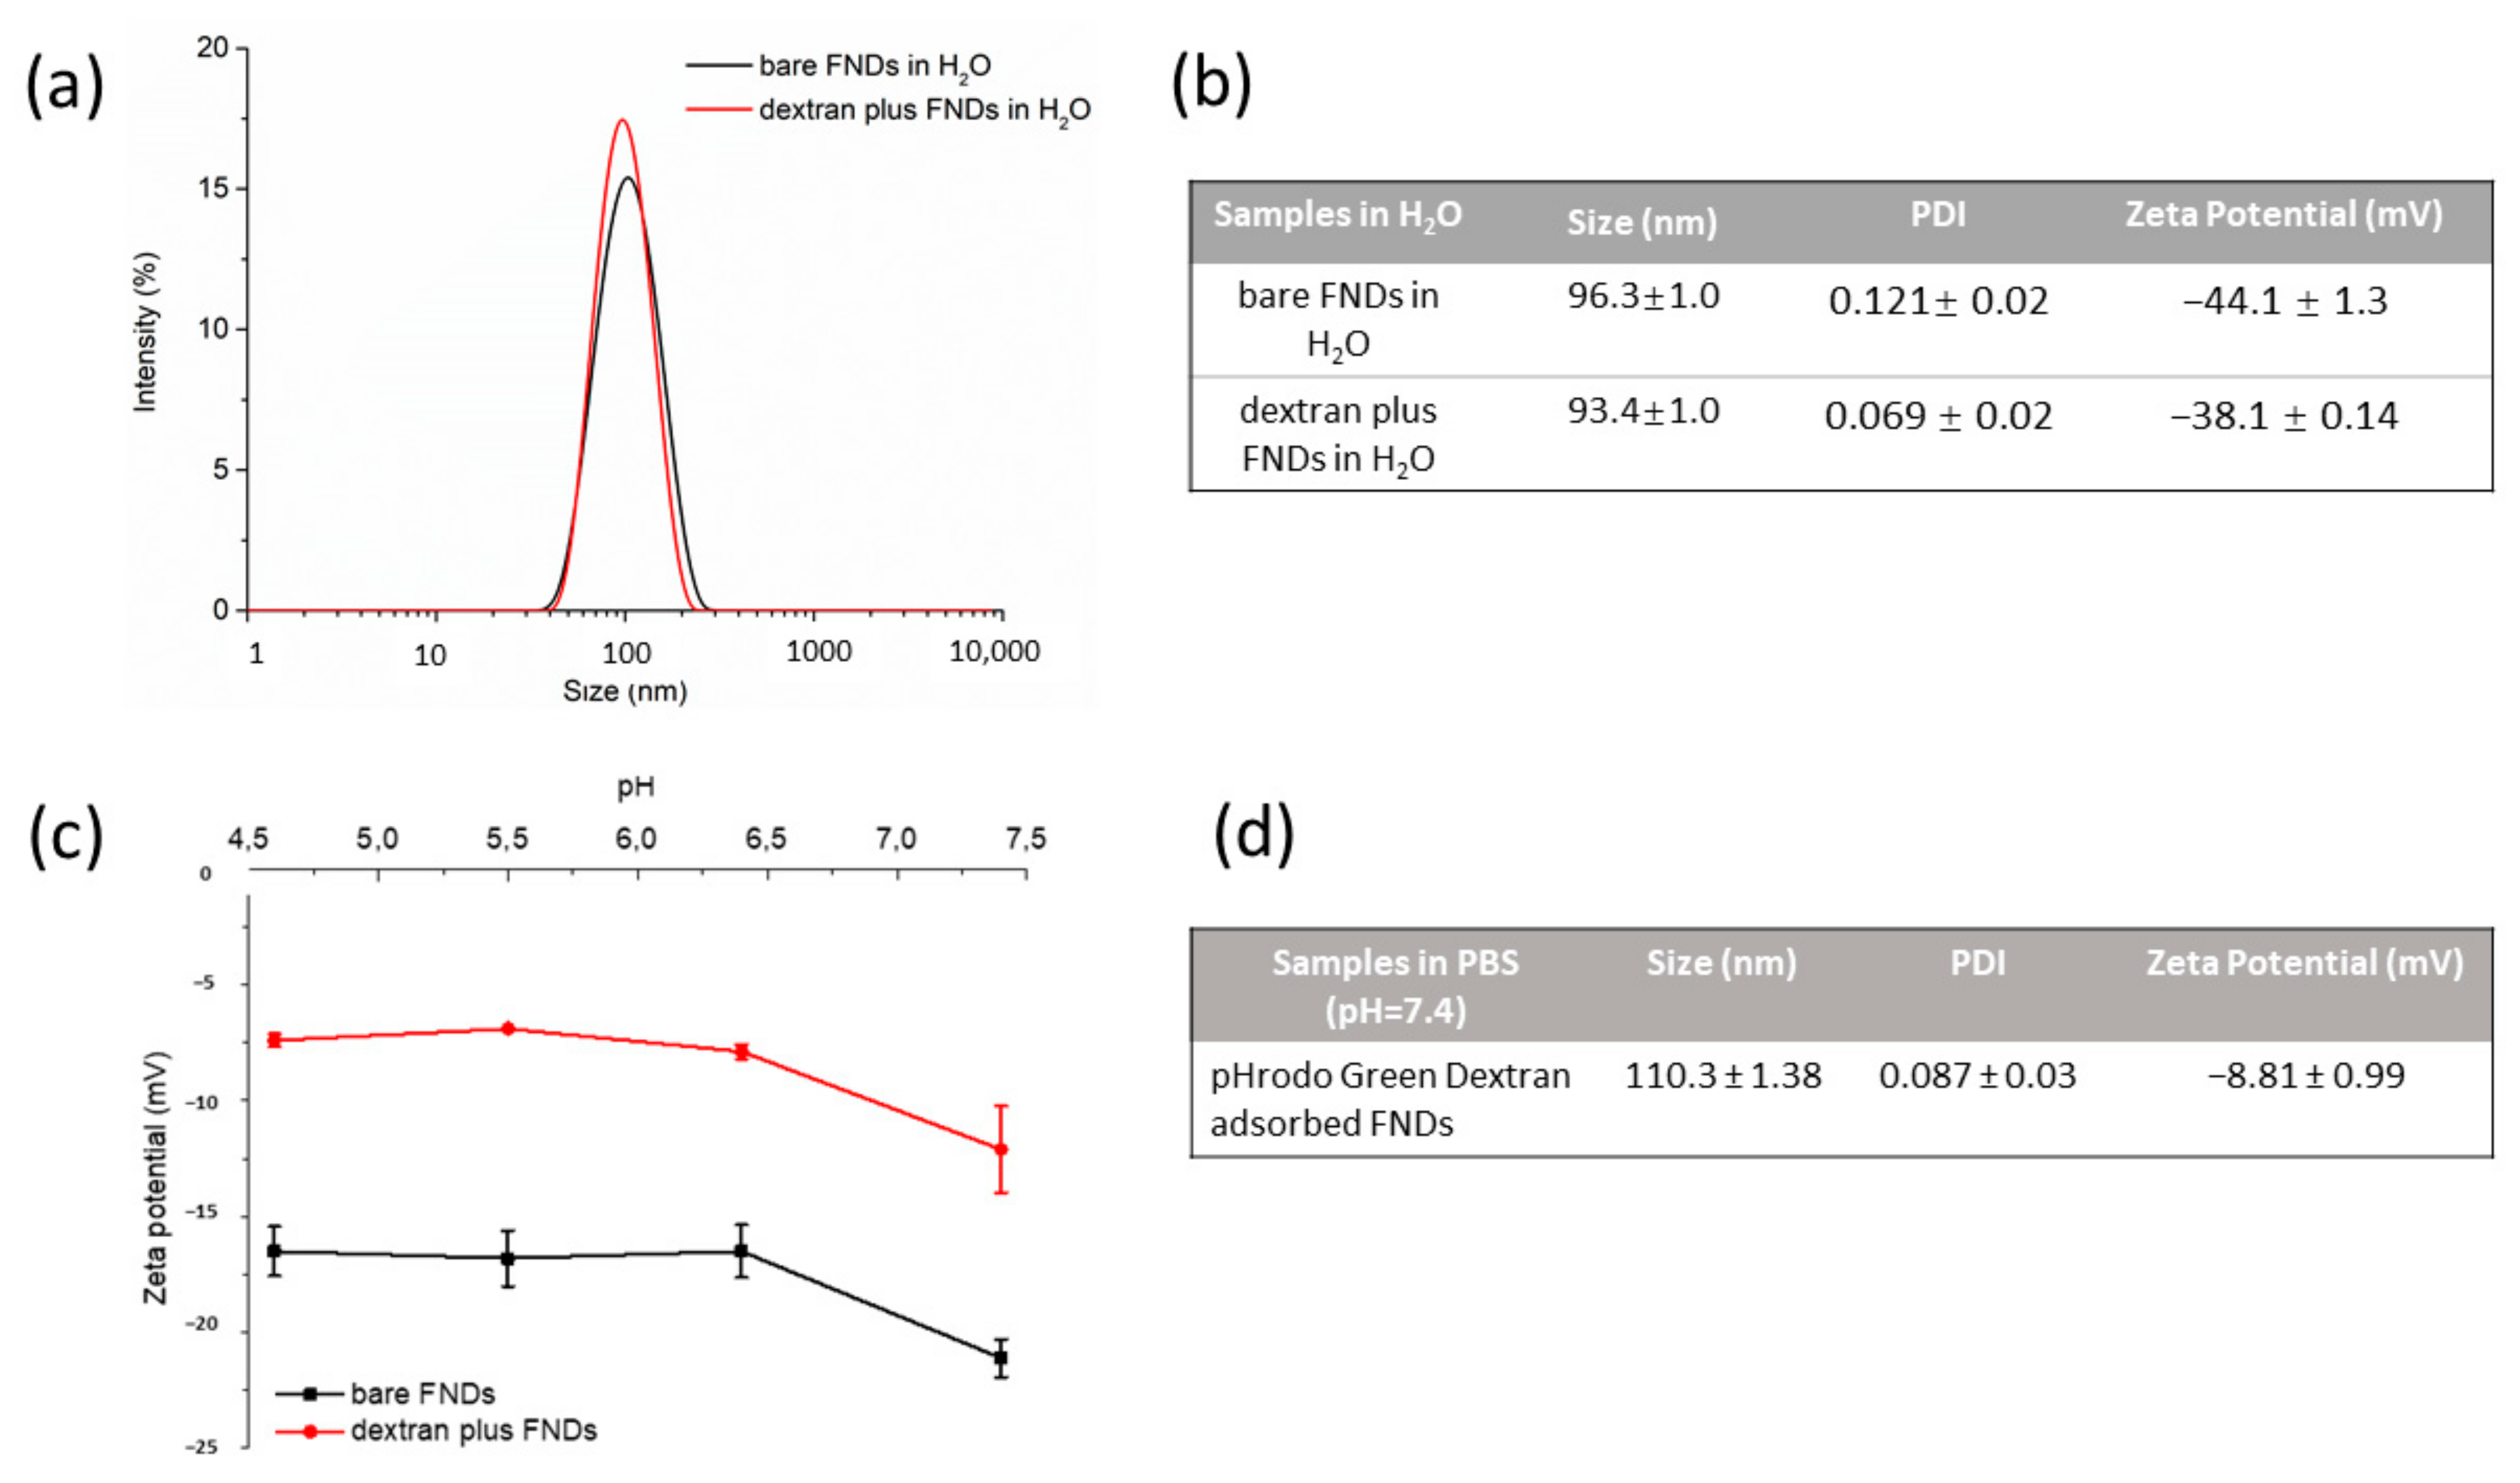
3.1. FNDs Characterization
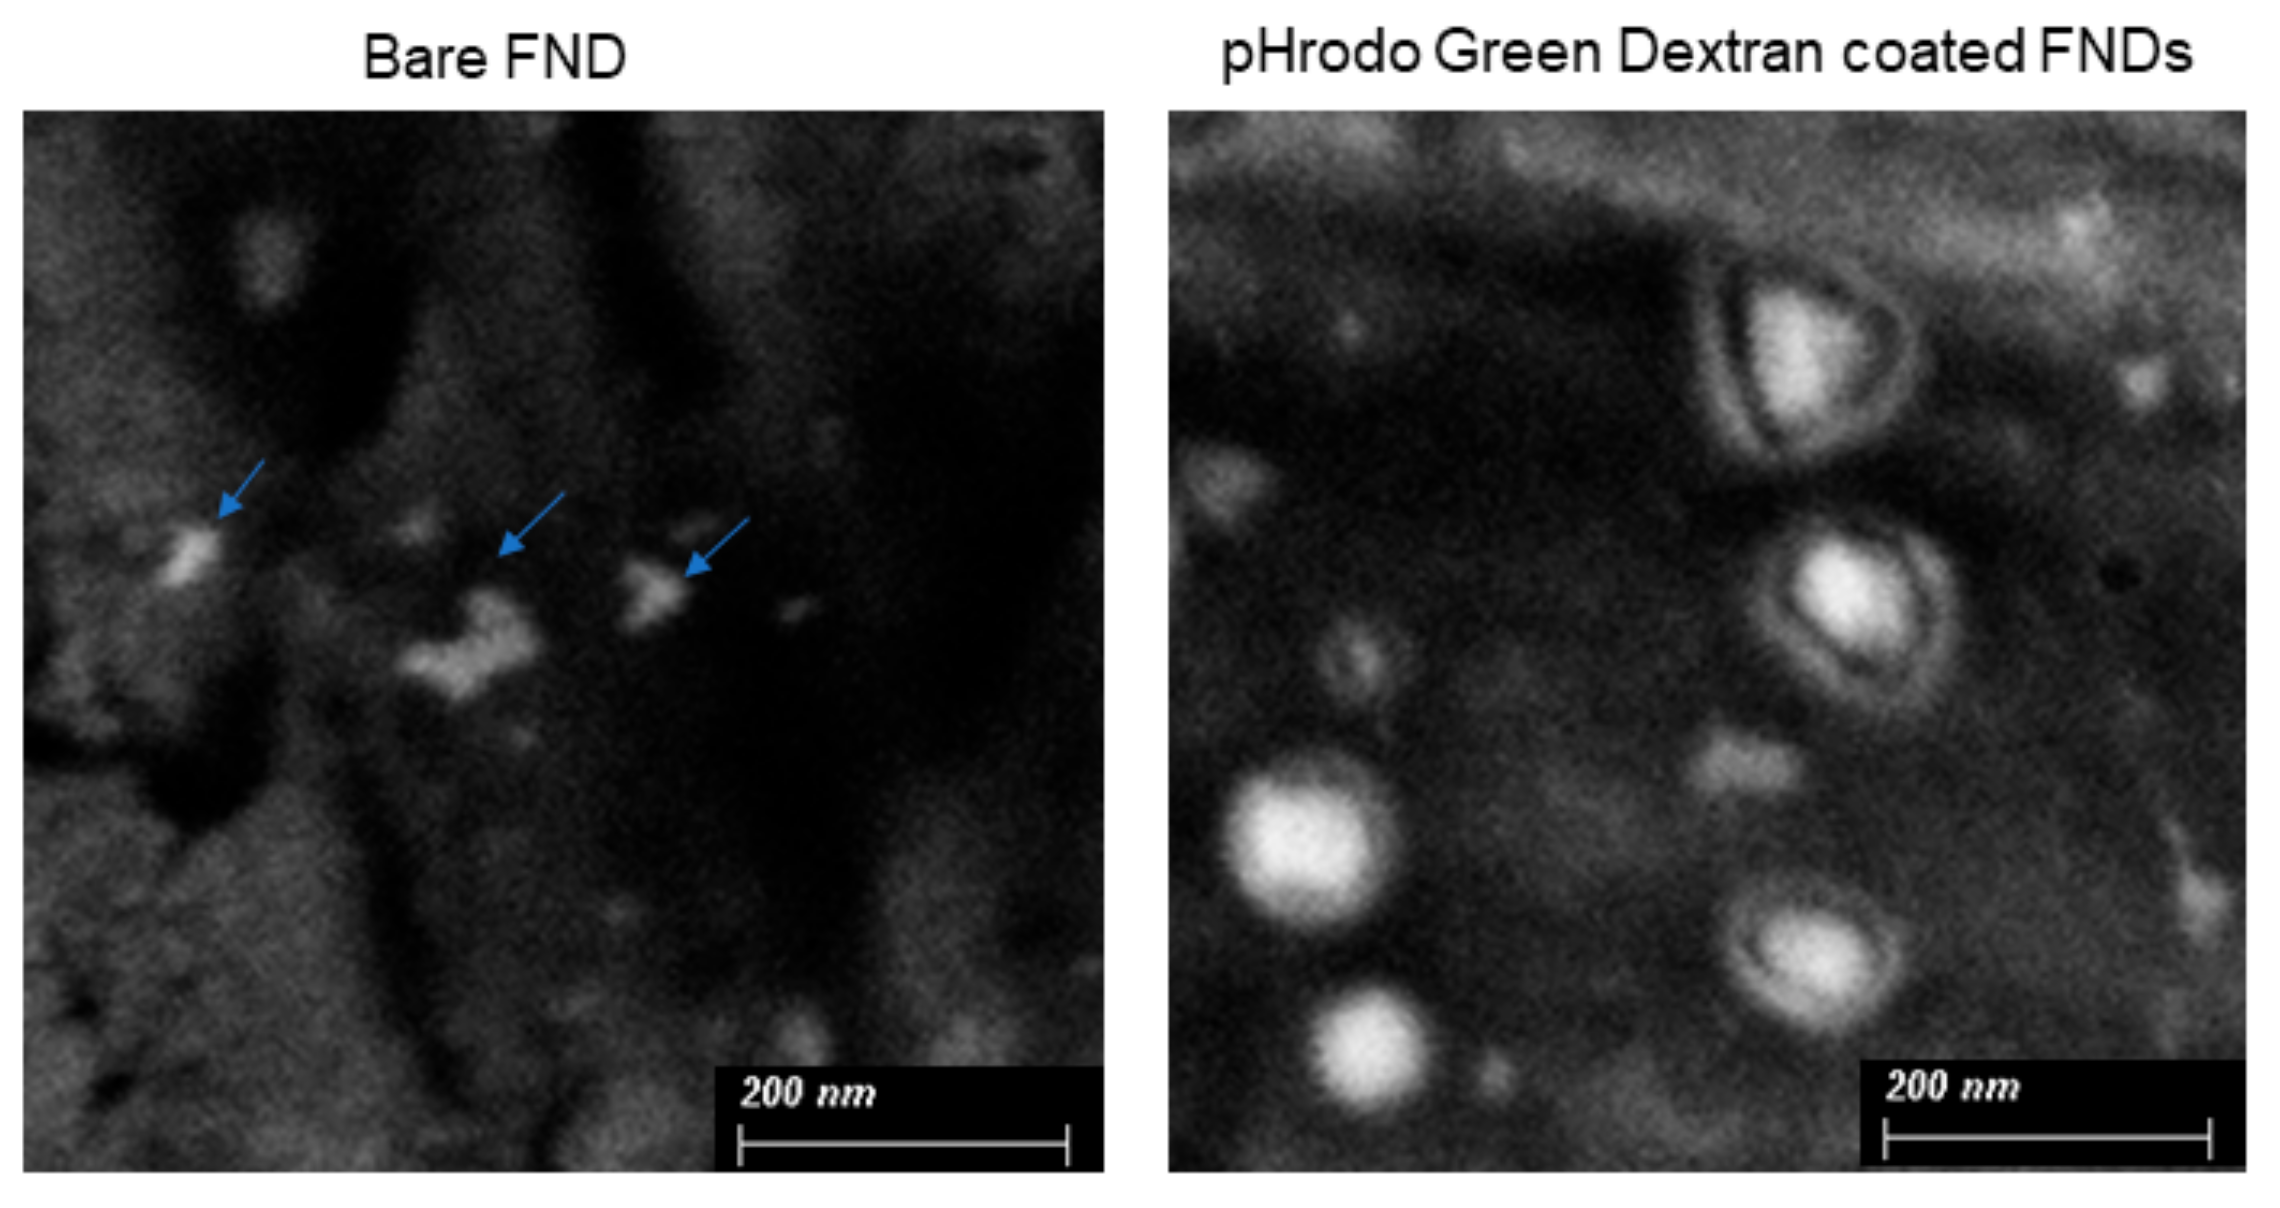
3.2. SEM Imaging
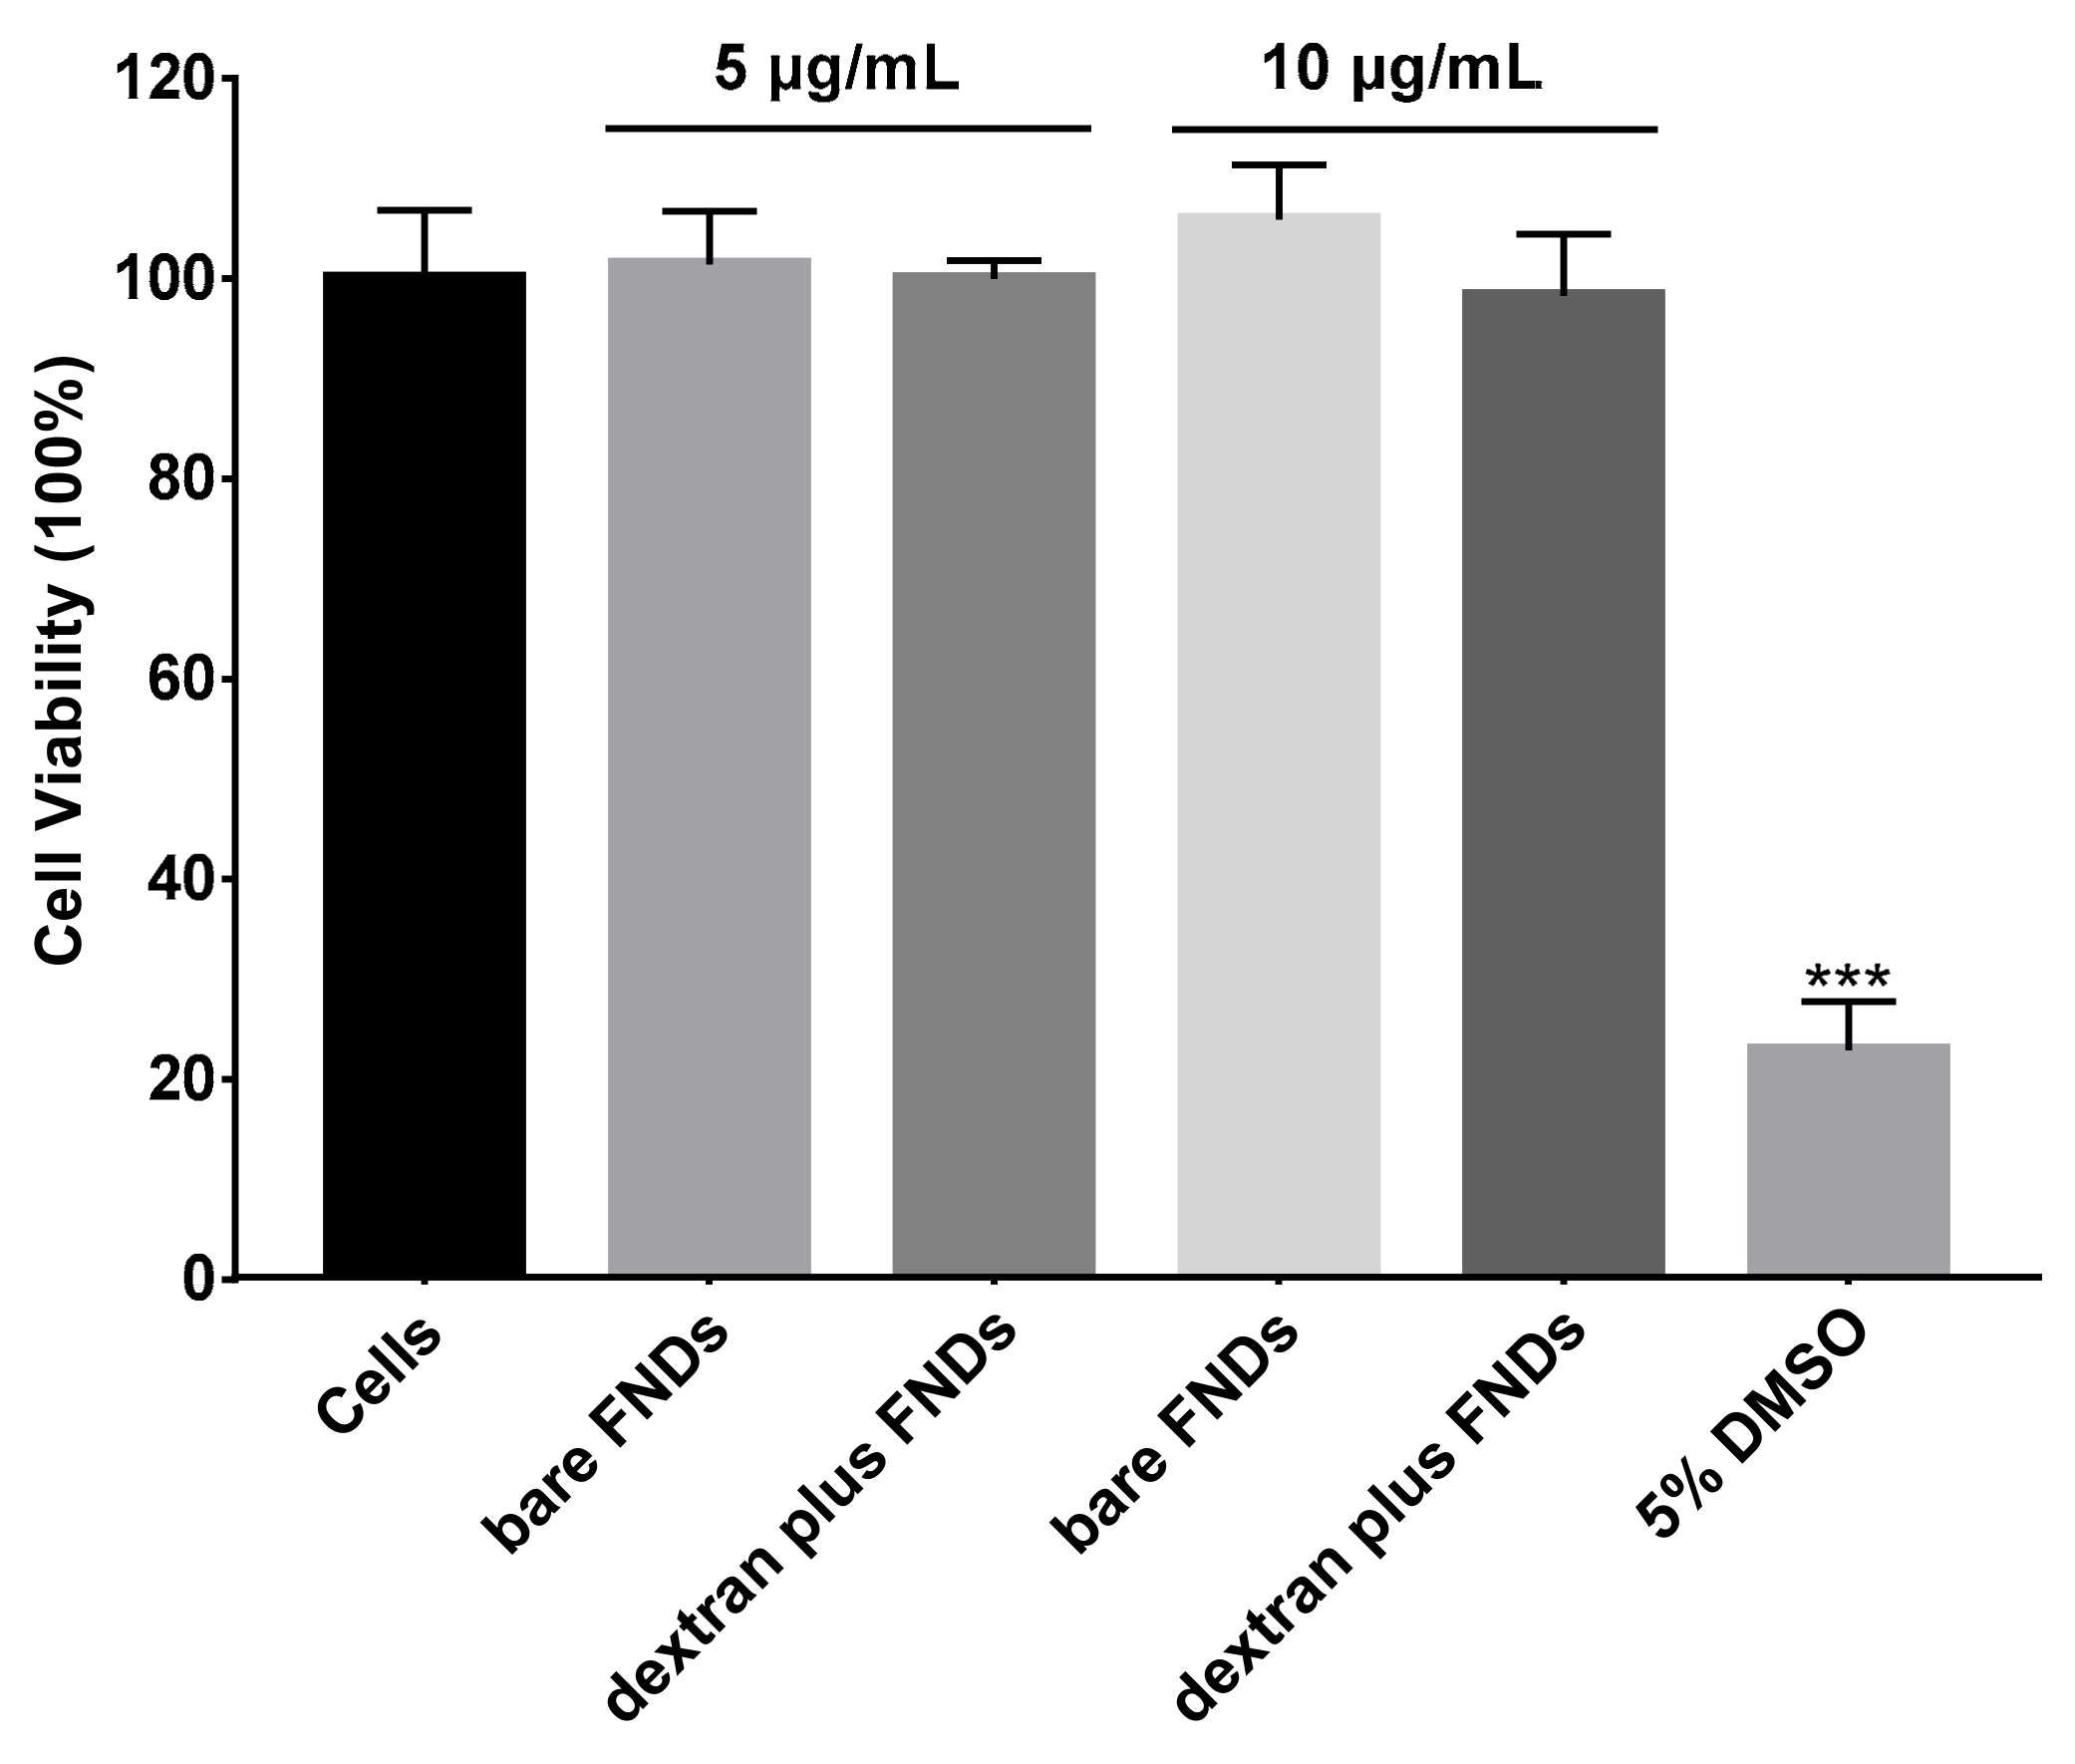
3.3. Cell Viability
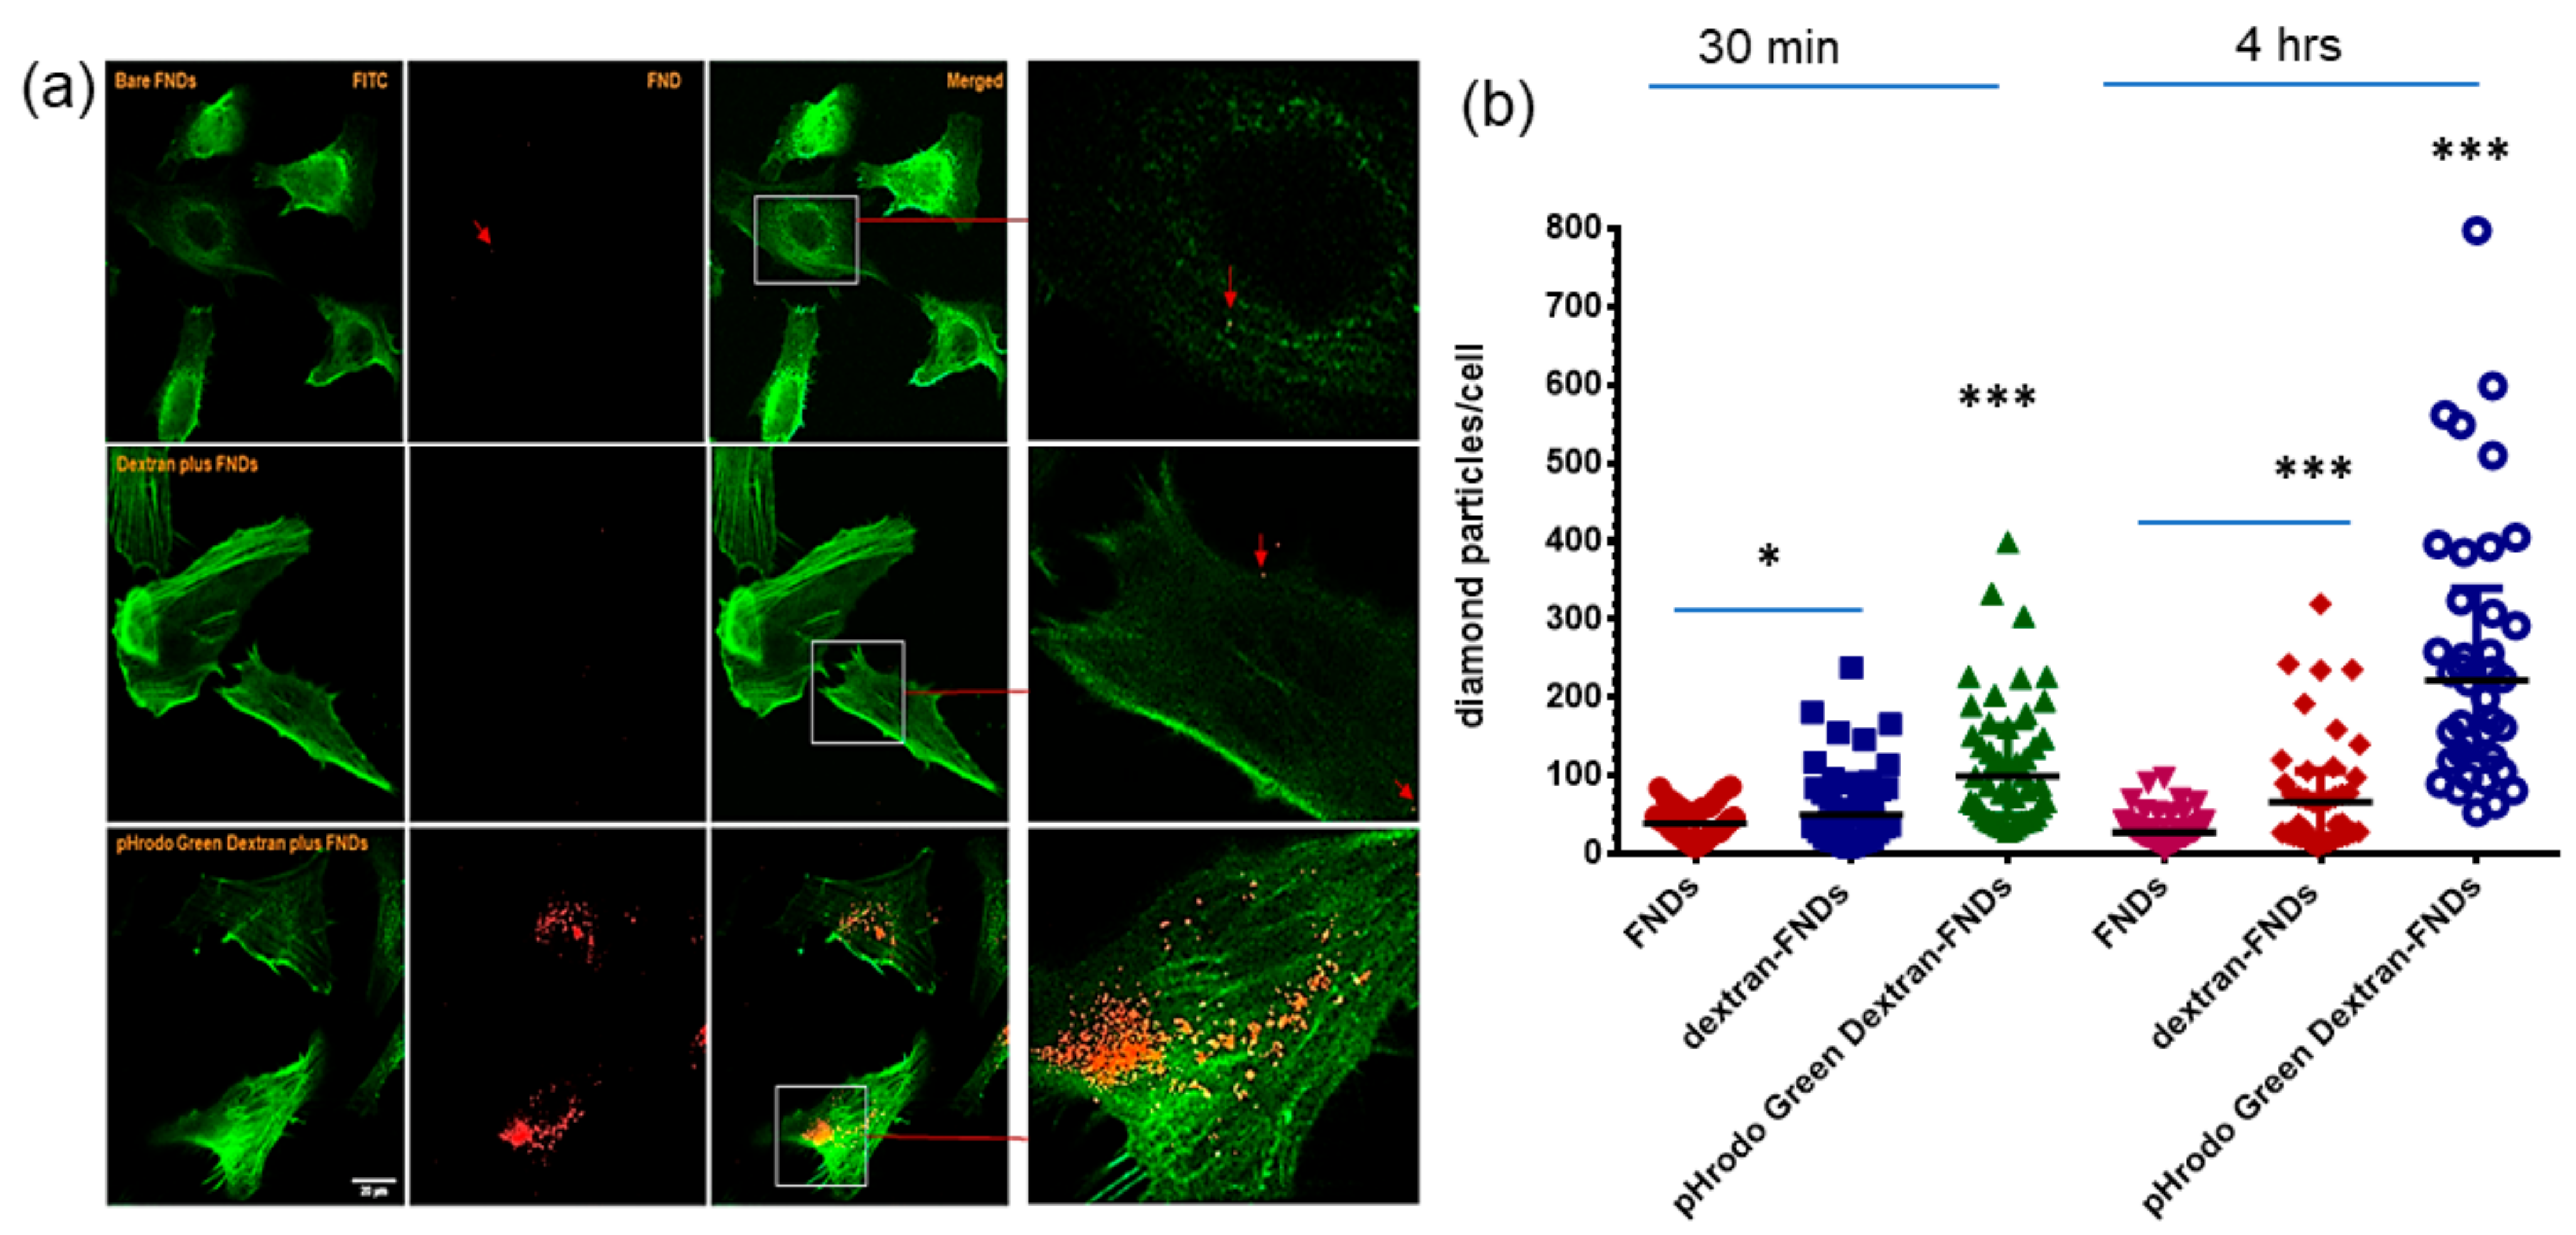
3.4. Cellular Uptake of FNDs
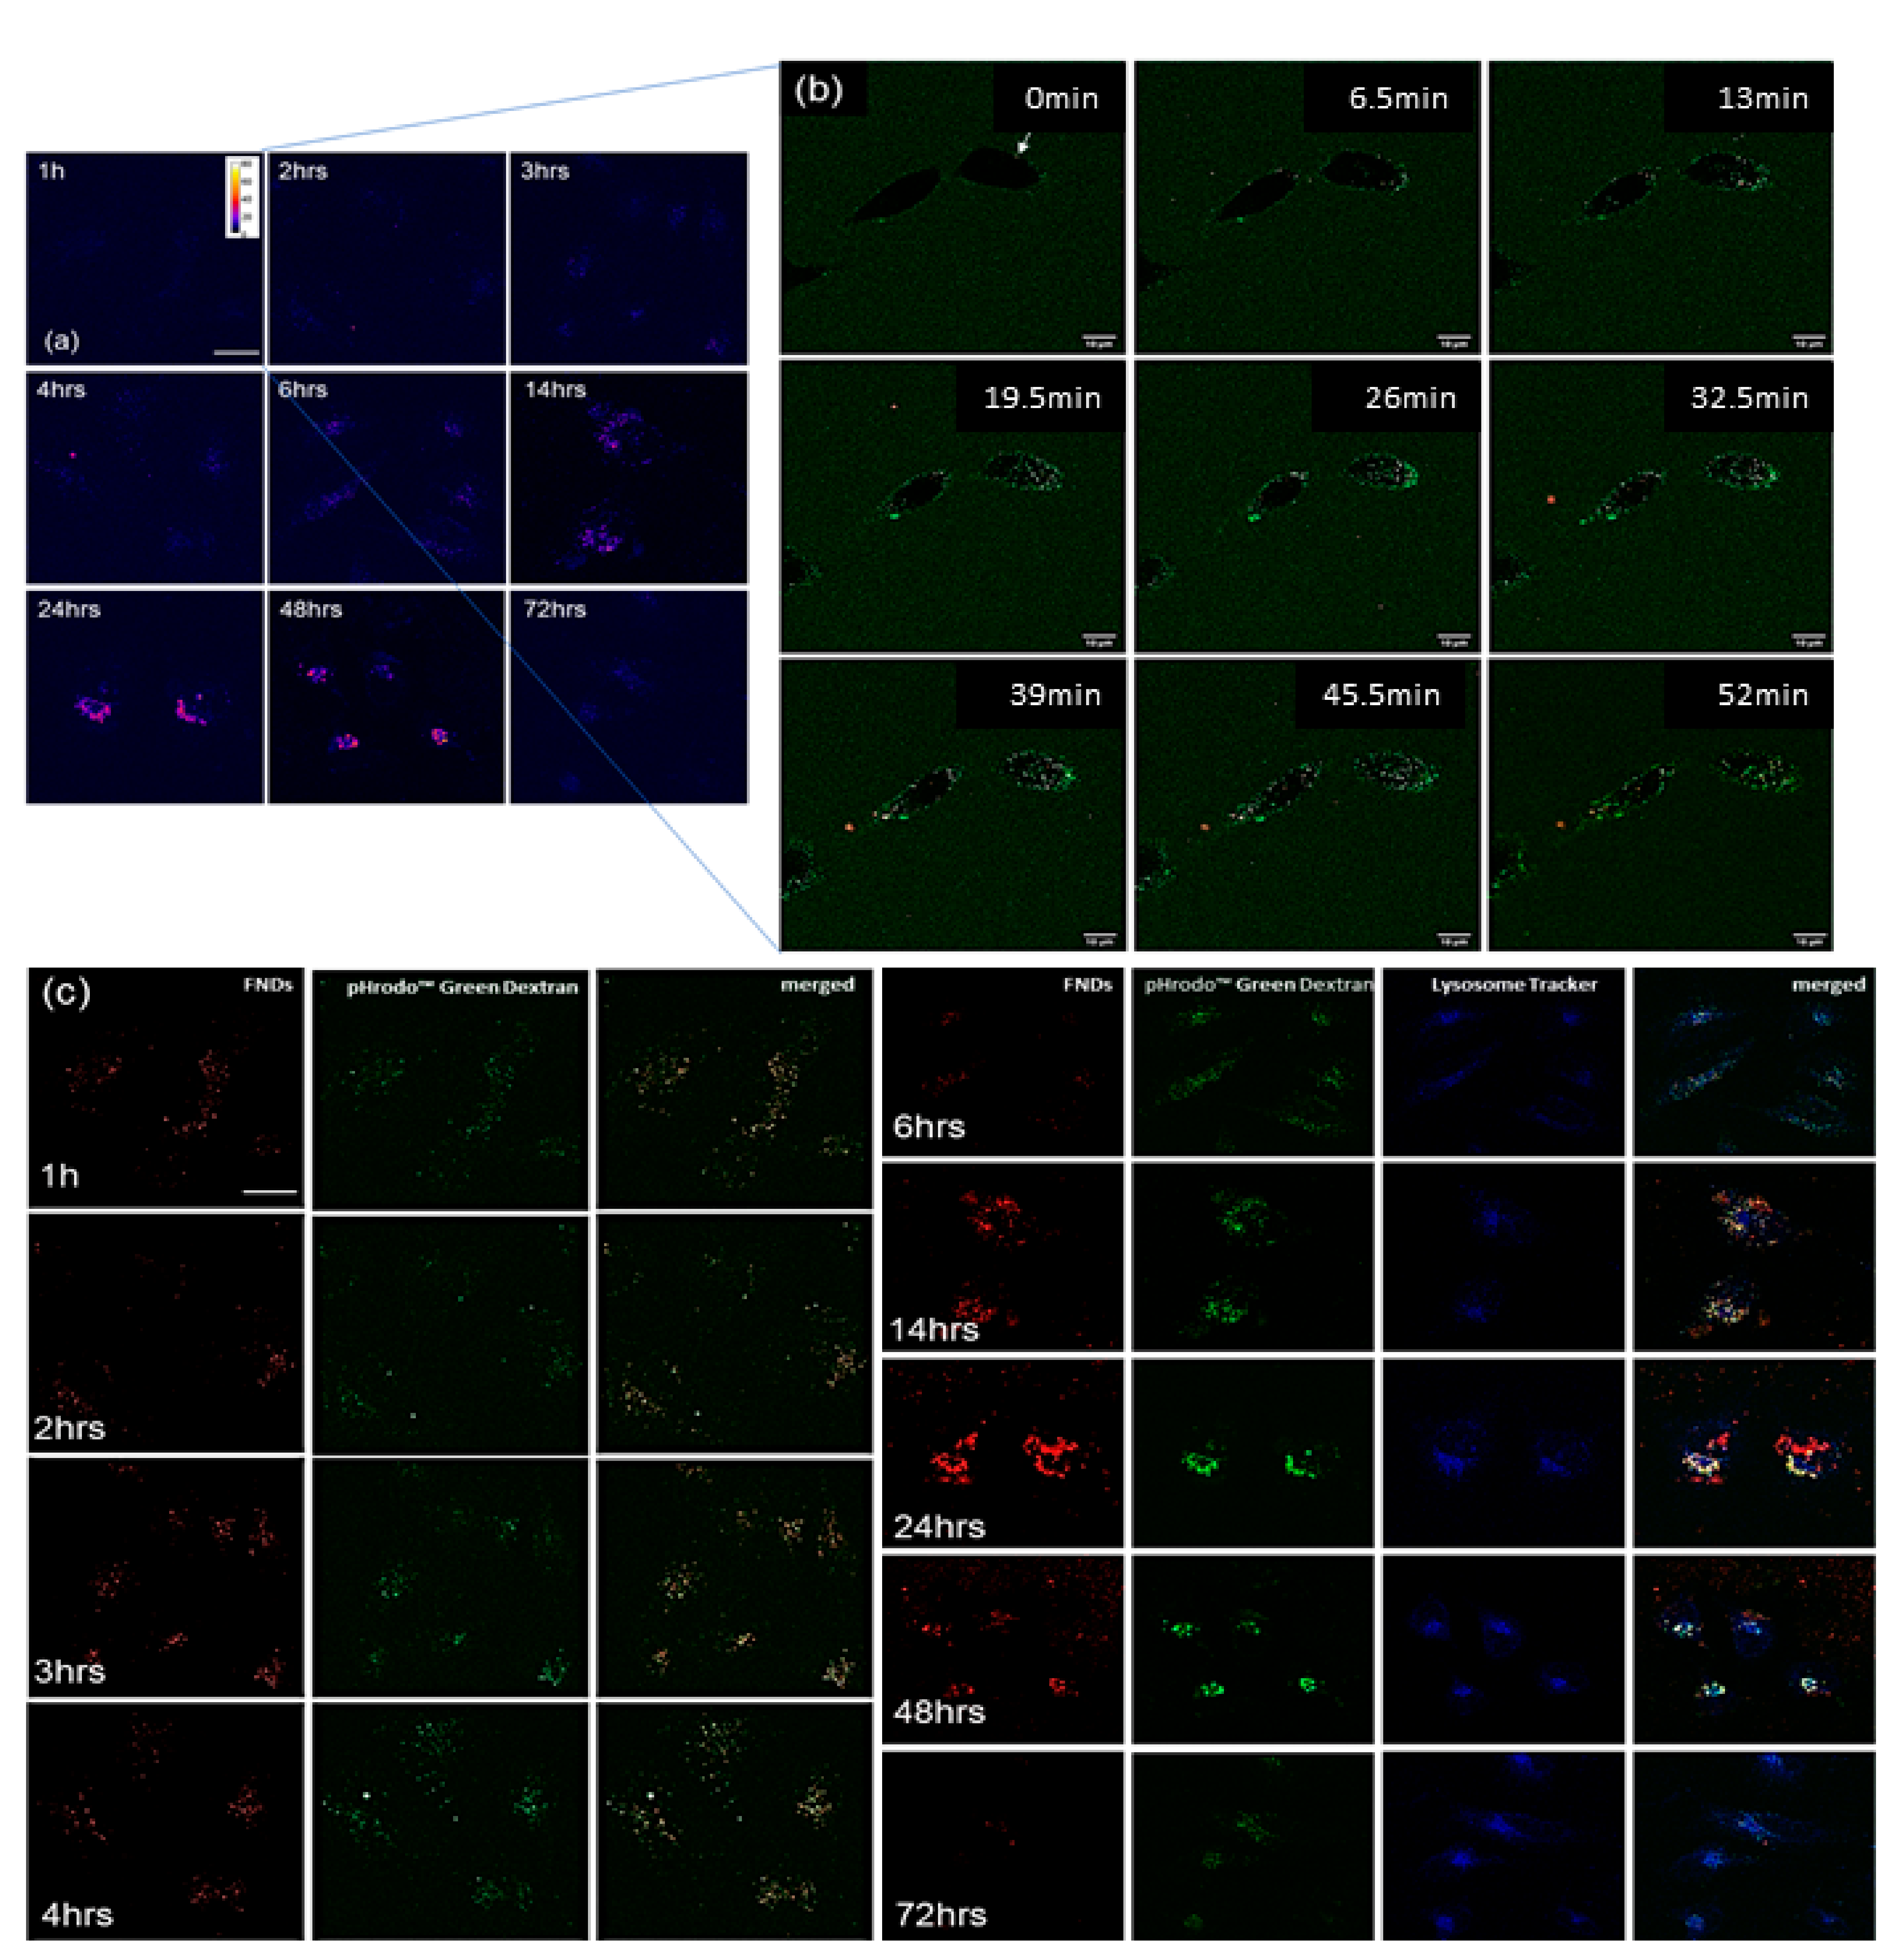
3.5. Subcellular Location of FNDs
4. Conclusions
5. Statistical Analysis
Supplementary Materials
Author Contributions
Funding
Data Availability Statement
Acknowledgments
Conflicts of Interest
References
- Alkahtani, M.H.; Alghannam, F.; Jiang, L.; Almethen, A.; Rampersaud, A.A.; Brick, R.; Gomes, C.L.; Scully, M.O.; Hemmer, P.R. Fluores-cent nanodiamonds: Past, present, and future. Nanophotonics 2018, 7, 1423–1453. [Google Scholar] [CrossRef]
- Que, R.; Shao, M.; Chen, T.; Xu, H.; Wang, S.; Lee, S.T. Diamond nanoparticles with more surface functional groups obtained using carbon nanotubes as sources. J. Appl. Phys. 2011, 110, 054321. [Google Scholar] [CrossRef]
- Kim, H.; Bin Man, H.; Saha, B.; Kopacz, A.M.; Lee, O.-S.; Schatz, G.C.; Ho, D.; Liu, W.K. Multiscale Simulation as a Framework for the Enhanced Design of Nanodiamond-Polyethylenimine-Based Gene Delivery. J. Phys. Chem. Lett. 2012, 3, 3791–3797. [Google Scholar] [CrossRef] [PubMed]
- Schmidlin, L.; Pichot, V.; Comet, M.; Josset, S.; Rabu, P.; Spitzer, D. Identification, quantification and modification of detonation nanodiamond functional groups. Diam. Relat. Mater. 2012, 22, 113–117. [Google Scholar] [CrossRef]
- Sigaeva, A.; Morita, A.; Hemelaar, S.R.; Schirhagl, R. Nanodiamond uptake in colon cancer cells: The influence of direction and trypsin-EDTA treatment. Nanoscale 2019, 11, 17357–17367. [Google Scholar] [CrossRef]
- Morita, A.; Martinez, F.P.P.; Chipaux, M.; Jamot, N.; Hemelaar, S.R.; van der Laan, K.J.; Schirhagl, R. Cell Uptake of Lipid-Coated Diamond. Part. Part. Syst. Charact. 2019, 36, 1900116. [Google Scholar] [CrossRef]
- Damle, V.G.; Sharmin, R.; Morita, A.; Nie, L.; Schirhagl, R. Micro versus Macro–The effect of environmental con-finement on cellular nanoparticle uptake. Front. Bioeng. Biotechnol. 2020, 8, 869. [Google Scholar] [CrossRef]
- Tsai, L.-W.; Lin, Y.-C.; Perevedentseva, E.; Lugovtsov, A.; Priezzhev, A.; Cheng, C.-L. Nanodiamonds for Medical Applications: Interaction with Blood in Vitro and in Vivo. Int. J. Mol. Sci. 2016, 17, 1111. [Google Scholar] [CrossRef]
- Svadlakova, T.; Hubatka, F.; Turanek Knotigova, P.; Kulich, P.; Masek, J.; Kotoucek, J.; Macak, J.; Motola, M.; Kalbac, M.; Kolackova, M.; et al. Proinflam-matory effect of carbon-based nanomaterials: In vitro study on stimulation of inflammasome NLRP3 via destabilisation of ly-sosomes. Nanomaterials 2020, 10, 418. [Google Scholar] [CrossRef] [PubMed]
- Huang, K.J.; Lee, C.Y.; Lin, Y.C.; Lin, C.Y.; Perevedentseva, E.; Hung, S.F.; Cheng, C.L. Phagocytosis and immune response studies of Macrophage-Nanodiamond Interactions in vitro and in vivo. J. Biophotonics 2017, 10, 1315–1326. [Google Scholar] [CrossRef]
- Chan, M.S.; Liu, L.S.; Leung, H.M.; Lo, P.K. Cancer-cell-specific mitochondria-targeted drug delivery by du-al-ligand-functionalized nanodiamonds circumvent drug resistance. ACS Appl. Mater. Interfaces 2017, 9, 11780–11789. [Google Scholar] [CrossRef]
- Xi, G.; Robinson, E.; Mania-Farnell, B.; Vanin, E.F.; Shim, K.-W.; Takao, T.; Allender, E.V.; Mayanil, C.S.; Soares, M.B.; Ho, D.; et al. Convection-enhanced delivery of nanodiamond drug delivery platforms for intracranial tumor treatment. Nanomed. Nanotechnol. Biol. Med. 2014, 10, 381–391. [Google Scholar] [CrossRef]
- Chauhan, S.; Jain, N.; Nagaich, U. Nanodiamonds with powerful ability for drug delivery and biomedical applications: Recent updates on in vivo study and patents. J. Pharm. Anal. 2020, 10, 1–12. [Google Scholar] [CrossRef]
- Vasilyeva, E.Y.; Prokhorenkov, V.I.; Puzyr, A.P.; Bondar, V.S. The effects of nanodiamonds at the action of colored metal ions on the skin of Guinea pigs. J. Biomater. Nanobiotechnol. 2016, 7, 214. [Google Scholar] [CrossRef][Green Version]
- Chow, E.K.; Zhang, X.Q.; Chen, M.; Lam, R.; Robinson, E.; Huang, H.; Schaffer, D.; Osawa, E.; Goga, A.; Ho, D. Nanodiamond therapeutic de-livery agents mediate enhanced chemoresistant tumor treatment. Sci. Transl. Med. 2011, 3, 73ra21. [Google Scholar] [CrossRef]
- Claveau, S.; Bertrand, J.-R.; Treussart, F. Fluorescent Nanodiamond Applications for Cellular Process Sensing and Cell Tracking. Micromachines 2018, 9, 247. [Google Scholar] [CrossRef] [PubMed]
- Steinert, S.; Ziem, F.; Hall, L.; Zappe, A.; Schweikert, M.; Götz, N.; Aird, A.; Balasubramanian, G.; Hollenberg, L.C.L.; Wrachtrup, J. Magnetic spin imaging under ambient conditions with sub-cellular resolution. Nat. Commun. 2013, 4, 1607. [Google Scholar] [CrossRef] [PubMed]
- Glenn, D.R.; Lee, K.; Park, H.; Weissleder, R.; Yacoby, A.; Lukin, M.D.; Lee, H.; Walsworth, R.L.; Connolly, C.B. Single-cell magnetic imaging using a quantum diamond microscope. Nat. Methods 2015, 12, 736–738. [Google Scholar] [CrossRef] [PubMed]
- Raabova, H.; Chvatil, D.; Cigler, P. Diamond nano-optode for fluorescent measurements of pH and temperature. Nanoscale 2019, 11, 18537–18542. [Google Scholar] [CrossRef] [PubMed]
- Sow, M.; Steuer, H.; Adekanye, S.; Ginés, L.; Mandal, S.; Gilboa, B.; Williams, O.A.; Smith, J.M.; Kapanidis, A.N. High-throughput nitro-gen-vacancy center imaging for nanodiamond photophysical characterization and pH nanosensing. Nanoscale 2020, 12, 21821–21831. [Google Scholar] [CrossRef]
- Hemelaar, S.R.; Saspaanithy, B.; L’Hommelet, S.R.M.; Martinez, F.P.P.; Van Der Laan, K.J.; Schirhagl, R. The Response of HeLa Cells to Fluorescent NanoDiamond Uptake. Sensors 2018, 18, 355. [Google Scholar] [CrossRef]
- Hemelaar, S.R.; Nagl, A.; Bigot, F.; Rodríguez-García, M.M.; de Vries, M.P.; Chipaux, M.; Schirhagl, R. The inter-action of fluorescent nanodiamond probes with cellular media. Microchim. Acta 2017, 184, 1001–1009. [Google Scholar] [CrossRef]
- Lin, Y.C.; Wu, K.T.; Lin, Z.R.; Perevedentseva, E.; Karmenyan, A.; Lin, M.D.; Cheng, C.L. Nanodiamond for biolabelling and toxicity evaluation in the zebrafish embryo in vivo. J. Biophotonics 2016, 9, 827–836. [Google Scholar] [CrossRef]
- Van Der Laan, K.J.; Morita, A.; Perona-Martinez, F.P.; Schirhagl, R. Evaluation of the Oxidative Stress Response of Aging Yeast Cells in Response to Internalization of Fluorescent Nanodiamond Biosensors. Nanomaterials 2020, 10, 372. [Google Scholar] [CrossRef] [PubMed]
- Hemelaar, S.R.; Van Der Laan, K.J.; Hinterding, S.R.; Koot, M.V.; Ellermann, E.; Perona-Martinez, F.P.; Roig, D.; Hommelet, S.; Novarina, D.; Takahashi, H.; et al. Generally Applicable Transformation Protocols for Fluorescent Nanodiamond Internalization into Cells. Sci. Rep. 2017, 7, 5862. [Google Scholar] [CrossRef]
- Zheng, T.; Martínez, F.P.; Storm, I.M.; Rombouts, W.; Sprakel, J.; Schirhagl, R.; De Vries, R. Recombinant Protein Polymers for Colloidal Stabilization and Improvement of Cellular Uptake of Diamond Nanosensors. Anal. Chem. 2017, 89, 12812–12820. [Google Scholar] [CrossRef] [PubMed]
- Xiang, L.-J.; Zhang, H.-H.; Li, H.; Kong, L.; Zhou, H.-P.; Wu, J.-Y.; Tian, Y.-P.; Zhang, J.; Mao, Y.-F. A specific HeLa cell-labelled and lysosome-targeted upconversion fluorescent probe: PEG-modified Sr2YbF7:Tm3+. Nanoscale 2017, 9, 18861–18866. [Google Scholar] [CrossRef] [PubMed]
- Pataer, A.; Ozpolat, B.; Shao, R.; Cashman, N.R.; Plotkin, S.S.; Samuel, C.E.; Lin, S.H.; Kabil, N.N.; Wang, J.; Majidi, M. Therapeutic target-ing of the PI4K2A/PKR lysosome network is critical for misfolded protein clearance and survival in cancer cells. Oncogene 2020, 39, 801–813. [Google Scholar] [CrossRef] [PubMed]
- Voigt, J.; Christensen, J.; Shastri, V.P. Differential uptake of nanoparticles by endothelial cells through polyelectro-lytes with affinity for caveolae. Proc. Natl. Acad. Sci. USA 2014, 111, 2942–2947. [Google Scholar] [CrossRef] [PubMed]
- Ansari, S.A.; Satar, R.; Jafri, M.A.; Rasool, M.; Ahmad, W.; Kashif Zaidi, S. Role of Nanodiamonds in Drug Delivery and Stem Cell Therapy. Iran. J. Biotechnol. 2016, 14, 130–141. [Google Scholar] [CrossRef]
- Abedini, F.; Hosseinkhani, H.; Ismail, M.; Domb, A.J.; Omar, A.R.; Chong, P.P.; Hong, P.D.; Yu, D.S.; Farber, I.Y. Cationized dex-tran nanoparticle-encapsulated CXCR4-siRNA enhanced correlation between CXCR4 expression and serum alkaline phos-phatase in a mouse model of colorectal cancer. Int. J. Nanomed. 2012, 7, 4159. [Google Scholar]
- Cui, L.; Cohen, J.A.; Broaders, K.E.; Beaudette, T.T.; Fréchet, J.M. Mannosylated dextran nanoparticles: A pH-sensitive system engineered for immunomodulation through mannose targeting. Bioconjugate Chem. 2011, 22, 949–957. [Google Scholar] [CrossRef]
- Salatin, S.; Yari Khosroushahi, A. Overviews on the cellular uptake mechanism of polysaccharide colloidal nanoparticles. J. Cell. Mol. Med. 2017, 21, 1668–1686. [Google Scholar] [CrossRef]
- Li, Y.-L.; Zhu, L.; Liu, Z.; Cheng, R.; Meng, F.; Cui, J.-H.; Ji, S.-J.; Zhong, Z. Reversibly Stabilized Multifunctional Dextran Nanoparticles Efficiently Deliver Doxorubicin into the Nuclei of Cancer Cells. Angew. Chem. 2009, 121, 10098–10102. [Google Scholar] [CrossRef]
- Fermie, J.; de Jager, L.; Foster, H.; Veenendaal, T.; de Heus, C.; van Dijk, S.; ten Brink, C.; Oorschot, V.M.; Yang, L.; Li, W.; et al. Bimodal Endocytic Probe for Three-Dimensional Correlative Light and Electron Microscopy. Cell Rep. Methods 2021. [Google Scholar] [CrossRef]
- Perera, R.M.; Zoncu, R. The Lysosome as a Regulatory Hub. Annu. Rev. Cell Dev. Biol. 2016, 32, 223–253. [Google Scholar] [CrossRef] [PubMed]
- Repnik, U.; Česen, M.H.; Turk, B. The Endolysosomal System in Cell Death and Survival. Cold Spring Harb. Perspect. Biol. 2013, 5, a008755. [Google Scholar] [CrossRef] [PubMed]
- Repnik, U.; Turk, B. Lysosomal–mitochondrial cross-talk during cell death. Mitochondrion 2010, 10, 662–669. [Google Scholar] [CrossRef] [PubMed]
- Kroemer, G.; Jäättelä, M. Lysosomes and autophagy in cell death control. Nat. Rev. Cancer 2005, 5, 886–897. [Google Scholar] [CrossRef]
- Fennelly, C.; Amaravadi, R.K. Lysosomal Biology in Cancer. Lysosomes 2017, 1594, 293–308. [Google Scholar]
- Afghah, Z.; Chen, X.; Geiger, J.D. Role of endolysosomes and inter-organellar signaling in brain disease. Neurobiol. Dis. 2020, 134, 104670. [Google Scholar] [CrossRef] [PubMed]
- Nixon, R.A. Amyloid precursor protein and endosomal-lysosomal dysfunction in Alzheimer’s disease: Inseparable partners in a multifactorial disease. FASEB J. 2017, 31, 2729–2743. [Google Scholar] [CrossRef] [PubMed]
- Kett, L.R.; Dauer, W.T. Endolysosomal dysfunction in Parkinson’s disease: Recent developments and future challenges. Mov. Disord. 2016, 31, 1433–1443. [Google Scholar] [CrossRef] [PubMed]
- Colacurcio, D.J.; Nixon, R.A. Disorders of lysosomal acidification—The emerging role of v-ATPase in aging and neurodegenerative disease. Ageing Res. Rev. 2016, 32, 75–88. [Google Scholar] [CrossRef] [PubMed]
- Osei-Owusu, J.; Yang, J.; Leung, K.H.; Ruan, Z.; Lü, W.; Krishnan, Y.; Qiu, Z. Proton-activated chloride channel PAC regulates endosomal acidification and transferrin receptor-mediated endocytosis. Cell Rep. 2021, 34, 108683. [Google Scholar] [CrossRef] [PubMed]


Publisher’s Note: MDPI stays neutral with regard to jurisdictional claims in published maps and institutional affiliations. |
© 2021 by the authors. Licensee MDPI, Basel, Switzerland. This article is an open access article distributed under the terms and conditions of the Creative Commons Attribution (CC BY) license (https://creativecommons.org/licenses/by/4.0/).
Share and Cite
Nie, L.; Zhang, Y.; Li, L.; van Rijn, P.; Schirhagl, R. pH Sensitive Dextran Coated Fluorescent Nanodiamonds as a Biomarker for HeLa Cells Endocytic Pathway and Increased Cellular Uptake. Nanomaterials 2021, 11, 1837. https://doi.org/10.3390/nano11071837
Nie L, Zhang Y, Li L, van Rijn P, Schirhagl R. pH Sensitive Dextran Coated Fluorescent Nanodiamonds as a Biomarker for HeLa Cells Endocytic Pathway and Increased Cellular Uptake. Nanomaterials. 2021; 11(7):1837. https://doi.org/10.3390/nano11071837
Chicago/Turabian StyleNie, Linyan, Yue Zhang, Lei Li, Patrick van Rijn, and Romana Schirhagl. 2021. "pH Sensitive Dextran Coated Fluorescent Nanodiamonds as a Biomarker for HeLa Cells Endocytic Pathway and Increased Cellular Uptake" Nanomaterials 11, no. 7: 1837. https://doi.org/10.3390/nano11071837
APA StyleNie, L., Zhang, Y., Li, L., van Rijn, P., & Schirhagl, R. (2021). pH Sensitive Dextran Coated Fluorescent Nanodiamonds as a Biomarker for HeLa Cells Endocytic Pathway and Increased Cellular Uptake. Nanomaterials, 11(7), 1837. https://doi.org/10.3390/nano11071837