Article

Nanomaterial Synthesis in Ionic Liquids and Their Use on the Photocatalytic Degradation of Emerging Pollutants

1
CRETUS Institute, Department of Chemical Engineering, Universidade de Santiago, E-15782 Santiago de Compostela, Spain
2
Department of Analytical Chemistry, Nutrition and Food Science, Universidade de Santiago de Compostela, E-15782 Santiago de Compostela, Spain
*
Author to whom correspondence should be addressed.
Nanomaterials 2021, 11(2), 411; https://doi.org/10.3390/nano11020411
Submission received: 17 January 2021 / Revised: 1 February 2021 / Accepted: 2 February 2021 / Published: 5 February 2021
(This article belongs to the Special Issue Ionic Liquids as Task-Specific Materials)

Abstract

:
The unique properties of ionic liquids make them suitable candidates to prepare nanoscale materials. A simple method that uses exclusively a corresponding bulk material and an ionic liquid—in this case, [P6,6,6,14]Cl—was used to prepare AgCl nanoparticles and AgCl@Fe3O4 or TiO2@Fe3O4 magnetic nanocomposites. The prepared nanomaterials were characterized by X-ray powder diffraction, scanning electron microscopy, transmission electron microscopy, ultraviolet–visible spectroscopy, and X-ray photoelectron spectroscopy. The photodegradation of atenolol as a model pharmaceutical pollutant in wastewater was investigated under ultraviolet–visible light irradiation using the different synthesized nanocatalysts. In the presence of 0.75 g·L−1 AgCl nanoparticles, a practically complete degradation of 10 ppm of atenolol was obtained after 30 min, following pseudo-first-order reaction kinetics. The effect of different variables (concentrations, pH, oxidant agents, etc.) was analyzed. The recyclability of the nanocatalyst was tested and found to be successful. A degradation mechanism was also proposed. In order to improve the recovery stage of the nanocatalyst, the use of magnetic nanocomposites is proposed. Under the same experimental conditions, a slightly lower and slower degradation was achieved with an easier separation. The main conclusions of the paper are the suitability of the use of ionic liquids to prepare different nanocatalysts and the effectiveness of these at degrading an emerging pollutant in wastewater treatment.

Graphical Abstract

1. Introduction

Effluents containing emerging pollutants, specifically pharmaceuticals and personal care products (PPCPs) (ibuprofen, atenolol, carbamazepine, etc.), can be detrimental to nature and health [1,2,3]. Different entry paths of these compounds into the environment are known, among which urban wastewater and hospital effluents are considered the most significant [2,4]. Traditional wastewater treatment plants are not designed to remove them [4,5,6,7,8]. This concerns scientific and environmental agencies as these compounds are reaching rivers and canals. Gavrilescu et al. reported the concentration of these compounds in rivers around the world. In particular, European rivers have on average 14–44 ng·L−1 of ibuprofen, 314 ng·L−1 of atenolol, and 9–157 ng·L−1 of carbamazepine, among others [9].
These facts have aroused great interest in investigating wastewater treatment techniques that remove or degrade PPCPs, including filtration [10,11], adsorption [12,13], coagulation/flocculation [14], biological processes [15,16], and degradation by various advanced oxidation processes (AOPs) such as photo-Fenton [17,18], ozonation [19,20], ultrasound treatment [21], electrochemical oxidation [22,23], ultraviolet (UV)/H2O2 [24,25], etc. Among the AOPs, degradation using ultraviolet–visible (UV–Vis) irradiation and nanomaterials as photocatalytic agents must be highlighted due to the promising results obtained up to now [26,27,28,29,30,31]. Advantages of this method include application at low temperatures and ambient pressures, low environmental impact, easy mineralization of contaminants, and low operating costs [32]. In this research line, Hapeshi et al. [28] studied the degradation by UV irradiation of ofloxacin and atenolol with TiO2 nanoparticles as catalysts. Martinez et al. [29] researched degradation of carbamazepine using P-25, anatase, rutile, ZnO, and multi-walled carbon nanotubes–anatase composites as catalysts. The load and type of catalyst and the effect of adding O2 or H2O2 were also analyzed by these authors. Karunakaran et al. [30] removed carboxylic acids from water using UV irradiation with Al2O3 and SiO2 nanoparticles. Ji et al. [31] studied the degradation of atenolol in aqueous TiO2 suspensions using a high-pressure mercury lamp as a source of radiation.
The number of possible nanocatalysts for degradation of PPCPs is high, and their synthesis methods varied [33,34]. However, the main drawback in the use of nanomaterials in wastewater treatment is the separation step, owing to the high operation costs. To solve this issue, magnetic nanoparticles or nanocomposites are being proposed [35,36]. Iron oxide and titanium oxide [37,38], ZnO/AgI/Fe3O4 nanocomposite [39], or FeO and ZnO [40] were easily separated and re-used without losing their photocatalytic activity in different applications.
In recent years, ionic liquids (ILs) have been shown as task-specific solvents of great interest in the preparation of different nano-scale materials [41,42,43,44,45,46]. AgCl [47], Ag [48], TiO2 [49], and CeO2 [50], among other nanoparticles, have been successfully synthesized using these neoteric solvents. Even though the preparation methods are different, all of them share the advantages of ILs, mainly their green character (atmospheric contamination is avoided with the use of these salts) and their tunable character. Chen et al. [51] used a solvothermal process to synthesize the photocatalyst bismuth phosphate (BiPO4) with different morphologies in the presence of the ionic liquid [Omim]H2PO4. Its photocatalytic performance was tested under ultraviolet irradiation for the elimination of ciprofloxacin as a target contaminant. Xia et al. [52], using the same method, synthesized the g-C3N4/BiPO4 hybrid material and tested it as a photocatalyst for the removal of methylene blue dye and the antibiotic ciprofloxacin. The photocatalytic degradation of rhodamine B, tetracycline hydrochloride, ciprofloxacin, and bisphenol A was carried out using carbon quantum dot-modified bismuth oxychloride/bismuth oxybromide nanosheet by Hu et al. [53]. To that end, an in situ ionic liquid-induced strategy was used with [C16mim]Cl. Using the same IL, Yin et al. [54] synthesized novel carbon quantum dot-modified PbBiO2Cl for degradation of tetracycline hydrochloride, ciprofloxacin, and bisphenol A. BiOBr microspheres were synthesized [55] in the presence of three different reactive ILs, namely 1-butyl-3-vinylimidazolium bromide, poly(1-butyl-3-vinylimidazolium) bromide, and poly(1-butyl-3-vinylimidazolium bromide acrylamide. Photocatalytic activity of the microspheres was tested with rodamine B and tetracycline. All these nanocatalysts [51,52,53,54,55] have shown good results in the degradation of pharmaceuticals; however, their synthesis is complicated and requires different solvents besides the IL.
In this work, AgCl nanoparticles and magnetic nanocomposites (AgCl@Fe3O4 and TiO2@Fe3O4) are prepared using the IL trihexyl(tetradecyl)phosphonium chloride ([P6,6,6,14]Cl) and the corresponding bulk materials. The selected method of preparation [47,56] is quick and easy. The synthesized nanomaterials are characterized by X-ray powder diffraction (XRD), transmission electron microscopy (TEM), scanning electron microscopy (SEM), ultraviolet–visible spectroscopy (UV–Vis), and X-ray photoelectron spectroscopy (XPS). Atenolol (ATL) is used as a pharmaceutical pollutant model, and AgCl nanoparticles are used as catalysts in its photodegradation with UV light. Several parameters are evaluated: nanocatalyst loading, atenolol concentration, addition of oxidant agents, and pH. The kinetics of the degradation process are determined by measuring the variation of the ATL concentration with time using high-performance liquid chromatography (HPLC), and the degradation products are identified. Furthermore, recyclability of the nanocatalyst is shown. Finally, the synthesized magnetic nanocomposites, prepared with the aim of facilitating catalyst recovery, are also tested under the same conditions as the individual nanoparticles.

2. Materials and Methods
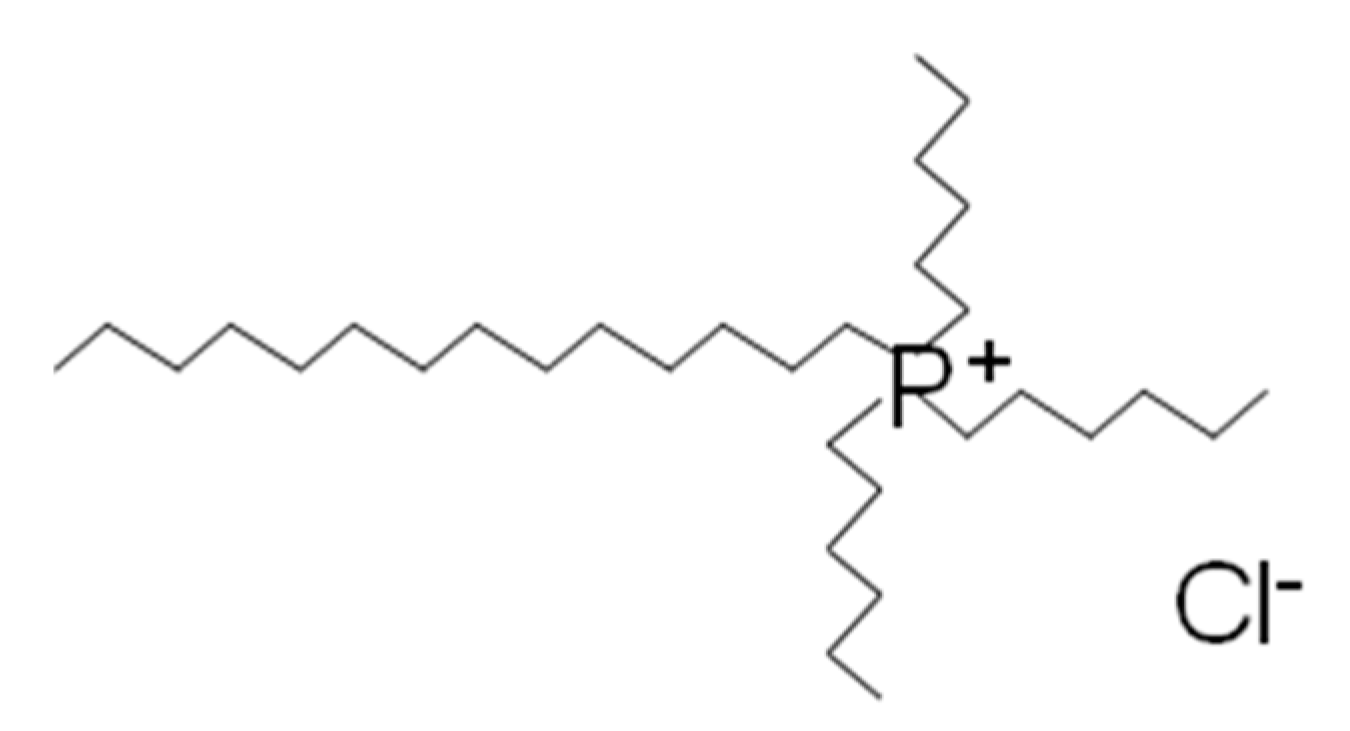
2.1. Materials

ATL (>98%), whose structure is shown in Figure 1, magnetite (97%, nanopowder 50–100 nm), titanium (IV) oxide (>99.5% P25 degussa, nanopowder), silver chloride (99%), toluene (≥99.5%), sulfuric acid (72%), acetic acid (99%), hydrogen peroxide (30% in H2O), acetone (≥99.5%), and ammonia (25%) were obtained from Merck / Sigma-Aldrich (Germany). Ethanol (99.8%) and sodium hydroxide were purchased from Panreac, and methanol (99.9%, HPLC) was supplied by Scharlau (Barcelona, España). [P6,6,6,14]Cl, was obtained from CYTEC industries (Woodland Park, New Jersey, United States) under the trade name CYPHOS IL 101 (97.7%); Figure 2. The IL was dried at 70 °C under high vacuum (absolute pressure < 1 Pa) for 24 h and then stored under inert atmosphere. The water content (<2000 ppm) was measured by titration using a Metrohm 737 Karl Fischer coulometer. IL final purity was checked by 1H and 13C NMR analyses (Figure S1).

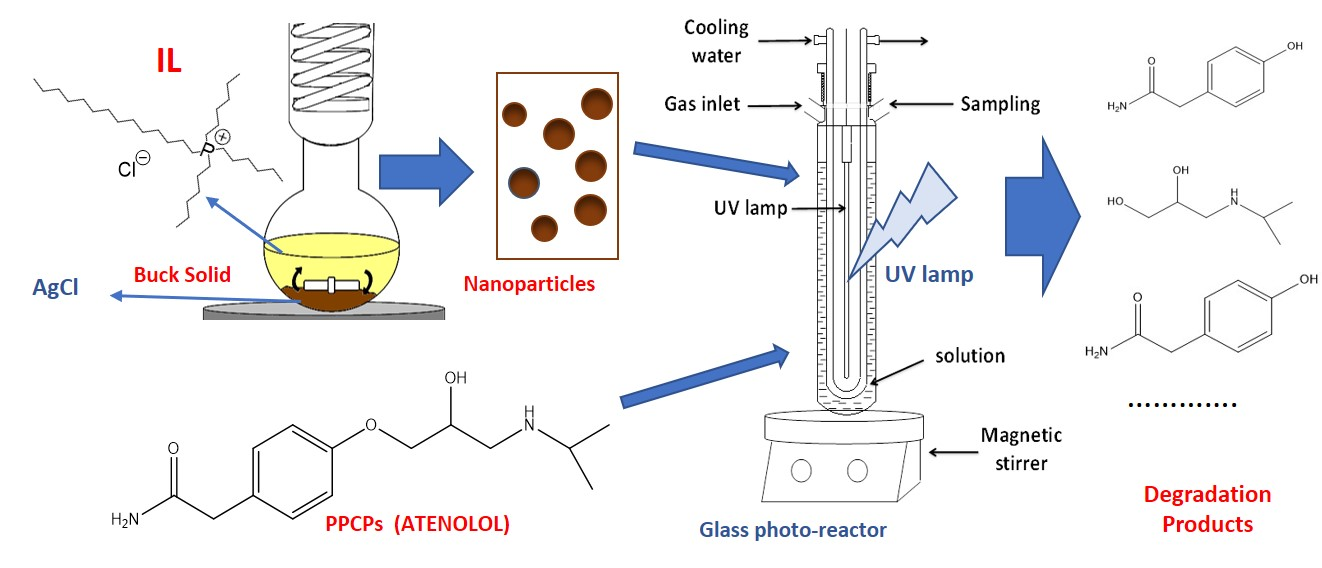
2.2. Preparation of AgCl Nanoparticles

AgCl nanoparticles were synthesized using a previously published method [56]. In a round-bottom flask, a certain amount of bulk AgCl was mixed with [P6,6,6,14]Cl to obtain a concentration of 10% w/w. The mixture was stirred vigorously at 120 °C for 4 h. Then, ethanol was used to precipitate the nanoparticles. They were washed three times with acetone to remove any possible trace of IL. Finally, the nanoparticles were dried at 80 °C for 12 h in the dark.

2.3. Preparation of AgCl@Fe3O4 and TiO2@Fe3O4 Magnetic Nanocomposites

The procedure above mentioned [56] was used, for the first time, to synthesize nanocomposites (AgCl@Fe3O4 and TiO2@Fe3O4). Commercial magnetic nanoparticles of Fe3O4 were dissolved in pure [P6,6,6,14]Cl to obtain a 5% w/w concentration. When a homogeneous solution was obtained, the chosen photocatalytic nanomaterial (synthesized AgCl or commercial TiO2 nanoparticles) was added at a 5% w/w concentration. The mixture was stirred at 120 °C for 4 h. Precipitation and washing procedures were performed as described above.

2.4. Characterization of the Nanomaterials

The prepared nanomaterials were structurally characterized by XRD. The diffraction patterns were obtained using an X-ray Philips powder diffractometer (PW 1710) with a Cu-kα X-ray source (λ = 1.54 Å). SEM and TEM were used to determine the shape and size of the nanomaterials. One drop of dispersed nanoparticles in toluene was deposited on a 400 mesh carbon formvar grid and allowed to evaporate at room temperature. SEM images were obtained with a field emission scanning electron microscope Zeiss Ultra Plus FESEM, with energy-dispersive X-ray micro-analysis (EDS). TEM images were obtained using a Philips CM-12 microscope (FEI Company, Eidhoven, The Netherlands) with a MegaView docu-II camera and IMAX image analysis Software SIS NT. The UV–Vis absorption spectra of nanoparticles dispersed in toluene were obtained with an Agilent 8543 absorption spectrophotometer. Finally, to confirm the surface composition and chemical states of the nanocatalysts before and after usage, a Thermo Scientific K-Alpha ESCA instrument equipped with an aluminum Kα monochromatized radiation at 1486.6 eV X-ray source (XPS) was used.

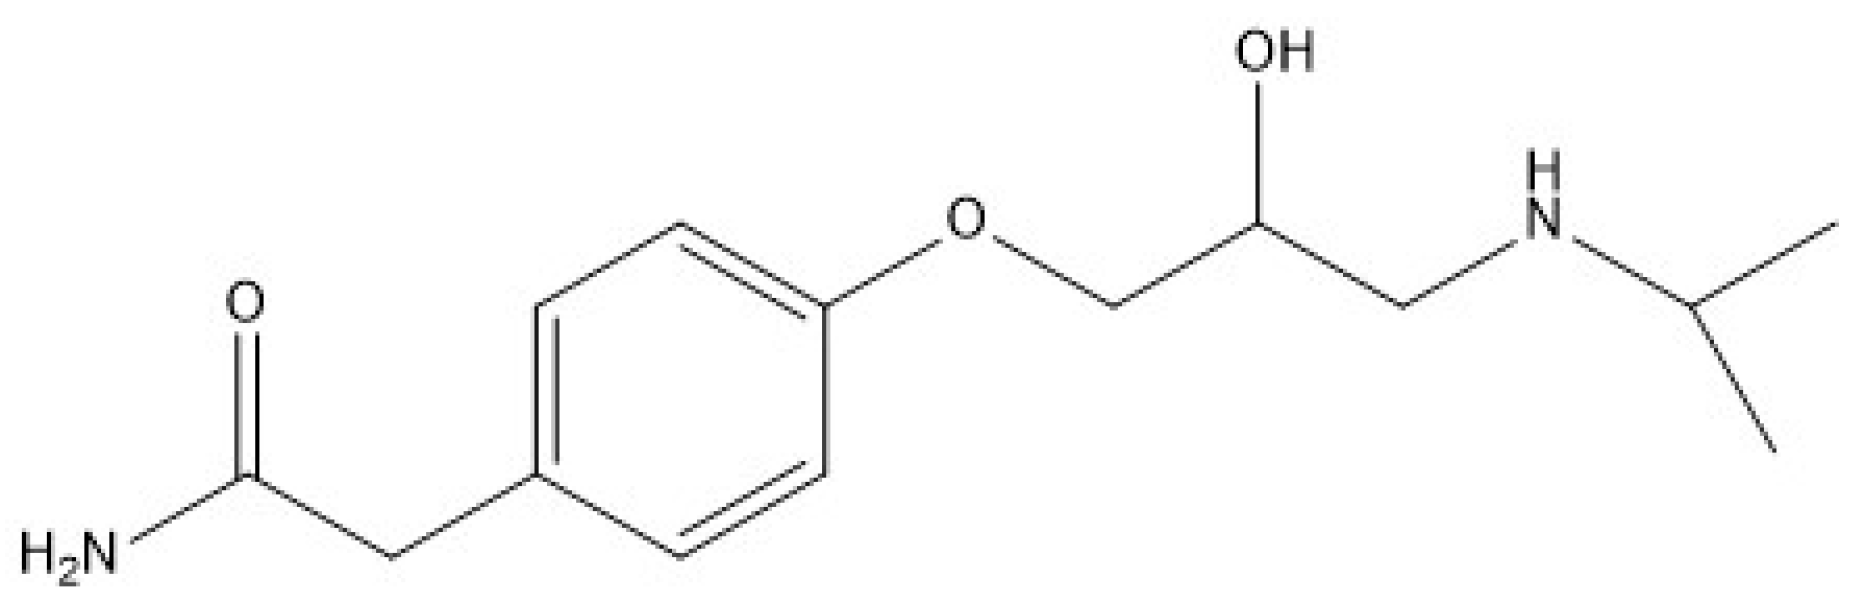
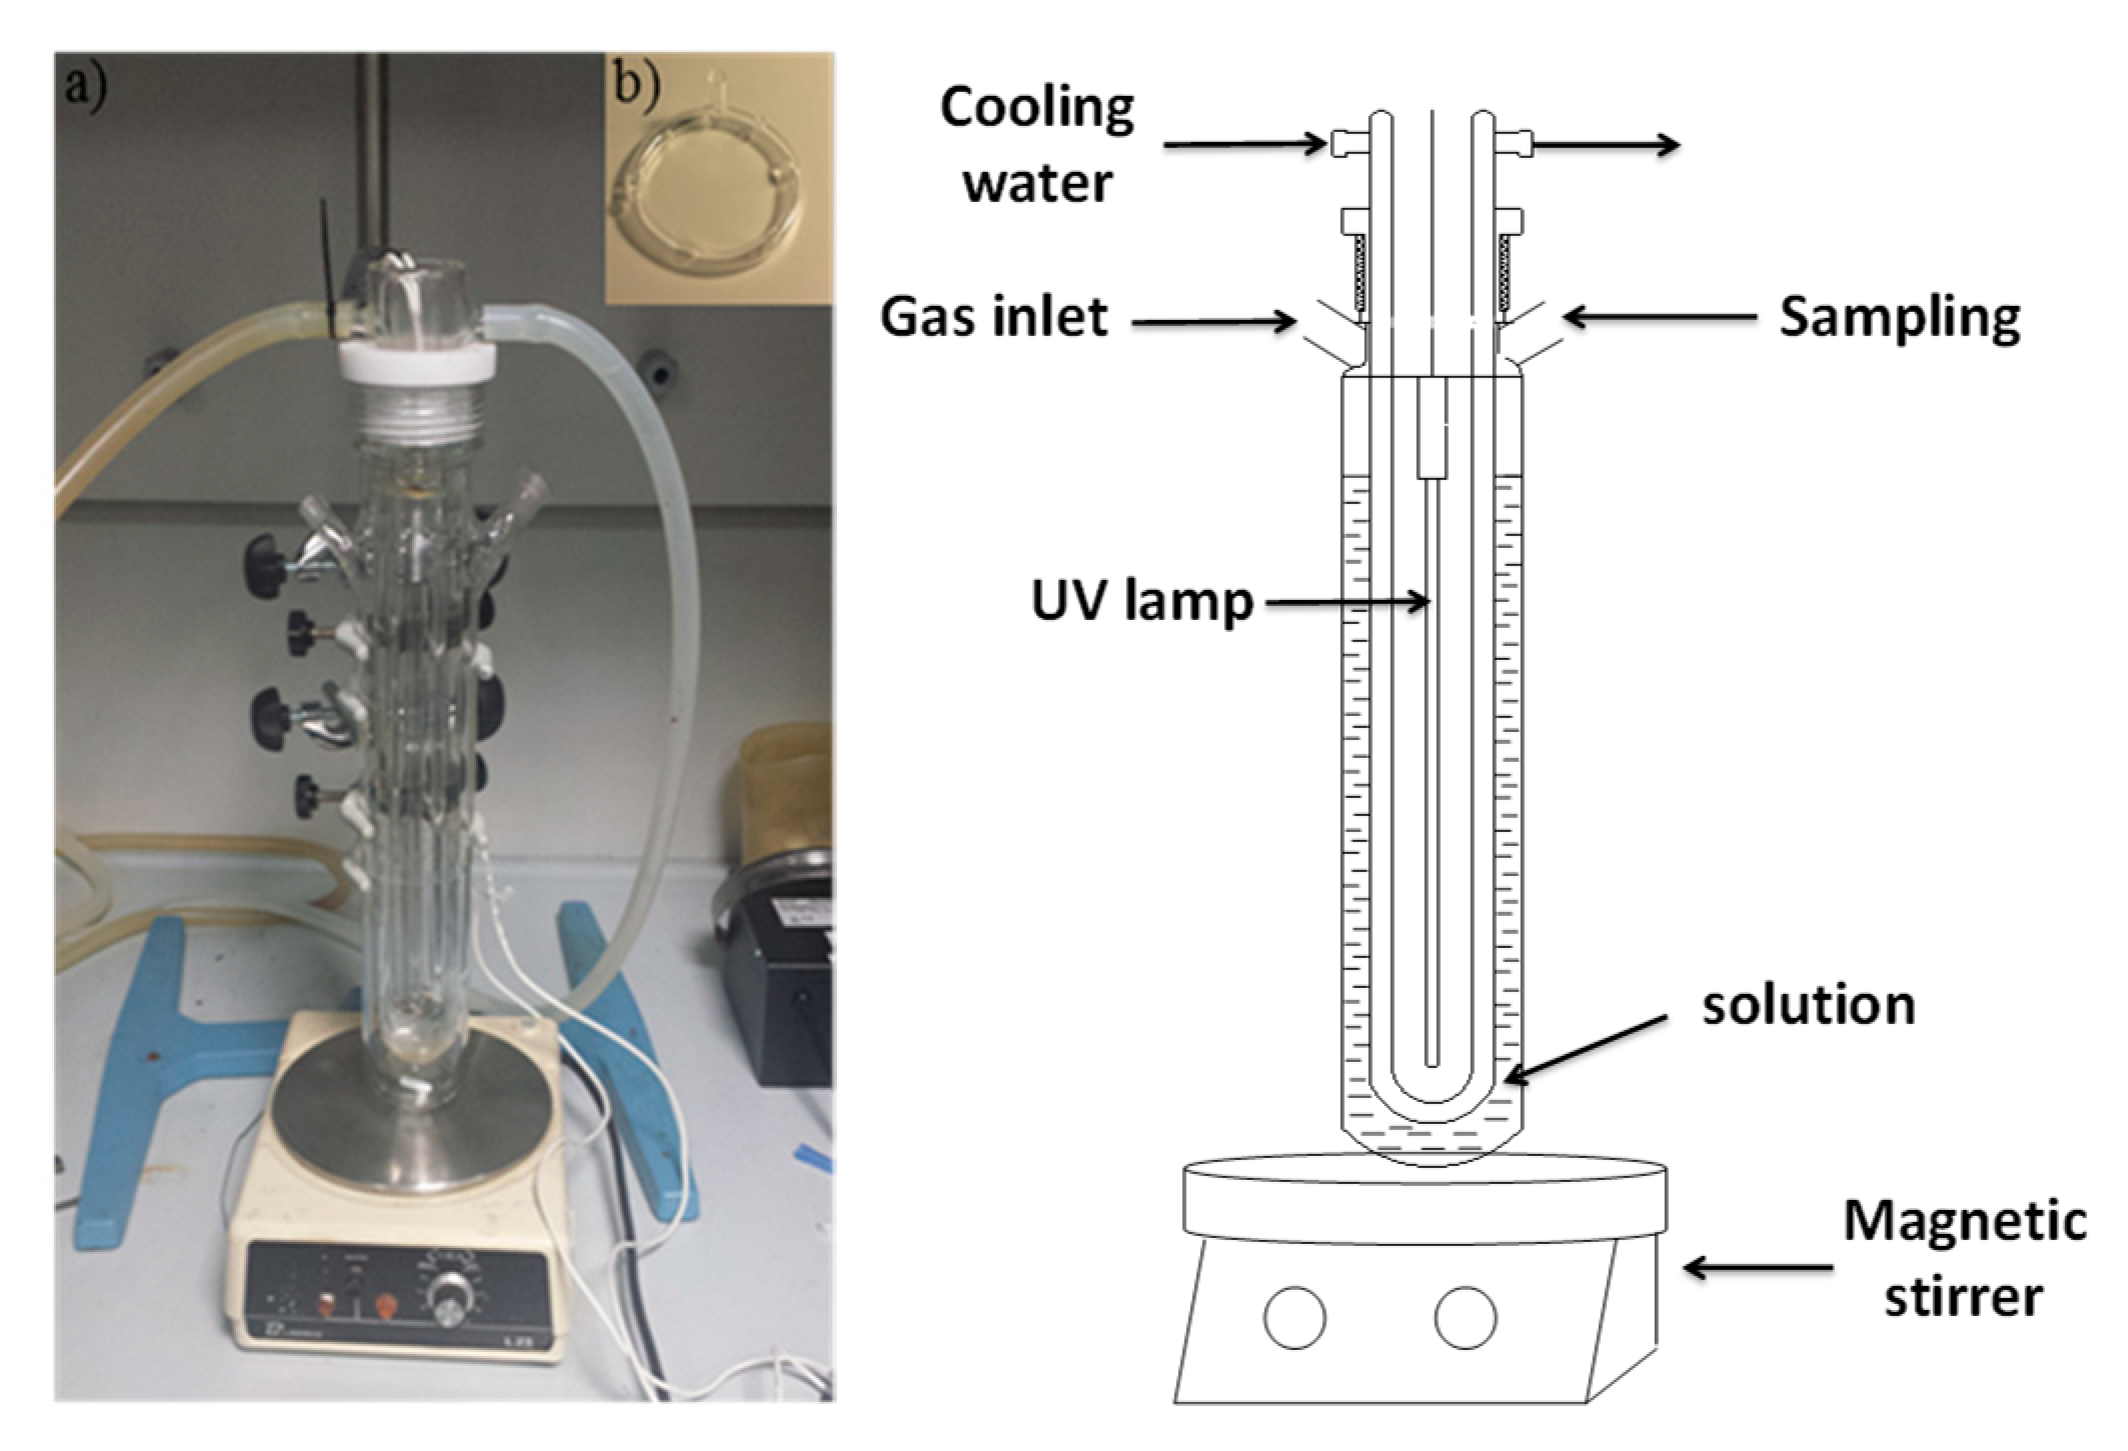
2.5. Experimental Set-Up for Photocatalytic Degradation of ATL

The photocatalytic performance of the obtained nanomaterials was evaluated by degrading 10 ppm ATL stock solutions. The experiments were carried out in a 250-mL designed glass photoreactor (Figure 3) equipped with a low-pressure mercury vapor lamp (UV-C, λ = 280–100 nm). Furthermore, the reactor was equipped with a double stirring system consisting of a magnetic stirrer and a gas diffuser. The reaction camera including the irradiation source was surrounded by a quartz cooling jacket to control the temperature.
The nanomaterial, dispersed in water solution, was added to the ATL stock solution to obtain a concentration of 0.75 g·L−1 (except when this effect was evaluated where the corresponding concentrations were prepared). Before starting irradiation, the suspension was magnetically and bubble-stirred for 30 min in the dark to achieve adsorption–desorption equilibrium. Then, the UV light was switched on and samples were taken at different time intervals during the reaction, centrifuged (14,500 rpm during 10 min), and immediately analyzed. In the experiments carried out, helium was bubbled in to maintain an inert atmosphere free of oxidizing agents (except when the effect of oxidizing agents was evaluated). All tests were accomplished at least twice, guaranteeing their repeatability.

2.6. Analytical Method

The ATL concentration was measured by high-performance liquid chromatography (HPLC) using an Agilent 1100 chromatograph equipped with a diode array detector (λ = 224 nm), vacuum degasser unit, quaternary pump, and thermostated autosampler. Separation was performed by a ZORBAZ SB-C18 column (4.6 × 150 mm; 80 Å pore size) at 30 °C. The isocratic elution was 20/80 (v/v) methanol/ammonium acetate 10 mM (aq.). Flow rate was set as 0.5 mL/min and the injection volume was 20 µL.
ATL concentration was determined using an area–concentration calibration. Subsequently, the concentration of the samples was measured, and the degradation percentage was calculated according to Equation (1):
% d e g r a d a t i o n = ( 1 C C 0 ) · 100
where C0 and C are the initial and the sample concentration of ATL, respectively.
Furthermore, the degradation products were identified by liquid chromatography–quadrupole-time-of-flight (LC-Q-TOF). To that end, an Agilent 1200 Series HLPC system consisting of a membrane degasser, a binary high-pressure gradient pump, an autosampler, and a thermostated LC column compartment was used. This system was interfaced to a Q-TOF mass spectrometry (Q-TOF-MS) instrument (Agilent 6520 Series) equipped with a dual electrospray ion source. Separation was carried out on a 100 × 2 mm (particle size: 3 μm) Synergi Fusion RP (Phenomenex, Torrance, CA, USA) at a flow rate of 0.2 mL min−1 and temperature of 35 °C. Mobile phase consisted of Milli-Q water (A) and methanol (B), both containing 5 mM of ammonium acetate. The gradient was as follows: 0 min, 5% B; 10–12 min, 100% B; 12.10−25 min, 5% B. For the Q-TOF-MS, nitrogen (99.9%), used for nebulizing and drying gas, was provided by a nitrogen generator (Erre Due Srl, Livorno, Italy). Nitrogen (99.9995%) used for collision-induced dissociation was supplied by Praxair Spain (A Coruña, Spain). The electrospray ion source was operated in positive (no transformations products were detected in negative) mode with the following parameters applied: gas temperature: 350 °C; drying gas: 7 L min−1; nebulizer: 42 psig; capillary: 4000 V; fragmentor: 120 V; skimmer voltage: 65 V; octopole radio frequency peak: 750 V. The instrument was operated in the 2 GHz (extended-dynamic range) mode, which provides a Full Width at Half Maximum (FWHM) resolution of ca. 4500 at m/z 121 and ca. 11,000 at 922 m/z. A reference solution was also continuously infused using a second nebulizer of the dual electrospray ion source (5 psig) to recalibrate the Q-TOF using two masses (m/z 121.0509 and 922.0098) and maintain mass accuracy. Instrument control, data acquisition, and evaluation were performed with the MassHunter software (Agilent Technologies). Finally, MS/MS analyses were performed using different collision energies (10, 20, and 40 V) and interpreted in order to tentatively elucidate the structure of the degradation products.

3. Results and Discussion

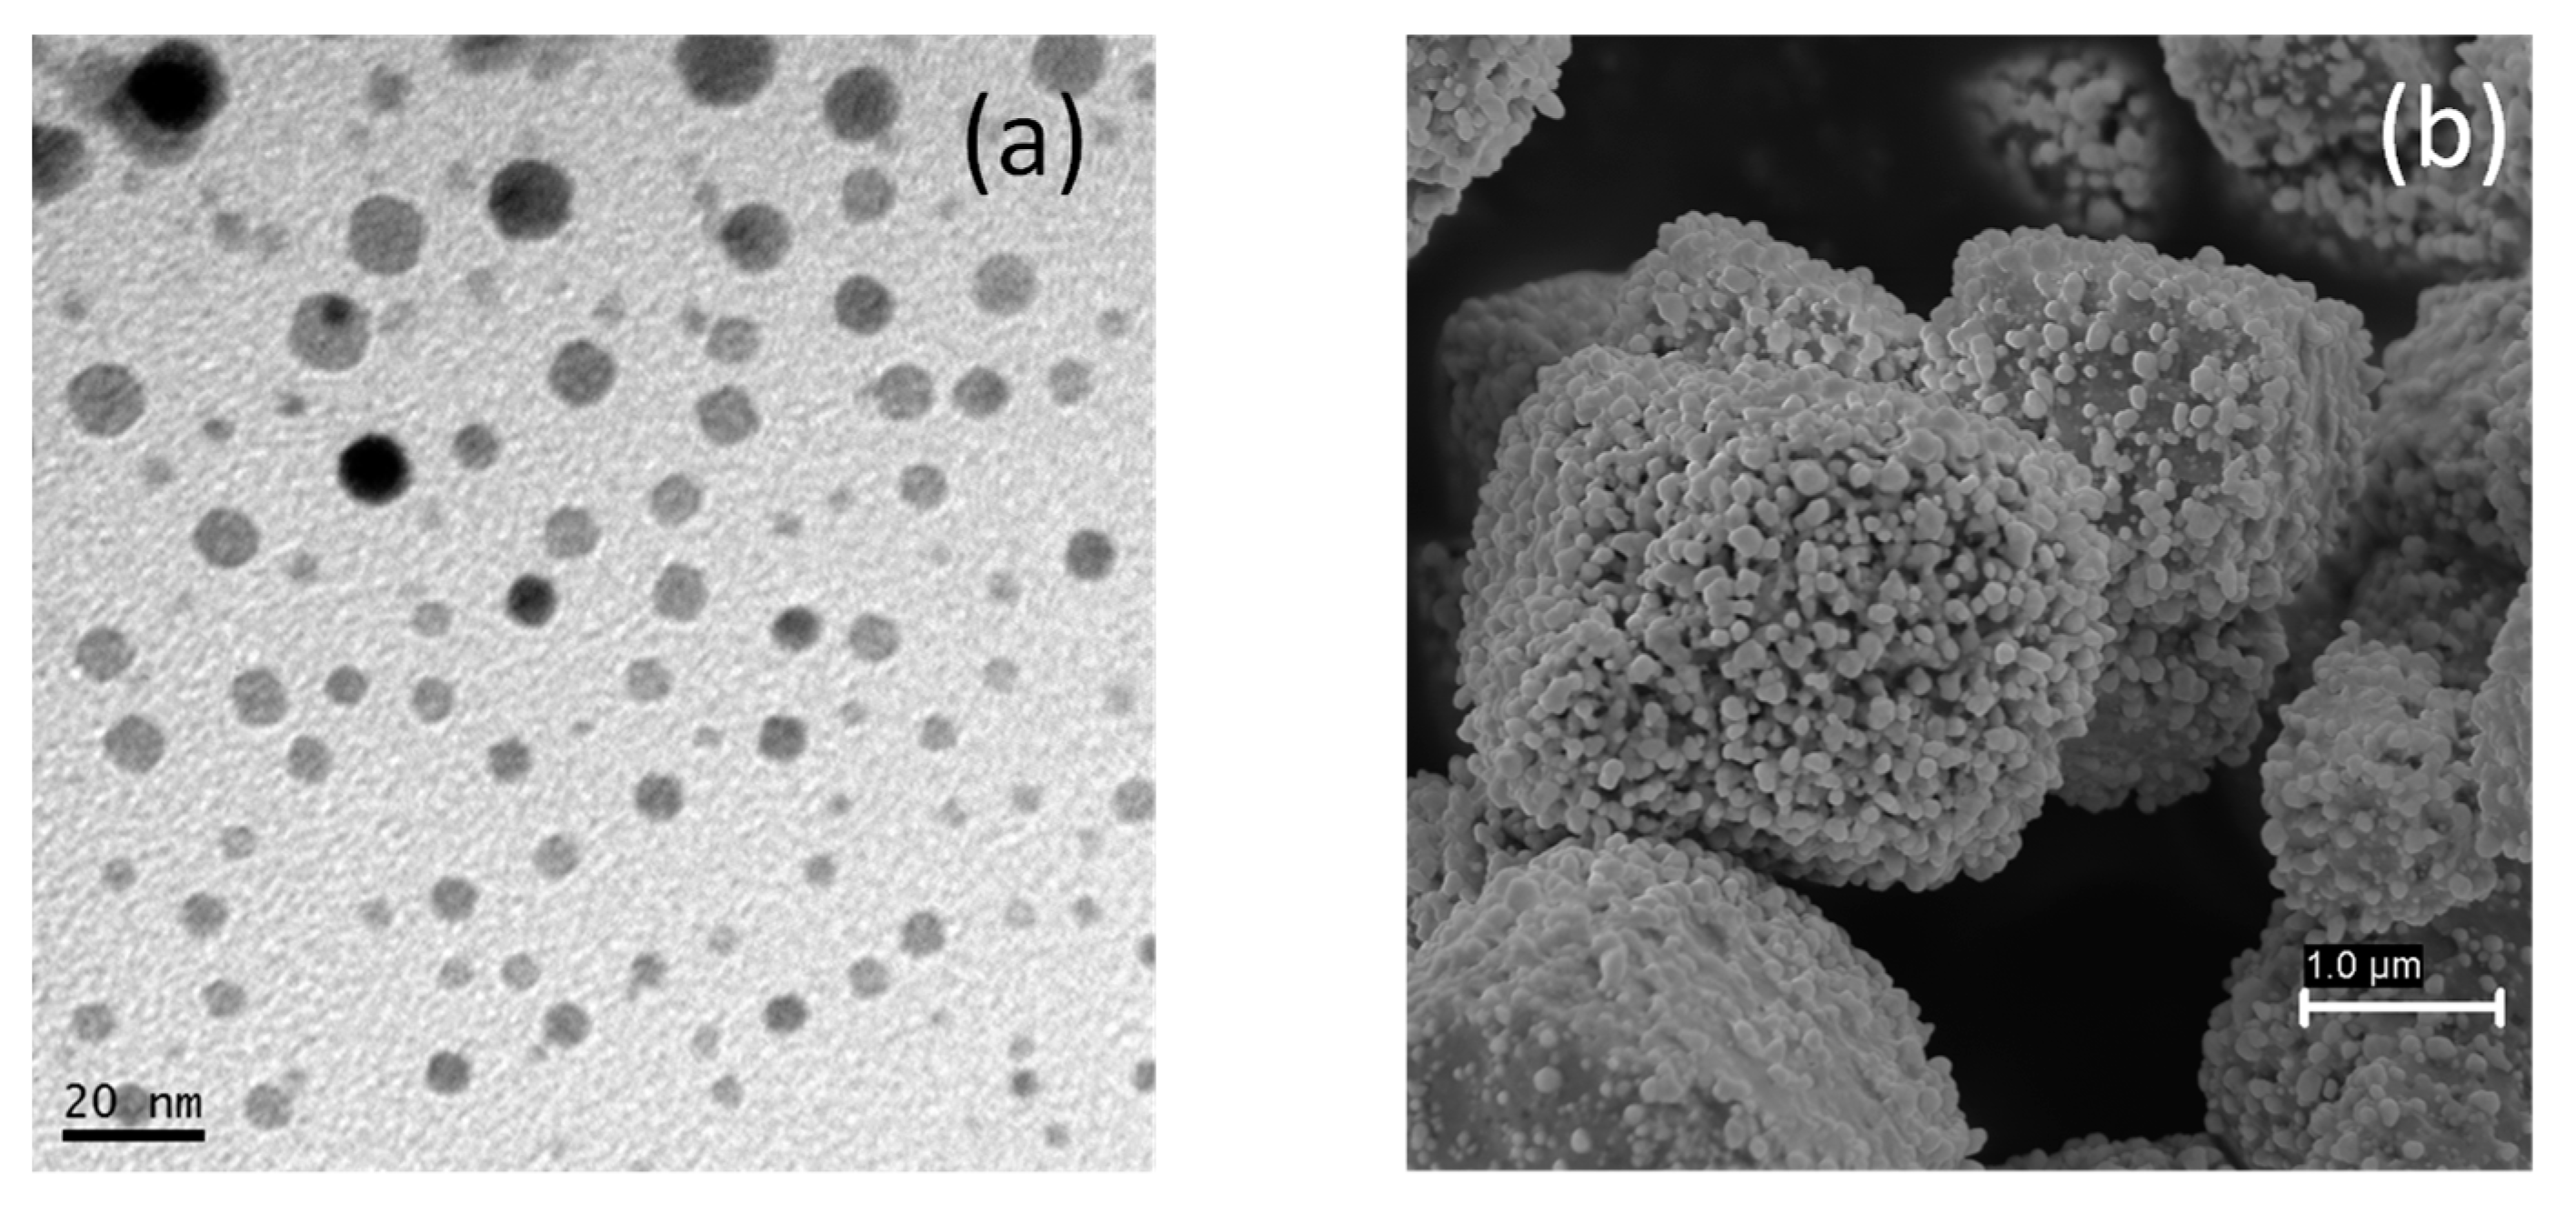
3.1. Characterization of AgCl Nanoparticles

The morphology of the AgCl nanoparticles was characterized by SEM and TEM (Figure 4a,b). As shown in Figure 4a, the dispersed AgCl nanoparticles have a regular and spherical shape with homogeneous distribution (5–20nm). Figure 4b shows the SEM image of the precipitated nanoparticles; the solid was formed of large cubic agglomerates, behavior which has previously been reported by other authors [47,57,58]. The UV–Vis absorption spectrum of the dispersed nanoparticles (Figure S2) indicates the presence of silver chloride, with a characteristic absorption peak below 300 nm [59]. Moreover, there are no absorption peaks in the visible light region, which indicates that the photosensitive silver chloride has not been converted into silver (its absorption peak should appear at 400 nm [60]). AgCl nanoparticles were structurally characterized by XRD. The position and relative intensities of the peaks observed in Figure S3 indicate the presence of chlorargyrite only, the cubic structure of silver chloride, with the peaks matching the standard JCPD (Joint Committee on Powder Diffraction Standards) card number 31-1238 [61,62]. The bonding configuration and element analysis were determined by XPS, which allowed confirmation of the surface composition and chemical states of the nanoparticles. Figure S4a shows two band peaks corresponding to Ag 3d3/2 and Ag 3d5/2 at 371.38 and 365.38 eV, respectively. Figure S4b shows the XPS Cl spectrum with two peaks at 197.48 and 195.88 eV, belonging to Cl 2p1/2 and Cl 2p3/2, respectively. These binding energy values and the obtained Ag/Cl ratio of 0.99 indicate that the nanocatalyst is AgCl [63].

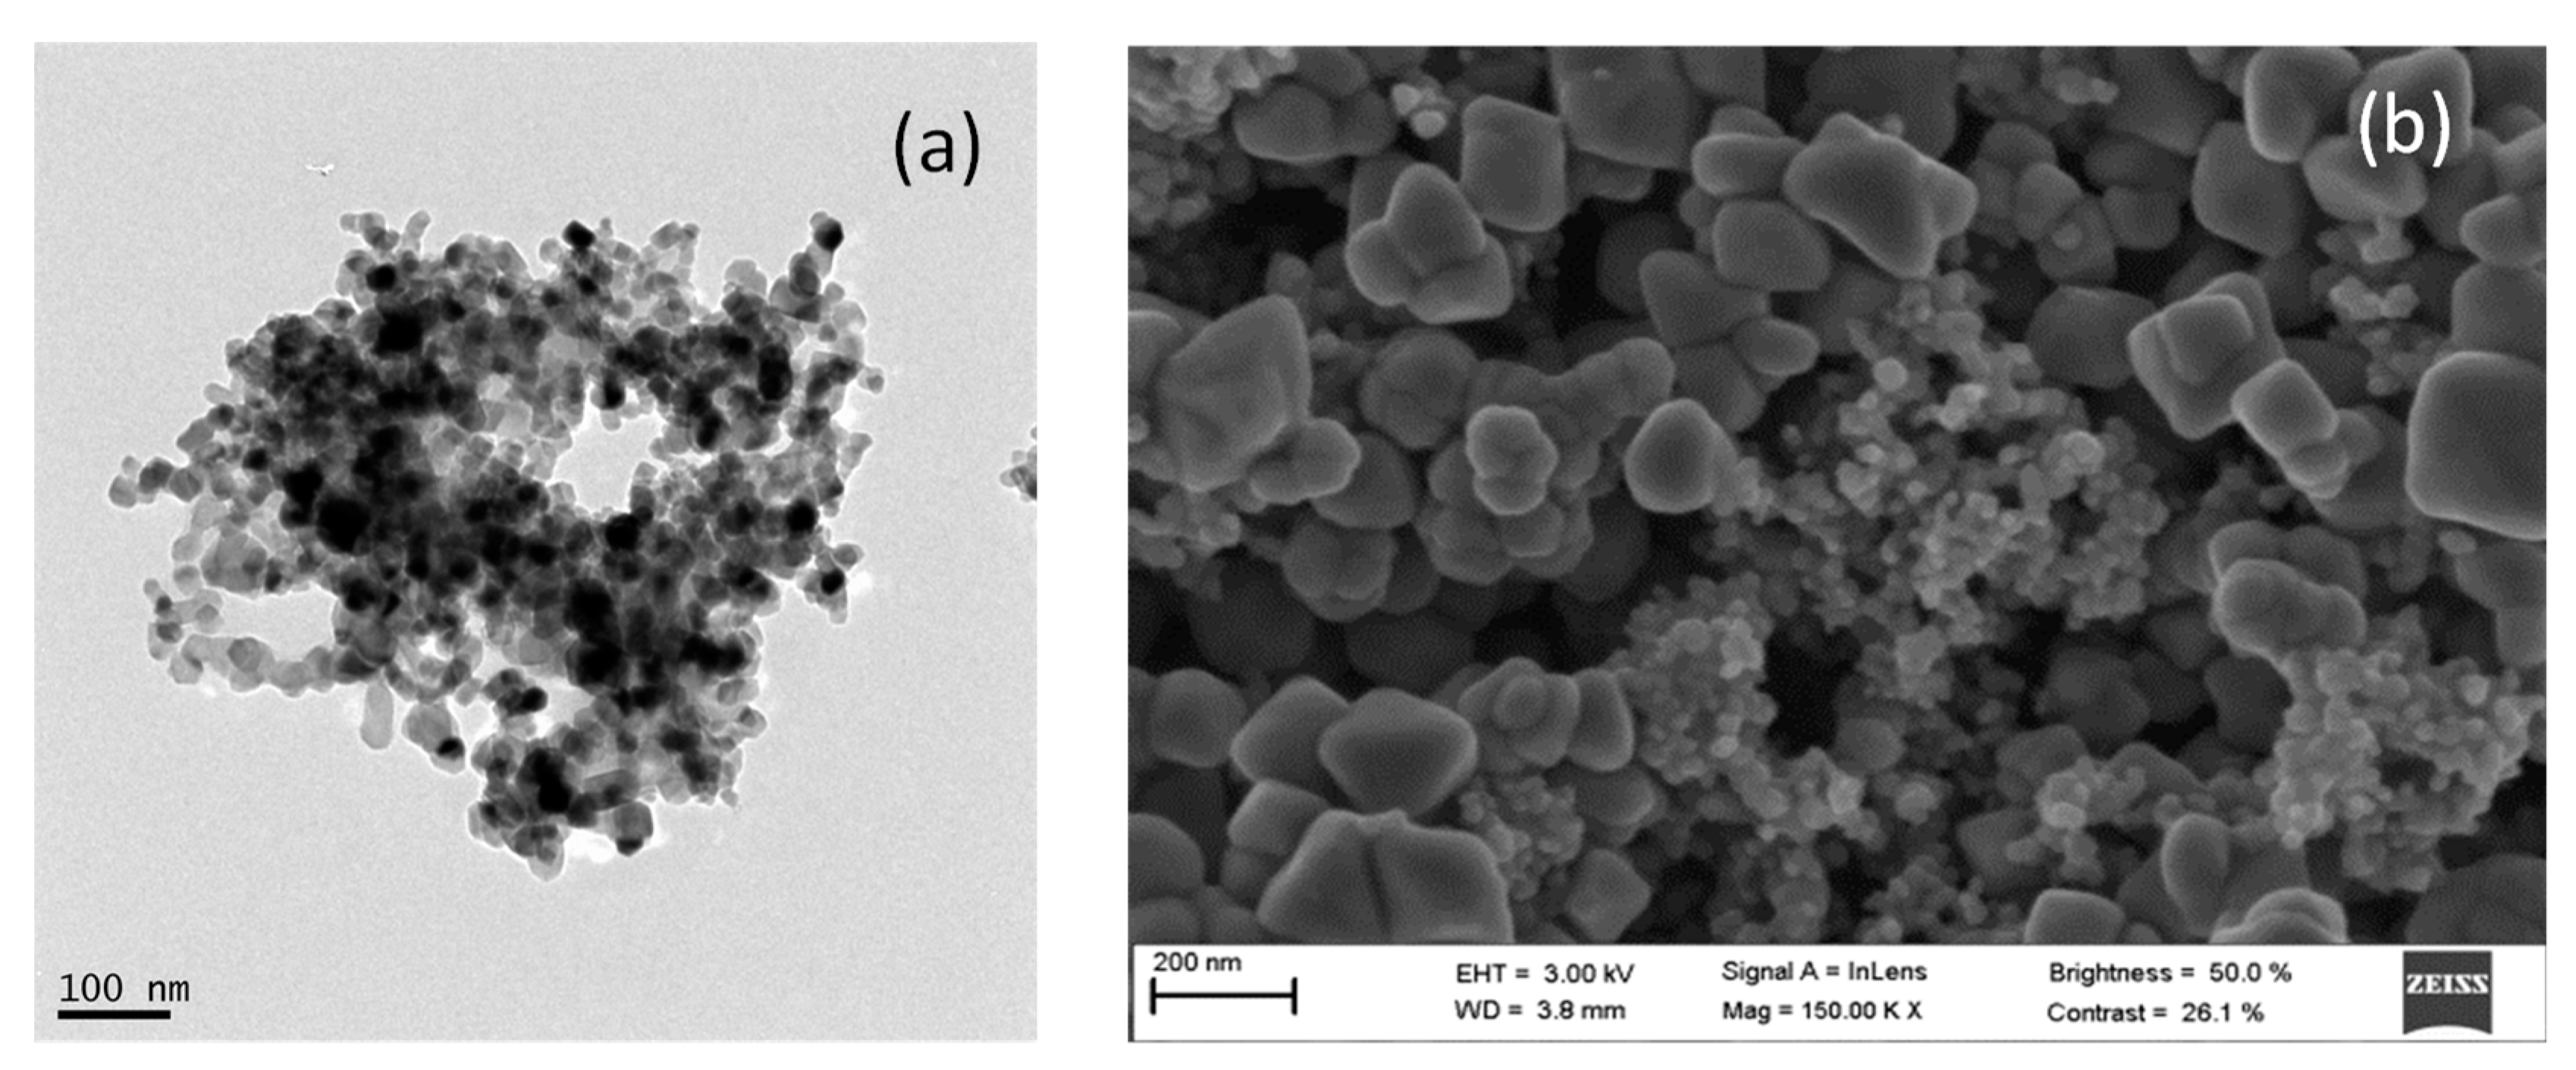
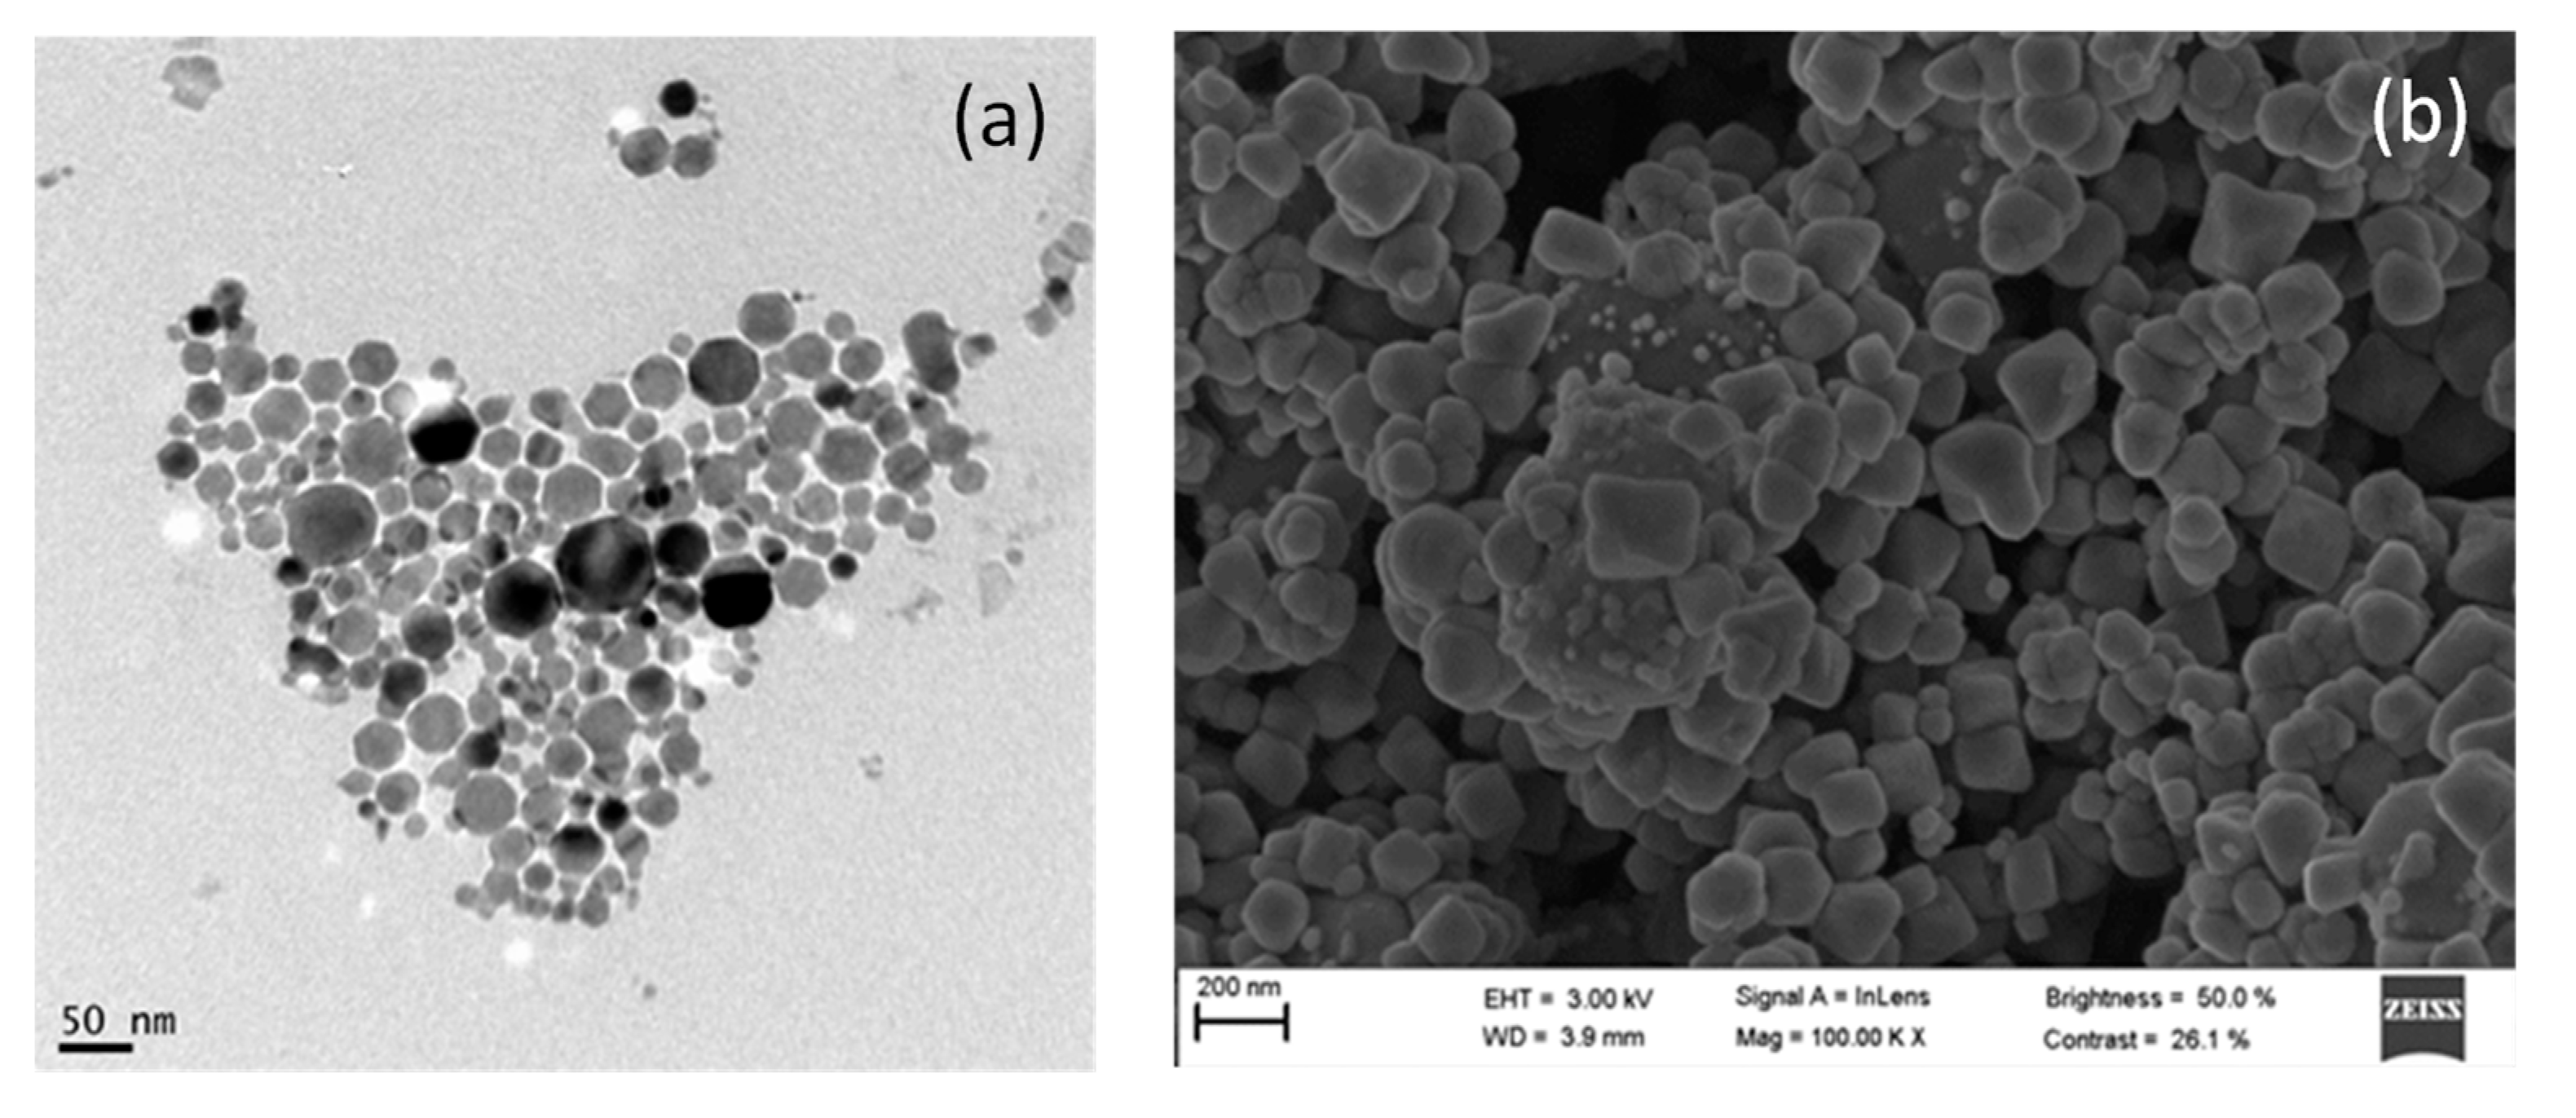
3.2. Characterization of TiO2@Fe3O4 and AgCl@Fe3O4 Nanocomposites

Figure 5a shows a TEM image for TiO2@Fe3O4. The nanocomposite shows a regular, almost spherical morphology with a size distribution between 20 and 50 nm. Figure 5b and Figure S5 show SEM and EDS spectra, respectively. In Figure S5, besides the peaks corresponding to Fe, O and Ti from the nanocomposite, Cu peaks from the copper grid are also observed. The XRD patterns of the prepared TiO2@Fe3O4 nanocomposite are shown in Figure S6. The diffraction peaks that appear for Fe3O4 correspond to the standard JCPD card number 39-1346. In the case of TiO2. (P25-Degussa, 20% rutile and 80% anatase), the peaks match a standard for rutile, JCPD card number 21-1273, and for anatase, JCPD card number 21-1272. Finally, XPS was used to confirm the surface composition (Ti and Fe) and the chemical states of the nanocomposite. As can be seen, the binding energies in Figure S7a,b can be assigned to Fe3O4 and TiO2. The characteristic peaks of Fe 2p3/2, Fe 2p1/2, Ti 2p1/2, and Ti2p3/2 are at 724, 710, 464.59, and 458.92eV, respectively [38,64].
Figure 6a shows a TEM image of the AgCl@Fe3O4 nanocomposite. The formation of mainly spherical aggregates with a size distribution between 10 and 40 nm is observed. Figure 6b and Figure S8 show an SEM image and EDS spectrum. The peaks shown in Figure S8 are those corresponding to Fe, O, Cl and Ag from the nanocomposite, and the Cu peak comes from the copper grid. The XRD patterns of the prepared AgCl@Fe3O4 nanocomposite are shown in Figure S9. The diffraction peaks for Fe3O4 correspond to the standard JCPD card number 39-1346, and for AgCl, to the standard JCPD card number 31-1238 (chlorargyrite) [38,61,62,63,64]. Furthermore, XPS surface analysis was also used to confirm the surface composition and chemical states of the nanocomposite. Figure S10a shows the spectrum with binding energies at the characteristic peaks of Ag 3d3/2 and Ag 3d5/2 at 373.91 and 367.92 eV, respectively. Figure S10b shows the peaks of Fe 2p3/2 and Fe 2p1/2 at 724 and 710 eV, respectively [38,63,64].

3.3. Photocatalytic Degradation of ATL with AgCl Nanoparticles

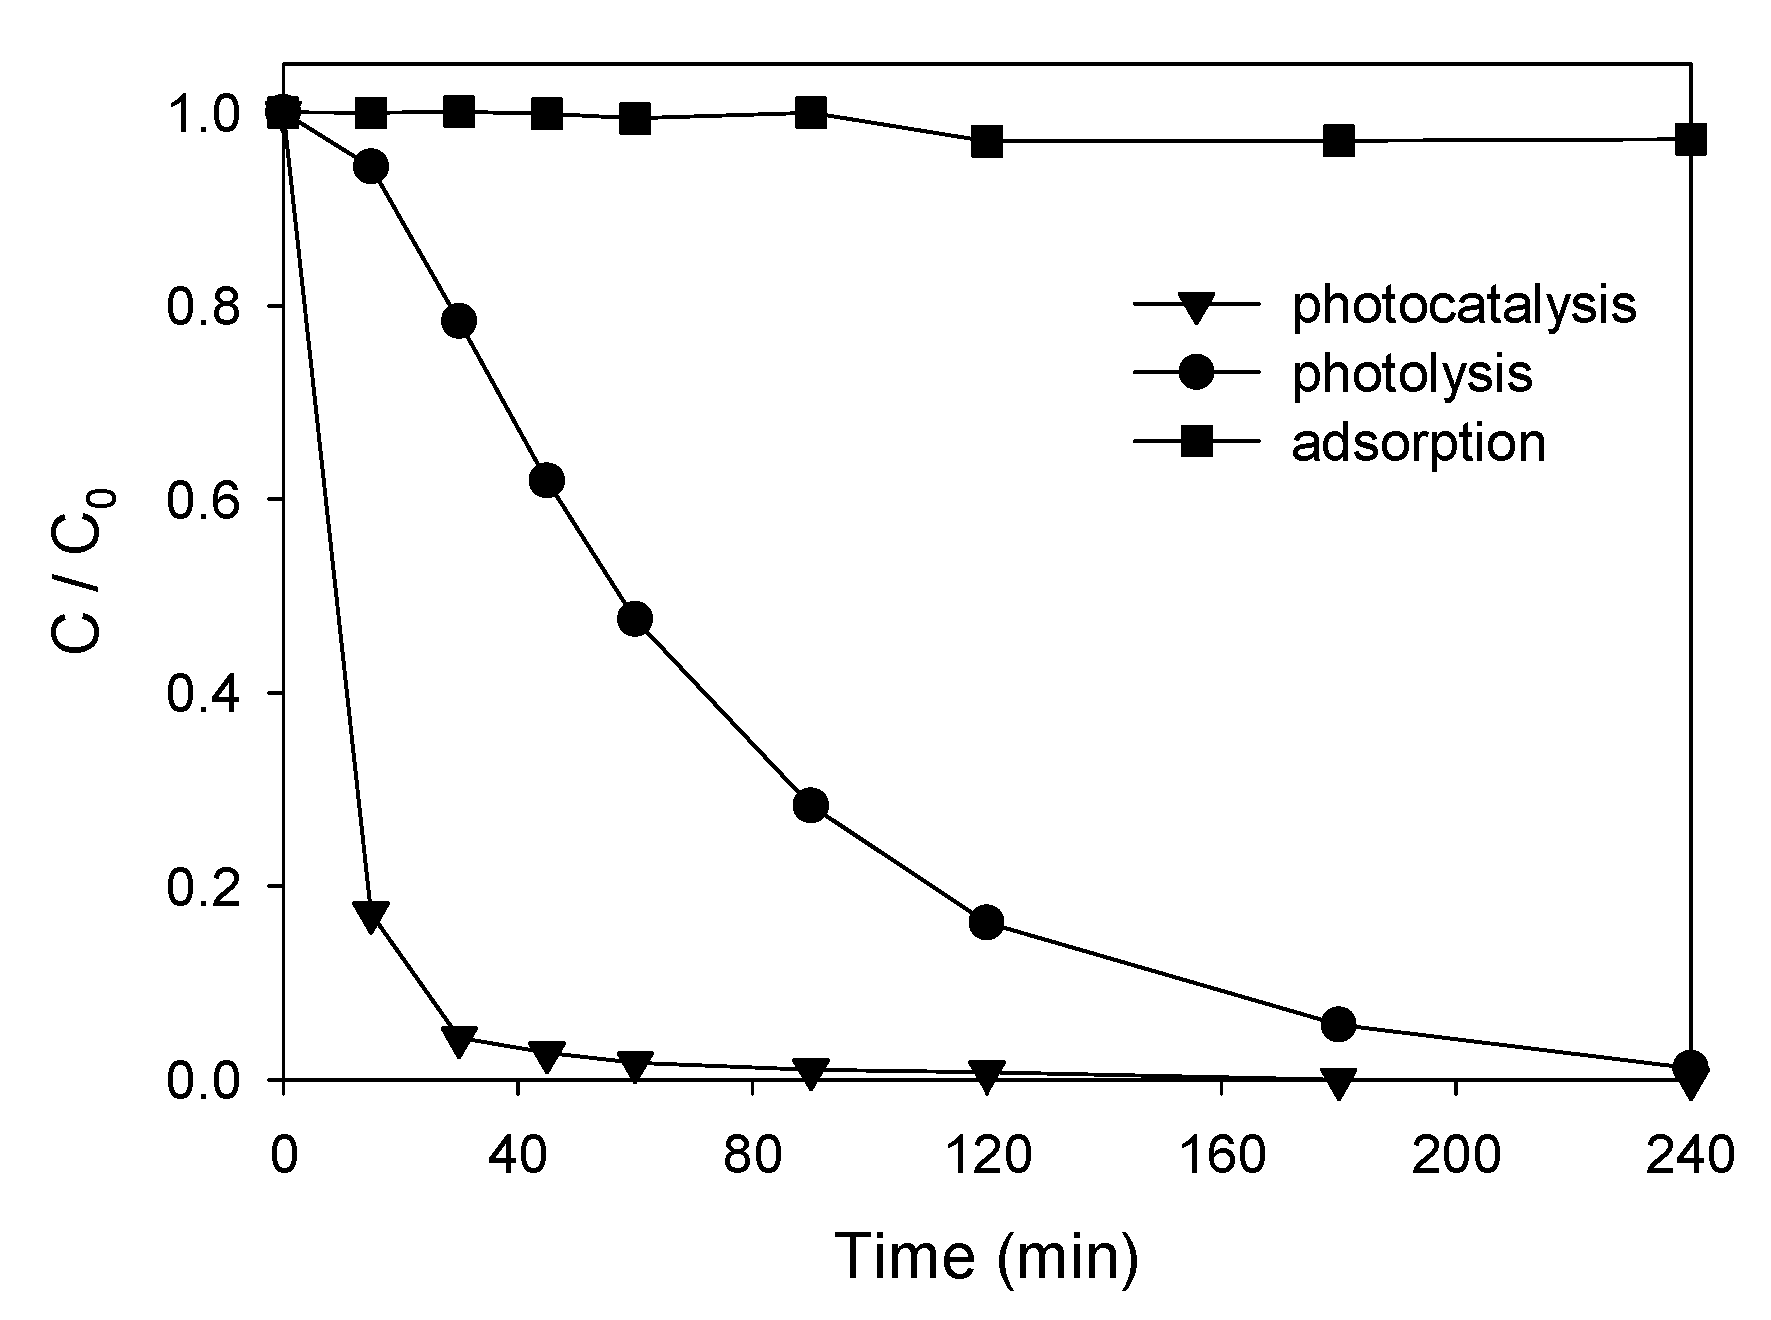
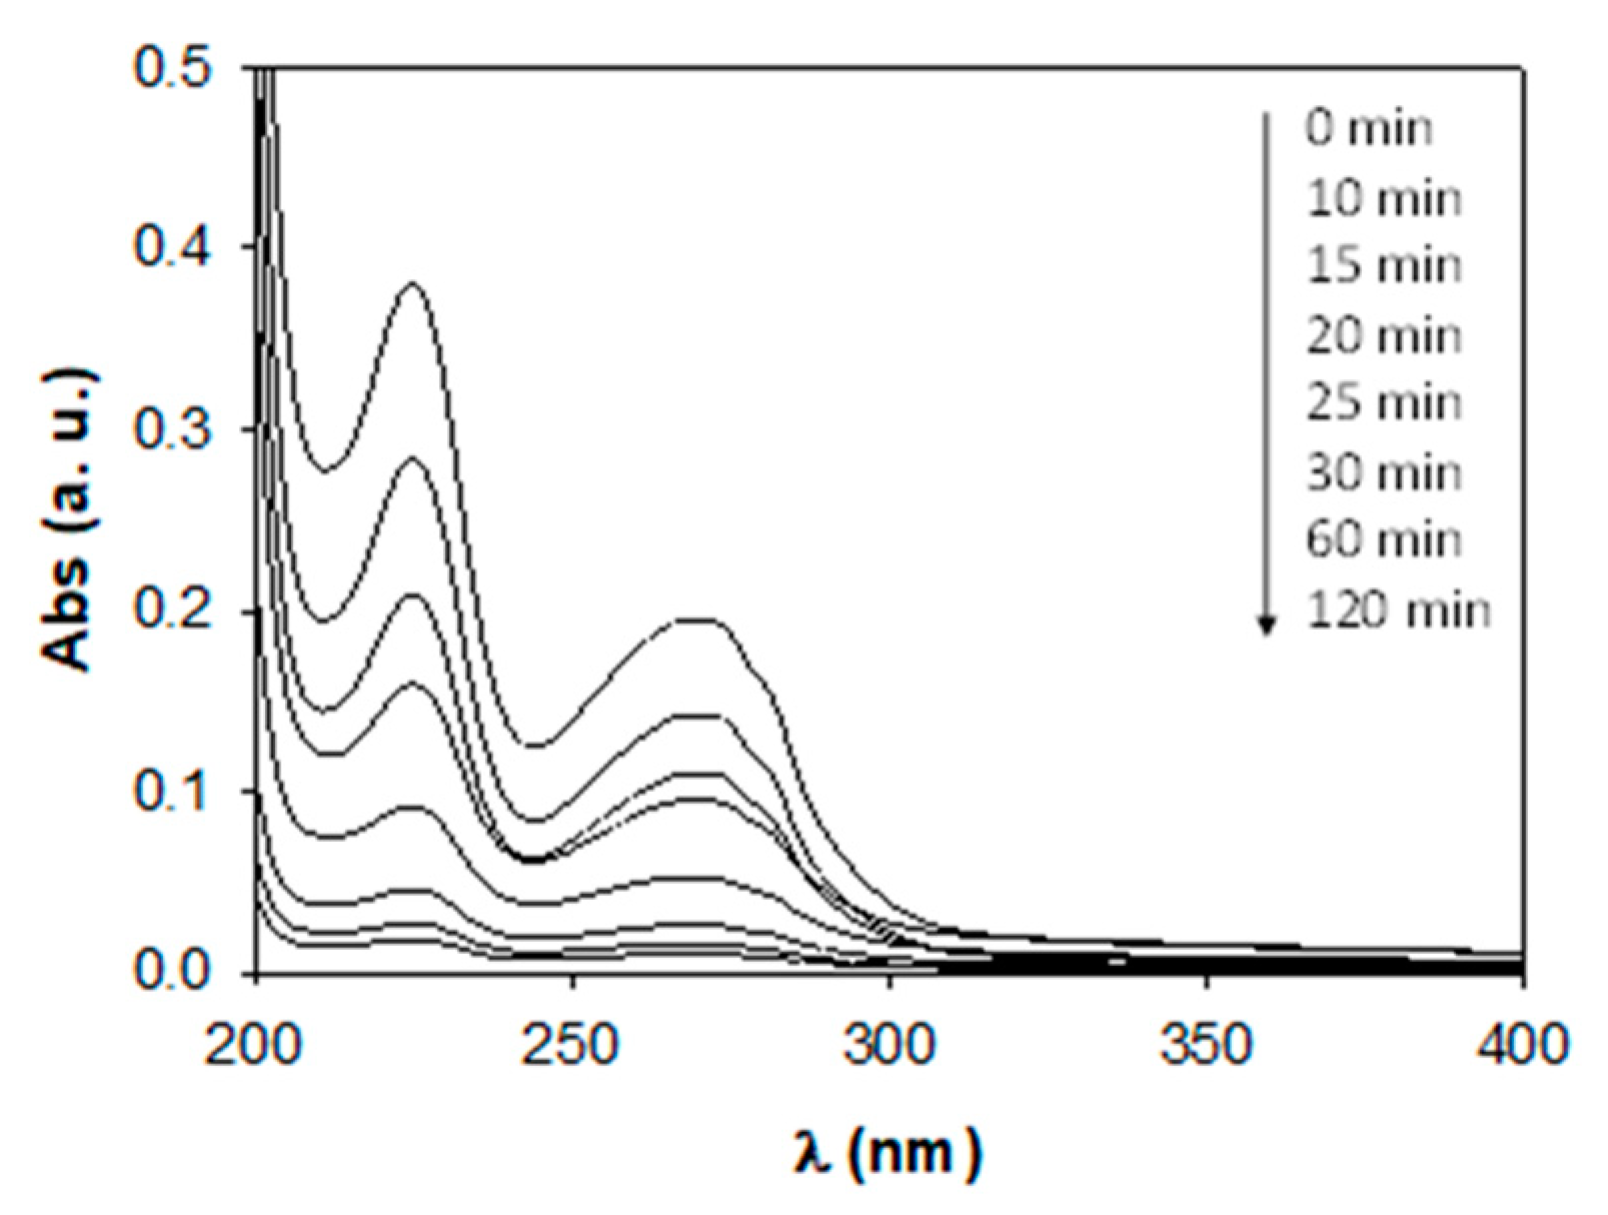
3.3.1. Degradation Tests

The degradation of an aqueous solution with 10 ppm of ATL was carried out firstly using only UV irradiation, secondly with a nanoparticle concentration of 0.75 g·L−1 in the dark, and finally using the same concentration of AgCl nanoparticles under UV irradiation. Concentrations were determined by HPLC. Figure 7 shows the variation of ATL concentration with time for all the cases studied. As shown, in the case of the photolysis process (without catalyst), the degradation was very slow, only 5% and 70% were achieved in 15 and 90 min, respectively. More than 240 min were required to achieve a practically complete degradation. In the case of the study in the dark, a negligible decrease in the concentration, mainly due to adsorption of ATL, was observed. The photocatalytic degradation of ATL with AgCl nanoparticles allowed a total and quick degradation (82% in 15 min, 98% in 45 min). Therefore, the presence of nanoparticles significantly accelerates ATL removal efficiency, decreasing reaction times, energy consumption, and process costs.
The degradation of the aqueous solution with 10 ppm of ATL and 0.75 g·L−1 of AgCl can be easily observed in the progressive evolution of UV–visible absorption spectra (Figure 8). The remarkable decrease in the absorbance peak at 224 nm over time indicates a very significative degradation of ATL, thus confirming the catalyst’s excellent photocatalytic activity under UV light irradiation.
With the aim of comparing the proposed nanocatalyst with other commonly used ones, new tests were carried out using TiO2 (P25-degussa) and Fe2O3 nanoparticles. The results obtained can be seen in Figure 9. A total degradation of ATL was achieved after 45 min in the case of TiO2, a slightly higher value than in the case of AgCl that, at the same time, achieved a degradation of about 98%. However, as previously reported [65,66], suspensions of TiO2 nanoparticles in water form a highly stable hydrocolloid that makes separation of the nanoparticles from water difficult. Therefore, the recovery and reuse of this nanocatalyst become more complicated and the process becomes less efficient. In the case of Fe2O3, with a clearly lower reduction in the ATL concentration, the process cannot be considered competitive.

3.3.2. Influence of Operational Parameters
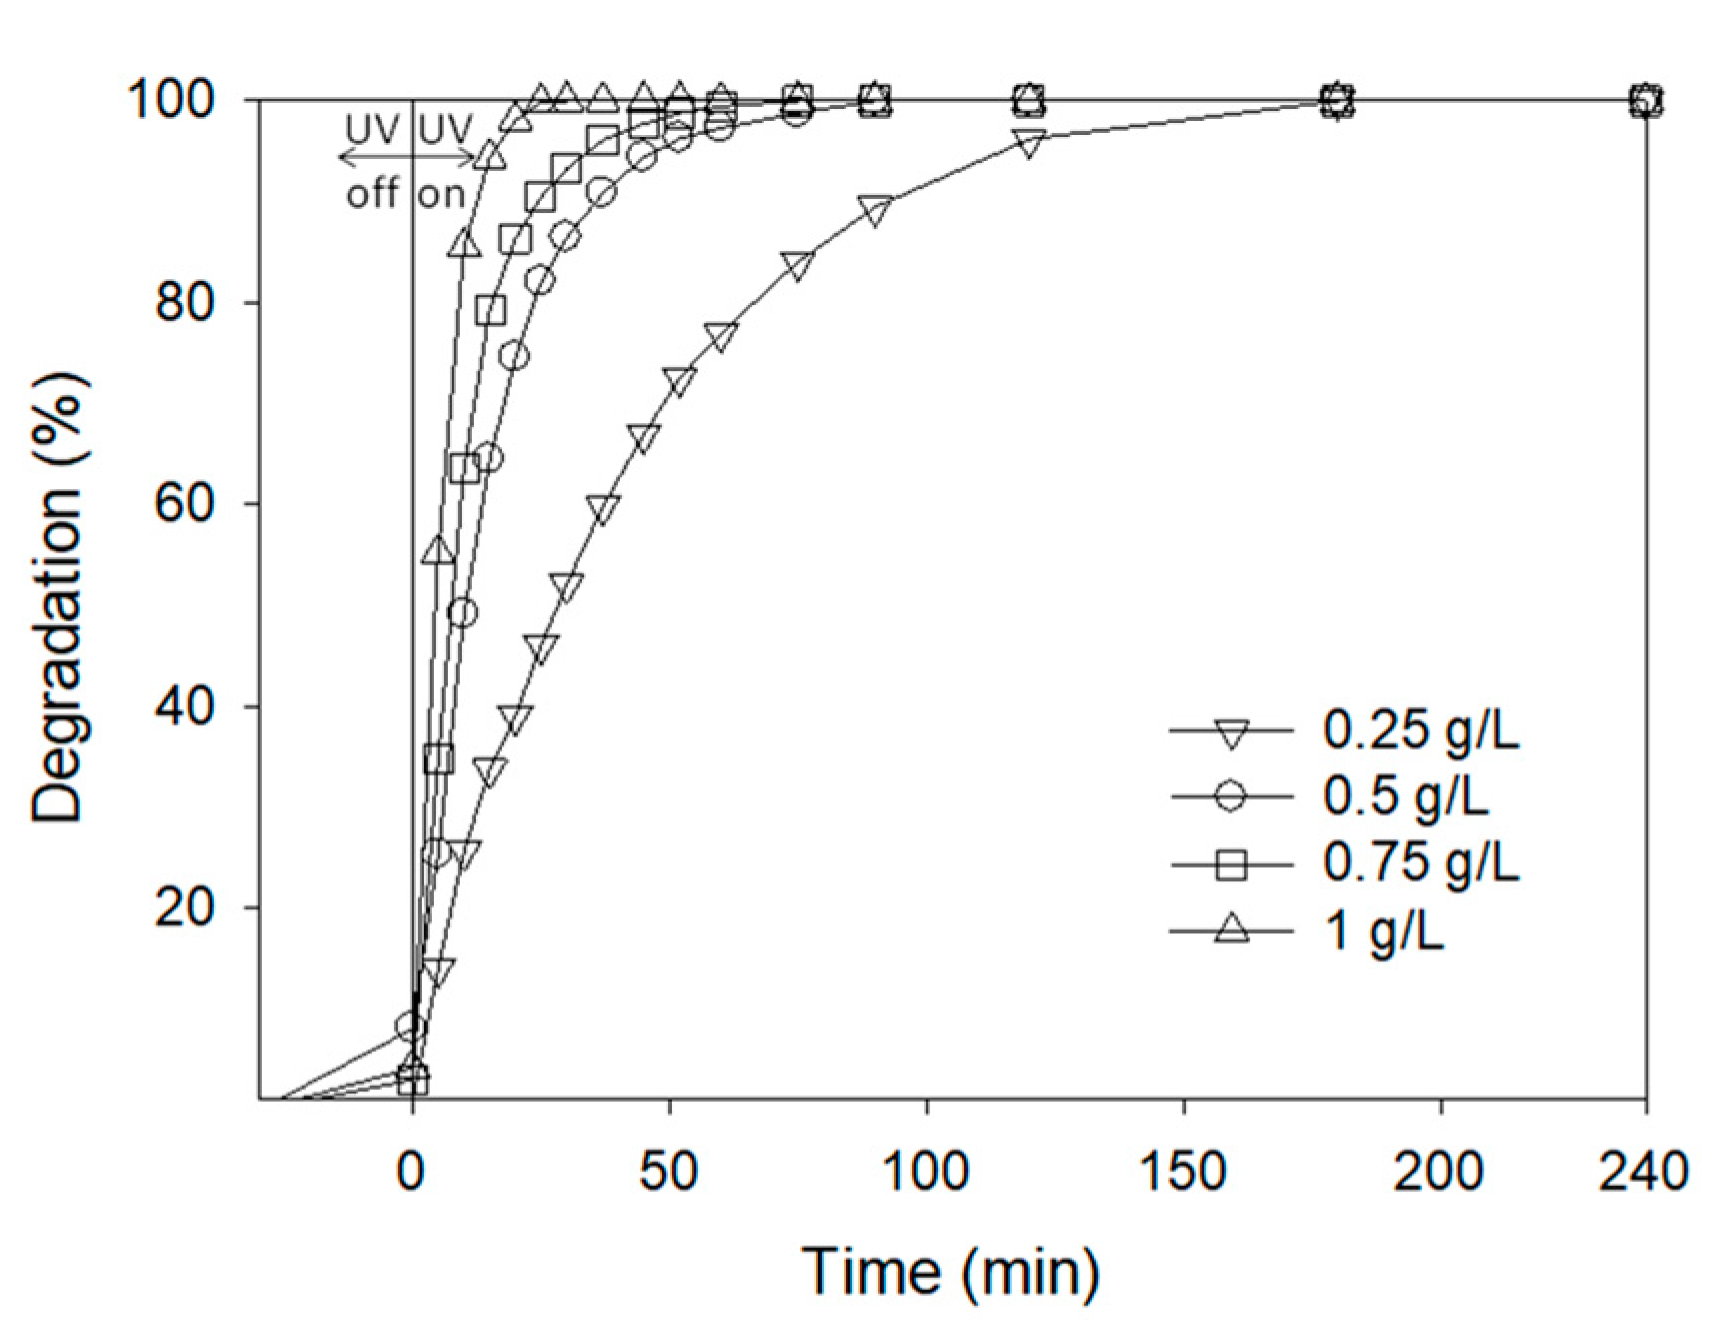
In order to analyze the effect of different variables on the performance of the degradation of ATL, some tests were conducted as reflected in the following subsections.

AgCl Concentration

Aqueous solutions of ATL (10 ppm) were submitted to photocatalytic degradation using AgCl nanoparticle concentrations ranging from 0.25 to 1 g L−1. Figure 10 clearly shows that at a given time, an increase in nanoparticle concentration causes an increase in the degradation percentage. Total degradation of ATL was achieved in all the experiments. However, the increase in nanocatalyst concentration from 0.25 to 1 g·L−1 reduced the required time for complete degradation from 180 to 25 min. As shown in Figure 10, the adsorption before light irradiation has a very small influence on the degradation process.

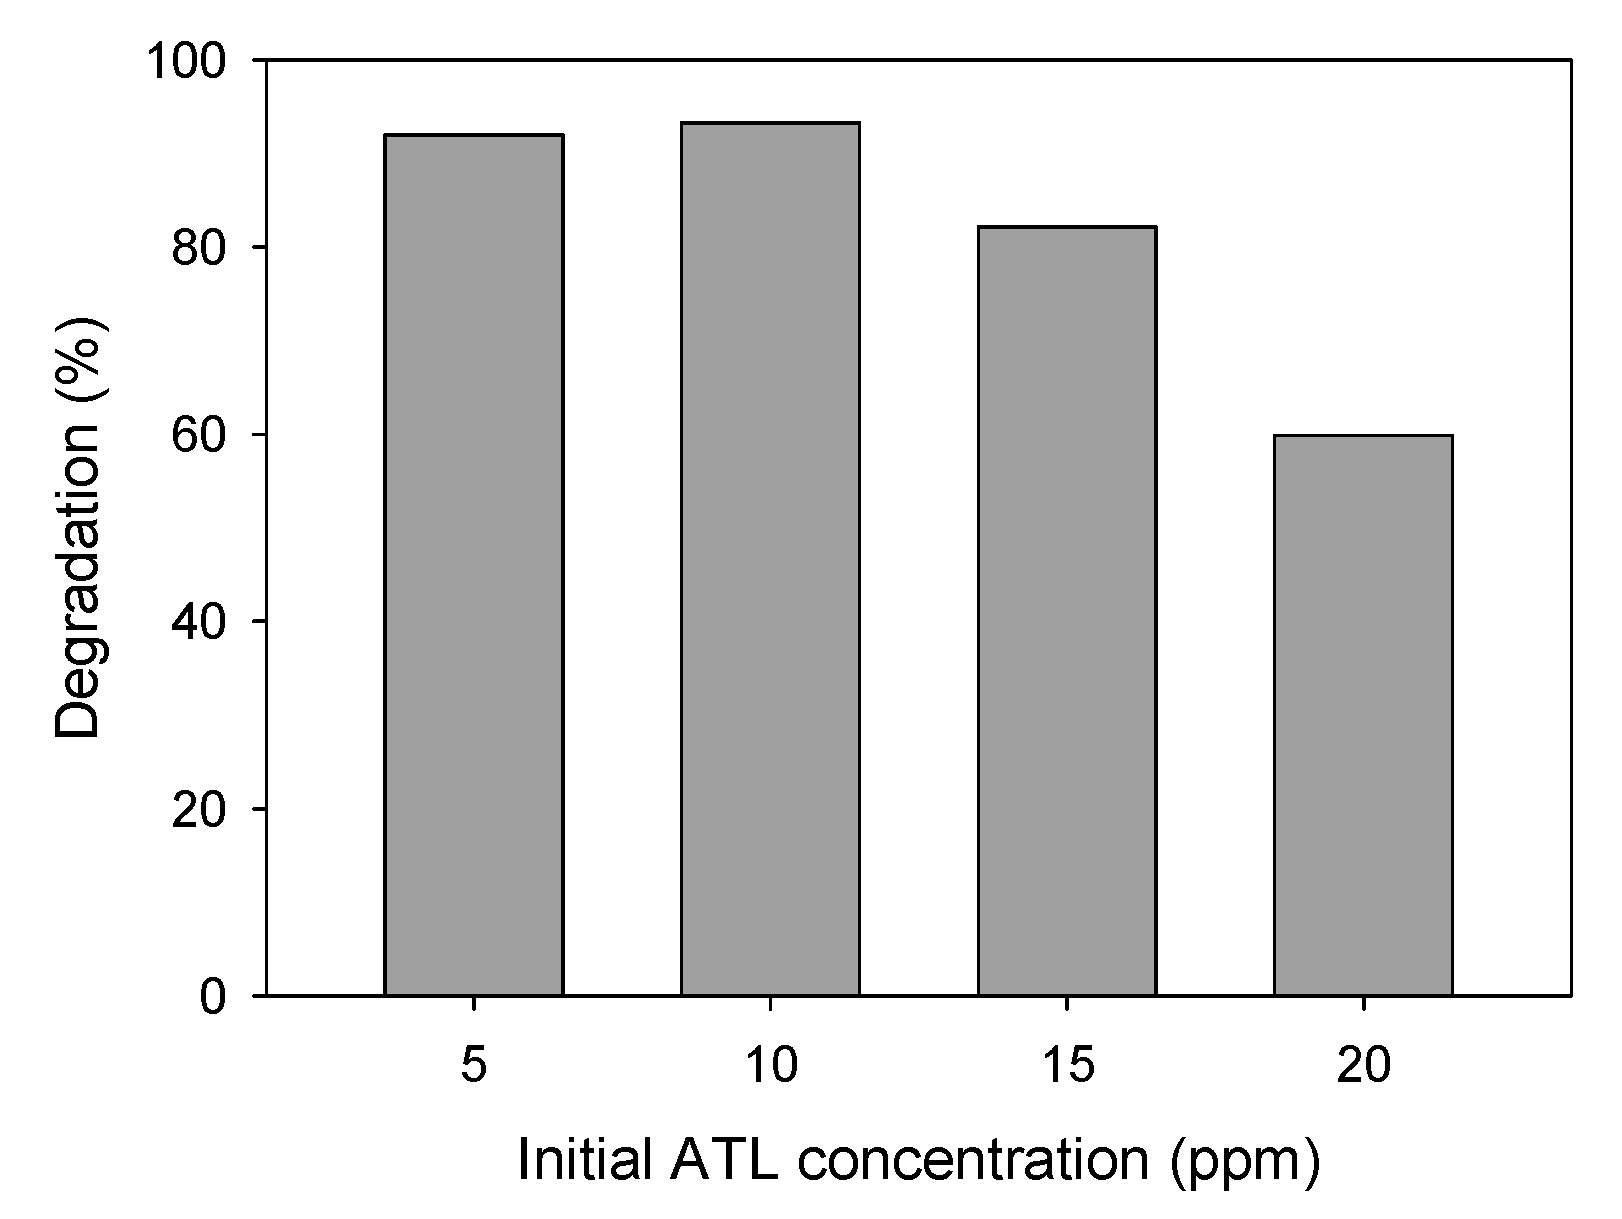
ATL Initial Concentration
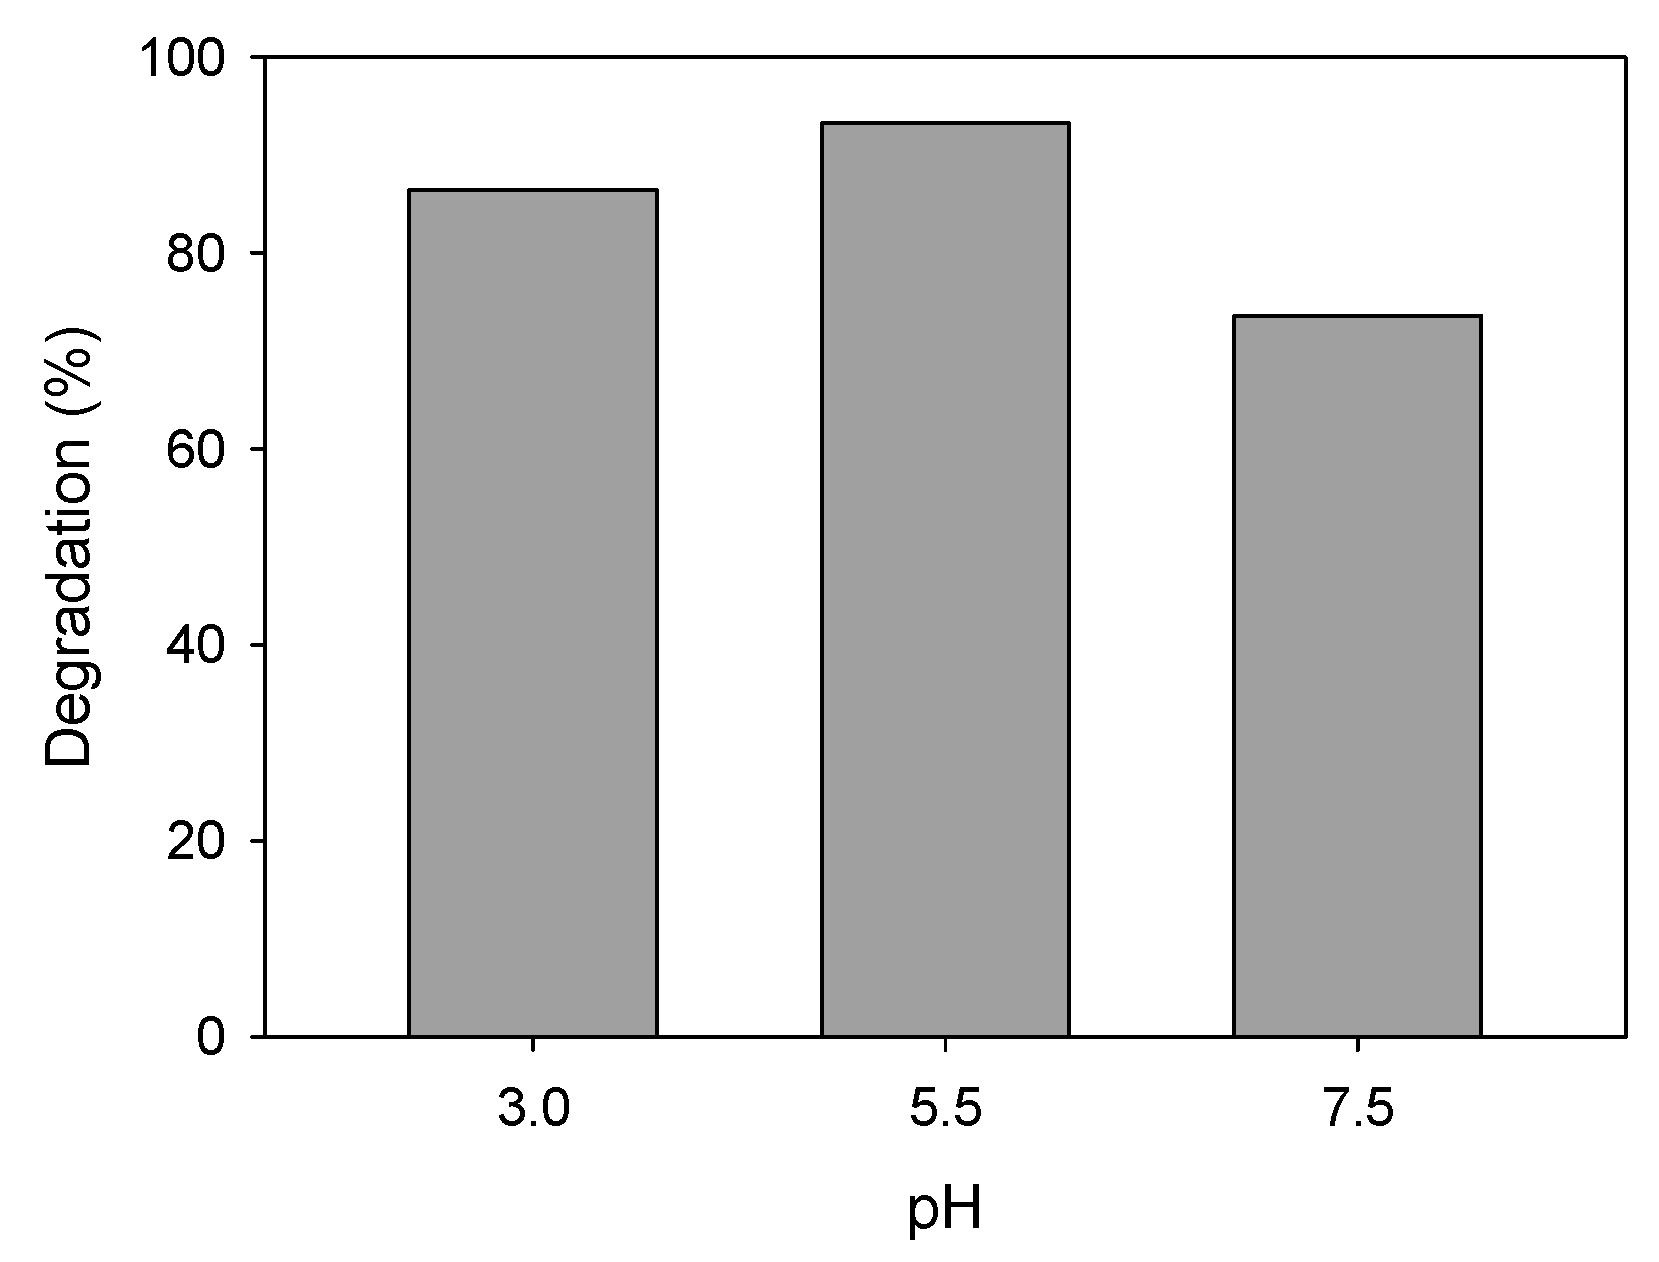
Aqueous solutions of different concentrations of ATL (ranging from 5 to 20 ppm) were submitted to photocatalytic degradation using 0.75 g·L−1 of AgCl as a nanocatalyst. Figure 11 shows the percentage of degradation achieved after 30 min under UV light irradiation (a preliminary period of 30 min in the darkness was always maintained). As shown, degradations of 92%, 93%, 82%, and 60% were obtained for solutions with 5, 10, 15, and 20 ppm of initial ATL concentration, respectively. The effect of this parameter on degradation is not significant up to 10 ppm, but higher concentrations for the same nanocatalytic load and the same exposure time to UV light irradiation are associated with a lower degradation percentage.

pH Solution

To simulate different types of wastewaters, the pH of the aqueous solutions containing ATL was varied using the required amount of sulfuric acid or sodium hydroxide. The natural pH of 10 ppm ATL solution was 5.5 and it was varied to obtain values of 3 and 7.5. Figure 12 shows the results of degradation (30 min) using 0.75 g·L−1 of AgCl as a nanocatalyst. The degradation achieved in a solution at acidic pH was slightly lower than in the case of natural pH (86% and 93%, respectively). With the increase in pH to 7.5 to obtain a slightly basic medium, the degradation decreased to 73%. Similar behavior was previously reported by Bhatia et al. [67].

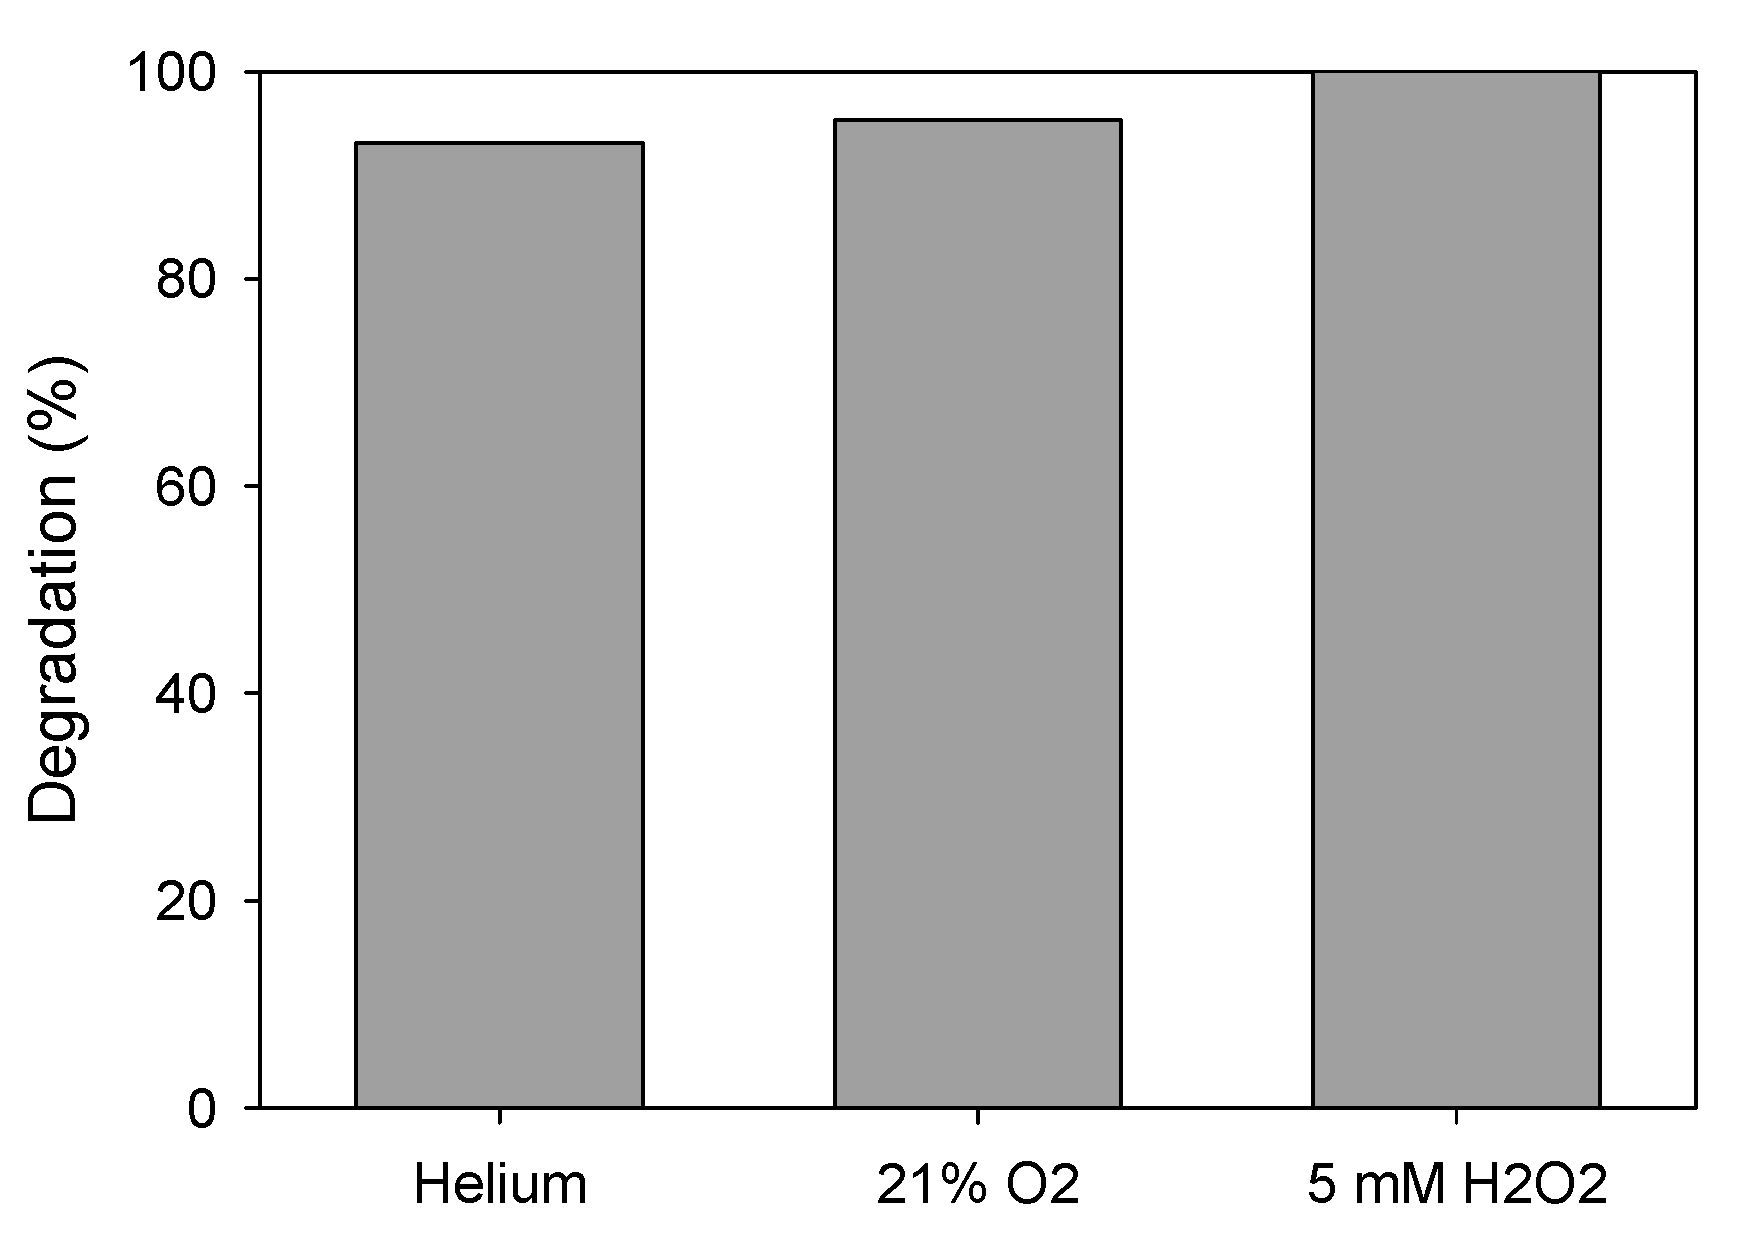
Addition of Oxidizing Agents

To evaluate the effect of the addition of oxidizing agents on the photocatalytic process, besides the standard experiment where helium was bubbled to avoid the presence of oxidizing experiments, two new tests were developed where hydrogen peroxide was added or air (oxygen source) was bubbled. In all the cases, the initial concentration of ATL was 10 ppm and nanoparticle concentration was 0.75 g·L−1. When air was bubbled, the degradation at 30 min slightly increased from 93% to 95.5% (Figure 13). When hydrogen peroxide (H2O2) was added (5 mM), total degradation was achieved in the same period of time. A similar effect was previously found by Li et al. [68].

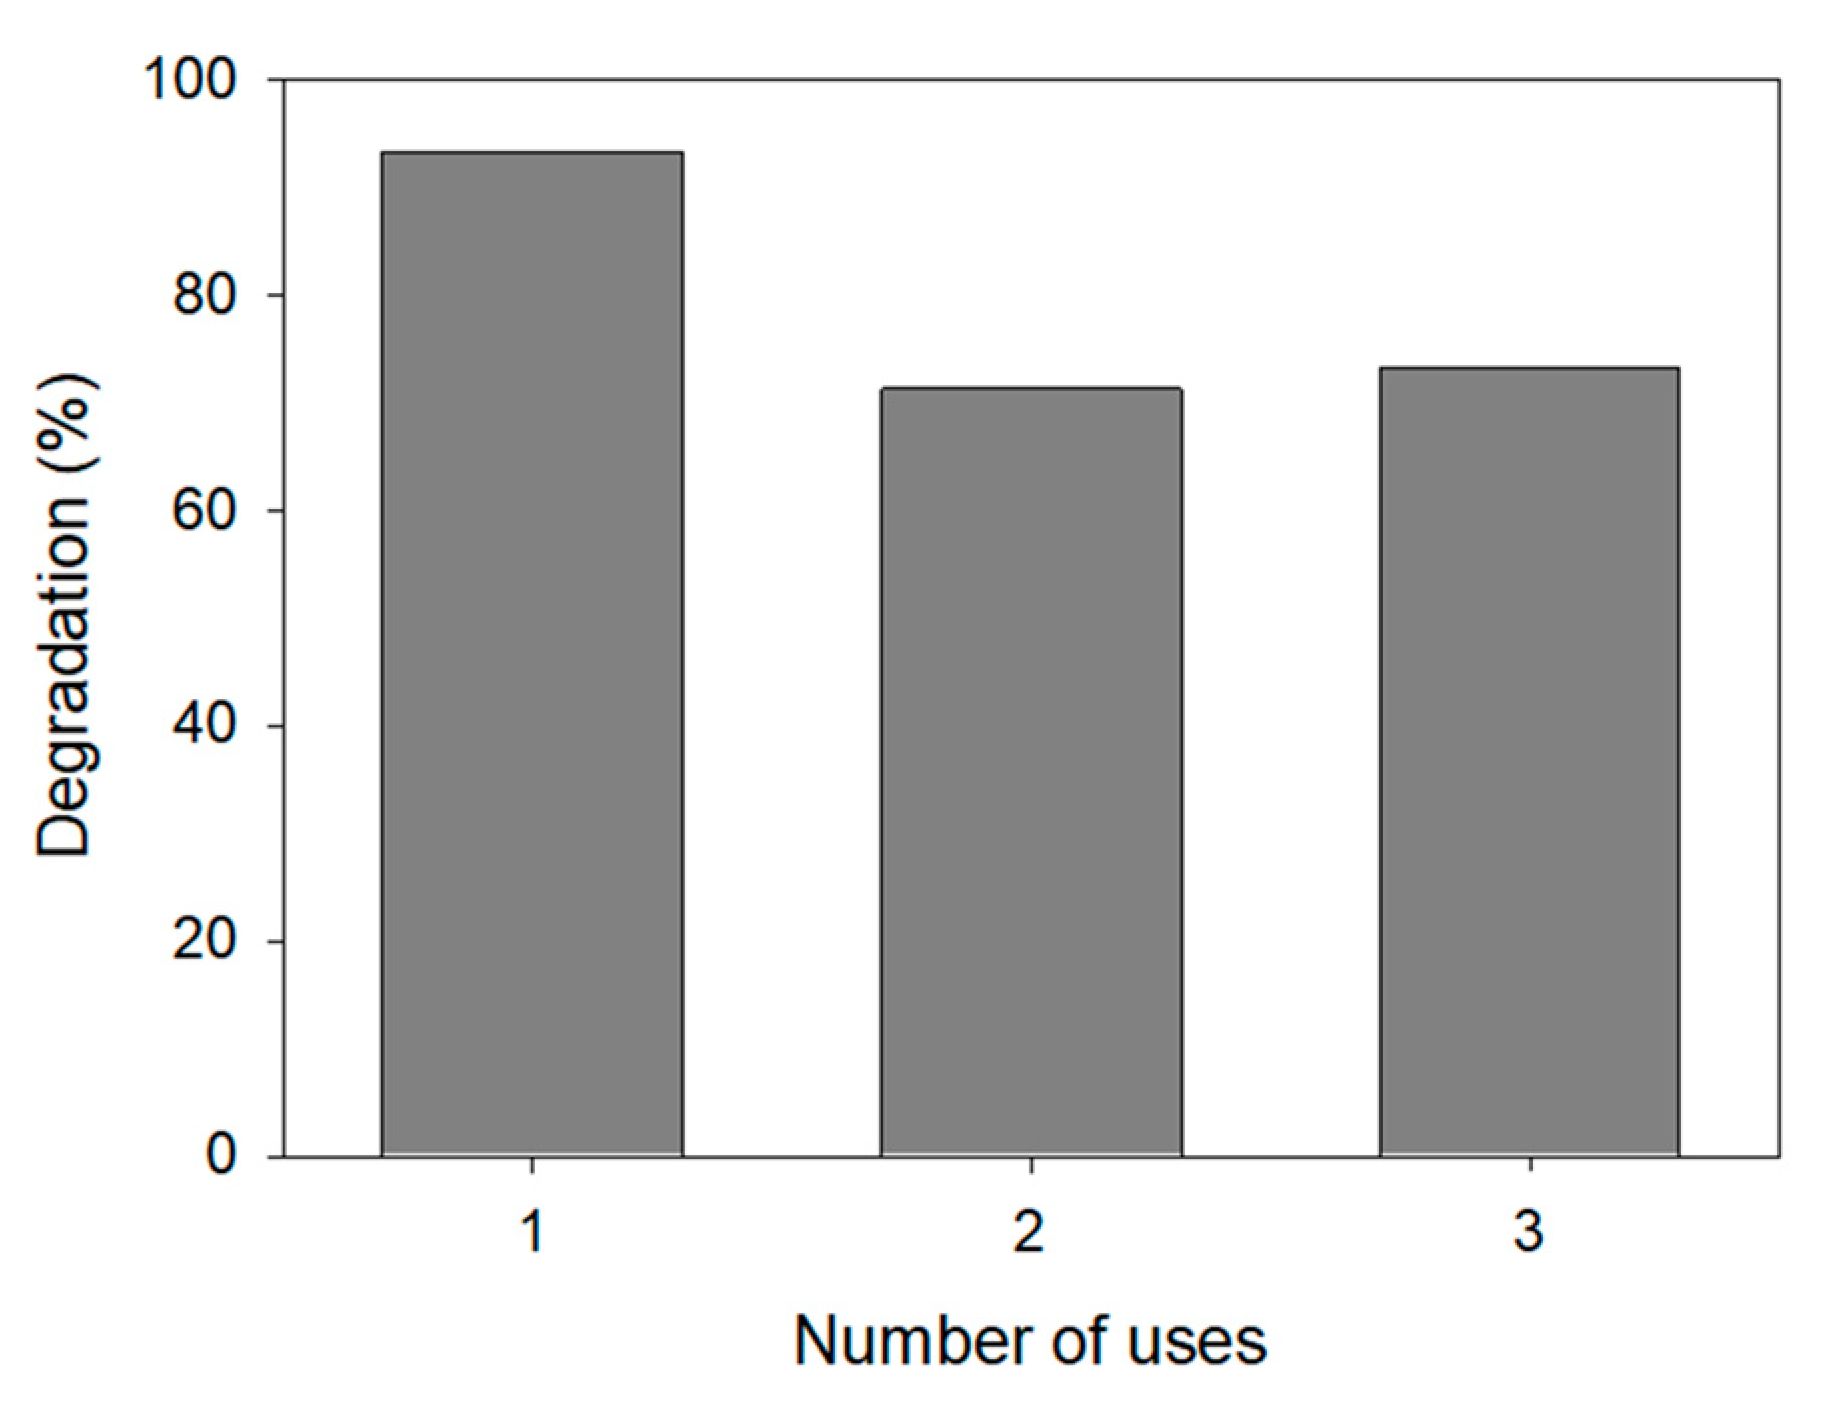
3.3.3. Durability of the Nanophotocatalyst
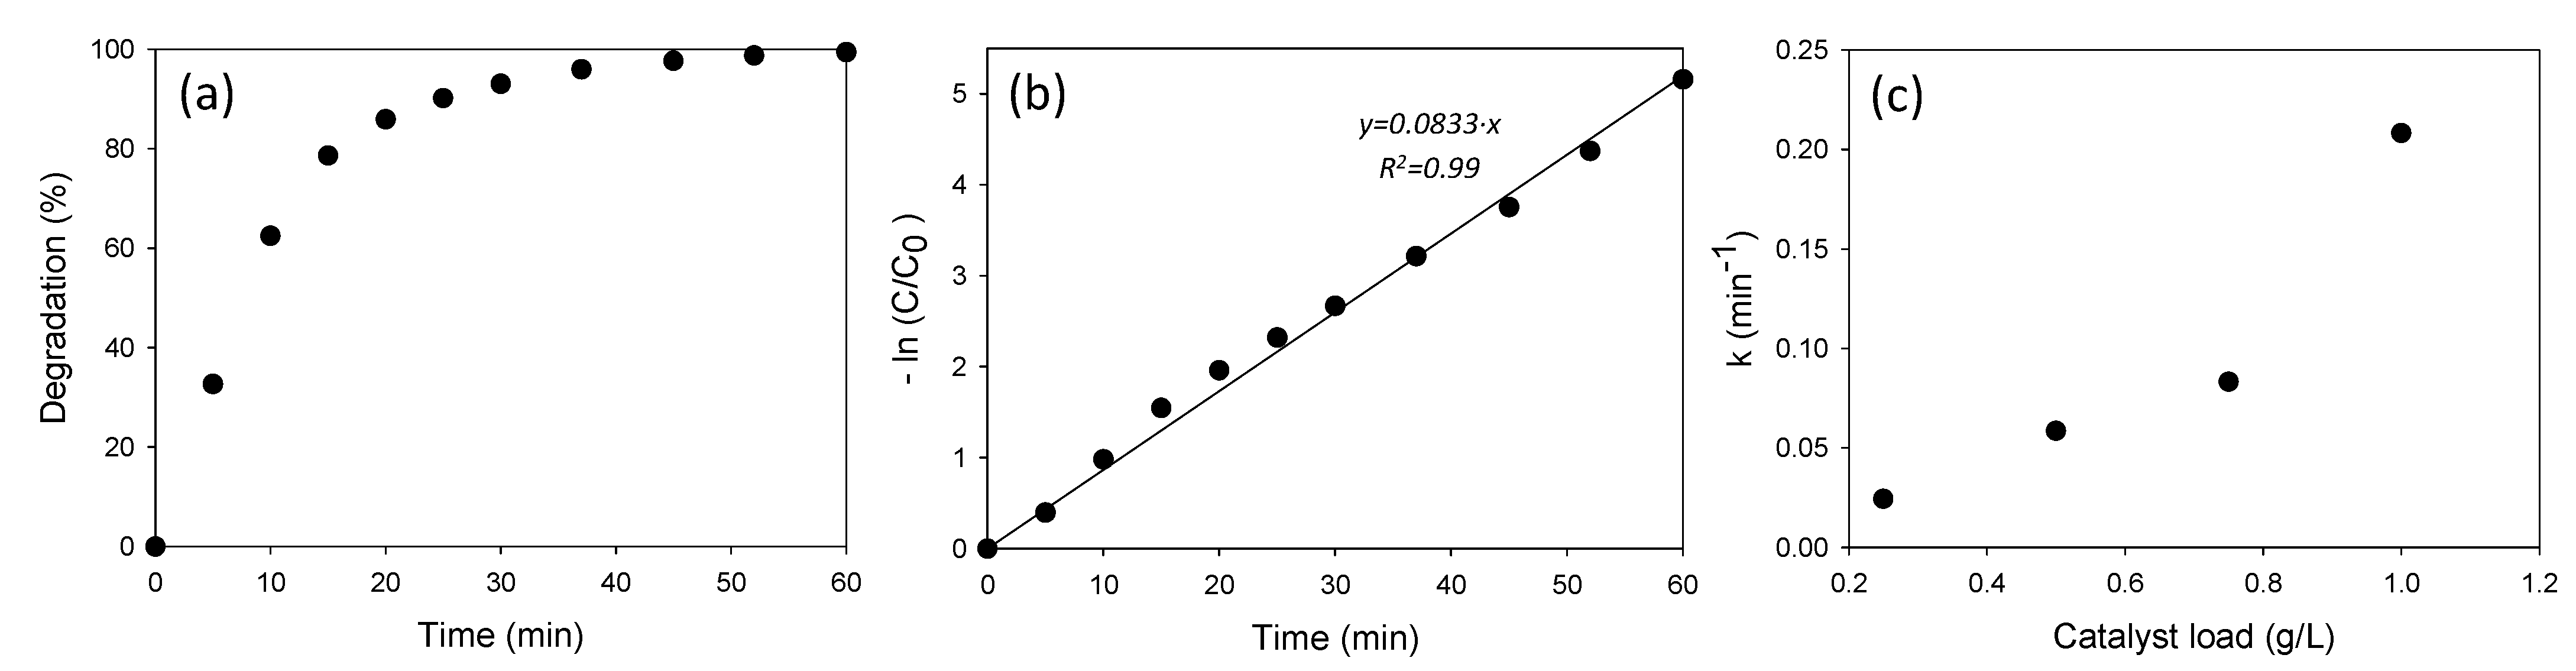
To achieve an economical process, it is important to evaluate the possibility of reusing the catalyst. Three cycles of degradation were carried out to analyze catalyst durability and efficiency. After each run of degradation (10 ppm ATL, 0.75 g·L−1 AgCl), the nanoparticles were separated from the aqueous solution by centrifugation, washed with water, and dried at 100 °C for 12 h. The nanocatalyst was then used in a subsequent degradation process under identical conditions. As can be seen in Figure 14, after the first degradation experiment, in which 93% degradation was achieved, the efficiency of the process decreased to 75%. No further decrease was detected. Part of the reduction in the efficiency is likely due to the loss of nanoparticles in the separation process.

3.3.4. Kinetics

The kinetics of the degradation process were studied through the evolution of the ATL concentration with time. The study was carried out (10 ppm ATL, 0.75 g·L−1 AgCl) by taking samples of the liquid phase at different times and analyzing them by HPLC. The results are shown in Figure 15a. Obtained data were adjusted to a pseudo-first-order reaction,
l n ( C C 0 ) = k a p p · t
where kapp is the pseudo-first-order rate coefficient (min−1), t is the degradation time, and C and C0 are the ATL concentrations at time t and at the beginning of the process, respectively. Figure 15b shows −ln(C/C0) as a function of time. A linear fit, R2 > 0.99, led to a pseudo-first-order kinetic coefficient of 0.0833 min−1. Kinetic tests were also carried out with the same ATL concentration but different concentrations of nanoparticles (0.25, 0.5, and 1 g·L−1). In all cases, the linear fits were satisfactory and pseudo-first-order kinetic coefficients were calculated. The results are shown in Figure 15c. As expected, the coefficient increases with the increase in the nanocatalyst load.

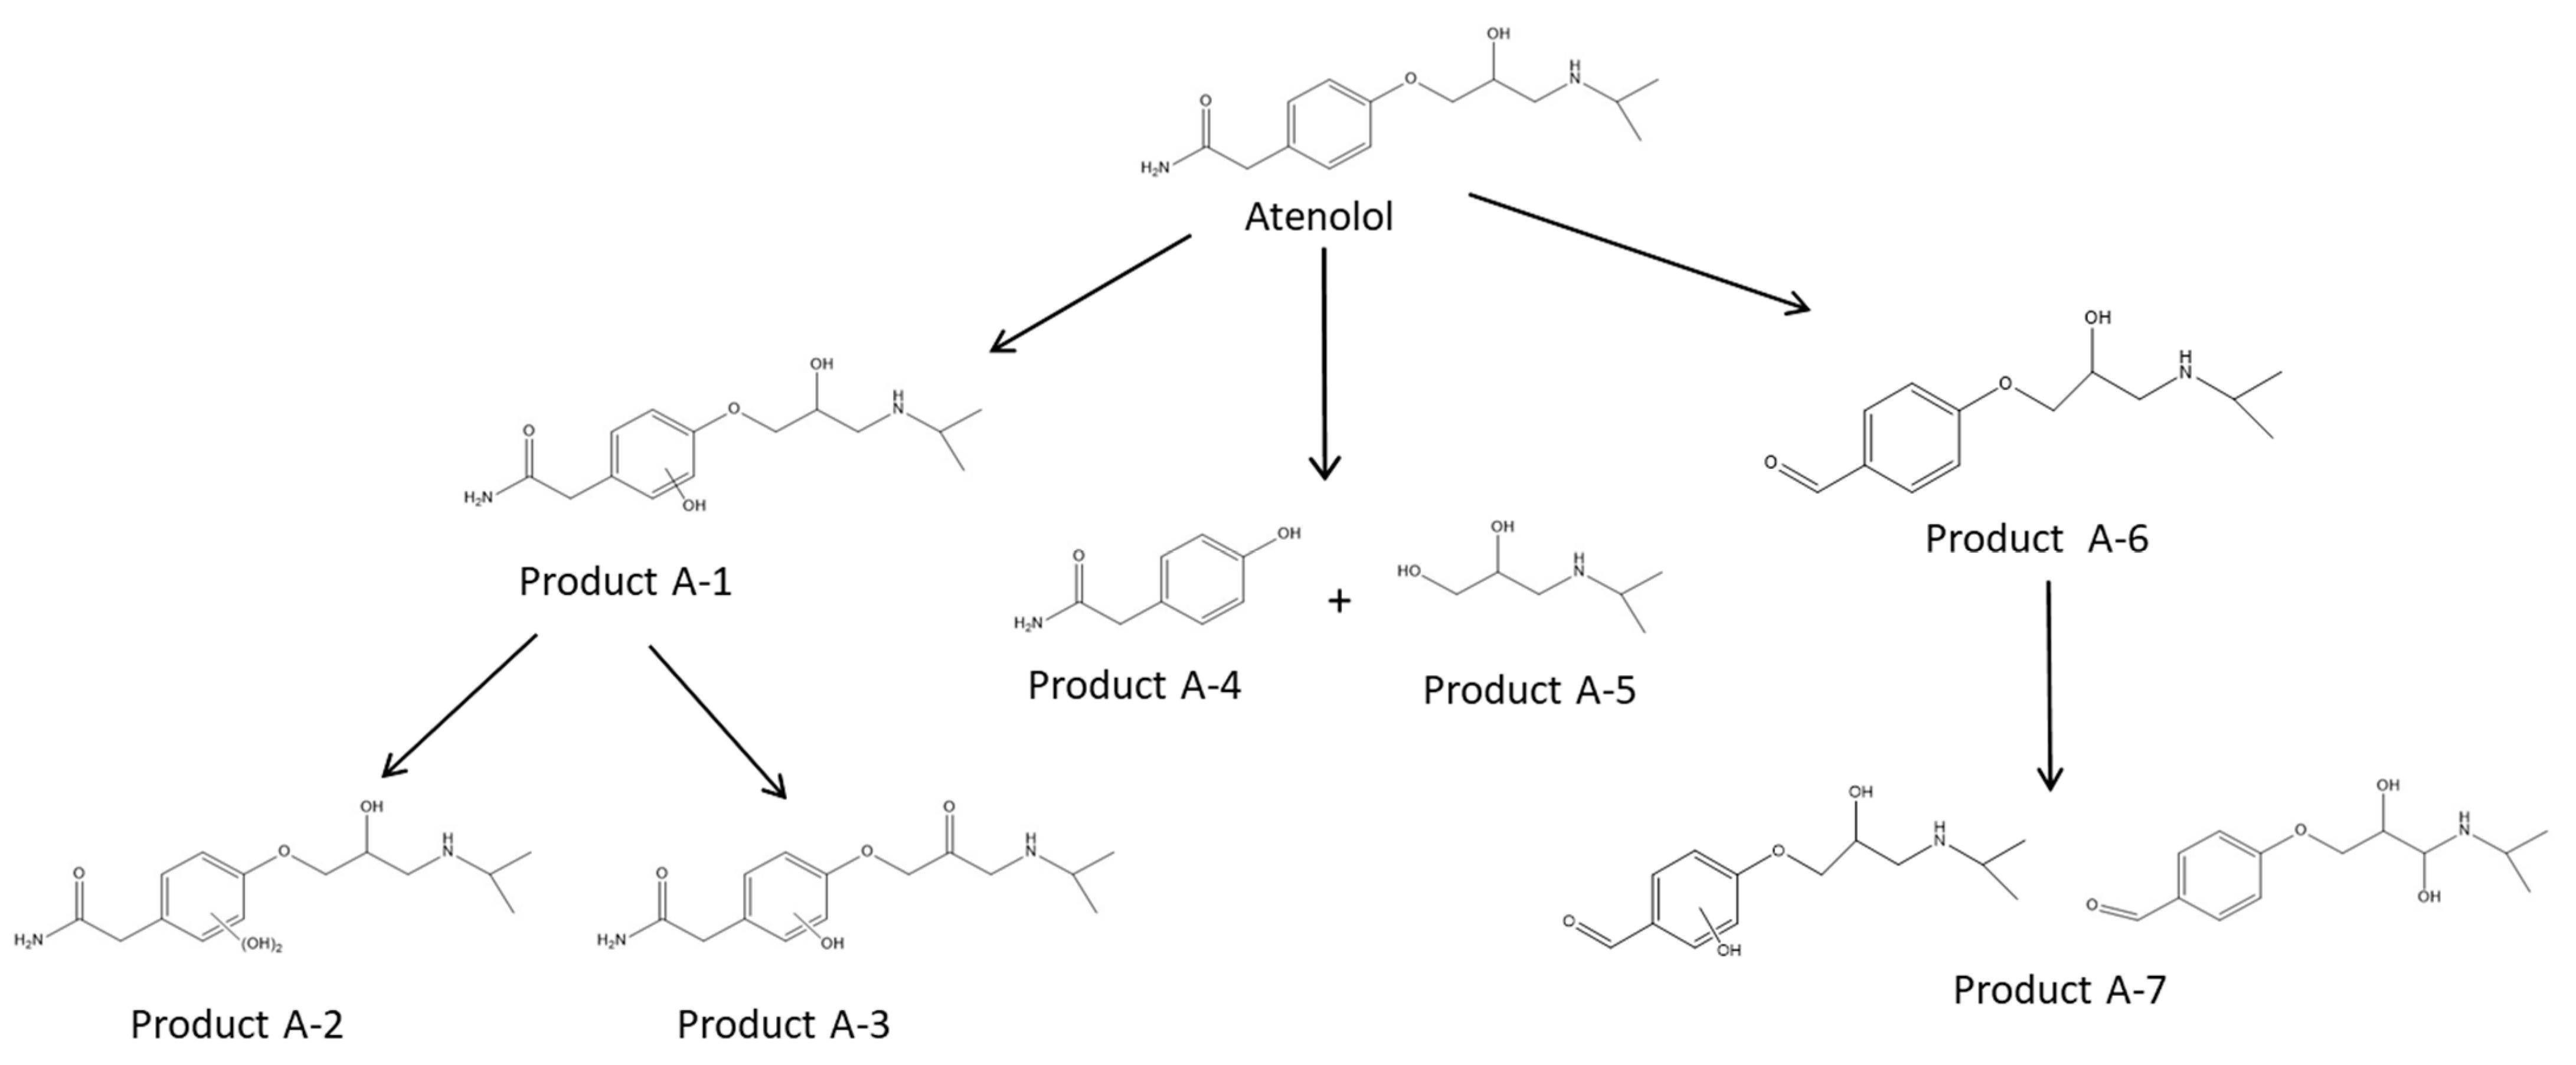
3.3.5. Degradation Products

Degradation products were identified as a means to evaluate possible pathways of AgCl-mediated ATL transformation. The HPLC chromatogram of the irradiated sample revealed some new peaks compared to the non-irradiated sample, which was indicative of the formation of intermediates. In order to determine as many intermediates as possible, aliquots at different irradiation times from the degradation process were analyzed by LC-Q-TOF-MS and MS/MS as described before [69,70]. Briefly, a list of possible entities for each chromatogram was generated using the algorithm “Find by molecular feature”. Then, a comparison between the control group (aliquots at time 0) and aliquots at different times was performed using the MassProfiler Professional software. Next, empirical formulae were generated for the potential degradation products with cut-off values of mass error <5 ppm and score >80 (100 being a perfect match of accurate mass and isotopic distribution). A list of the detected transformation products and identification parameters is shown in Table 1. As shown, the empirical formula can be applied with a high degree of certainty, with score values higher than 85% and mass errors lower than 3.5 ppm.
The proposed structures are based on the interpretation of the MS/MS spectra and the literature (Figure 16). All the identified products have been previously reported in the literature [31,71,72,73]. Products A-1 and A-2 consist of the addition of one or two hydroxyl groups to the aromatic ring. After 40 min, these products were degraded, and at longer exposure times, product A-3 was produced by oxidation of the hydroxyl group of the aliphatic chain to the ketone. Two isomers were observed for these products. Products A-4 and A-5 were formed through hydroxylation followed by the cleavage of the bond between the oxygen and the aromatic carbon. The product A-5 was stable at long degradation times, while product A-4 disappeared. The benzaldehyde derivative product A-6 was produced after the loss of the amide group, hydroxylation, and oxidation. Further hydroxylation of this product resulted in the formation of product A-7. Three isomers of A-7 were observed. Thus, at long reaction times (after 180 min), the most persistent degradation products were A-5 and A-3.

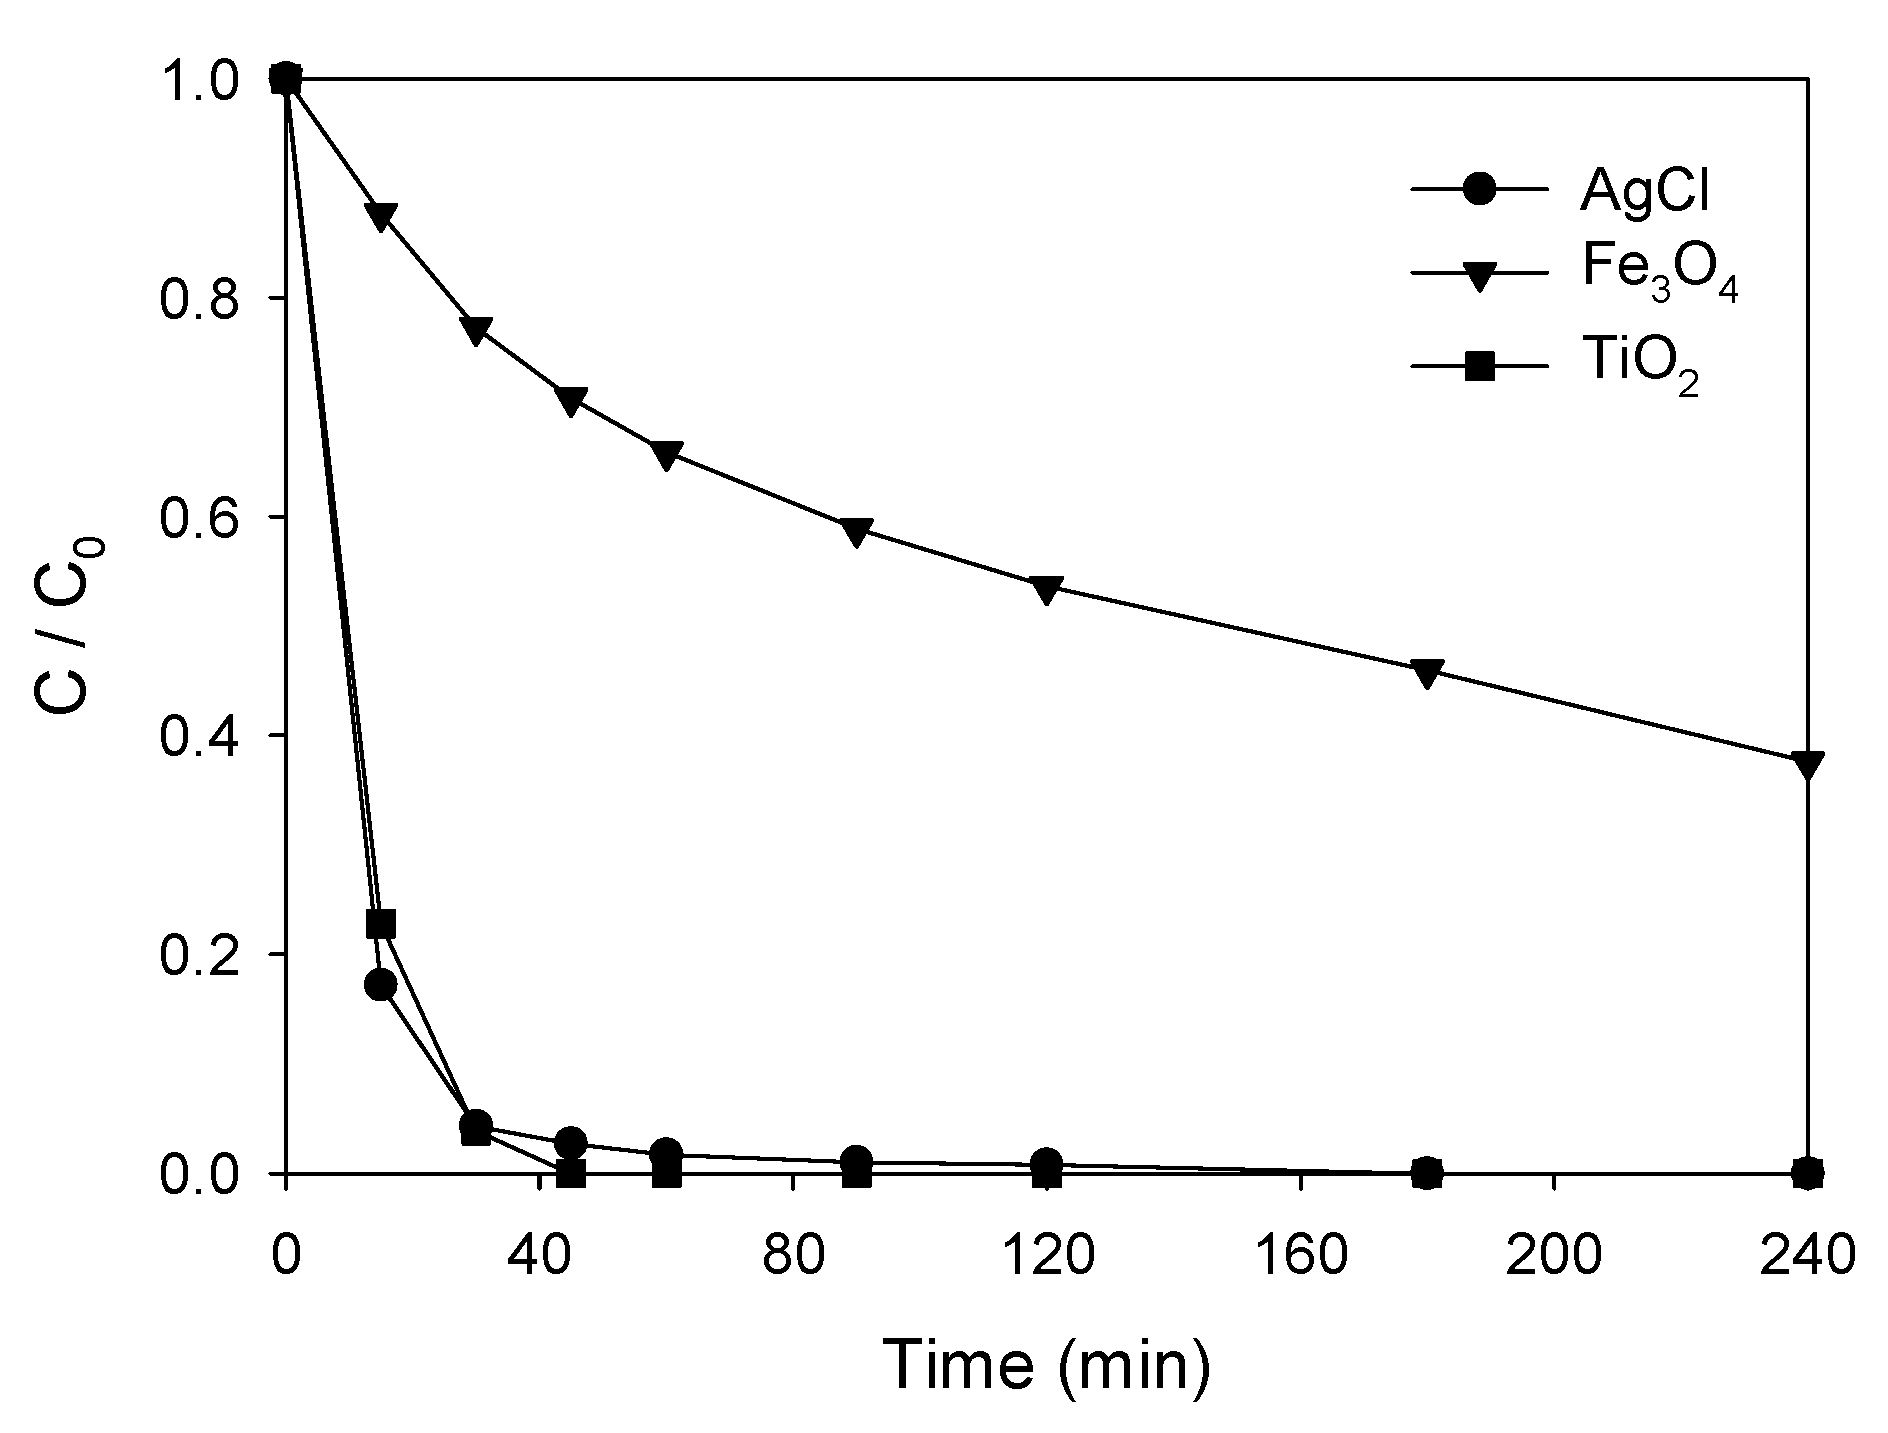
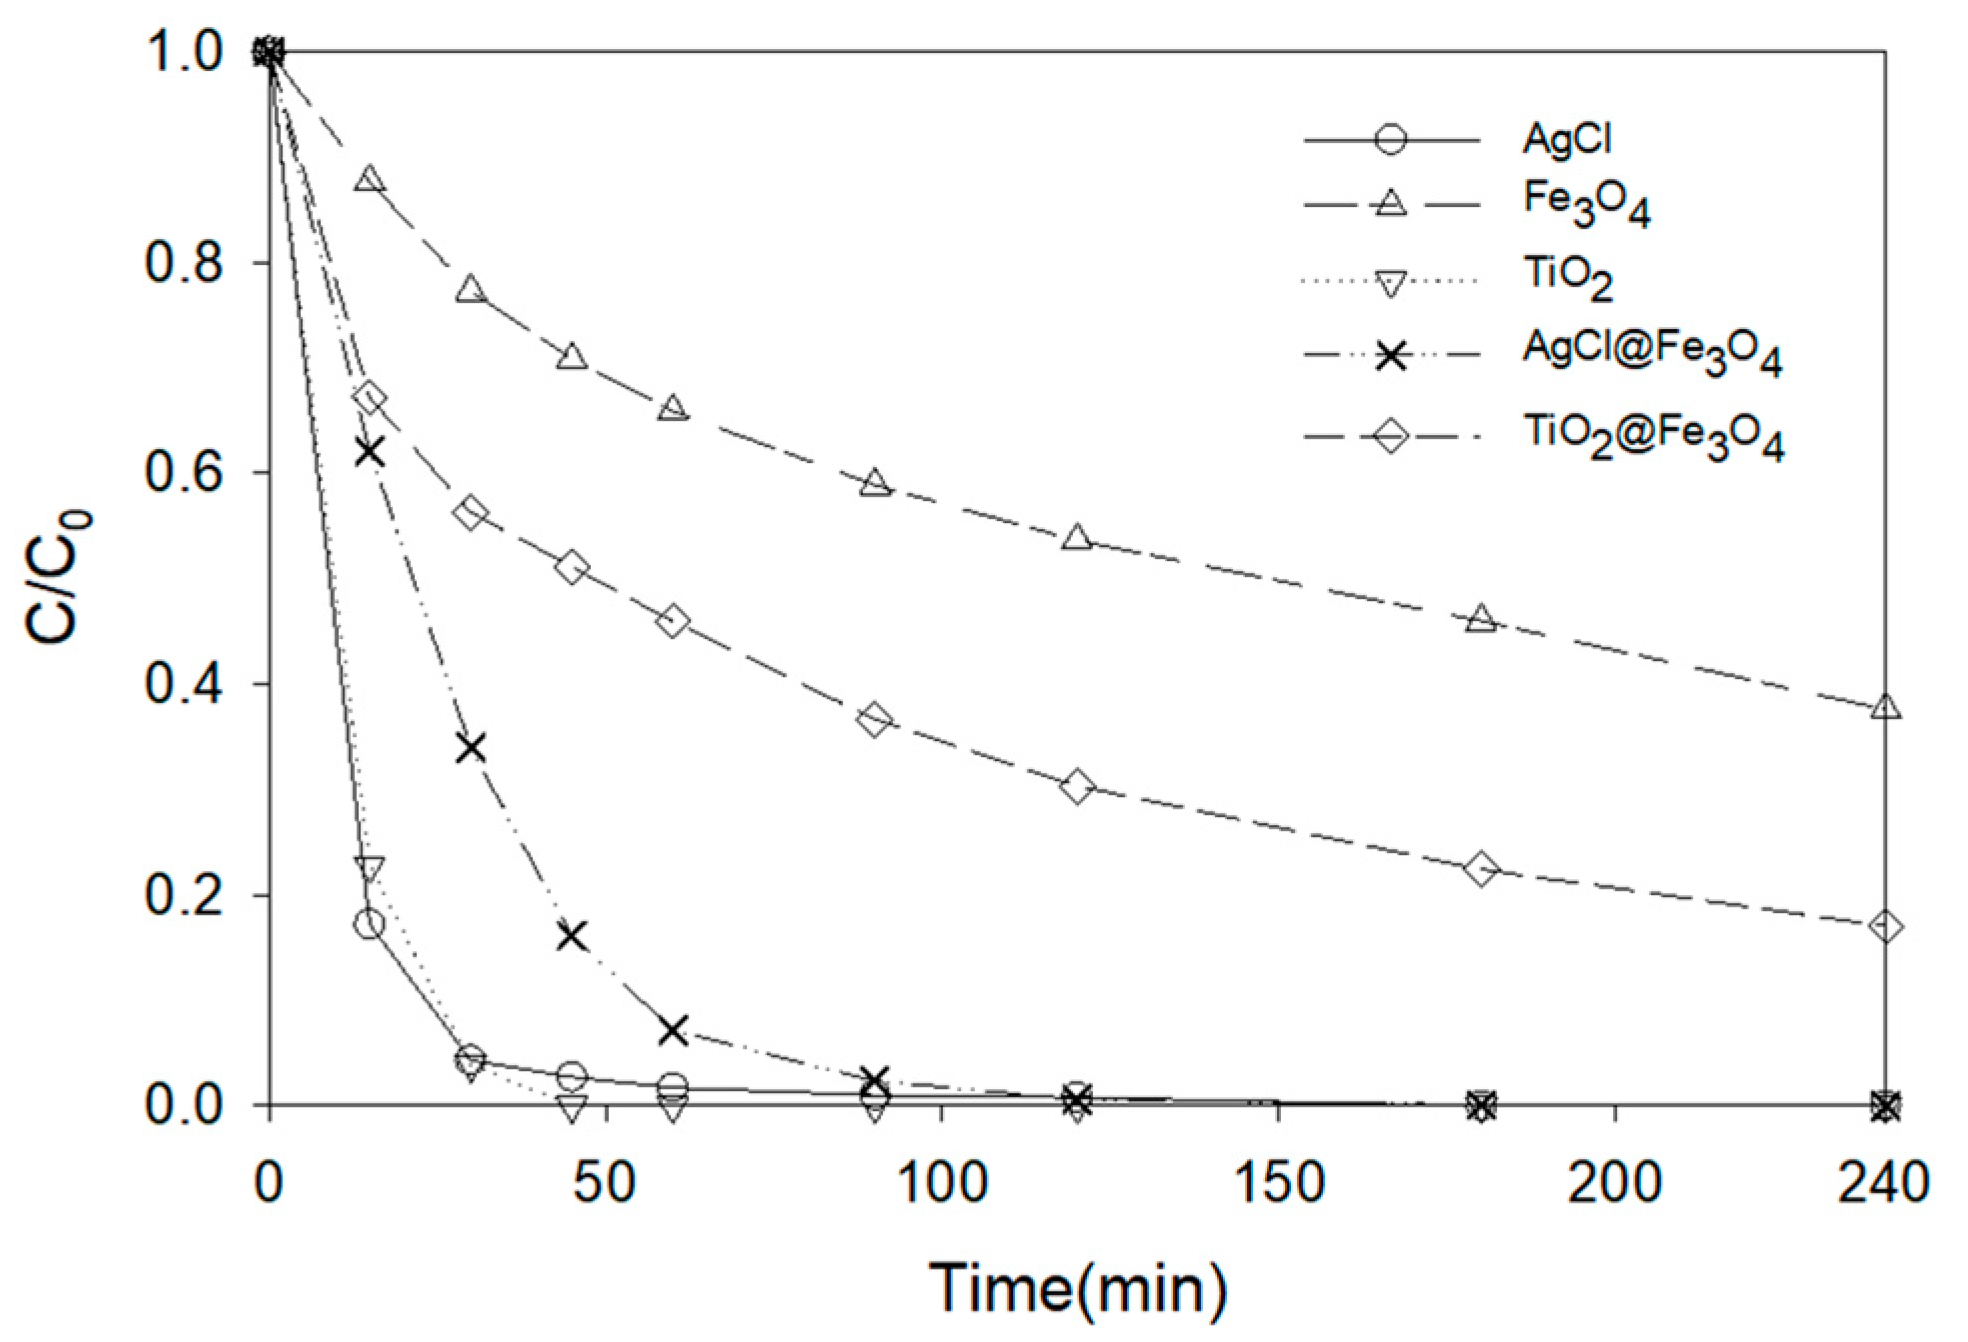
3.4. Photocatalytic Degradation of ATL with AgCl@Fe3O4 or TiO2@Fe3O4 Nanocomposites

AgCl nanoparticles were separated and re-used in this work, but the process took several stages to complete. Thus, a preliminary study was carried out to analyze the efficiency of magnetic nanocomposites, since the industrial recovery of the catalyst would be facilitated. Thus, Fe3O4 was combined with AgCl and also TiO2 due to its great degradation capacity associated with a difficult separation [65,66]. For comparative purposes, the same degradation conditions (10 ppm ATL, 0.75 g·L−1 nanocatalyst) were selected. Figure 17 shows the results obtained with these nanocomposites and the corresponding nanoparticles. Some degradation results are numerically presented in Table 2. As shown in Section 3.3.1, AgCl and TiO2 nanoparticles offer similar degradation results, with a slightly higher velocity in the case of the latter, and degradation obtained with Fe2O3 is very limited. Regarding nanocomposites, it can be observed that they present an intermediate behavior between their two constituents. Thus, comparing nanocomposites and nanoparticles, the latter show higher degradation capacity. This was expected because at the same concentration of the nanocatalyst, nanocomposites have Fe3O4 with low photocatalytic activity. However, these nanocomposites have a great advantage in the separation process and subsequent reuse. Their magnetic properties allow for an easy separation with the help of a simple magnetic field, thus avoiding the expensive process of ultracentrifugation. This is shown in Figure 18. A practically complete separation from water was achieved in a matter of seconds using a simple magnet.
Comparing AgCl@Fe2O3 and TiO2@Fe3O4 nanocomposites, the first clearly led to better results. After 30 min of reaction, the degradation achieved with AgCl@Fe3O4 MNCs is 66% and with TiO2@Fe3O4 is 44% (see Table 2). Moreover, total degradation was not possible in this last case, whereas the nanocomposite with silver achieved it in about 95 min.

4. Conclusions

The use of the IL [P6,6,6,14]Cl allowed the preparation of simple nanoparticles such as AgCl and also more complex nanocomposites (AgCl@Fe2O3 and TiO2@Fe3O4) at room pressure and low temperatures without the need for any other solvent. Among many other applications, the use of these nanomaterials as photocatalysts in the degradation of emerging pollutants is promising.
Selecting ATL as a model of a pharmaceutical pollutant in wastewater, it was found that UV-C irradiation and a catalyst are required to achieve competitive results. The use of 0.75 g·L−1 of AgCl nanoparticles led to a degradation of ATL of 96% in aqueous solution (10 ppm) after 30 min and a practically total degradation in about 45 min. Slightly better results were obtained with TiO2 nanoparticles but separation was more difficult.
Selecting AgCl as a nanocatalyst, it was found that the increase in its concentration accelerates the degradation process. Higher concentrations of ATL in the wastewater mean lower degradation if the nanocatalyst concentration is fixed. A natural pH of the solution (5.5) led to the greatest degradation rates. The use of oxidizing agents slightly increases the degradation rate, at the expense of increasing the risk and cost of the process. The catalyst can be separated by centrifugation and re-used at least three times with a small loss of efficiency. The degradation process follows first-order kinetics. The main reactions occurring during degradation were ipso-hydroxylation and subsequent fragmentation, hydroxylation with detachment of the amide moiety and further oxidation, and introduction of hydroxyl groups into the aromatic ring or the alkyl chain.
Magnetic composites (AgCl@Fe2O3 and TiO2@Fe3O4) led to worse degradation results than AgCl or TiO2 due to the limited photocatalytic activity of Fe3O4. Of the two, the silver nanocomposites clearly performed better and total degradation was achieved after about 95 min, but this was far slower than in the case of AgCl alone. However, the nanocomposites have a great advantage in the separation process, since their magnetism makes separation simple and quick.

Supplementary Materials

The following are available online at https://www.mdpi.com/2079-4991/11/2/411/s1, Figure S1: 1H and 13C spectra of [P6, 6, 6, 14]Cl, Figure S2: UV-Vis-absorbance of AgCl nanoparticles, Figure S3: XRD diffraction pattern of AgCl nanoparticles, Figure S4: XPS spectra of AgCl nanoparticles: Ag3d (a) and Cl2p (b), Figure S5: EDS spectrum of TiO2@Fe3O4 nanocomposite, Figure S6: XRD patterns of TiO2@Fe3O4 nanocomposite, Figure S7: XPS spectra of TiO2@Fe3O4 nanocomposite: Fe2p (a) and Ti2p (b), Figure S8: EDS spectrum of AgCl@Fe3O4 nanocomposite, Figure S9: XRD patterns of AgCl@Fe3O4 nanocomposite, Figure S10: XPS spectra of AgCl@Fe3O4 nanocomposite: Ag3d (a) and Fe2p (b)

Author Contributions

Experimental, R.C.; analatical studies: R.R.; writing, R.R., E.R. and A.S.; project coordinator, E.R.; funding acquisition, A.S. All authors have read and agreed to the published version of the manuscript.

Funding

This research was funded by Xunta de Galicia through grant numbers ED431B 2020/21, ED431B 2020/21 and ED431C2017/36, the Spanish Agencia Estatal de Investigación (ref. CTM2017-84763-C3-R-2), and FEDER/ERDF funds (European Regional Development Fund).

Conflicts of Interest

The authors declare no conflict of interest.

References

  1. Daughton, C.G.; Ternes, T.A. Pharmaceuticals and personal care products in the environment: Agents of subtle change? Environ. Health Perspect. 1999, 107, 907–938. [Google Scholar] [CrossRef] [PubMed]
  2. Ellis, J. Pharmaceutical and personal care products (PPCPs) in urban receiving waters. Environ. Pollut. 2006, 144, 184–189. [Google Scholar] [CrossRef]
  3. Ebele, A.J.; Abdallah, M.A.-E.; Harrad, S. Pharmaceuticals and personal care products (PPCPs) in the freshwater aquatic environment. Emerg. Contam. 2017, 3, 1–16. [Google Scholar] [CrossRef]
  4. Pal, A.; He, Y.; Jekel, M.; Reinhard, M.; Gin, K.Y.-H. Emerging contaminants of public health significance as water quality indicator compounds in the urban water cycle. Environ. Int. 2014, 71, 46–62. [Google Scholar] [CrossRef]
  5. Recsetara, M.S.; Fitzsimmonsb, K.M.; Cuello, J.L.; Hoppe-Jones, C.; Snyderc, S.A. Evaluation of a recirculating hydroponic bed bioreactor for removal of contaminants of emerging concern from tertiary-treated wastewater effluent. Chemosphere 2021, 128121. [Google Scholar] [CrossRef]
  6. Petrie, B.; Barden, R.; Kasprzyk-Hordern, B. A review on emerging contaminants in wastewaters and the environment: Current knowledge, understudied areas and recommendations for future monitoring. Water Res. 2015, 72, 3–27. [Google Scholar] [CrossRef]
  7. Geissen, V.; Mol, H.G.J.; Klumpp, E.; Umlauf, G.; Nadal, M.; Van Der Ploeg, M.; Van De Zee, S.E.; Ritsema, C.J. Emerging pollutants in the environment: A challenge for water resource management. Int. Soil Water Conserv. Res. 2015, 3, 57–65. [Google Scholar] [CrossRef]
  8. Roberts, J.; Kumar, A.; Du, J.; Hepplewhite, C.; Ellis, D.J.; Christy, A.G.; Beavis, S.G. Pharmaceuticals and personal care products (PPCPs) in Australia’s largest inland sewage treatment plant, and its contribution to a major Australian river during high and low flow. Sci. Total Environ. 2016, 541, 1625–1637. [Google Scholar] [CrossRef]
  9. Gavrilescu, M.; Demnerová, K.; Aamand, J.; Agathos, S.N.; Fava, F. Emerging pollutants in the environment: Present and future challenges in biomonitoring, ecological risks and bioremediation. New Biotechnol. 2015, 32, 147–156. [Google Scholar] [CrossRef] [PubMed]
  10. Yoon, Y.; Westerhoff, P.; Snyder, S.A.; Wert, E.C.; Yoon, J. Removal of endocrine disrupting compounds and pharmaceu-ticals by nanofiltration and ultrafiltration membranes. Desalination 2007, 202, 16–23. [Google Scholar] [CrossRef]
  11. Abdel-Fatah, M.A. Nanofiltration systems and applications in wastewater treatment: Review article. Ain Shams Eng. J. 2018, 9, 3077–3092. [Google Scholar] [CrossRef]
  12. Grassi, M.; Rizzo, L.; Farina, A. Endocrine disruptors compounds, pharmaceuticals and personal care products in urban wastewater: Implications for agricultural reuse and their removal by adsorption process. Environ. Sci. Pollut. Res. 2013, 20, 3616–3628. [Google Scholar] [CrossRef]
  13. Joseph, L.; Jun, B.-M.; Jang, M.; Park, C.M.; Muñoz-Senmache, J.C.; Hernández-Maldonado, A.J.; Heyden, A.; Yu, M.; Yoon, Y. Removal of contaminants of emerging concern by metal-organic framework nanoadsorbents: A review. Chem. Eng. J. 2019, 369, 928–946. [Google Scholar] [CrossRef]
  14. Suarez, S.; Lema, J.M.; Omil, F. Pre-treatment of hospital wastewater by coagulation–flocculation and flotation. Bioresour. Technol. 2009, 100, 2138–2146. [Google Scholar] [CrossRef] [PubMed]
  15. Suarez, S.; Lema, J.M.; Omil, F. Removal of pharmaceutical and personal care products (PPCPs) under nitrifying and de-nitrifying conditions. Water Res. 2010, 44, 3214–3224. [Google Scholar] [CrossRef]
  16. Gardner, M.; Jones, V.; Comber, S.; Scrimshaw, M.D.; Coello-Garcia, T.; Cartmell, E.; Lester, J.; Ellor, B. Performance of UK wastewater treatment works with respect to trace contaminants. Sci. Total Environ. 2013, 456, 359–369. [Google Scholar] [CrossRef] [Green Version]
  17. Mirzaei, A.; Chen, Z.; Haghighat, F.; Yerushalmi, L. Removal of pharmaceuticals from water by homo/heterogonous Fenton-type processes—A review. Chemosphere 2017, 174, 665–688. [Google Scholar] [CrossRef]
  18. Utset, B.; Garcia, J.; Casado, J.; Domènech, X.; Peral, J. Replacement of H2O2 by O2 in Fenton and photo-Fenton reactions. Chemosphere 2000, 41, 1187–1192. [Google Scholar] [CrossRef]
  19. Esplugas, S.; Bila, D.M.; Krause, L.G.T.; Dezotti, M. Ozonation and advanced oxidation technologies to remove endocrine disrupting chemicals (EDCs) and pharmaceuticals and personal care products (PPCPs) in water effluents. J. Hazard. Mater. 2007, 149, 631–642. [Google Scholar] [CrossRef]
  20. Paucar, N.E.; Kim, I.; Tanaka, H.; Sato, C. Ozone treatment process for the removal of pharmaceuticals and personal care products in wastewater. Ozone Sci. Eng. 2019, 41, 3–16. [Google Scholar] [CrossRef]
  21. Chu, K.H.; Al-Hamadani, Y.; Park, C.M.; Lee, G.; Jang, M.; Jang, A.; Her, N.; Son, A.; Yoon, Y. Ultrasonic treatment of endocrine disrupting compounds, pharmaceuticals, and personal care products in water: A review. Chem. Eng. J. 2017, 327, 629–647. [Google Scholar] [CrossRef]
  22. Pérez, G.; Fernández-Alba, A.; Urtiaga, A.; Ortiz, I. Electro-oxidation of reverse osmosis concentrates generated in tertiary water treatment. Water Res. 2010, 44, 2763–2772. [Google Scholar] [CrossRef]
  23. Urtiaga, A.; Pérez, G.; Ibáñez, R.; Ortiz, I. Removal of pharmaceuticals from a WWTP secondary effluent by ultrafiltration/reverse osmosis followed by electrochemical oxidation of the RO concentrate. Desalination 2013, 331, 26–34. [Google Scholar] [CrossRef]
  24. Duan, X.D.; He, X.X.; Wang, D.; Mezyk, S.P.; Otto, S.C.; Marfil-Vega, R.; Mills, M.A.; Dionysiou, D.D. Decomposition of Iodinated Pharmaceuticals by UV-254 nm-assisted Advanced Oxidation Processes. J. Hazard. Mater. 2017, 323, 489–499. [Google Scholar] [CrossRef] [PubMed]
  25. Baena-Nogueras, R.M.; González-Mazo, E.; Lara-Martín, P.A. Degradation kinetics of pharmaceuticals and personal care products in surface waters: Photolysis vs biodegradation. Sci. Total. Environ. 2017, 643–654. [Google Scholar] [CrossRef] [PubMed]
  26. Bethi, B.; Sonawane, S.H.; Bhanvase, B.A.; Gumfekar, S.P. Nanomaterials-based advanced oxidation processes for wastewater treatment: A review. Chem. Eng. Process. Process. Intensif. 2016, 109, 178–189. [Google Scholar] [CrossRef]
  27. Bakbolat, B.; Daulbayev, C.; Sultanov, F.; Beissenov, R.; Umirzakov, A.; Mereke, A.; Bekbaev, A.; Chuprakov, I. Recent Developments of TiO2-Based Photocatalysis in the Hydrogen Evolution and Photodegradation: A Review. Nanomaterials 2020, 10, 1790. [Google Scholar] [CrossRef]
  28. Hapeshi, E.; Achilleos, A.; Vasquez, M.; Michael, C.; Xekoukoulotakis, N.; Mantzavinos, D.; Kassinos, D. Drugs degrading photocatalytically: Kinetics and mechanisms of ofloxacin and atenolol removal on titania suspensions. Water Res. 2010, 44, 1737–1746. [Google Scholar] [CrossRef]
  29. Martínez, C.; Canle, M.; Fernández, M.; Santaballa, J.; Faria, J. Kinetics and mechanism of aqueous degradation of carbamazepine by heterogeneous photocatalysis using nanocrystalline TiO2, ZnO and multi-walled carbon nanotubes–anatase composites. Appl. Catal. B Environ. 2011, 102, 563–571. [Google Scholar] [CrossRef]
  30. Karunakaran, C.; Dhanalakshmi, R.; Manikandan, G.; Gomathisankar, P. Photodegradation of carboxylic acids on Al2O3 and SiO2 nanoparticles. Indian J. Chem. Part A Inorg. Phys. Theor. Anal. 2011, 50, 163–170. [Google Scholar]
  31. Jia, Y.; Zhou, L.; Ferronato, C.; Yang, X.; Salvador, A.; Zeng, C.; Chovelon, J.-M. Photocatalytic degradation of atenolol in aqueous titanium dioxide suspensions: Kinetics, intermediates and degradation pathways. J. Photochem. Photobiol. A Chem. 2013, 254, 35–44. [Google Scholar] [CrossRef]
  32. Bodzek, M.; Rajca, M. Photocatalysis in the treatment and disinfection of water. Part I. Theoretical backgrounds/Foto-kataliza w oczyszczaniu i dezynfekcji wody część i. podstawy teoretyczne. Ecol. Chem. Eng. S 2012, 489. [Google Scholar] [CrossRef]
  33. Kolahalam, L.A.; Viswanath, I.K.; Diwakar, B.S.; Govindh, B.; Reddy, V.; Murthy, Y. Review on nanomaterials: Synthesis and applications. Mater. Today Proc. 2019, 18, 2182–2190. [Google Scholar] [CrossRef]
  34. Nasrollahzadeh, M.; Sajjadi, M.; Iravani, S.; Varma, R.S. Green-synthesized nanocatalysts and nanomaterials for water treatment: Current challenges and future perspectives. J. Hazard. Mater. 2021, 401, 123401. [Google Scholar] [CrossRef] [PubMed]
  35. Lu, A.-H.; Salabas, E.-L.; Schüth, F. Magnetic Nanoparticles: Synthesis, Protection, Functionalization, and Application. Angew. Chem. Int. Ed. 2007, 46, 1222–1244. [Google Scholar] [CrossRef]
  36. Behrens, S.; Appel, I. Magnetic nanocomposites. Curr. Opin. Biotechnol. 2016, 39, 89–96. [Google Scholar] [CrossRef]
  37. Wu, W.; Xiao, X.; Zhang, S.; Ren, F.; Jiang, C.Z. Facile method to synthesize magnetic iron oxides/TiO2 hybrid nanoparticles and their photodegradation application of methylene blue. Nanoscale Res. Lett. 2011, 6, 533. [Google Scholar] [CrossRef] [PubMed] [Green Version]
  38. Álvarez, P.M.; Jaramillo, J.; López-Piñero, F.; Plucinski, P.K. Preparation and characterization of magnetic TiO2 nano-particles and their utilization for the degradation of emerging pollutants in water. Appl. Catal. B Environ. 2010, 100, 338–345. [Google Scholar] [CrossRef]
  39. Shekofteh-Gohari, M.; Habibi-Yangjeh, A. Ultrasonic-assisted preparation of novel ternary ZnO/AgI/Fe3O4 nanocomposites as magnetically separable visible-light-driven photocatalysts with excellent activity. J. Colloid Interface Sci. 2016, 461, 144–153. [Google Scholar] [CrossRef]
  40. Wang, J.; Yang, J.; Li, X.; Wang, D.; Wei, B.; Song, H.; Li, X.; Fu, S. Preparation and photocatalytic properties of magnetically reusable Fe3O4@ZnO core/shell nanoparticles. Phys. E Low Dimens. Syst. Nanostruct. 2016, 75, 66–71. [Google Scholar] [CrossRef]
  41. Wang, Y.; Hou, Q.; Ju, M.; Li, W. New Developments in Material Preparation Using a Combination of Ionic Liquids and Microwave Irradiation. Nanomaterials 2019, 9, 647. [Google Scholar] [CrossRef] [PubMed] [Green Version]
  42. Khare, V.; Ruby, C.; Sonkaria, S.; Taubert, A. A green and sustainable nanotechnology: Role of ionic liquids. Int. J. Precis. Eng. Manuf. 2012, 13, 1207–1213. [Google Scholar] [CrossRef]
  43. He, Z.; Alexandridis, P. Nanoparticles in ionic liquids: Interactions and organization. Phys. Chem. Chem. Phys. 2015, 17, 18238–18261. [Google Scholar] [CrossRef]
  44. Antonietti, M.; Kuang, D.; Smarsly, B.; Zhou, Y. Ionic Liquids for the Convenient Synthesis of Functional Nanoparticles and Other Inorganic Nanostructures. Angew. Chem. Int. Ed. 2004, 43, 4988–4992. [Google Scholar] [CrossRef]
  45. Scholten, J.D.; Prechtl, M.H.G.; Dupont, J. Formation of Nanoparticles Assisted by Ionic Liquids. In Handbook of Green Chemistry; Wiley: Hoboken, NJ, USA, 2010; Volume 8, pp. 1–31. [Google Scholar]
  46. Duan, X.; Ma, J.-M.; Lian, J.; Zheng, W. The art of using ionic liquids in the synthesis of inorganic nanomaterials. CrystEngComm 2014, 16, 2550–2559. [Google Scholar] [CrossRef]
  47. Rodríguez-Cabo, B.; Rodríguez-Palmeiro, I.; Rodil, R.; Rodil, E.; Arce, A.; Soto, A. Synthesis of AgCl nanoparticles in ionic liquid and their application in photodegradation of Orange II. J. Mater. Sci. 2015, 50, 3576–3585. [Google Scholar] [CrossRef]
  48. Kumar, B.; Smita, K.; Cumbal, L.; Debut, A.; Pathak, R.N. Ionic Liquid Based Silica Tuned Silver Nanoparticles: Novel Approach for Fabrication. Synth. React. Inorg. Met. Chem. 2016, 46, 1265–1271. [Google Scholar] [CrossRef]
  49. Zhou, Y.; Antonietti, M. Synthesis of very small TiO2 nanocrystals in a room-temperature ionic liquid and their self-assembly toward mesoporous spherical aggregates. J. Am. Chem. Soc. 2003, 125, 14960–14961. [Google Scholar] [CrossRef] [PubMed]
  50. Chen, T.; Xie, Z.; Jiang, W.; Jiang, W.; Zhang, W.; Liu, J. Synthesis of CeO2 nanosheets with a room temperature ionic liquid assisted method. J. Adv. Ceram. 2016, 5, 111–116. [Google Scholar] [CrossRef] [Green Version]
  51. Chen, J.; Xia, J.; Di, J.; Ji, M.; Li, H.; Xu, H.; Zhang, Q.; Lu, J. Reactable ionic liquid assisted synthesis of BiPO4 and the influences of solvent on structure, morphology and photocatalytic performance. Colloids Surf. A Phys. Chem. Eng. Asp. 2016, 488, 110–117. [Google Scholar] [CrossRef]
  52. Xia, J.; Zhao, J.; Chen, J.; Di, J.; Ji, M.; Xu, L.; Chen, Z.; Li, H. Facile fabrication of g-C3N4/BiPO 4 hybrid materials via a reactable ionic liquid for the photocatalytic degradation of antibiotic ciprofloxacin. J. Photochem. Photobiol. A Chem. 2017, 339, 59–66. [Google Scholar] [CrossRef]
  53. Hu, Q.; Ji, M.; Di, J.; Wang, B.; Xia, J.; Zhao, Y.; Li, H. Ionic liquid-induced double regulation of carbon quantum dots modified bismuth oxychloride/bismuth oxybromide nanosheets with enhanced visible-light photocatalytic activity. J. Colloid Interface Sci. 2018, 519, 263–272. [Google Scholar] [CrossRef]
  54. Yin, S.; Ding, Y.; Hu, Q.; Wu, T.; Li, M.; Chen, Y.; Shao, Y.; Di, J.; Wang, B.; Xia, J.; et al. CQDs modified PbBiO2Cl nanosheets with improved molecular oxygen activation ability for photodegradation of organic contaminants. J. Photochem. Photobiol. A Chem. 2019, 382, 111921. [Google Scholar]
  55. Nan, Q.; Huang, S.; Zhou, Y.; Zhao, S.; He, M.; Wang, Y.; Li, S.; Huang, T.; Pan, W. Ionic liquid-assisted synthesis of porous BiOBr microspheres with enhanced visible light photocatalytic performance. Appl. Organomet. Chem. 2018, 32, e4596. [Google Scholar] [CrossRef]
  56. Arce, A.; Soto, A.; Rodil, E.; Rodríguez-Cabo, B. Method for the Preparation of Nanoparticles in Ionic Liquids. Patent US20130221289A1, 29 August 2013. [Google Scholar]
  57. Kim, S.W.; Chung, H.; Kwon, J.-H.; Yoon, H.G.; Kim, W. Facile Synthesis of Silver Chloride Nanocubes and Their Derivatives. Bull. Korean Chem. Soc. 2010, 31, 2918–2922. [Google Scholar] [CrossRef] [Green Version]
  58. Song, J.; Roh, J.; Lee, I.; Jang, J. Low temperature aqueous phase synthesis of silver/silver chloride plasmonic nanoparticles as visible light photocatalysts. Dalton Trans. 2013, 42, 13897–13904. [Google Scholar] [CrossRef] [PubMed]
  59. Husein, M.M.; Rodil, E.; Vera, J.H. A novel method for the preparation of silver chloride nanoparticles starting from their solid powder using microemulsions. J. Colloid Interface Sci. 2005, 288, 457–467. [Google Scholar] [CrossRef]
  60. Petit, C.; Lixon, P.; Pileni, M.P. In situ synthesis of silver nanocluster in AOT reverse micelles. J. Phys. Chem. 1993, 97, 12974–12983. [Google Scholar] [CrossRef]
  61. Choi, M.; Shin, K.H.; Jang, J. Plasmonic photocatalyticsystem using silver chloride/silver nanostructures under visible light. J. Colloid Interface Sci. 2010, 341, 83–87. [Google Scholar] [CrossRef] [PubMed]
  62. Wang, W.; Lu, W.; Jiang, L. AgCl and Ag/AgCl hollow spheres based on self-assemblies of a multi-amine head surfactant. J. Colloid Interface Sci. 2009, 338, 270–275. [Google Scholar] [CrossRef] [PubMed]
  63. Zhang, H.; Wang, G.; Chen, D.; Lv, X.; Li, J. Tuning photoelectrochemical performances of Ag@TiO2 nanocomposites via reduction/oxidation of Ag. Chem. Mater. 2008, 20, 6543–6549. [Google Scholar] [CrossRef]
  64. Ma, J.; Guo, S.; Guo, X.; Ge, H. A mild synthetic route to Fe3O4@TiO2-Au composites: Preparation, characterization and photocatalytic activity. Appl. Surf. Sci. 2015, 353, 1117–1125. [Google Scholar] [CrossRef]
  65. Torres, J.D.; Faria, E.A.; Souza, J.R.; Prado, A.G. Preparation of photoactive chitosan–niobium (V) oxide composites for dye degradation. J. Photochem. Photobiol. A Chem. 2006, 182, 202–206. [Google Scholar] [CrossRef]
  66. Prado, A.G.; Bolzon, L.B.; Pedroso, C.P.; Moura, A.O.; Costa, L.L. Nb2O5 as efficient and recyclable photocatalyst for indigo carmine degradation. Appl. Catal. B Environ. 2008, 82, 219–224. [Google Scholar] [CrossRef]
  67. Bhatia, V.; Malekshoar, G.; Dhir, A.; Ray, A.K. Enhanced photocatalytic degradation of atenolol using graphene TiO2 composite. J. Photochem. Photobiol. A Chem. 2017, 332, 182–187. [Google Scholar] [CrossRef]
  68. Li, F.; Kang, Y.; Chen, M.; Liu, G.; Lv, W.; Yao, K.; Chen, P.; Huang, H. Photocatalytic degradation and removal mechanism of ibuprofen via monoclinic BiVO4 under simulated solar light. Chemosphere 2016, 150, 139–144. [Google Scholar] [CrossRef] [PubMed]
  69. Rodil, R.; Quintana, J.B.; Cela, R. Transformation of phenazone-type drugs during chlorination. Water Res. 2012, 46, 2457–2468. [Google Scholar] [CrossRef] [PubMed]
  70. Rodil, R.; Quintana, J.B.; Cela, R. Reaction of β-blockers and β-agonist pharmaceuticals with aqueous chlorine. Investigation of kinetics and by-products by liquid chromatography quadrupole time-of-flight mass spectrometry. Anal. Bioanal. Chem. 2012, 403, 2385–2395. [Google Scholar]
  71. Salgado, R.; Pereira, V.; Carvalho, G.; Soeiro, R.; Gaffney, V.; Almeida, C.; Cardoso, V.V.; Ferreira, E.; Benoliel, M.; Ternes, T.; et al. Photodegradation kinetics and transformation products of ketoprofen, diclofenac and atenolol in pure water and treated wastewater. J. Hazard. Mater. 2013, 244, 516–527. [Google Scholar] [CrossRef]
  72. Zeng, C.; Ji, Y.; Zhou, L.; Zhang, Y.; Yang, X. The role of dissolved organic matters in the aquatic photodegradation of atenolol. J. Hazard. Mater. 2012, 239, 340–347. [Google Scholar] [CrossRef]
  73. Yang, H.; Ao, Z.; Li, G.; Song, W.; Cooper, W.J.; Luo, H.; Guo, X. Photocatalytic degradation kinetics and mechanism of environmental pharmaceuticals in aqueous suspension of TiO2: A case of β-blockers. J. Hazard. Mater. 2010, 179, 834–839. [Google Scholar] [CrossRef] [PubMed]
Figure 1. Structure of atenolol (ATL).
Nanomaterials 11 00411 g001
Figure 2. Structure of [P6,6,6,14]Cl.
Nanomaterials 11 00411 g002
Figure 3. Glass photoreactor picture and scheme.
Nanomaterials 11 00411 g003
Figure 4. AgCl nanoparticles characterization: (a) TEM image, (b) SEM image.
Nanomaterials 11 00411 g004
Figure 5. TiO2@Fe3O4 nanocomposite: (a) TEM image, (b) SEM image.
Nanomaterials 11 00411 g005
Figure 6. AgCl@Fe3O4 nanocomposite: (a) TEM image, (b) SEM image.
Nanomaterials 11 00411 g006
Figure 7. Comparison of ATL degradation methods.
Nanomaterials 11 00411 g007
Figure 8. Variation of the UV–Vis absorption spectrum during the degradation of 10 ppm of ATL with 0.75 g·L−1 of AgCl.
Nanomaterials 11 00411 g008
Figure 9. Comparison of nanocatalysts (0.75 g·L−1) in the photocatalytic degradation of ATL (10 ppm) in aqueous solutions.
Nanomaterials 11 00411 g009
Figure 10. ATL degradation (%) using different concentrations of nanocatalyst. Initial ATL concentration: 10 ppm.
Nanomaterials 11 00411 g010
Figure 11. ATL degradation (%) using different concentrations of contaminant. AgCl nanoparticles concentration: 10 ppm.
Nanomaterials 11 00411 g011
Figure 12. ATL degradation (%) at different pH aqueous solutions. Initial ATL concentration: 10 ppm; AgCl nanoparticles concentration: 0.75 g·L−1.
Nanomaterials 11 00411 g012
Figure 13. ATL degradation (%) with and without oxidizing agents. Initial ATL concentration: 10 ppm; AgCl concentration: 10 ppm.
Nanomaterials 11 00411 g013
Figure 14. Degradation as a function of the number of uses of the nanocatalyst.
Nanomaterials 11 00411 g014
Figure 15. Kinetic studies of photocatalytic degradation of ATL: (a) Degradation with time (10 ppm ATL and 0.75 g·L−1 of AgCl). (b) Fit to a pseudo-first-order reaction. (c) Pseudo-first-order coefficients as a function of nanocatalyst load.
Nanomaterials 11 00411 g015
Figure 16. Proposed mechanism for the degradation of ATL.
Nanomaterials 11 00411 g016
Figure 17. Degradation performances (C/C0) as a function of time using different nanocatalysts (the lines are only to facilitate the visualization of the results).
Nanomaterials 11 00411 g017
Figure 18. Magnetic separation of nanocomposites.
Nanomaterials 11 00411 g018
Table 1. List of ATL degradation compounds and their identification parameters.
ProductExperimental m/zProposed FormulaMass Error (ppm)Score
Atenolol267.1705C14H22O3N2−0.3399.92
A-1283.1648C14H22O4N23.4892.39
A-2299.1595C14H22O5N22.0585.5
A-3281.1499C14H20O4N2−186.34
A-4152.0703C8H9O2N0.9785.13
A-5134.1178C6H15O2N−1.4687.74
A-6238.1439C13H19O3N0.9695.32
A-7254.1387C13H19O4N3.0289.79
Table 2. Degradation achieved by different nanocatalysts after 30 min under UV–Vis light (Initial concentration of ATL, 10 ppm; nanomaterials, 0.75 g/L).
CatalystSize (nm)Degradation—30 min (%)
AgCl<2095.7
TiO2<2196.1
Fe3O4<10023.4
Fe3O4@AgCl<10066.0
Fe3O4@TiO2<10043.7
Publisher’s Note: MDPI stays neutral with regard to jurisdictional claims in published maps and institutional affiliations.

