
Iron in Hydroxyapatite: Interstitial or Substitution Sites?

 , , , ,
Abstract
:
1. Introduction
2. Computation Methods
2.1. First-Principles Defect Energetics
2.2. X-ray Absorption near Edge Structure (XANES)
3. Results and Discussion
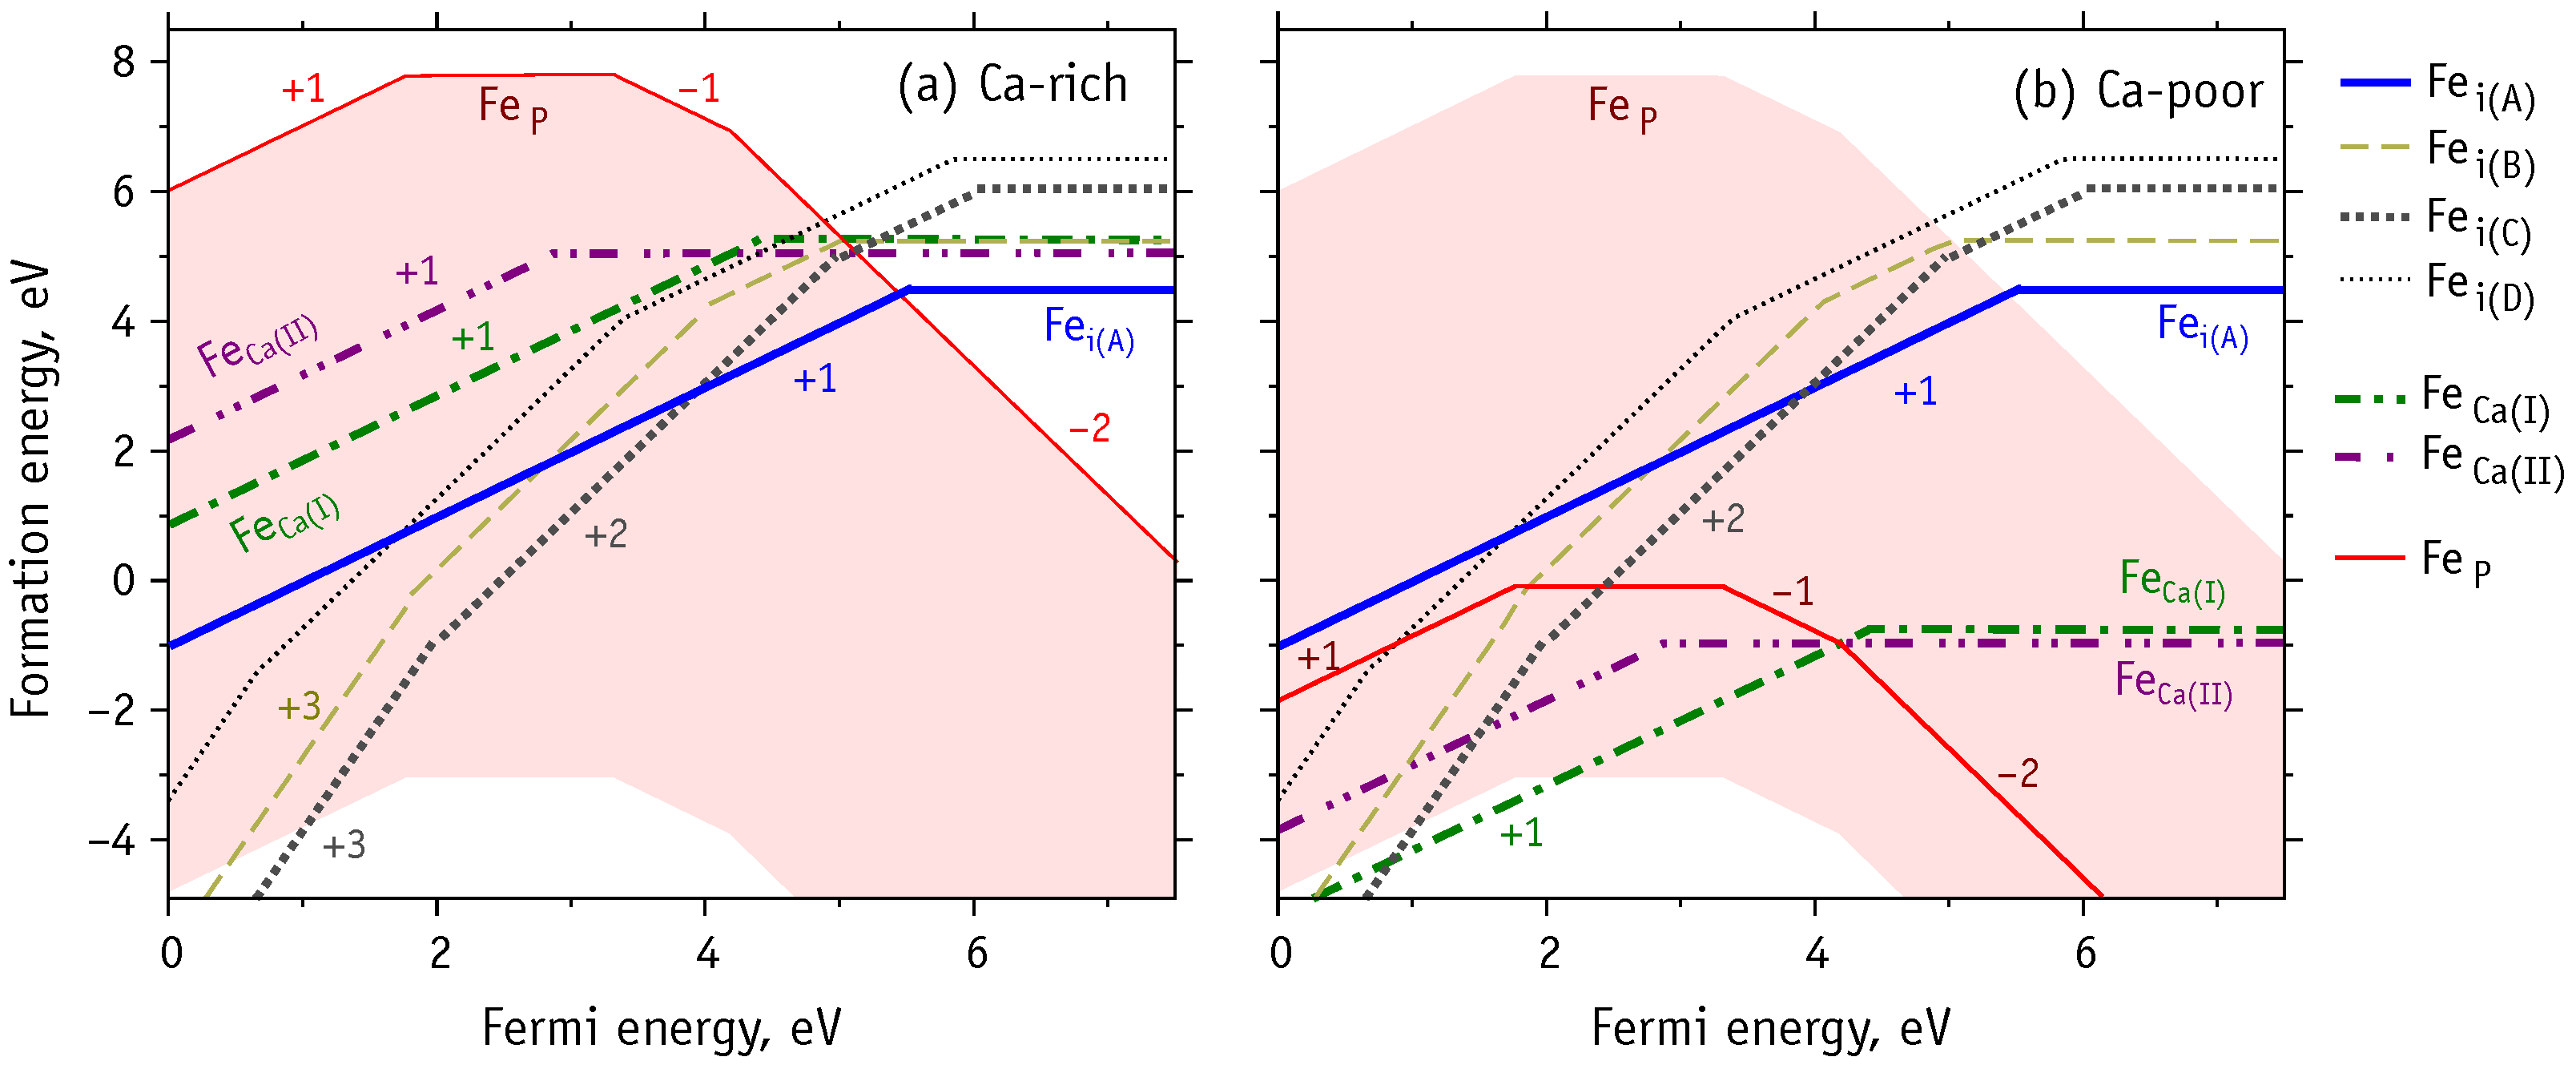
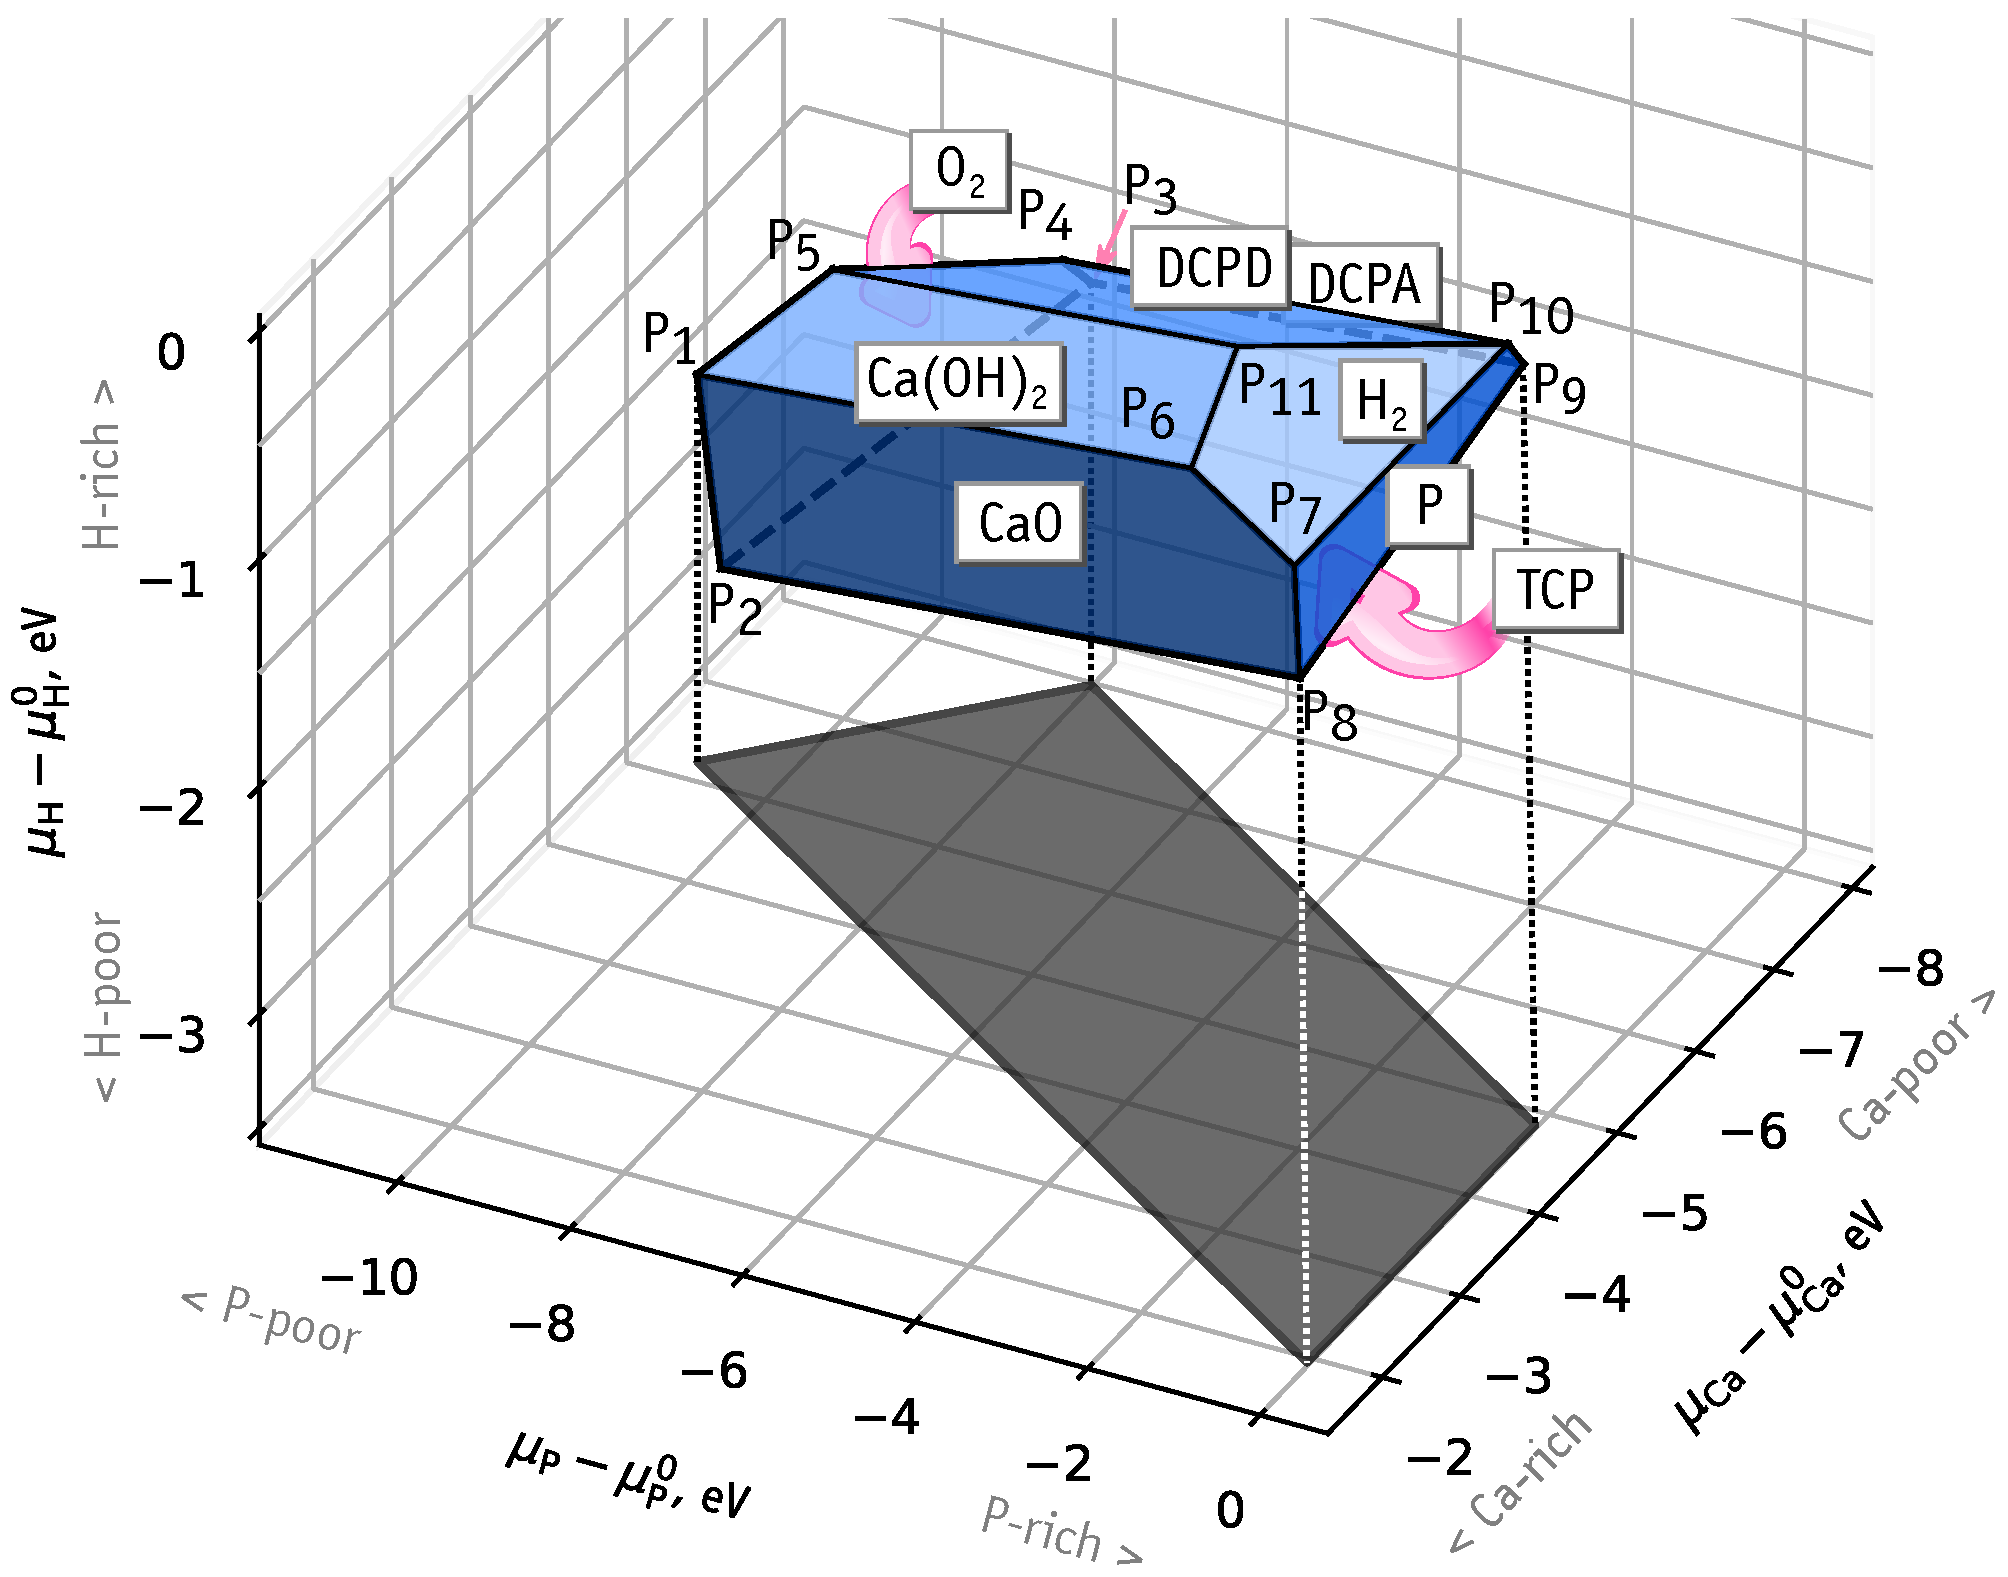
3.1. Chemical Stability Diagram
- Ca-rich and P-rich, points and , eV, ;
- Ca-poor, point , eV, eV;
- P-poor, points and , eV, eV.
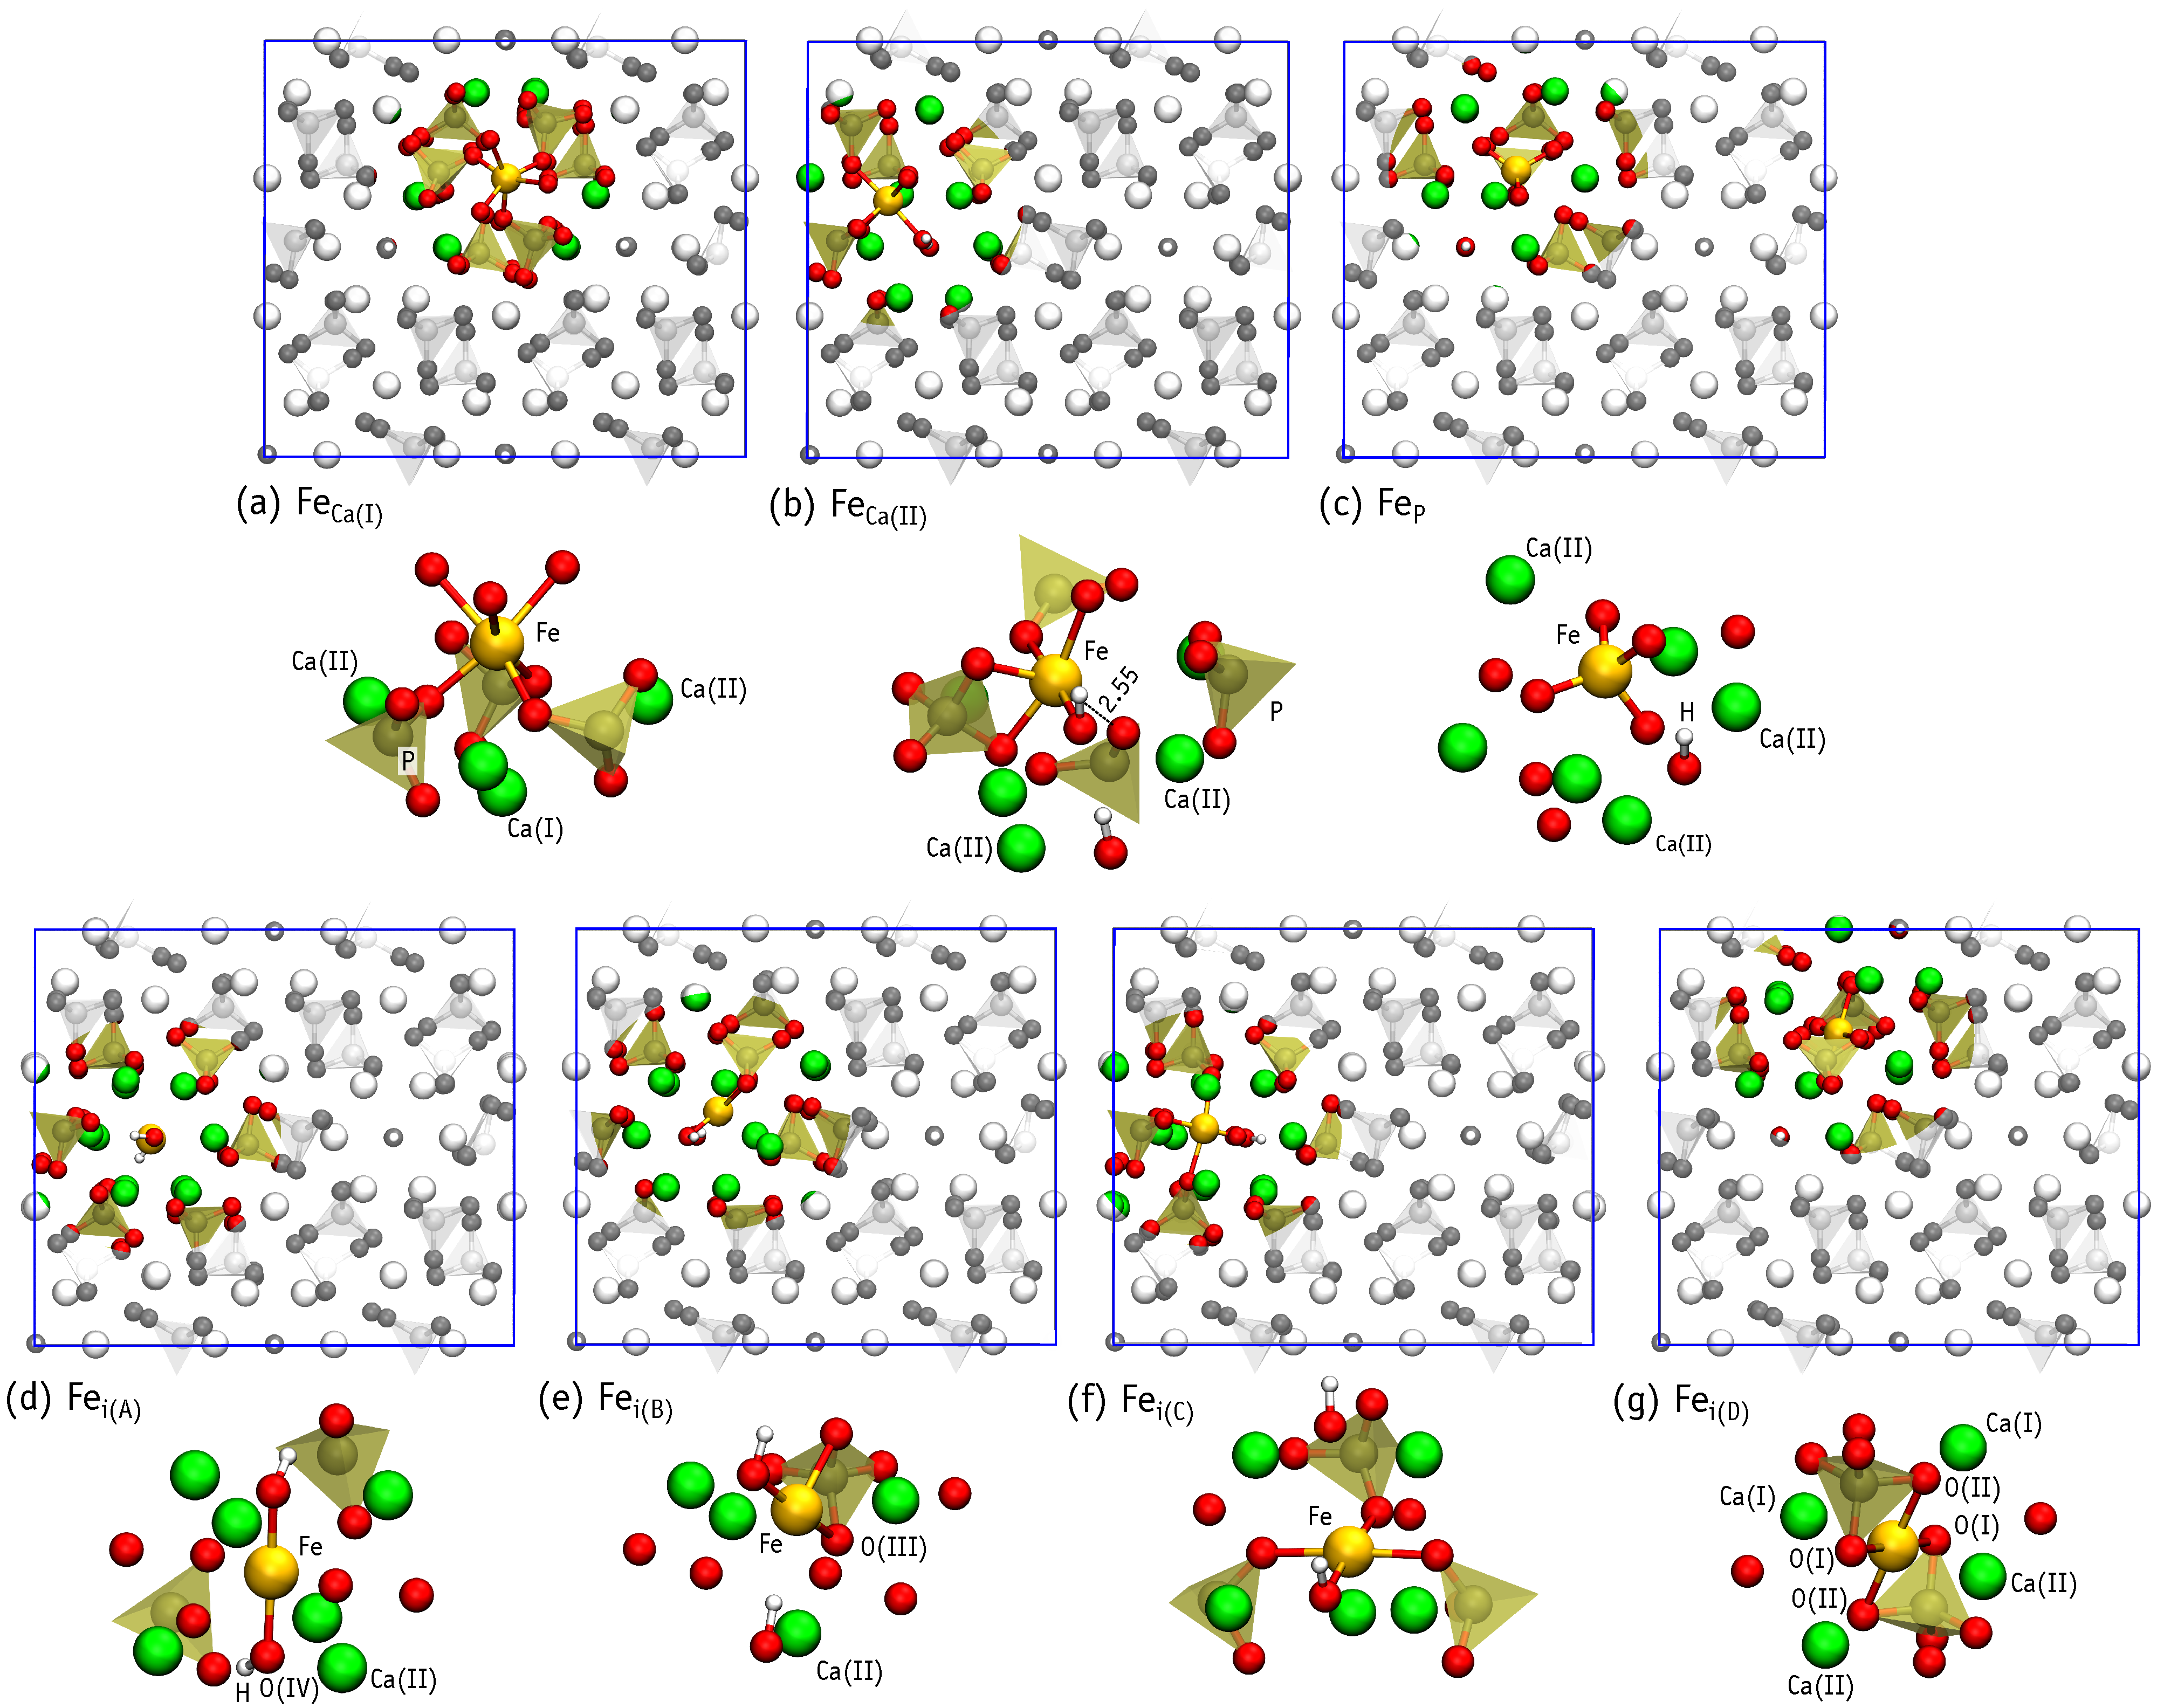
3.2. Notation for Defect Structures
3.3. Neutral Iron Defects
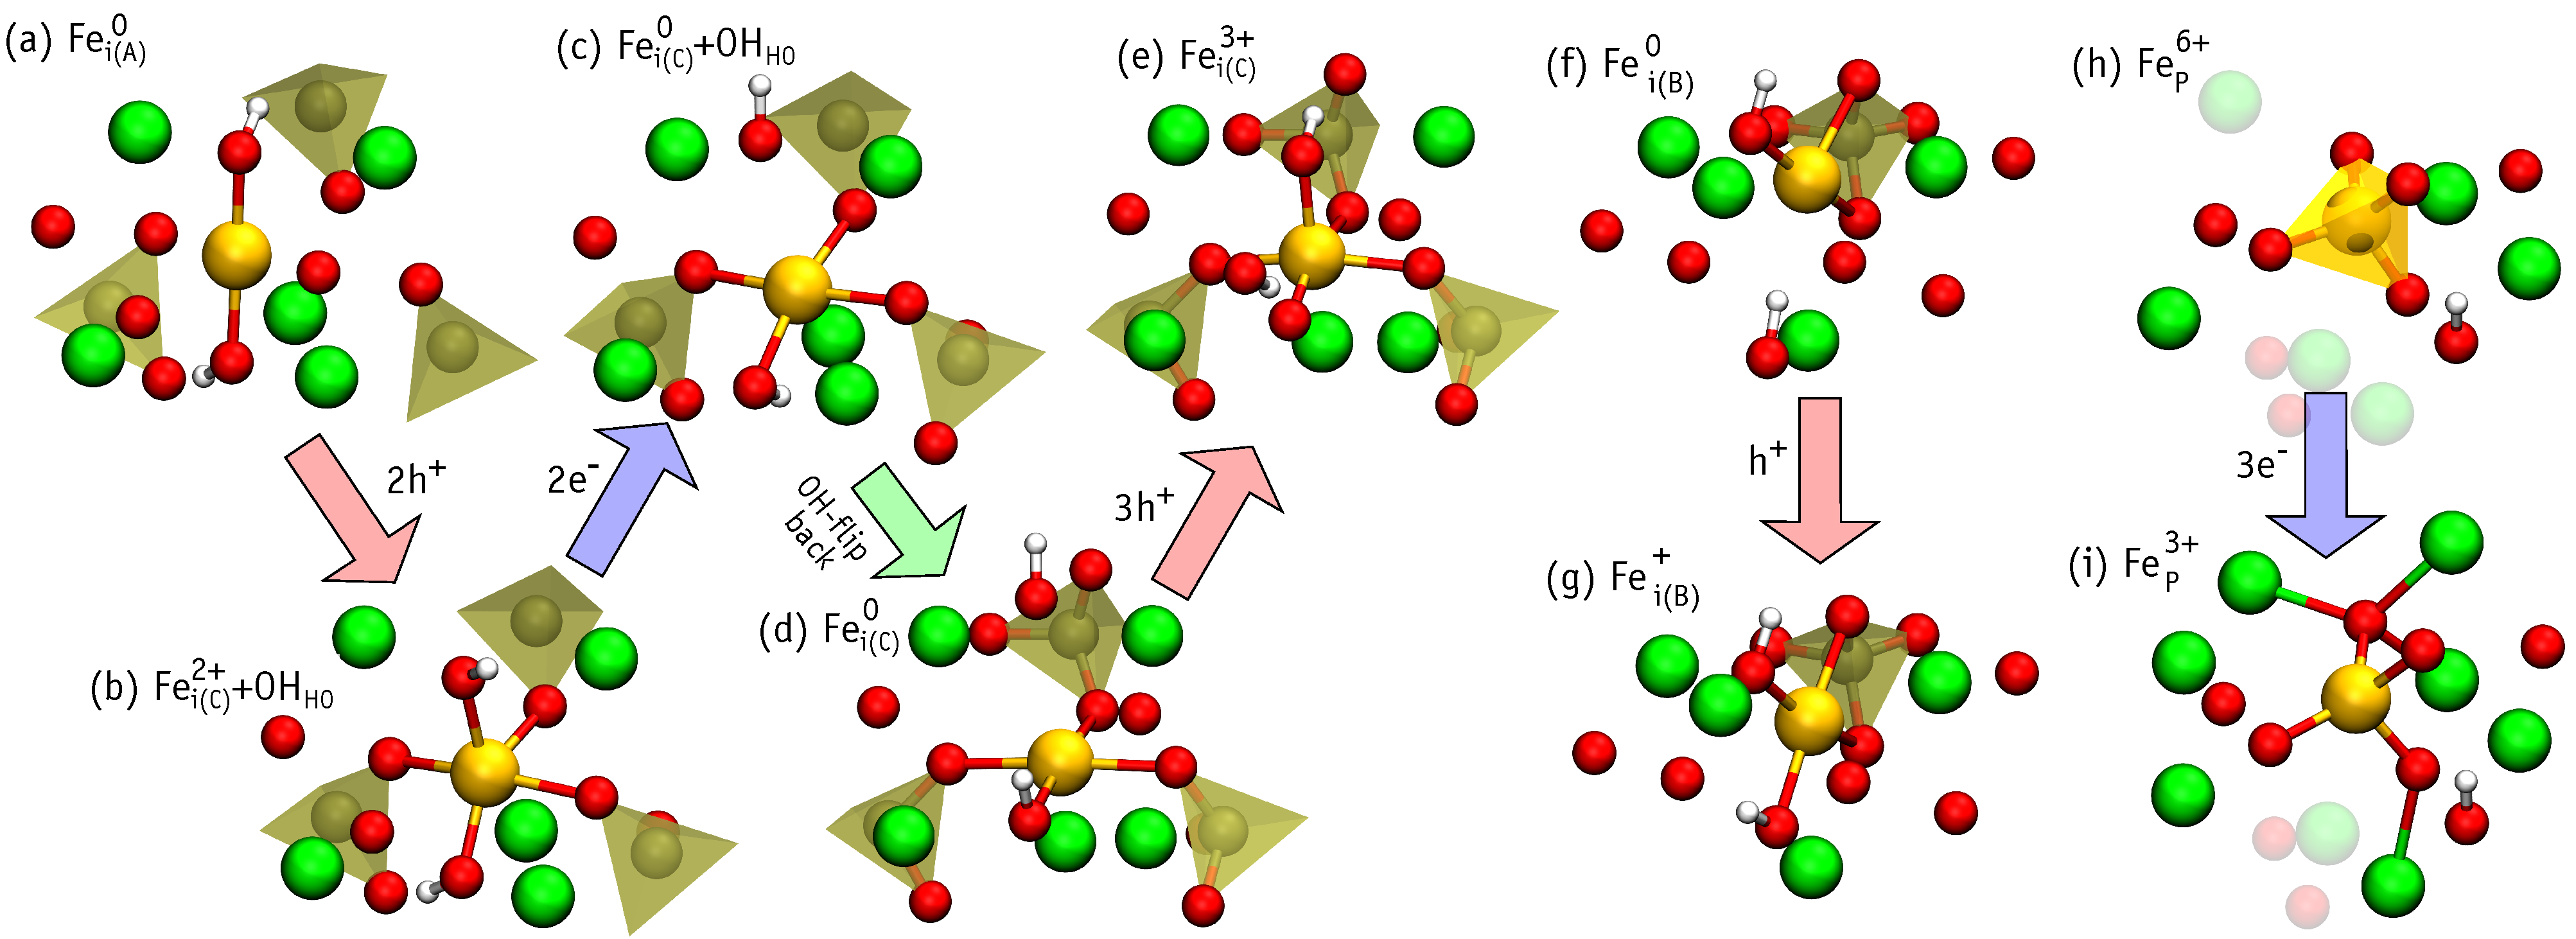
3.4. Charged Iron Defects
3.5. Fe K-XANES of Fe-HAp
4. Conclusions
- The chemical stability of HAp (Ca(POOH) is limited by a thermodynamic equilibrium with O, CaO, Ca(OH), H, P, DCPD (CaHPOHO), DCPA (CaHPO) and TCP (Ca(PO) phases. Formation of these compounds limit the range of values of Ca and P chemical potentials, and we could identify three extreme cases: Ca- and P-rich, Ca-poor, P-poor.
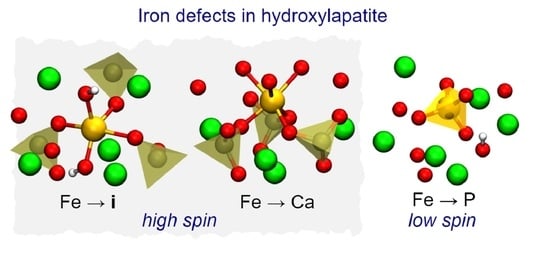
- Under P-poor conditions, phosphorous substitutions are the most favorable, resulting in the formation of low-spin Fe defect states. However, p-type HAp may contain high spin iron interstitials Fe.
- Under Ca-poor conditions, the high-spin calcium substitution, Fe, is the most favorable species. Fe defects have higher formation energy comparing to Fe and Fe.
- Under Ca- and P-rich conditions, interstitial iron atoms in the OH channel are the most prominent. Depending on the position of Fermi level the most favorable are Fe, Fe and Fe. When compared to Fe, the last structure involves the flipping of a nearby hydroxyl unit. The OH flipping does not introduce a significant change to the formation energy of Fe and Fe defects.
- High-spin iron defects are Fe and Fe. These are both expected in p-type HAp. Such configurations are expected to be most useful for materials targeting magnetic hyperthermia or magnetic resonance imaging applications.
- The comparison of Fe K-XANES spectra of theoretically predicted defect structures with experimental data [18] confirms the interstitial character of iron defects in samples sintered at high (1100 °C) temperature, but does not exclude the substitution defects for samples sintered at lower temperatures.
Supplementary Materials
Author Contributions
Funding
Institutional Review Board Statement
Informed Consent Statement
Data Availability Statement
Acknowledgments
Conflicts of Interest
Abbreviations
| HAp | Hydroxyapatite |
| Fe-HAp | Iron-doped HAp |
| DFT | Density functional theory |
| HSE | Heyd, Scuseria and Ernzerhof / Hybrid Screened Exchange |
| XANES | X-ray absorption near-edge structure |
References
- Epple, M.; Ganesan, K.; Heumann, R.; Klesing, J.; Kovtun, A.; Neumann, S.; Sokolova, V. Application of calcium phosphate nanoparticles in biomedicine. J. Mater. Chem. 2010, 20, 18–23. [Google Scholar] [CrossRef]
- Bystrov, V. Computational studies of the hydroxyapatite nanostructures, peculiarities and properties. Math. Biol. Bioinform. 2017, 12, 14–54. [Google Scholar] [CrossRef]
- Duminis, T.; Shahid, S.; Hill, R.G. Apatite Glass-Ceramics: A Review. Front. Mater. 2017, 3, 59. [Google Scholar] [CrossRef] [Green Version]
- Degli Esposti, L.; Carella, F.; Adamiano, A.; Tampieri, A.; Iafisco, M. Calcium phosphate-based nanosystems for advanced targeted nanomedicine. Drug Dev. Ind. Pharm. 2018, 44, 1223–1238. [Google Scholar] [CrossRef]
- Mayer, I.; Diab, H.; Felner, I. Ferric iron in synthetic carbonate apatites: A Mössbauer effect study. J. Inorg. Biochem. 1992, 45, 129–133. [Google Scholar] [CrossRef]
- Boda, S.K.; Basu, B.; Anupama, A.V.; Sahoo, B. Structural and Magnetic Phase Transformations of Hydroxyapatite-Magnetite Composites under Inert and Ambient Sintering Atmospheres. J. Phys. Chem. C 2015, 119, 6539–6555. [Google Scholar] [CrossRef]
- Mondal, S.; Manivasagan, P.; Bharathiraja, S.; Moorthy, M.S.; Kim, H.H.; Seo, H.; Lee, K.D.; Oh, J. Magnetic hydroxyapatite: A promising multifunctional platform for nanomedicine application. Int. J. Nanomed. 2017, 12, 8389–8410. [Google Scholar] [CrossRef] [Green Version]
- Laranjeira, M.S.; Moço, A.; Ferreira, J.; Coimbra, S.; Costa, E.; Santos-Silva, A.; Ferreira, P.J.; Monteiro, F.J. Different hydroxyapatite magnetic nanoparticles for medical imaging: Its effects on hemostatic, hemolytic activity and cellular cytotoxicity. Colloids Surf. B Biointerfaces 2016, 146, 363–374. [Google Scholar] [CrossRef]
- Tampieri, A.; D’Alessandro, T.; Sandri, M.; Sprio, S.; Landi, E.; Bertinetti, L.; Panseri, S.; Pepponi, G.; Goettlicher, J.; Bañobre-López, M.; et al. Intrinsic magnetism and hyperthermia in bioactive Fe-doped hydroxyapatite. Acta Biomater. 2012, 8, 843–851. [Google Scholar] [CrossRef]
- Piccirillo, C.; Rocha, C.; Tobaldi, D.M.; Pullar, R.C.; Labrincha, J.A.; Ferreira, M.O.; Castro, P.M.L.; Pintado, M.M.E. A hydroxyapatite–Fe2O3 based material of natural origin as an active sunscreen filter. J. Mater. Chem. B 2014, 2, 5999–6009. [Google Scholar] [CrossRef]
- Gambardella, A.; Bianchi, M.; Kaciulis, S.; Mezzi, A.; Brucale, M.; Cavallini, M.; Herrmannsdoerfer, T.; Chanda, G.; Uhlarz, M.; Cellini, A.; et al. Magnetic hydroxyapatite coatings as a new tool in medicine: A scanning probe investigation. Mater. Sci. Eng. C 2016, 62, 444–449. [Google Scholar] [CrossRef] [PubMed]
- Lin, K.; Chen, L.; Liu, P.; Zou, Z.; Zhang, M.; Shen, Y.; Qiao, Y.; Liu, X.; Chang, J. Hollow magnetic hydroxyapatite microspheres with hierarchically mesoporous microstructure for pH-responsive drug delivery. CrystEngComm 2013, 15, 2999. [Google Scholar] [CrossRef]
- Gu, L.; He, X.; Wu, Z. Mesoporous Fe3O4 /hydroxyapatite composite for targeted drug delivery. Mater. Res. Bull. 2014, 59, 65–68. [Google Scholar] [CrossRef]
- Ok, H.N. Mössbauer Studies of Natural Apatite. Phys. Rev. 1969, 185, 477–482. [Google Scholar] [CrossRef]
- Jiang, M.; Terra, J.; Rossi, A.M.; Morales, M.A.; Saitovitch, E.M.B.; Ellis, D.E. Fe2+/Fe3+substitution in hydroxyapatite: Theory and experiment. Phys. Rev. B 2002, 66, 224107. [Google Scholar] [CrossRef]
- Low, H.R.; Phonthammachai, N.; Maignan, A.; Stewart, G.A.; Bastow, T.J.; Ma, L.L.; White, T.J. The Crystal Chemistry of Ferric Oxyhydroxyapatite. Inorg. Chem. 2008, 47, 11774–11782. [Google Scholar] [CrossRef]
- Zilm, M.E.; Chen, L.; Sharma, V.; McDannald, A.; Jain, M.; Ramprasad, R.; Wei, M. Hydroxyapatite substituted by transition metals: Experiment and theory. Phys. Chem. Chem. Phys. 2016, 18, 16457–16465. [Google Scholar] [CrossRef]
- Gomes, S.; Kaur, A.; Grenèche, J.M.; Nedelec, J.M.; Renaudin, G. Atomic scale modeling of iron-doped biphasic calcium phosphate bioceramics. Acta Biomater. 2017, 50, 78–88. [Google Scholar] [CrossRef]
- Kato, S.; Ikeda, S.; Saito, K.; Ogasawara, M. Fe incorporation into hydroxyapatite channels by Fe loading and post-annealing. J. Solid State Chem. 2018, 265, 411–416. [Google Scholar] [CrossRef]
- Renaudin, G.; Gomes, S.; Nedelec, J.M. First-row transition metal doping in calcium phosphate bioceramics: A detailed crystallographic study. Materials 2017, 10, 92. [Google Scholar] [CrossRef] [Green Version]
- Avakyan, L.A.; Paramonova, E.V.; Coutinho, J.; Öberg, S.; Bystrov, V.S.; Bugaev, L.A. Optoelectronics and defect levels in hydroxyapatite by first-principles. J. Chem. Phys. 2018, 148, 154706. [Google Scholar] [CrossRef] [Green Version]
- Martin, R.; Reining, L.; Ceperley, D. Interacting Electrons; Cambridge University Press: Cambridge, UK, 2016. [Google Scholar]
- Calderin, L.; Stott, M.; Rubio, A. Electronic and crystallographic structure of apatites. Phys. Rev. B 2003, 67, 134106. [Google Scholar] [CrossRef] [Green Version]
- Rulis, P.; Ouyang, L.; Ching, W.Y. Electronic structure and bonding in calcium apatite crystals: Hydroxyapatite, fluorapatite, chlorapatite, and bromapatite. Phys. Rev. B 2004, 70, 155104. [Google Scholar] [CrossRef]
- Rulis, P.; Yao, H.; Ouyang, L.; Ching, W.Y. Electronic structure, bonding, charge distribution, and x-ray absorption spectra of the (001) surfaces of fluorapatite and hydroxyapatite from first principles. Phys. Rev. B 2007, 76, 245410. [Google Scholar] [CrossRef]
- Matsunaga, K.; Kuwabara, A. First-principles study of vacancy formation in hydroxyapatite. Phys. Rev. B 2007, 75, 014102. [Google Scholar] [CrossRef] [Green Version]
- Slepko, A.; Demkov, A.A. First-principles study of the biomineral hydroxyapatite. Phys. Rev. B 2011, 84, 134108. [Google Scholar] [CrossRef] [Green Version]
- Bystrov, V.S.; Coutinho, J.; Bystrova, A.V.; Dekhtyar, Y.D.; Pullar, R.C.; Poronin, A.; Palcevskis, E.; Dindune, A.; Alkan, B.; Durucan, C.; et al. Computational study of hydroxyapatite structures, properties and defects. J. Phys. D Appl. Phys. 2015, 48, 195302. [Google Scholar] [CrossRef]
- Kay, M.; Young, R.; Posner, A. Crystal Structure of Hydroxyapatite. Nature 1964, 204, 1050–1052. [Google Scholar] [CrossRef] [PubMed]
- Hughes, J.M.; Rakovan, J. The Crystal Structure of Apatite, Ca5(PO4)3(F,OH,Cl). Rev. Mineral. Geochem. 2002, 48, 1–12. [Google Scholar] [CrossRef]
- Elliott, J.; Mackie, P.; Young, R. Monoclinic hydroxyapatite. Science 1973, 180, 1055–1057. [Google Scholar] [CrossRef] [PubMed]
- Ikoma, T.; Yamazaki, A.; Nakamura, S.; Akao, M. Preparation and dielectric property of sintered monoclinic hydroxyapatite. J. Mater. Sci. Lett. 1999, 18, 1225–1228. [Google Scholar] [CrossRef]
- Giannozzi, P.; Baroni, S.; Bonini, N.; Calandra, M.; Car, R.; Cavazzoni, C.; Ceresoli, D.; Chiarotti, G.L.; Cococcioni, M.; Dabo, I.; et al. QUANTUM ESPRESSO: A modular and open-source software project for quantum simulations of materials. J. Phys. Condens. Matter 2009, 21, 395502. [Google Scholar] [CrossRef] [PubMed]
- Giannozzi, P.; Andreussi, O.; Brumme, T.; Bunau, O.; Nardelli, M.B.; Calandra, M.; Car, R.; Cavazzoni, C.; Ceresoli, D.; Cococcioni, M.; et al. Advanced capabilities for materials modelling with Quantum ESPRESSO. J. Phys. Condens. Matter 2017, 29, 465901. [Google Scholar] [CrossRef] [PubMed] [Green Version]
- Heyd, J.; Scuseria, G.E.; Ernzerhof, M. Hybrid functionals based on a screened Coulomb potential. J. Chem. Phys. 2003, 118, 8207–8215. [Google Scholar] [CrossRef] [Green Version]
- Krukau, A.V.; Vydrov, O.A.; Izmaylov, A.F.; Scuseria, G.E. Influence of the exchange screening parameter on the performance of screened hybrid functionals. J. Chem. Phys. 2006, 125, 224106. [Google Scholar] [CrossRef]
- Perdew, J.P.; Burke, K.; Ernzerhof, M. Generalized Gradient Approximation Made Simple. Phys. Rev. Lett. 1996, 77, 3865–3868. [Google Scholar] [CrossRef] [Green Version]
- Hamann, D.R. Optimized norm-conserving Vanderbilt pseudopotentials. Phys. Rev. B 2013, 88, 085117. [Google Scholar] [CrossRef] [Green Version]
- Schlipf, M.; Gygi, F. Optimization algorithm for the generation of ONCV pseudopotentials. Comput. Phys. Commun. 2015, 196, 36–44. [Google Scholar] [CrossRef] [Green Version]
- Coutinho, J.; Torres, V.J.; Demmouche, K.; Öberg, S. Theory of the carbon vacancy in 4 H-SiC: Crystal field and pseudo-Jahn-Teller effects. Phys. Rev. B 2017, 96, 174105. [Google Scholar] [CrossRef] [Green Version]
- Bystrov, V.S.; Avakyan, L.A.; Paramonova, E.V.; Coutinho, J. Sub-Band Gap Absorption Mechanisms Involving Oxygen Vacancies in Hydroxyapatite. J. Phys. Chem. C 2019, 123, 4856–4865. [Google Scholar] [CrossRef] [Green Version]
- Gouveia, J.D.; Coutinho, J. Can we rely on hybrid-DFT energies of solid-state problems with local-DFT geometries? Electron. Struct. 2019, 1, 015008. [Google Scholar] [CrossRef] [Green Version]
- Qian, G.X.; Martin, R.M.; Chadi, D.J. First-principles study of the atomic reconstructions and energies of Ga- and As-stabilized GaAs(100) surfaces. Phys. Rev. B 1988, 38, 7649–7663. [Google Scholar] [CrossRef]
- Jang, Y.R.; Yu, B.D. Structural, Magnetic, and Electronic Properties of Fe: A Screened Hybrid Functional Study. J. Magn. 2011, 16, 201–205. [Google Scholar] [CrossRef]
- Meng, Y.; Liu, X.W.; Huo, C.F.; Guo, W.P.; Cao, D.B.; Peng, Q.; Dearden, A.; Gonze, X.; Yang, Y.; Wang, J.; et al. When Density Functional Approximations Meet Iron Oxides. J. Chem. Theory Comput. 2016, 12, 5132–5144. [Google Scholar] [CrossRef] [PubMed]
- Ingebrigtsen, M.E.; Varley, J.B.; Kuznetsov, A.Y.; Svensson, B.G.; Alfieri, G.; Mihaila, A.; Badstübner, U.; Vines, L. Iron and intrinsic deep level states in Ga2O3. Appl. Phys. Lett. 2018, 112, 042104. [Google Scholar] [CrossRef] [Green Version]
- Makov, G.; Payne, M.C. Periodic boundary conditions in ab initio calculations. Phys. Rev. B 1995, 51, 4014–4022. [Google Scholar] [CrossRef] [PubMed] [Green Version]
- Lany, S.; Zunger, A. Assessment of correction methods for the band-gap problem and for finite-size effects in supercell defect calculations: Case studies for ZnO and GaAs. Phys. Rev. B 2008, 78, 235104. [Google Scholar] [CrossRef] [Green Version]
- Sit, P.H.L.; Car, R.; Cohen, M.H.; Selloni, A. Simple, Unambiguous Theoretical Approach to Oxidation State Determination via First-Principles Calculations. Inorg. Chem. 2011, 50, 10259–10267. [Google Scholar] [CrossRef]
- Bunau, O.; Joly, Y. Self-consistent Aspects of X-ray Absorption Calculations. J. Phys. Condens. Matter 2009, 21, 345501. [Google Scholar] [CrossRef]
- Lamberti, C.; van Bokhoven, J.A. X-ray Absorption and X-ray Emission Spectroscopy: Theory and Applications. In X-ray Absorption and X-ray Emission Spectroscopy; Chapter X-ray Absorption and Emission Spectroscopy for Catalysis; van Bokhoven, J.A., Lamberti, C., Eds.; John Wiley & Sons, Ltd.: Hoboken, NJ, USA, 2016; pp. 351–383. [Google Scholar] [CrossRef]
- Soldatov, M.A.; Göttlicher, J.; Kubrin, S.P.; Guda, A.A.; Lastovina, T.A.; Bugaev, A.L.; Rusalev, Y.V.; Soldatov, A.V.; Lamberti, C. Insight from X-ray Absorption Spectroscopy to Octahedral/Tetrahedral Site Distribution in Sm-Doped Iron Oxide Magnetic Nanoparticles. J. Phys. Chem. C 2018, 122, 8543–8552. [Google Scholar] [CrossRef]
- Lide, D.R. (Ed.) CRC Handbook of Chemistry and Physics, 88th ed.; CRC Press: Boca Raton, FL, USA, 2005; p. 2661. [Google Scholar]
- Gražulis, S.; Daškevič, A.; Merkys, A.; Chateigner, D.; Lutterotti, L.; Quiros, M.; Serebryanaya, N.R.; Moeck, P.; Downs, R.T.; Le Bail, A. Crystallography Open Database (COD): An open-access collection of crystal structures and platform for world-wide collaboration. Nucleic Acids Res. 2012, 40, D420–D427. [Google Scholar] [CrossRef] [PubMed]
- Fukui, H.; Ohtaka, O.; Fujisawa, T.; Kunisada, T.; Suzuki, T.; Kikegawa, T. Thermo-elastic property of Ca(OH)2portlandite. High Press. Res. 2003, 23, 55–61. [Google Scholar] [CrossRef]
- Brazhkin, V.V.; Gromnitskaya, E.L.; Danilov, I.V.; Katayama, Y.; Lyapin, A.G.; Popova, S.V. High pressure behavior of P2O5crystalline modifications: Compressibility, elastic properties and phase transitions. Mater. Res. Express 2015, 2, 025201. [Google Scholar] [CrossRef]
- Zhai, S.; Liu, X.; Shieh, S.R.; Zhang, L.; Ito, E. Equation of state of -tricalcium phosphate, -Ca3(PO4)2, to lower mantle pressures. Am. Mineral. 2009, 94, 1388–1391. [Google Scholar] [CrossRef]
- Hughes, J.; Fransolet, A.; Schreyer, W. The atomic arrangement of iron-bearing apatite. In Neues Jahrbuch Fur Mineralogie-Monatshefte; Schweizerbart Science Publishers: Stuttgart, Germany, 1993; pp. 504–510. [Google Scholar]
- Carrera, K.; Huerta, V.; Orozco, V.; Matutes, J.; Fernández, P.; Graeve, O.; Herrera, M. Formation of vacancy point-defects in hydroxyapatite nanobelts by selective incorporation of Fe3+ ions in Ca(II) sites. A CL and XPS study. Mater. Sci. Eng. B 2021, 271, 115308. [Google Scholar] [CrossRef]
- Bauminger, E.; Ofer, S.; Gedalia, I.; Horowitz, G.; Mayer, I. Iron uptake by teeth and bones: A mossbauer effect study. Calcif. Tissue Int. 1985, 37, 386–389. [Google Scholar] [CrossRef] [PubMed]
- Tsuneda, T.; Song, J.W.; Suzuki, S.; Hirao, K. On Koopmans’ theorem in density functional theory. J. Chem. Phys. 2010, 133, 174101. [Google Scholar] [CrossRef]
- Stoch, P.; Szczerba, W.; Bodnar, W.; Ciecinska, M.; Stoch, A.; Burkel, E. Structural properties of iron-phosphate glasses: Spectroscopic studies and ab initio simulations. Phys. Chem. Chem. Phys. 2014, 16, 19917–19927. [Google Scholar] [CrossRef] [PubMed] [Green Version]


| Compound | HSE | Ref. | |||||
|---|---|---|---|---|---|---|---|
| HAp | 532.1 | 87 | 528.7 | 89 | |||
| CaO | 110.4 | 114 | 110.5 | 116 | |||
| Ca(OH) | 56.46 | 31 | 54.78 | 33 | |||
| PO | 330.7 | 64 | 322.0 | 12–40 | |||
| HPO | – | – | – | – | |||
| HO | – | – | – | – | |||
| TCP | 445.5 | 105 | 445.5 | 100 | |||
| TTCP | 796.0 | 79 | 797.3 | – | |||
| DCPD | 490.3 | 51 | 497.7 | – | |||
| DCPA | 311.9 | 75 | – | 309.3 | – |
| Notation | ||
|---|---|---|
| q | Kröger-Vink | This Work |
| 0 | ||
| 0 | ||
| 0 | ||
| Structure | , Å | , C | Methods | Ref. | ||
|---|---|---|---|---|---|---|
| Fe | 1000 | MB | [14] | |||
| Fe | ≥0.15 | XRD | [58] | |||
| Fe | 2.2–2.3 | 6 | 0.5 | 90 | MD, EPR, MB | [15] |
| Fe | 2.4–2.5 | 6 | ≤0.5 | 600–1000 | EPR, MB | [16] |
| Fe | 0.2 | 40 | XRD, XAS | [9] | ||
| Fe/Fe | 5 or 6/6 | 0.5–2.0 | 950 | XRD, XPS, MB | [6] | |
| Fe/Fe | 2.0–2.2/2.2–2.3 | 4 / 6 | 0.012 | 25 | XRD, DFT | [17] |
| Fe | 0.3–6.0 | 100 | XPS, XRD | [59] | ||
| FeOOH | biogenic/120 | MB | [5,60] | |||
| Fe | 2 | 0.15–0.75 | <1000 | XRD | [18] | |
| Fe | 1.80–1.85 | 3 | 0.15–0.75 | 1100 | XRD | [18] |
| Fe | 1.84–1.94 | 0.15 | 1100 | EXAFS | [18] | |
| Fe | 1.8–2.4 | 4 | 0.1–0.9 | 60 | XRD, IR | [19] |
| Defect Structure | |||||||
|---|---|---|---|---|---|---|---|
| Ca- & P-Rich | Ca-Poor | P-Poor | |||||
| 5.25 | −0.76 | 1.02 | 6 | 2.04–2.24 | 0.0 | ||
| 5.05 | −0.96 | 0.82 | 5 | 1.99–2.21 | 0.0 | ||
| 6.05 | −0.09 | −3.03 | 4 | 1.69–1.70 | 1.0 | ||
| 4.48 | 4.48 | 4.48 | 2 | 1.88–1.89 | 2.0 | ||
| 5.24 | 5.24 | 5.24 | 3 | 1.86–2.22 | 2.0 | ||
| 6.05 | 6.05 | 6.05 | 4 | 1.94–2.18 | 2.0 | ||
| 6.50 | 6.50 | 6.50 | 4 | 2.02–2.06 | 2.0 |
| Defect Structure | q | ||||
|---|---|---|---|---|---|
| 6 | 1.96–2.12 | 5.0 | |||
| 5 | 1.90–2.01 | 1.0 | |||
| 4 | 1.65–1.67 | 0.0 | |||
| 4 | 1.74–1.75 | 0.0 | |||
| 4 | 1.81–1.84 | 1.0 | |||
| 2 | 1.84–1.85 | 3.0 | |||
| 4 | 1.89–2.02 | 3.0 | |||
| 4 | 1.82–1.95 | 2.0 | |||
| 4 | 1.78–1.88 | 3.0 | |||
| 4 | 1.89–2.08 | 3.0 | |||
| 5 | 1.84–2.16 | 4.0 | |||
| 5 | 1.72–2.12 | 5.0 | |||
| 4 | 1.98–1.99 | 3.0 | |||
| 4 | 1.90–1.93 | 2.0 | |||
| 6 | 1.95–2.06 | 1.0 |
Publisher’s Note: MDPI stays neutral with regard to jurisdictional claims in published maps and institutional affiliations. |
© 2021 by the authors. Licensee MDPI, Basel, Switzerland. This article is an open access article distributed under the terms and conditions of the Creative Commons Attribution (CC BY) license (https://creativecommons.org/licenses/by/4.0/).
Share and Cite
Avakyan, L.; Paramonova, E.; Bystrov, V.; Coutinho, J.; Gomes, S.; Renaudin, G. Iron in Hydroxyapatite: Interstitial or Substitution Sites? Nanomaterials 2021, 11, 2978. https://doi.org/10.3390/nano11112978
Avakyan L, Paramonova E, Bystrov V, Coutinho J, Gomes S, Renaudin G. Iron in Hydroxyapatite: Interstitial or Substitution Sites? Nanomaterials. 2021; 11(11):2978. https://doi.org/10.3390/nano11112978
Chicago/Turabian StyleAvakyan, Leon, Ekaterina Paramonova, Vladimir Bystrov, José Coutinho, Sandrine Gomes, and Guillaume Renaudin. 2021. "Iron in Hydroxyapatite: Interstitial or Substitution Sites?" Nanomaterials 11, no. 11: 2978. https://doi.org/10.3390/nano11112978
APA StyleAvakyan, L., Paramonova, E., Bystrov, V., Coutinho, J., Gomes, S., & Renaudin, G. (2021). Iron in Hydroxyapatite: Interstitial or Substitution Sites? Nanomaterials, 11(11), 2978. https://doi.org/10.3390/nano11112978