Article

SDS-Stabilized CuInSe2/ZnS Multinanocomposites Prepared by Mechanochemical Synthesis for Advanced Biomedical Application

1
Department of Mechanochemistry, Institute of Geotechnics, Slovak Academy of Sciences, Watsonova 45, 04001 Košice, Slovakia
2
Faculty of Science and Technology, Jan Dlugosz University, Al. Armii Krajowej, 13/15, 42201 Czestochowa, Poland
3
Department of Optical Glass and Ceramics, Vlokh Institute of Physical Optics, 23, Dragomanov Str., 79005 Lviv, Ukraine
4
Biomedical Research Center, Cancer Research Institute, Slovak Academy of Sciences, Dúbravská cesta 9, 84505 Bratislava, Slovakia
5
Centre of Advanced Material Application, Slovak Academy of Sciences, Dúbravská cesta 5807/9, 84511 Bratislava, Slovakia
6
Advanced Materials Department, Jozef Štefan Institute, Jamova 39, 1000 Ljubljana, Slovenia
7
Institute of Electronics and Photonics, Slovak University of Technology, 81219 Bratislava, Slovakia
8
Department of Inorganic Chemistry, Ivan Franko National University of Lviv, 107, Tarnavskogo Str., 79017 Lviv, Ukraine
*
Author to whom correspondence should be addressed.
Nanomaterials 2021, 11(1), 69; https://doi.org/10.3390/nano11010069
Submission received: 6 November 2020 / Revised: 17 December 2020 / Accepted: 24 December 2020 / Published: 30 December 2020
(This article belongs to the Special Issue Mechanochemistry and Nanotechnology)

Abstract

:
The CuInSe2/ZnS multiparticulate nanocomposites were first synthesized employing two-step mechanochemical synthesis. In the first step, tetragonal CuInSe2 crystals prepared from copper, indium and selenium precursors were co-milled with zinc acetate dihydrate and sodium sulfide nonahydrate as precursors for ZnS in different molar ratios by mechanochemical route in a planetary mill. In the second step, the prepared CuInSe2/ZnS nanocrystals were further milled in a circulation mill in sodium dodecyl sulphate (SDS) solution (0.5 wt.%) to stabilize the synthesized nanoparticles. The sodium dodecyl sulphate capped CuInSe2/ZnS 5:0-SDS nanosuspension was shown to be stable for 20 weeks, whereas the CuInSe2/ZnS 4:1-SDS one was stable for about 11 weeks. After sodium dodecyl sulphate capping, unimodal particle size distribution was obtained with particle size medians approaching, respectively, 123 nm and 188 nm for CuInSe2/ZnS 5:0-SDS and CuInSe2/ZnS 4:1-SDS nanocomposites. Successful stabilization of the prepared nanosuspensions due to sodium dodecyl sulphate covering the surface of the nanocomposite particles was confirmed by zeta potential measurements. The prepared CuInSe2/ZnS 5:0-SDS and CuInSe2/ZnS 4:1-SDS nanosuspensions possessed anti-myeloma sensitizing potential assessed by significantly reduced viability of multiple myeloma cell lines, with efficient fluorescence inside viable cells and higher cytotoxic efficacy in CuInSe2/ZnS 4:1-SDS nanosuspension.

1. Introduction

Multiparticulate nanocomposites (multinanocomposites (MNC)) represents a group of phase-distinguished nanostructured substances possessing wide application in biomedicine as advanced media utilizing unique exploitation properties inaccessible for their unicomponent precursors [1]. Nowadays, rich family of such materials can be well exemplified by MNC containing ZnS nanoparticles complemented with other chalcogenide compounds [2,3,4,5], like semiconductor CuInSe2 [3], ensuring unified functionality of a whole nanosystem with improved optical properties due to elimination of surface non-radiative recombination defects. So biparticulate CuInSe2/ZnS MNC with equal ratio between components exactly reaching 1:1 are perspective highly-luminescent “green” materials for bioimaging free of hazardous additives [6,7,8,9]. Recently, several techniques have been successfully developed to synthesize inorganic-coated CuInSe2 nanomaterials, such as electron beam evaporation [10], large-scale synthesis using gelatin and thioglycolic acid as dual stabilizers in electric pressure cooker [11] and organic phase high temperature route combined with alloying [12]. Stable equi-component CuInSe2/ZnS colloidal nanocrystals have been prepared employing different nanostructurization technologies as described in more details elsewhere [7,8,13,14].
From technologically-guided and bio-applicability tuning challenges, the most promising approach seems to have highly-stabilized biparticulate CuInSe2/ZnS MNC with variable ratio between components, like it is achieved in other ZnS-based prototypes [15,16,17]. To improve bioimaging ability and cytotoxicity of these MNC, stable nanosuspensions should be prepared avoiding parasitic inter-particulate aggregation and agglomeration processes. Sodium dodecyl sulphate (SDS) is known to be one of the best biocompatible moderately toxic anionic surfactants for this purpose, widely used in pharmaceutical and industrial (building, chemical, detergency and textile) applications [18,19]. Its potential toxicity is also a subject to research [20,21]. At the final stage, the top-down approach employing high-energy mechanochemical synthesis in wet stirred media can be used to produce nanosuspensions, as it was noted in a number of recent publications [15,17,22,23,24,25,26].
To the best of our knowledge, the component-variable biparticulate CuInSe2/ZnS MNC have not been prepared yet. In this work, we reported the first successful attempt on this objective concerning preparation of CuInSe2/ZnS nanocrystals with different intercomponent ratio, supplemented by second-step wet stirred media milling route using a circulation mill stabilizing these CuInSe2/ZnS nanocrystals in 0.5% SDS solution (the SDS-stabilized CuInSe2/ZnS nanosuspensions).

2. Materials and Methods

2.1. Mechanochemical Synthesis of CuInSe2/ZnS Nanocrystals and SDS Capped CuInSe2/ZnS Nanosuspensions

The component-variable CuInSe2/ZnS MNC in a molar CuInSe2:ZnS ratio approaching 5:0, 4:1 and 1:4 (chosen at the basis of previous research for ZnS-based nanocrystals [15,17]) were prepared by co-milling of CuInSe2 (previously synthesized by milling from elemental ingredients purchased in Merck, Darmstadt, Germany, the 99.7% Cu, 99.99% In and 99.9999% Se, according the procedure described in [27]) and precursors for ZnS preparation (zinc acetate dihydrate, 99%, Ites, Vranov nad Topľou, Slovakia, and sodium sulfide nonahydrate, 98%, Acros Organics, NJ, USA), as it was described in more details elsewhere [28,29]. The respective preparation route for CuInSe2/ZnS nanocrystals is highlighted in Figure 1 (left), it obeyed the following reactions:
Cu + In + 2Se → CuInSe2
CuInSe2 + (CH3COO)2Zn∙2H2O + Na2S∙9H2O → CuInSe2/ZnS + 2CH3COONa + 11H2O
Co-milling was performed in a planetary ball mill Pulverisette 6 (Fritsch, Idar-Oberstein, Germany) in an argon atmosphere for 30 min. The 250 mL tungsten carbide milling chamber with 50 tungsten carbide balls, having 10 mm in diameter was used. The rotational speed of the planet carrier n was 500 rpm. After the synthesis, the sodium acetate as side product of Equation (2), was removed by washing with distilled water. After vacuum drying (70 °C, 180 min), a solid phase of CuInSe2/ZnS nanocrystals was obtained.
In order to obtain colloidal form of nanocrystals suitable for testing of their biological activity, the wet stirred media milling route was applied. The previously prepared CuInSe2 and CuInSe2/ZnS nanocrystals were subjected to wet milling in the 0.5% SDS solution under the following conditions: 4 g of CuInSe2 or CuInSe2/ZnS in a total, 300 mL of SDS solution (0.5 wt.%) and 45 min milling at n = 3500 rpm. After milling, the samples were centrifuged at n = 3000 rpm. The scheme of preparation of CuInSe2 and CuInSe2/ZnS nanocrystals capped by SDS is illustrated on Figure 1 (right).

2.2. Characterization Methods

The phase-microstructure analysis of the prepared MNC were performed using X-ray powder diffraction (XRPD) method collected the data in a transmission mode on STOE STADI P diffractometer (STOE Automated DIffractometer for Powder, STOE & Cie GmbH, Darmstadt, Germany) with the following setup: CuKα1-radiation, curved Ge (111) monochromator on primary beam, linear position-sensitive detector and 2θ/ω-scan. Preliminary data processing was performed employing STOE WinXPOW [30] and Powder Cell [31,32] program packages, using crystallographic data taken from the known databases [33]. The crystal structures of the phases were refined by the Rietveld method with FullProf.2k program (version 5.60) [34,35]. Quantitative phase analysis according to [35] and microstructure parameters of the identified phases (average apparent crystallite size D in terms of size of coherently diffracting domains, and average maximum strain ε) were determined by isotropic line broadening analysis implemented in this program [36].
The room-temperature micro-Raman spectroscopic measurements were performed in backscattering geometry under the excitation from focused Ar laser beam (514 nm), using confocal Raman Microscope (Spectroscopy & Imaging, Warstein Germany). The Raman line of crystalline Si (520 cm−1) was employed to calibrate the system in the present study.
Transmission electron microscopy (TEM) was used to characterize the prepared MNC samples at a nanoscale. A small amount of sample was ultrasonically homogenized in absolute ethanol for 5 min. Then, a droplet of the suspension was applied onto a lacey carbon-coated nickel grid and dried. Prior to the TEM analyses, the samples were carbon-coated to prevent charging under the electron beam. The TEM analyses were performed using a 200 kV microscope JEM 2100 (JEOL, Akishima, Japan) with LaB6 electron source, this set-up being equipped with energy dispersive X-ray spectrometer (EDXS) for chemical analysis. The morphology of the MNC was investigated using field emission-scanning electron microscope (FE-SEM) Mira 3 (Tescan, Brno, Czech Republic) coupled with an EDXS analyzer (Oxford Instruments, Oxford, UK).
Adsorption isotherms and pore size distribution in the MNC samples were obtained using NOVA 1200e Surface Area & Pore Size Analyzer (Quantachrome Instruments, Hook, UK), the specific surface area and pore size distribution being calculated by respectively applying the Brunnauer–Emmet–Teller (BET) and Barret–Joyner–Halenda (BJH) methods.
Optical absorption spectra were recorded using UV-Vis spectrophotometer Helios Gamma (Thermo Electron Corporation, Cambridge, UK). The measurements were performed in quartz cell by dispersing the synthesized particles in absolute ethanol by ultrasonic stirring. The photoluminescence (PL) spectra were registered using UV-Vis-NIR confocal Raman Microscope (Spectroscopy & Imaging, Warstein, Germany) with 488 nm line of Ar laser for excitation. The samples were dispersed on SiO2/Si substrate for PL intensity measurement.
The particle size distribution was measured by a photon cross-correlation spectroscopy using a Nanophox particle size analyzer (Sympatec, Clausthal-Zellerfeld, Germany). A portion of nanosuspension was diluted with the BSA-containing solution to achieve a suitable concentration for the measurement. This analysis was performed using a dispersant refractive index of 1.33. The measurements were repeated three times for each sample.
Zeta-potential (ZP) was registered for the samples diluted in a distilled water using Zetasizer Nano ZS (Malvern, Malvern, UK) set-up, the electrophoretic mobility of the particles being converted to ZP using the Smoluchowski equation built in the Malvern zetasizer software. These ZP measurements were performed in triplicate with at least 12 sub-runs for each sample.
Fourier transform infrared (FT-IR) in transmission mode was performed using a Tensor 27 spectrometer (Bruker, Karlsruhe, Germany). The samples were prepared by a KBr-pellet method and measured in the frequency range of 4000–400 cm−1. KBr was dried before the analysis at 100 °C for 1 h. The spectra were expressed as absorbance versus wavenumber (cm−1).
Dissolution tests were conducted in 250 mL glass reactor under the following conditions: The weight of the sample—0.5 g, the volume of the physiological solution (0.9% NaCl)—200 mL and temperature—37 ± 0.5 °C. Aliquots (1 mL) and diluted as necessary of the solution were collected at appropriate intervals for the determination of the dissolved copper and zinc by the atomic absorption spectroscopy (AAS).
The content of metal ions in solid samples was analyzed using an atomic absorption spectrometer SPECTRAA L40/FS (Varian, Crawley, Australia).

2.3. Biological Activity

2.3.1. Multiple Myeloma Cell Lines

Multiple myeloma (MM) cell lines (MM.1S, RPMI 8226-S (referred to as RPMI-S), OPM-1, OPM-2, KMS-11 and JJN3 were obtained from ATCC (Manassas, VA, USA). MM cell lines were cultured in RPMI 1640 (Cellgro, Mediatech, VA, USA) supplemented with 10% heat-inactivated fetal bovine serum (FBS; Harlan, Indianapolis, IN, USA), 100 U/mL penicillin, 100 μg/mL streptomycin and 2 mM L-glutamine (GIBCO, Grand Island, NY, USA) at 37 °C in 5% CO2, respectively.

2.3.2. Nanoparticles Sensitivity by Cell-Based MTT Assay

The MM cell lines were plated in 96-well plates at a density of 1 × 10⁴ cells per well, and treated with increasing concentrations (0–10 µM) of CuInSe2/ZnS at ratio 5:0 and 4:1 for 24 h, 48 h and 72 h compared to control cells treated with same concentration of SDS as in nanoparticles.
The cytotoxic effect was determined by 50 µL per well of the 3-(4,5-dimethylthiazol-2-yl)-2,5-diphenyltetrazolium bromide assay (MTT; 1 mg/mL, Sigma-Aldrich, St Louis, MO, USA) for 4 h. Formazan crystals were dissolved with addition of 150 µL of DMSO, and absorbance was measured at 540 and 690 nm in a spectrophotometer (xMark™ Microplate Absorbance Spectrophotometer, Biorad, California, CA, USA). The concentration of nanoparticles that inhibited cell survival to 50% (EC50) was determined by Calcusyn software (Biosoft, Ferguson, MO, USA).

2.3.3. Nanoparticle Sensitivity by Flow Cytometry Analysis

The MM cell lines were plated in 12-well plates at a density of 2 × 10⁵ cells per well, and treated with CuInSe2/ZnS at ratio 5:0 and 4:1 at 5 µM concentration for 24 h. Briefly, both suspension and adherent cells were collected and washed with cold PBS. Cells were resuspended in 400 µL of PBS and 7-AAD (Molecular probes, Eugene, OR, USA; final concentration = 1 μg/mL) to gate out dead cells. After 15 min incubation in the dark at room temperature, cells were analyzed by a FACS Aria Special Sorter equipped with UV laser (Becton Dickinson, Mountain View, CA, USA). The nanoparticles were excited at violet (405 nm) laser and emitted by 670+/−30 nm wavelength.

3. Results and Discussion

3.1. Characterization of CuInSe2/ZnS Nanocrystals

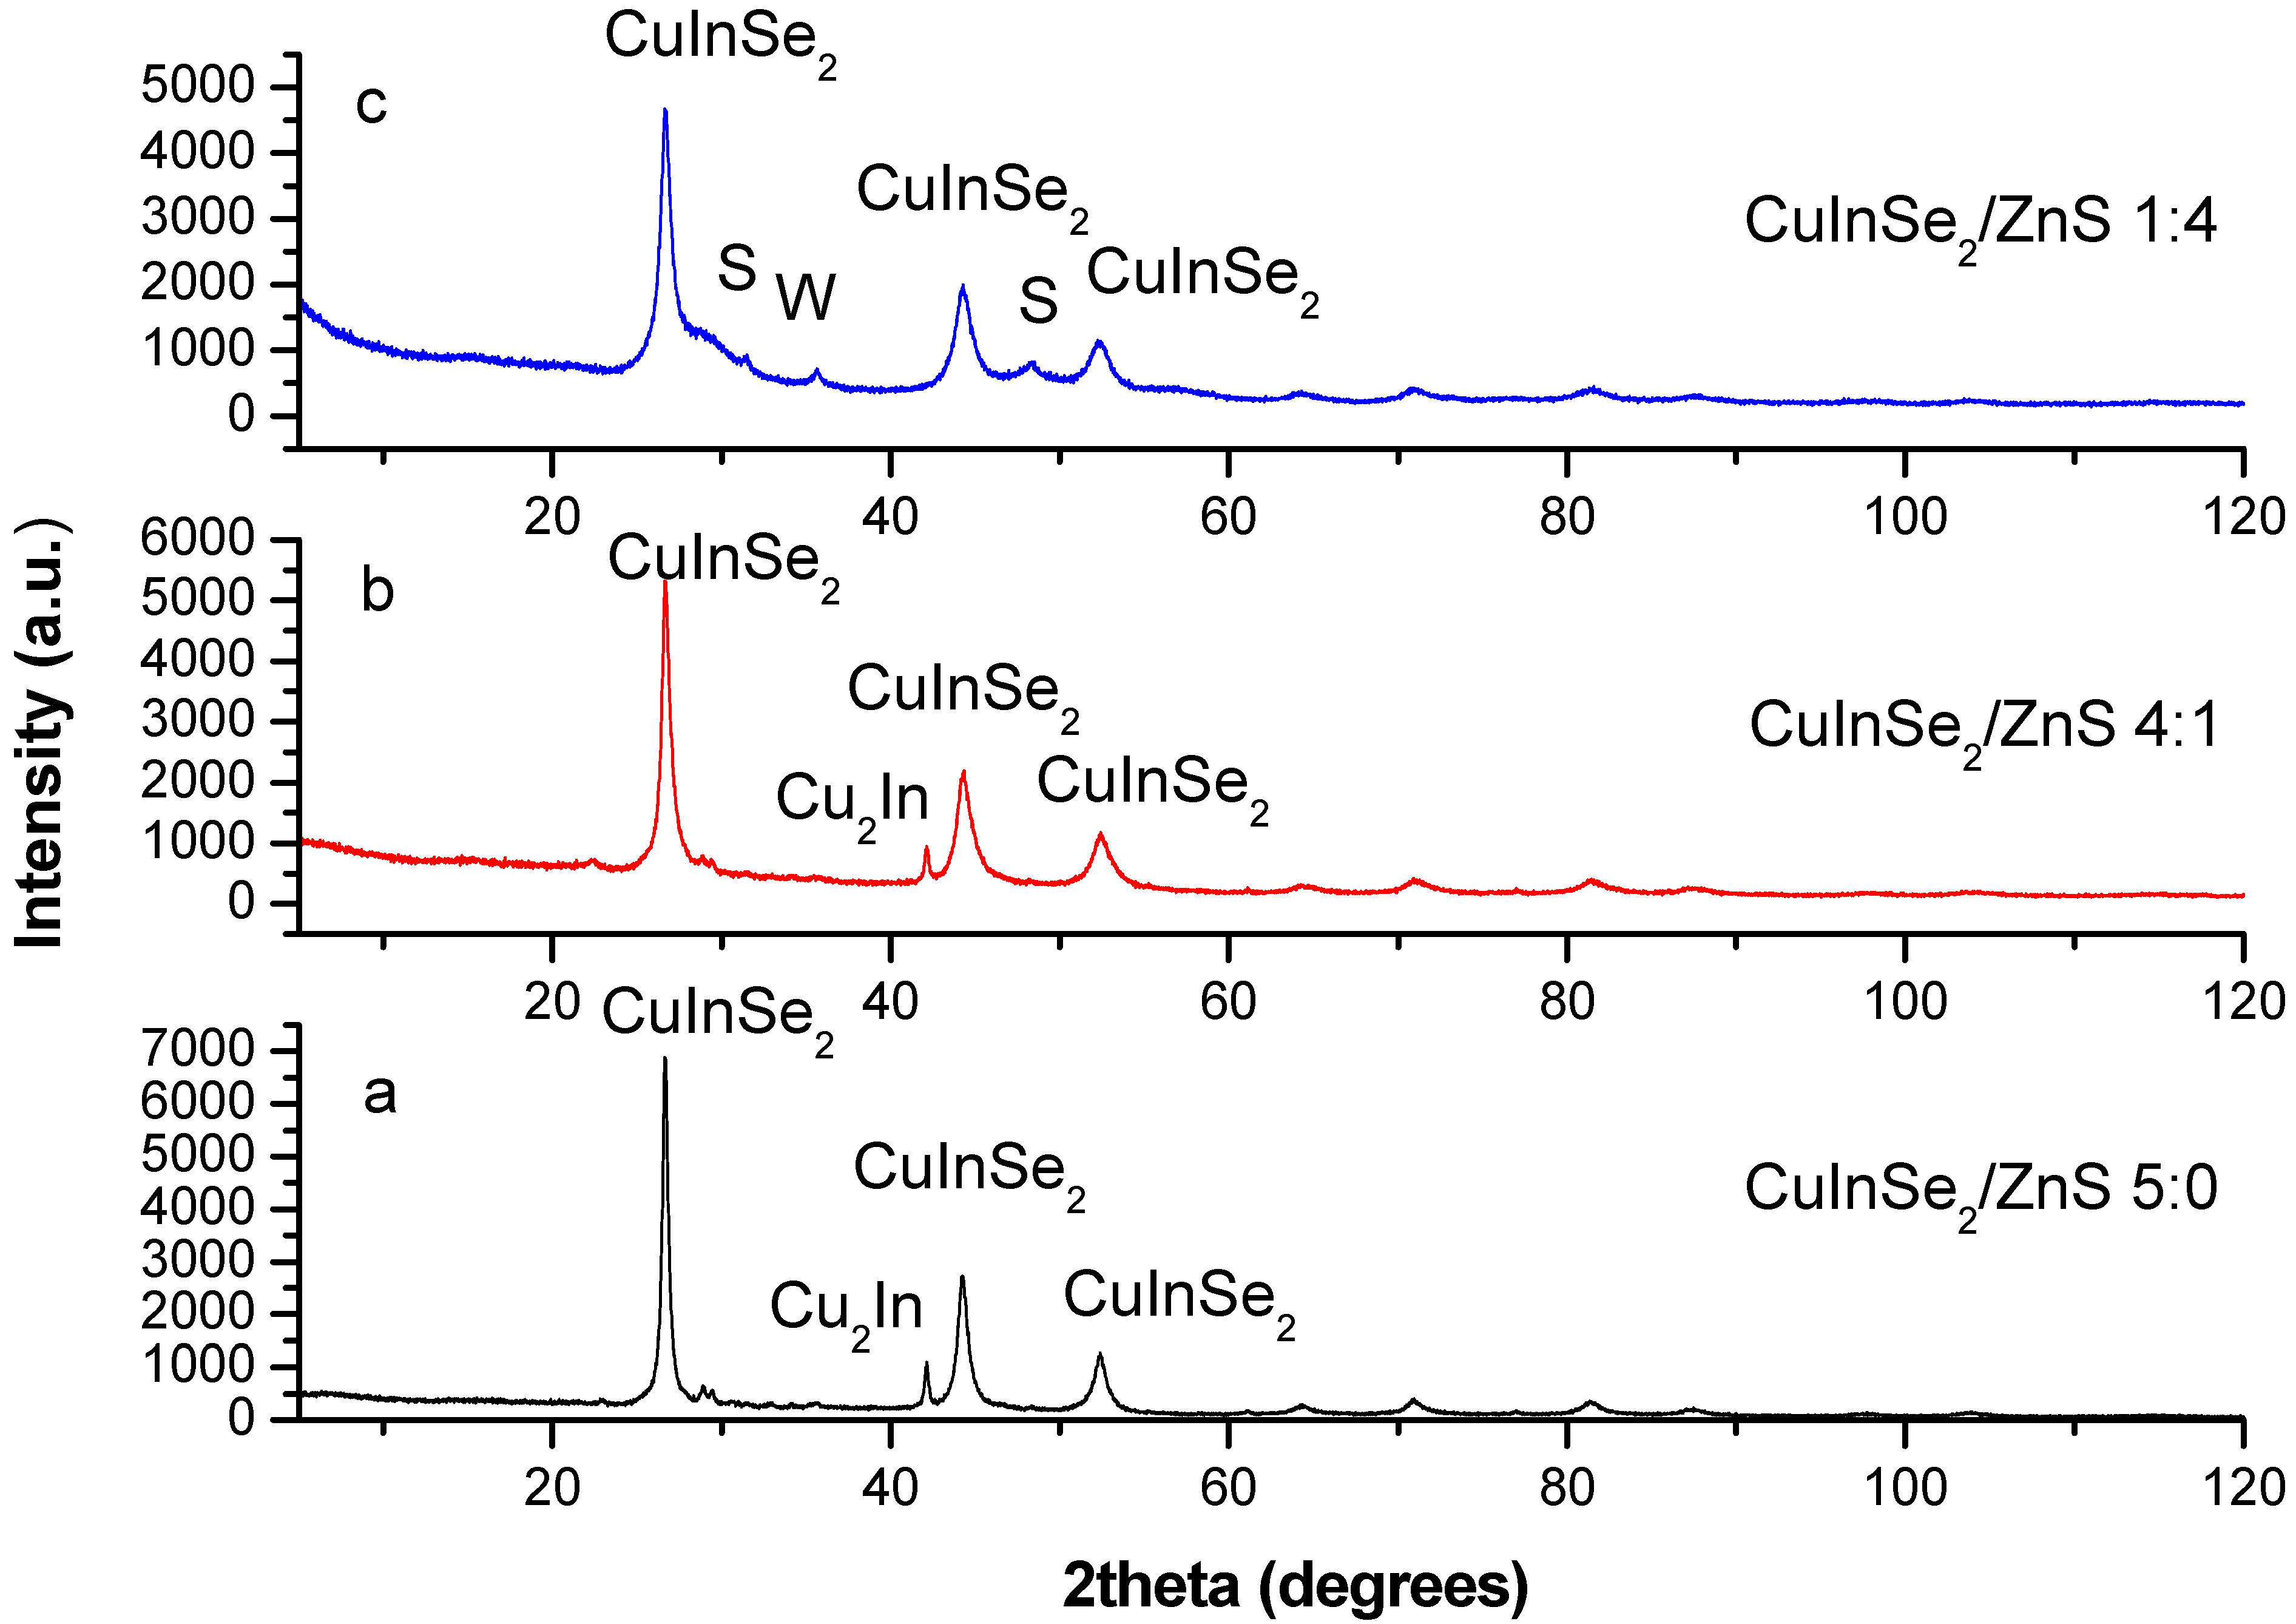
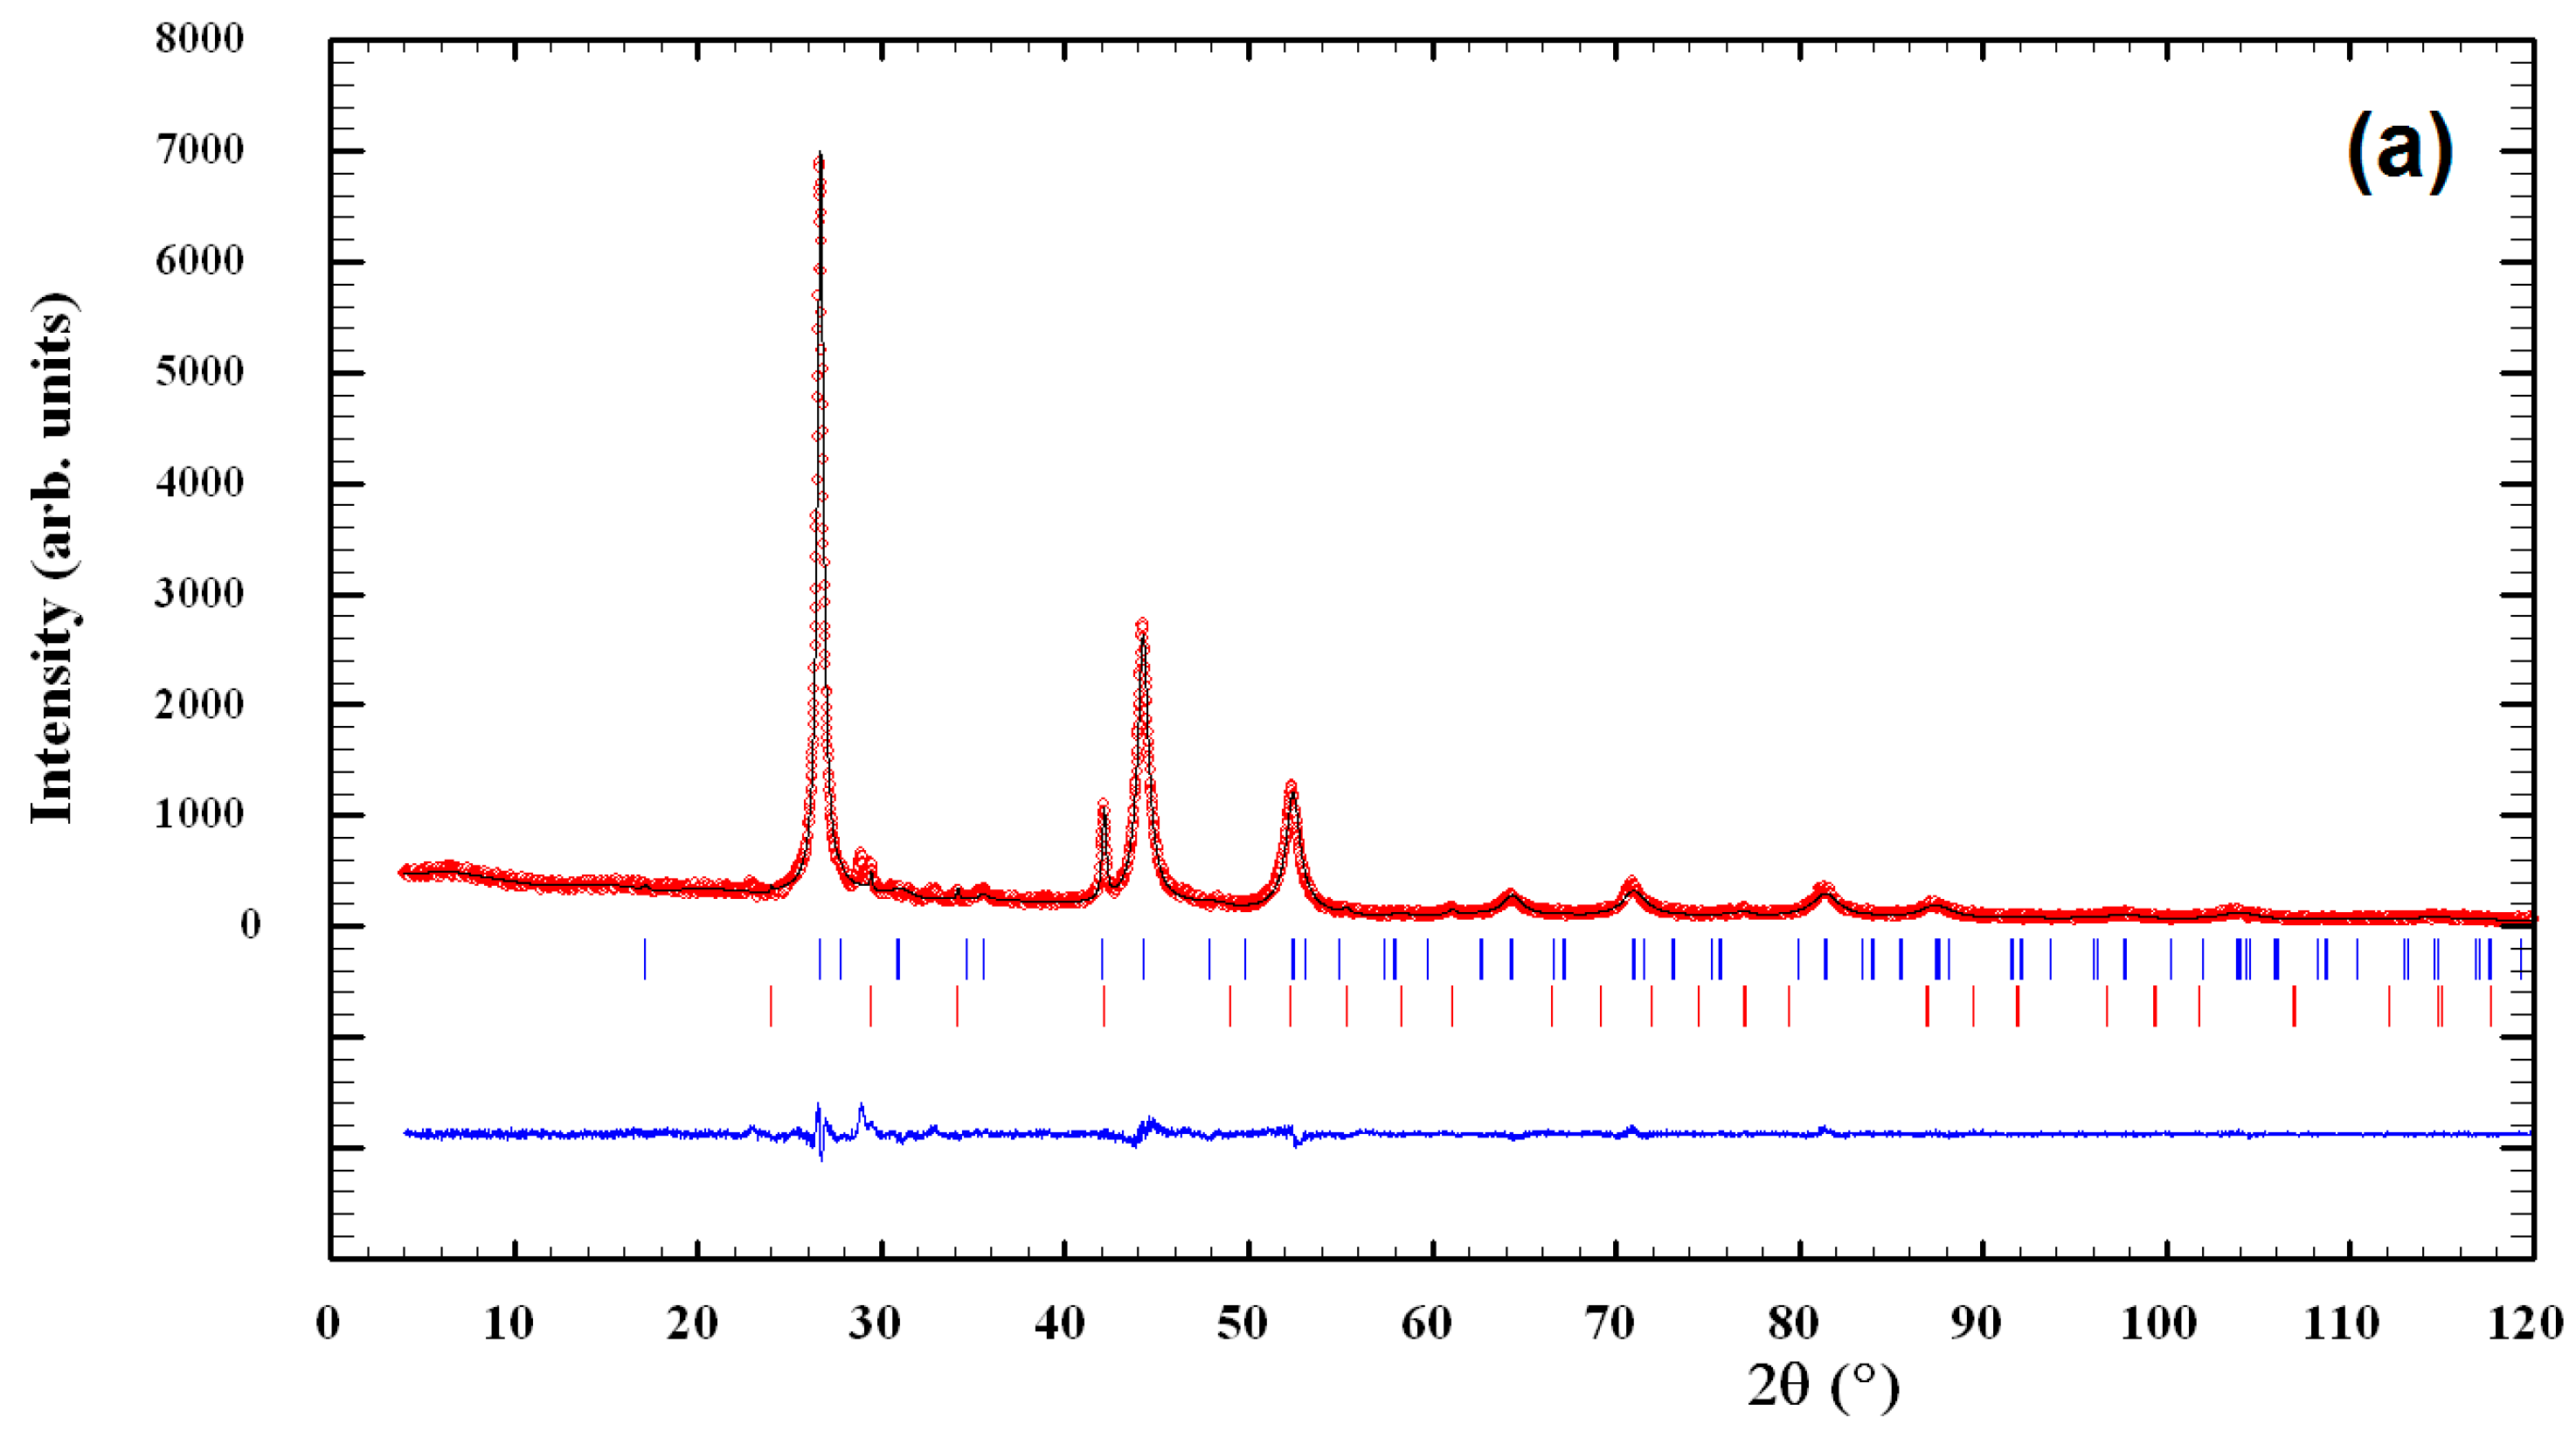
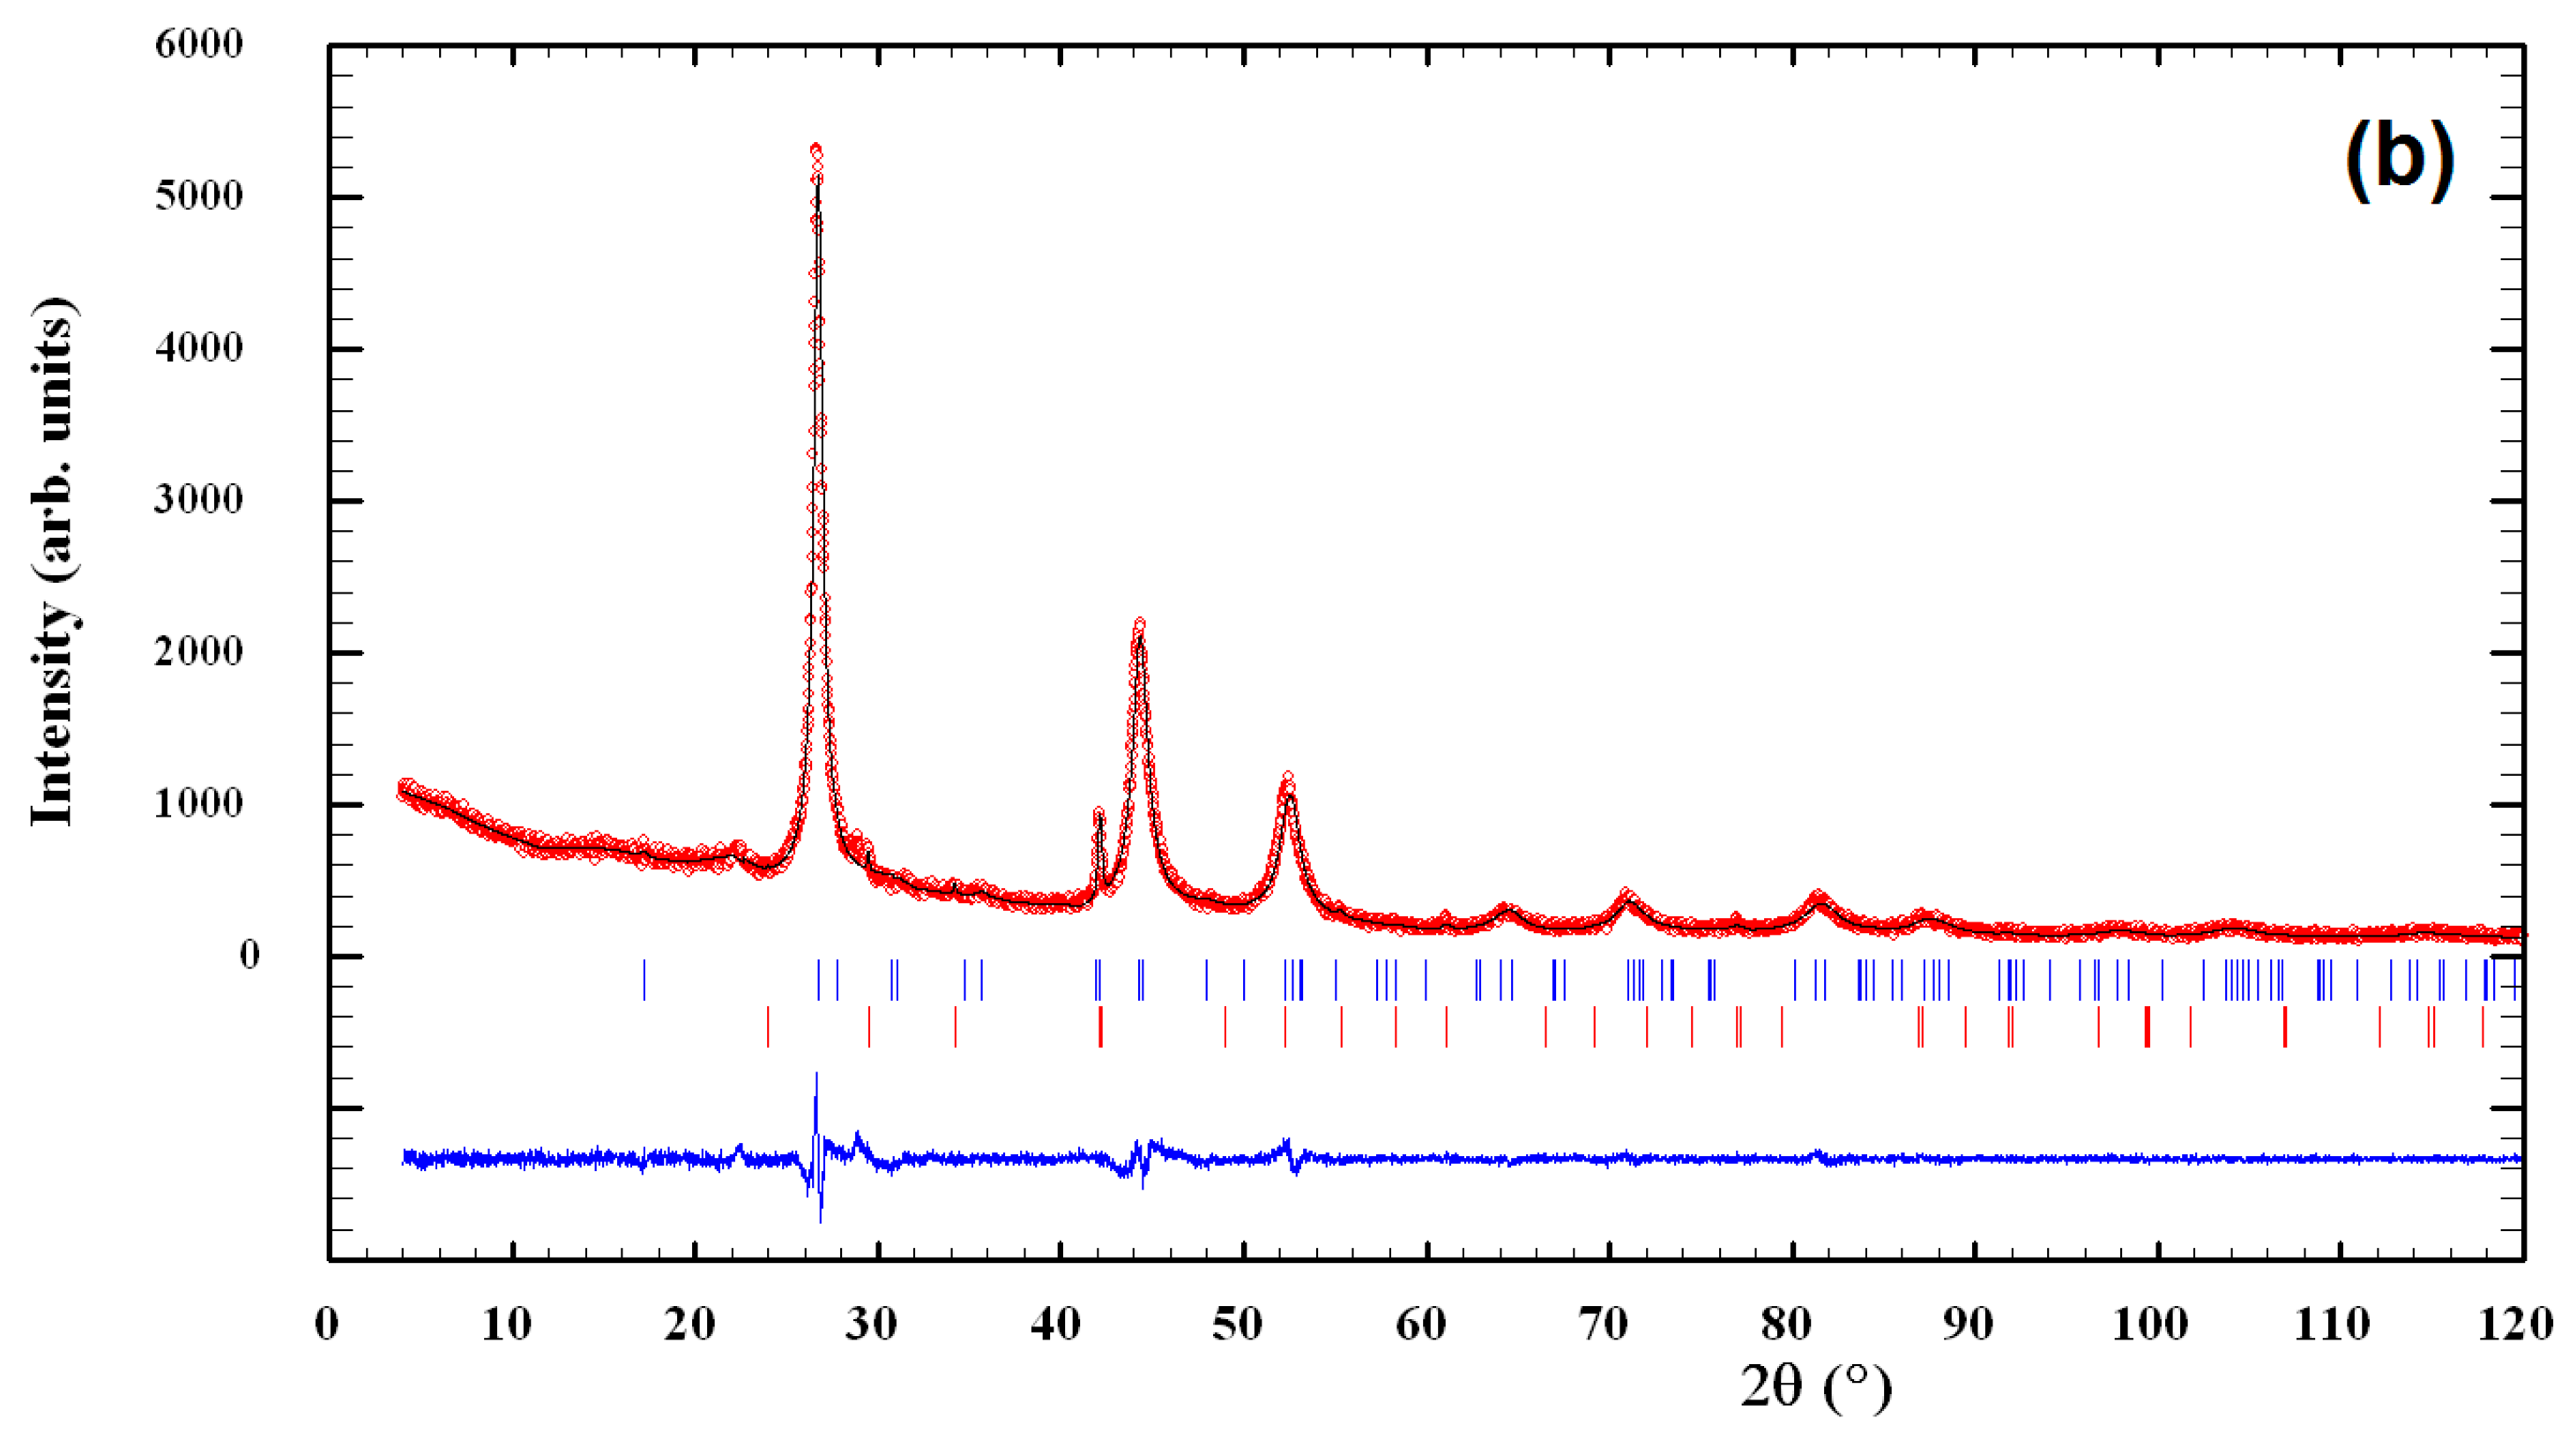
The XRPD patterns of mechanosynthesized CuInSe2/ZnS nanocrystals with different intercomponent ratio 5:0, 4:1 and 1:4 are compared in Figure 2, Figure 3 and Figure 4.
The CuInSe2/ZnS 5:0 sample consists of three different phases (see Figure 2a and Figure 3a). The main phase (94.7(6) mass.%) is CuInSe2: Structure type CuFeS2, space group I-42d, unit cell parameters a = 5.782(3) and c = 11.583(11) Å. Additional phase (5.3(1) mass.%) is Cu2In: Structure type Co1.75Ge, space group P63/mmc, unit cell parameters a = 4.2888(6) and c = 5.2457(14) Å. Small admixture of the third phase with maximal reflex at 2θ ~ 22.93° is also detectable, the distribution of the respective reflexes being like to Cu2TeSe4 phase (JCPDS card No. 27-0186). With acceptance of analogy between Se and Te, it seems reasonable that this phase is Cu2Se5 with smaller unit cell parameters. Since the crystal structure of this phase is unknown, it was not accepted during refinement. Thus, the content of main phase CuInSe2 was determined as close to ~90 mass.%. The estimated numerical value of average apparent crystallite size D for CuInSe2 approaches 9.8 ± 2.9 nm, while average maximum microstrain ε achieves 1.20(3)%.
The CuInSe2/ZnS 4:1 sample is also three-phased one (see Figure 2b and Figure 3b), the phase composition being identical to the previous. The unit cell parameters for the main (96.8(6) mass %) CuInSe2 phase are a = 5.7582(12) and c = 11.616(4) Å, and microstructural parameters are D = 7.1 ± 1.8 nm and ε = 1.67(8)%. The ZnS phase in this sample is probably in highly dispersive state, since there are no visible relaxations from wurtzite and/or sphalerite phases.
In case of CuInSe2/ZnS 1:4 sample (Figure 2c and Figure 4), the main phase (53.8(3) mass. %) is CuInSe2 with unit cell parameters a = 5.7696(14) and c = 11.642(5) Å, and microstructural parameters D = 6.4 ± 4.3 nm and ε = 1.80(4)%. Additional phase in this sample is high-temperature ZnS modification preferentially with hexagonal wurtzite structure. The presence of room-temperature ZnS modification with cubic sphalerite structure is also possible, but more reliable identification is difficult in view of semi-amorphous type of the collected XRPD pattern (the overlapped reflections).
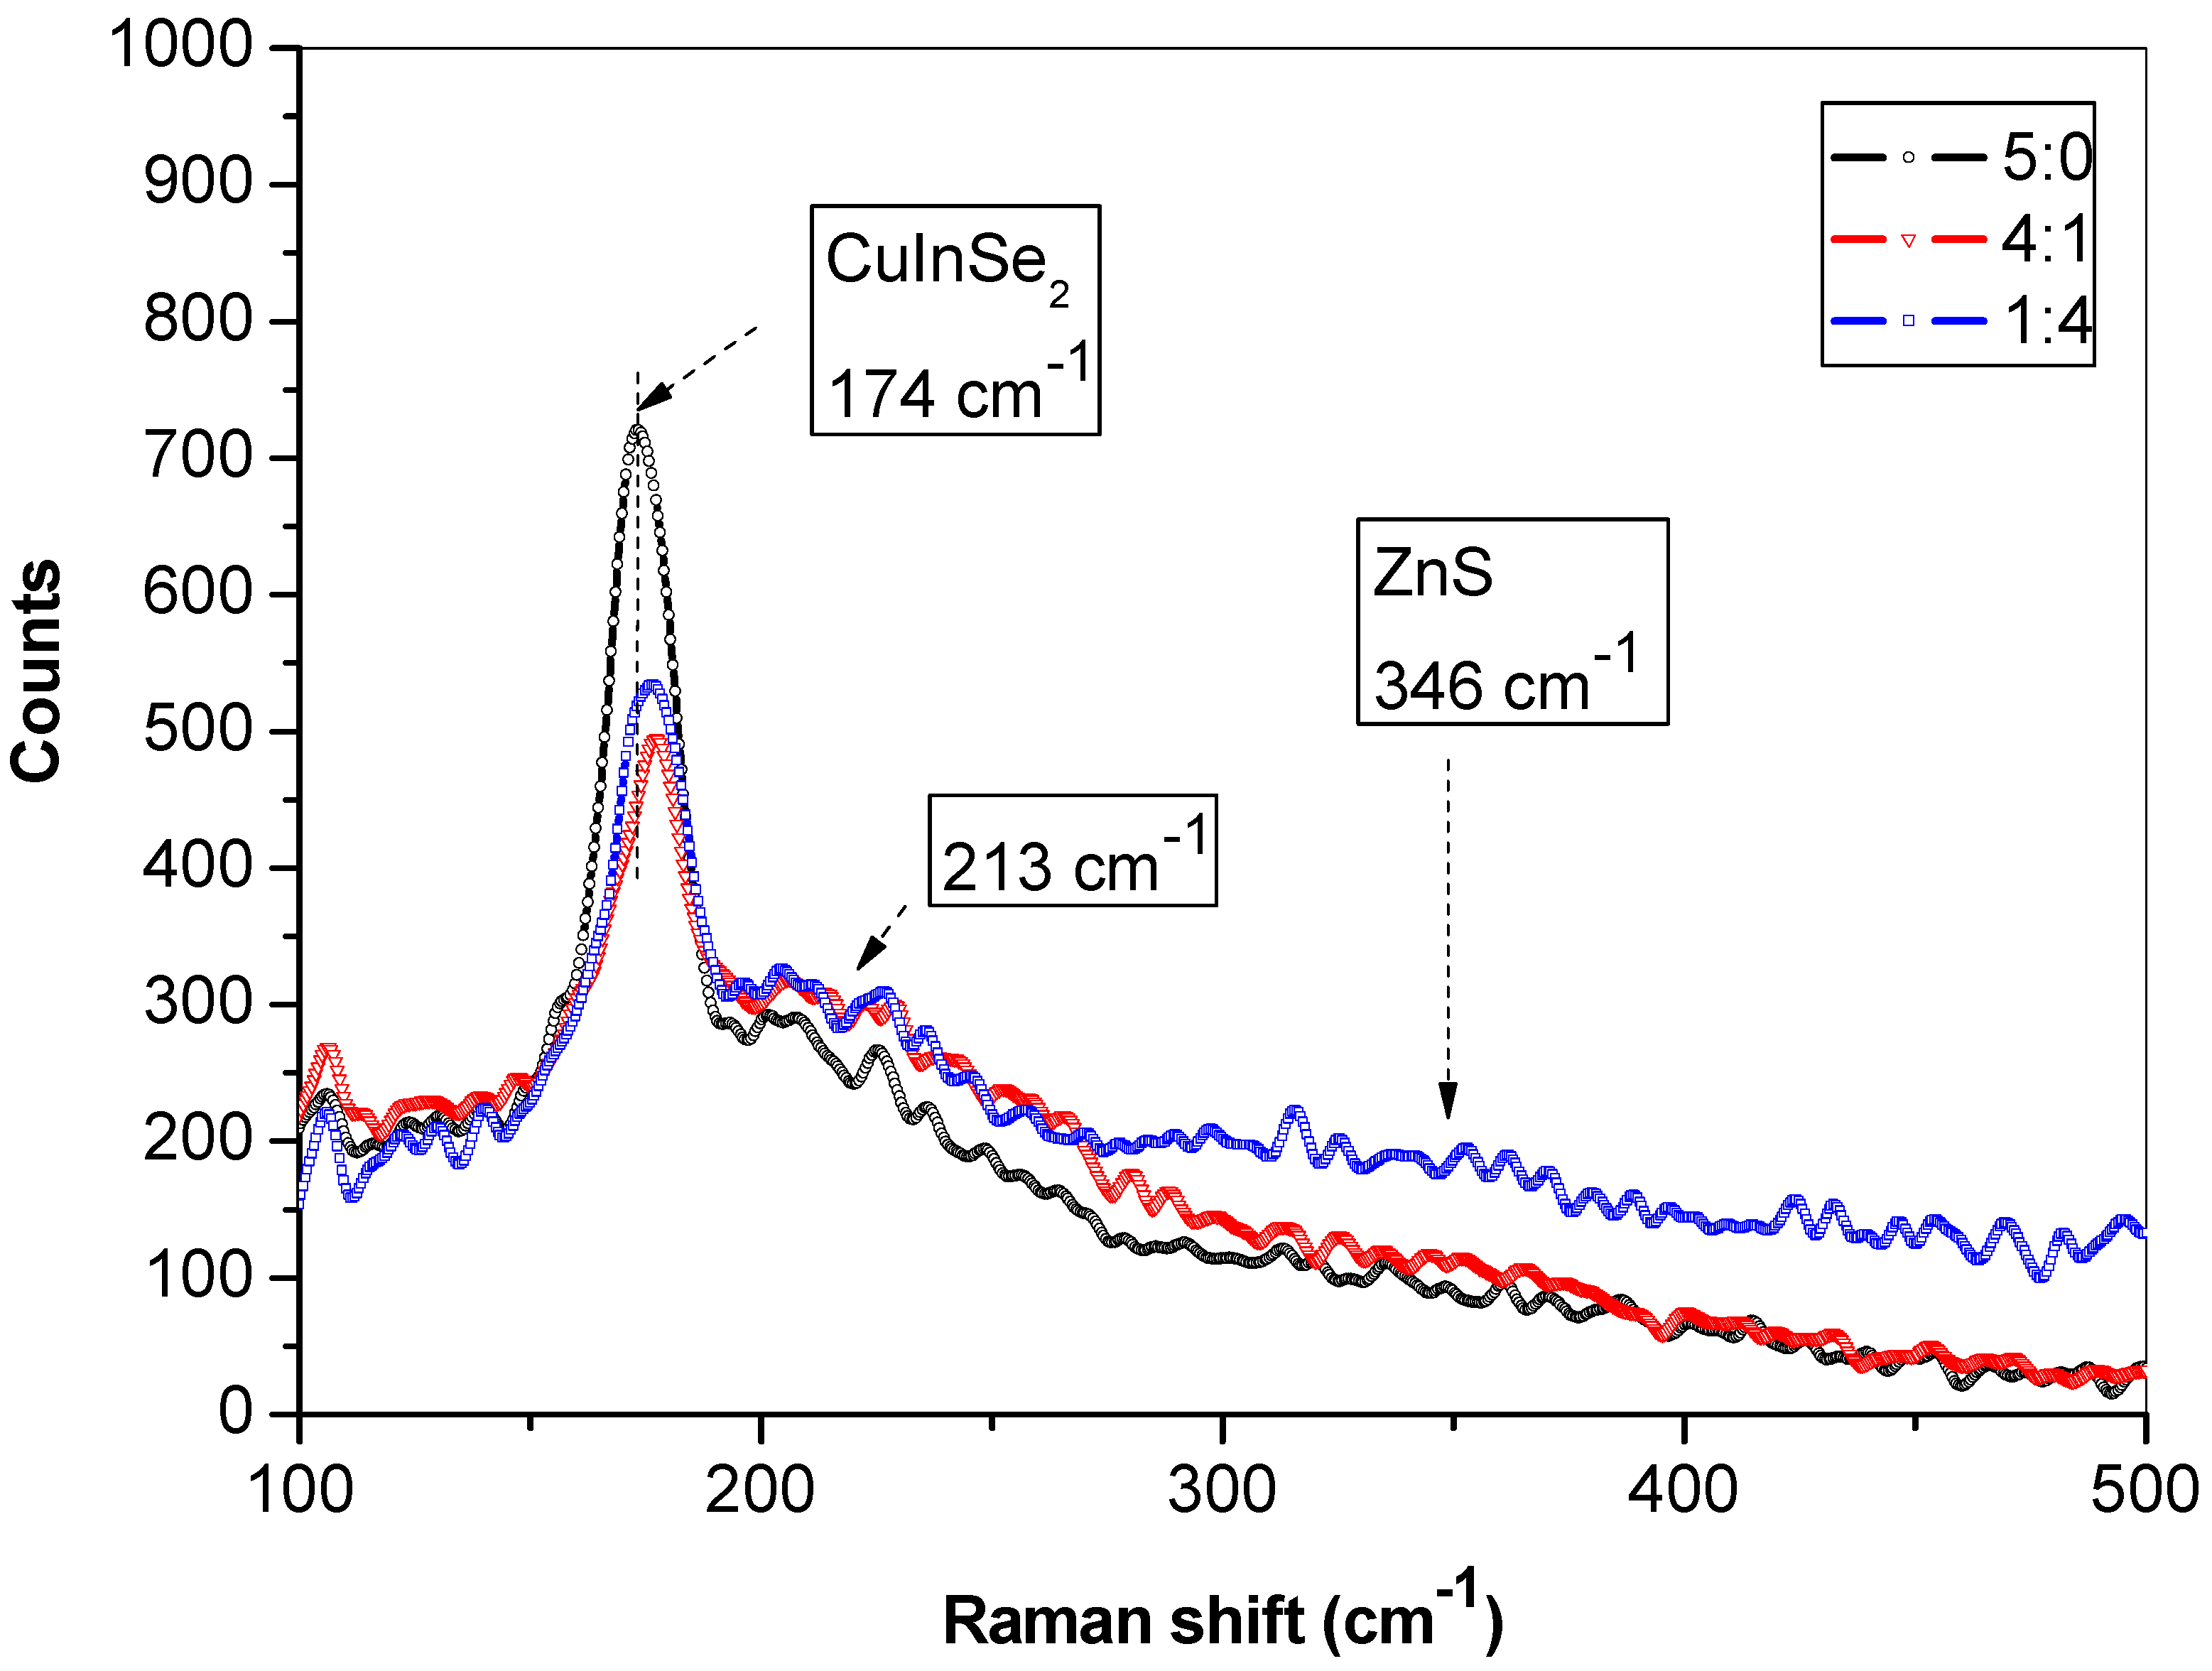
The Raman spectra from mechanochemically synthesized CuInSe2/ZnS nanocrystals excited by Ar laser beam (514 nm) are shown in Figure 5. The main part of the spectrum is located between 100 and 300 cm−1. For all measured samples, the ternary CuInSe2 phase is clearly identified by two peaks at 174 and 213 cm−1. The most intense peak at 174 cm−1 is due to the characteristic A1 mode of the chalcopyrite CuInSe2 phase [37,38,39]. The blue shift in the position of this A1 mode (as compared with announced in [37,38]) is probably due to nanocrystalline structure of this sample, and it could be related to the presence of high density of structural defects in the scattering volume. This specificity constitutes the main vibrational mode from chalcopyrite-ordered CuInSe2, allowing additional modes in the spectral region between 173 and 216 cm−1 (B1, B2, 2E) [37]. The 174 cm−1 peak intensity in CuInSe2 sample [39] is stronger than in CuInSe2/ZnS 4:1 and CuInSe2/ZnS 1:4 MNC samples. The peaks ascribed to A1 mode in CuInSe2/ZnS nanocrystals are red shifted in comparison with these peaks in CuInSe2 alone. The very weak peak ascribed to E vibrational mode in CuInSe2 is located at 213 cm−1.
It can be seen some minor changes in the Raman spectra for samples before and after mixing with ZnS. For sample with molar ratio 1:4, the broader peak at 335–340 cm−1 can be assigned to LO modes of A1 and E1 symmetry (351 cm−1 [40]), and mixed prevailing surface optical (SO) mode of ZnS (335 cm−1). This is in accordance with the results discussed in previous studies on ZnS nanowires [41,42], where SO phonon mode varies in wavenumber depending on the shape and surface roughness of ZnS nanostructures.
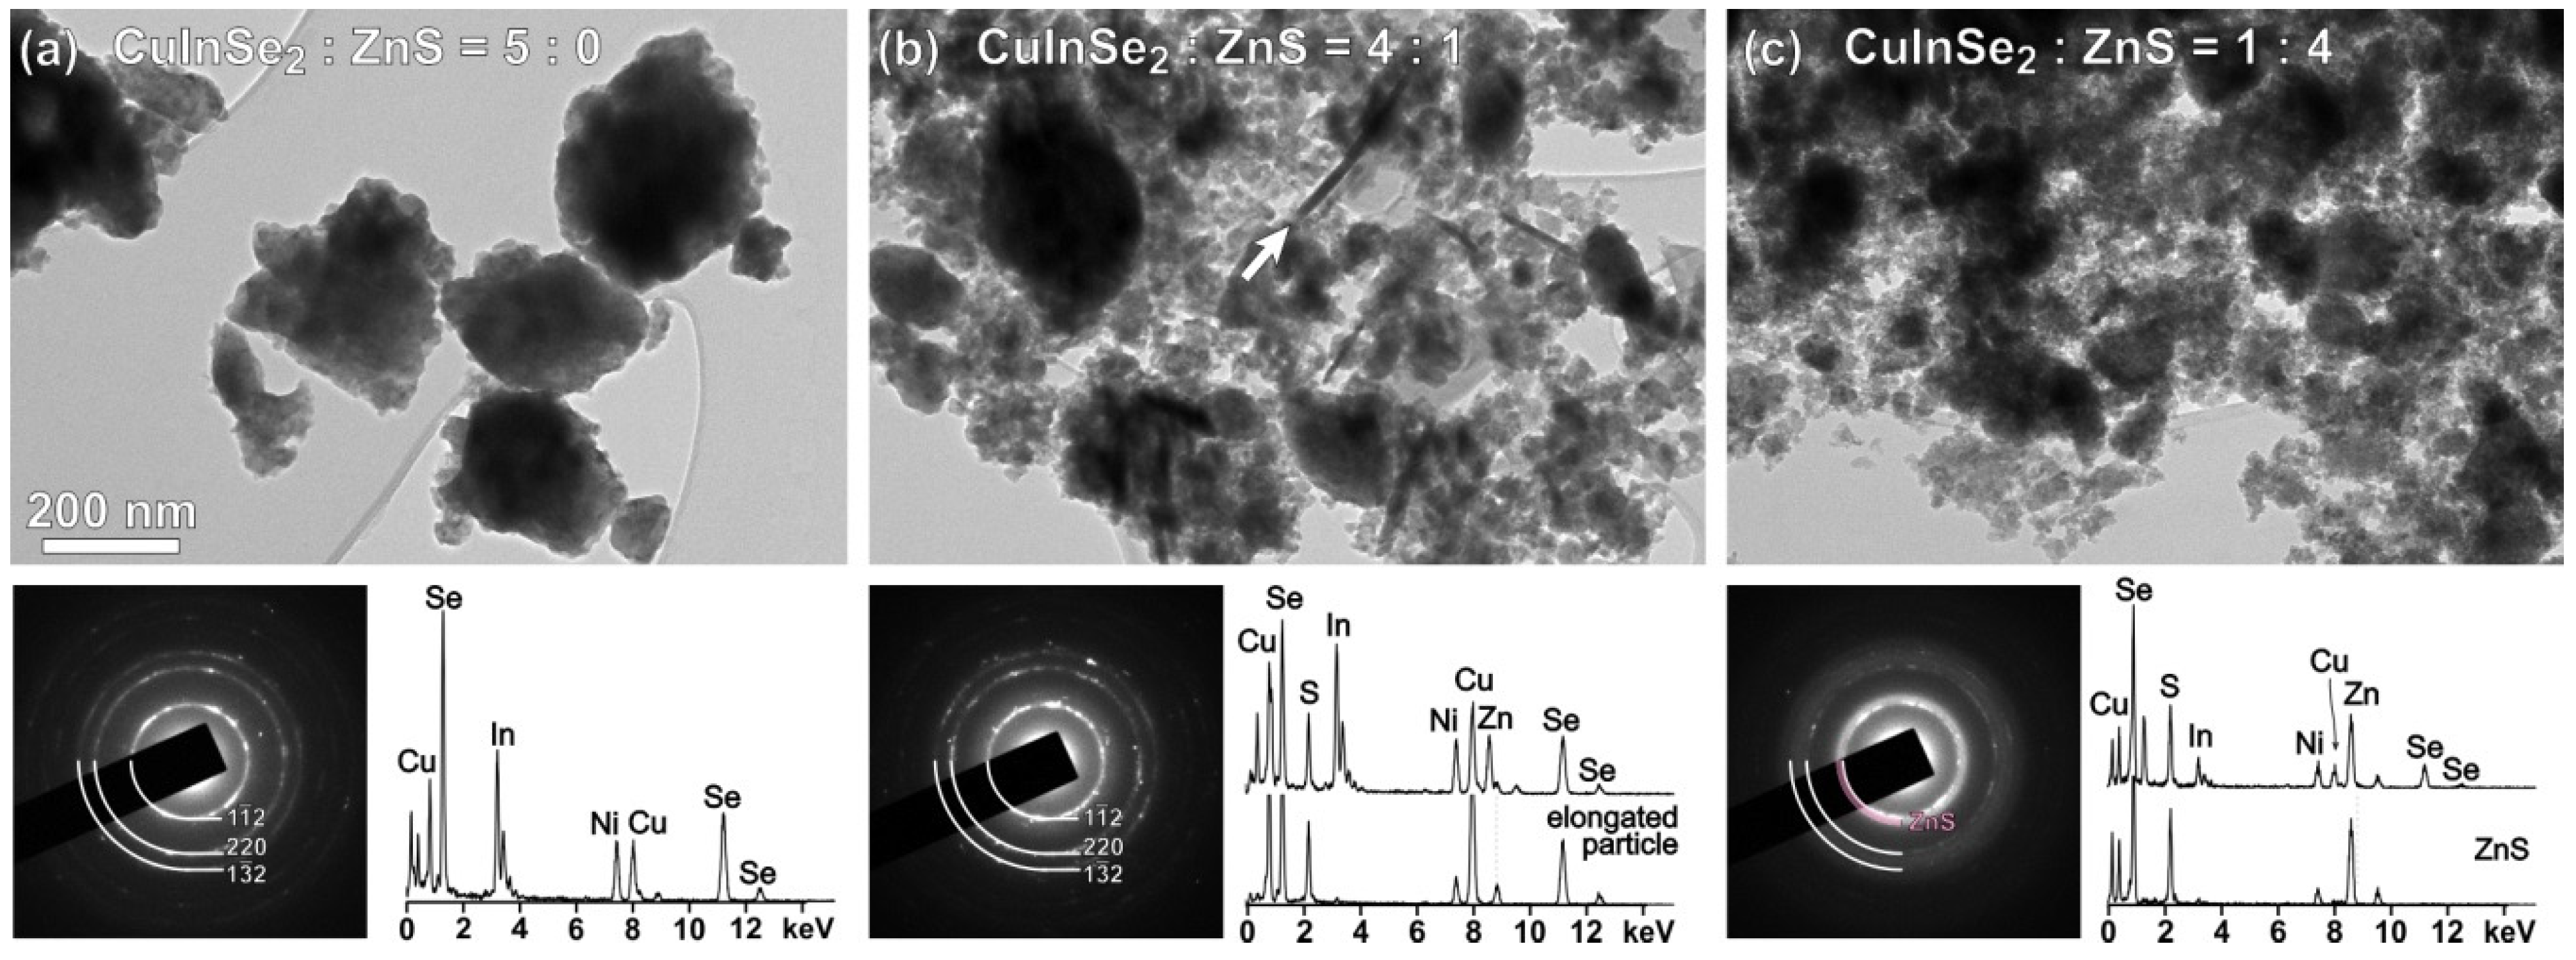
The prepared CuInSe2/ZnS MNC samples were further characterized by TEM method, the low-magnification images of three samples along with selected area electron diffraction (SAED) patterns and results of EDXS analyses being presented in Figure 6.
The CuInSe2 sample (Figure 6a) is composed of agglomerated, randomly oriented CuInSe2 nanoparticles exhibiting good crystallinity, as it follows from sharp diffraction rings of the respective SAED pattern. Several EDXS analyses performed in different parts of the sample revealed relatively homogenous composition of the sample with elemental ratio close to the expected Cu:In:Se = 1:1:2. Due to small amount, two secondary phases determined from XRPD analyses of this sample (Figure 2a and Figure 3a) were not detected by TEM.
In CuInSe2/ZnS 4:1 MNC sample (Figure 6b), the ZnS nanoparticles are present in the form of extremely fine crystallites surrounding larger CuInSe2 agglomerates as previously observed for CuInS2/ZnS system [43]. The presence of ZnS nanoparticles is barely observed in the SAED pattern, whereas the presence of Zn and S from ZnS nanoparticles surrounding the initial CuInSe2 agglomerates is clearly evident from EDXS. In this sample, the small amount of nanoparticles with elongated morphology was observed. In respect to EDXS analysis, these nanoparticles are shown to be composed of Cu, S and Se. It seems these nanoparticles are formed by reaction between one of the secondary phases in CuInSe2 detected by XRPD, e.g., Cu2Se5 and sodium sulfide nonahydrate added to form ZnS.
In MNC sample with highest ZnS fraction (CuInSe2/ZnS 1:4), the presence of ZnS nanocrystallites is clearly observed in the SAED pattern shown in Figure 6c. Due to extremely small crystallite size (<5nm), the ZnS phase yields diffuse diffraction rings, making impossible distinction between sphalerite and wurtzite polymorphs. According to HRTEM analysis of CuInS2/ZnS [43], the ZnS component is mainly stabilized as sphalerite phase, with many defects having locally wurtzite-type stacking (stacking faults and twin boundaries).
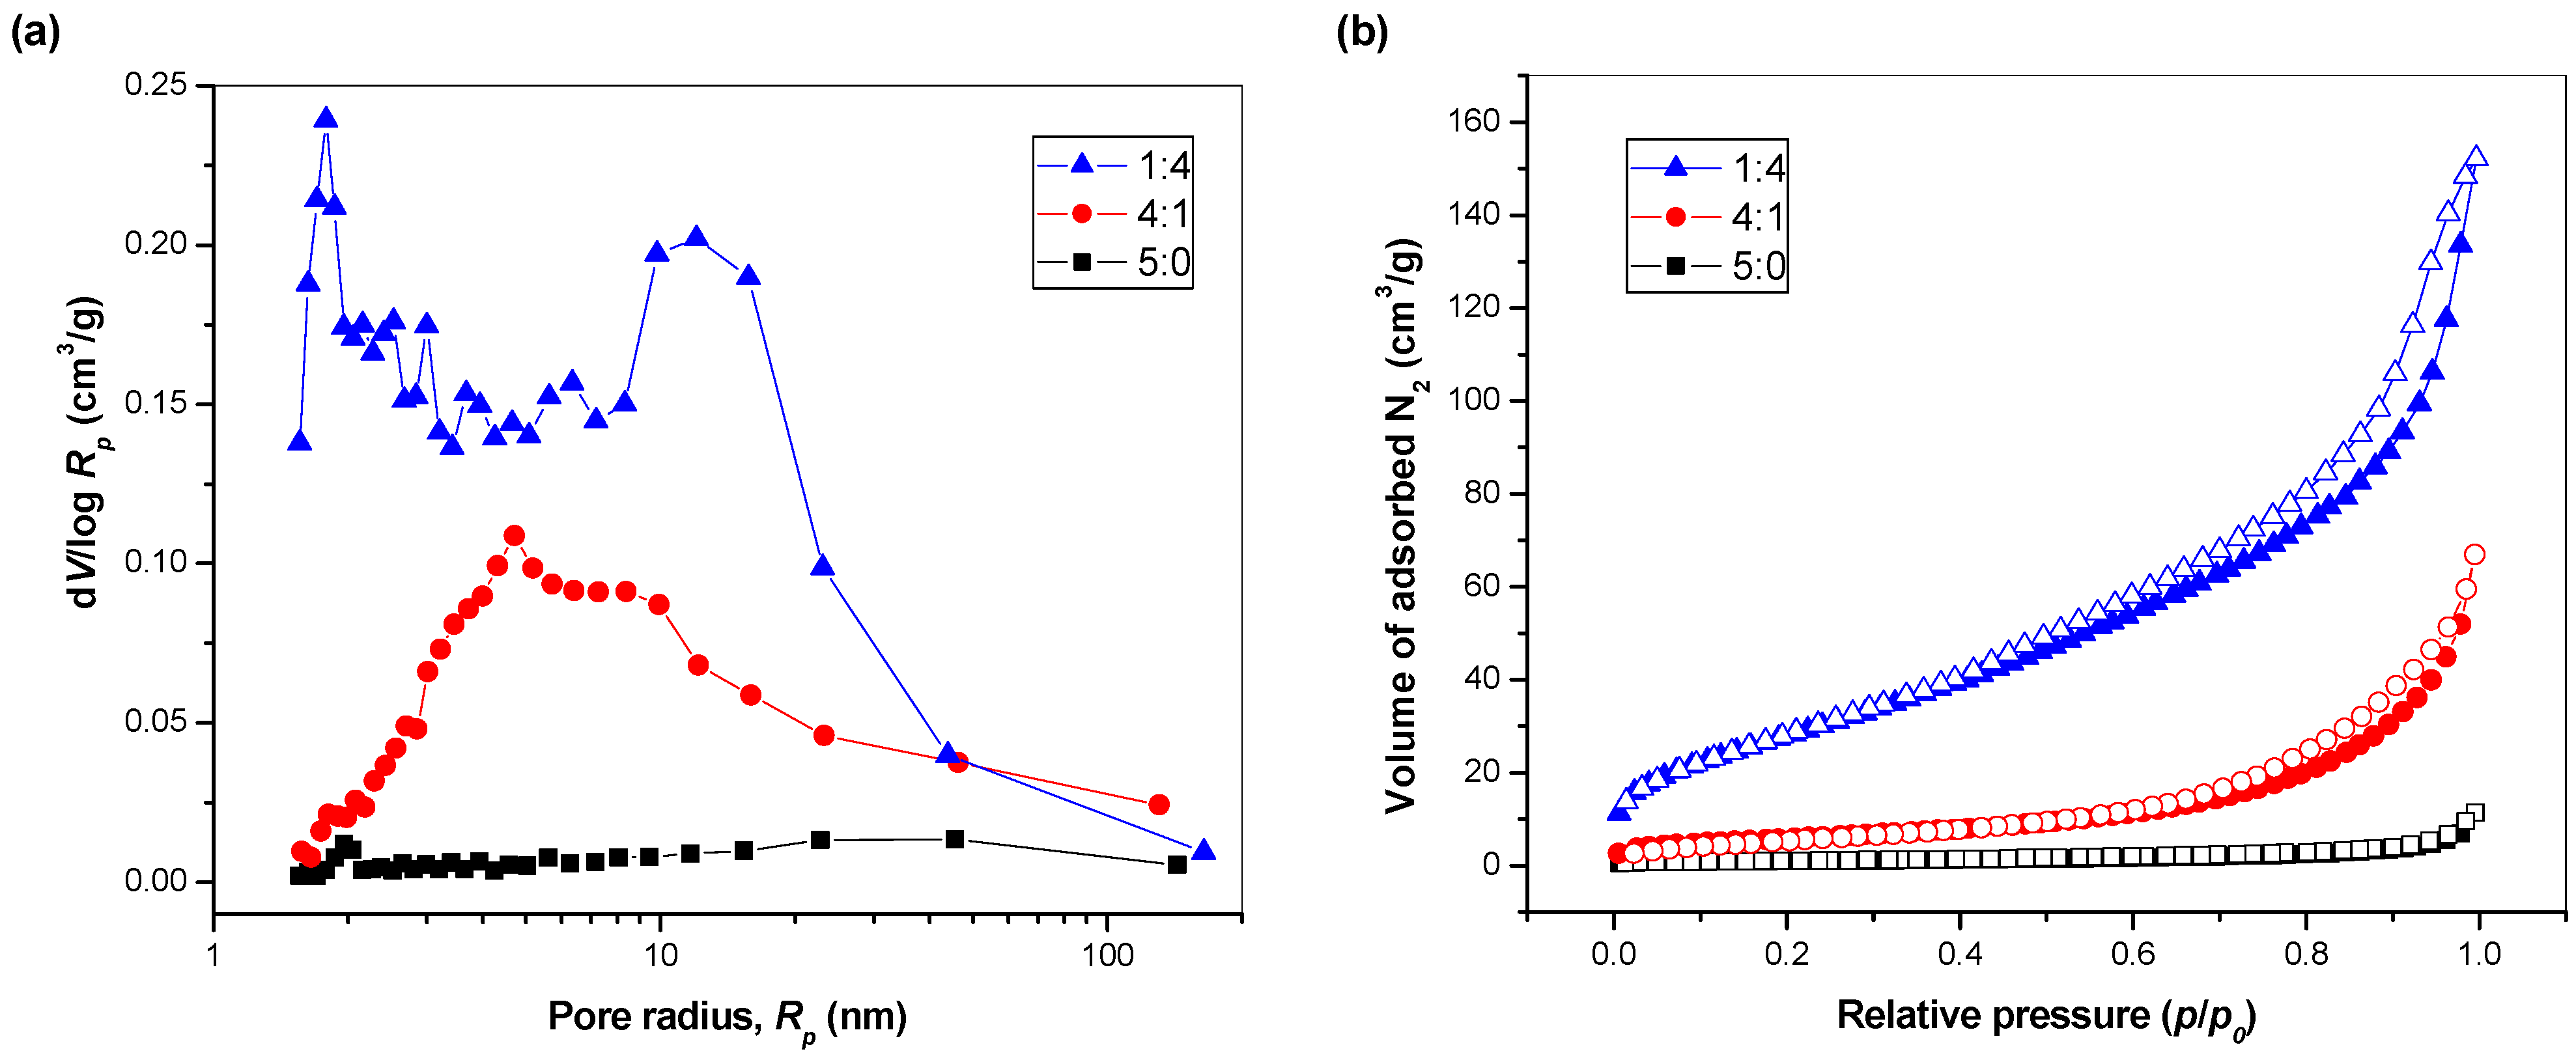
The specific surface area SBET of pure CuInSe2 MNC sample is 3.4 m2/g, the value which is more-or-less anticipated as for mechanochemically activated chalcogenides [15,16,17]. Upon further ZnS introduction (in CuInSe2/ZnS 4:1), this parameter is increased to 21 m2/g. The sample with highest ZnS content exhibits the SBET value approaching as high as 108 m2/g. In our previous study, the SBET values for the CuInS2/ZnS system prepared in a similar manner were reported to be 6 and 86 m2/g for ZnS-free and ZnS-rich compounds, respectively [43]. Whereas the as-synthesized CuInSe2 exhibits almost two-fold lower SBET value than CuInS2, the CuInSe2/ZnS 1:4 MNC sample has higher SBET than the corresponding sulfide analogue. Maybe, the less porous structure of selenide MNC with respect to the corresponding sulfide offers the possibility of ZnS to manifest its porosity better by being exposed to the nitrogen gas on flat surface. In the case of sulfide, the ZnS particles can be trapped inside already present pores of CuInS2 and the gas cannot reach them so easily. In the report applying solvothermal approach for CuInSe2 nanoparticles, significantly higher values (ca. 8.22 and 44.8 m2/g for quantum dots and dandelion-like particles, respectively) were reported [44]. This can be caused by applied method. In solvothermal method, the porous crystals have enough time to grow, whereas in mechanochemical synthesis, the porous structure is immediately brought down by heavy impacts of milling balls.
To study the surface properties of mechanochemically synthesized CuInSe2/ZnS nanocrystals in more details, the whole adsorption–desorption isotherms and particle size distributions for these samples were analyzed (see Figure 7).
The adsorption isotherm of CuInSe2 sample resembles that of non-porous solid, although the area around relative pressures of one hints to the presence of macropores. This is confirmed by pore size distribution of this sample shown in Figure 7b. Almost similar situation was evidenced for CuInS2 earlier [43].
Upon ZnS introduction, the mesopores are formed, as evidenced by hysteresis loops in isotherms in both ZnS-containing samples in Figure 7a. The CuInSe2:ZnS 4:1 nanocrystals have broad pore size distribution covering almost the whole mesoporous range with the maximum around 4 nm. Macropores are also present, which are most probably coming both from CuInSe2 and ZnS. When the content of ZnS is increased further (as in CuInSe2:ZnS 1:4 sample), the porous properties are improved more (and also very small mesopores with maximum radius around 2 nm are formed). This is not an artifact, as such a peak, also more diffuse, was evidenced upon calculation from adsorption isotherm (not shown here). In addition to this maximum, another one around 15 nm radius is present. The pore size distribution of this sample resembles that reported for pure ZnS in [43] rather than for CuInS2:ZnS 1:4, in which the fraction of larger mesopores was missing. This is supported also by higher SBET value of CuInSe2:ZnS 1:4 than CuInS2:ZnS 1:4 sample discussed earlier. The changes observed with the introduction of ZnS suggest that the prepared sample is not just a pure mixture of both sulfides, but some interactions at least on the level of the Van der Waals forces are definitely important.
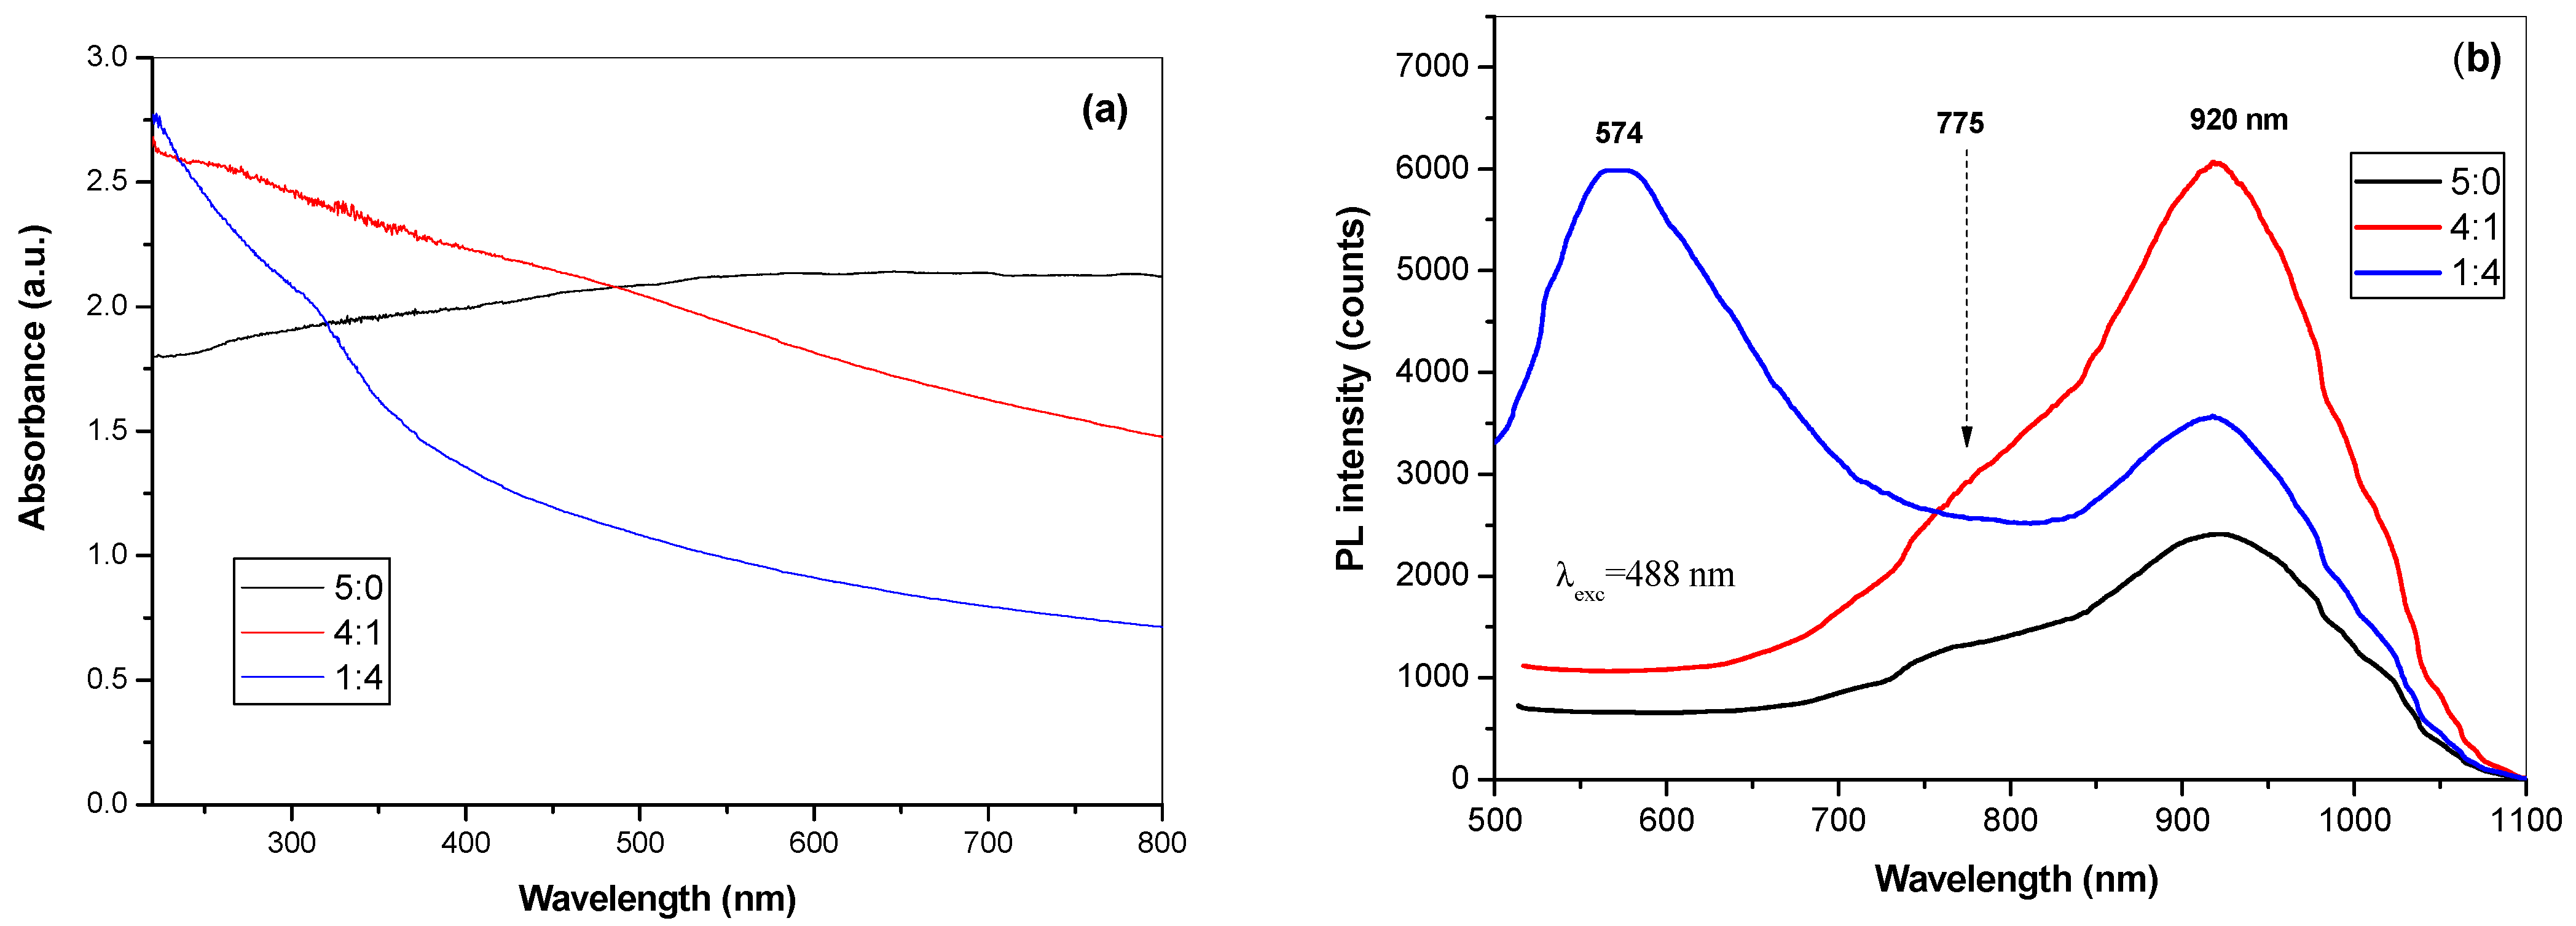
Optical properties of mechanochemically synthesized CuInSe2/ZnS nanocrystals were recorded by UV-Vis and micro-PL spectroscopy, the spectra being shown in Figure 8.
By incorporation of ZnS into CuInSe2, the absorption spectra of CuInSe2/ZnS 4:1 and CuInSe2/ZnS 1:4 MNC show absorption peak at 320 nm (3.85 eV) typical for ZnS, which is blue shifted due to quantum confinement effect in respect to the bulk band gap of ZnS [5].
The room temperature PL spectra excited with the wavelength of 488 nm are presented in Figure 8b. There are two band emissions for CuInSe2 phase, these being weak emission in visible range at 775 nm (1.6 eV) and more intensive emission at 920 nm (1.34 eV). The emission spectrum is red-shifted by 0.29 eV respectively to the band edge. The strong emission at 1.34 eV appears is due to excitonic band-to-band (e-h) recombination, while peak at 1.6 eV is attributed to transition from shallow trap centers to conduction band. For CuInSe2/ZnS 1:4 MNC sample, the broad green emission spectra are observed due to some self-activated defect centers related to Zn and S-vacancies [45].

3.2. Characterization of SDS Capped CuInSe2/ZnS Nanosuspensions

To obtain colloidal CuInSe2/ZnS nanocrystals dispersed in SDS solution suitable for their biological and anti-cancer testing, the wet stirred media milling process was applied, the respective MNC samples being further referred to as CuInSe2/ZnS-SDS. We tried to prepare nanosuspensions for all three above studied CuInSe2/ZnS nanocrystals (5:0, 4:1 and 1:4). Unfortunately, we have only prepared SDS capped CuInSe2/ZnS 5:0 and CuInSe2/ZnS 4:1 nanosuspensions. Therefore, only these nanosuspensions were further characterized.
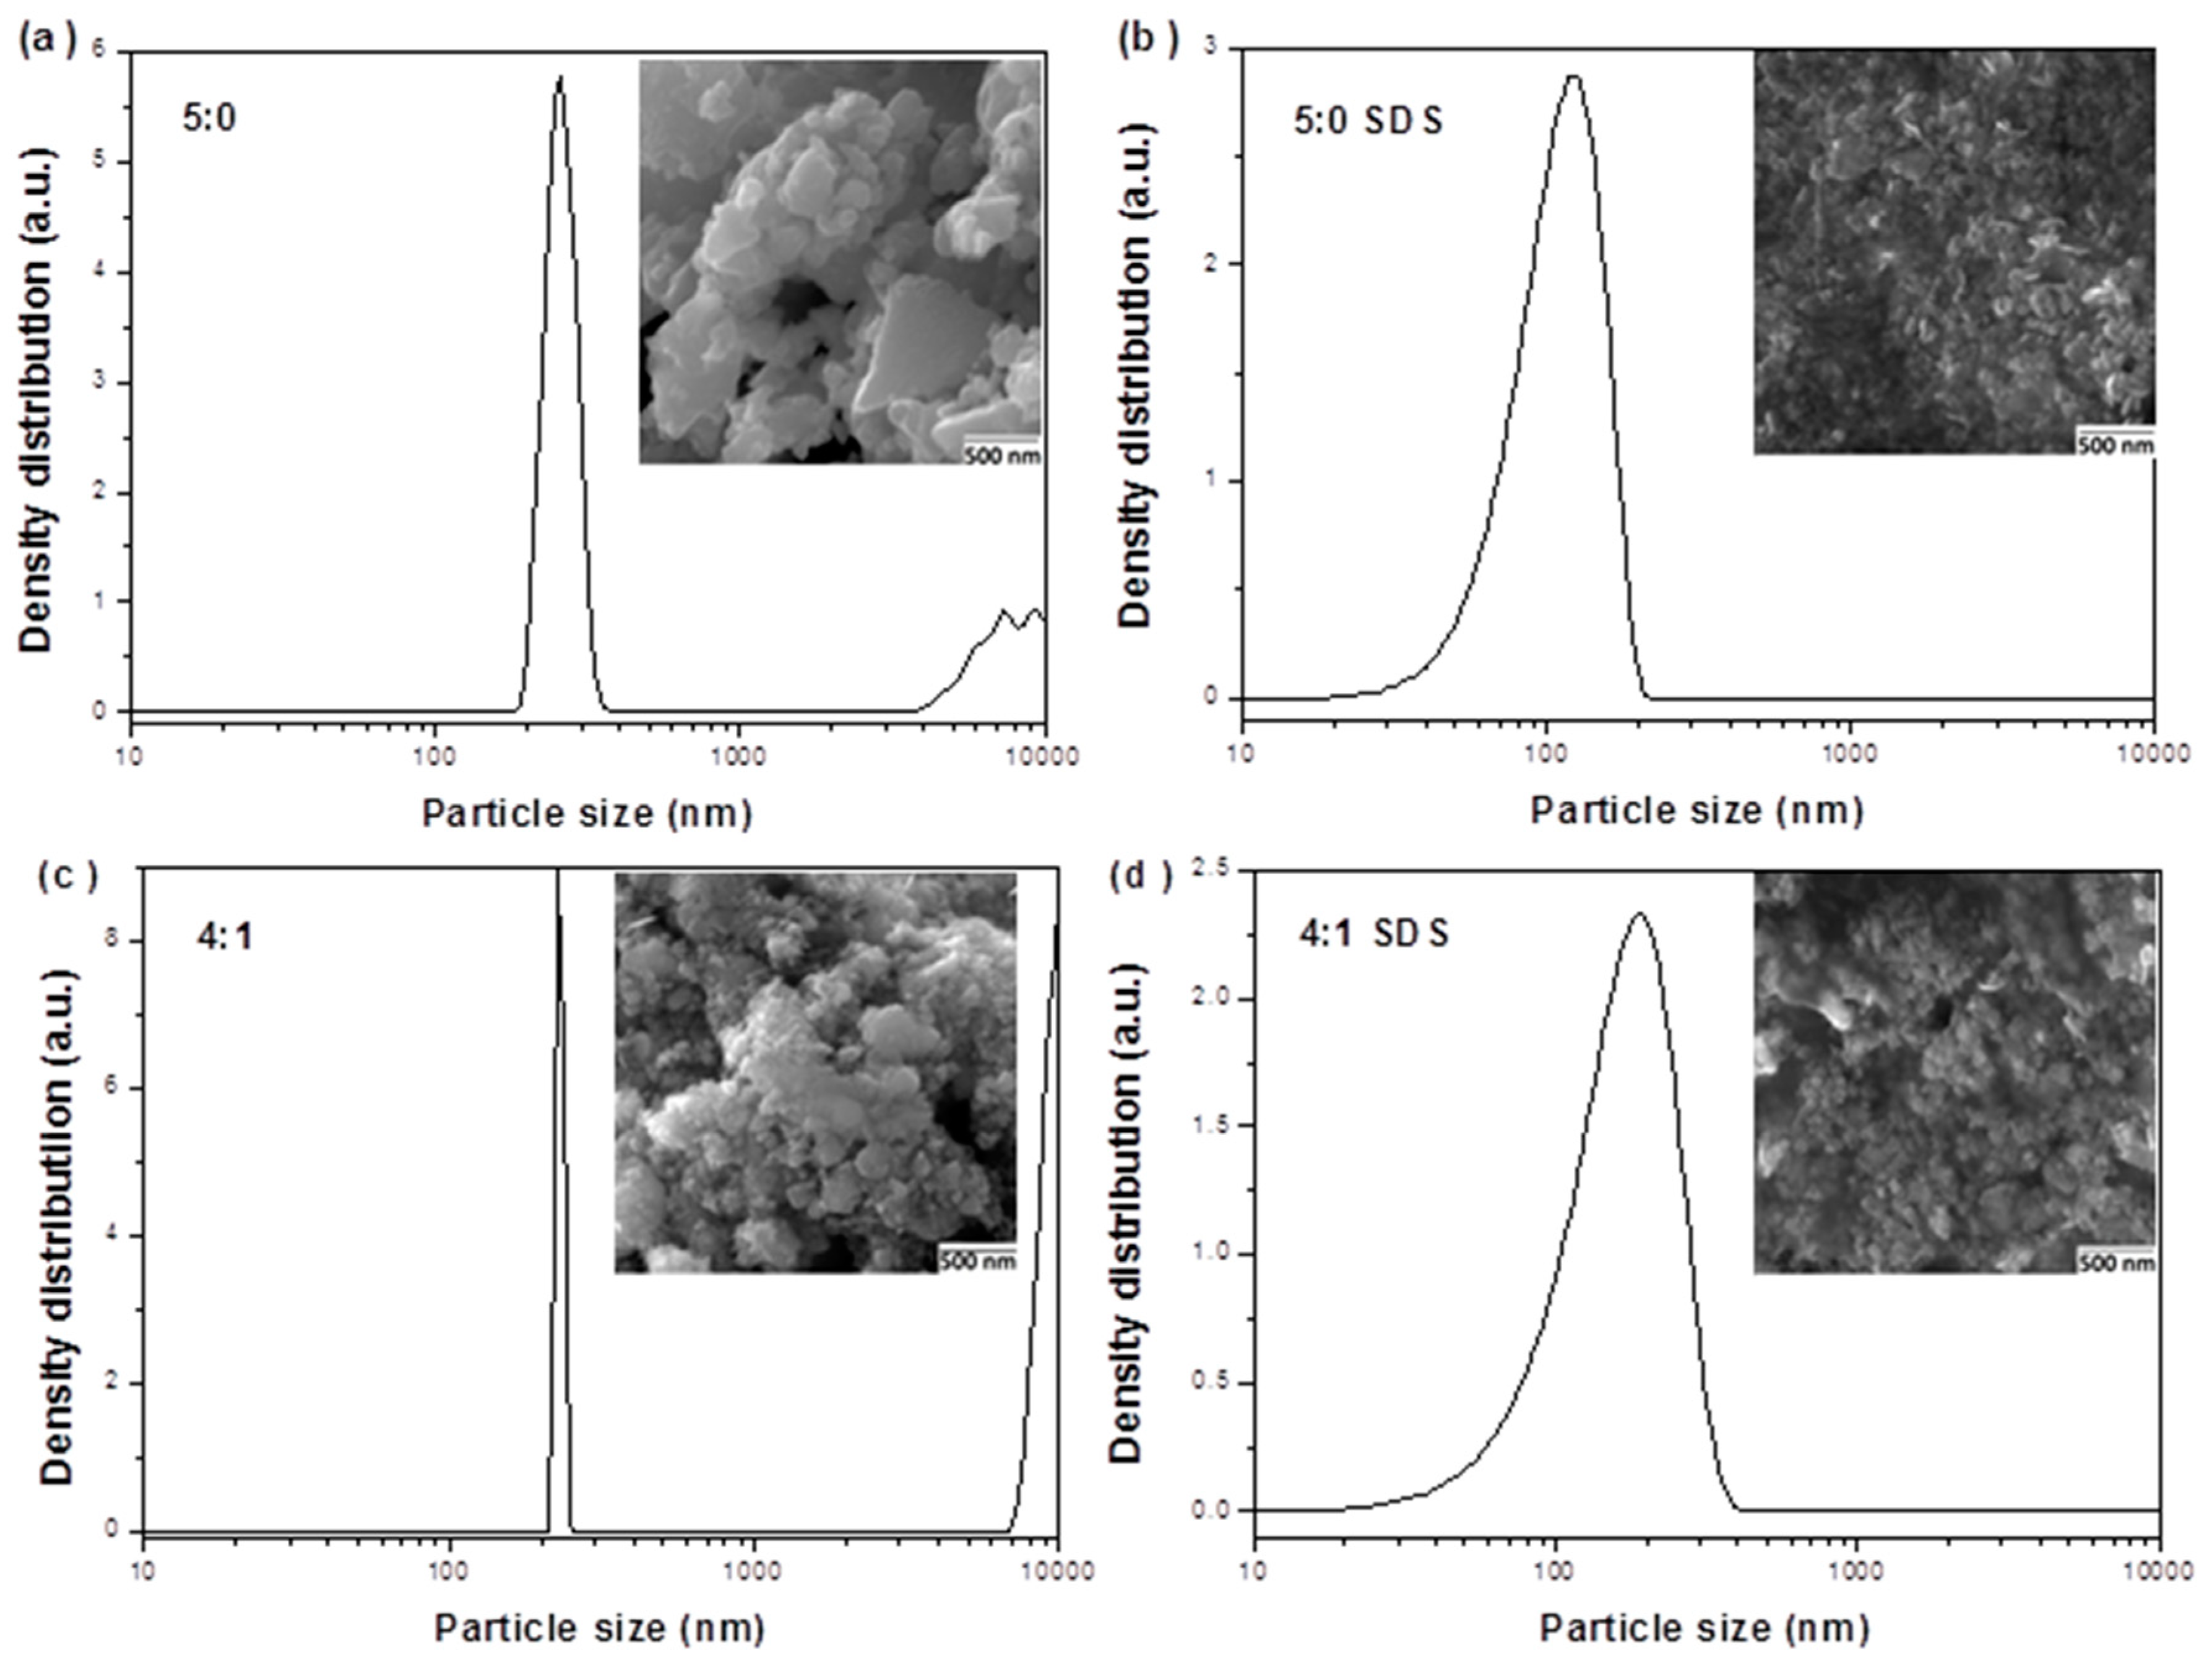
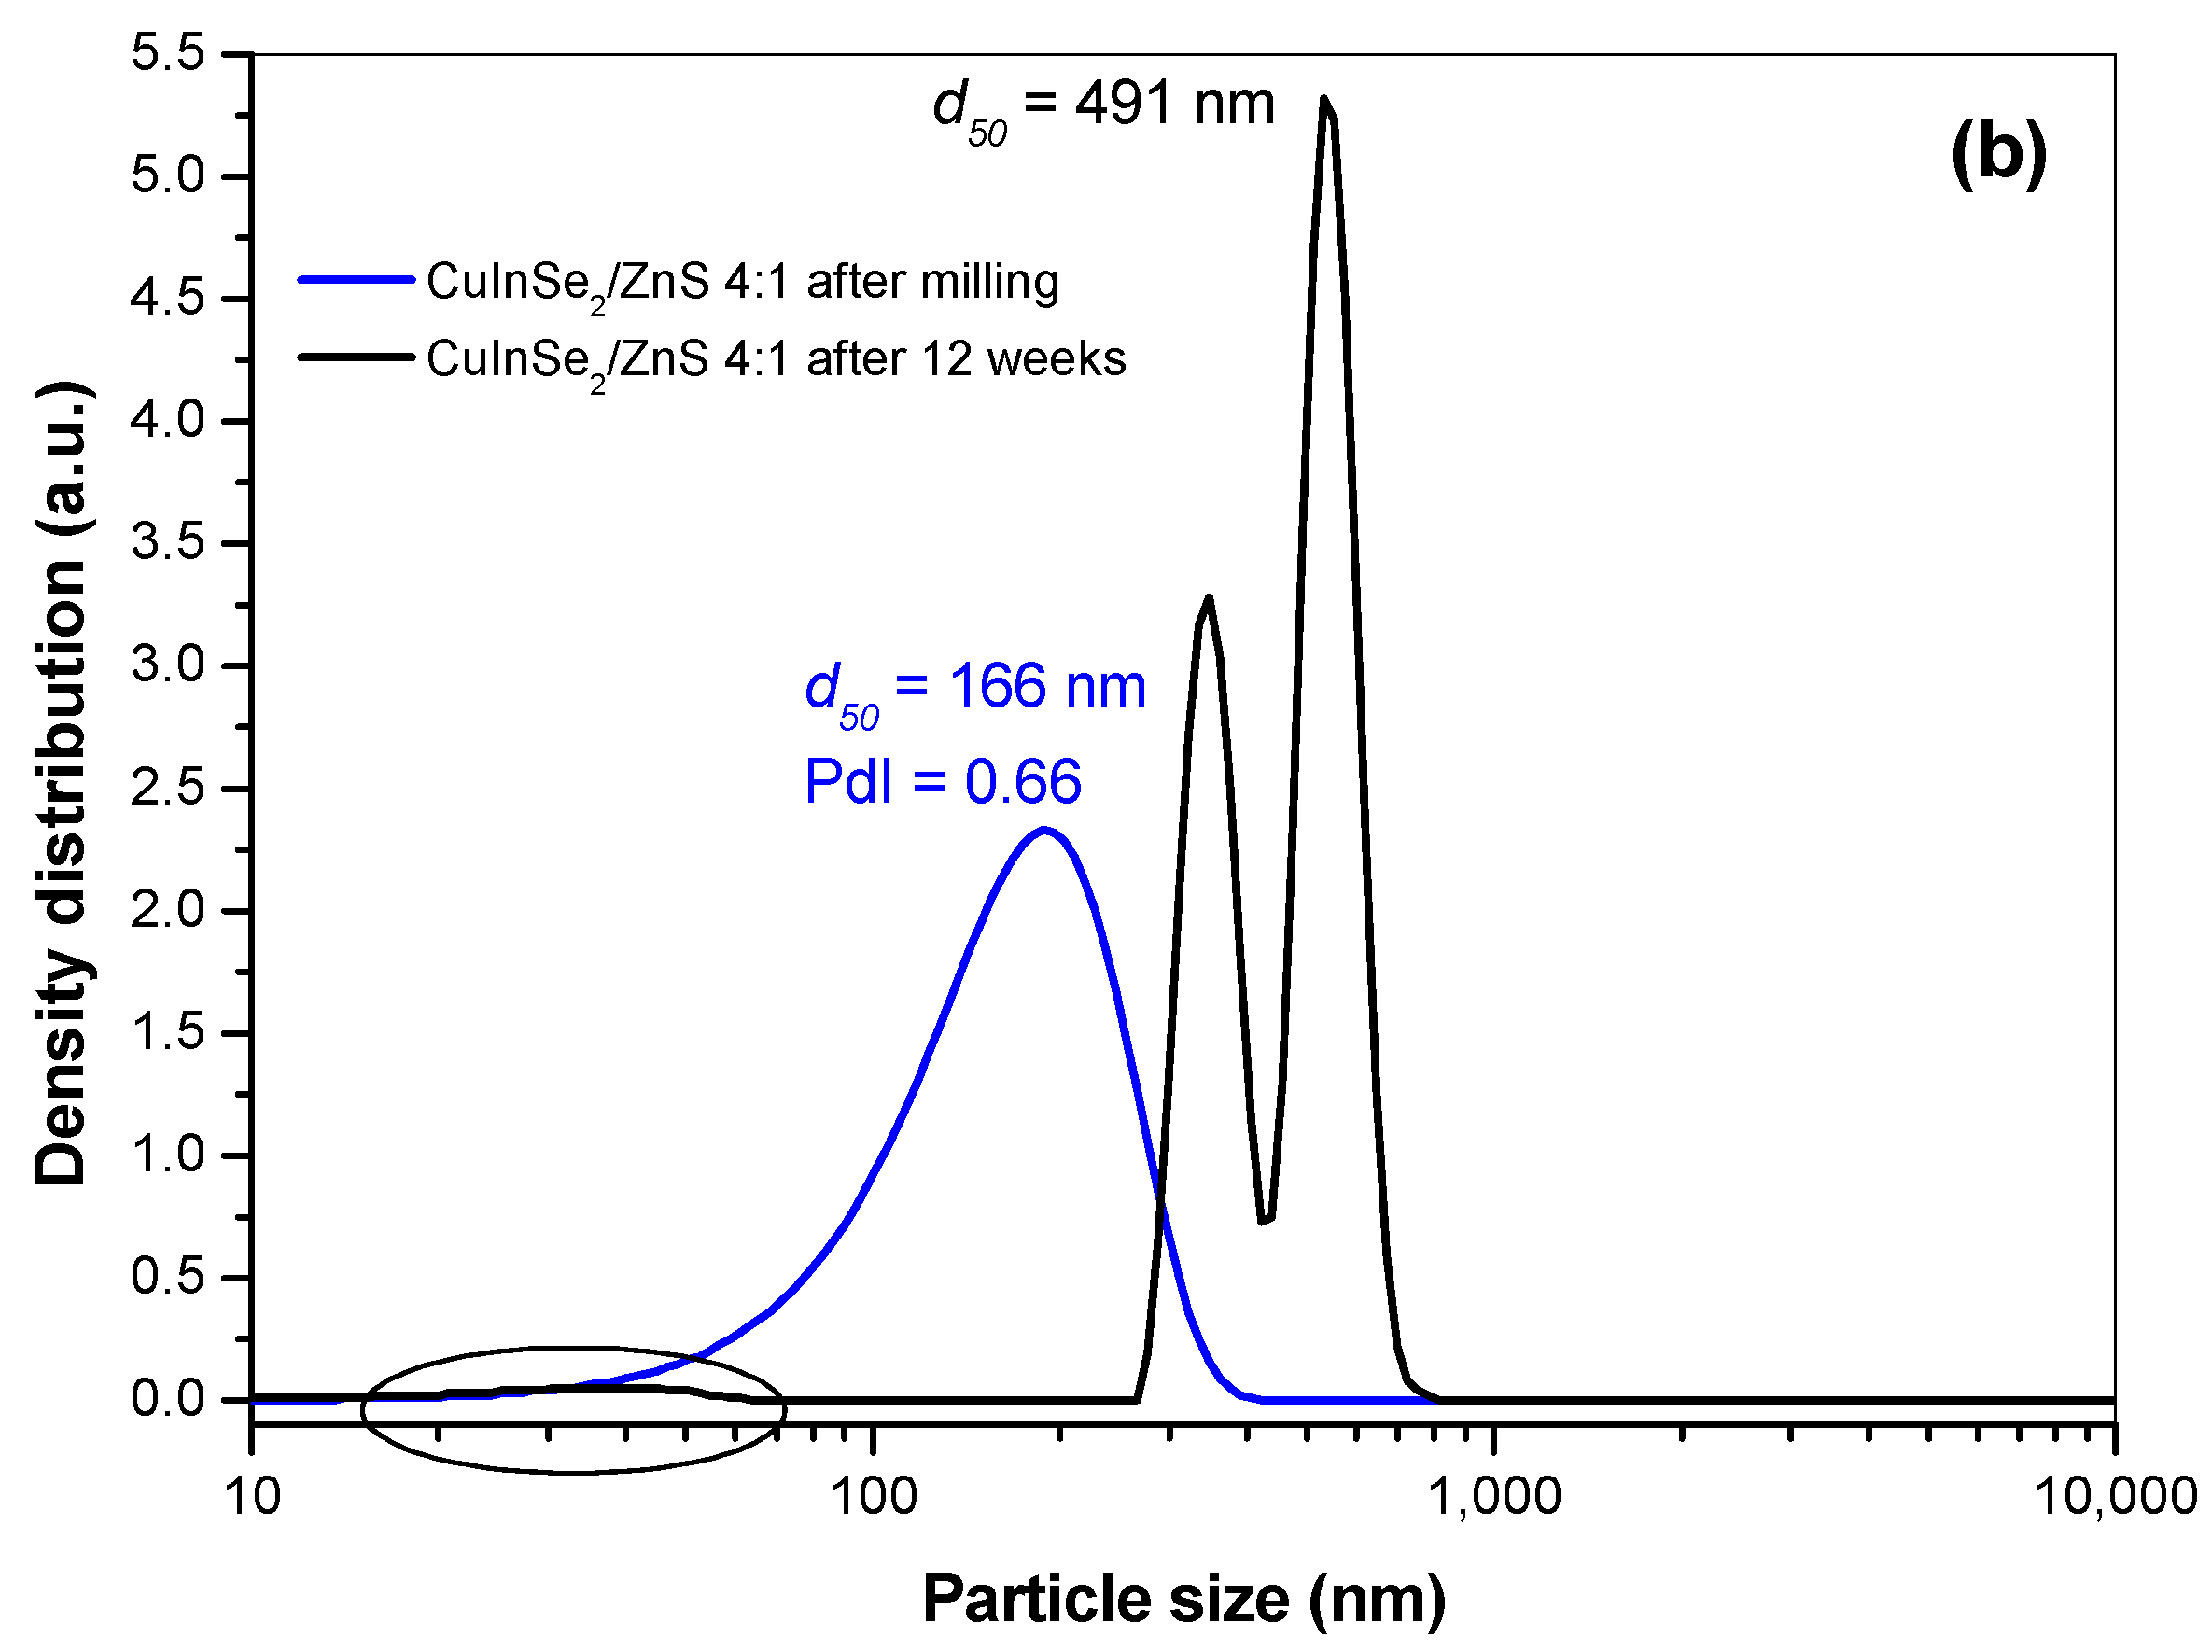
Changes in particle size distribution during such processing are displayed in Figure 9 with morphology of the samples documented by SEM micrographs in the insets. As can be seen, the particle size distributions were changed from polymodal (Figure 9a,c) to unimodal after wet milling in SDS (Figure 9b,d). The greatest particles (>1 µm) disappear after wet milling, being transformed into the finest ones (see Figure 9b,d). The SDS on the surface of these particles was sufficient to separate them and avoid aggregation. In the case of CuInSe2/ZnS 5:0 nanocrystals, the particle size median d50 was 269 nm, and after wet milling the obtained suspension was getting gradually smaller with d50 = 123 nm. The similar situation was characteristic for CuInSe2/ZnS 4:1 nanocrystals with d50 gradually dropped under wet milling (from d50 = 227 nm to d50 = 188 nm).
The above results are in accordance with representative SEM images of these samples shown as insets in Figure 9. The SEM images of CuInSe2/ZnS nanocrystals before wet milling (Figure 9a,c) manifest, that powder samples are composed of fine nanoparticles creating densely packed irregular aggregates. Besides larger micrograins, great amount of nanosized grains (200–300 nm in sizes) can be found. Noteworthy, the studied CuInSe2/ZnS-SDS samples contain also a large portion of homogeneously distributed nanocrystallites. It follows from SEM images that in the case of samples capped with SDS (CuInSe2/ZnS-SDS 5:0 and 4:1, Figure 9b,d) the particles are smaller than ones in samples without SDS (CuInSe2/ZnS 5:0 and 4:1, Figure 9a,c).
The results of ZP measurements for these MNC before and after milling in SDS are summarized in Table 1. As can be seen, both 5:0 and 4:1 samples were dispersed in distilled water have negative ZP, belonging to unstable area close to zero (−19 and −6.2 mV, respectively). Therefore, the anionic surfactant SDS was used to improve their stability. After 45 min milling of the nanocrystals in this surfactant, the ZP values were shifted to more negative ones (−41 and −39 mV, respectively), to the areas of the better stability. The obtained unimodal particle size distributions correlate very well with these ZP values.
The long-term stability of the prepared CuInSe2/ZnS-SDS nanosuspensions was also studied using respective particle size distributions measured after prolonged storage (Figure 10). It was found that CuInSe2/ZnS 5:0-SDS nanosuspension was stable for 20 weeks, whereas CuInSe2/ZnS 4:1-SDS was stable for about half time shorter (11 weeks).
This difference can be reasonably explained by deep analysis of the respective particle size distributions measured after MNC milling in surfactant (red and blue curves on Figure 9b,d and Figure 10a,b) and comparison with the calculated polydispersity index (PdI). In case of CuInSe2/ZnS 5:0-SDS nanosuspension (Figure 10a, red curve), the particle size distribution is narrower (from 20 to 200 nm) with PdI value approaching 0.53. On the other hand, the particle size distribution in CuInSe2/ZnS 4:1-SDS nanosuspension (Figure 10b, blue curve) is wider (from 10 to 400 nm) with PdI approaching 0.66. Thereby, the higher PdI, the higher polydispersity, and, consequently, the lower stability of the system. In final, this effect leads to Ostwald ripening process, where the coarse-grained particles grow at the expense of the fine-grained particles [46], which are more soluble thus allowing mass transfer towards less soluble coarse-grained particles [24]. These structural transformations result in particles aggregation (see Figure 10a,b, black curves).
To confirm interaction between CuInSe2/ZnS and SDS, the ATR-FTIR spectra (in the range of 4000–400 cm−1) of SDS and SDS capped CuInSe2/ZnS-SDS nanosuspensions were recorded (see Figure 11). The spectrum of pure SDS (Figure 11a, black) contains two major regions attributing to aliphatic group of hydrophobic tail (3000–2800 cm−1) and sulfonic acid group of hydrophilic head (1250–950 cm−1) [47]. The spectrum also exhibits characteristic bands ascribed to O–H stretching (3472 cm−1) and CH2 scissoring vibrations in hydrocarbon segment (1468 cm−1). The region 3000–2800 cm−1 is attributed to C-H stretching containing asymmetric (2957 cm−1) and symmetric (2850 cm−1) CH3 and asymmetric CH2 (2920 cm−1) vibrational modes. The region 1250–950 cm−1 is attributed to asymmetric (1220 and 1249 cm−1) and symmetric (1084 cm−1) SO2 vibrational modes [48].
After capping of CuInSe2/ZnS nanoparticles with SDS negligible shifts were detected in spectra. In the region of C–H symmetric and asymmetric stretching vibrations modes of aliphatic group of hydrophobic tail (3000–2800 cm−1 and 1468 cm−1) definitely no changes were registered. However, in S=O stretching region of the sulfonic acid group of hydrophilic head slight shifts (from 1249 to 1246 cm−1 and from 1219 to 1220 cm−1) and changes in shape of spectra were detected. Therefore, it shows that the capping could be due to negatively charged head group moieties (Figure 11b, red). Moreover, a number of references mentioning the presence of adsorption bands of SDS at similar places have been introduced [49,50,51].

3.3. Biological Activity of SDS Capped CuInSe2/ZnS 5:0 and 4:1 Nanosuspensions

3.3.1. Dissolution of Copper and Zinc from CuInSe2/ZnS Nanocrystals

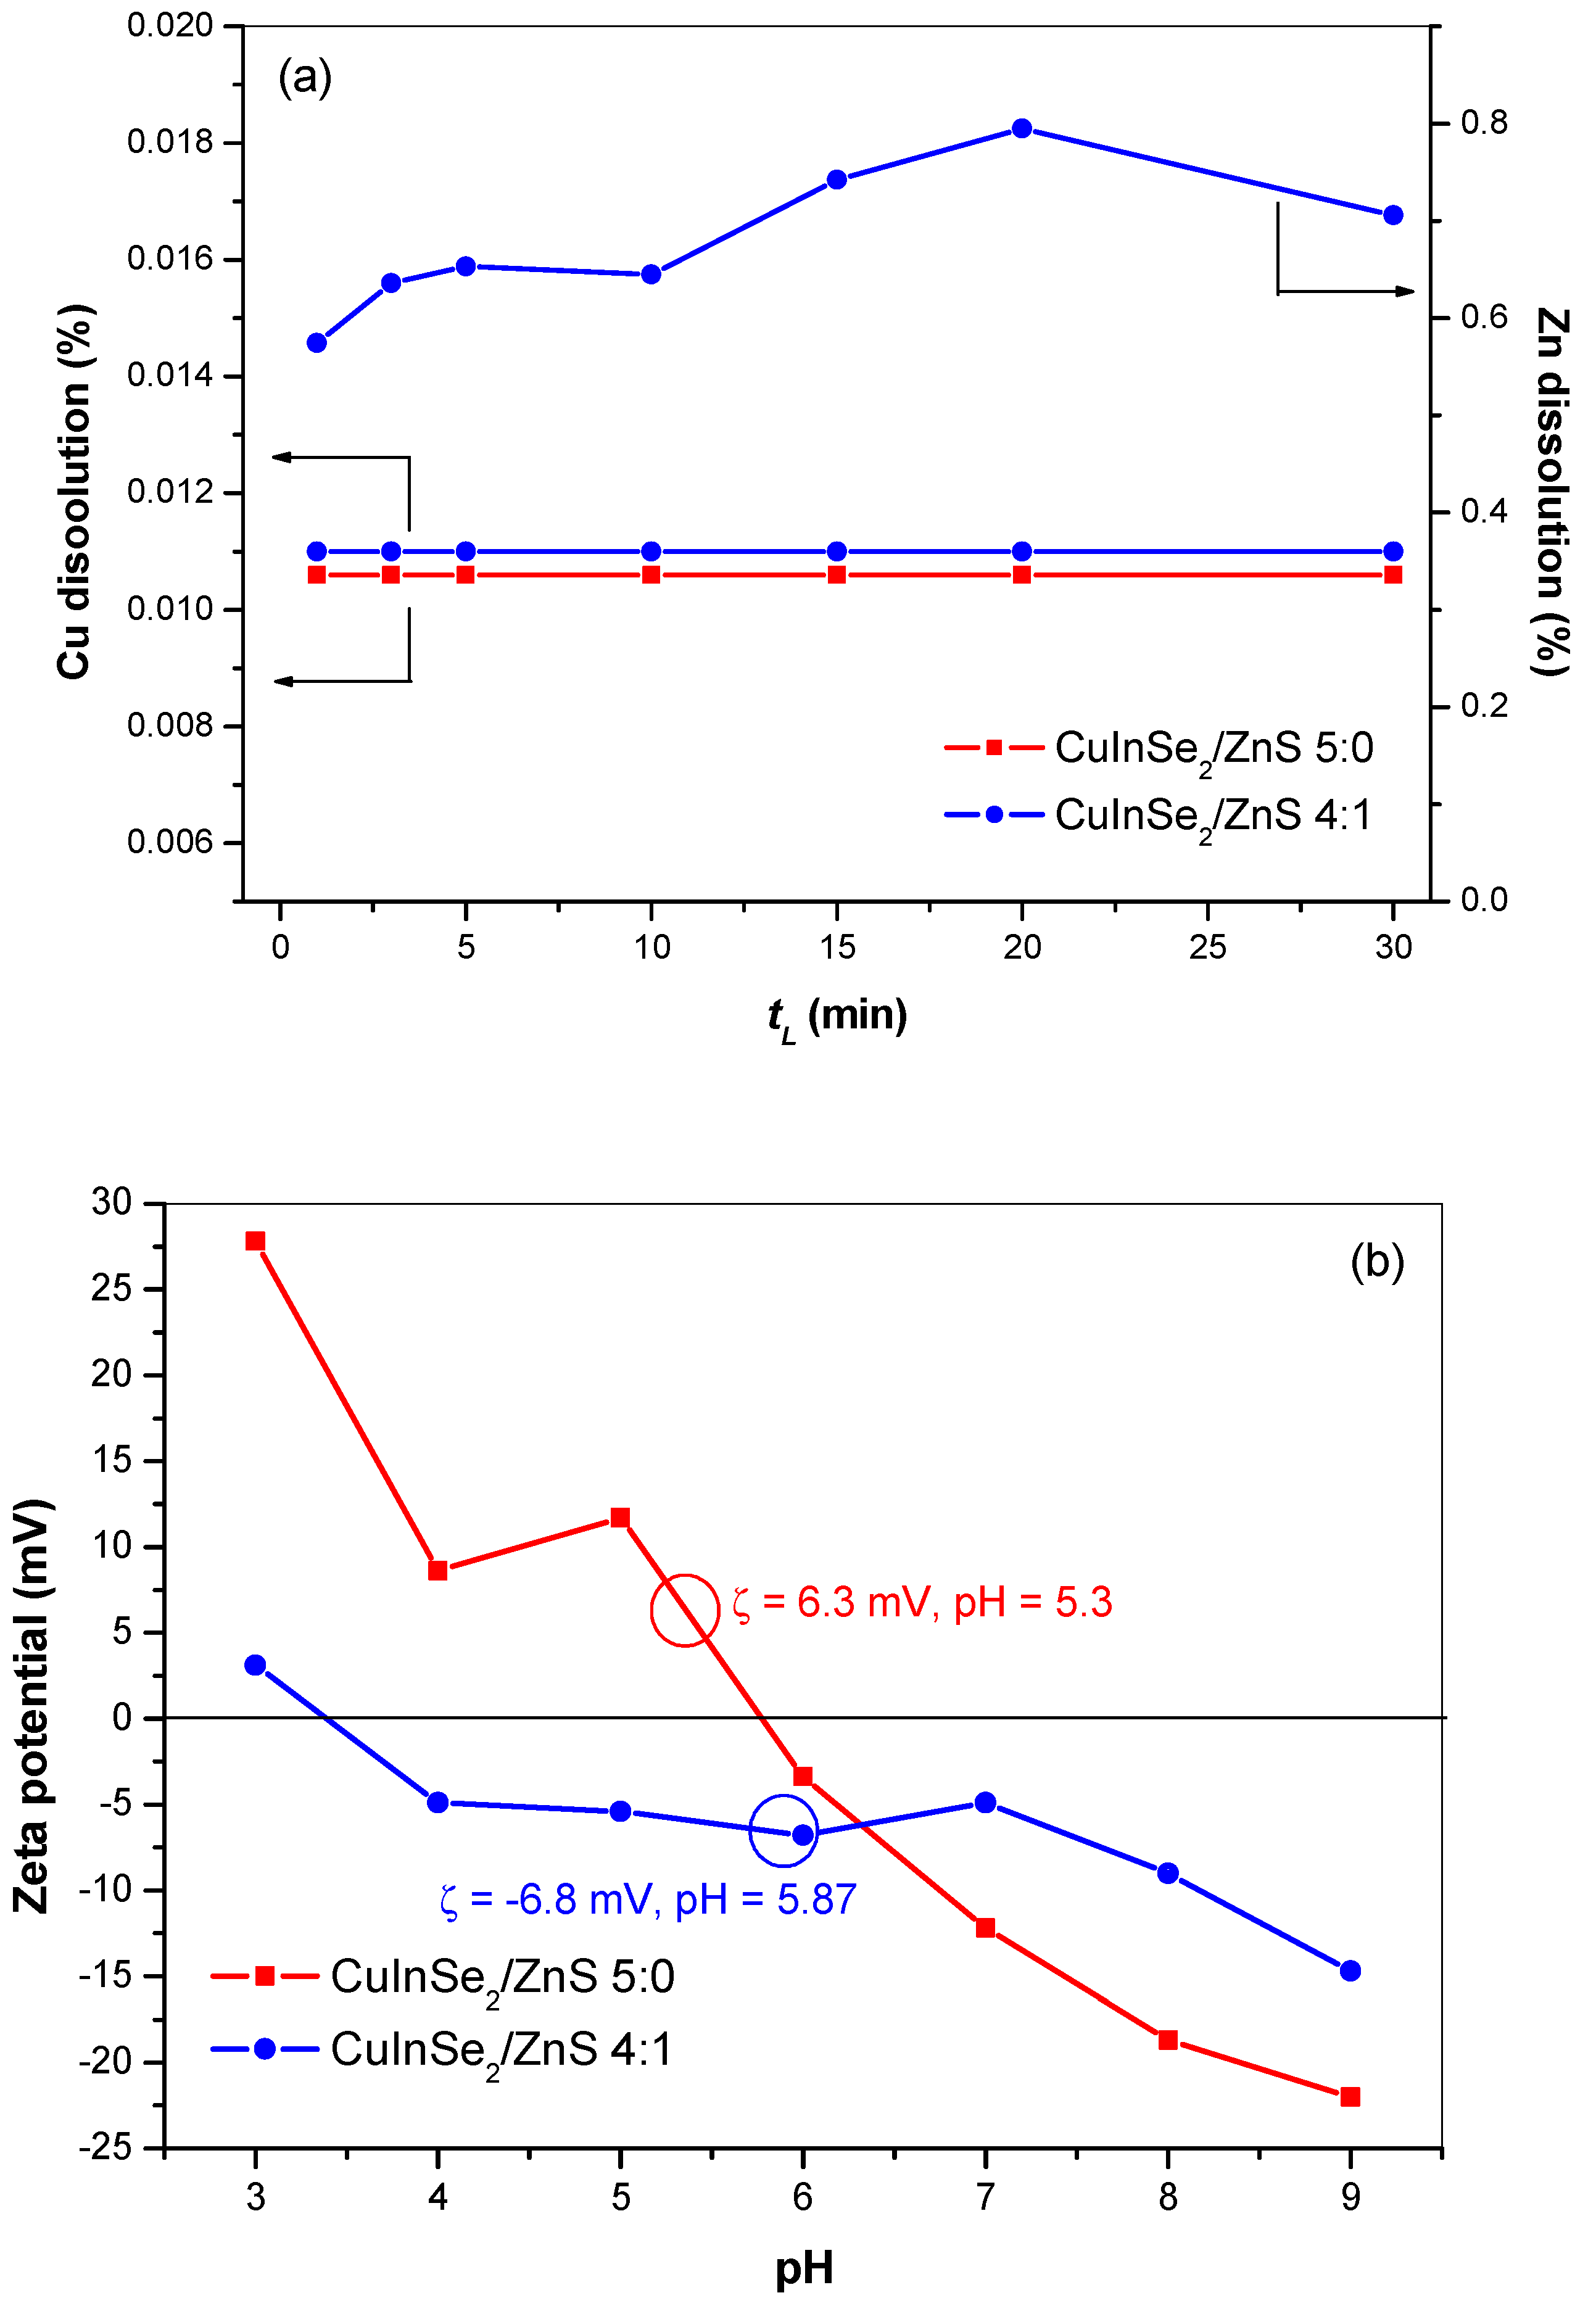
As one of possible applications of CuInSe2/ZnS MNC is their usage in nanomedicine. The results of metal (Cu and Zn) dissolution testing in CuInSe2/ZnS 5:0 and CuInSe2/ZnS 4:1 nanocrystals are presented in Figure 12. The dissolution was performed in a physiological medium (0.9% NaCl solution) at human body temperature (37 ± 0.5 °C) for 30 min. As seen, the Cu dissolution for both MNC samples is very low (~0.011%). In the case of CuInSe2/ZnS 4:1 sample, the dissolution of Zn was reached as high as 0.7% (Figure 12a). These results can be confronted with data on ZP measurements shown in Figure 12b.
For the better understanding of the differences in metals dissolution which were occurred during dissolution, we tried to explain this dissolution phenomena by means of ZP. After addition of CuInSe2/ZnS 5:0 sample into physiological medium, the pH value was 5.3 and positive ZP = 6.3 mV was detected. According to the XRPD data (Figure 3a), this sample prepared by mechanochemical route possesses chalcopyrite crystal structure, in which each S(-II) anion is tetrahedrally coordinated to two Cu(I) cations and two In(III) cations. The positive ZP value is consequence of Cu(I) and In(III) cations contribution at crystal surface. The slight Cu dissolution was obtained from the surface of a sample. However, addition of CuInSe2/ZnS 4:1 sample into the physiological medium, brings about the pH value as 5.87. Contrary to CuInSe2/ZnS 5:0 sample, the negative ZP (−6.8 mV) is obtained in this sample. Based on the SEM analysis and leaching experiments (higher Zn dissolution), we suppose the ZnS particles are on the surface or between CuInSe2 crystallites. The negative ZP is a consequence of sulfur ions excess (due to the presence of ZnS) on the surface of nanocrystals prepared by co-milling of CuInSe2 with ZnS precursors. Three possible scenarios could be realized during this process, these being surface reconstruction, interdiffusion of Zn atoms or cation exchange in the surface of CuInSe2. Therefore, the negative charge is reached, like in our previous study on CuInS2/ZnS mechanosynthesis [43].

3.3.2. Cytotoxicity of CuInSe2/ZnS 5:0-SDS and CuInSe2/ZnS 4:1-SDS Nanosuspensions

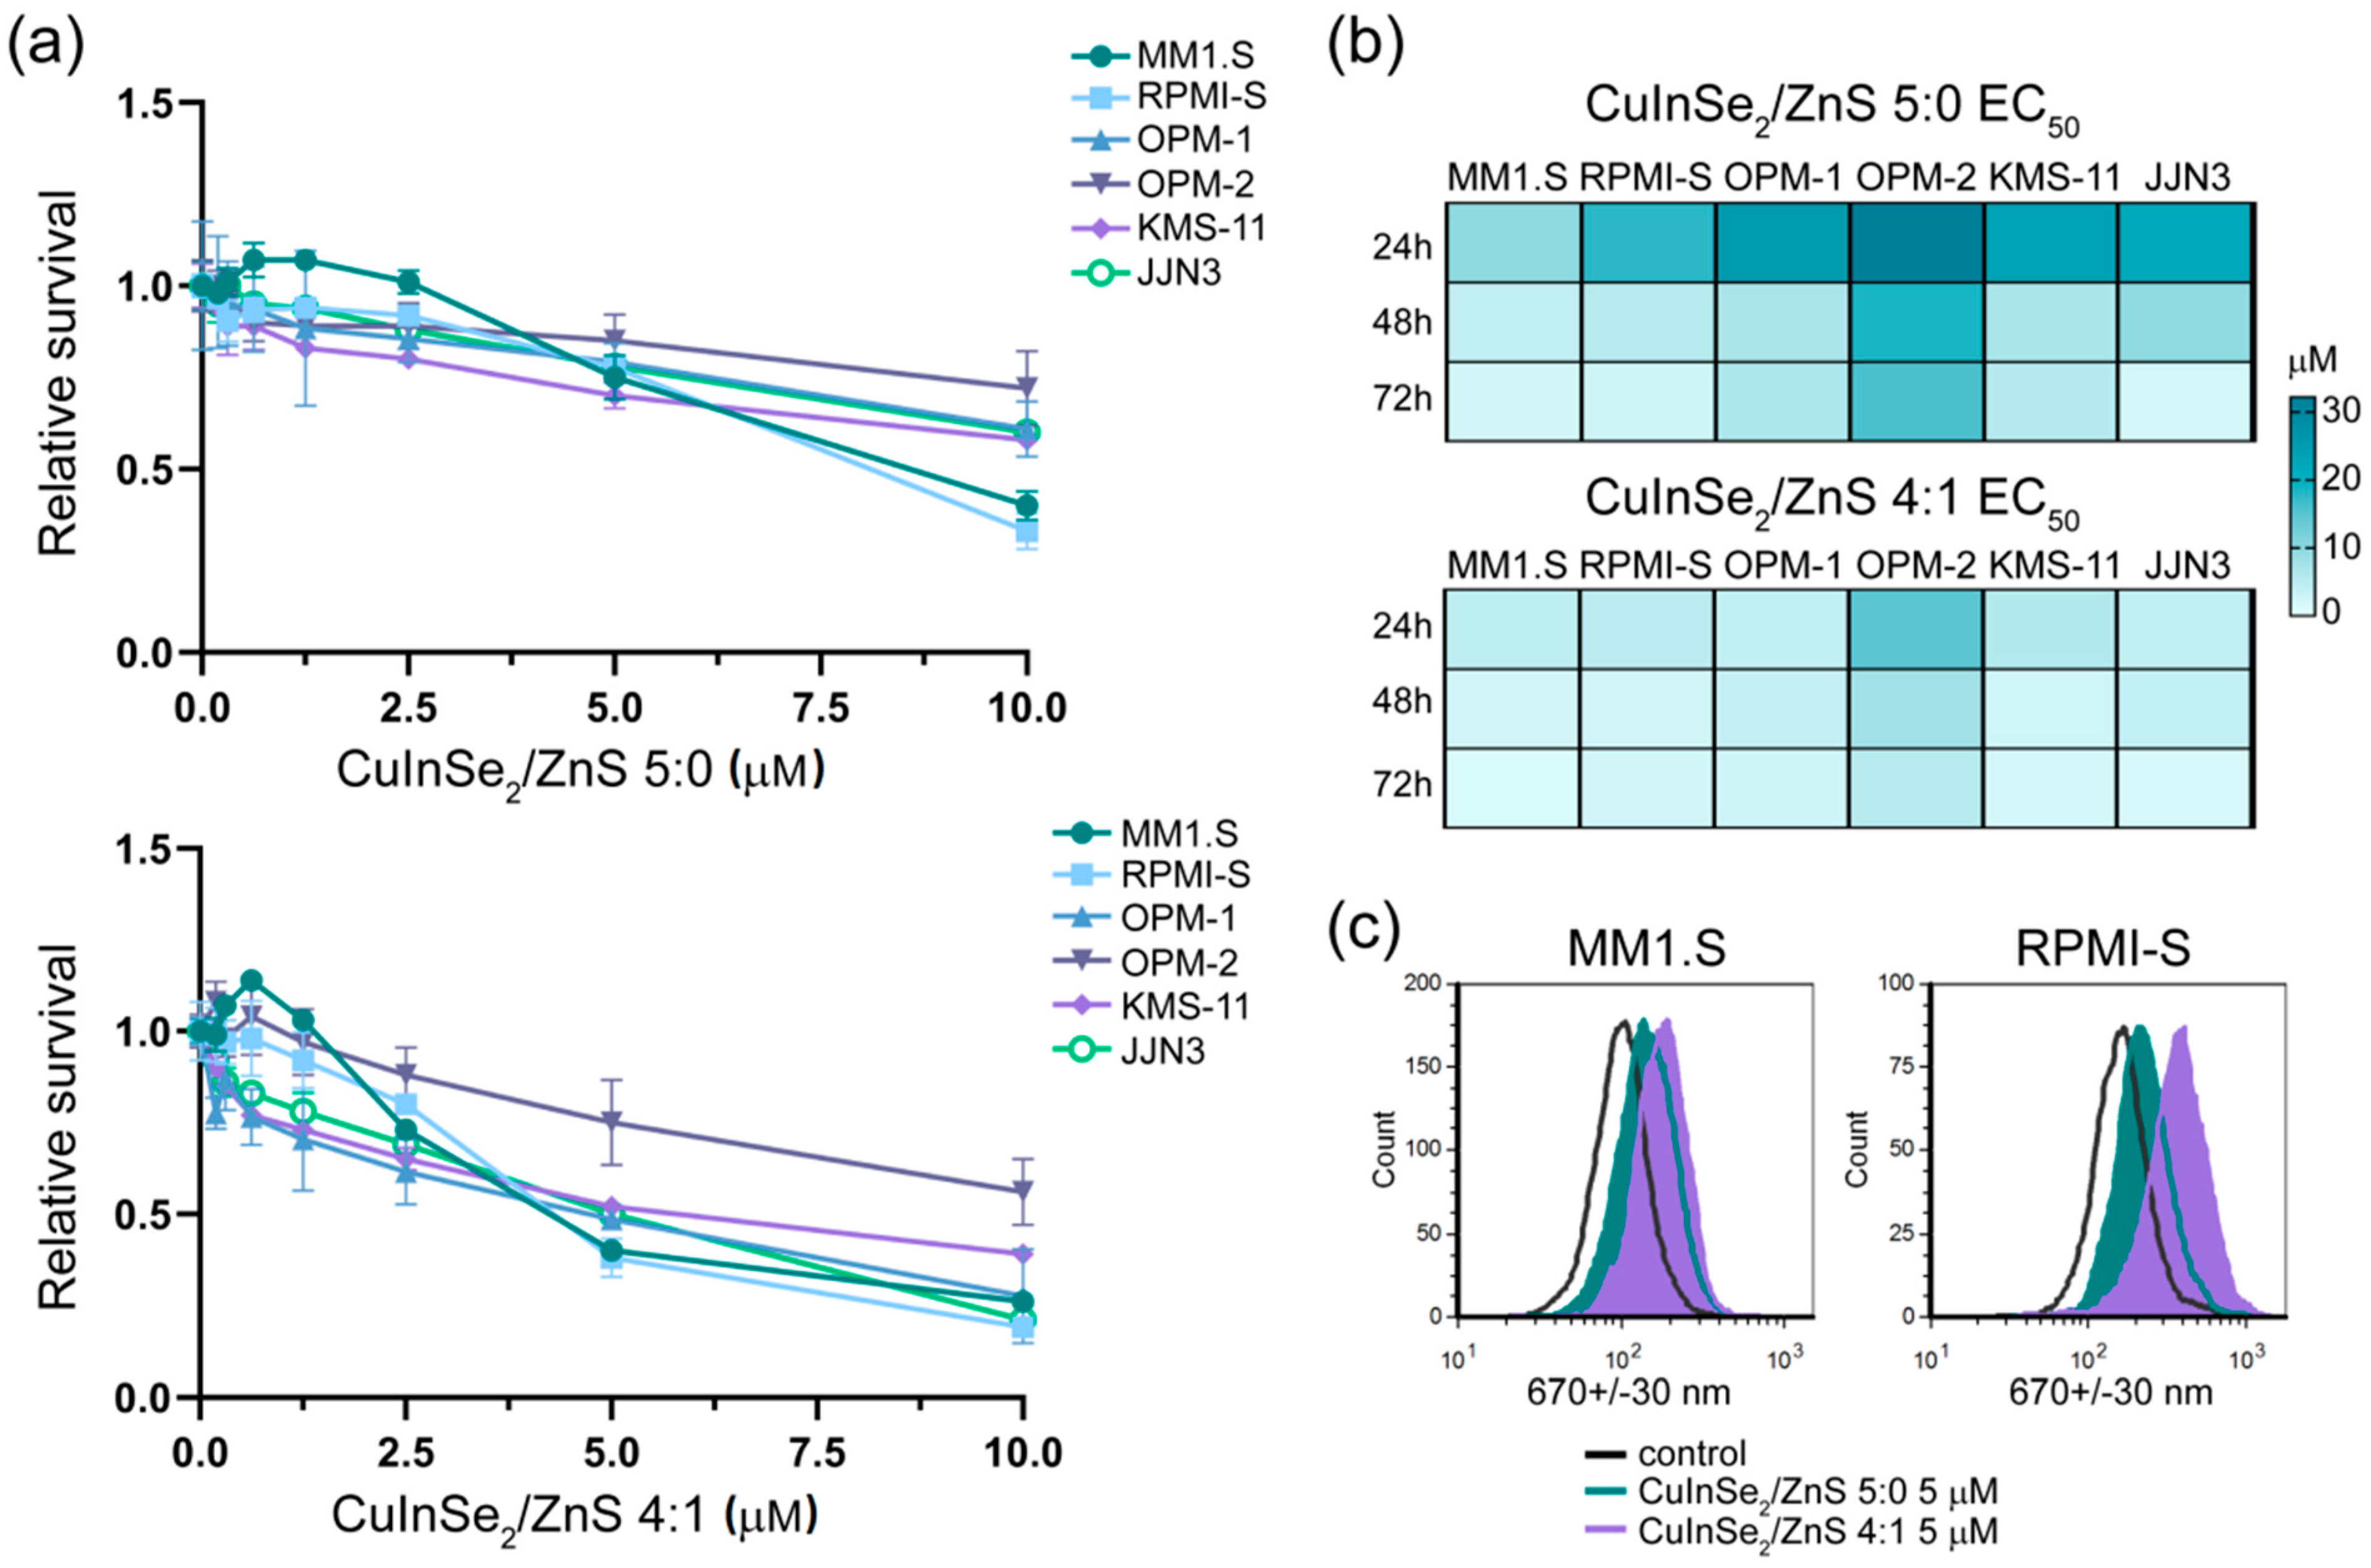
To evaluate cytotoxic effects of composite nanoparticles, six MM cell lines (in part, MM.1S, RPMI-S, OPM-1, OPM-2, KMS-11 and JJN3) were treated by CuInSe2/ZnS 5:0-SDS and CuInSe2/ZnS 4:1-SDS nanosuspensions (1–10 μmol/L) and cell survival was determined by MTT assay. For 24 h, the stronger anti-MM cytotoxic effect was achieved with CuInSe2/ZnS 4:1-SDS nanosuspension (see Figure 13a). The concentration- and time-dependent reduced cell viability was observed by EC50 value (the concentration reducing cell survival by 50%) for both nanosuspensions for 24 h, 48 h and 72 h by the CalcuSyn software (Figure 13b). Similarly, the higher cytotoxic effects on MM cell lines were determined by CuInSe2/ZnS 4:1-SDS nanosuspension. The effect was two to six times and one to three times stronger at 24 h and 48/72 h, respectively, as compared to CuInSe2/ZnS 5:0-SDS nanosuspension. Comparing MM cell lines, the anti-MM sensitizing potential was similar on all tested MM cell lines with exception of OPM-2 cells which were more resistant to both samples and OPM-1 cells which were also resistant to CuInSe2/ZnS 5:0-SDS nanosuspension. This finding is in accordance with previous data determining more resistant effect of As4S4 nanoparticles on OPM-2 cells in comparison with other MM cells [52]. In summary, both CuInSe2/ZnS-SDS nanosuspensions show cytotoxic potential, with stronger anti-MM effect caused by CuInSe2/ZnS 4:1-SDS nanosuspension.
To confirm fluorescent activity of the MNC, we evaluate the fluorescent intensity of both CuInSe2/ZnS-SDS samples in viable MM cells (MM1.S and RPMI-S) by flow cytometry (Figure 13c). These samples show significant shift in fluorescence intensity determined by violet laser excitation and emission of 670+/−30 nm wavelength, whereas stronger fluorescence is determined by CuInSe2/ZnS 4:1 MNC. This observation not only proves MNC localization inside viable cells, but also supports idea of their usage as imaging agents or labeled quantum dots in biomedical applications as drug carriers at lower (not cytotoxic) concentrations.

4. Conclusions

Within this work, the synthesis of CuInSe2/ZnS multiparticulate nanocomposites by milling in a planetary ball mill via simple solid-state approach is first reported. The sodium dodecyl sulphate capped CuInSe2/ZnS nanosuspensions were prepared by wet stirred media milling to obtain stable suspensions suitable for bioimaging applications. However, it was not possible to prepare stable SDS capped CuInSe2/ZnS 1:4 nanosuspension. Therefore, only SDS capped CuInSe2/ZnS 5:0 and 4:1 nanosuspenions were further characterized. The CuInSe2/ZnS 5:0-SDS nanosuspension was shown to be stable for 20 weeks, whereas the CuInSe2/ZnS 4:1-SDS one was stable for about 11 weeks. After SDS capping, unimodal particle size distribution was obtained with particle sizes medians approaching, respectively, 123 nm and 188 nm for CuInSe2/ZnS 5:0-SDS and CuInSe2/ZnS 4:1-SDS nanocomposites. Successful stabilization of the prepared nanosuspensions due to SDS covering the surface of the nanocomposite particles was confirmed by zeta potential measurements. The prepared CuInSe2/ZnS 5:0-SDS and CuInSe2/ZnS 4:1-SDS nanosuspensions possessed anti-myeloma sensitizing potential assessed by significantly reduced viability of multiple myeloma cell lines, with efficient fluorescence inside viable cells and higher cytotoxic efficacy in CuInSe2/ZnS 4:1-SDS nanosuspension.

Author Contributions

Conceptualization, E.D.; methodology, E.D., Z.L.B., O.S., J.J., D.C., V.Š., N.D., M.B., J.K., J.K.J., and P.D.; investigation, E.D., Z.L.B., O.S., J.J., D.C., V.Š., N.D., M.B., J.K., J.K.J., J.B. and P.D.; visualization, E.D., Z.L.B., O.S., J.J., N.D., M.B., J.K., J.K.J., J.B. and P.D.; writing–original draft preparation, E.D., Z.L.B. and O.S.; writing–review and editing, Z.L.B., O.S., J.J., N.D., M.B. and J.K. All authors have read and agreed to the published version of the manuscript.

Funding

This research was funded by Research and Development Agency, grant number 18-0357 and also by Scientific Grant Agency of the Ministry of Education, Science, Research and Sport of the Slovak Republic and Slovak Academy of Sciences, grant numbers 2/0065/18, 2/0044/18 and 1/733/20. This research was also realized within the frame of the project “Research Centre of Advanced Materials and Technologies for Recent and Future Applications PROMATECH”, ITMS 26220220186, supported by the Operational Program “Research and Development” financed through European Regional Development Fund. N.D. acknowledges financial support of the Slovenian Research Agency within the program no. P2-0091.

Conflicts of Interest

The authors declare no conflict of interest. The funders had no role in the design of the study; in the collection, analyses, or interpretation of data; in the writing of the manuscript, or in the decision to publish the results.

References

  1. Vollath, D. Nanomaterials: An Introduction to Synthesis, Properties and Applications, 2nd ed.; Wiley-VCH Verlag GmbH: Weinheim, Germany, 2013. [Google Scholar]
  2. Chuang, P.H.; Lin, C.C.; Liu, R.S. Emission-Tunable CuInS2/Zns Quantum Dots: Structure, Optical Properties, and Application in White Light-Emitting Diodes with High Color Rendering Index. ACS Appl. Mater. Interfaces 2014, 6, 15379–15387. [Google Scholar] [CrossRef] [PubMed]
  3. Kang, F.; Ao, J.P.; Sun, G.Z.; He, Q.; Sun, Y. Structure and Photovoltaic Characteristics of CuInSe2 Thin Films Prepared by Pulse-Reverse Electrodeposition and Selenization Process. J. Alloys Compd. 2009, 478, L25–L27. [Google Scholar] [CrossRef]
  4. Jiang, D.X.; Cao, L.X.; Su, G.; Liu, W.; Qu, H.; Sun, Y.G.; Dong, B.H. Shell Thickness Dependence of Luminescence Intensity in Core/Shell ZnS:Mn/ZnS Nanoparticles. Mater. Chem. Phys. 2009, 115, 795–798. [Google Scholar] [CrossRef]
  5. Fang, X.S.; Zhai, T.Y.; Gautam, U.K.; Li, L.; Wu, L.M.; Yoshio, B.; Golberg, D. ZnS Nanostructures: From Synthesis to Applications. Prog. Mater Sci. 2011, 56, 175–287. [Google Scholar] [CrossRef]
  6. Liu, X.Y.; Braun, G.B.; Zhong, H.Z.; Hall, D.J.; Han, W.L.; Qin, M.D.; Zhao, C.Z.; Wang, M.N.; She, Z.G.; Cao, C.B.; et al. Tumor-Targeted Multimodal Optical Imaging with Versatile Cadmium-Free Quantum Dots. Adv. Funct. Mater. 2016, 26, 267–276. [Google Scholar] [CrossRef] [PubMed]
  7. Park, J.; Dvoracek, C.; Lee, K.H.; Galloway, J.F.; Bhang, H.E.C.; Pomper, M.G.; Searson, P.C. CuInSe2/ZnS Core/Shell NIR Quantum Dots For Biomedical Imaging. Small 2011, 7, 3148–3152. [Google Scholar] [CrossRef] [Green Version]
  8. Yarema, O.; Bozyigit, D.; Rousseau, I.; Nowack, L.; Yarema, M.; Heiss, W.; Wood, V. Highly Luminescent, Size- and Shape-Tunable Copper Indium Selenide Based Colloidal Nanocrystals. Chem. Mater. 2013, 25, 3753–3757. [Google Scholar] [CrossRef]
  9. Lian, W.; Tu, D.; Hu, P.; Song, X.; Gong, Z.; Chen, T.; Song, J.; Chen, Z.; Chen., X. Broadband Excitable NIR-II Luminescent Nano-Bioprobes Based on CuInSe2 Quantum Dots for the Detection of Circulating Tumor Cells. NanoToday 2020, 35, 100943. [Google Scholar] [CrossRef]
  10. Abdullah, H.; Habibi, S. Effect Of Annealing Temperature on CuInSe2/Zns Thin-Film Solar Cells Fabricated by using Electron Beam Evaporation. Int. J. Photoenergy 2013, 2013, 1–5. [Google Scholar] [CrossRef]
  11. Kang, X.J.; Yang, Y.C.; Huang, L.J.; Tao, Y.; Wang, L.; Pan, D.C. Large-Scale Synthesis of Water-Soluble CuInSe2/ZnS and AgInSe2/ZnS Core/Shell Quantum Dots. Green. Chem. 2015, 17, 4482–4488. [Google Scholar] [CrossRef]
  12. Li, W.J.; Pan, Z.X.; Zhong, X.H. CuInSe2 and CuInSe2-ZnS Based High Efficiency “Green” Quantum Dot Sensitized Solar Cells. J. Mater. Chem. A 2015, 3, 1649–1655. [Google Scholar] [CrossRef]
  13. Zhong, H.Z.; Wang, Z.B.; Bovero, E.; Lu, Z.H.; Van Veggel, F.C.J.M.; Scholes, G.D. Colloidal CuInSe2 Nanocrystals in the Quantum Confinement Regime: Synthesis, Optical Properties, and Electroluminescence. J. Mater. Chem. C 2011, 115, 12396–12402. [Google Scholar] [CrossRef]
  14. Mazing, D.S.; Karmanov, A.A.; Matyushkin, L.B.; Aleksandrova, O.A.; Pronin, I.A.; Moshnikov, V.A. Synthesis and Characterization of CuInSe2 Core–Shell Quantum Dots. Glass Phys. Chem 2016, 42, 497–504. [Google Scholar] [CrossRef]
  15. Bujňáková, Z.; Baláž, M.; Dutková, E.; Baláž, P.; Kello, M.; Mojžišová, G.; Mojžiš, J.; Vilková, M.; Imrich, J.; Psotka, M. Mechanochemical Approach for the Capping of Mixed Core CdS/ZnS Nanocrystals: Elimination of Cadmium Toxicity. J. Colloid Interface Sci. 2017, 486, 97–111. [Google Scholar] [CrossRef] [PubMed]
  16. Bujňáková, Z.; Baláž, M.; Zdurienčiková, M.; Sedlák, J.; Čaplovičová, M.; Čaplovič, L.; Dutková, E.; Zorkovská, A.; Turianicová, E.; Baláž, P.; et al. Preparation, Properties and Anticancer Effects of Mixed As4S4/ZnS Nanoparticles Capped by Poloxamer 407. Mater. Sci. Eng. C Mater. Biol. Appl. 2017, 71, 541–551. [Google Scholar] [CrossRef]
  17. Bujňáková, Z.; Dutková, E.; Zorkovská, A.; Baláž, M.; Kováč, J.; Kello, M.; Mojžiš, J.; Briančin, J.; Baláž, P. Mechanochemical Synthesis and in Vitro Studies of Chitosan-Coated InAs/Zns Mixed Nanocrystals. J. Mater. Sci. 2017, 52, 721–735. [Google Scholar] [CrossRef]
  18. Kelly, M.A.; Altria, K.D.; Clark, B.J. Quantitative Analysis of Sodium Dodecyl Sulphate by Capillary Electrophoresis. J. Chromatogr. A 1997, 781, 67–71. [Google Scholar] [CrossRef]
  19. Liu, Y.; Guo, R. Interaction Between Casein and Sodium Dodecyl Sulfate. J. Colloid Interface Sci. 2007, 315, 685–692. [Google Scholar] [CrossRef]
  20. Raymond, C.; Rowe, P.J.S.; Marian, E. Quinn Handbook of Pharmaceutical Excipients, 6th ed.; Pharmaceutical Press and American Pharmacists Association: Washington, DC, USA, 2009. [Google Scholar]
  21. Niraula, T.P.; Bhattarai, A.; Chatterjee, S.K. Sodium Dodecylsulphate: A Very Useful Surfactant for Scientific Investigations. J. Knowl. Innov. 2014, 2, 111–113. [Google Scholar]
  22. Bujňáková, Z.; Dutková, E.; Kello, M.; Mojžiš, J.; Baláž, M.; Baláž, P.; Shpotyuk, O. Mechanochemistry of Chitosan-Coated Zinc Sulfide (ZnS) Nanocrystals for Bio-Imaging Applications. Nanoscale Res. Lett. 2017, 12, 1–9. [Google Scholar] [CrossRef] [Green Version]
  23. Bujňáková, Z.; Dutková, E.; Baláž, M.; Turianicová, E.; Baláž, P. Stability Studies of As4S4 Nanosuspension Prepared by Wet Milling in Poloxamer 407. Int. J. Pharm. 2015, 478, 187–192. [Google Scholar] [CrossRef] [PubMed]
  24. Liu, P.; Rong, X.Y.; Laru, J.; Van Veen, B.; Kiesvaara, J.; Hirvonen, J.; Laaksonen, T.; Peltonen, L. Nanosuspensions of Poorly Soluble Drugs: Preparation and Development by Wet Milling. Int. J. Pharm. 2011, 411, 215–222. [Google Scholar] [CrossRef] [PubMed]
  25. Li, M.; Zhang, L.; Dave, R.N.; Bilgili, E. An Intensified Vibratory Milling Process for Enhancing the Breakage Kinetics During the Preparation of Drug Nanosuspensions. AAPS PharmsSciTech 2016, 17, 389–399. [Google Scholar] [CrossRef] [PubMed] [Green Version]
  26. Lukáčová Bujňáková, Z.; Shpotyuk, O.; Syvorotka, I., Jr.; Demchenko, P.; Dutková, E.; Tóthová, E.; Bártová, Z. Preparation and Characterization of Stable Fluorescent As4S4/ZnS/Fe3O4 Nanosuspension Capped by Poloxamer 407 and Folic Acid. Appl. Nanosci. 2020, 10, 4651–4660. [Google Scholar] [CrossRef]
  27. Dutková, E.; Sayagues, M.J.; Kováč, J.; Kováč, J.; Bujňáková, Z.; Briančin, J.; Zorkovská, A.; Baláž, P.; Ficeriová, J. Mechanochemically Synthesized Nanocrystalline Ternary CuInSe2 Chalcogenide Semiconductor. Mater. Lett. 2016, 173, 182–186. [Google Scholar] [CrossRef]
  28. Baláž, P.; Boldižárová, E.; Godočíková, E.; Briančin, J. Mechanochemical Route for Sulphide Nanoparticles Preparation. Mater. Lett. 2003, 57, 1585–1589. [Google Scholar] [CrossRef]
  29. Dutková, E.; Baláž, P.; Pourghahramani, P.; Velumani, S.; Ascencio, J.A.; Kostová, N.G. Properties of Mechanochemically Synthesized ZnS Nanoparticles. J. Nanosci. Nanotechnol. 2009, 9, 6600–6605. [Google Scholar] [CrossRef] [Green Version]
  30. STOE WinXPOW. Software Manual, Version 3.03; Stoe & Cie GmbH: Darmstadt, Germany, 2010.
  31. Kraus, W.; Nolze, G. Powder Cell—A Program for the Representation and Manipulation of Crystal Structures and Calculation of the Resulting X-Ray Powder Patterns. J. Appl. Crystallogr. 1996, 29, 301–303. [Google Scholar] [CrossRef]
  32. Kraus, W.; Nolze, G. PowderCell for Windows, Version 2.4; Federal Institute for Materials Research and Testing: Berlin, Germany, 2000.
  33. Downs, R.T.; Hall-Wallace, M. The American Mineralogist Crystal Structure Database. Am. Mineral. 2003, 88, 247–250. [Google Scholar]
  34. Rodriguez-Carvajal, J. Recent Developments of the Program Fullprof. Commission on Powder Diffraction (iucr). Newsletter 2001, 26, 12–19. [Google Scholar]
  35. Rodriguez-Carvajal, J. An Introduction to the Program Fullprof 2000 (Version 5.60); Laboratoire Léon Brillouin (Cea-Cnrs): Saclay, France, 2001. [Google Scholar]
  36. Rodriguez-Carvajal, J.; Roisnel, T. Line Broadening Analysis Using Fullprof*: Determination of Microstructural Properties. Mater. Sci. Forum. 2004, 443–444, 123–126. [Google Scholar] [CrossRef]
  37. Alvarez-Garcia, J.; Barcones, B.; Perez-Rodriguez, A.; Romano-Rodriguez, A.; Morante, J.R.; Janotti, A.; Wei, S.H.; Scheer, R. Vibrational and Crystalline Properties of Polymorphic CuInC2 (C=Se,S) Chalcogenides. Phys. Rev. B 2005, 71. [Google Scholar] [CrossRef] [Green Version]
  38. Zaretskaya, E.P.; Gremenok, V.F.; Riede, V.; Schmitz, W.; Bente, K.; Zalesski, V.B.; Ermakov, O. Raman Spectroscopy of CuInSe2 Thin Films Prepared by Selenization. J. Phys. Chem. Solids 2003, 64, 1989–1993. [Google Scholar] [CrossRef]
  39. Rincon, C.; Ramirez, F.J. Lattice-Vibrations of CuInSe2 and CuGaSe2 by Raman Microspectrometry. J. Appl. Phys. 1992, 72, 4321–4324. [Google Scholar] [CrossRef]
  40. Xiong, Q.H.; Wang, J.G.; Reese, O.; Voon, L.C.L.Y.; Eklund, P.C. Raman Scattering from Surface Phonons in Rectangular Cross-Sectional W-ZnS Nanowires. Nano Lett. 2004, 4, 1991–1996. [Google Scholar] [CrossRef]
  41. Cheng, Y.C.; Jin, C.Q.; Gao, F.; Wu, X.L.; Zhong, W.; Li, S.H.; Chu, P.K. Raman Scattering Study of Zinc Blende and Wurtzite ZnS. J. Appl. Phys. 2009, 106, 123505. [Google Scholar] [CrossRef]
  42. Kim, J.H.; Rho, H.; Kim, J.; Choi, Y.J.; Park, J.G. Raman Spectroscopy of ZnS Nanostructures. J. Raman Spectrosc. 2012, 43, 906–910. [Google Scholar] [CrossRef]
  43. Dutková, E.; Daneu, N.; Lukáčová Bujňáková, Z.; Baláž, M.; Kováč, J.; Kováč, J., Jr.; Baláž, P. Mechanochemical Synthesis and Characterization of CuInS2/ZnS Nanocrystals. Molecules 2019, 24, 1031. [Google Scholar] [CrossRef] [Green Version]
  44. Zhou, W.W.; Yin, Z.Y.; Sim, D.H.; Zhang, H.; Ma, J.; Hng, H.H.; Yan, Q.Y. Growth of Dandelion-Shaped CuInSe2 Nanostructures by a Two-Step Solvothermal Process. Nanotechnology 2011, 22, 195607. [Google Scholar] [CrossRef]
  45. Dong, J.; Zeng, X.H.; Xia, W.W.; Zhang, X.Y.; Zhou, M.; Wang, C.X. Ferromagnetic Behavior of Non-Stoichiometric ZnS Microspheres with a Nanoplate-Netted Surface. RSC Adv. 2017, 7, 20874–20881. [Google Scholar] [CrossRef] [Green Version]
  46. Kim, C.-J. Surface Chemistry and Colloids, Advanced Pharmaceutics: Physico-Chemical Principles; CRC Press: Boca Raton, FL, USA, 2004. [Google Scholar]
  47. De, S.; Mandal, S. Surfactant-Assisted Shape Control of Copper Nanostructures. Colloids Surf. A Physicochem. Eng. Asp. 2013, 421, 72–83. [Google Scholar] [CrossRef]
  48. Viana, R.B.; Da Silva, A.B.F.; Pimentel, A.S. Infrared Spectroscopy of Anionic, Cationic, and Zwitterionic Surfactants. Adv. Phys. Chem. 2012, 2012, 1–14. [Google Scholar] [CrossRef] [Green Version]
  49. Chinmay, H.; Kundu, D.; Chaudharia, A.; Jana, T. Biogenic Synthesis, Characterization, Toxicity and Photocatalysis of Zinc Sulfide Nanoparticles Using Rhamnolipids from Pseudomonas Aeruginosa BS01 as Capping and Stabilizing Agent. J. Chem. Technol. Biotechnol. 2013, 88, 1039–1048. [Google Scholar]
  50. Xiaodong Gao, J.C. Adsorption of Sodium Dodecyl Sulfate (SDS) at ZnSe and α-Fe2O3 Surfaces: Combining Infrared Spectroscopy and Batch Uptake Studies. J. Colloid Interface Sci. 2010, 348, 167–176. [Google Scholar]
  51. Soomro, R.A.; Sirajuddin, S.; Memon, N.; Shah, M.R.; Kalwar, N.H.; Hallam, K.R.; Shah, A. Synthesis of Air Stable Copper Nanoparticles and their Use in Catalysis. Adv. Mat. Lett. 2014, 5, 191–198. [Google Scholar] [CrossRef]
  52. Lukáčová Bujňáková, Z.; Melnyk, I.; Dutková, E.; Varhač, R.; Jakubíková, J.; Cholujová, D.; Tóthová, E.; Storozhuk, L.; Briančin, J. Nano-Bio Interface Between As4S4 Nanoparticles and Albumin Influenced by Wet Stirred Media Milling. Small 2020. under review. [Google Scholar]
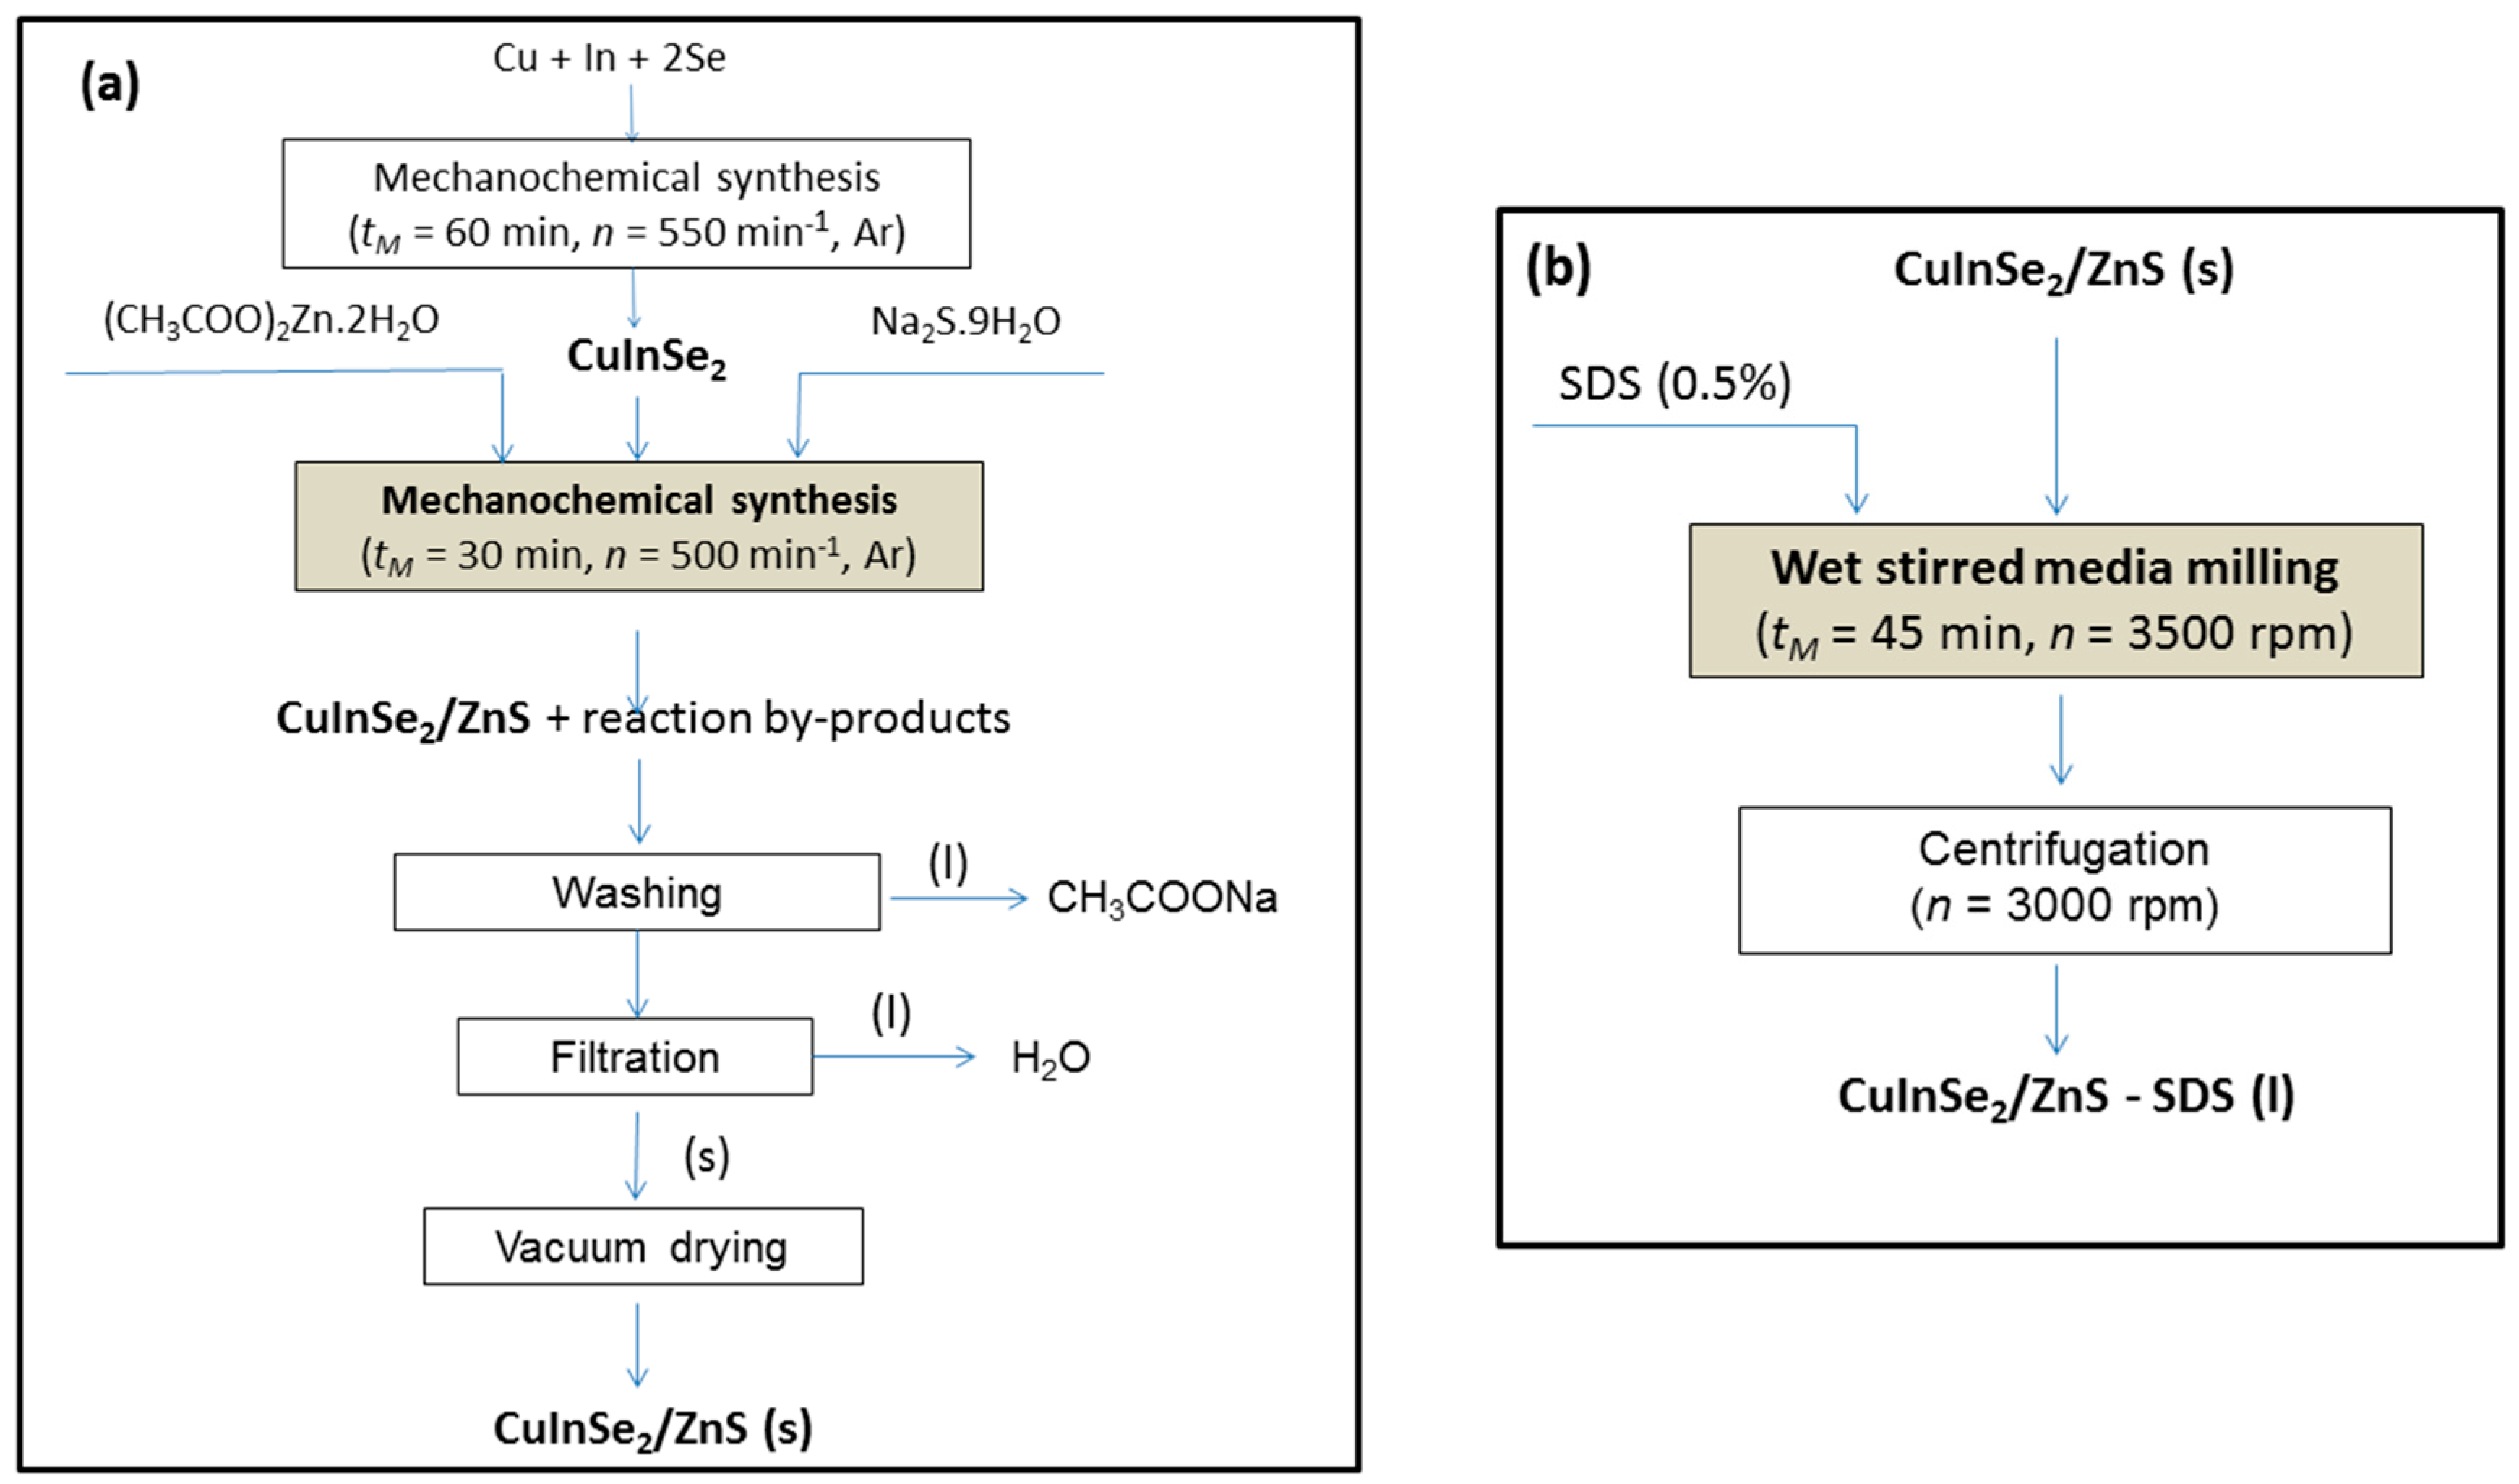
Figure 1. Flow-sheets of the technological routes to prepare CuInSe2/ZnS nanocrystals (a) and sodium dodecyl sulphate (SDS) capped CuInSe2/ZnS nanosuspensions (b).
Nanomaterials 11 00069 g001
Figure 2. Observed X-ray powder diffraction (XRPD) patterns of CuInSe2/ZnS MNC: (a) CuInSe2/ZnS 5:0, (b) CuInSe2/ZnS 4:1 and (c) CuInSe2/ZnS 1:4 (the ZnS phase is denoted as S—sphalerite, and W—wurtzite).
Nanomaterials 11 00069 g002
Figure 3. Observed and calculated XRPD profiles for CuInSe2/ZnS 5:0 (a) and CuInSe2/ZnS 4:1 (b) multinanocomposites (MNC). Experimental data (circles) and calculated profile (solid line) are given with calculated Bragg positions for CuInSe2 (the upper raw of blue vertical ticks), Cu2In (the bottom raw of red vertical ticks) and difference curve (the bottom solid line). The presence of the third phase with unknown crystal structure in both samples is possible (see text for more details).
Nanomaterials 11 00069 g003aNanomaterials 11 00069 g003b
Figure 4. Observed and calculated XRPD profiles for CuInSe2/ZnS 1:4 MNC. Experimental data (circles) and calculated profile (solid line) are given with calculated Bragg positions for CuInSe2 (the upper raw of blue vertical ticks), ZnS wurtzite (the bottom raw of red vertical ticks) and difference curve (the bottom solid line). The presence of ZnS sphalerite phase is also possible (see text for more details).
Nanomaterials 11 00069 g004
Figure 5. Raman spectra of CuInSe2/ZnS MNC excited at 514 nm Ar laser beam.
Nanomaterials 11 00069 g005
Figure 6. Low-magnification images of CuInSe2/ZnS MNC: (a) CuInSe2/ZnS 5:0, (b) CuInSe2/ZnS 4:1 and (c) CuInSe2/ZnS 1:4 with selected area electron diffraction (SAED) patterns and energy dispersive X-ray spectrometer (EDXS) spectra recorded at characteristic parts of the samples.
Nanomaterials 11 00069 g006
Figure 7. Surface properties of the synthesized MNC: (a) adsorption–desorption isotherms and (b) pore size distributions.
Nanomaterials 11 00069 g007
Figure 8. (a) UV-Vis and (b) micro-photoluminescence (PL) (b) spectra of the synthesized CuInSe2/ZnS 5:0, CuInSe2/ZnS 4:1 and CuInSe2/ZnS 1:4 MNC excited at 488 nm.
Nanomaterials 11 00069 g008
Figure 9. Particle size distribution in CuInSe2/ZnS nanocrystals (a,c) and CuInSe2/ZnS-SDS nanosuspensions (b,d) with intercomponent ratio 5:0 (a,b) and 4:1 (c,d). The inset shows representative SEM image of the MNC sample.
Nanomaterials 11 00069 g009
Figure 10. Changes in particle size distribution in the nanosuspensions CuInSe2/ZnS 5:0-SDS (a) and CuInSe2/ZnS 4:1-SDS (b) during prolonged storage.
Nanomaterials 11 00069 g010aNanomaterials 11 00069 g010b
Figure 11. FTIR spectra of SDS (black), SDS capped nanosuspensions CuInSe2/ZnS 5:0-SDS (red) and CuInSe2/ZnS 4:1-SDS (blue). (a) the whole spectrum; (b) a characteristic region for SO2 vibrations of SDS.
Nanomaterials 11 00069 g011
Figure 12. The dissolution of Cu(II) and Zn(II) ions (a) and ZP measurements (b) of CuInSe2/ZnS 5:0 and CuInSe2/ZnS 4:1 nanocrystals.
Nanomaterials 11 00069 g012
Figure 13. The multiple myeloma (MM) cell lines sensitized by CuInSe2/ZnS 5:0-SDS and CuInSe2/ZnS 4:1-SDS nanosuspensions. (a) MM cell lines (MM.1S, RPMI-S, OPM-1, OPM-2, KMS-11, and JJN3) were treated (0–10 μM) with CuInSe2/ZnS 5:0 (top) and CuInSe2/ZnS 4:1 (bottom) for 24 h. The viability was assessed by 3-(4,5-dimethylthiazol-2-yl)-2,5-diphenyltetrazolium bromide assay (MTT) assay. Each treatment with a specific concentration of the nanoparticle was done in triplicate. The data presented are mean ± standard error, and expressed as viability relative to untreated controls. (b) the EC50 value of CuInSe2/ZnS 5:0 and CuInSe2/ZnS 4:1 was determined for each MM cell line for 24 h, 48 h and 72 h by the CalcuSyn software and depicted by heatmap. (c) fluorescence of nanoparticles CuInSe2/ZnS (5 μM concentration) 5:0 (blue) and 4:1 (purple) compared to control untreated cell (unfilled) in MM1.S and RPMI-S cell lines showed by histogram. Fluorescent intensity was excited by violet (405 nm) laser and emitted by 670+/−30 nm wavelength by a FACS Aria Special Sorter.
Nanomaterials 11 00069 g013
Table 1. Zeta potential of CuInSe2/ZnS 5:0 and CuInSe2/ZnS 4:1 MNC samples measured in water (before milling) and in SDS (after wet milling).
Sampleξ (mV)pH
CuInSe2/ZnS 5:0-H2O−197.00
CuInSe2/ZnS 5:0-SDS−417.96
CuInSe2/ZnS 4:1-H2O−6.26.43
CuInSe2/ZnS 4:1-SDS−397.80
Publisher’s Note: MDPI stays neutral with regard to jurisdictional claims in published maps and institutional affiliations.