Article

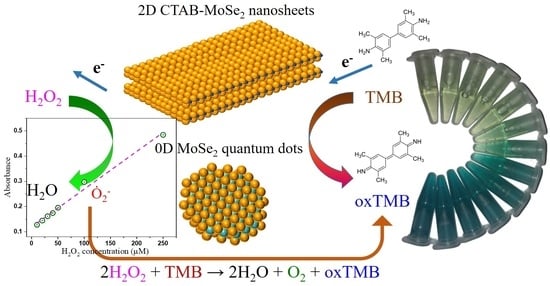
2D CTAB-MoSe2 Nanosheets and 0D MoSe2 Quantum Dots: Facile Top-Down Preparations and Their Peroxidase-Like Catalytic Activity for Colorimetric Detection of Hydrogen Peroxide

1
Department of Materials and Optoelectronic Science, National Sun Yat-sen University, Kaohsiung 80424, Taiwan
2
Center of Crystal Research, National Sun Yat-sen University, Kaohsiung 80424, Taiwan
3
Department of Physics, National Taiwan University, Taipei 10617, Taiwan
4
Department of Chemistry, National Sun Yat-sen University, Kaohsiung 80424, Taiwan
*
Authors to whom correspondence should be addressed.
These authors contributed equally to this work.
Nanomaterials 2020, 10(10), 2045; https://doi.org/10.3390/nano10102045
Submission received: 29 September 2020 / Revised: 11 October 2020 / Accepted: 13 October 2020 / Published: 16 October 2020
(This article belongs to the Special Issue Nanobiophotonics, Photomedicine, and Imaging)

Abstract

:
We report the facile and economic preparation of two-dimensional (2D) and 0D MoSe2 nanostructures based on systematic and non-toxic top-down strategies. We demonstrate the intrinsic peroxidase-like activity of these MoSe2 nanostructures. The catalytic processes begin with facilitated decomposition of H2O2 by using MoSe2 nanostructures as peroxidase mimetics. In turn, a large amount of generated radicals oxidizes 3,3,5,5-tetramethylbenzidine (TMB) to produce a visible color reaction. The enzymatic kinetics of our MoSe2 nanostructures complies with typical Michaelis–Menten theory. Catalytic kinetics study reveals a ping–pong mechanism. Moreover, the primary radical responsible for the oxidation of TMB was identified to be Ȯ2 by active species-trapping experiments. Based on the peroxidase mimicking property, we developed a new colorimetric method for H2O2 detection by using 2D and 0D MoSe2 nanostructures. It is shown that the colorimetric sensing capability of our MoSe2 catalysts is comparable to other 2D materials-based colorimetric platforms. For instance, the linear range of H2O2 detection is between 10 and 250 μM by using 2D functionalized MoSe2 nanosheets as an artificial enzyme. Our work develops a systematic approach to use 2D materials to construct novel enzyme-free mimetic for a visual assay of H2O2, which has promising prospects in medical diagnosis and food security monitoring.

Graphical Abstract

1. Introduction

The development of convenient and sensitive detection of hydrogen peroxide (H2O2) is in high demand in the fields of food security, environmental monitoring and biochemical analysis. H2O2, produced from the incomplete reduction of O2, can be found as a byproduct in diverse biological processes. Higher amounts than normal of cellular H2O2 have been linked to the risk of a few diseases including Parkinson’s disease and cancer development [1,2]. Thus, it is of practical importance to analyze and detect H2O2 by a simple, sensitive and economic method. So far, various techniques for H2O2 determination have been explored, such as fluorometry [3,4], cellular imaging [5], electrochemistry [6,7], and the colorimetric method [8,9]. Among these approaches, the colorimetric method has drawn a lot of attention due to its convenient operation, visibility, facile miniaturization, and low cost [10,11]. In this respect, natural enzymes were extensively used for the detection of H2O2 due to its catalysis capability under mild conditions. Nevertheless, these conventional enzymes usually suffer from the disadvantages of low stability against harsh conditions and high expenditures for preparation and purification. Consequently, researchers actively sought artificial enzyme-mimic materials without these shortcomings. Nanomaterials are currently regarded as a rich source to synthesize desired alternative mimic enzymes with the benefits of low cost, plentiful raw materials, and ease in purification and storage. Many nanomaterials with intrinsic enzyme-mimetic activity analogous to that of natural enzymes were fabricated, such as metal organic frameworks [12], Pt nanoclusters [13], silver nanoparticles [14], and gold nanoparticles [15]. Although enormous progress has been made, the discovery and development of novel promising artificial peroxidase mimics is still in urgent need.
With the persistent advancement of nanotechnology and materials science, two-dimensional (2D) nanomaterials beyond graphene have received much attention because of many fascinating chemical and physical properties. The transition metal dichalcogenides (TMDs), a family of layered compound materials consisting of 2D sheets weakly bound by van der Waals interactions, is the most renowned group of emerging 2D materials. They have shown huge promise in a wide range of applications. In particular, TMD nanostructures have shown good potential in biomedical applications due to their large surface area, low cytotoxicity, and higher structural rigidity than other 2D nanomaterials. For instance, it was found that TMDs exhibited lower cytotoxicity than typical graphene and its analogues [16]. As for structural rigidity, commonly used graphene and hexagonal boron-nitride have relatively low flexural rigidity around 3.5 eV Å2/atom. On the other hand, these values for MoS2 and WS2 are 27 eV Å2/atom and 30 eV Å2/atom, respectively [17]. These properties should make 2D TMDs appropriate for biomedical applications. Finally, TMDs can remain stable in liquid due to the lack of dangling bonds on the surface, which supports their use in biomedical applications.
Molybdenum disulfide (MoS2), the most prominent member of the TMD family, possesses distinctive properties and has found diverse successful applications in electronics [18], energy devices [19], photocatalysis [20], and sensors [21,22]. In particular, the peroxidase-like catalytic ability of a few MoS2 nanostructures has been shown by researchers [23,24]. While a large amount of investigations is devoted to MoS2, considerably less attention has been devoted to molybdenum diselenide (MoSe2) [25]. 2H-MoSe2, also with a graphene-like lamellar structure, is a semiconductor whose bandgap energy increases from ~1.1 eV in bulk to ~1.55 eV in ultrathin form with atomic thickness. In a previous comparative study, Gholamvand and coworkers concluded that MoSe2 is the most effective electrocatalyst among TMDs [26]. Recent studies also showed that few-layered MoSe2 nanosheets (NSs) could be a promising candidate with peroxidase-like activity and good biocompatibility [27,28]. Moreover, inspired by the fact that selenium-containing enzymes are generally prevalent in the biosphere and their active sites usually involve selenium, we thus turned our attention to the investigation of nanoscale MoSe2 in this respect. Even though MoSe2 is expected to function as efficient peroxidase mimetics for colorimetric detection, so far little progress has been made in this respect. Its extended topics, such as surface modification and variation in dimensionality, were rarely studied for use in colorimetric detection. Here, we intend to fill the gap along this exploration. For instance, TMD in quantum dot (QD) form deserves more investigation because their pronounced quantum confinement effects (QCE) and edge effects further aid applications in catalysts and sensing [29,30]. Significant enhancement in photoluminescence (PL) quantum efficiency by QCE is favorable to develop a sensor by optical means [31,32]. Moreover, a few optical properties in the strong coupling regime for semiconductor QDs and nanostructures could be implemented to strengthen the functionality of biosensors [33,34,35].
Liquid-phase synthesis routes are suitable to produce TMD nanostructures in large quantity at low cost. In general, solution-based synthesis approaches can be divided into “top-down” methods and “bottom-up” methods. For bottom-up wet-chemical synthesis methods, specific precursors are needed and a high-temperature and high-pressure environment is required. Among top-down approaches, liquid phase exfoliation (LPE) is a powerful technique to efficiently exfoliate various types of layered crystals into few-layer nanosheets or even QDs [36,37]. The basic protocol of LPE technique is very general and only parent crystal is needed instead of the need for specific precursors in bottom-up chemical methods.
In this paper, we prepared two types of low-dimensional MoSe2 nanostructures based on top-down techniques. In the first case, LPE-derived 2D MoSe2 nanosheets were functionalized with cetyltrimethyl ammonium bromide (CTAB). It is expected that the CTAB surfactant could aid exfoliation efficiency and prevent 2D nanosheets from restacking or agglomeration [38]. Secondly, 0D MoSe2 QDs were obtained based on top-down exfoliation approaches. For usual 0D TMD QDs derived from LPE, longer ultrasonication time and higher power were typically adopted, which could easily deform the microstructure and result in higher density of surface traps states. As surface-to-volume ratio is rather large for QDs, these deep trap states pose negative impact to many applications. In our work, a novel and efficient ultrasonication-assisted solvothermal exfoliation technique is firstly introduced for preparing small size and high-quality MoSe2 QDs. In the initial probe-assistant ultrasonication exfoliation phase, MoSe2 bulk is broken into nanosheets or nanoparticles by the acoustic cavitation effect. The sonication time is kept short in this stage. Next, the solvothermal treatment with a polar solvent continuously weakens the van der Waals forces of thinned MoSe2 and break it up into small 0D QDs. We show that our CTAB-modified MoSe2 NSs and 0D MoSe2 QDs are able to efficiently catalyze the oxidation of 3,3,5,5-tetramethylbenzidine (TMB) in the presence of H2O2 to produce a colored product. On this basis, we have successfully demonstrated novel platforms for colorimetric detection of H2O2. It is found that the sensing capability of our MoSe2 systems is comparable to those of published 2D materials-based platforms. As far as we know, it is the first time the potential of CTAB-functionalized MoSe2 nanosheets and 0D MoSe2 QDs have been explored for colorimetric detection of H2O2. Toxic and high boiling point solvents were not used in our synthesis methods thus our protocols also provide a non-toxic and systematic way to fabricate new 2D nanomaterials for construction of novel colorimetric sensors and for use in extended applications.

2. Materials and Methods

2.1. Materials and Reagents

MoSe2 powder (99.9%), 3,3,5,5-tetramethylbenzidine (TMB), and isopropanol were purchased from Sigma-Aldrich (St. Louis, MO, USA). Cetyltrimethyl ammonium bromide (CTAB) was purchased from Millipore (Burlington, MA, USA). Acetic acid, sodium acetate anhydrous, hydrochloric acid, and hydrogen peroxide (35%) were obtained from Alfa Aesar (Tewksbury, MA, USA). These chemicals were of analytical purity and were used as received. Deionized water (DI water) was used as a solvent throughout.

2.2. Methods

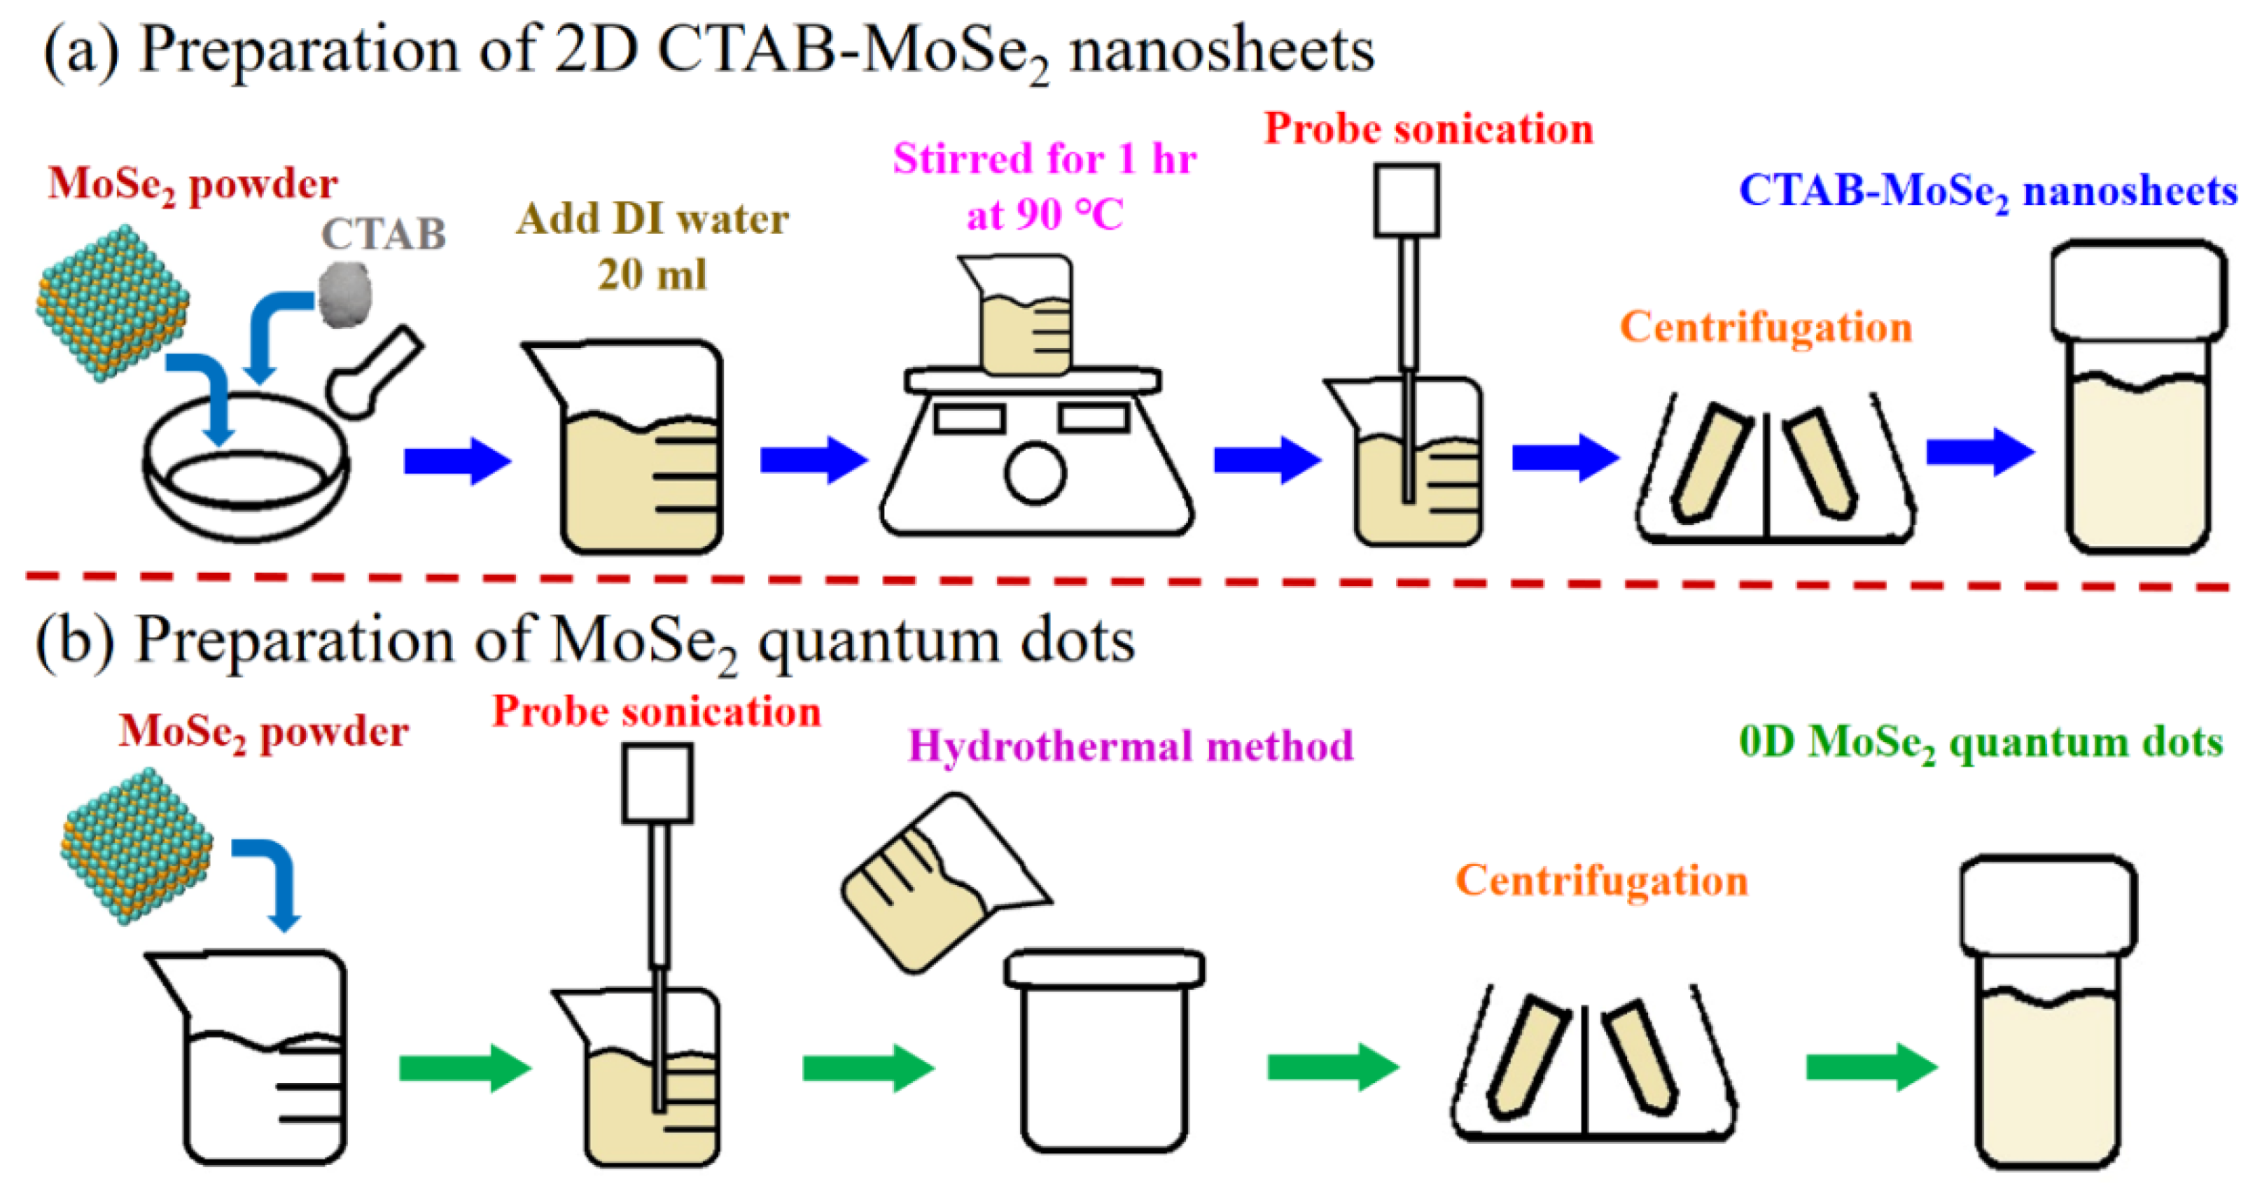
2.2.1. Preparation of Surfactant Modified Two-Dimensional (2D) MoSe2 Nanosheets (NSs)

The few-layer CTAB-MoSe2 NSs synthesis protocol is based on the grinding-assisted liquid phase exfoliation approach [37]. The synthesis protocol of 2D CTAB-MoSe2 NSs is illustrated in Figure 1a. First, 100 mg of MoSe2 powder and 50 mg of CTAB were ground for 30 min. The mixture was subsequently dispersed in 20 mL of DI water and stirred for 1 h at 90 °C in a beaker. The solution was probe sonicated for 3 h with a horn sonic tip (Qsonica CL-334) at a power output of 125 W in a water-cooled bath at 20 °C. Residual sediment and thick flakes were further removed by centrifugation at 4000 rpm for 20 min. The upper portion of the supernatant was taken for the next centrifugation for 20 min at the speed of 9000 rpm. The upper portion of the resultant supernatant was transferred to a refrigerator at 4 °C for storage. Finally, the 2D CTAB-MoSe2 NS product was collected by another centrifugation at the speed of 9000 rpm.

2.2.2. Preparation of 0D MoSe2 QDs

The 0D MoSe2 QDs were obtained according to the ultrasonication-assisted solvothermal exfoliation technique. Figure 1b depicts the synthesis procedure of 0D MoSe2 QDs. Typically, 100 mg of MoSe2 powder was dispersed in 60 mL of 50 vol% Isopropyl alcohol (IPA)/DI water mixture in a beaker. Then, the solution was probe sonicated for 1 h with a horn sonic tip (Qsonica CL-334) at a power output of 150 W in a water-cooled bath at 20 °C. Afterward, the resultant dispersions was further transferred to a 60 mL Teflon-lined autoclave and reacted at 200 °C for 24 h. After the autoclave cooled naturally, the supernatant containing MoSe2 QDs was centrifuged for 30 min at the speed of 9000 rpm. After that, the upper portion of the supernatant was collected for second centrifugation for 15 min with the same rotation speed. Finally, the MoSe2 QD product was collected and then stored in a refrigerator at 4 °C for use.

2.3. Characterization

Transmission electron microscopy (TEM) images and high-resolution TEM (HRTEM) images were taken by using a JEOL-3010 transmission electron microscope at an accelerating voltage of 200 kV (Tokyo, Japan). The elemental composition and bonding configuration analysis were carried out by an ultrahigh vacuum JEOL JPS-9010 X-ray photoelectron spectrometer (XPS) equipped with a multi-channel detector. The detected binding energies were calibrated to the C1 s peak at 284.8 eV of the surface adventitious carbon. The ultraviolet–visible (UV–vis) spectra were recorded with a Jasco V-730 spectrophotometer (USA) with a standard 10-mm path length quartz cuvette (Easton, MD, USA). The photoluminescence spectra were measured using a Hitachi F-4500 florescence spectrophotometer connected to a 150 W Xenon lamp as the excitation source. The Raman spectra were recorded in ambient conditions using a confocal microscope linked to a Horiba iHR320 spectrometer (Piscataway, NJ, USA) [39].

2.4. Peroxidase-Mimetic Activity of MoSe2 Quantum Dots (QDs) and 2D Cetyltrimethyl Ammonium Bromide (CTAB)-MoSe2 NSs

To evaluate the catalytic peroxidase-like properties, a blue product was generated by the peroxidase substrate TMB in the presence of H2O2. In a typical experiment, 600 μL 0.1 mg/mL MoSe2 catalyst was incubated with 500 μL acetate buffer solution (0.1 M, pH 3.6), 200 μL H2O2 (10 mM), 200 μL TMB (5 mM) and 60 μL H2O at room temperature for 15 min. Then, the absorbance of the mixture was measured by a Jasco V-730 UV-visible spectrophotometer (Easton, MD, USA). For H2O2 detection, different contents of H2O2 were incubated with 600 μL 0.1 mg/mL MoSe2 catalyst, 500 μL acetate buffer solution (0.1 M, pH 3.6) and 200 μL TMB (5 mM) at room temperature for 15 min, and then the absorbance at 652 nm was recorded.

3. Results and Discussion

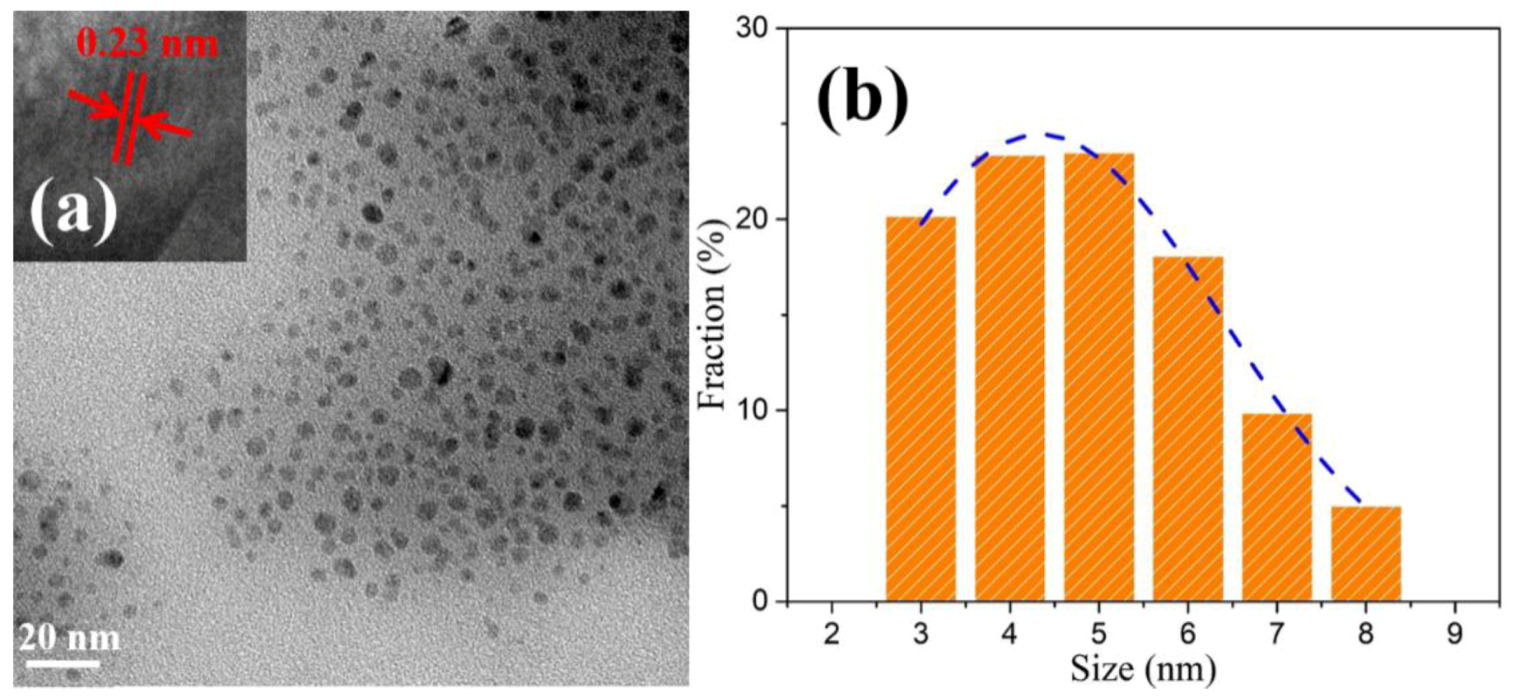
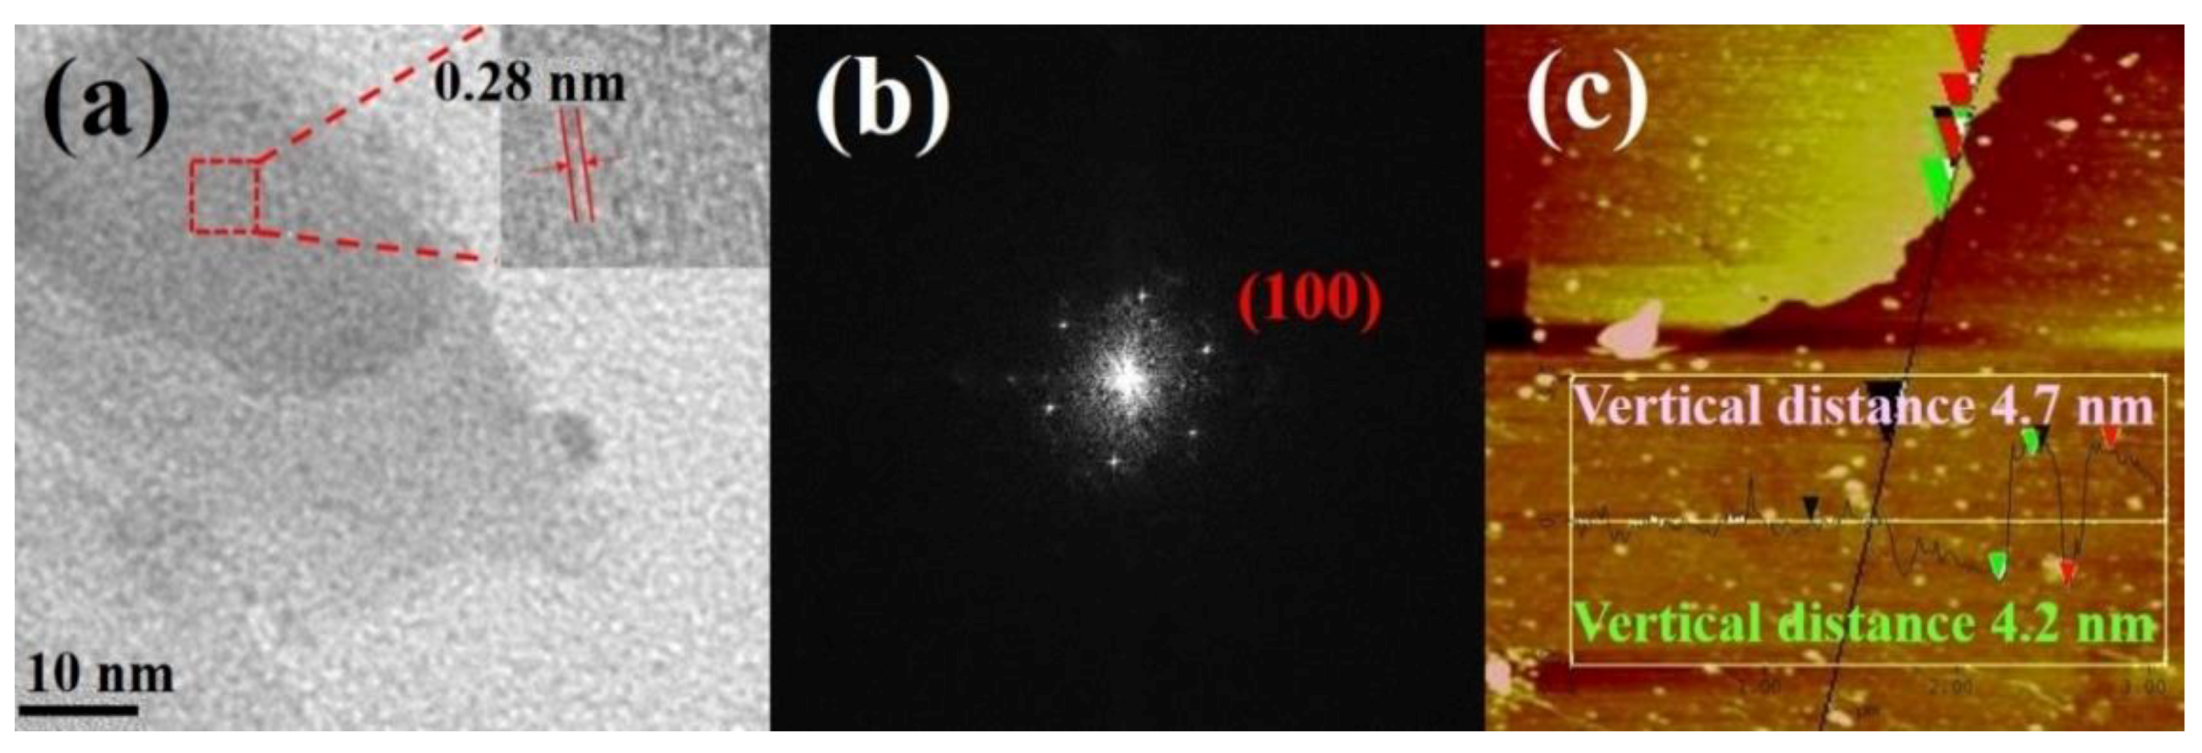
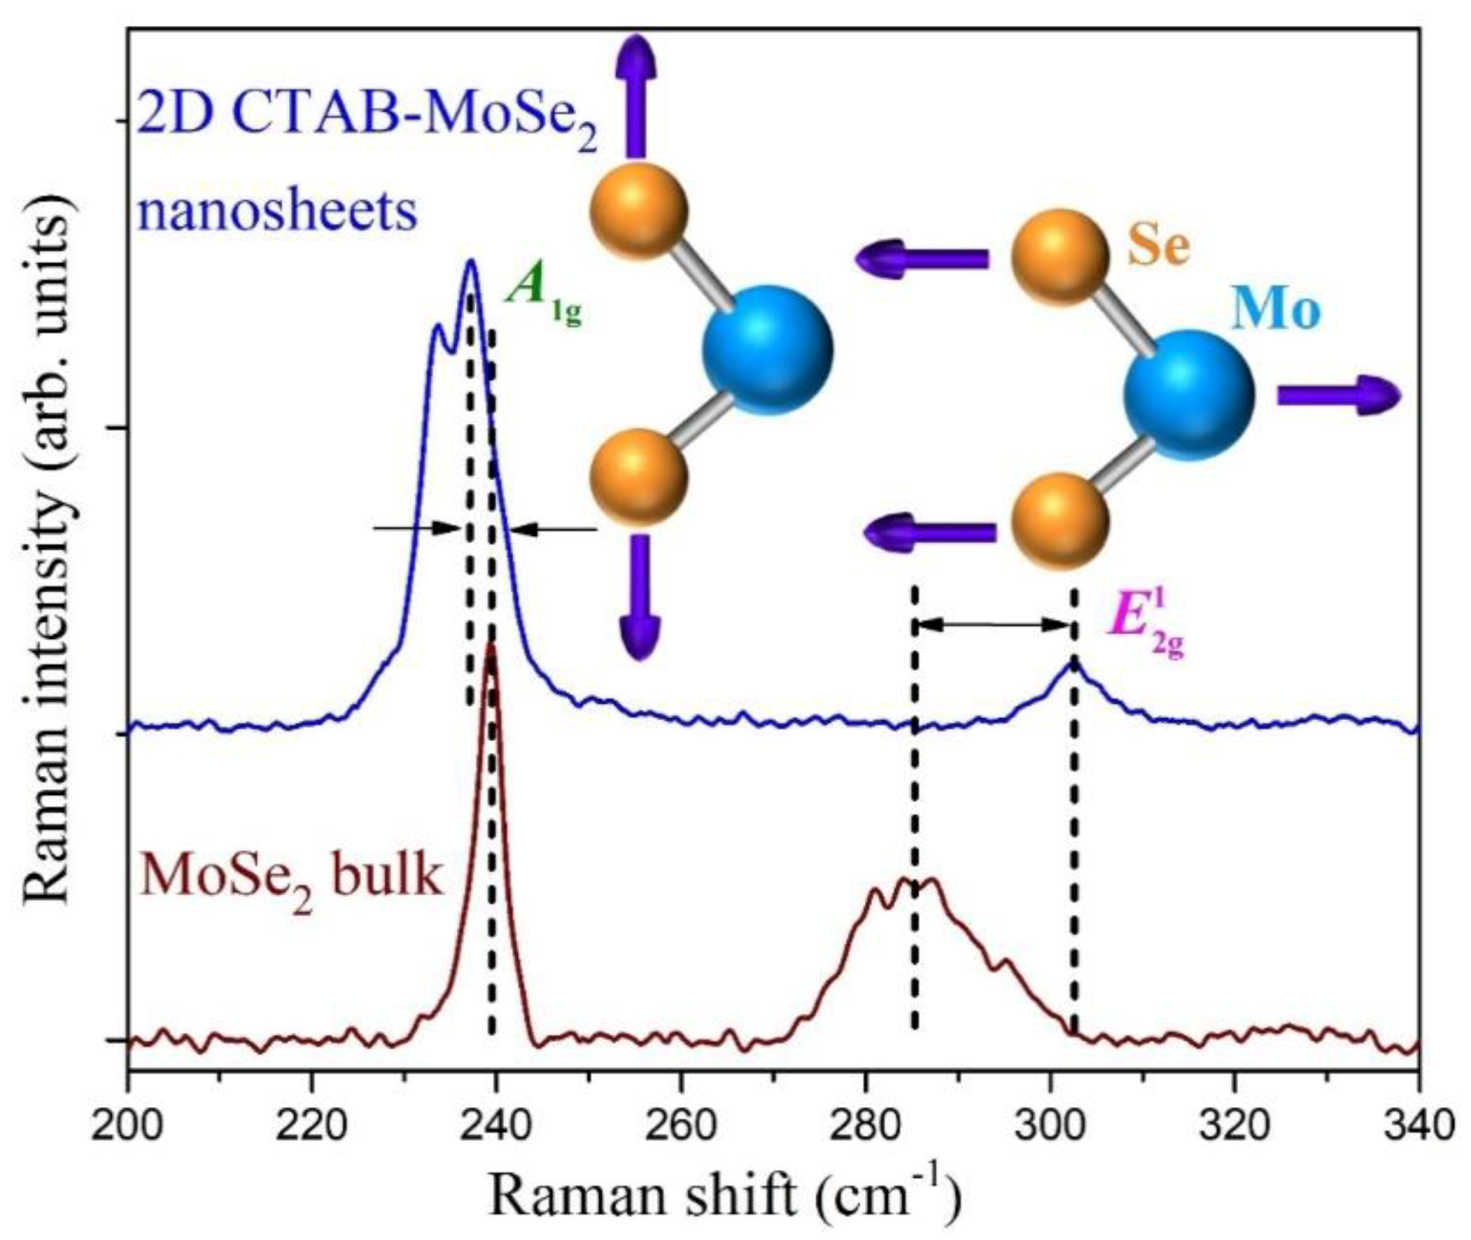
3.1. Structural Studies

The microstructure of the resultant MoSe2 nanomaterials is characterized by transmission electron microscopy (TEM). As shown in Figure 2a, the as-obtained MoSe2 QDs reveal a spherical shape without noticeable aggregation, indicating the successful formation of highly dispersive QDs. The statistical analysis of particle size distribution was conducted by counting 700 QD profiles measured by TEM. The outcome is displayed by the histogram in Figure 2b along with its calculated Gaussian fitting curve. The average size of the 0D QDs was determined to be 4.5 nm and up to 80% QDs have their diameters in the narrow range from 3 to 6 nm. A high-resolution TEM (HRTEM) image of a single MoSe2 QD in the inset of Figure 2a reveals that the lattice spacing of the synthesized QD was 0.23 nm, which coincides with the (103) plane of hexagonal MoSe2 [40].
Next, Figure 3a shows the representative TEM image of the as-prepared 2D CTAB-MoSe2 nanosheet, in which a sheet-like structure can be found. The HRTEM image in the inset of Figure 3a resolves lattice fringes with lattice spacing of 0.28 nm, which is in agreement with the (100) plane of 2H-MoSe2. As shown in Figure 3b, the selected-area electron diffraction (SAED) pattern again verifies the diffraction pattern from the 2H-MoSe2 crystal and demonstrates the good crystallinity of the exfoliated nanosheets. Atomic force microscopy (AFM) measurement was adopted to further confirm the 2D nature of CTAB-MoSe2 nanosheets. A representative AFM image is shown in Figure 3c and the height profile along the black line was measured. It was found that the nanosheet thickness ranges from 4.2 to 4.7 nm, which confirms the 2D few-layered structure.

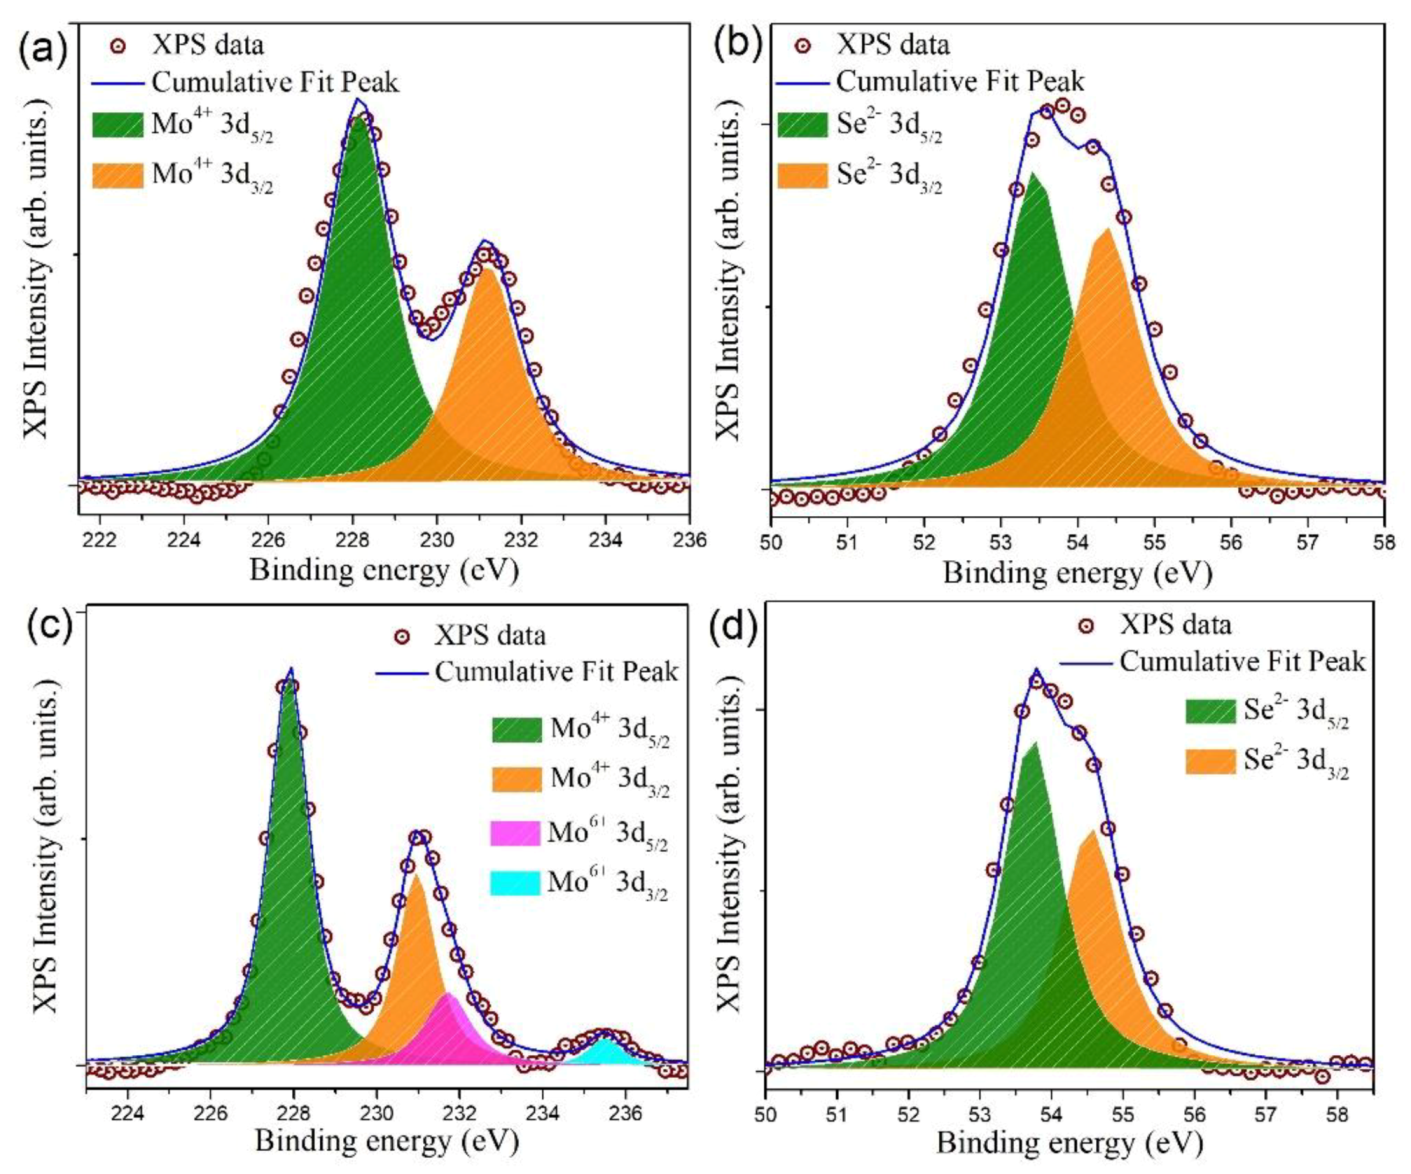
3.2. Surface Elemental and Valence State Analysis

To further shed light on the surface chemical components and oxidation states of our solvothermal-treated MoSe2 QDs, XPS was performed on both pristine bulk MoSe2 powder and MoSe2 QDs. Figure 4a,b show the high-resolution Mo 3d and Se 3d XPS spectra of pristine MoSe2 powder, respectively. The two peaks located at 228.1 eV and 231.2 eV correspond to the Mo 3d5/2 and Mo 3d3/2 peaks of the Mo4+ state in MoSe2, which is in agreement with previous reports [19,41]. Meanwhile, the peak of Se 3d spectrum can be deconvoluted into two components: the binding energy peaks at 53.4 eV and 54.2 eV are characteristic signals of Se2− 3d5/2 and Se2− 3d3/2, respectively [42]. In this case, a signal from the Mo6+ state was not observed, indicating that there is no noticeable oxidation in our pristine material. Next, the high-resolution Mo 3d and Se 3d spectra of MoSe2 QDs are presented in Figure 4c,d, respectively. The deconvolution of Mo 3d spectral region reveals four contributions. The two intense peaks at 227.9 and 231.1 eV belong to the characteristic signals from Mo4+ 3d5/2 and Mo4+ 3d3/2, respectively. Furthermore, the other two minor peaks at binding energies of 232.2 and 235.5 eV are ascribed to the Mo(VI) state [37]. This suggests that a small portion of surface Mo4+ was oxidized into Mo6+ during the imposed reaction [43,44]. As shown in Figure 4d, the two deconvoluted components of the Se 3d doublet appear at 53.5 eV and 54.3 eV, which can be assigned to the Se 3d5/2 and Se 3d3/2 orbitals of divalent selenide ions (Se2−), respectively. It can be confirmed that the binding energies of Mo4+ and Se2- orbitals of our prepared QDs do not deviate noticeably from those of the starting material. It is reasonable as no heterostructure formation or other interaction is involved.

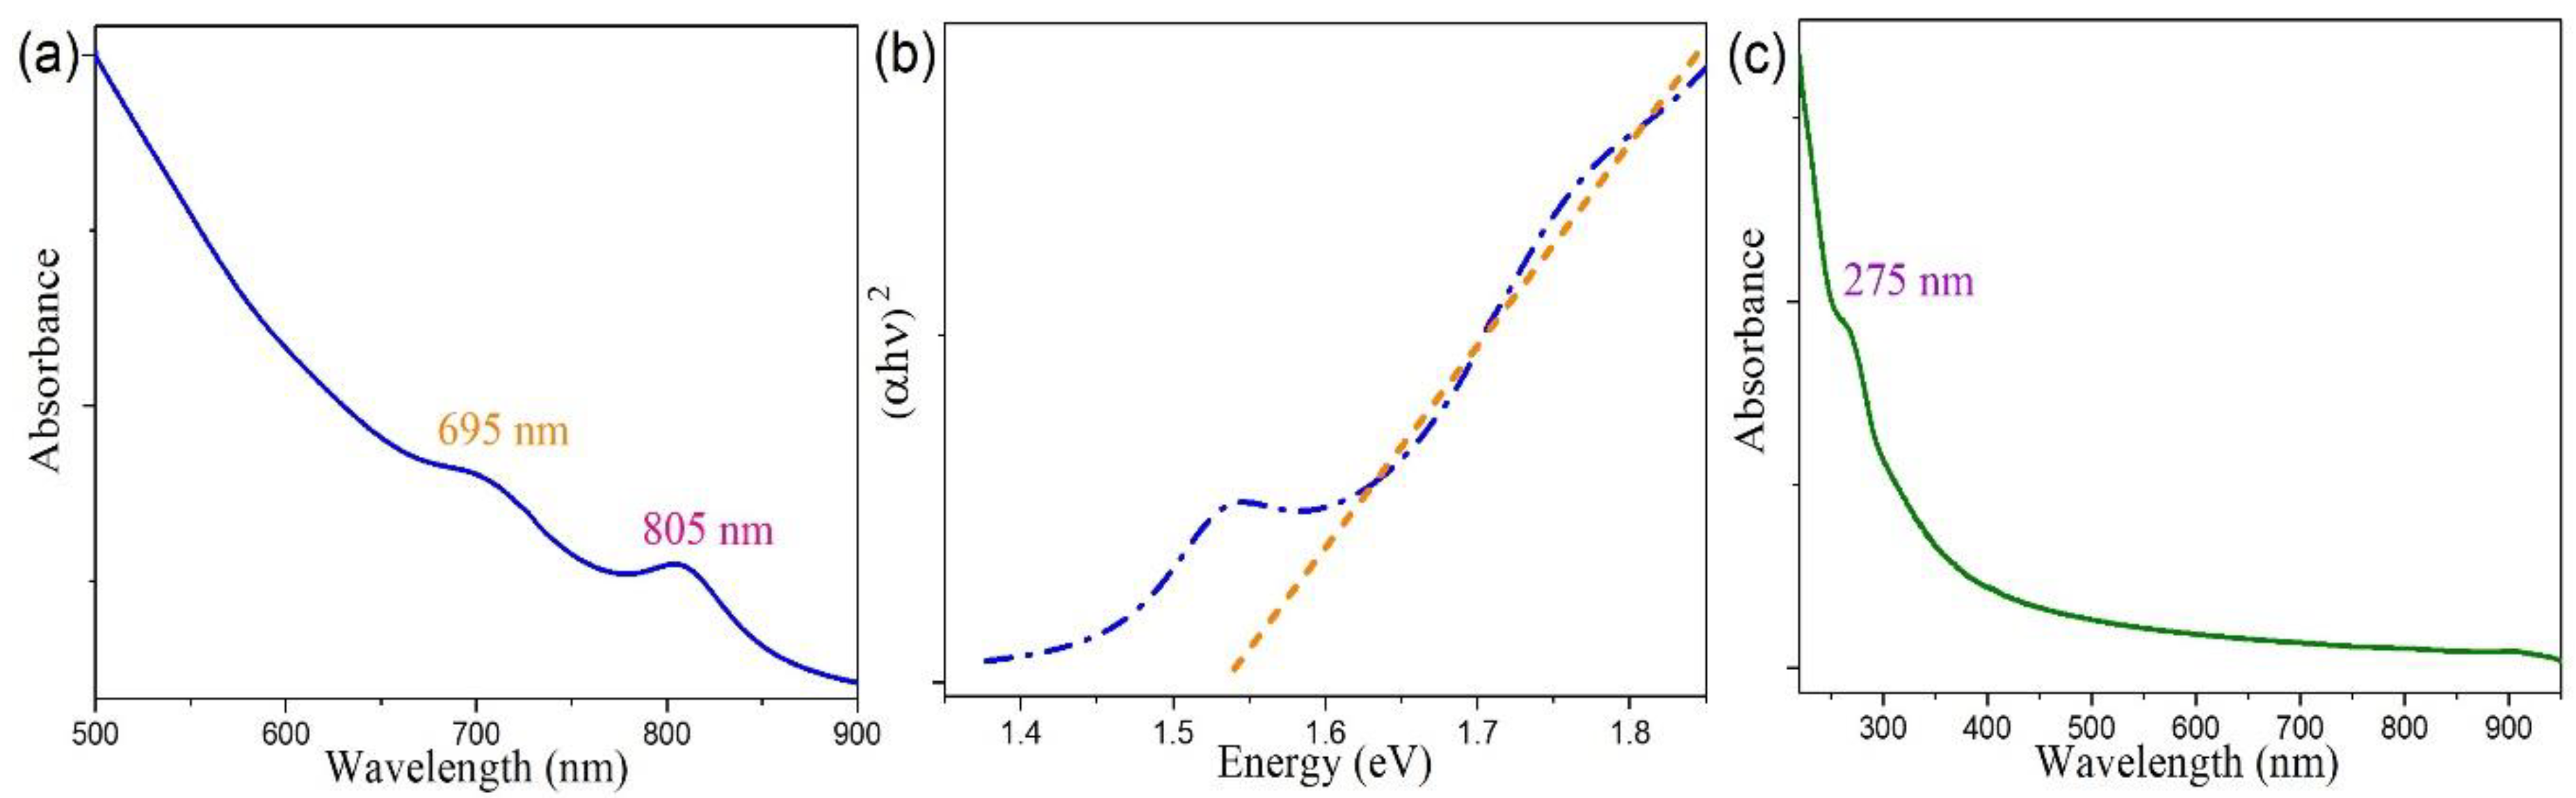
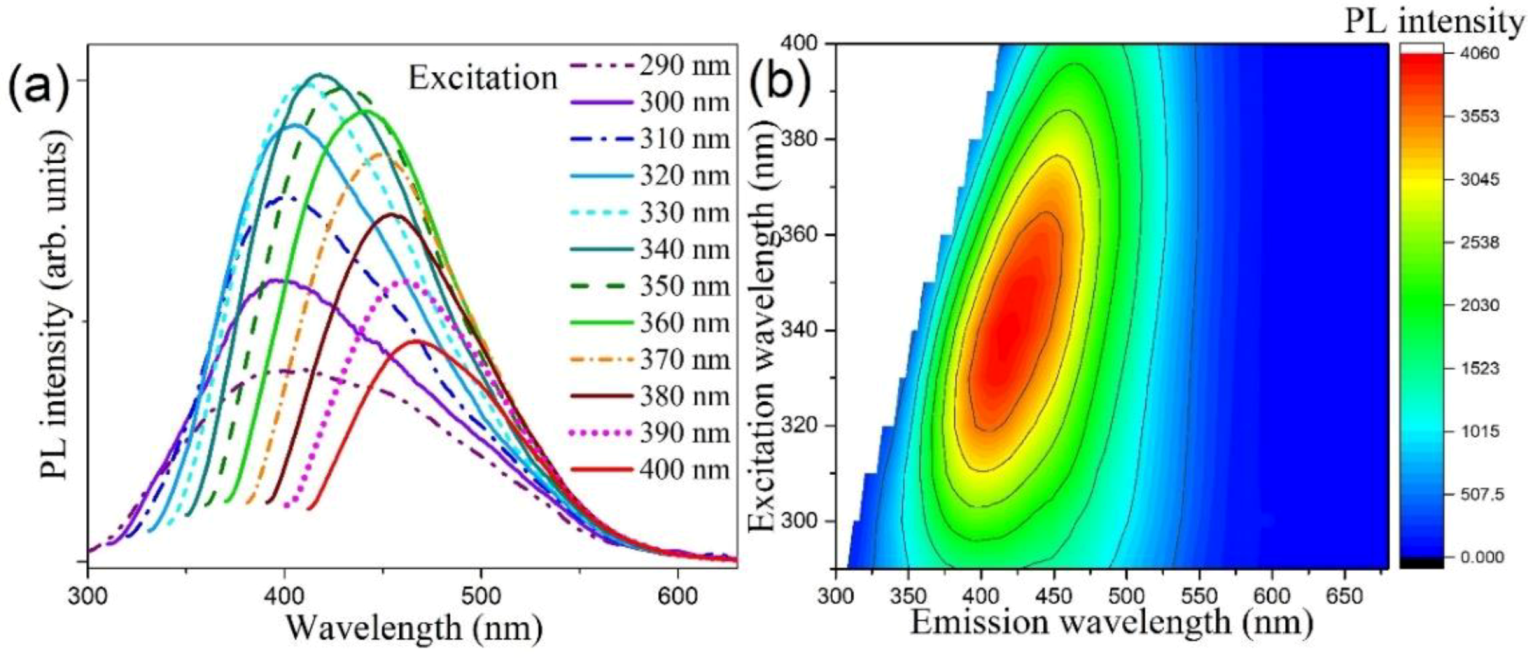
3.3. Optical Property Studies

It is known that the dimensionality strongly affects the optical properties of nanoscale semiconductors. The optical absorption spectrum of the resultant CTAB-MoSe2 nanosheets in dispersion is displayed in Figure 5a. The evident absorption peaks at 805 and 695 nm can be easily identified and they are attributed to the characteristic resonances of A and B excitons, respectively [45,46,47]. Their origin is derived from the transitions between the spin-orbit split valence bands and the lowest conduction band at K and K’ points of the Brillouin zone. Moreover, it is worth of noting that the determined energy separation of 244 meV between the A and B excitonic states is consistent with a previous study on the energy splitting of the exciton states in ultrathin MoSe2 nanosheets [48]. Therefore, it provides a quantitative proof of pronounced quantum confinement effect in our exfoliated 2D MoSe2 nanosheets. The facile and conventional way to address the optical band gap is by means of the Tauc plot. The absorption coefficient α of a direct band-gap semiconductor can be related to photon energy hυ by (αhυ)2 = A (hυEg), where A is a constant and Eg is the optical band gap. Figure 5b plots the relationship of (αhυ)2 versus hυ, which demonstrates a linear dependence. The calculated optical gap for the apparent absorption is 1.54 eV (805 nm), which exactly coincides with the A excitonic states and highlights the 2D nature of CTAB-MoSe2 nanosheets.
The optical absorption spectrum of the as-prepared 0D MoSe2 QDs is in sharp contrast with their 2D counterpart, as shown in Figure 5c. Here, the A and B excitonic features in the absorption completely disappeared. Instead, the absorption feature comprised two absorption bands. The prominent band is centered at around 275 nm, which is ascribed to the intrinsic excitonic absorption of the QDs [49,50]. Such a significant blue-shift of the excitonic features directly reflects the dominating quantum confinement effect and is in accordance with previous studies on other TMD QDs [32,51]. Furthermore, there exists another mild absorption band at longer wavelengths. It is wide and centered about 325 nm with a tail extending to ~400 nm, which will be commented upon later.
Photoluminescence (PL) spectroscopy provides a complimentary optical means to probe the electronic structure of semiconductor materials [52,53]. The distinct optical property of TMD QDs is well-suited to be further evidenced by the PL technique. It is easily found that our MoSe2 QDs dispersed in aqueous solution emit strong blue fluorescence under irradiation with a typical UV lamp. It is due to the weak interlayer coupling and enhanced quantum efficiency of MoSe2 QDs, which is another signature of TMD QDs [54]. To gain a comprehensive view of the emission property, the PL spectra of resultant MoSe2 QD dispersion were further taken with different excitation wavelengths, as shown in Figure 6a. It is observed that when the excitation wavelength was increased from 290 to 400 nm, the PL peak position monotonically increased from 390 to 470 nm. Similar excitation-dependent PL behavior has been reported in a few TMD QD reports [32]. In a strong quantum confinement regime, photons with higher energies resonantly excites smaller QDs with wider band gaps, pushing the emission peak to shorter wavelengths. Accordingly, the characteristic excitation-dependent PL behavior derives from the polydispersity of the synthesized QDs. This idiosyncratic variation of PL intensity in response to varying excitation wavelengths can be clearly presented by the 2D color-converted PL contour map as depicted in Figure 6b. We found the strongest emission peaked at 418 nm under an excitation wavelength of 340 nm. This specific wavelength falls coincidentally within the observed absorption band around 325 nm. Thus the close correspondence between the absorption and the emission of the synthesized QDs can be revealed by our optical characterizations.
Raman spectroscopy was adopted to acquire additional insight into the optical characteristics of 2D CTAB-MoSe2 nanosheets. In general, group theory analysis permits bulk TMDs to have four Raman-active modes. However, only two modes are accessible in typical experimental configuration, namely, out-of-plane A1g and in-plane E12g modes. The inset sketch in Figure 7 depicts these two principal Raman-active vibration modes of MoSe2. Figure 7 compares the Raman spectra of both MoSe2 bulk and 2D CTAB-MoSe2 nanosheets. For MoSe2 bulk, the A1g mode is located at 239.4 cm−1 while the in-plane E12g mode appears at ≈285.5 cm−1, which match nicely with literature values [55]. The A1g mode for CTAB-MoSe2 nanosheets is red-shifted to 237 cm−1, which is attributed to the softening of the vibrational mode [56]. The reduced inter-planar restoring force is another proof for the 2D few-layer structure. In addition, a new peak emerges on the lower-frequency side of the A1g peak. It is ascribed to Davydov splitting of the A1g mode that is accompanied by the suppressed interlayer interaction as reported in TMD nanosheets [57,58]. In contrast, the E12g mode for CTAB-MoSe2 shifts to 302 cm−1. The dielectric screening of the long-range Coulomb interaction and the surface effects of TMD materials were proposed to be responsible for this blue-shift [59]. The increased energy splitting between the two allowed Raman peaks is in accord with the 2D nature of our CTAB-MoSe2 [60,61].

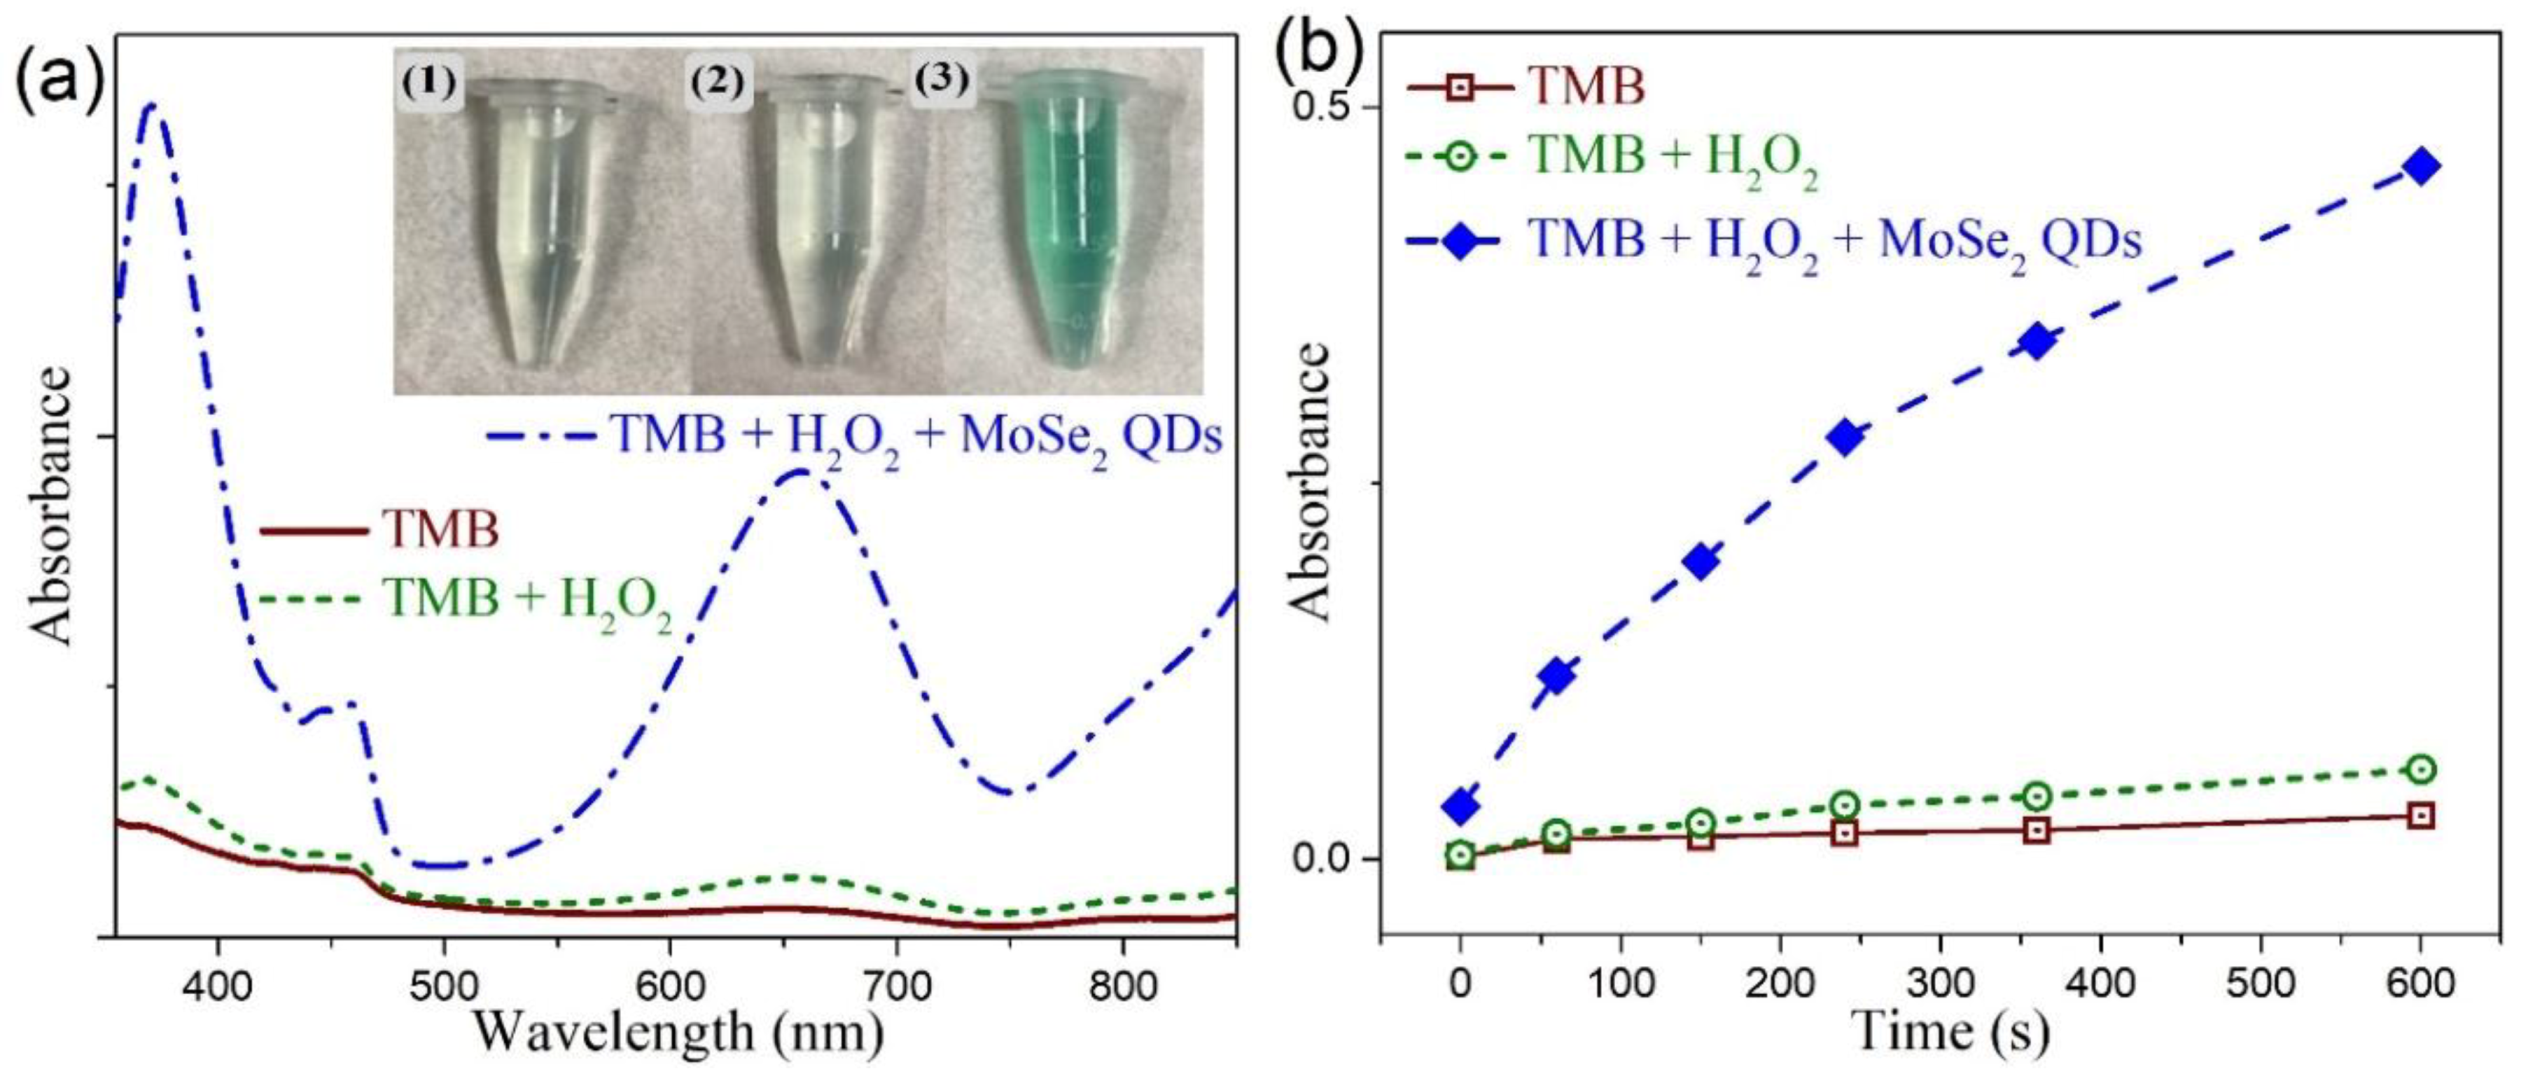
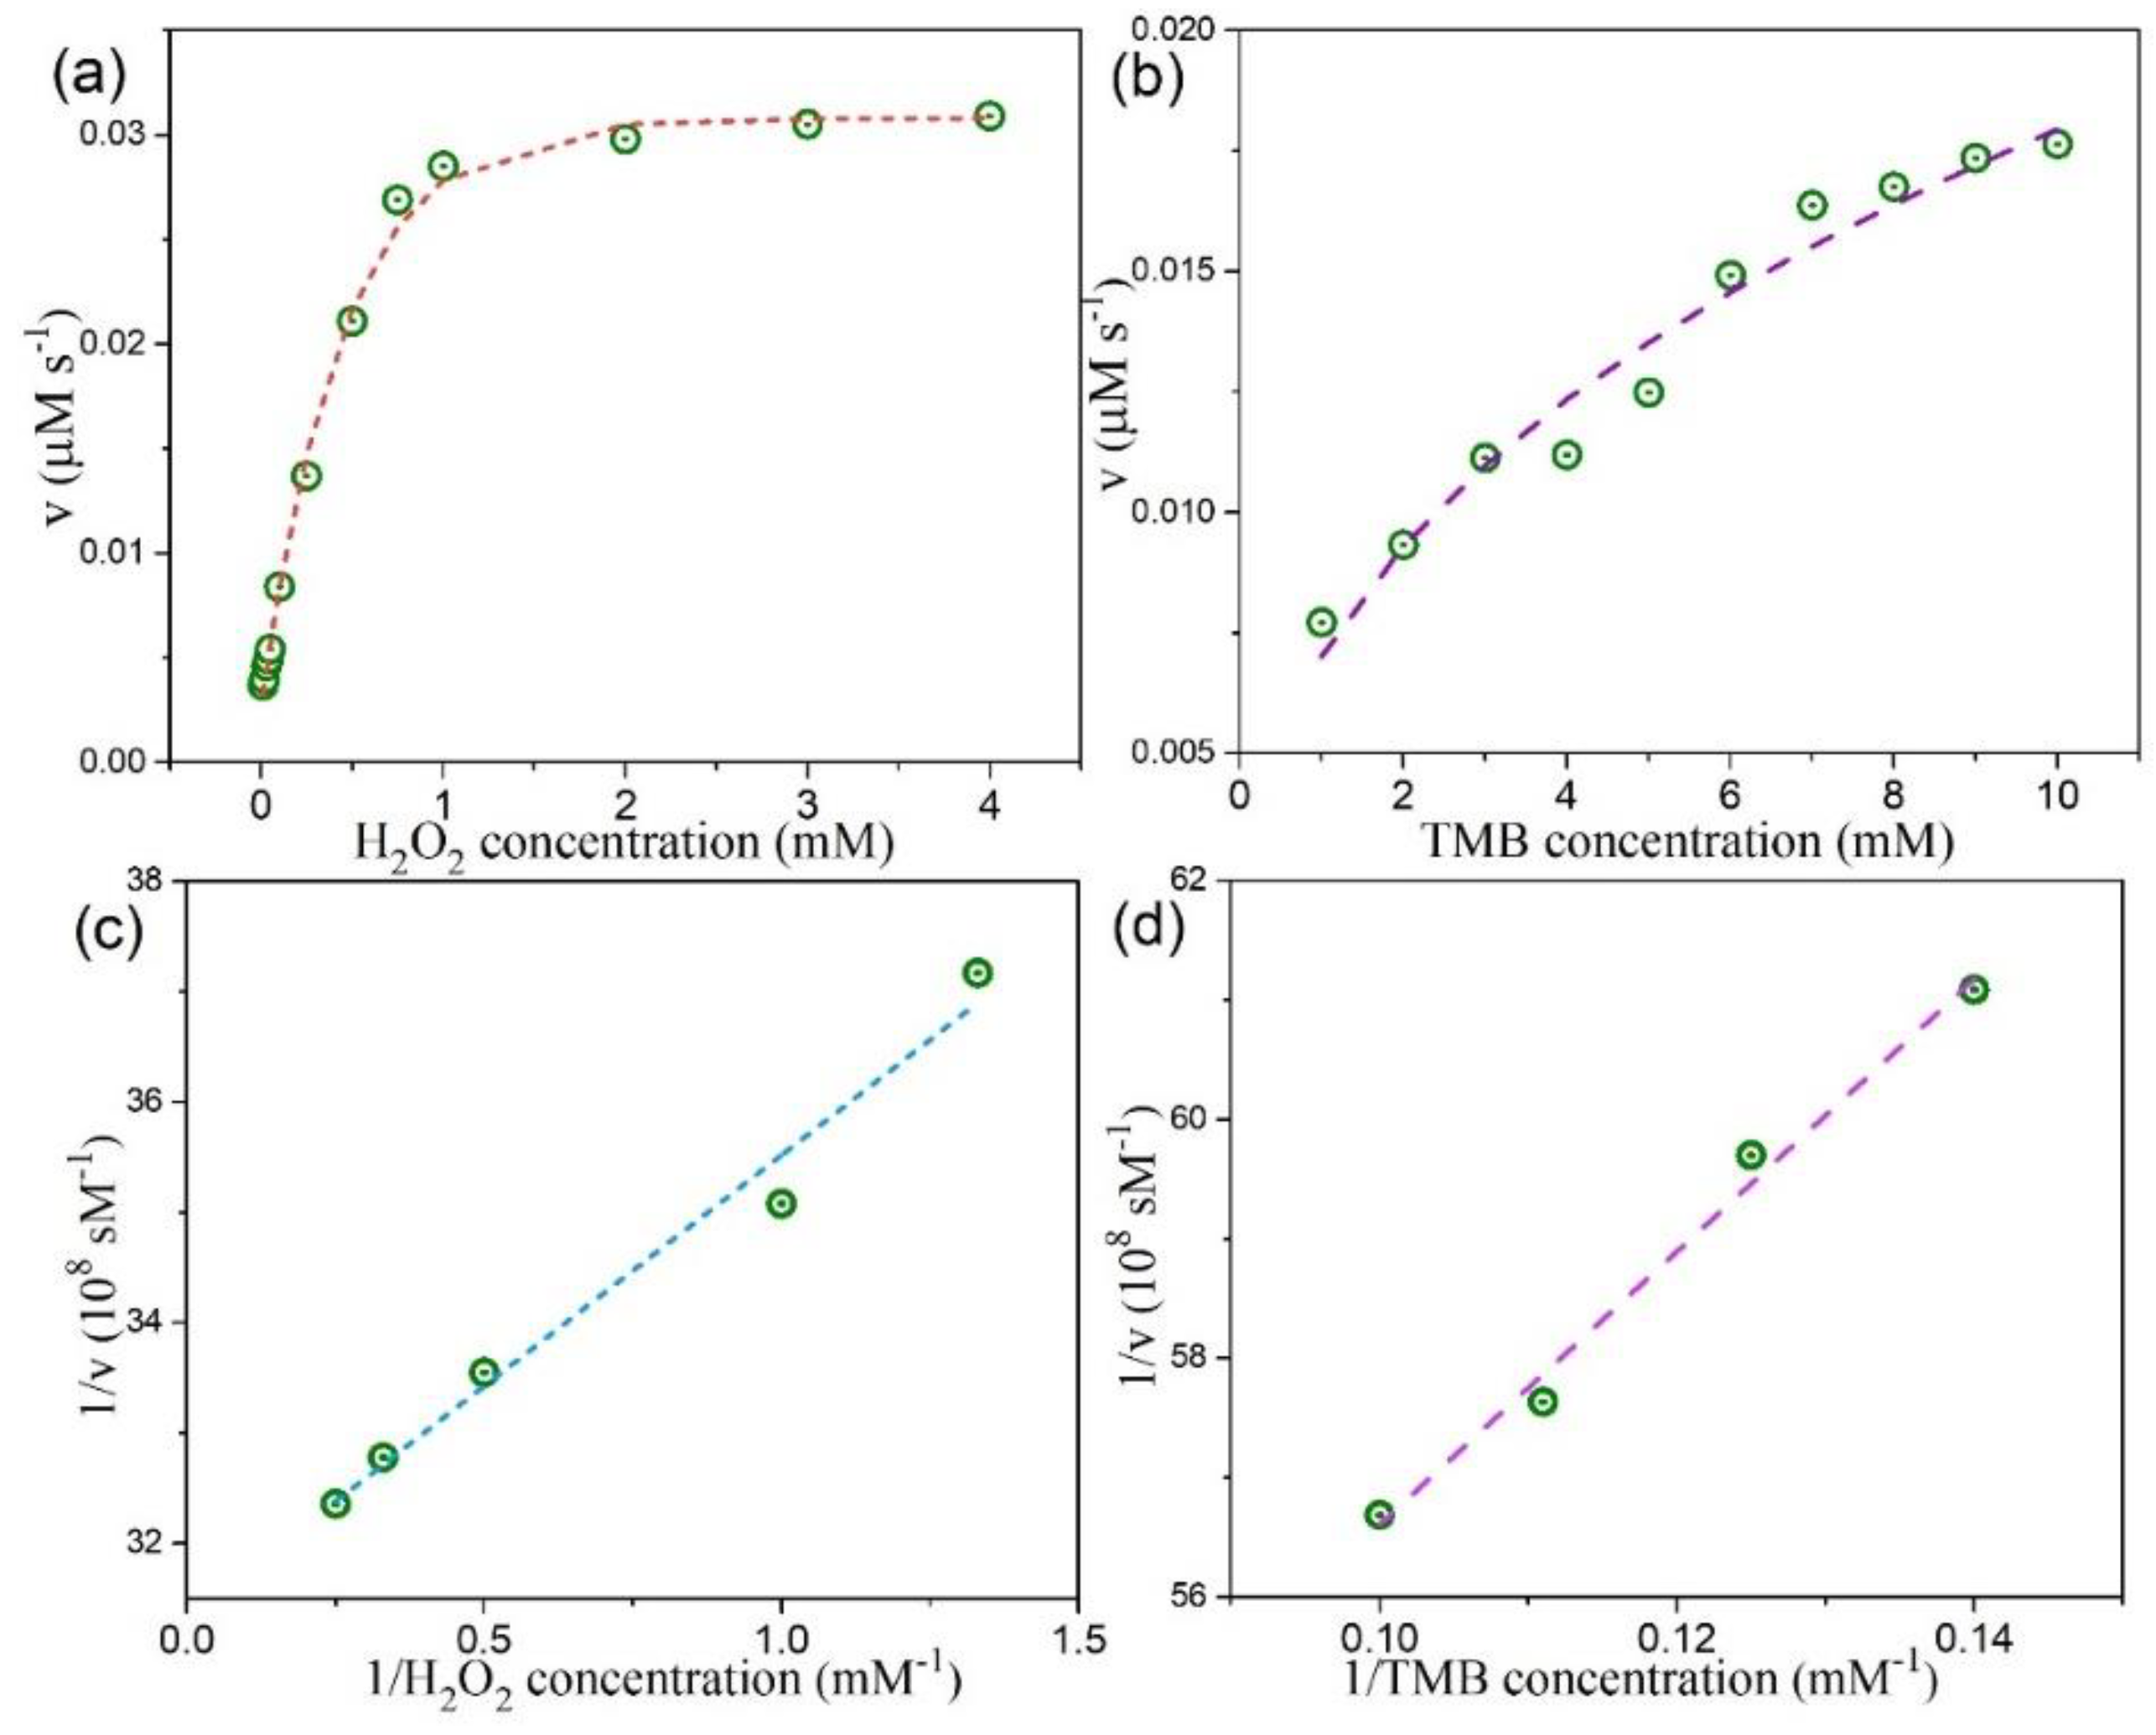
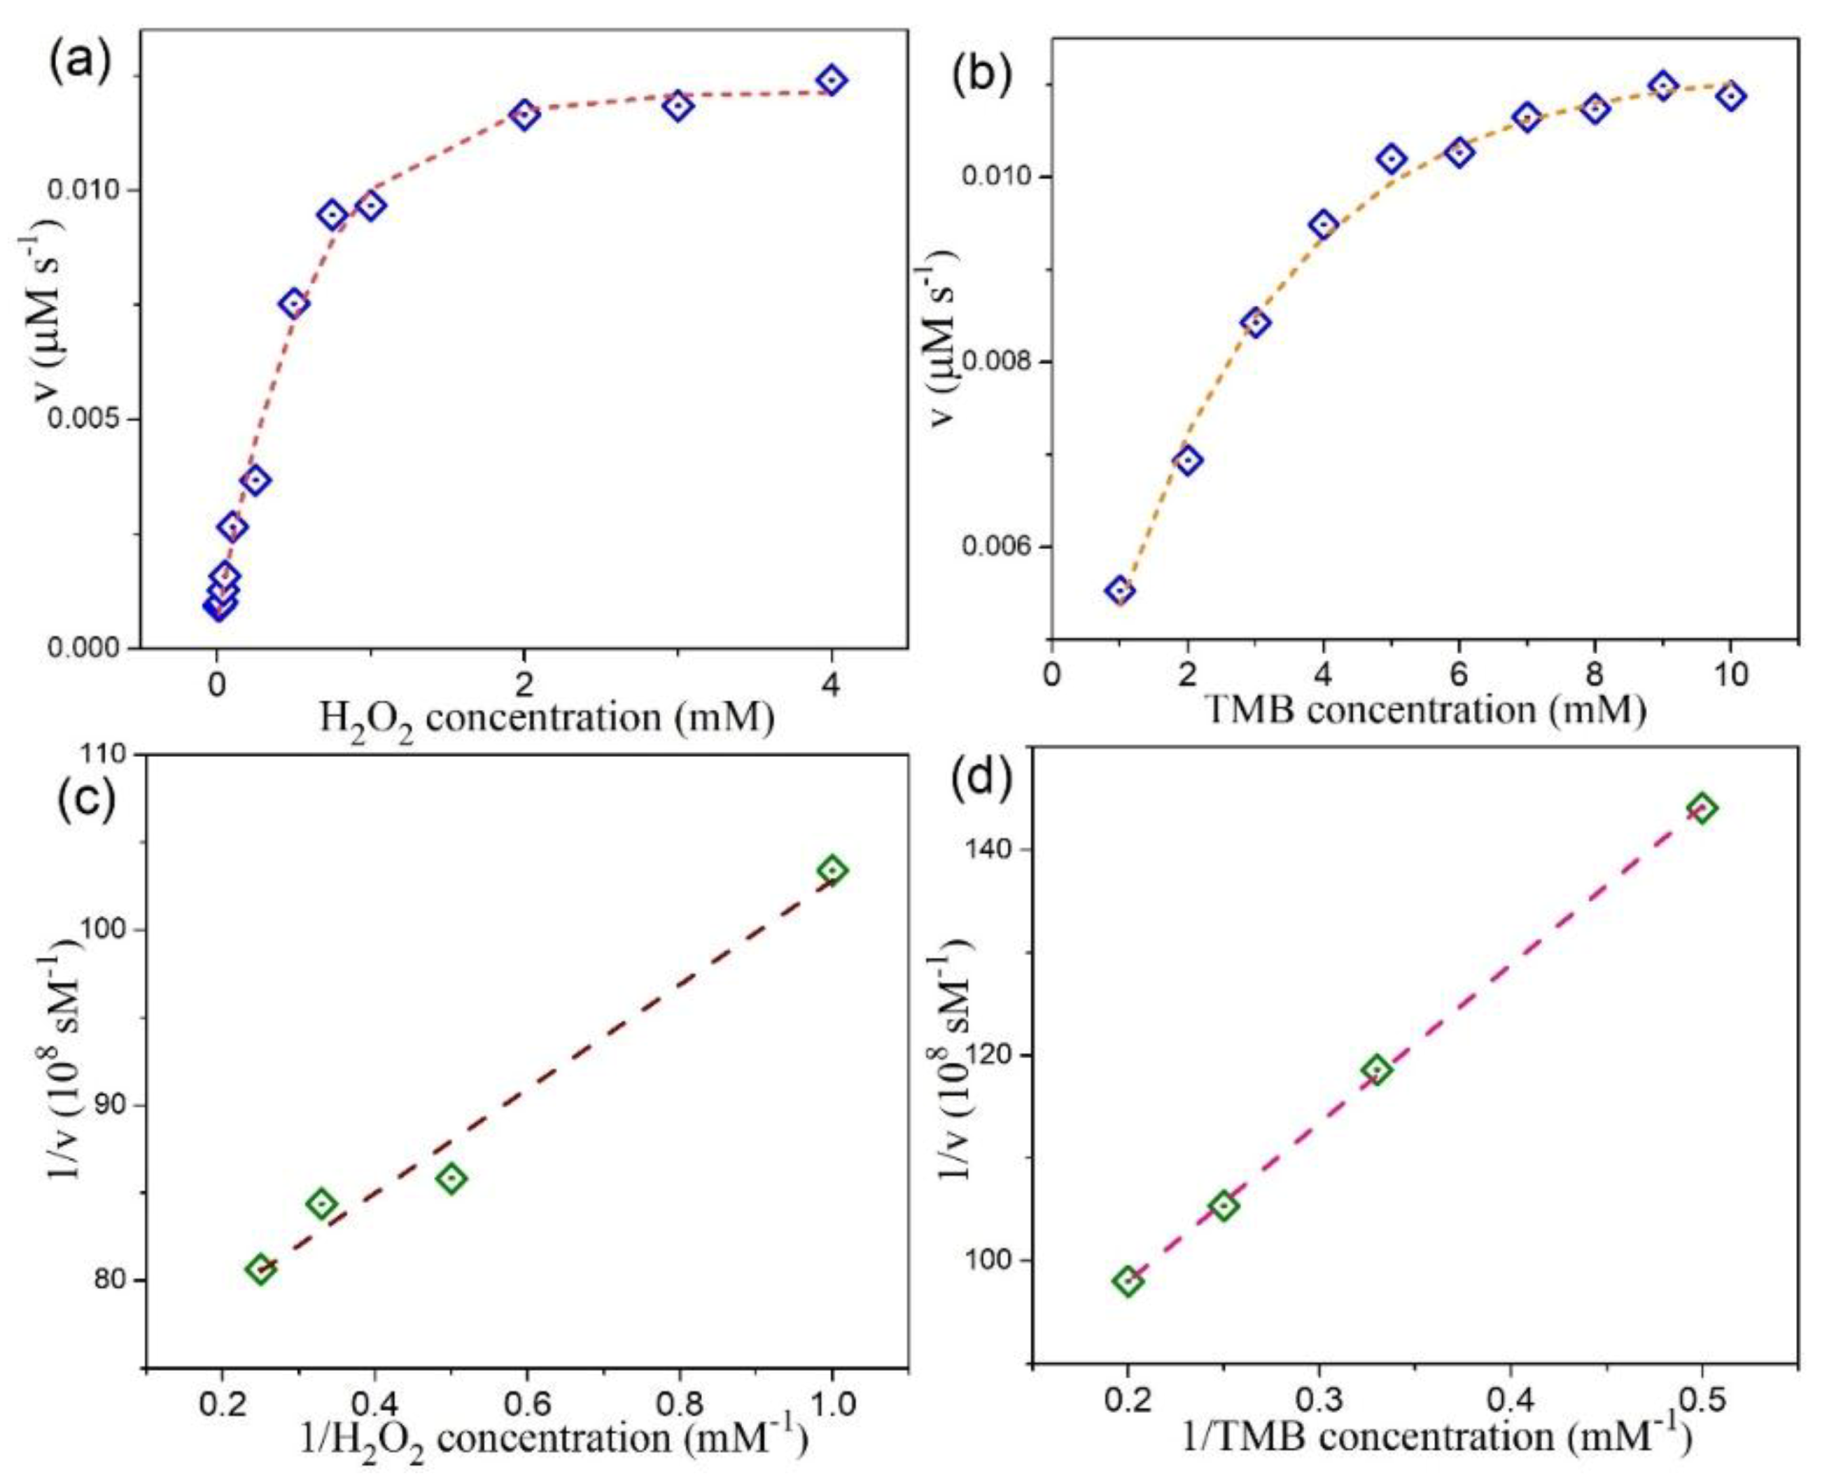
3.4. Peroxidase-Like Activities and Steady-State Kinetic Assay

We evaluated the peroxidase-like activity of MoSe2 QDs by using the catalytic oxidation of TMB in the presence of H2O2, as shown in Figure 8a. The absorption spectrum of the TMB solution showed it is colorless. When only H2O2 was incubated with TMB, the TMB–H2O2 systems showed rather weak absorbance at 652 nm. Yet as TMB coexisted with H2O2 and the MoSe2 QDs, a prominent absorption peak of the oxidation products of TMB at 652 nm was observed. Moreover, the color contrast of these system is presented in the inset of Figure 8a. It can be seen that the bare TMB and the TMB–H2O2 systems are virtually colorless to the naked eye, while TMB–H2O2–MoSe2 QDs system showed an apparent color variation. Figure 8b display time-dependent absorbance changes at 652 nm of these systems. It clearly shows the absorbance at 652 nm increased as the time increased for TMB–H2O2–MoSe2 QDs system. This means that the prepared MoSe2 QDs possess the peroxidase-like catalysis capability, which effectively catalyze the oxidation of TMB by H2O2. On the contrary, rather insignificant and slow oxidation of TMB by the presence of H2O2 was found for the reference TMB–H2O2 system. Our results thus demonstrated that the MoSe2 QDs can facilitate the oxidation of TMB to oxTMB in the presence of H2O2 to generate observable color changes. An identical result was also found for our 2D CTAB-MoSe2 nanosheets (not shown here).
The kinetic parameters of the peroxidase-like reaction were harvested by employing the steady-state kinetics analysis. With H2O2 and TMB as substrates, the measurements were carried out by changing the concentration of one substrate while keeping the other substrate concentration constant. This generates the typical Michaelis–Menten curves, as shown in Figure 9a,b for our MoSe2 QDs. For 2D CTAB-MoSe2 nanosheets, these curves are plotted in Figure 10a,b. The relevant kinetic parameters like the Michaelis–Menten constant (Km) and the maximal reaction velocity (Vmax) can be extracted from the Lineweaver–Burk plot according to the relation: 1/v = (Km/Vmax) × (1/[S]) + 1/Vmax, where v stands for the initial velocity and [S] signifies the concentration of the substrate [62,63]. Figure 9c,d display the L-B plot for our 0D MoSe2 QDs while Figure 10c,d illustrate the L-B plot for 2D CTAB-MoSe2 nanosheets. The calculated results are listed in Table S1. The Km value is regarded as an important index that measures the binding affinity of enzyme to the substrates. A smaller value of Km usually indicates a higher affinity between the enzyme and the substrate. It is found that the Km value of 2D CTAB-MoSe2 for H2O2 is lower than that of MoSe2 QDs, suggesting a higher affinity of 2D CTAB-MoSe2 to H2O2 than MoSe2 QDs. Meanwhile, the lower Km value of MoSe2 QDs to TMB represents its higher affinity in this respect. In addition, the parallel slope of the lines in the double-reciprocal plots of initial velocity versus different concentrations of one substrate reveals a ping-pong mechanism in the catalytic reaction [64,65,66]. This indicates that both of our MoSe2–based enzymes bound and reacted with the first substrate and the first product was subsequently released before the reaction with the second substrate.

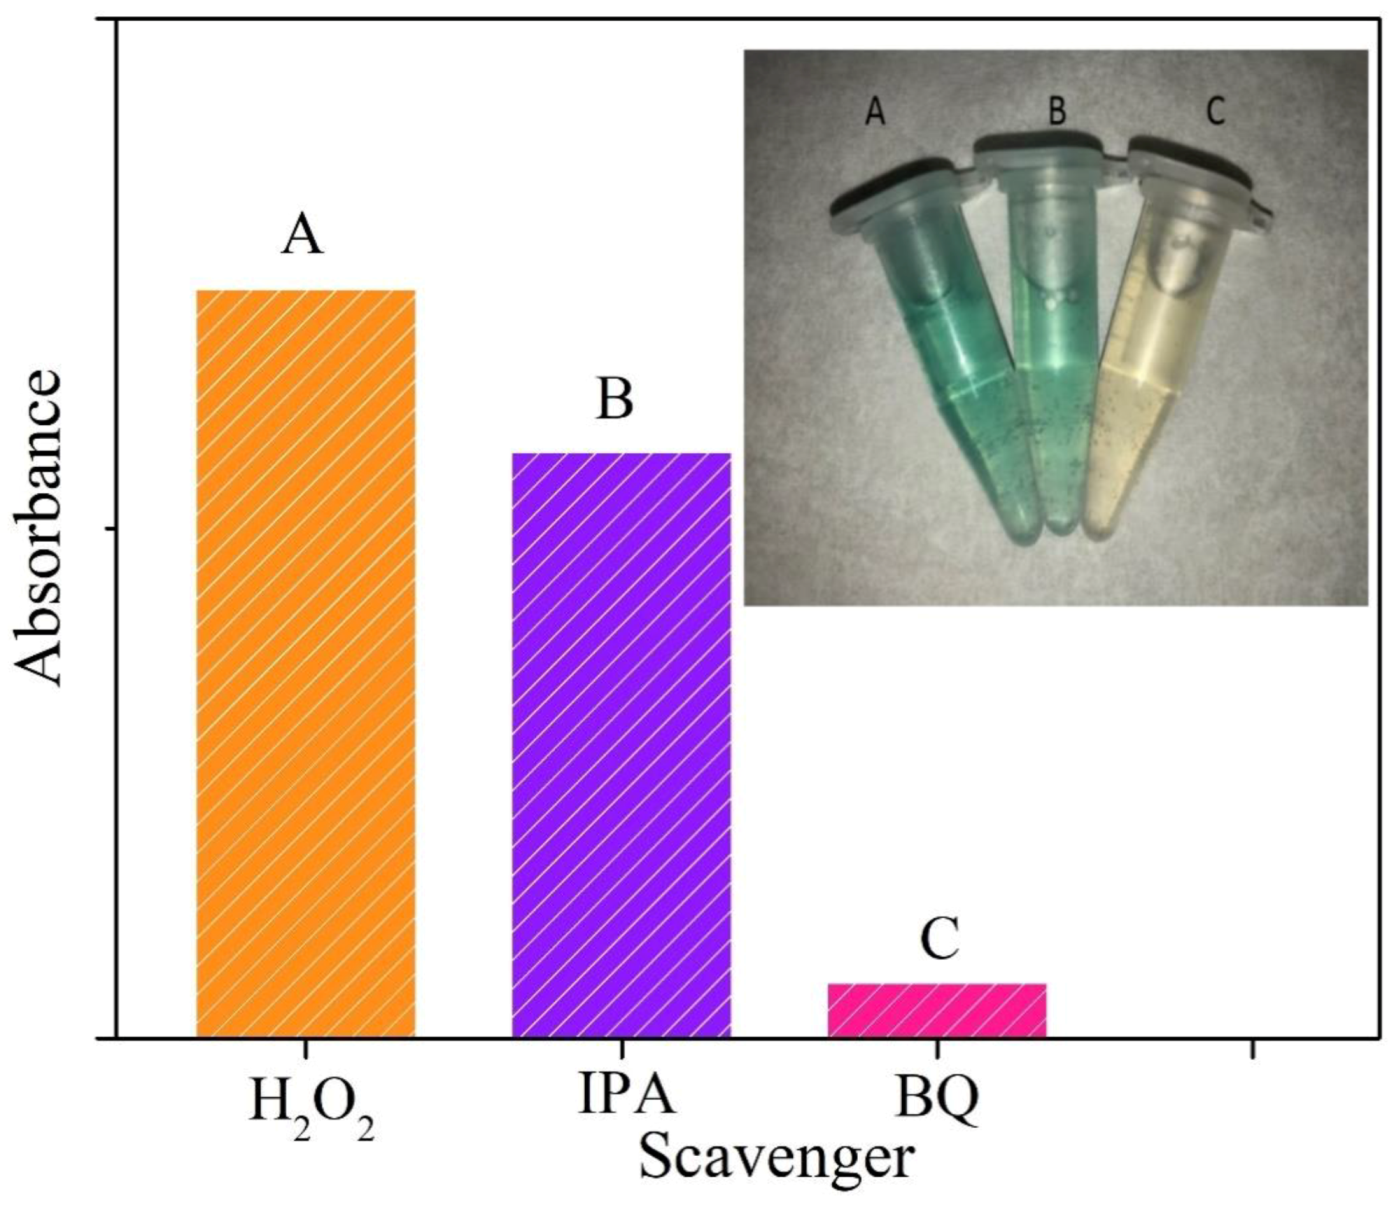
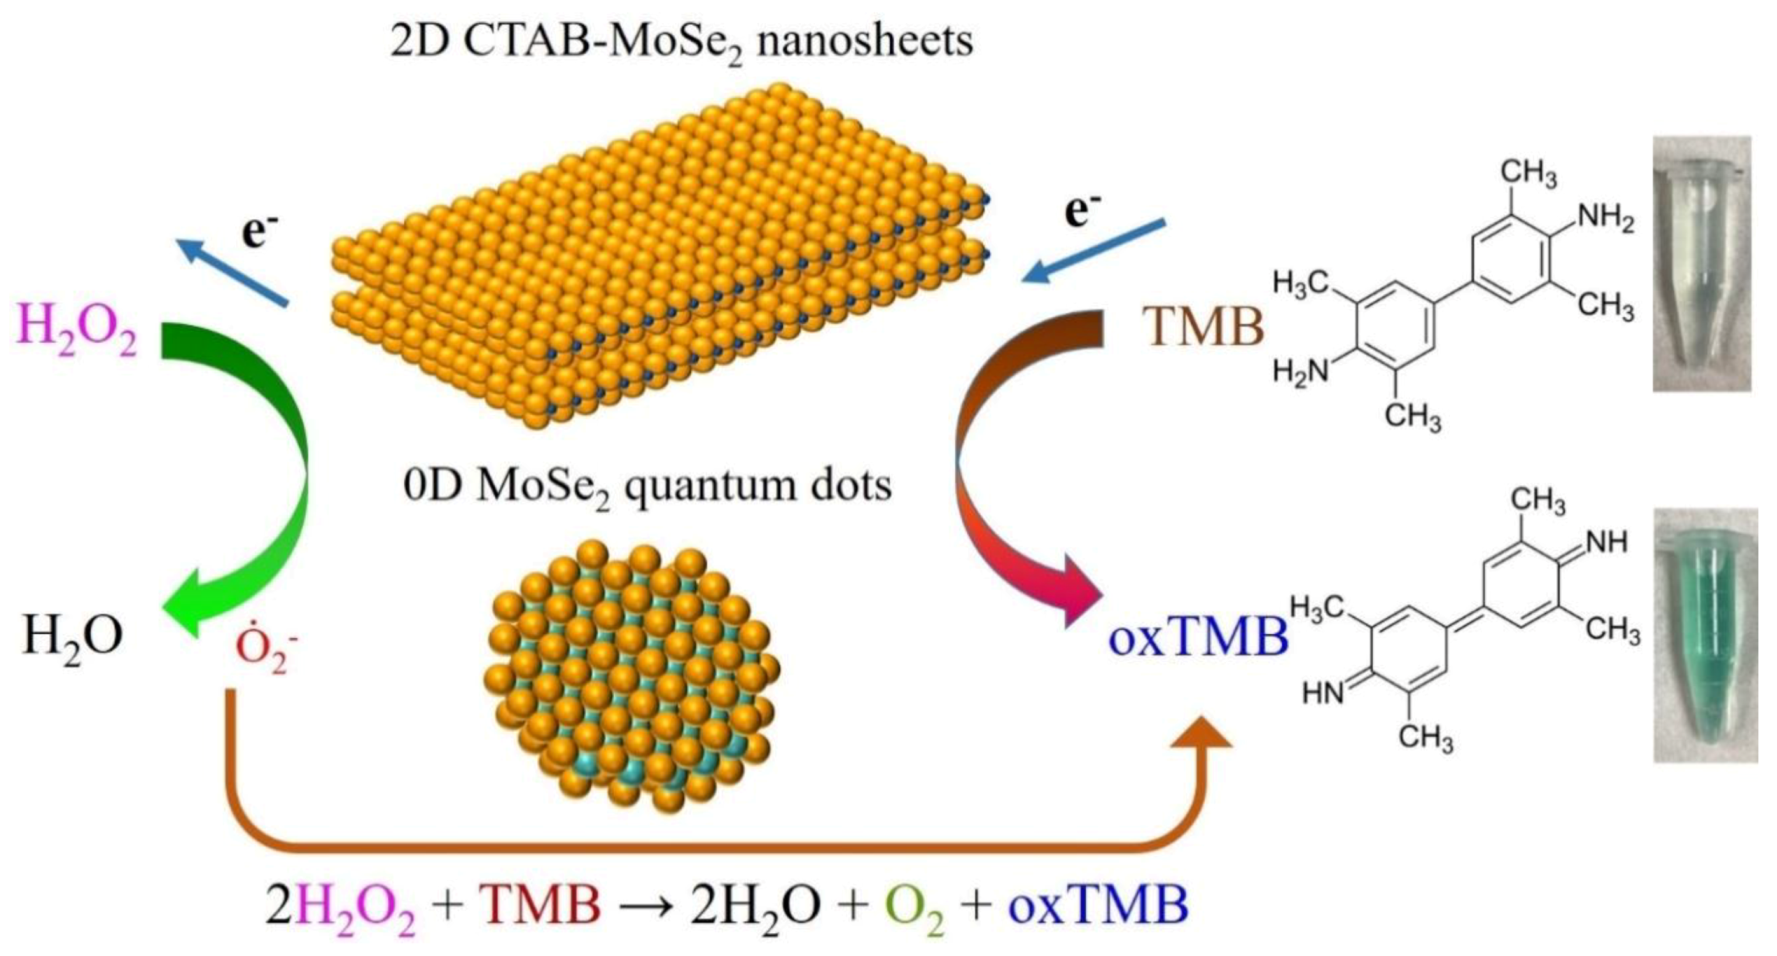
3.5. Actives Species Trapping Tests and Peroxidase-Like Catalytic Mechanism

To confirm the prime species responsible for the peroxidase-mimetic catalytic activities of our artificial MoSe2–based enzymes, scavenger tests were employed. It is known that reaction systems involving hydrogen peroxide usually abound with reactive radicals such as ȮH and Ȯ2. Then IPA and benzoquinone (BQ) were taken to be the scavengers in the reaction system for ȮH and Ȯ2 radicals, respectively. Figure 11 shows the results of active species trapping tests of our reaction system. We found that the suppression of characteristic absorption and color fading were not evident with the addition of IPA. On the other hand, significant decrease in absorption and color contrast can be seen when BQ was added. This indicates that Ȯ2 radical plays the major role to oxidize TMB to produce a TMB oxide and generate color contrast. Based on our finding and several previous reports [67,68], we propose the peroxidase-like catalytic mechanism of our MoSe2–based enzymes, which is illustrated in Figure 12. In the reaction process, TMB molecules are absorbed on the surface of MoSe2–based nanomaterials and act as the chromogenic electron donors. These molecules transfer their lone-pair electrons to MoSe2 from the amino groups, leading to the enhancement of electron density and mobility on the surface of MoSe2-based catalyst. In turn, it accelerates the electron migration from MoSe2–based catalyst to hydrogen peroxide. The one-electron transfer reaction generate a large amount of Ȯ2 radicals that oxidize TMB and form blue-green product. Briefly, the MoSe2-based catalyst promote the electron transfer from TMB to H2O2, resulting in the oxidation of TMB and reduction of hydrogen peroxide. The production of colored oxTMB and water in this system can be expressed by the equation H2O2 + TMB → 2H2O + O2 + oxTMB.

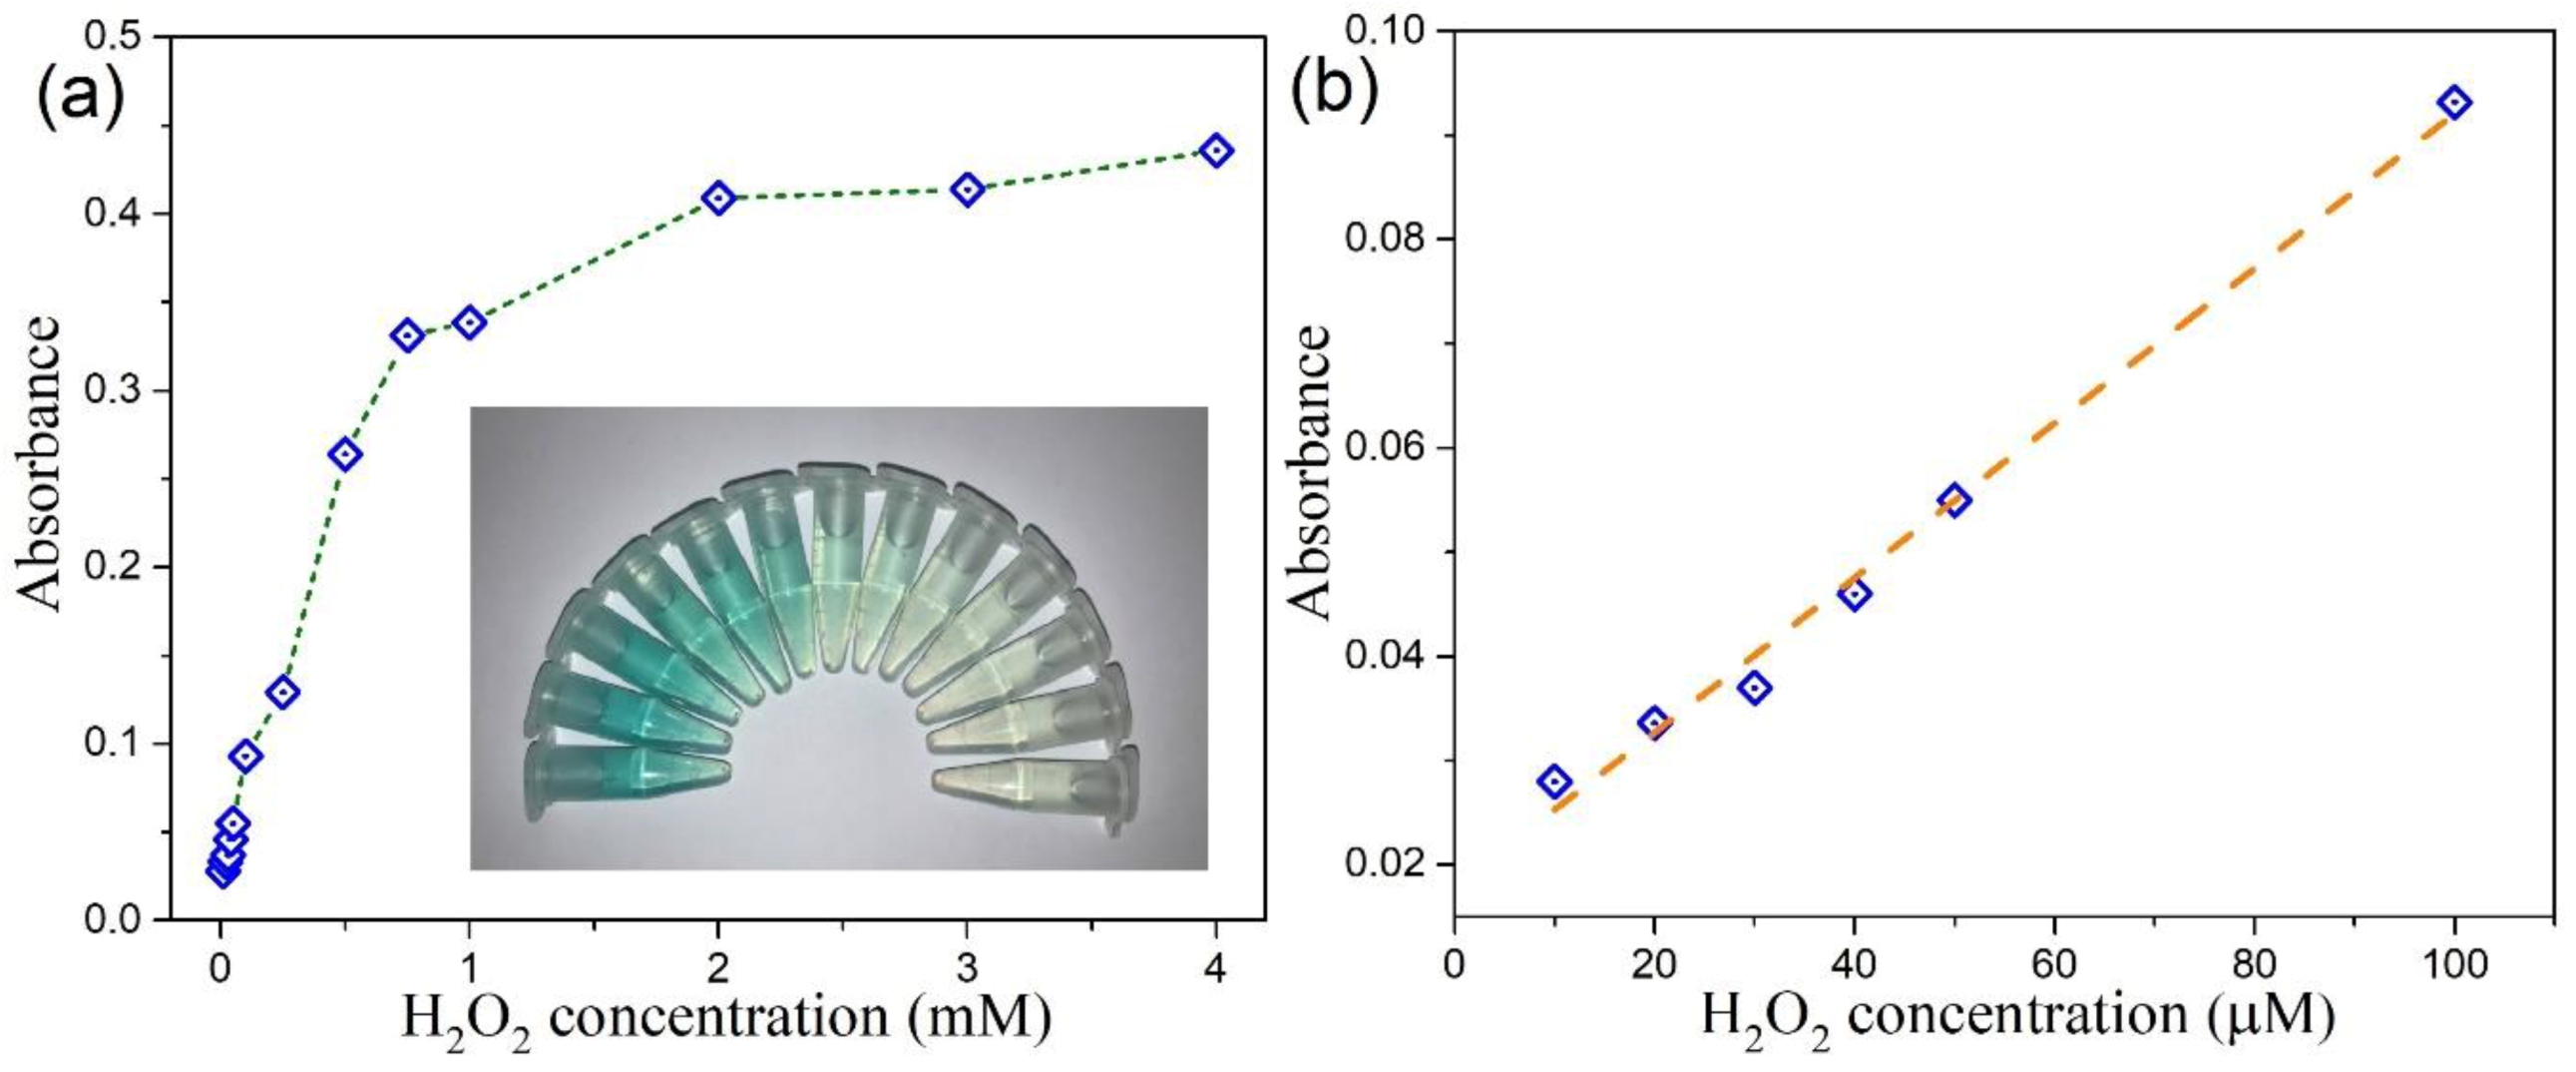
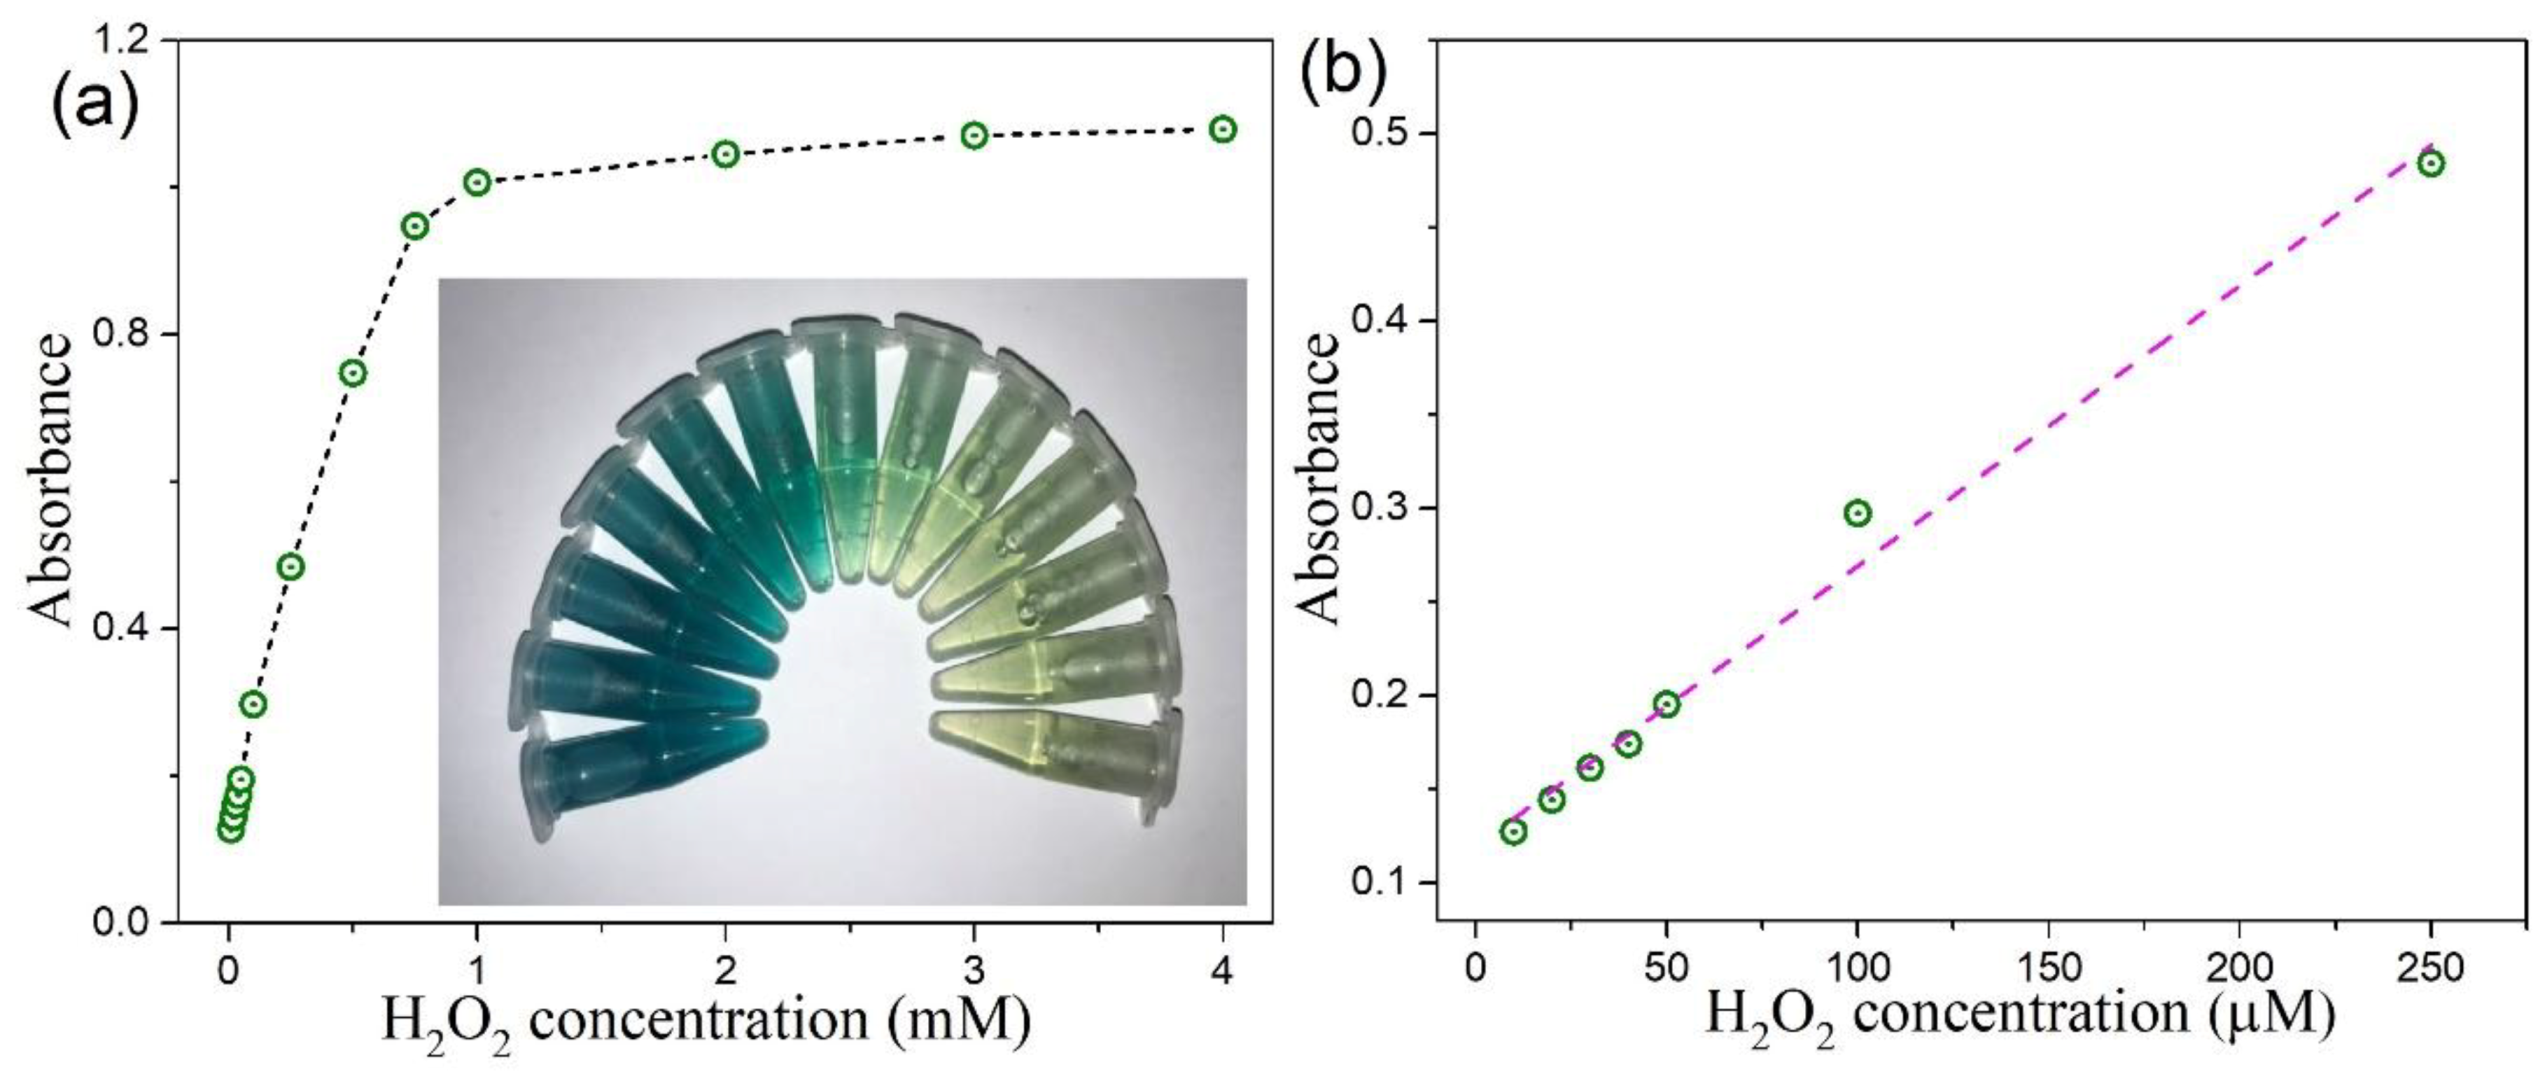
3.6. Colorimetric Detection of H2O2 by MoSe2-Based Assay System

In view of the intrinsic peroxidase-like property of as-prepared MoSe2–based catalysts, a colorimetric strategy for the detection of H2O2 was established. The absorption spectra of TMB–H2O2–MoSe2 QDs system with different H2O2 concentration is presented in Figure S1. It can be seen that the characteristic absorption of TMB at 652 nm is dependent on the concentration of H2O2 varied from 10 μM to 4 M. Analogous results can be found with our TMB–H2O2–2D CTAB-MoSe2 system, as shown in Figure S2. Figure 13a and Figure 14a display the absorbance variations at 652 nm of the oxidized TMB in the presence of H2O2 with different concentrations for the TMB–H2O2–MoSe2 QDs system and TMB–H2O2–2D CTAB-MoSe2 system, respectively. Besides, the corresponding image in response to the change of H2O2 is shown in the insets of Figure 13a and Figure 14a, which shows the color variation could be seen by the naked eye. For TMB–H2O2–MoSe2 QDs system, the H2O2 concentration-response curve has a linear relationship in the range of 10 μM to 100 μM with a detection limit of 4 μM, as illustrated in Figure 13b. Figure 14b draws the calibration curve for H2O2 with a linear range from 10 to 250 μM for the TMB–H2O2–2D CTAB-MoSe2 system. The detection limit was also reckoned to be around 4 μM. It shows that the TMB–H2O2–2D CTAB-MoSe2 system could have a wider linear range compared with that of the TMB–H2O2–MoSe2 QDs system. Finally, we compare some representative colorimetric detections of H2O2 by using novel 2D materials in Table 1 [69,70,71,72]. It can be seen that the colorimetric sensing ability of H2O2 based on the peroxidase-like property of our MoSe2-based catalyst is comparable to other reported 2D materials-based colorimetric platforms. Therefore, our work provides a facile, simple, cost-effective, and alternative 2D materials-based colorimetric sensing platform for sensitive detection of H2O2. In principle, this sensing platform can be applied to a few diverse applications, yet proper selectivity tests should then be imposed to understand the specific accuracy in the measurement [31,73,74,75].

4. Conclusions

In summary, we prepared 2D and 0D MoSe2 nanostructures based on systematic and non-toxic top-down strategies. The characteristic excitation-dependent PL of the MoSe2 QDs can be attributed to the polydispersity of the synthesized QDs. The Raman shift of ultrathin MoSe2 nanosheets manifests the 2D nature of its structure. We demonstrated that these MoSe2 nanostructures possess intrinsic peroxidase-like activity in that they can facilitate the oxidation of TMB in the presence of H2O2, generating a visible color reaction. For the catalysis mechanism, kinetic analysis indicates that the catalytic reaction follows the typical Michaelis–Menten theory and a ping–pong mechanism. Moreover, active species study shows that Ȯ2 plays a pivotal role in the peroxidase-like catalytic reaction. Based on the color reaction of TMB catalyzed by our MoSe2 nanomaterials, we have developed a new colorimetric method for H2O2 detection by using 2D and 0D MoSe2 nanostructures as peroxidase mimetics. It is shown that the colorimetric sensing capability of our MoSe2 catalysts is comparable to other 2D materials-based colorimetric platforms. Overall, the synthesis strategy we proposed is environmentally friendly and economic, and it can easily be adapted to construct novel inorganic low-dimensional enzyme-free mimetic with intrinsic catalytic activity. The potential of the presented 2D and 0D MoSe2 nanostructures for use as a catalyst in other oxidation reactions could be explored in the extended study and this could create a new opportunity for this enzyme-mimicking MoSe2 nanostructures in many significant fields, such as environmental protection, food monitoring, medical diagnostics, and photocatalysis.

Supplementary Materials

The following are available online at https://www.mdpi.com/2079-4991/10/10/2045/s1, Figure S1: UV–vis absorption spectra of MoSe2 QDs with different concentrations of H2O2, Figure S2: UV–vis absorption spectra of 2D CTAB-MoSe2 NSs with different amounts of H2O2, Table S1: Michaelis–Menten parameters of the 2D CTAB-MoSe2 NSs and 0D MoSe2 QDs.

Author Contributions

Conceptualization, D.-R.H. and Y.-Q.P.; methodology, Y.-Q.P. and K.H.S.; validation, Y.-Q.P., K.H.S. and S.E.I.; formal analysis, Y.-Q.P. and K.H.S.; investigation, Y.-Q.P. and K.H.S.; data curation, D.-R.H. and Y.-Q.P.; writing—original draft preparation, D.-R.H. and Y.-Q.P.; writing—review and editing, D.-R.H. and C.-T.L.; resources, H.-F.W. and M.M.C.C.; supervision, D.-R.H.; project administration, D.-R.H.; funding acquisition, D.-R.H. and C.-T.L. All authors have read and agreed to the published version of the manuscript.

Funding

This work was supported by the Ministry of Science and Technology, Taiwan under grant Nos: MOST 108-2221-E-110-044, MOST 109-2811-M-002-634, and MOST 108-2119-M-002-025-MY3.

Acknowledgments

We acknowledge financial support from Center of Crystal Research, National Sun Yat-sen University, Kaohsiung, 80424, Taiwan. We thank Yuan-Kuei Hu for valuable help with the AFM characterization.

Conflicts of Interest

The authors declare no conflict of interest.

References

  1. Zhu, J.; Wang, S. In situ growth of copper oxide-graphite carbon nitride nanocomposites with peroxidase-mimicking activity for electrocatalytic and colorimetric detection of hydrogen peroxide. Carbon 2018, 129, 29–37. [Google Scholar] [CrossRef]
  2. Mao, L.; Osborne, P.G.; Yamamoto, K.; Kato, T. Continuous on-line measurement of cerebral hydrogen peroxide using enzyme-modified ring–disk plastic carbon film electrode. Anal Chem. 2002, 74, 3684–3689. [Google Scholar] [CrossRef] [PubMed]
  3. Belousov, V.V.; Fradkov, A.F.; Lukyanov, K.A.; Staroverov, D.B.; Shakhbazov, K.S.; Terskikh, A.V.; Lukyanov, S. Genetically encoded fluorescent indicator for intracellular hydrogen peroxide. Nat. Methods 2006, 3, 281–286. [Google Scholar] [CrossRef] [PubMed]
  4. Xu, M.; Han, J.-M.; Zhang, Y.; Yang, X.; Zang, L. A selective fluorescence turn-on sensor for trace vapor detection of hydrogen peroxide. Chem. Commun. 2013, 49, 11779–11781. [Google Scholar] [CrossRef]
  5. Srikun, D.; Albers, A.E.; Nam, C.I.; Iavaron, A.T.; Chang, C.J.J. Organelle-targetable fluorescent probes for imaging hydrogen peroxide in living cells via SNAP-Tag protein labeling. J. Am. Chem. Soc. 2010, 132, 4455–4465. [Google Scholar] [CrossRef] [Green Version]
  6. Xu, J.; Shang, F.J.; Luong, J.H.T.; Razeeb, K.M.; Glennon, J.D. Direct electrochemistry of horseradish peroxidase immobilized on a monolayer modified nanowire array electrode. Biosens. Bioelectron. 2010, 25, 1313–1318. [Google Scholar] [CrossRef] [Green Version]
  7. Ding, J.W.; Zhang, K.; Wei, G.; Su, Z.Q. Fabrication of polypyrrole nanoplates decorated with silver and gold nanoparticles for sensor applications. RSC Adv. 2015, 5, 69745–69752. [Google Scholar] [CrossRef]
  8. Wei, H.; Wang, E.K. Fe3O4 magnetic nanoparticles as peroxidase mimetics and their applications in H2O2 and glucose detection. Anal. Chem. 2008, 80, 2250–2254. [Google Scholar] [CrossRef]
  9. Bao, Y.-W.; Hua, X.-W.; Ran, H.-H.; Zeng, J.; Wu, F.-G. Metal-doped carbon nanoparticles with intrinsic peroxidase-like activity for colorimetric detection of H2O2 and glucose. J. Mater. Chem. B 2019, 7, 296–304. [Google Scholar] [CrossRef]
  10. Nerthigan, Y.; Sharma, A.K.; Pandey, S.; Sharma, K.H.; Khan, M.S.; Hang, D.-R.; Wu, H.-F. Glucose oxidase assisted visual detection of glucose using oxygen deficient α-MoO3-x nanoflakes. Microchim. Acta 2018, 185, 65. [Google Scholar] [CrossRef]
  11. Sharma, A.K.; Pandey, S.; Sharma, K.H.; Nerthigan, Y.; Khan, M.S.; Hang, D.-R.; Wu, H.-F. Two dimensional α-MoO3-x nanoflakes as bare eye probe for hydrogen peroxide in biological fluids. Anal. Chim. Acta 2018, 1015, 58–65. [Google Scholar] [CrossRef] [PubMed]
  12. Tang, X.Q.; Zhang, Y.D.; Jiang, Z.W.; Wang, D.M.; Huang, C.Z.; Li, Y.F. Fe3O4 and metal–organic framework MIL-101(Fe) composites catalyze luminol chemiluminescence for sensitively sensing hydrogen peroxide and glucose. Talanta 2018, 179, 43–50. [Google Scholar] [CrossRef]
  13. Jin, L.; Meng, Z.; Zhang, Y.; Cai, S.; Zhang, Z.; Li, C.; Shang, L.; Shen, Y. Ultrasmall Pt nanoclusters as robust peroxidase mimics for colorimetric detection of glucose in human serum. ACS Appl. Mater. Interfaces 2017, 9, 10027–10033. [Google Scholar] [CrossRef]
  14. Wang, S.; Sun, J.; Jia, Y.; Yang, L.; Wang, N.; Xianyu, Y.; Chen, W.; Li, X.; Cha, R.; Jiang, X. Nanocrystalline cellulose-assisted generation of silver nanoparticles for nonenzymatic glucose detection and antibacterial agent. Biomacromolecules 2016, 17, 2472–2478. [Google Scholar] [CrossRef]
  15. Jv, Y.; Li, B.X.; Cao, R. Positively-charged gold nanoparticles as peroxidiase mimic and their application in hydrogen peroxide and glucose detection. Chem. Commun. 2010, 46, 8017–8019. [Google Scholar] [CrossRef] [PubMed]
  16. Teo, W.Z.; Chng, E.L.K.; Sofer, Z.; Pumera, M. Cytotoxicity of exfoliated transition-metal dichalcogenides (MoS2, WS2, and WSe2) is lower than that of graphene and its analogues. Chem. Eur. J. 2014, 20, 9627–9632. [Google Scholar] [CrossRef]
  17. Sorkin, V.; Pan, H.; Shi, H.; Quek, S.Y.; Zhang, Y.W. Nanoscale transition metal dichalcogenides: Structures, properties, and applications. Crit. Rev. Solid State Mater. Sci. 2014, 39, 319–367. [Google Scholar] [CrossRef]
  18. Singh, A.K.; Hwang, C.; Eom, J. Low-Voltage and high-performance multilayer MoS2 field-effect transistors with graphene electrodes. ACS Appl. Mater. Interfaces 2016, 8, 34699–34705. [Google Scholar] [CrossRef]
  19. Joseph, N.; Muhammed Shafi, P.; Chandra Bose, A. Recent advances in 2D-MoS2 and its composite nanostructures for supercapacitor electrode application. Energy Fuels 2020, 34, 6558–6597. [Google Scholar] [CrossRef]
  20. Lin, X.; Wang, X.; Zhou, Q.; Wen, C.; Su, S.; Xiang, J.; Cheng, P.; Hu, X.; Li, Y.; Wang, X.; et al. Magnetically recyclable MoS2/Fe3O4 hybrid composite as visible light responsive photocatalyst with enhanced photocatalytic performance. ACS Sustain. Chem. Eng. 2018, 7, 1673–1682. [Google Scholar] [CrossRef]
  21. Kalantar-zadeh, K.; Ou, J.Z. Biosensors based on two-dimensional MoS2. ACS Sens. 2016, 1, 5–16. [Google Scholar] [CrossRef]
  22. Gan, X.; Zhao, H.; Quan, X. Two-dimensional MoS2: A promising building block for biosensors. Biosens. Bioelectron. 2017, 89, 56–71. [Google Scholar] [CrossRef] [PubMed]
  23. Zhao, Y.; Huang, Y.; Wu, J.; Zhan, X.; Xie, Y.; Tang, D.; Cao, H.; Yun, W. Mixed-solvent liquid exfoliated MoS2 NPs as peroxidase mimetics for colorimetric detection of H2O2 and glucose. RSC Adv. 2018, 8, 7252–7259. [Google Scholar] [CrossRef] [Green Version]
  24. Zhao, K.; Gu, W.; Zheng, S.S.; Zhang, C.L.; Xian, Y.Z. SDS-MoS2 nanoparticles as highly-efficient peroxidase mimetics for colorimetric detection of H2O2 and glucose. Talanta 2015, 141, 47–52. [Google Scholar] [CrossRef] [PubMed]
  25. Choi, S.Y.; Kim, Y.; Chung, H.S.; Kim, A.R.; Kwon, J.D.; Park, J.; Kim, Y.L.; Kwon, S.H.; Hahm, M.G.; Cho, B. Effect of Nb doping on chemical sensing performance of two-dimensional layered MoSe2. ACS Appl. Mater. Interfaces 2017, 9, 3817–3823. [Google Scholar] [CrossRef]
  26. Gholamvand, G.; McAteer, D.; Backes, C.; McEvoy, N.; Harvey, A.; Berner, N.C.; Hanlon, D.; Bradley, C.; Godwin, I.; Rovetta, A.; et al. Comparison of liquid exfoliated transition metal dichalcogenides reveals MoSe2 to be the most effective hydrogen evolution catalyst. Nanoscale 2016, 8, 5737–5749. [Google Scholar] [CrossRef]
  27. Wu, X.; Chen, T.; Wang, J.; Yang, G. Few-layered MoSe2 nanosheets as an efficient peroxidase nanozyme for highly sensitive colorimetric detection of H2O2 and xanthine. J. Mater. Chem. B 2018, 6, 105–111. [Google Scholar] [CrossRef]
  28. Pan, J.; Zhu, X.; Chen, X.; Zhao, Y.; Liu, J. Gd3+-doped MoSe2 nanosheets used as a theranostic agent for bimodal imaging and highly efficient photothermal cancer therapy. Biomater. Sci. 2018, 6, 372–387. [Google Scholar] [CrossRef]
  29. Li, B.L.; Setyawati, M.I.; Zou, H.L.; Dong, J.X.; Luo, H.Q.; Li, N.B.; Leong, D.T. Emerging 0D transition-metal dichalcogenides for sensors, biomedicine, and clean energy. Small 2017, 13, 1700527. [Google Scholar] [CrossRef]
  30. Xu, Y.; Wang, X.; Zhang, W.L.; Lv, F.; Guo, S. Recent progress in two-dimensional inorganic quantum dots. Chem. Soc. Rev. 2018, 47, 586–625. [Google Scholar] [CrossRef]
  31. Wang, X.; Wu, Q.; Jiang, K.; Wang, C.; Zhang, C. One-step synthesis of water-soluble and highly fluorescent MoS2 quantum dots for detection of hydrogen peroxide and glucose. Sens. Actuators B 2017, 252, 183–190. [Google Scholar] [CrossRef]
  32. Hang, D.-R.; Sun, D.-Y.; Chen, C.-H.; Wu, H.-F.; Chou, M.M.C.; Islam, S.E.; Sharma, K.H. Facile bottom-up preparation of WS2-based water-soluble quantum dots as luminescent probes for hydrogen peroxide and glucose. Nanoscale Res. Lett. 2019, 14, 271. [Google Scholar] [CrossRef] [PubMed]
  33. Gerislioglu, B.; Dong, L.; Ahmadivand, A.; Hu, H.; Nordlander, P.; Halas, N.J. Monolithic metal dimer-on-film structure: New plasmonic properties introduced by the underlying metal. Nano Lett. 2020, 20, 2087–2093. [Google Scholar] [CrossRef]
  34. Ahmadivand, A.; Gerislioglu, B. Tunable plexciton dynamics in electrically biased nanojunctions. J. Appl. Phys. 2020, 128, 063101. [Google Scholar] [CrossRef]
  35. Gerislioglu, B.; Ahmadivand, A. Theoretical study of photoluminescence spectroscopy of strong exciton-polariton coupling in dielectric nanodisks with anapole states. Mater. Today Chem. 2020, 16, 100254. [Google Scholar] [CrossRef]
  36. Backes, C.; Higgins, T.M.; Kelly, A.; Boland, C.; Harvey, A.; Hanlon, D.; Coleman, J.N. Guidelines for exfoliation, characterization and processing of layered materials produced by liquid exfoliation. Chem. Mater. 2017, 29, 243–255. [Google Scholar] [CrossRef]
  37. Hang, D.-R.; Sharma, K.H.; Chen, C.-H.; Islam, S.E. Enhanced photocatalytic performance of ZnO nanorods coupled by two-dimensional α-MoO3 nanoflakes under UV and visible light irradiation. Chem. Eur. J. 2016, 22, 12777–12784. [Google Scholar] [CrossRef]
  38. Chhetri, S.; Adak, N.C.; Samanta, P.; Murmu, N.C.; Kuila, T. Exploration of mechanical and thermal properties of CTAB-modified MoS2/LLDPE composites prepared by melt mixing. J. Compos. Sci. 2018, 2, 37. [Google Scholar] [CrossRef] [Green Version]
  39. Hang, D.-R.; Sharma, K.H.; Islam, S.E.; Chen, C.; Chou, M.M.C. Resonant Raman scattering and photoluminescent properties of nonpolar a-plane ZnO thin film on LiGaO2 substrate. Appl. Phys. Express 2014, 7, 041101. [Google Scholar] [CrossRef]
  40. Zhu, C.; Huang, Y.; Xu, F.; Gao, P.; Ge, B.; Chen, J.; Zeng, H.; Sutter, E.; Sutter, P.; Sun, L. Defect-laden MoSe2 quantum dots made by turbulent shear mixing as enhanced electrocatalysts. Small 2017, 13, 1700565. [Google Scholar] [CrossRef]
  41. Islam, S.E.; Hang, D.-R.; Chen, C.-H.; Sharma, K.H. Facile and cost-efficient synthesis of quasi-0D/2D ZnO/MoS2 nanocomposites for highly enhanced visible-light-driven photocatalytic degradation of organic pollutants and antibiotics. Chem. Eur. J. 2018, 24, 9305–9315. [Google Scholar] [CrossRef]
  42. Qu, B.; Yu, X.; Chen, Y.; Zhu, C.; Li, C.; Yin, Z.; Zhang, X. Ultrathin MoSe2 nanosheets decorated on carbon fiber cloth as binder-free and high-performance electrocatalyst for hydrogen evolution. ACS Appl. Mater. Interfaces 2015, 7, 14170–14715. [Google Scholar] [CrossRef]
  43. Koroteev, V.; Bulusheva, L.; Asanov, I.; Shlyakhova, E.; Vyalikh, D.; Okotrub, A. Charge transfer in the MoS2/carbon nanotube composite. J. Phys. Chem. C 2011, 115, 21199–21204. [Google Scholar] [CrossRef]
  44. Guo, X.; Cao, G.; Ding, F.; Li, X.; Zhen, S.; Xue, Y.; Yan, Y.; Liu, T.; Sun, K. A bulky and flexible electrocatalyst for efficient hydrogen evolution based on the growth of MoS2 nanoparticles on carbon nanofiber foam. J. Mater. Chem. A 2015, 3, 5041–5046. [Google Scholar] [CrossRef]
  45. Smith, R.J.; King, P.J.; Lotya, M.; Wirtz, C.; Khan, U.; De, S.; O’Neill, A.; Duesberg, G.S.; Grunlan, J.C.; Moriarty, G. Large-scale exfoliation of inorganic layered compounds in aqueous surfactant solutions. Adv. Mater. 2011, 23, 3944–3948. [Google Scholar] [CrossRef] [PubMed]
  46. Wang, K.; Feng, Y.; Chang, C.; Zhan, J.; Wang, C.; Zhao, Q.; Colemon, J.N.; Zhang, L.; Blau, W.J.; Wang, J. Broadband ultrafast nonlinear absorption and nonlinear refraction of layered molybdenum dichalcogenide semiconductors. Nanoscale 2014, 6, 10530–10535. [Google Scholar] [CrossRef] [Green Version]
  47. Dong, N.; Li, Y.; Feng, Y.; Zhang, S.; Zhang, X.; Chang, C.; Fan, J.; Zhang, L.; Wang, J. Optical limiting and theoretical modelling of layered transition metal dichalcogenide nanosheets. Sci. Rep. 2015, 5, 14646. [Google Scholar] [CrossRef] [Green Version]
  48. Wang, G.; Gerber, I.C.; Bouet, L.; Lagarde, D.; Balocchi, A.; Vidal, M.; Amand, T.; Marie, X.; Urbaszek, B. 2015 Exciton states in monolayer MoSe2: Impact on interband transitions. 2D Mater. 2015, 2, 045005. [Google Scholar] [CrossRef] [Green Version]
  49. Roy, S.; Neupane, G.P.; Dhakal, K.P.; Lee, J.; Yun, S.J.; Han, G.H.; Kim, J. Observation of charge transfer in heterostructures composed of MoSe2 quantum dots and a monolayer of MoS2 or WSe2. J. Phys. Chem. C 2017, 121, 1997–2004. [Google Scholar] [CrossRef]
  50. Xu, S.; Li, D.; Wu, P. One-pot, facile, and versatile synthesis of monolayer MoS2/WS2 quantum dots as bioimaging probes and efficient electrocatalysts for hydrogen evolution reaction. Adv. Funct. Mater. 2015, 25, 1127–1136. [Google Scholar] [CrossRef]
  51. Yan, Y.; Zhang, C.; Gu, W.; Ding, C.; Li, X.; Xian, Y. Facile synthesis of water-soluble WS2 quantum dots for turn-on fluorescent measurement of lipoic acid. J. Phys. Chem. C 2016, 120, 12170–12177. [Google Scholar] [CrossRef]
  52. Hang, D.-R.; Islam, S.E.; Sharma, K.H.; Chen, C.; Liang, C.-T.; Chou, M.M.C. Optical characteristics of nonpolar a-plane ZnO thin film on (010) LiGaO2 substrate. Semicond. Sci. Technol. 2014, 29, 085004. [Google Scholar] [CrossRef]
  53. Hang, D.-R.; Islam, S.E.; Chen, C.-H.; Sharma, K.H. Full solution-processed synthesis and mechanisms of a recyclable and bifunctional Au/ZnO plasmonic platform for enhanced UV/Vis photocatalysis and optical properties. Chem. Eur. J. 2016, 22, 14950–14961. [Google Scholar] [CrossRef]
  54. Gan, Z.X.; Liu, L.Z.; Wu, H.Y.; Hao, Y.L.; Shan, Y.; Wu, X.L.; Chu, P.K. Quantum confinement effects across two-dimensional planes in MoS2 quantum dots. Appl. Phys. Lett. 2015, 106, 233113. [Google Scholar] [CrossRef]
  55. Roy, A.; Movva, H.C.P.; Satpati, B.; Kim, K.; Dey, R.; Rai, A.; Pramanik, T.; Guchhait, S.; Tutuc, E.; Banerjee, S.K. Structural and electrical properties of MoTe2 and MoSe2 grown by molecular beam epitaxy. ACS Appl. Mater. Interfaces 2016, 8, 7396–7402. [Google Scholar] [CrossRef] [Green Version]
  56. Lee, C.; Yan, H.; Brus, L.E.; Heinz, T.F.; Hone, J.; Ryu, S. Anomalous lattice vibrations of single- and few-layer MoS2. ACS Nano 2010, 4, 2695–2700. [Google Scholar] [CrossRef] [PubMed] [Green Version]
  57. Tonndorf, P.; Schmidt, R.; Böttger, P.; Zhang, X.; Börner, J.; Liebig, A.; Albrecht, M.; Kloc, C.; Gordan, O.; Zahn, D.R.T.; et al. Photoluminescence emission and Raman response of monolayer MoS2, MoSe2, and WSe2. Opt. Express 2013, 21, 4908. [Google Scholar] [CrossRef] [PubMed]
  58. Chen, S.Y.; Zheng, C.; Fuhrer, M.S.; Yan, J. Helicity-resolved Raman scattering of MoS2, MoSe2, WS2, and WSe2 atomic layers. Nano Lett. 2015, 15, 2526–2532. [Google Scholar] [CrossRef] [Green Version]
  59. Luo, X.; Zhao, Y.; Zhang, J.; Xiong, Q.; Quek, S.Y. Anomalous frequency trends in MoS2 thin films attributed to surface effects. Phys. Rev. B 2013, 88, 075320. [Google Scholar] [CrossRef] [Green Version]
  60. Kim, K.; Lee, J.U.; Nam, D.Y.; Cheong, H. Davydov splitting and excitonic resonance effects in Raman spectra of few-layer MoSe2. ACS Nano 2016, 10, 8113–8120. [Google Scholar] [CrossRef] [Green Version]
  61. Luan, C.-Y.; Xie, S.; Ma, C.; Wang, S.; Kong, Y.; Xu, M. Elucidation of luminescent mechanisms of size-controllable MoSe2 quantum dots. Appl. Phys. Lett. 2017, 111, 073105. [Google Scholar] [CrossRef]
  62. Qiao, F.M.; Qi, Q.Q.; Wang, Z.Z.; Xu, K.; Ai, S.Y. MnSe-loaded g-C3N4 nanocomposite with synergistic peroxidase-like catalysis: Synthesis and application toward colorimetric biosensing of H2O2 and glucose. Sensor. Actuator. B Chem. 2016, 229, 379–386. [Google Scholar] [CrossRef]
  63. Chen, L.J.; Sun, B.; Wang, X.; Qiao, F.M.; Ai, S.Y. 2D ultrathin nanosheets of Co-Al layered double hydroxides prepared in L-asparagine solution enhanced peroxidase-like activity and colorimetric detection of glucose. J. Mater. Chem. B 2013, 1, 2268–2274. [Google Scholar] [CrossRef] [PubMed]
  64. Gao, L.; Zhuang, J.; Nie, L.; Zhang, J.; Zhang, Y.; Gu, N.; Wang, T.; Feng, J.; Yang, D.; Perrett, S.; et al. Intrinsic peroxidase-like activity of ferromagnetic nanoparticles. Nat. Nanotechnol. 2007, 2, 577–583. [Google Scholar] [CrossRef]
  65. Qiao, F.M.; Chen, L.J.; Li, X.; Li, L.; Ai, S.Y. Peroxidase-like activity of manganese selenide nanoparticles and its analytical application for visual detection of hydrogen peroxide and glucose. Sensors Actuator B Chem. 2014, 193, 255–262. [Google Scholar] [CrossRef]
  66. Peng, J.; Weng, J. Enhanced peroxidase-like activity of MoS2/graphene oxide hybrid with light irradiation for glucose detection. Biosens. Bioelectron. 2017, 89, 652–658. [Google Scholar] [CrossRef]
  67. Vinita, N.R.N.; Prakash, R. One step synthesis of AuNPs@MoS2-QDs composite as a robust peroxidase-mimetic for instant unaided eye detection of glucose in serum, saliva and tear. Sensors Actuator B Chem. 2018, 263, 109–119. [Google Scholar] [CrossRef]
  68. Ju, P.; Xiang, Y.H.; Xiang, Z.B.; Wang, M.; Zhao, Y.; Zhang, D.; Yu, J.Q.; Han, X.X. BiOI hierarchical nanoflowers as novel robust peroxidase mimetics for colorimetric detection of H2O2. RSC Adv. 2016, 6, 17483–17493. [Google Scholar] [CrossRef]
  69. Zhang, X.; Gao, Y.F. 2D/2D h-BN/N-doped MoS2 heterostructure catalyst with enhanced peroxidase-like performance for visual colorimetric determination of H2O2. Chem. Asian J. 2020, 15, 1315–1323. [Google Scholar] [CrossRef]
  70. Lin, T.R.; Zhong, L.S.; Wang, J.; Guo, L.Q.; Wu, H.Y.; Guo, Q.Q.; Fu, F.F.; Chen, G.N. Graphite-like carbon nitrides as peroxidase mimetics and their applications to glucose detection. Biosens. Bioelectron. 2014, 59, 89–93. [Google Scholar] [CrossRef]
  71. Ju, P.; He, Y.; Wang, M.; Han, X.; Jiang, F.; Sun, C.; Wu, C. Enhanced Peroxidase-like activity of MoS2 quantum dots functionalized g-C3N4 nanosheets towards colorimetric detection of H2O2. Nanomaterials 2018, 8, 976. [Google Scholar] [CrossRef] [PubMed] [Green Version]
  72. Chen, Q.; Chen, J.; Gao, C.J.; Zhang, M.L.; Chen, J.Y.; Qiu, H.D. Hemin-functionalized WS2 nanosheets as highly active peroxidase mimetics for label-free colorimetric detection of H2O2 and glucose. Analyst 2015, 140, 2857–2863. [Google Scholar] [CrossRef] [PubMed]
  73. Ma, J.; Yu, H.; Jiang, X.; Luo, Z.; Zheng, Y. High sensitivity label-free detection of Fe3+ ion in aqueous solution using fluorescent MoS2 quantum dots. Sens. Actuators B 2019, 281, 989–997. [Google Scholar] [CrossRef]
  74. Chen, J.; Li, Y.; Lv, K.; Zhong, W.; Wang, H.; Wu, Z.; Yi, P.; Jiang, J. Cyclam-functionalized carbon dots sensor for sensitive and selective detection of copper(II) ion and sulfide anion in aqueous media and its imaging in live cells. Sens. Actuators B 2016, 224, 298–306. [Google Scholar] [CrossRef]
  75. Chhetri, R.K.; Kaarsholm, K.M.S.; Andersen, H.R. Colorimetric quantification methods for peracetic acid together with hydrogen peroxide for water disinfection process control. Int. J. Environ. Res. Public Health 2020, 17, 4656. [Google Scholar] [CrossRef] [PubMed]
Figure 1. The schematic illustrations for the preparations of (a) two-dimensional (2D) cetyltrimethyl ammonium bromide (CTAB)-MoSe2 nanosheets and (b) 0D MoSe2 quantum dots (QDs).
Nanomaterials 10 02045 g001
Figure 2. (a) Transmission electron microscope (TEM) image of synthesized MoSe2 QDs. The inset shows representative high-resolution TEM (HRTEM) image of the MoSe2 QD. (b) Statistical analysis of the size of MoSe2 QDs measured by TEM and its Gaussian fitting curve.
Nanomaterials 10 02045 g002
Figure 3. (a) TEM image of 2D CTAB-MoSe2 prepared by liquid phase exfoliation (LPE). The inset shows its HRTEM image (b) The selected area electron diffraction pattern (SAED). (c) The atomic force microscopy image of as-obtained 2D CTAB-MoSe2 and the corresponding height profile along the black line in the image.
Nanomaterials 10 02045 g003
Figure 4. High-resolution X-ray photoelectron spectrometer (XPS) spectra showing the binding energy of (a) Mo 3d and (b) Se 3d electrons recorded on bulk MoSe2 powder. High-resolution core level spectra corresponding to (c) Mo 3d and (d) Se 3d electrons for MoSe2 QDs.
Nanomaterials 10 02045 g004
Figure 5. (a) Ultraviolet–visible (UV–vis) absorption spectrum of 2D CTAB-MoSe2 nanosheets clearly reveals characteristic excitonic structures. (b) The corresponding plot versus (ahv)2 versus for absorption of 2D CTAB-MoSe2, in which the optical band gap energy can be estimated. (c) UV–vis absorption spectrum of MoSe2 QDs. Note the quenching of previous excitonic features in the spectrum.
Nanomaterials 10 02045 g005
Figure 6. (a) Excitation-wavelength dependent photoluminescence (PL) spectra of colloidal MoSe2 QDs at room temperature. (b) The 2D contour map acquired from the PL spectra. The characteristic contour is due to the pronounced quantum confinement effect.
Nanomaterials 10 02045 g006
Figure 7. Raman spectra of the source MoSe2 bulk powder (brown line) and as-produced 2D CTAB-MoSe2 nanosheets (blue line). The Raman shifts are denoted by the dashed lines. The inset sketch depicts the atomic displacements of the two vibrational modes leading to the primary Raman peaks.
Nanomaterials 10 02045 g007
Figure 8. (a) UV-visible absorption spectra of (1) 3,3,5,5-tetramethylbenzidine (TMB) solution (brown); (2) TMB–H2O2 system (green); (3) TMB–H2O2–MoSe2 QDs system (blue). Inset: the corresponding photographs of these reaction systems. (b) The time-dependent absorbance changes at 652 nm of these systems.
Nanomaterials 10 02045 g008
Figure 9. Steady-state kinetic analysis for MoSe2 QDs. The reaction velocity (v) was measured when (a) the H2O2 concentration was varied while the concentration of TMB was 5 mM and (b) the TMB concentration was varied while the concentration of H2O2 was 0.75 mM. The corresponding double-reciprocal plots with a fixed concentration of one substrate relative to varying the concentration of the other substrate are displayed in (c,d).
Nanomaterials 10 02045 g009
Figure 10. Steady-state kinetic assay of 2D CTAB-MoSe2 nanosheets. (a) Varying the concentrations of H2O2 while the concentration of TMB was 5 mM. (b) Varying the concentrations of TMB while the concentration of H2O2 was 0.75 mM. The double-reciprocal plots for the concentration of (c) H2O2 and (d) TMB.
Nanomaterials 10 02045 g010
Figure 11. The absorbance at 652 nm of reaction solutions in the absence or presence of scavengers Isopropyl alcohol (IPA) and benzoquinone (BQ). The inset shows the images of color changes for different reaction systems.
Nanomaterials 10 02045 g011
Figure 12. The schematic diagram depicts the mechanism for colorimetric detection of H2O2 by using 2D CTAB-MoSe2 NSs and MoSe2 QDs as peroxidase mimetics.
Nanomaterials 10 02045 g012
Figure 13. (a) The absorbance changes at 652 nm for MoSe2 QDs in different amount of H2O2 (0.01, 0.02, 0.03, 0.04, 0.05, 0.1, 0.25, 0.5, 0.75, 1, 2, 3 and 4 mM). Inset: the images of color contrast for different concentrations of H2O2. (b) The linear calibration plot for H2O2.
Nanomaterials 10 02045 g013
Figure 14. (a) The dose-response curve for H2O2 detection by using 2D CTAB-MoSe2 NSs as artificial enzyme. The inset are the photos of reaction solutions after adding different concentrations of H2O2. (b) The linear calibration plot for H2O2 concentration.
Nanomaterials 10 02045 g014
Table 1. Comparison of colorimetric detections of H2O2 in the linear range and detection limit between our MoSe2 nanostructures and other peroxidase mimics based on nanoscale 2D materials.
CatalystLinear Range (μM)Detection Limit (μM)Ref.
Positively-charged Au nanoparticles (NPs)2–2000.5[15]
h-BN/N-MoS21–10000.4[69]
Few-layered MoSe2 nanosheets (NSs)10–1600.4[27]
MoS2 NPs3–1201.25[23]
SDS–MoS2 NPs2–1000.32[24]
g-C3N45–1001[70]
MoS2 QDs/g-C3N4 NSs2–500.155[71]
WS2 Nanosheets5–2001.5[72]
2D CTAB-MoSe210–2504This work
0D MoSe2 QDs quantum dots (QDs)10–1004This work
Publisher’s Note: MDPI stays neutral with regard to jurisdictional claims in published maps and institutional affiliations.

