2.1. Data Entry Templates
There are several existing approaches to support data entry of experimental results for regulatory purposes (e.g., OHTs), research data in bioinformatics (e.g., ISA–Tab, ISA–JSON) and its extensions for NM (e.g., ISA–Tab–Nano), as well as data logging templates originating and widely used in EU funded projects, summarized in the NanoInformatics Roadmap 2030, Chapter 5 [
5]. While any data management system will prefer a structured format for data import, the data providers are much more likely to adopt a data entry centric workflow that requires the use of familiar tools and a format that follows the design of the experiment and is not too rigid. The lesson learned during the last decade is that unless there is external pressure to use a particular tool or structured format, the data generators resort to Excel spreadsheets, given their ubiquity and convenience. Thus, the approach taken early on by eNanoMapper was to develop a tool to help in converting the existing variety of spreadsheets into a common semantic data model, incorporate annotation with ontology terms, and steer the spreadsheet layout design towards harmonization, while retaining the user friendliness and features deemed important by the labs. We have been successful with parsing and importing into the eNanoMapper databases more than 1500 Excel spreadsheet files. These files roughly follow the NANoREG/JRC and IOM types of templates (briefly described below), and the subsequent sections provide specific layout examples.
The NANoREG approach to the harmonisation of data logging is based on structuring the information on assays in a set of MS Excel templates, developed by JRC and released under the Creative Commons Share-Alike license [
20]. While not strictly following the ISA–Tab and ISA–Tab–Nano specifications, the templates have been designed around “ISA–Tab logic”, i.e., structuring the data in investigation–study–assay-related groups. The motivation to create new templates instead of using ISA–Tab/ISA–Tab–Nano ones is the perceived low applicability of the latter in a more “lab-related” data logging due to lack of user-friendliness. The NANoREG/JRC templates are being used for data entry in a number of EU funded projects and a subset of the physicochemical templates was refined and published by the H2020 GRACIOUS project [
21]. A high level overview follows:
The sample information group describes the NM (including names, ID, supplier, vial number and replicate number, as well as dispersant). The reporting organisation, operator, and date of the experiment are also in this section;
An unnamed group listing the module (physicochemical, in-vitro, or in-vivo), the endpoint (e.g., cell viability), and the assay name (e.g., “Alamar blue”);
Method and instrument information;
A subgroup “size distribution”, providing placeholders for size distribution measured for the sample (including details of the dispersion protocol and dispersion medium). These fields are (almost) constant across all templates;
A set of parameters describing the experiment, including cell lines, instrument, controls, time points, concentrations. These differ widely across different experiments.
Results group: several columns to specify measured outcomes, along with measurement uncertainty;
SOP (reference to the protocol).
A separate set of Excel templates have been developed over the last decade at the Institute of Occupational Medicine (IOM) (
https://www.iom-world.org/) and used to gather data in several EU FP7 projects (NANOMMUNE, NanoTEST, ENPRA, MARINA, NanoSolutions, SUN). They are being further adapted for use in more recent H2020 projects (currently PATROLS, GRACIOUS, BIORIMA, RiskGONE and NanoInformaTIX). These templates (referred to as IOM–Nano–EHS data templates) were originally derived in alignment with earlier (from 2009) JRC–IHCP NanoHub database requirements (built upon the IUCLID model, initially 5.1). These templates were based on the original OECD HT, for a variety of bio assays, and tailored to provide simplified subsets of the complete HT, and provided to the experimentalists for data collection spreadsheet format. This delivers a user friendly and suitably flexible approach whereby end-users entering data could modify the templates for the particular needs of their experimental regimes where necessary, and in liaison with the project’s database administrator. They have successfully provided a practical format for users collecting the results of a variety of physicochemical, in-vitro, in-vivo and eco-toxicology assays for nanoEHS safety assessment. Their flexibility and user friendliness increase user acceptability and utility, but potentially require an additional effort later in the data curation process, due to the need to process more variations in file layout and format to enable upload to the database. Whilst being laid out physically very differently from ISA–Tab, in order to facilitate the collection of data in patterns better reflecting the experimental conditions and data outputs, the templates still inherently share the logical principles and essential metadata features of ISA–Tab, including information on the test method and relevant SOPs as mandatory requirements. To date, the IOM templates have generally collected results for one substance and one assay type in a single Excel spreadsheet file composed of several related worksheets. The first worksheet (“Test conditions”) is organised in the following groups:
Experimental test and end point details. These collect general information about the project, work package, test facility, scientist(s) conducting the tests, start and end dates, details of assay name, specific endpoint(s), outcome metric(s), and experimental protocol;
Test substance/NM. The name, CASRN, project ID of the substance, with a separate field for additional general material IDs (e.g., JRC representative materials) and the highest concentration used;
Information on replicates and controls; Timeline and dosage/treatment concentration. The latter span several cells, as many as required to cover the time points and concentrations used. The names (T1, T2, T3, etc., C1, C2, C3 etc.) are used in data sheets to report the experiment outcomes;
Other experimental parameters may be required by the assay being recorded, including key items from the experimental protocol.
There are then experimental results data worksheets. These may differ in detail for different experiments. Generally, the raw data represents the experimental plate layout, indexed by T* and C*, and includes all replicates. The “Test results” worksheet typically includes formulae aggregating measurements’ results across replicates, and is organised in “blocks” (see
Section 2.4 for details). The “Test summary” sheet is used to represent derived metrics over several concentrations, e.g., IC50.
2.2. The eNanoMapper Data Model
The eNanoMapper database is an extension of the Ambit chemoinformatics platform [
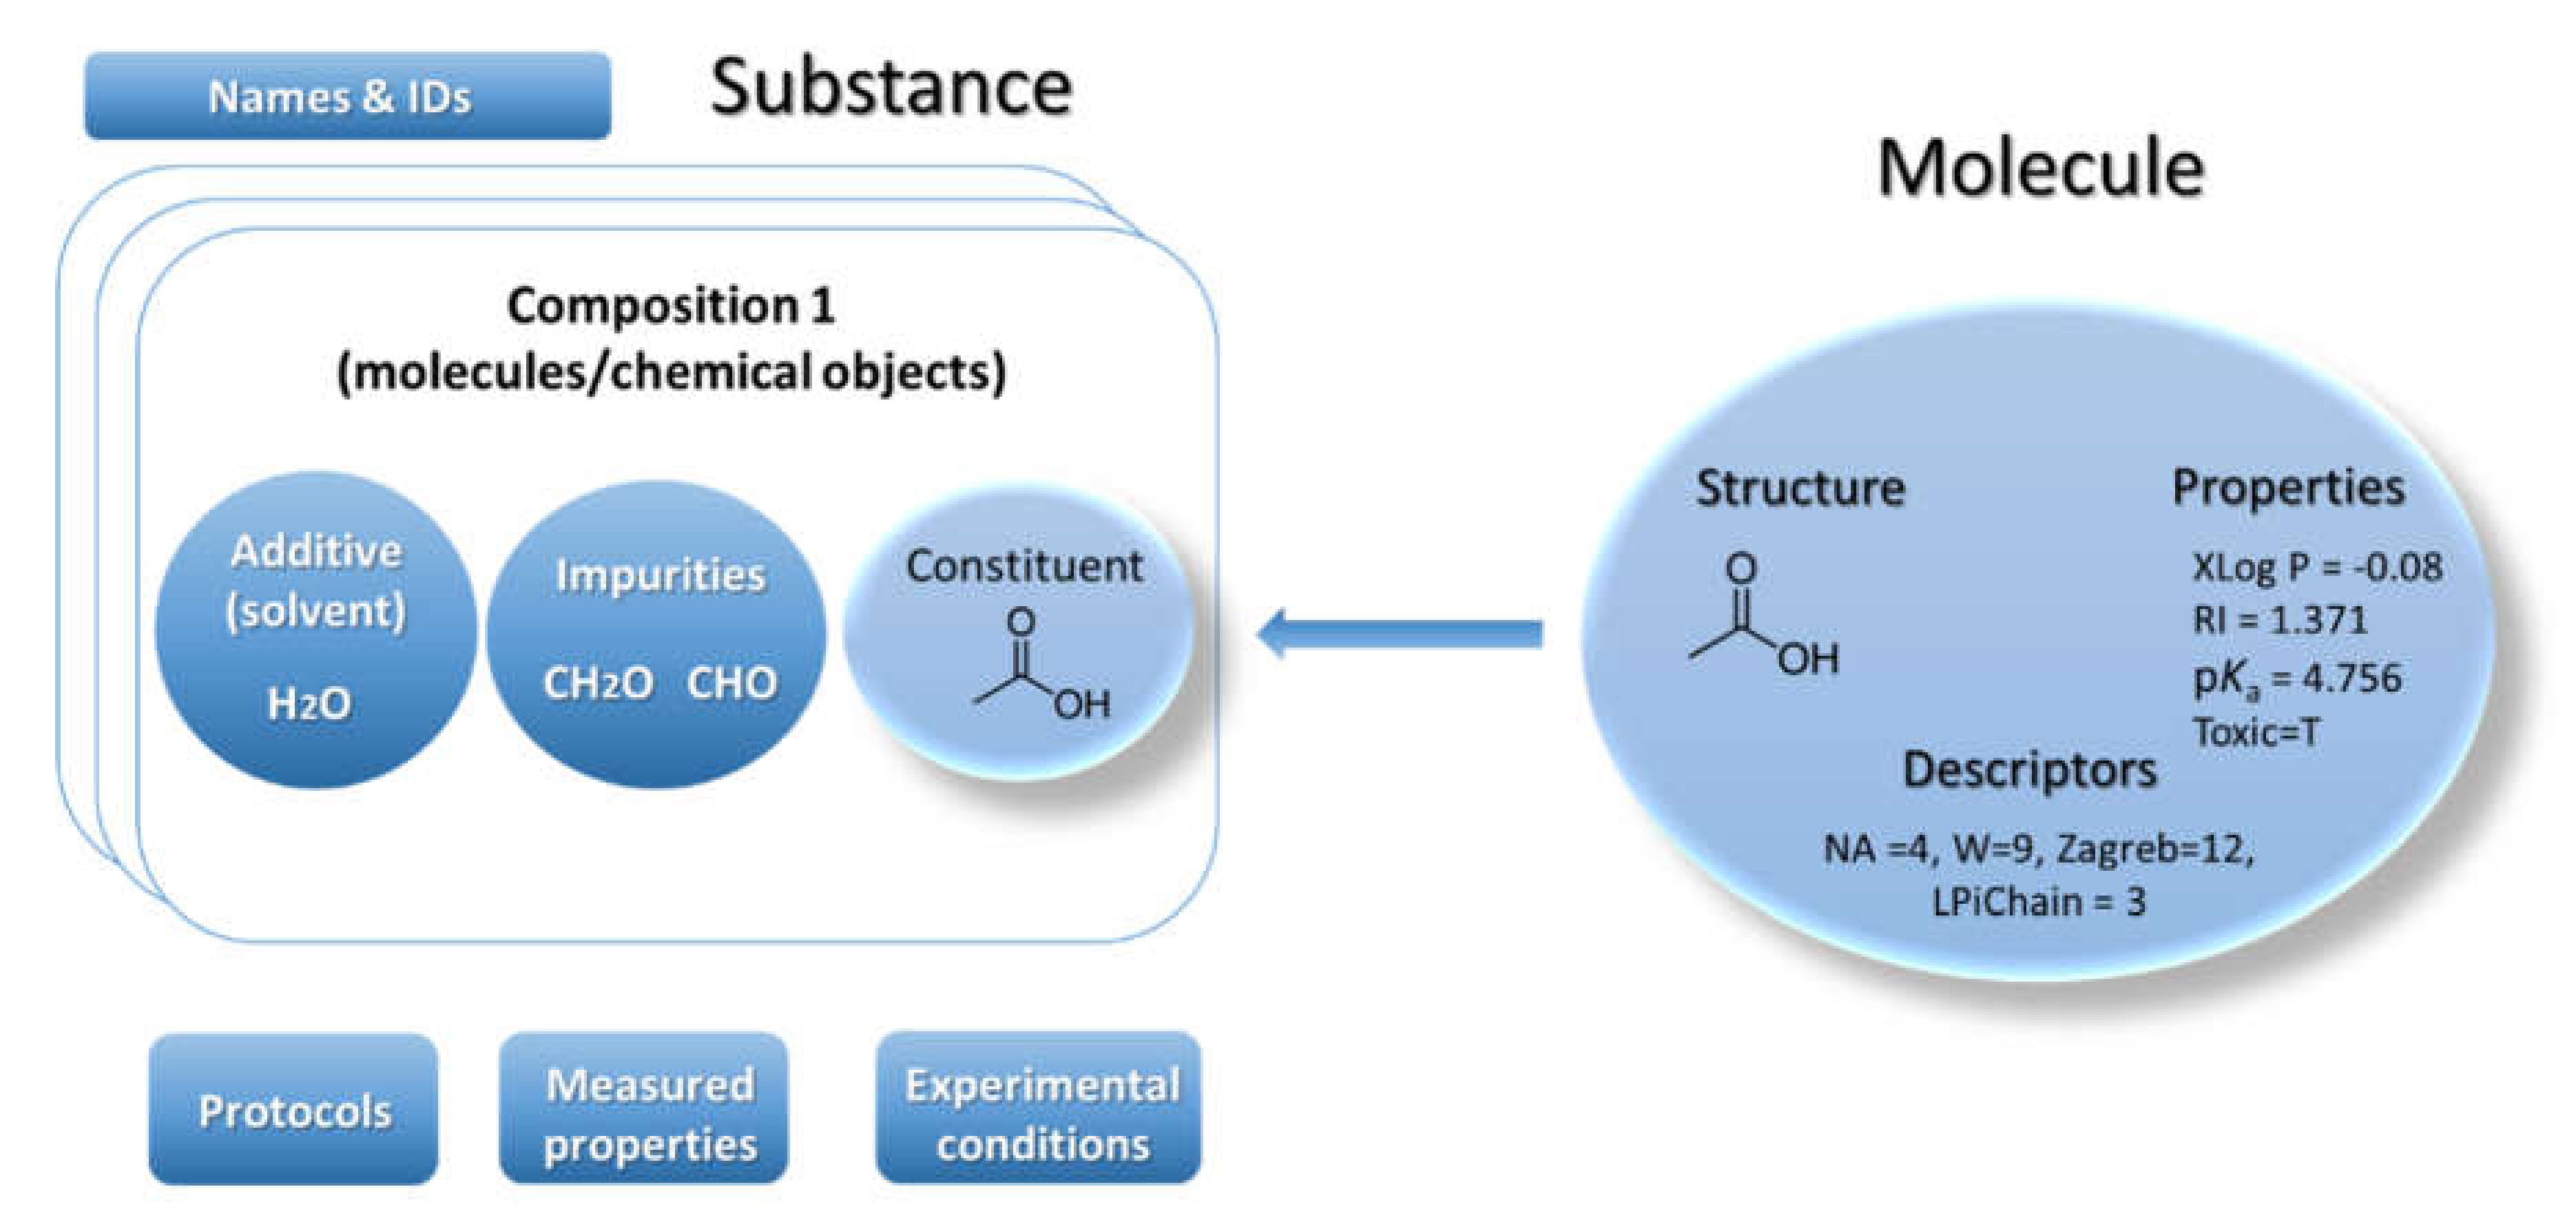
22]. Ambit can handle chemical structures via the classical model for representation of the molecule defined as a triad consisting of chemical structure, properties, and descriptors (
Figure 1). Many chemical databases and QSAR models’ implementations are mostly based on this model. This classical paradigm has been used for several decades and it is still nowadays the predominant base layer for public chemical databases. However, the regulatory bodies require information on chemical substances as produced by the industry—not as a single chemical structure. Hence the classical paradigm for describing a molecule is not sufficient for a complete description of the substance. The substance paradigm is a more complex data model adopted in Ambit [
23] to adequately represent the chemical objects under study. A more accurate representation of the composition and rich metadata is needed to effectively process data coming from many different biological analyses, including toxicity experiments. A substance is defined in the European Union regulation REACH [
7] and in the Classification, Labelling and Packaging (CLP) Regulation as: “a chemical element and its compounds in the natural state or obtained by any manufacturing process, including any additive necessary to preserve its stability and any impurity deriving from the process used, but excluding any solvent which may be separated without affecting the stability of the substance or changing its composition”. According to REACH and CLP, a substance may contain one or more main constituents that make up a significant part of that substance. The main constituents are clearly distinguished from other types of constituents, which are impurities and additives. The REACH definition includes all forms of substances and materials on the market, including nanomaterials.
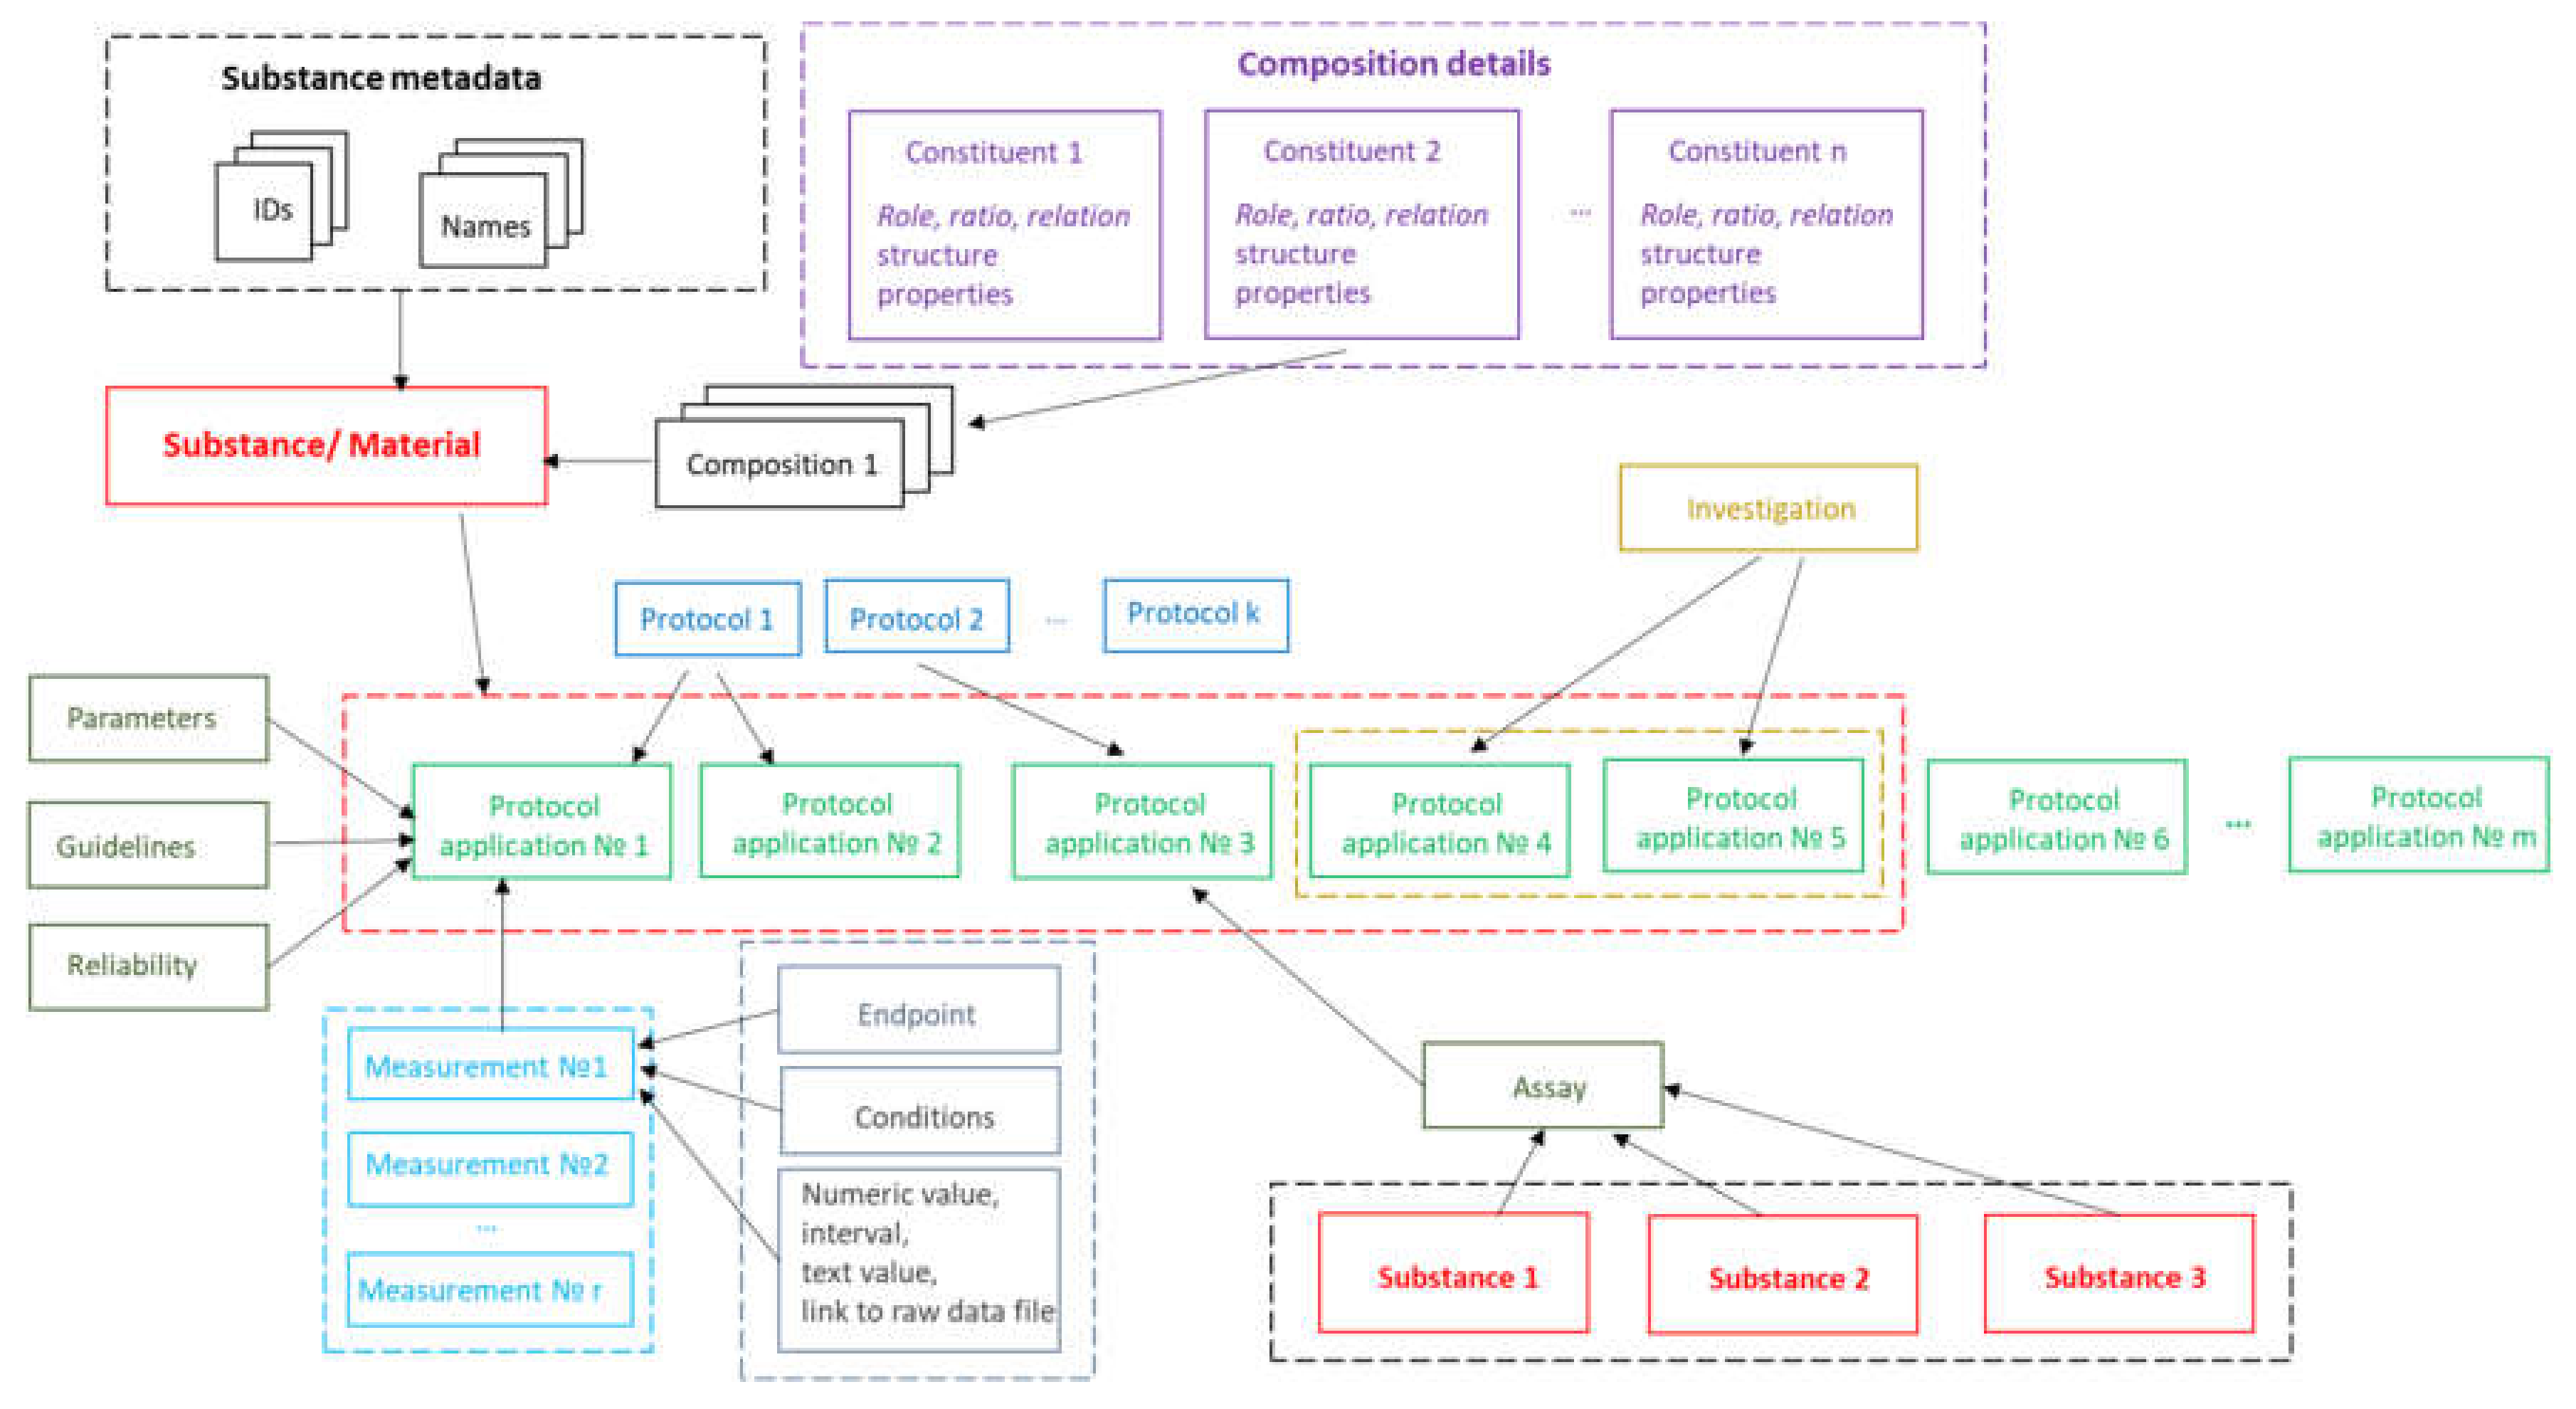
The implementation of substance support in Ambit is inspired by the OECD HT, CODATA, BioAssay ontology and ISA–Tab data model described above. The Ambit data model has been developed, optimized, tested, and improved for about a decade, processing many test cases and reflecting feedback from the users, all of which has helped to refine it. The eNanoMapper/Ambit data implementation has been designed to handle the major challenges encountered in the representation of chemical substances and nanomaterials. The eNanoMapper/Ambit data model is visualized in
Figure 2. It is composed of a variety of data components (entities) serving different roles for the formalization, encapsulation, and serialization of items of information about particular substances/nanomaterials and measurements. The data model components (
Figure 2) may have different representations at different stages of the information processing life-cycle: (1) JSON or RDF serialization on input or output; (2) Java classes in the server side Ambit implementation; (3) relational database entities (e.g., tables); (4) Python, R, Java, or JavaScript data structures when using the corresponding client libraries. Thus, the data model is a conceptual representation of chemical substances and measurements and can be implemented by different technology solutions, enabling data linking and interoperability. The Ambit cheminformatics platform uses these representations (1–3) internally and provides to external clients REST API representations in different formats (JSON, RDF, JSON–LD, ISA–JSON, TXT).
Substances are characterized by their composition and are identified by their names and IDs. The Ambit data model supports multiple names (e.g., public name, owner name) and multiple IDs as well as one or more compositions of the substance. The support for multiple compositions is in line with the IUCLIDv5 and v6 data model, complying with ECHA’s requirements. Each composition contains one or more components. Each component can be treated via the standard triad approach if needed (see
Figure 1), i.e., specifying a well-defined chemical structure and properties. Complex relations between the substance components can be specified. Each component is assigned a role in the composition, such as main constituent, impurity, or additive, or, for cases of nanomaterials, the roles can be core, coating, functionalization, etc. Each component may have its own properties (typically properties calculated from chemical structure and identifiers), which are distinguished from the substance properties. The results from the physicochemical and biological measurements are treated as properties of the entire substance and are handled via the protocol applications.
The measurements data model has been described previously [
8], but we highlight some of the essential points here for readers’ convenience. The event of applying a test or experimental protocol to a substance/nanomaterial is described by a “protocol application” entity (borrowed from the ISA–Tab model). Each protocol application consists of a set of “measurements” for a defined “endpoint” under given “conditions”. The measurement result can be a numeric value with or without uncertainty specified, an interval, a string value, or a link to a raw data file (e.g., a microscopy image). A particular “protocol application” is specified by a dynamic list of parameters as well as linking with Standard Operating Procedures (SOP), guidelines, publications, data quality flags, etc. The measurement conditions (or experiment factors, such as concentration, time, etc.) are another dynamic list of parameters, assigned to a different level of the data model. The data for particular NM may contain many “protocol applications”. The protocol applications that are related to one another can be grouped to form an “Investigation” entity. In addition, several different nanomaterials/substances that have the same “protocol application” applied can be grouped via the “Assay” entity (e.g., several materials and controls in the same assay). The high level components of the model, such as Substance, Protocol Application, Investigation, and Assay, have automatically generated UUIDs (hash based), which are used for linking and grouping the measurements.
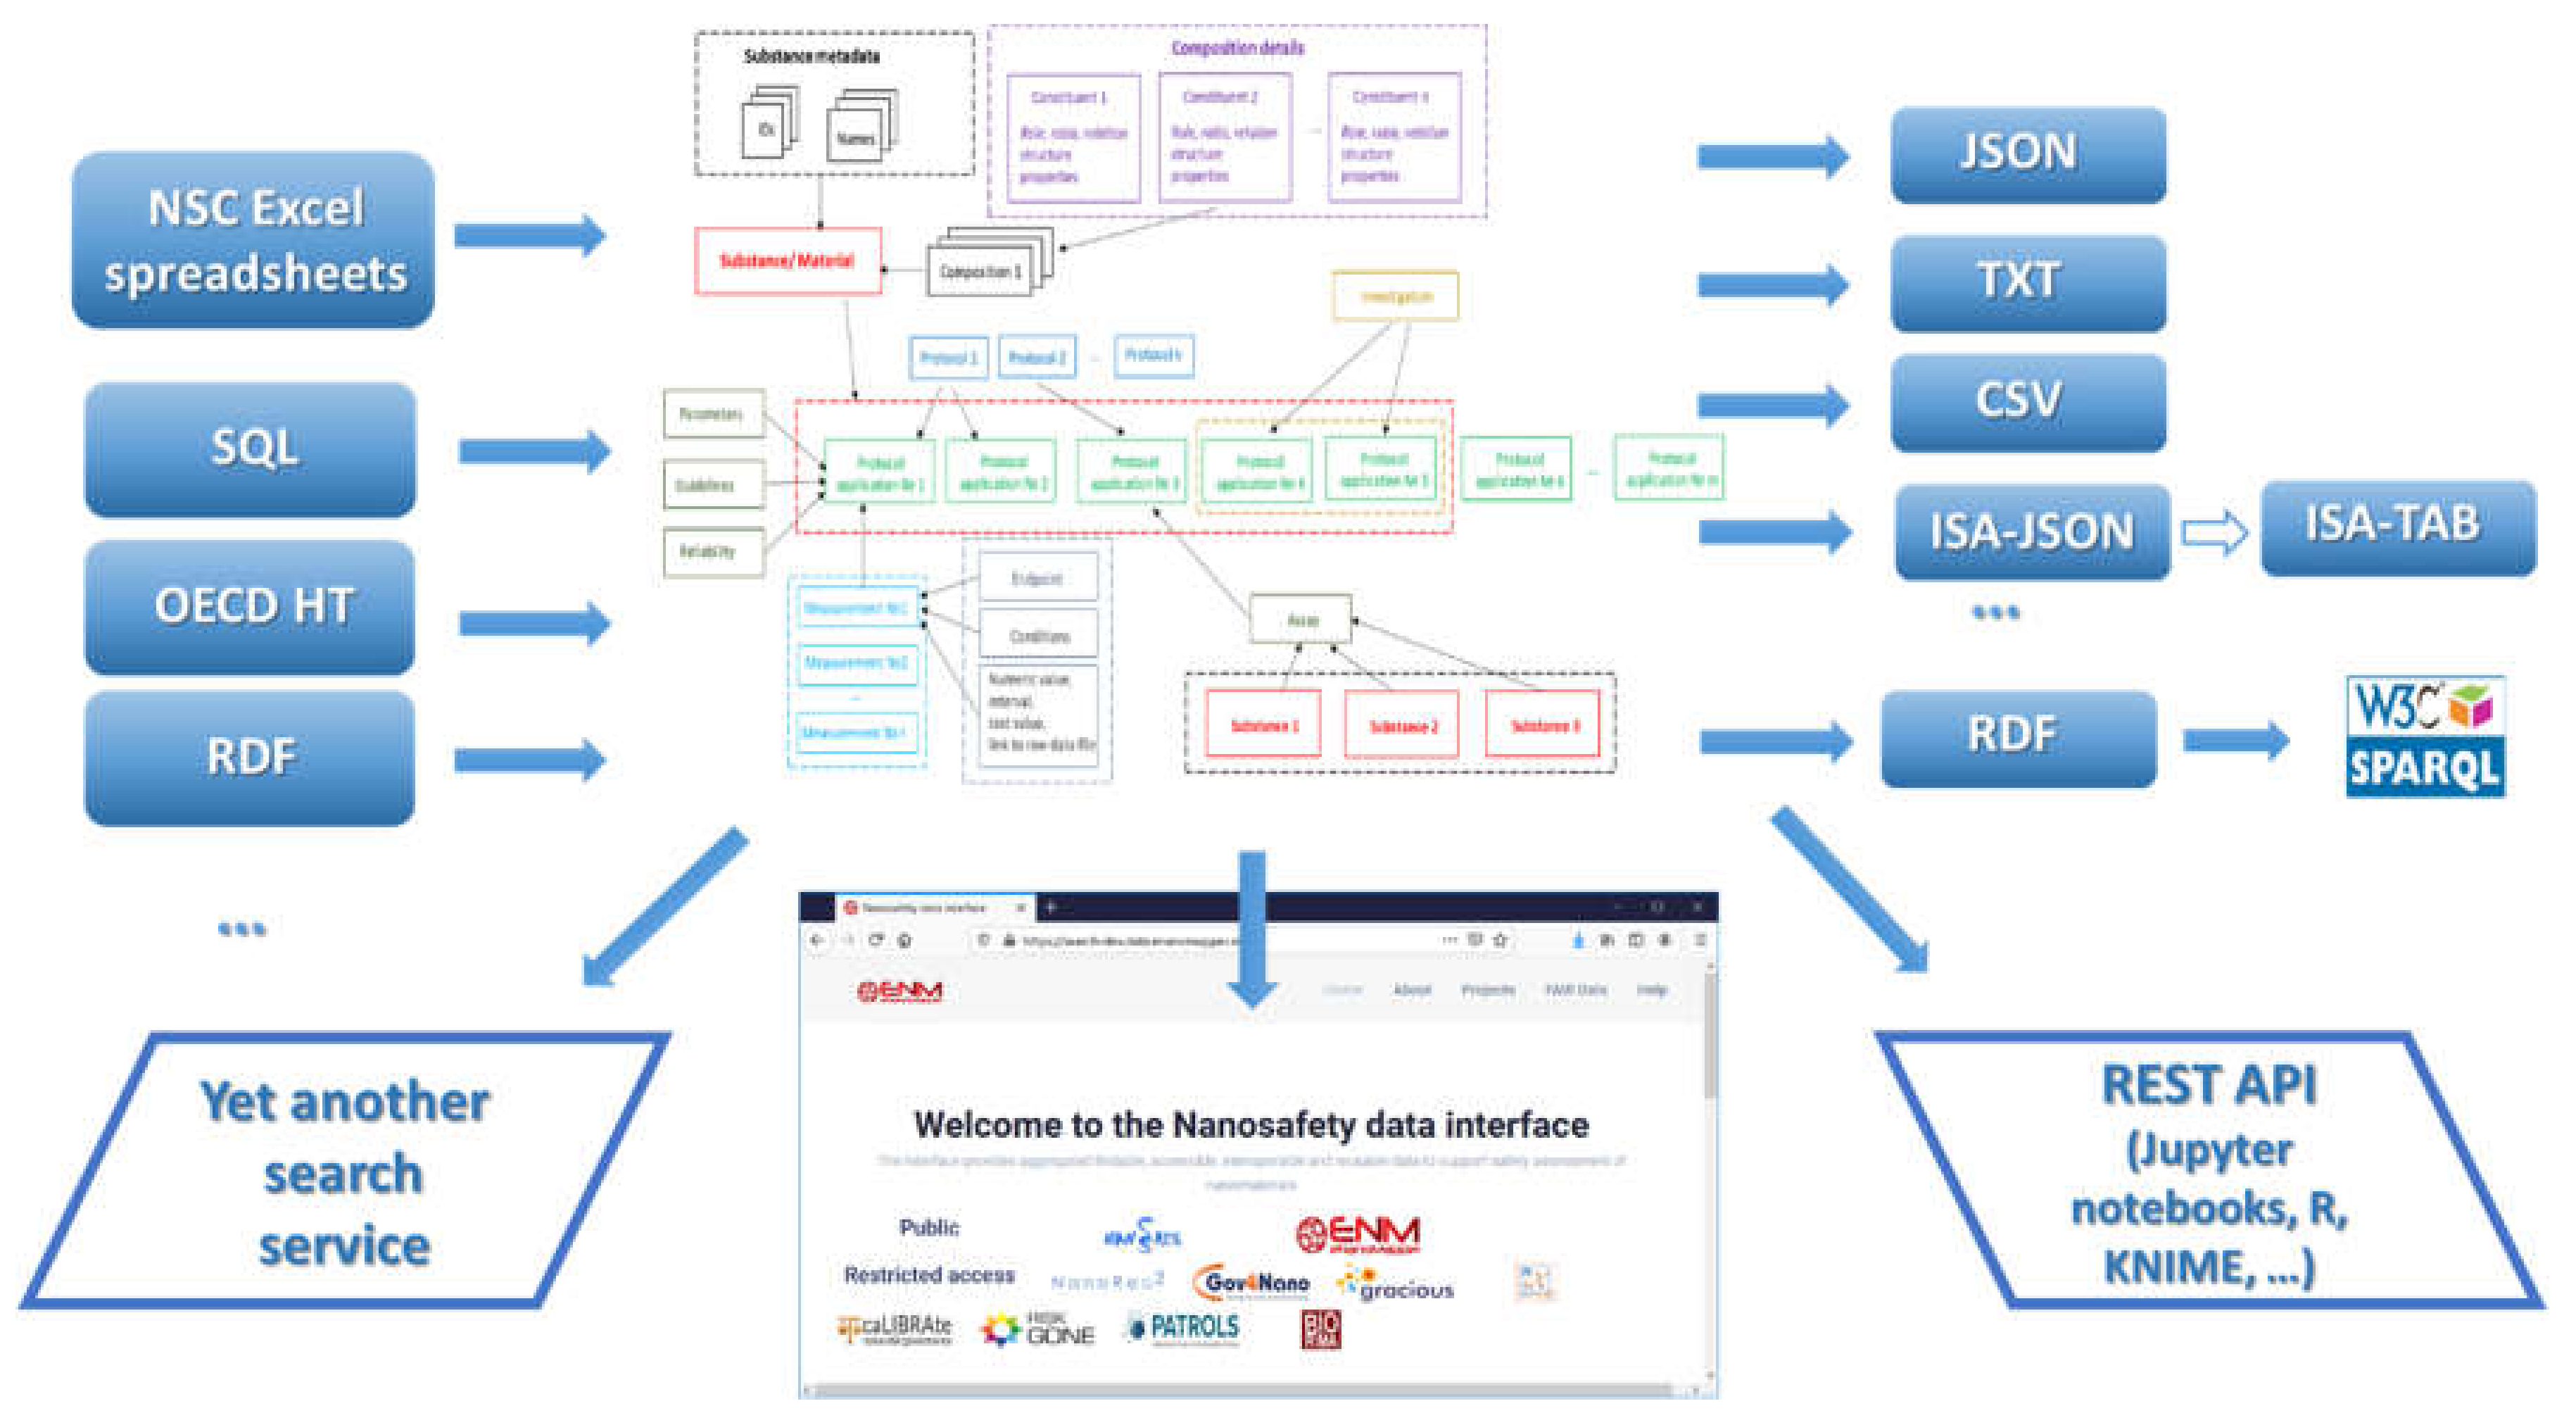
The data model allows for integration of content from a variety of sources: OECD HTs (IUCLID5 and IUCLID6 files or direct retrieval from IUCLID servers), custom spreadsheet templates, SQL dumps from other databases, custom formats, provided by partners (e.g., the NanoWiki RDF dump [
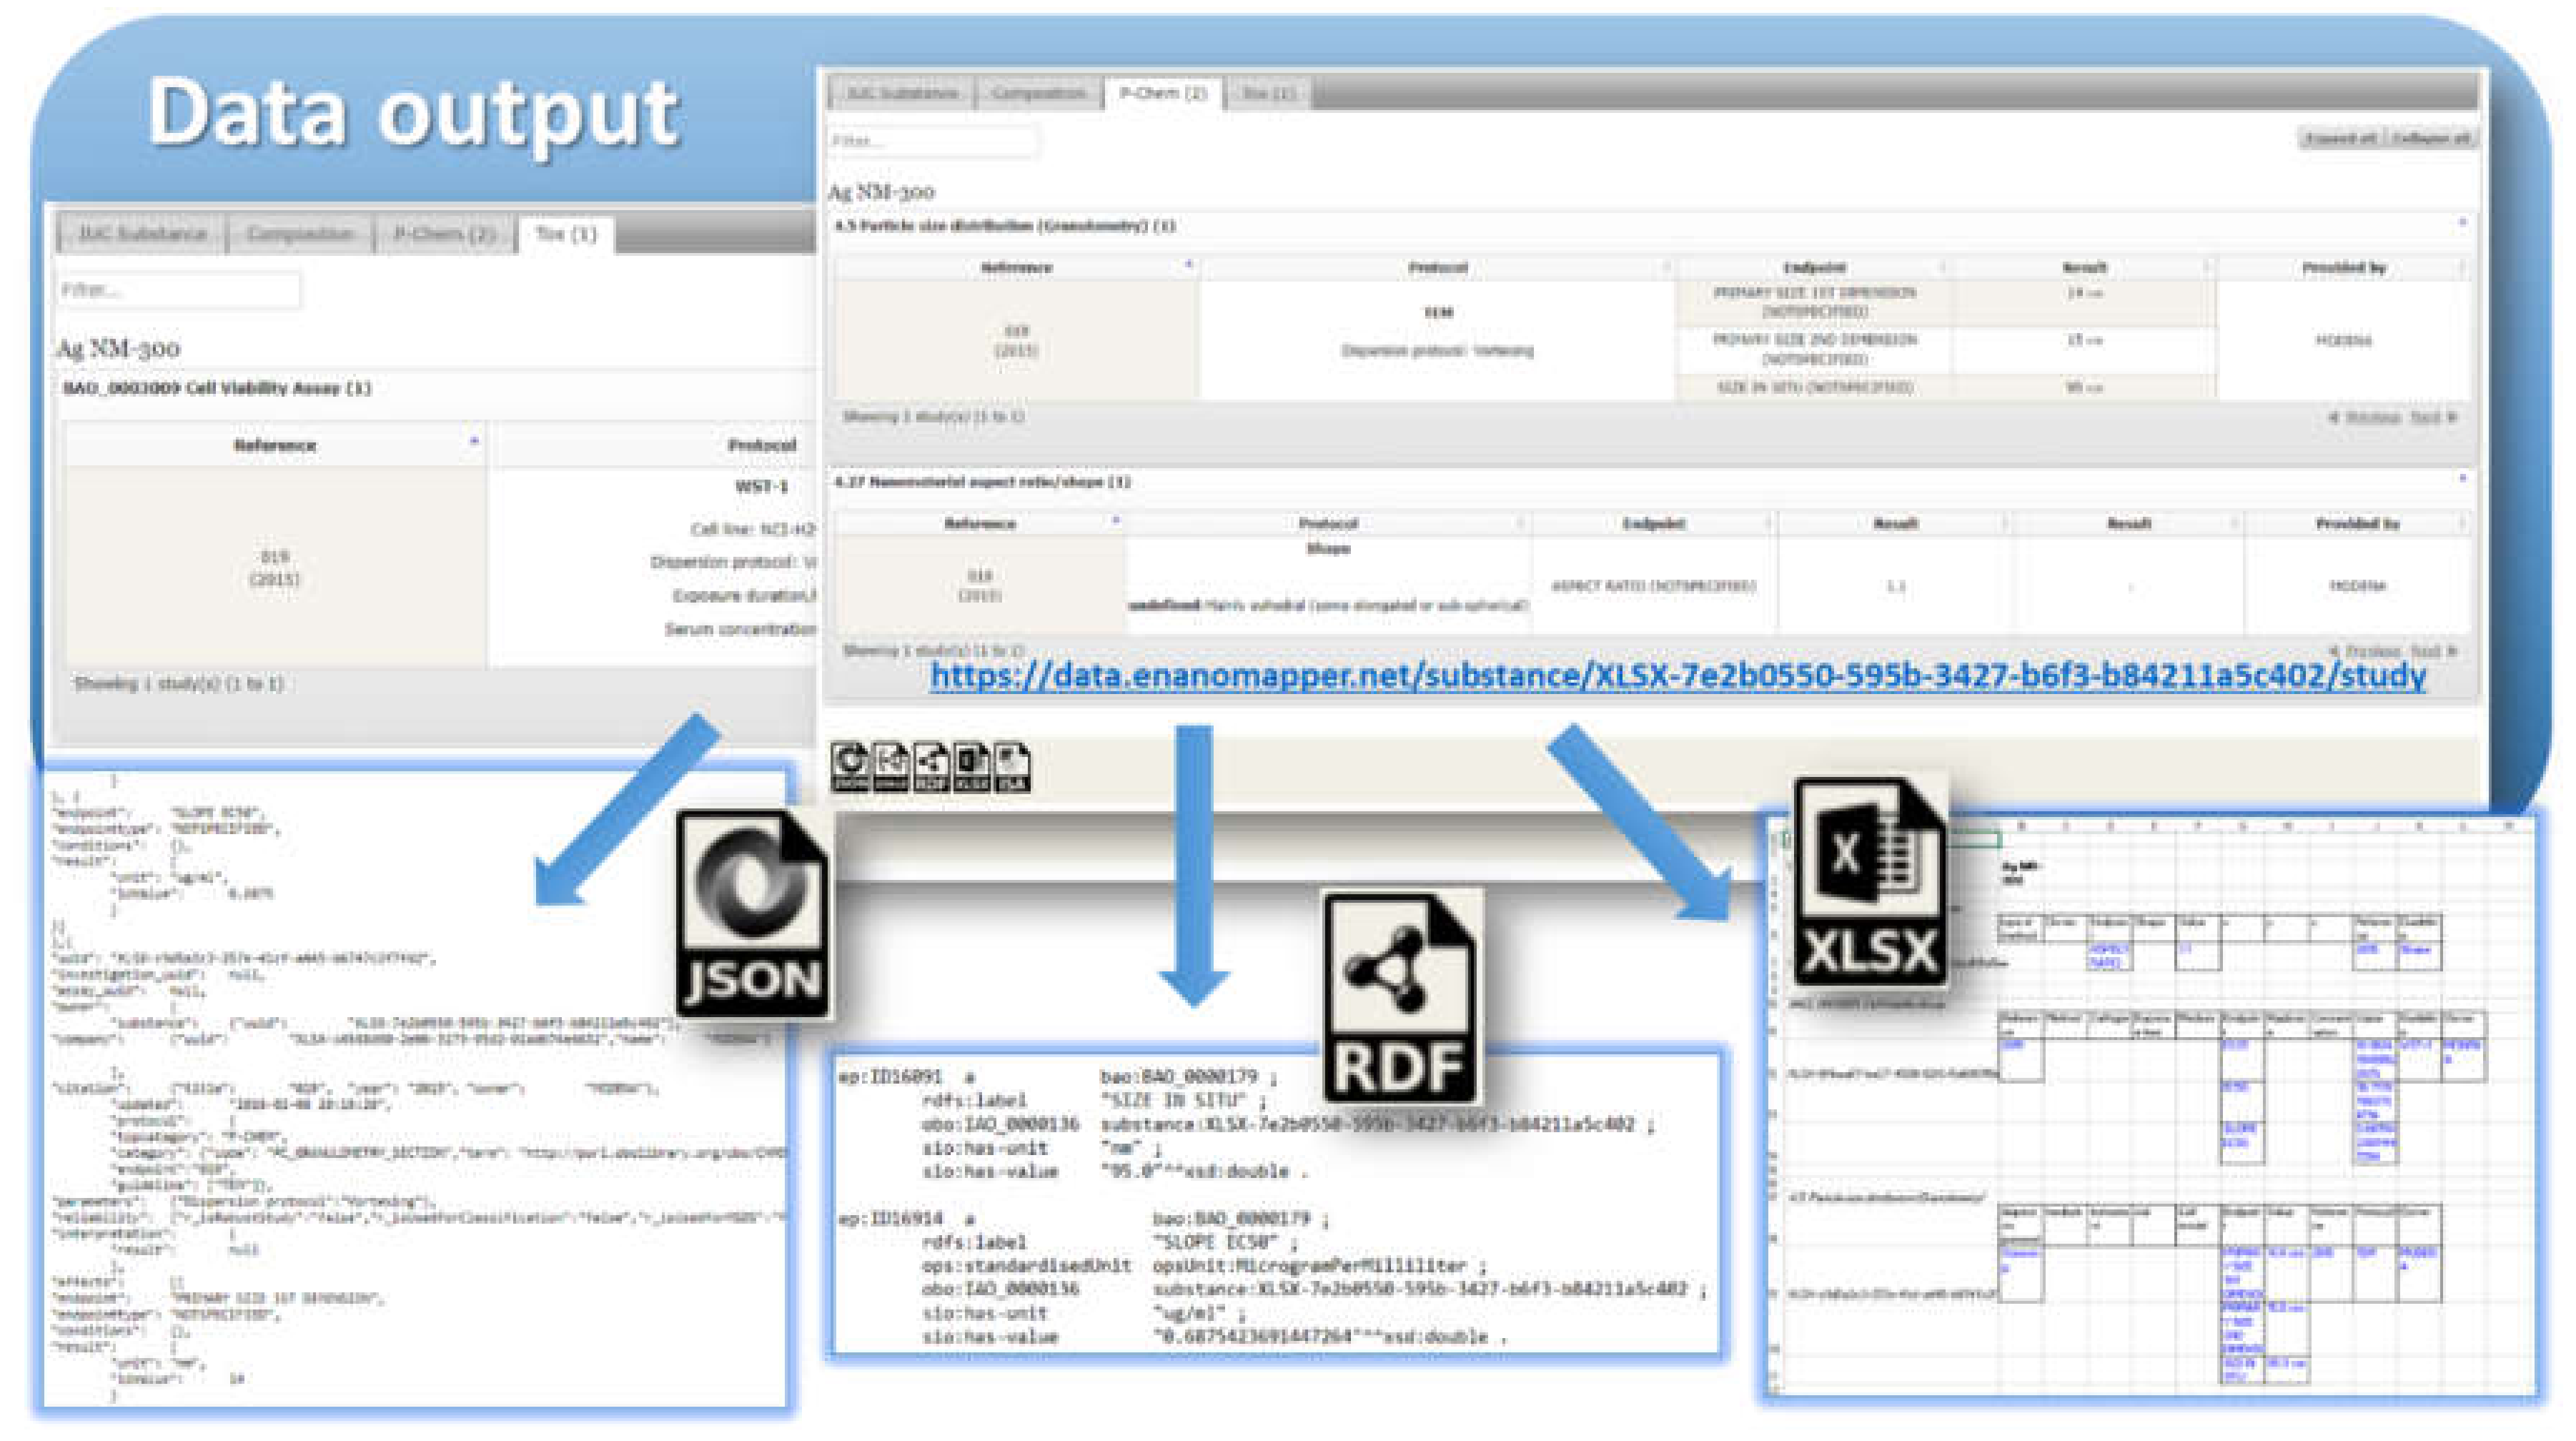
24]). Once the data is imported into the eNanoMapper database, a variety of options for export, data conversion, data retrieval, and data analysis are available (see
Figure 3). The data model described is flexible and allows a variety of views of the data implemented via a Web GUI based on the jToxKit [
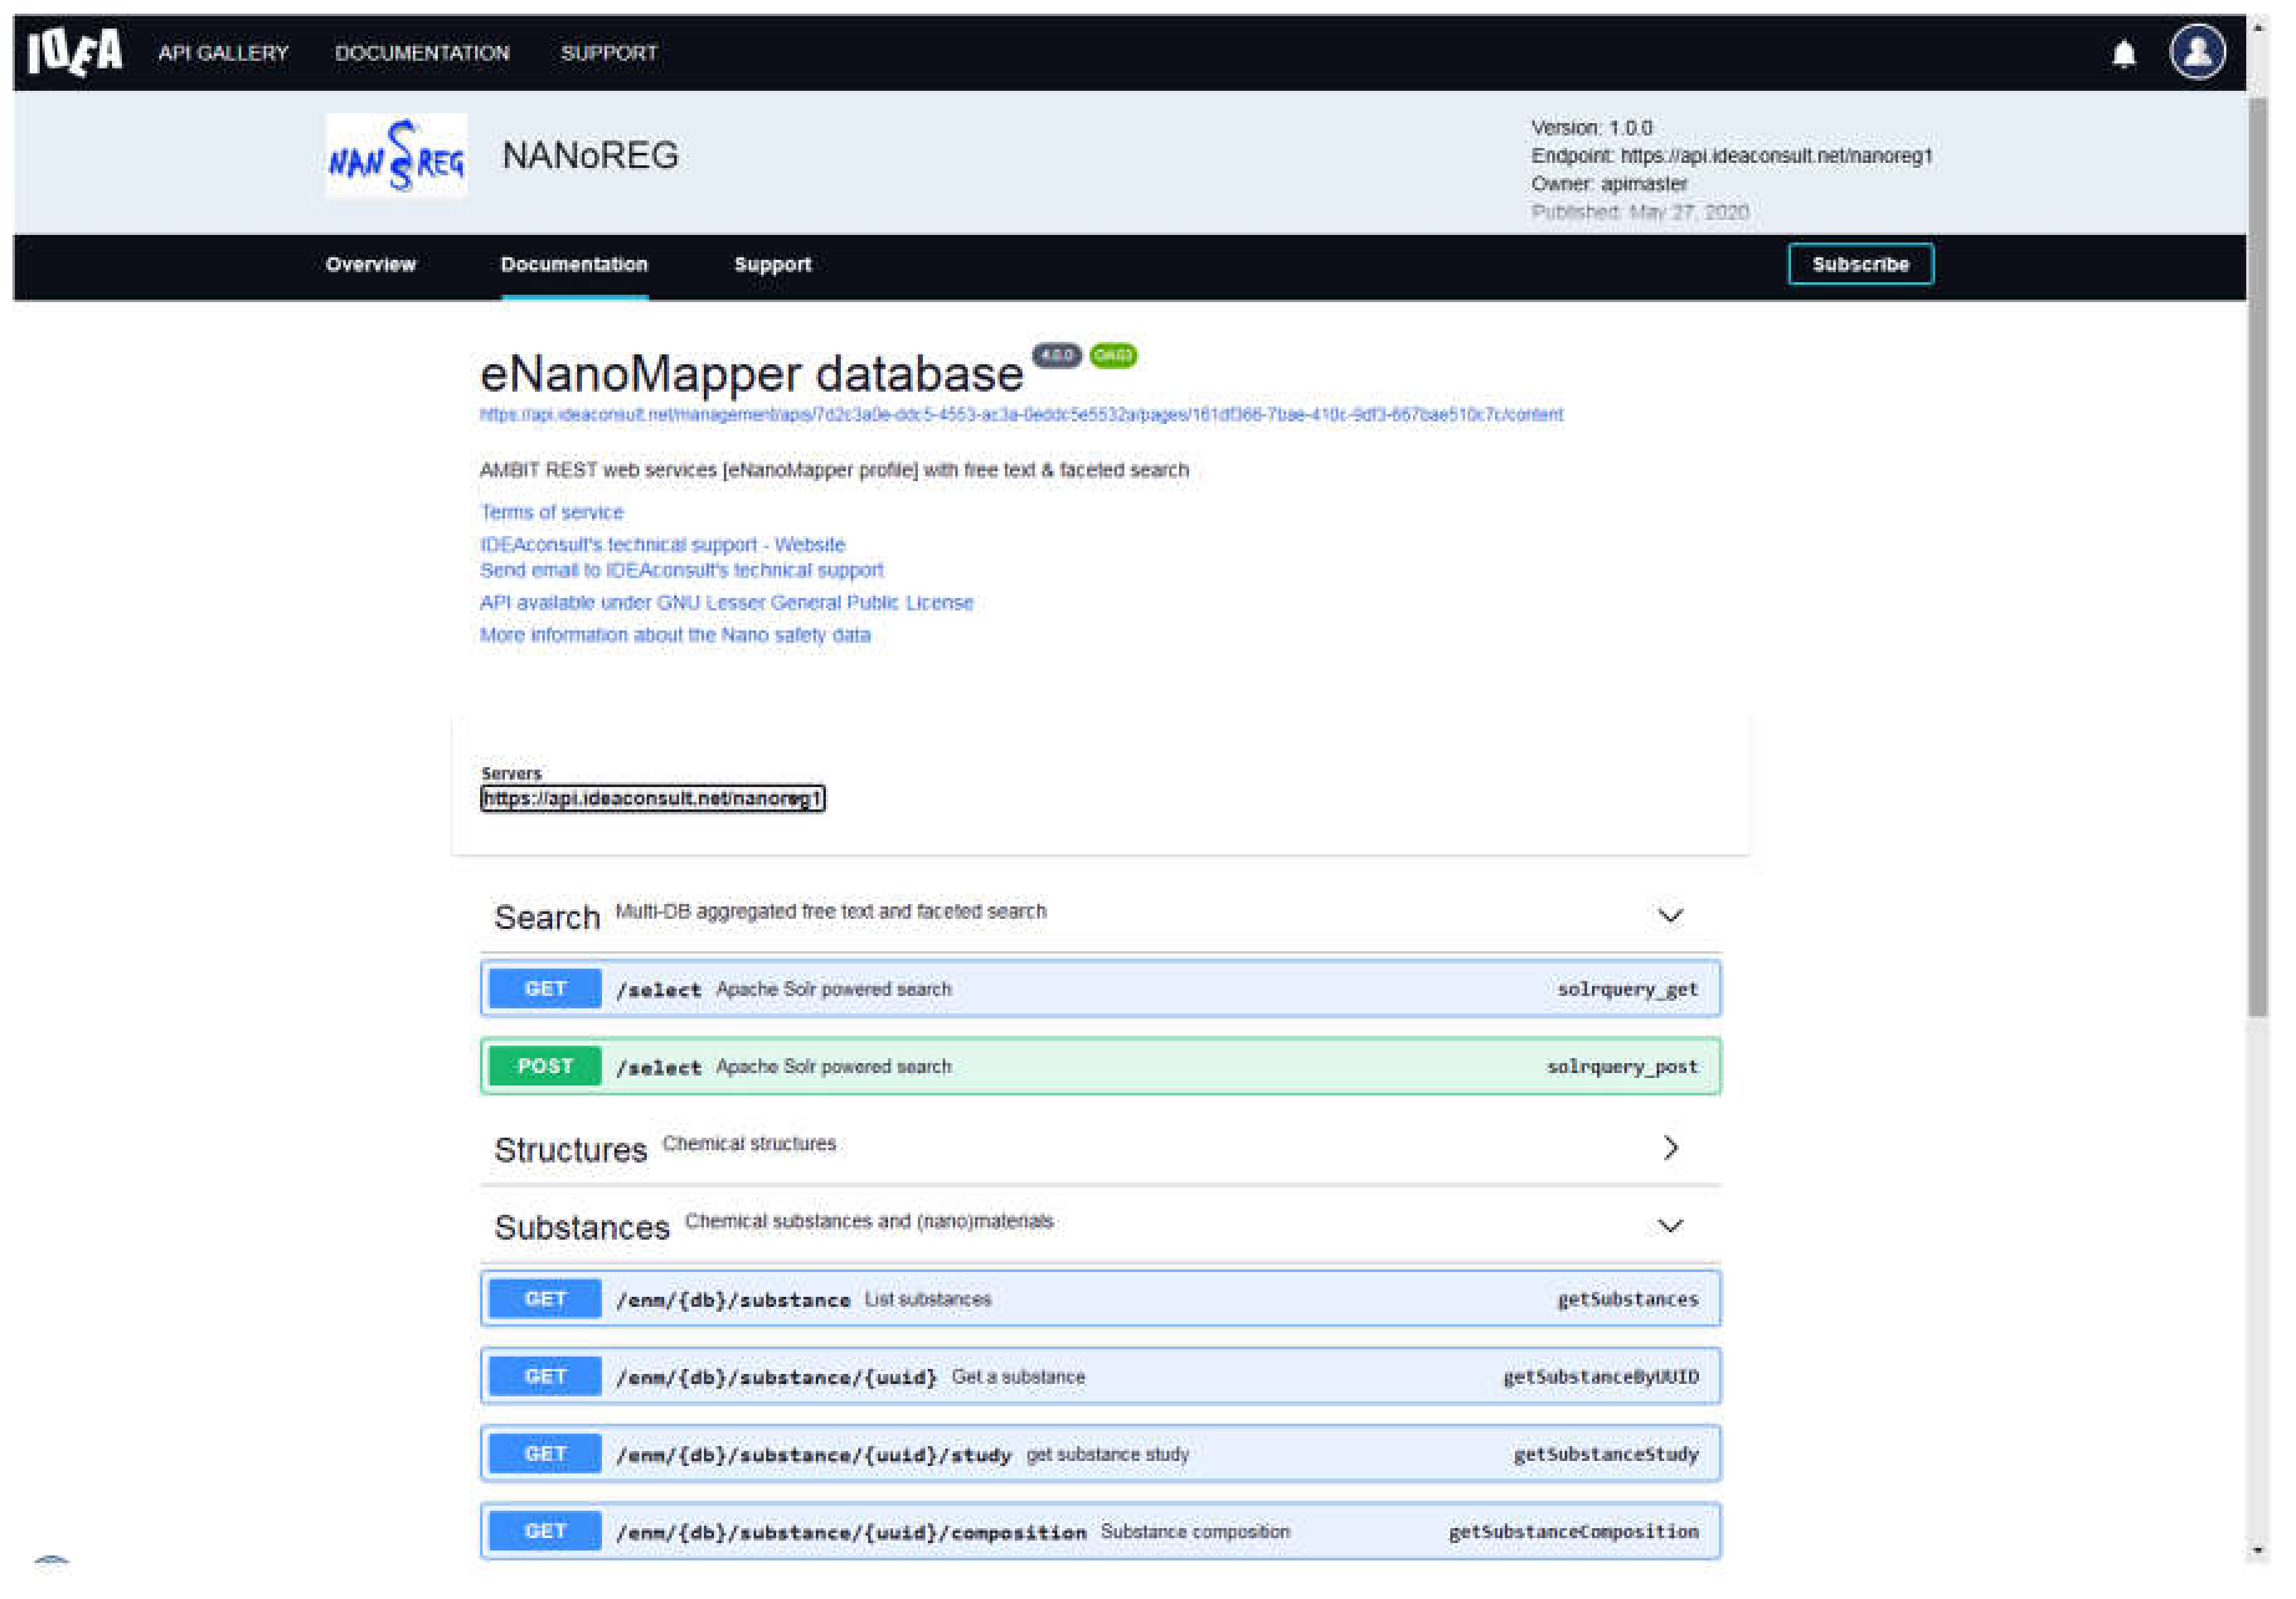
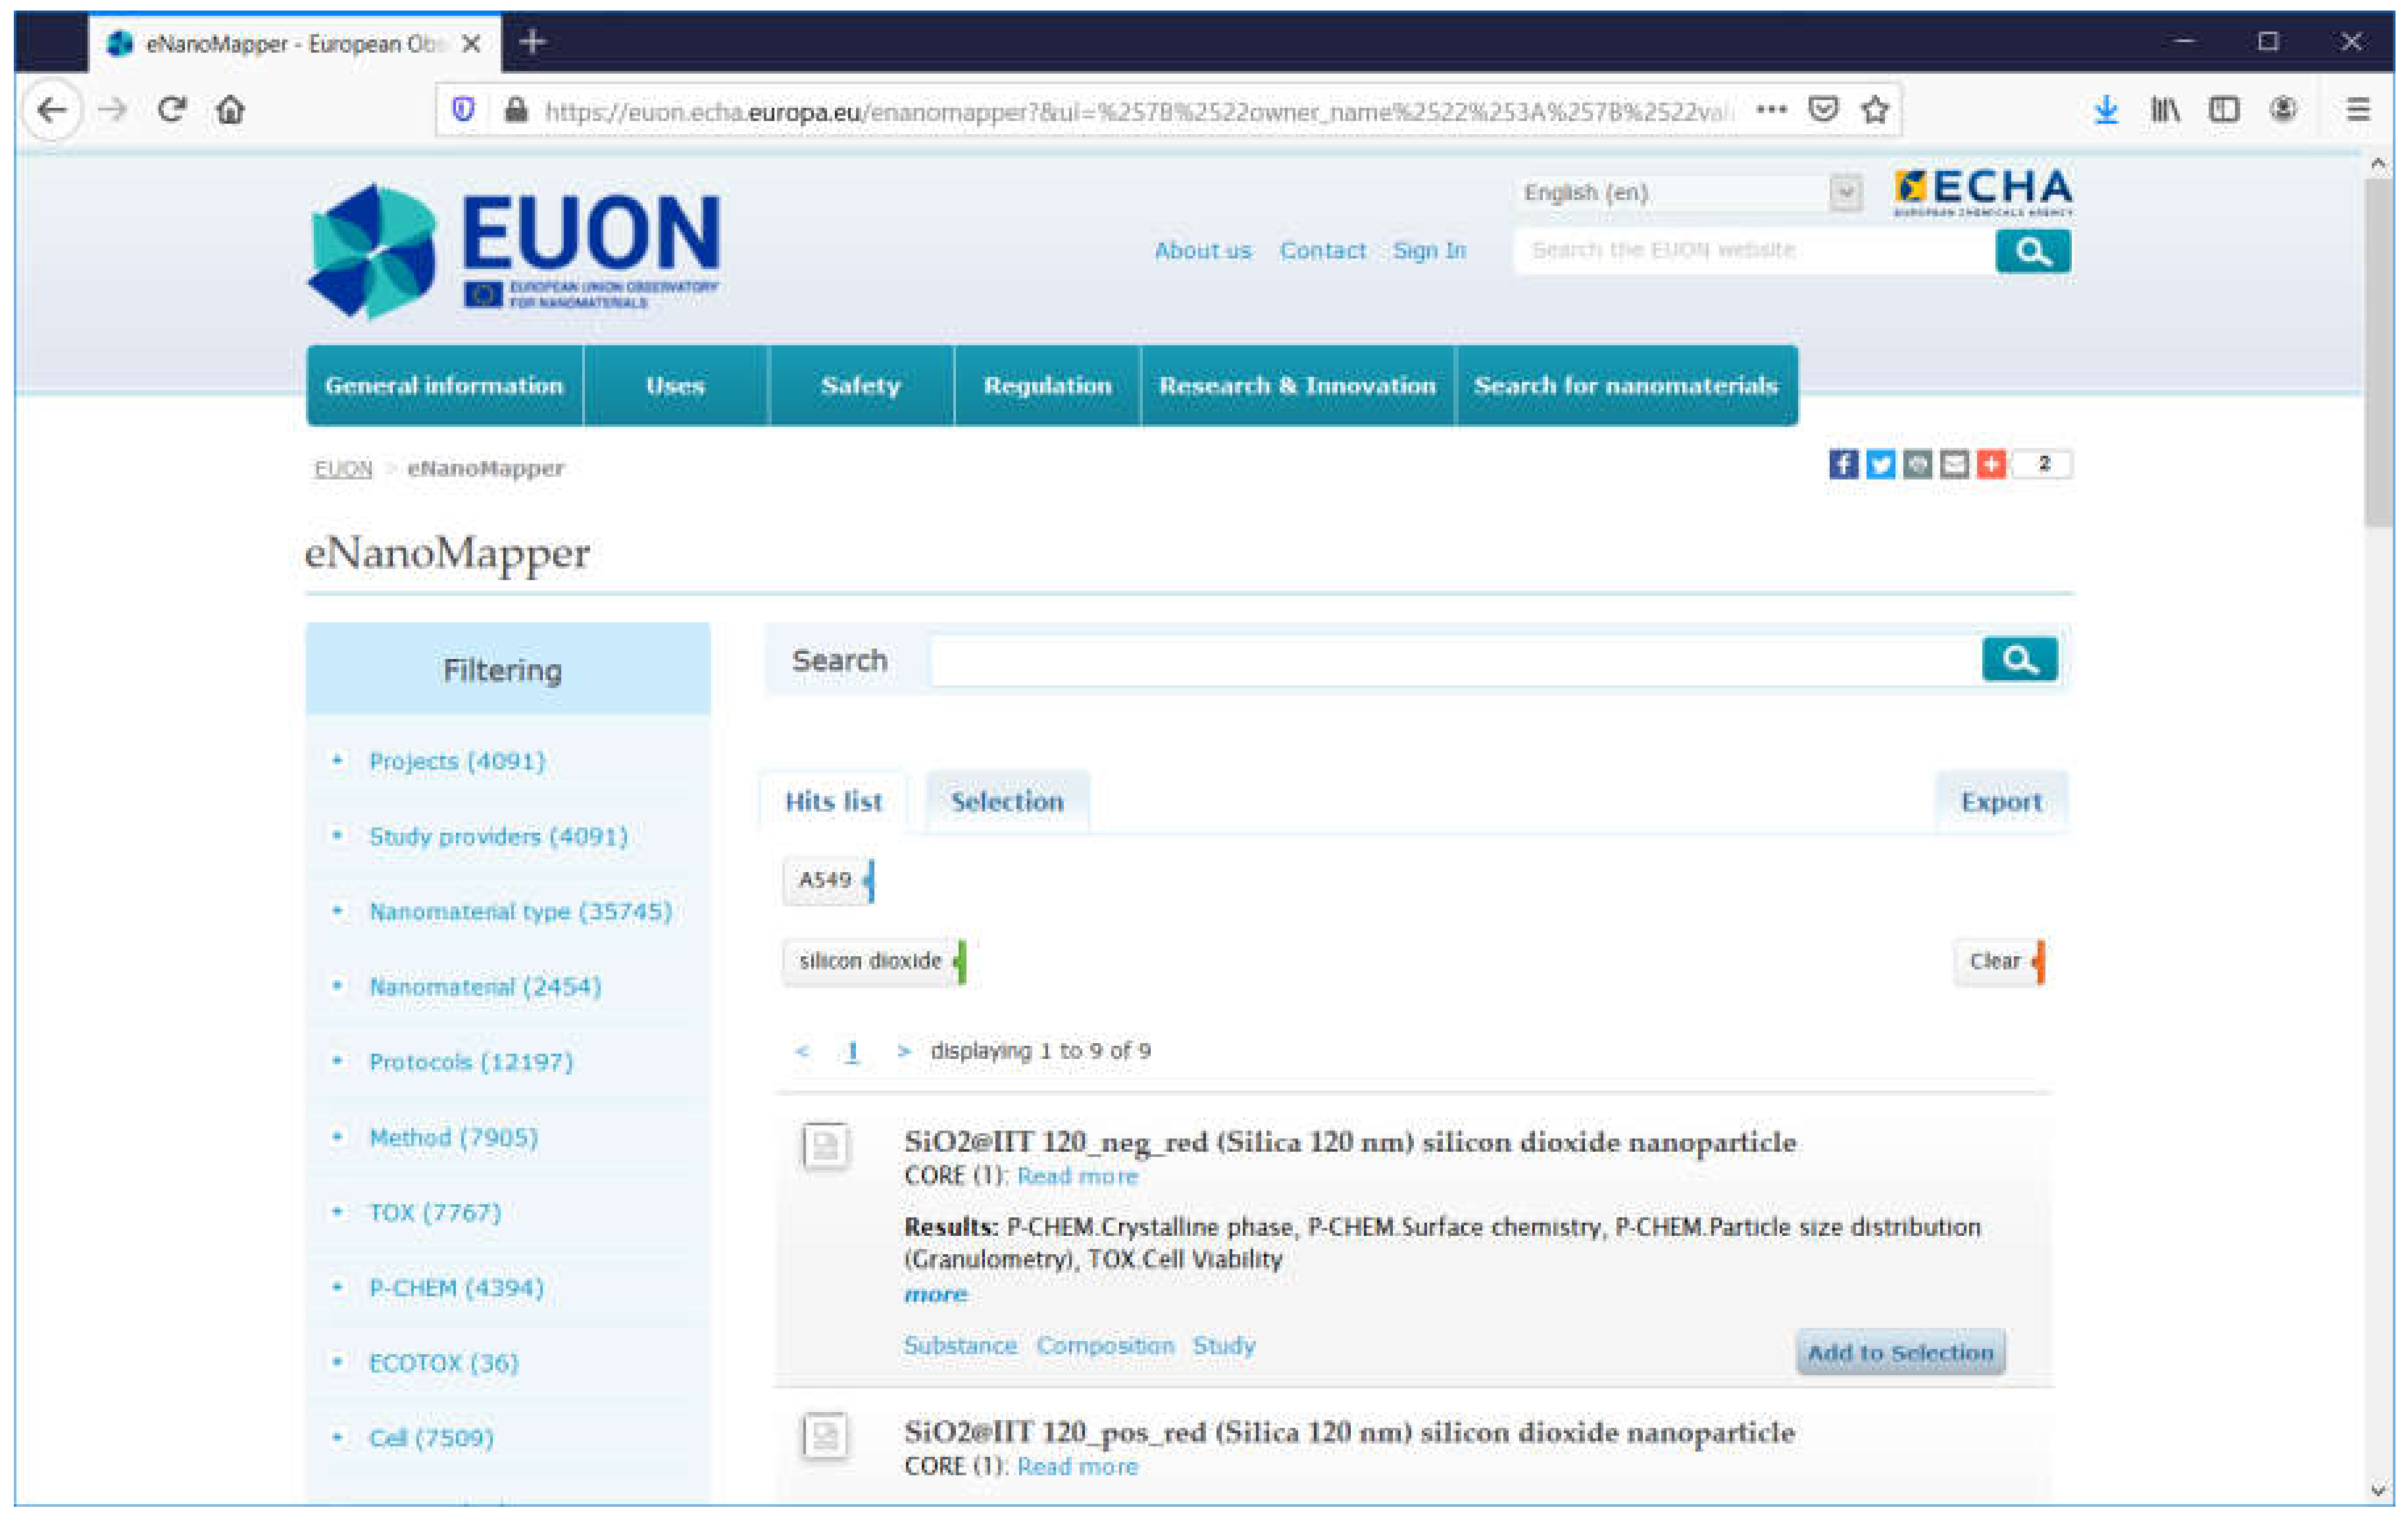
25] JavaScript library, as well as many customized methods for accessing the data through a REST API via external tools like Jupyter notebooks and the KNIME analytics platform.
Taking into account the fact that the use of spreadsheet templates for data entry is the preferred approach by the majority of the EU NanoSafety Cluster projects, we developed a configurable spreadsheet parser that facilitates user friendly data preparation and database upload, as described in the next section.
2.3. Configurable Excel Spreadsheet Parser (NMDataParser)
The NMDataParser tool is a configurable Excel file parser, developed in Java on top of the Ambit data model and with extensive use of the Apache POI library [
26]. It was designed and developed as an open source library to enable the import of nanomaterial characterization and safety data from the Excel spreadsheets provided by the nanosafety community. Within the two formats outlined in
Section 2.1, there can potentially be unlimited permutations in layout, data, metadata, and terminology used in the files. The parser enables conversion of the data stored in the supported set of spreadsheet templates into the eNanoMapper/Ambit data model (implemented internally as Java classes and JSON, RDF, and ISA–JSON serializations). It accommodates different row-based, column-based, or mixed arrangements of the data found in the Excel spreadsheet. The parser configuration is defined in a separate JSON file (the JSON configuration syntax is described in
Section 2.4), mapping the custom spreadsheet structure into the internal eNanoMapper data model storage components: “Substance”, “Protocol Application”, “Measurement”, “Parameters”, and “Conditions”.
The parser code, the JSON syntax, documentation and example files are available at
https://github.com/enanomapper/nmdataparser/. This repository hosts Java code arranged as a multi-module Apache Maven project. The main package,
net.enanomapper.parser (within the
enmexcelparser module), contains the basic functionality of the parser. The parser can be started via the class GenericExcelParser, as shown in
Figure 4. The parser works with a simple input: a spreadsheet (Excel) file and a JSON configuration file. As a result, an iterator to a list of substances (i.e., instances of the Java class SubstanceRecord from the Ambit Java data model) is returned.
The parser is embedded in the Ambit/eNanoMapper web application, allowing the upload of spreadsheets through a web form. The parser is also integrated into the main eNanoMapper import workflow (3.1).
The enmconvertor module is a command line application, which has options for converting input data in Excel, RDF, or JSON format into the eNanoMapper semantic model and serialization into eNanoMapper JSON, RDF, or ISA–JSON. Additional helper options are: extracting template fields of an input NanoReg/JRC template, generating a skeleton JSON configuration, and even generating an assay-specific Excel template. These helper functionalities are available as libraries in the enmtemplategen and enmtemplate modules.
The command line applications enabling file conversion without importing data into the database are useful for testing purposes, but also can be used to convert the input files into a common semantic model in a selected output format (JSON, RDF) with a subsequent storage and indexing outside of eNanoMapper database.
2.4. JSON Configurations for Data Import
The configuration metadata for the parser is defined in a separate file in JSON (JavaScript Object Notation [
27]) format, mapping the custom spreadsheet structure into the internal eNanoMapper storage components. A comprehensive understanding of the data model is mandatory (see
Section 2.1) for efficient use of the NMDataParser tool and to optimise the parsing process for successful database import. This section highlights the basic principles of NMDataParser configuration syntax based solely on the simplicity of the JSON format [
27].
The NMDataParser JSON configuration syntax includes a set of keywords (i.e., JSON attributes), specifying different strategies for reading the data from one or several Excel sheets, as well as allowing the combination of spreadsheet structures (sheets, rows, columns, blocks of cells, and individual cells) into the eNanoMapper data model. The JSON configuration file consists of several major sections, which are objects on the first level of the JSON schema:
![Nanomaterials 10 01908 i001 Nanomaterials 10 01908 i001]()
The section
DATA_ACCESS defines the basic access to the spreadsheet template information, i.e., how data for the substance records (nanomaterials) is iterated.
SUBSTANCE_RECORD is a section that defines data locations of the basic fields (components) of a substance record from the data model (see
Section 2.1). The last major section on the first JSON level is an array of Protocol Application configurations stored as the JSON attribute
PROTOCOL_APPLICATIONS. The Protocol Applications are associated with the Substance Record object, defined in the previous JSON section.
Most of the attributes in a JSON configuration are based on the concept of Excel Data Location (EDL). The EDL is a small JSON section (an object with several keys and values) that describes a particular location in the Excel workbook. EDL is similar to internal spreadsheet “coordinates”, specifying where and how to extract a particular piece of information, e.g., the endpoint within the Protocol Application entity is specified with an EDL as follows in the example:
![Nanomaterials 10 01908 i002 Nanomaterials 10 01908 i002]()
All major sections of the JSON parser configuration define attributes for particular components of the eNanoMapper/Ambit data model in the form:
<Data model entity (JSON attribute name)>: <Excel Data Location>
The NMDataParser JSON attribute names are identical to or closely resemble the eNanoMapper/Ambit data model components’ naming (i.e., names used in the SQL database schema or Java library classes; see also
Figure 2). The EDL information depends on the iteration mode defined by the attribute ITERATION (
Figure 5). A short syntax form is also allowed and encouraged for clearer, concise JSON configurations by omitting attributes that are defined globally by a DATA_ACCESS section (described below). For example, in the iteration mode ROW_SINGLE, only a column index is needed (actually, the row is not known in advance—it is obtained dynamically on the Excel rows iteration), while in the iteration mode ABSOLUTE_LOCATION, a column index and a row index are required. In this example, the Excel sheet index is not specified since it is taken globally (by default) from the DATA_ACCESS section as well.
Figure 5 illustrates another commonly used iteration mode, called JSON_VALUE, i.e., the value for the data model entity (in this example UNIT) is given directly in the JSON configuration file. These are the most widely used modes of iteration. The EDL configuration syntax contains many more flexible options discussed further in the
Supplementary Materials.
The DATA_ACCESS section defines the basic parameters for data access and iteration of the NM substances. The iteration mode is set through the attribute ITERATION and is used in every EDL object. NMDataParser supports several modes of iteration. Their implementation was motivated by the need to facilitate support for all known scenarios for accessing the NSC Excel sheets data (see more details in 2.1 Data entry templates and in the discussions in
Section 3 and
Section 4).
For most of the iteration modes (see
Supplementary Materials Table S1), there is a primary sheet used to define the logic of reading (iterating) the substances from the Excel sheet. The DATA_ACCESS section describes attributes (keys) for the basic approach for reading Excel data and these are the default reading parameters (i.e., they may be omitted using short JSON syntax, as shown in
Figure 5). When a particular attribute in EDL is not set, the default value is taken from the DATA_ACCESS section.
The ROW_SINGLE mode is predominantly used for the NSC templates (
Figure 6). The Excel sheet data is accessed treating each table row as a separate Substance record. The logic of data organization on a by-column basis of the substance data components is quite appealing and preferred in many cases (in
Section 3 and
Section 4 we discuss also the drawbacks of this approach). The header rows are not part of the iteration but the data therein can be accessed with an EDL in the iteration mode ABSOLUTE_LOCATION, for instance.
The NMDataParser tool recognizes missing or wrong types of attributes in the EDLs or other JSON sections and returns corresponding error messages. The error messages are crucial for the correct configuration of the NM data import and especially helpful when the JSON configuration is performed manually. The latter is quite common since domain expert knowledge is extensively used in parser configuration.
The
SUBSTANCE_RECORD section contains a set of EDLs for reading the basic fields of a Substance Record, as described in the data model (see
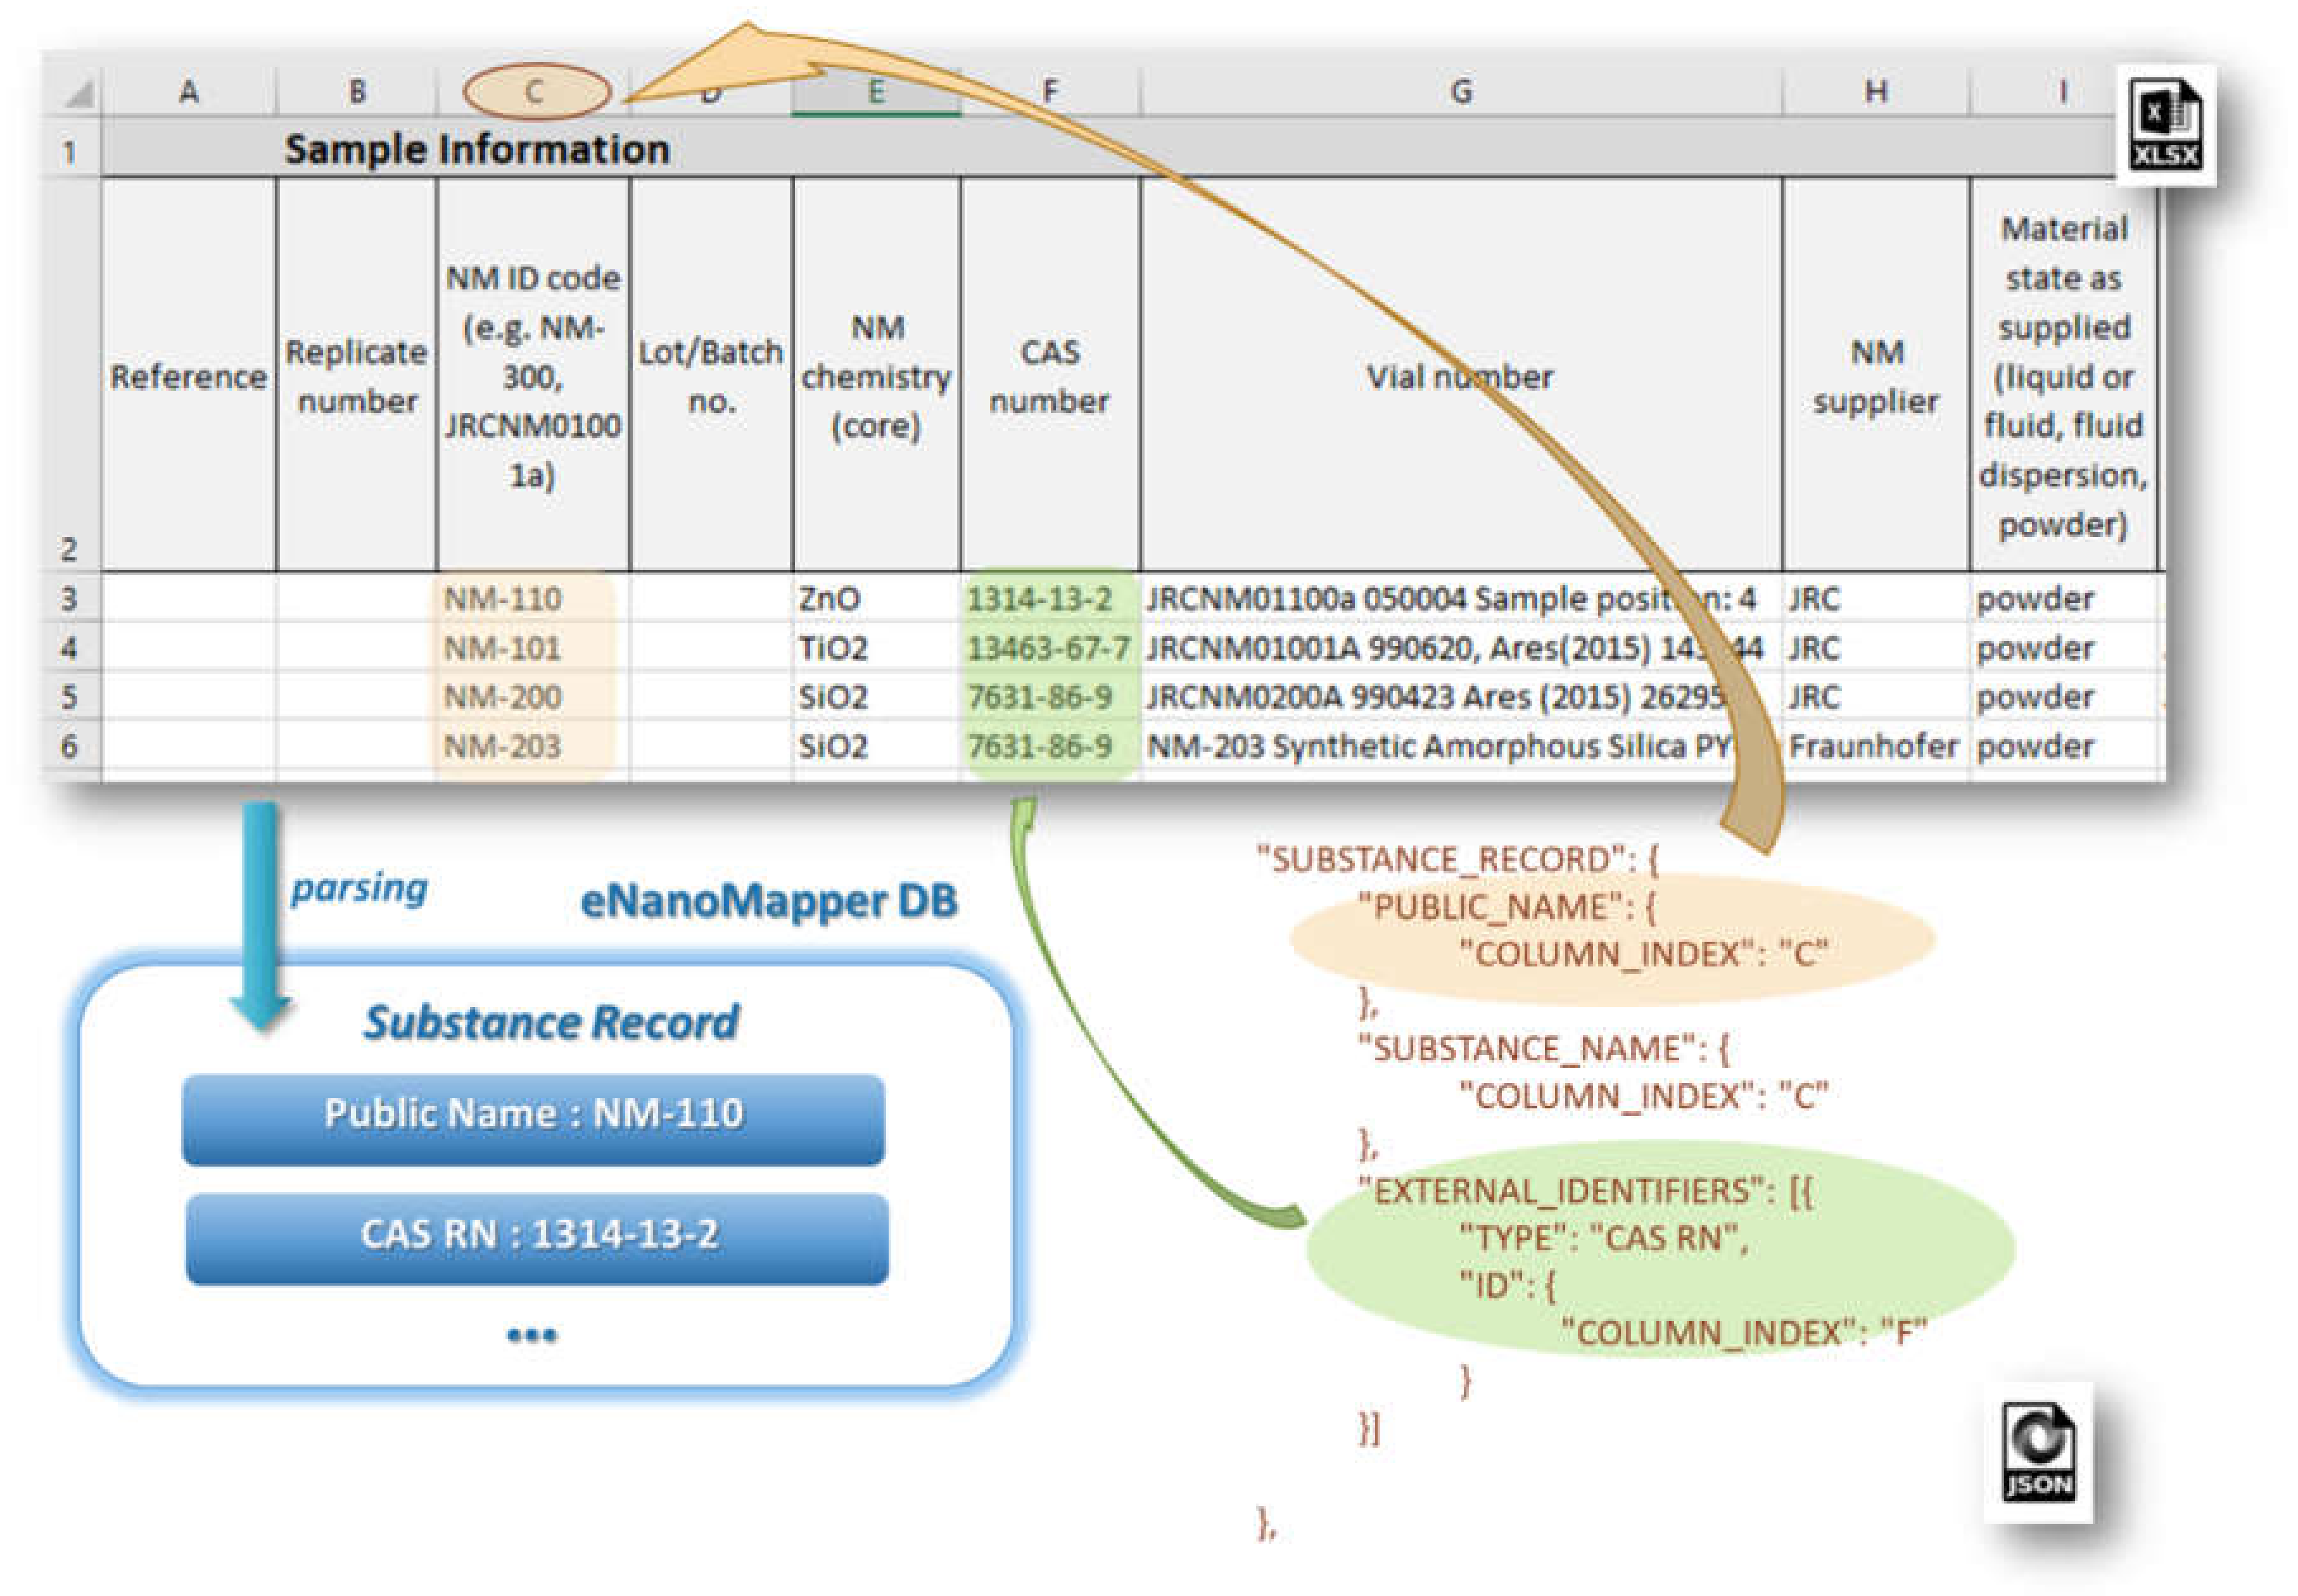
Figure 2). This section includes the attributes: SUBSTANCE_NAME, OWNER_NAME, SUBSTANCE_TYPE, OWNER_UUID, SUBSTANCE_UUID, PUBLIC_NAME, EXTERNAL_IDENTIFIERS, COMPOSITION.
Figure 7 illustrates the configuration for the reading of NM name and CAS number mapped as an external identifier into the eNanoMapper database.
The
PROTOCOL_APPLICATIONS section is an array of objects, defining all EDLs concerning Protocol Application data import. Each section includes attributes such as: CITATION_TITLE, CITATION_YEAR, CITATION_OWNER, INTERPRETATION_RESULT, INTERPRETATION_CRITERIA, PROTOCOL_GUIDELINE, PARAMETERS (an array of EDLs for the Protocol Application parameters—see an example from
Figure 8), EFFECTS (an array of sections with EDLs for measurement data and associated metadata), etc.
Each
EFFECTS section configures the mapping of spreadsheet data onto the Effect Record objects from the eNanoMapper data model, used for storing particular measurements, and includes EDL attributes such as: SAMPLE_ID, ENDPOINT, LO_VALUE, UP_VALUE, ERR_VALUE, TEXT_VALUE, VALUE, LO_QUALIFIER, UP_QUALIFIER, ERR_QUALIFIER, UNIT, CONDITIONS (an array of data locations for the experimental conditions). An example JSON configuration of experimental measurement of Zeta potential and corresponding metadata is given in
Figure 8. The eNanoMapper Effect Record is a flexible data structure, which allows quite diverse measurement data storage. Each measurement may be a single number or an interval with lower and upper values, together with specified qualifiers, e.g., x = 3, x < 3, 3 < x ≤ 4 or 3 < x < 4, x~3, x = 3 + −0.5 etc. Measurement errors can be stored also with a separate qualifier, thus different approaches for setting the measurement uncertainty are supported (e.g., SD for standard deviation).
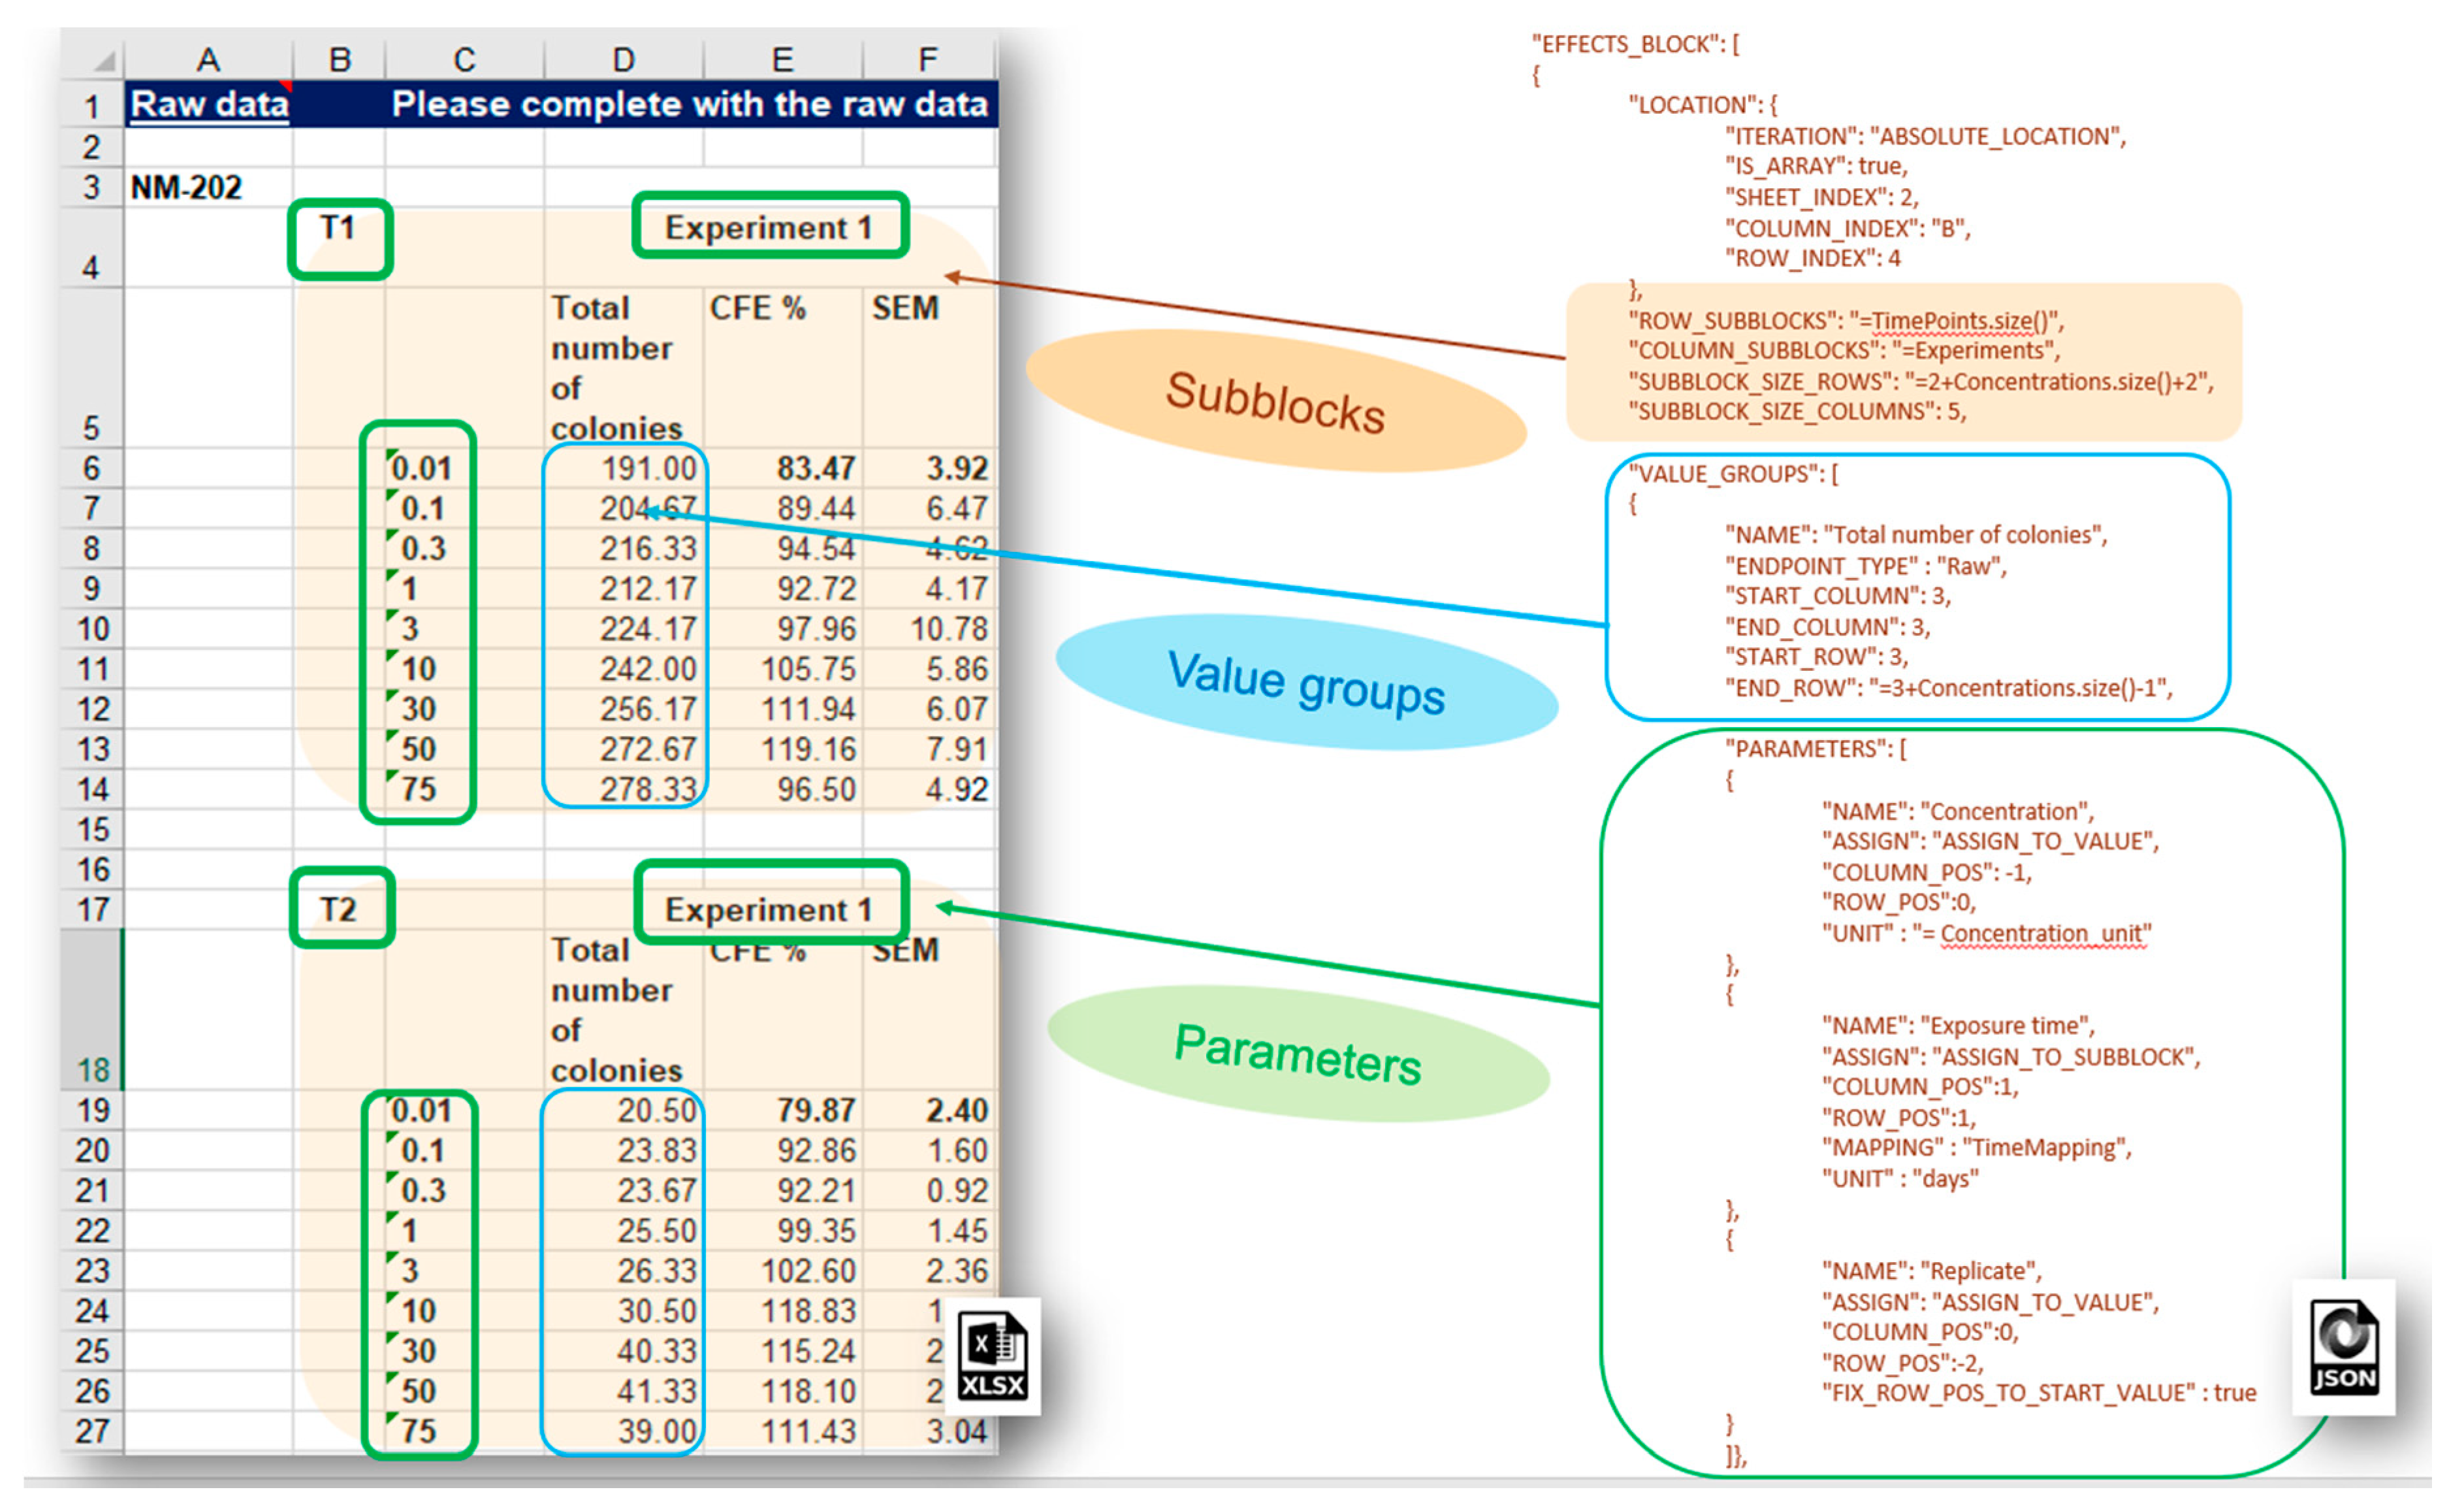
More complex data layouts of experimental measurements stored in spreadsheet files provided by the nanosafety community are often encountered. The typical bioassay experiment includes measurements with a variation of several experimental factors (the latter yields combinations of experimental conditions and multiple measurements), as in the dose response data recorded in the IOM–Nano–EHS Excel templates illustrated in
Figure 9. The CFE (Colony Forming Efficiency) assay is performed using 2 replicates, 2 different timings, and 9 concentrations of silicon dioxide (i.e., 2 × 2 × 9 = 36 measurements to be reported for the full experiment). With some effort, it is possible to handle this layout using the EFFECT section described above, but it would be very inefficient and prone to human errors. The NMDataParser functionality was extended to support blocks of effects to avoid enumerating each combination of experimental conditions’ values by hand. A new JSON section EFFECT_BLOCKS is introduced within PROTOCOL_APPLICATIONS objects. It is used to configure a simultaneous reading of many effects, grouped in blocks of measurements according to the variations of the experimental factors. In this way, one EFFECT_BLOCK can describe multiple values found on one sheet. This feature is crucial for the configuration of HTS (high-throughput screening) data import where it would be practically impossible to handle each single value by hand.
The NMDataParser tool supports several levels of block data aggregation, which allows very complex spreadsheet data organizations to be mapped onto the eNanoMapper data model. Each block can be divided into a rectangular grid of sub-blocks. Each sub-block can contain several value groups. Each value group is a set of measurements where each measurement is associated with a list of experimental conditions called in this context parameters of the value group (as distinct from the parameters of the Protocol Applications).


