Article

Evidence of Validity for the Artificial Intelligence Competence and Literacy Test (CAIA) in Spanish University Students


by
Xavier G. Ordóñez Camacho
1 and
Sonia J. Romero Martínez
2,*
1
Department of Research and Psychology in Education, Complutense University of Madrid, 28040 Madrid, Spain
2
Department of Methodology of the Behavioural Sciences, Universidad Nacional de Educación a Distancia (UNED), 28040 Madrid, Spain
*
Author to whom correspondence should be addressed.
Information 2026, 17(6), 555; https://doi.org/10.3390/info17060555
Submission received: 1 May 2026 / Revised: 31 May 2026 / Accepted: 2 June 2026 / Published: 4 June 2026
(This article belongs to the Section Artificial Intelligence)

Abstract

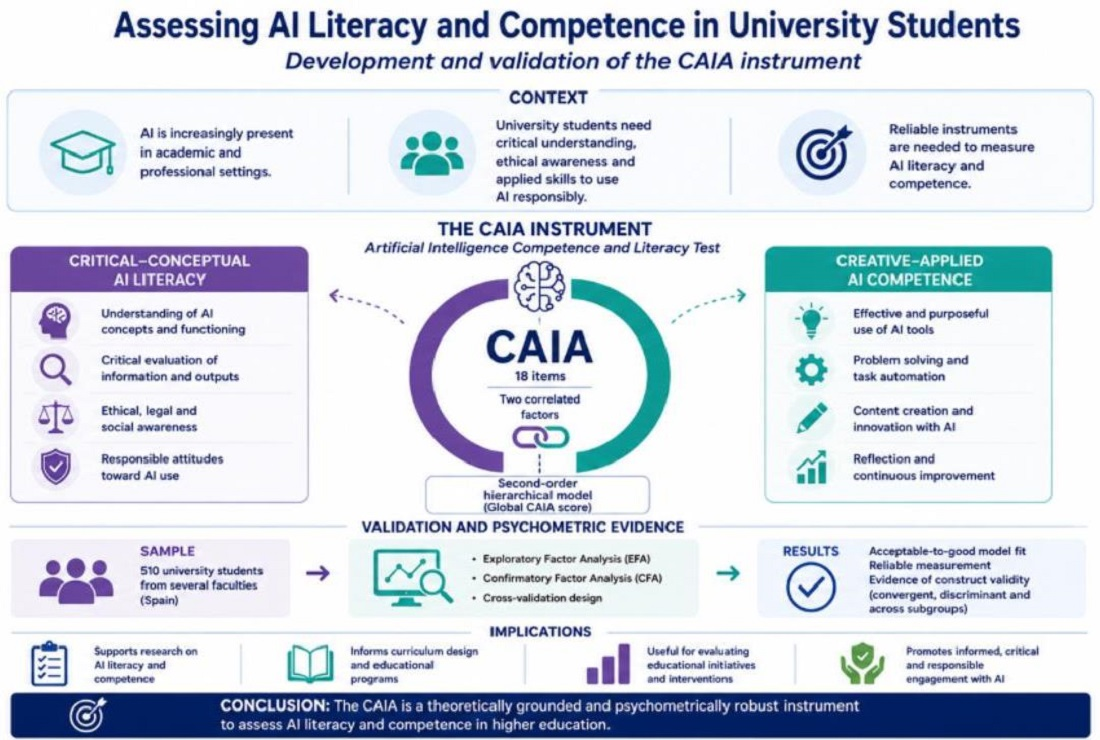
This study presents the development and psychometric validation of the Artificial Intelligence Competence and Literacy Test (CAIA), designed to assess artificial intelligence (AI) literacy and competence in higher education contexts. As AI becomes increasingly integrated into academic and professional environments, reliable instruments are needed to evaluate individuals’ conceptual understanding, ethical awareness, and applied competencies related to AI. The instrument was administered to a sample of 510 university students from several faculties at a Spanish university. Exploratory and confirmatory factor analyses were conducted using a cross-validation design. Results supported a multidimensional structure, in the final 18-item version of the instrument, composed of two correlated factors (critical—conceptual AI literacy and creative—applied AI competence) and a second-order hierarchical model representing a global CAIA score. Model fit indices were acceptable-to-good, and reliability estimates, including ordinal coefficients and measurement error indicators, showed adequate precision for both individual and group-level interpretation. Evidence of construct validity was further supported through convergent and discriminant analyses, as well as hypothesis testing across academic subgroups. The findings suggest that the CAIA provides a theoretically grounded and psychometrically robust instrument for assessing AI-related competencies in higher education. The instrument may support research, curriculum design, and evaluation of educational initiatives aimed at promoting informed, critical, and responsible engagement with artificial intelligence in digitally mediated learning environments.

Graphical Abstract

1. Introduction

Since the emergence of generative artificial intelligence tools such as ChatGPT, Generative Artificial Intelligences (GAIs) have become exponentially popular, rapidly being implemented across professional, educational, and social domains. This swift adoption has created a growing need for users not only to be familiar with these technologies but also to be adequately literate in their use or to possess advanced competencies that allow them to fully leverage their potential.
However, the speed of technological advancement has outpaced the theoretical and educational development surrounding AI. Consequently, the concepts of Artificial Intelligence Literacy (AIL) and Artificial Intelligence Competence (AIC) must be rigorously defined, characterized, differentiated, and measured. This distinction has not only epistemological implications but also practical ones, as it is essential for the design of measurement instruments, training programs, impact evaluation, and the identification of gaps in the responsible and ethical use of AI.
Despite recent efforts, significant conceptual confusion persists in the scientific literature. Various authors have proposed definitions of AIL [1,2], while others have focused on AIC, such as [3] or [4]. However, many of these works use the terms literacy and competence interchangeably, failing to acknowledge that they are theoretically related yet distinct constructs. This ambiguity has led to measurement instruments that combine indicators of both concepts, thereby compromising their structural validity and, consequently, their applicability.
The present study has two main objectives. First, to propose a clear, comprehensive, and differentiated conceptualization of AIL and AIC. Second, based on this theoretical clarity, to examine the psychometric properties of an instrument specifically designed to measure both constructs (competence and literacy in AI) among university students: the Artificial Intelligence Competence and Literacy Test (CAIA).
The theoretical framework presented below is organized into three main sections. First, a conceptual framework on literacy and competence is developed, addressing their definitions, similarities, and differences. Second, the relationship between AIL and AIC is examined, and, finally, an analysis is offered of the psychometric quality of several recently proposed instruments for measuring artificial intelligence literacy and/or competence.

Theoretical Framework

Conceptual foundations of literacy and competence. Literacy refers to individuals’ ability to access, interpret, evaluate, and communicate information in an ethical and contextually grounded manner [5,6]. Beyond technical skills, literacy also involves understanding conventions and meanings, applying basic strategies for information processing, and developing critical and responsible attitudes toward information practices [7,8,9,10]. Contemporary perspectives increasingly conceptualize literacy as a context-dependent and sociocultural construct rather than as a standardized set of isolated skills [7,8,9,10].
Literacy is commonly described as comprising three interrelated dimensions: cognitive (knowledge and understanding), procedural (basic strategies for searching and processing information), and dispositional (attitudes, values, and critical positioning) [5,6]. Consequently, literacy is typically inferred through declarative and interpretative evidence, such as comprehension tasks, critical analyses, rubrics, and self-report measures triangulated with actual performance [6].
Competence, in contrast, refers to the integrated ability to mobilize knowledge, skills, attitudes, and values to address tasks effectively and responsibly in specific contexts [11,12]. Unlike literacy, competence emphasizes situated action and observable performance, requiring individuals to apply knowledge under realistic conditions and make context-sensitive decisions [13,14,15]. Competence is therefore usually evidenced through simulations, portfolios, case resolution, and performance assessments [11,16].
Although literacy and competence differ in their degree of contextualization and the type of evidence required, they share important characteristics. Both involve the organization of knowledge into meaningful structures, self-regulatory processes, and progressive development through practice and experience [14,15,16]. Conceptually, literacy may be considered a foundation for more complex competencies, facilitating the transition from understanding and critical reflection toward increasingly autonomous and situated performance.
AI Literacy and AI competence. Artificial Intelligence Literacy (AIL) refers to the knowledge, understandings, and critical dispositions that enable individuals to describe what AI is, how it works at a basic level, where it is used, and what limitations, risks, and ethical implications it entails [1,17,18]. Operationally, AIL includes conceptual knowledge about data, models, machine learning, training and inference; basic procedural understanding of AI workflows; socio-technical and ethical awareness regarding bias, fairness, transparency, privacy, copyright, and responsible use; and dispositions of informed scepticism and public responsibility toward AI-generated content [1,17,18].
Recent frameworks organize AIL around understanding, evaluating, and using AI responsibly, without necessarily requiring evidence of situated performance or solution design [19,20,21]. Accordingly, AIL is usually assessed through declarative and interpretative evidence, such as items on AI concepts and risks, vignettes requiring critical judgment, analyses of AI-related information, and self-reports focused on beliefs, knowledge, and responsible use [19,20,22].
By contrast, Artificial Intelligence Competence (AIC) involves the integrated mobilization of knowledge, skills, judgment, and values to use, design, evaluate, and manage AI systems in real or simulated contexts according to criteria of effectiveness, safety, ethics, and transferability [23]. AIC therefore includes applied technical foundations, situated decision-making, socio-technical integration, and management or continuous improvement processes, such as selecting tools, preparing data, evaluating performance, balancing accuracy, cost, fairness, and traceability, documenting decisions, and monitoring impact [23].
Educational competence frameworks further emphasize human-centeredness, ethics, foundations and applications, pedagogy, and professional development as dimensions that guide learning outcomes and quality criteria for responsible AI use [5]. Unlike AIL, evidence of AIC requires authentic or simulated performance, such as case resolution, projects, simulations, functional indicators, or peer/user review assessed with rubrics that consider solution adequacy, risk management, documentation, and transparency [5].
In summary, AIL focuses primarily on knowing, understanding, and critically reflecting on AI, whereas AIC emphasizes knowing how to act with AI in situated contexts. This distinction requires differentiated measurement strategies: AIL is better captured through declarative and interpretative items assessing conceptual knowledge and critical judgment [18,19,20], whereas AIC requires situated items or tasks involving justified decisions, applied evaluation, creation, and responsible action under realistic constraints [5,23]. In terms of cognitive alignment, AIL is closer to remembering, understanding, and reflective evaluation, while AIC is more closely related to applying, analysing, evaluating in context, and creating, although the action verb alone does not determine the construct being assessed [16,24].
Existing AI Literacy and Competence Instruments. During the last decade, several instruments have been developed to assess AIL, whereas comparatively fewer tools have attempted to evaluate AIC, particularly through performance-oriented approaches. A recent systematic review summarized in Table 1 identified 16 AI-related scales and highlighted substantial variability in conceptual definitions, domains assessed, and psychometric evidence across instruments [25].
Despite recent progress, several limitations remain across existing instruments. First, some studies combine self-report and performance indicators, complicating construct interpretation and score use [25]. Second, AIL and AIC are operationalized heterogeneously, leading to inconsistencies in domains and taxonomies that hinder comparability across studies [19,21]. Third, psychometric evidence often relies on basic indicators of validity and reliability, whereas more advanced evidence regarding content validity, measurement invariance, external validity, measurement error, and responsiveness remains scarce [25,26,27,28,29]. In particular, Cronbach’s α continues to predominate, while ordinal reliability coefficients, test–retest evidence, and sensitivity-to-change analyses are rarely reported [25]. These limitations highlight the need for instruments that clearly distinguish AIL from AIC while providing stronger psychometric evidence and more comprehensive validation procedures. The CAIA was developed to address these gaps.
Accordingly, the present study aimed: (a) to gather evidence of structural validity for the CAIA test through exploratory and confirmatory factor analyses, (b) to examine the reliability of the instrument using comprehensive indicators of internal consistency and ordinal reliability, and (c) to determine whether score differences exist across population subgroups (sex, faculty, and year of study) through hypothesis testing.
In concordance with the previously defined objectives, the present research has the following hypothesis:
H1. 
The CAIA will show a multidimensional structure composed of two correlated latent factors representing AI literacy (AIL) and AI competence (AIC).
H2. 
A second-order hierarchical model representing a general CAIA factor underlying the AIL and AIC dimensions will provide an adequate representation of the construct and support the interpretation of a global score.
H3. 
The CAIA scores will show adequate reliability estimates, including internal consistency coefficients and ordinal reliability indices, supporting their use for research and educational assessment purposes.
H4. 
Differences in CAIA scores are expected across academic faculties, reflecting variability in exposure to AI-related knowledge and practices, whereas no substantial differences are expected according to sex or year of study.
Item generation was guided by the conceptual distinction between AI literacy (AIL) and AI competence (AIC) identified in recent theoretical and educational frameworks. Items were developed to represent two theoretically differentiated domains: critical—conceptual understanding of AI (AIL) and creative—applied use of AI (AIC). This distinction formed the basis for Hypothesis 1, which anticipated a multidimensional structure rather than a unidimensional solution.

2. Materials and Methods

Design. The present study follows an instrumental research design, aimed at the development and administration of a measurement instrument and the evaluation of its psychometric properties. Instrumental studies are analytical designs focused on the construction and assessment of measurement tools and typically rely on multivariate statistical techniques.
Participants. The sample consisted of 510 university students from the Complutense University of Madrid, enrolled in the following faculties: Physical Sciences (n = 75), Mathematical Sciences (n = 82), Chemical Sciences (n = 77), Information Sciences (n = 91), Computer Science (n = 63), Biological Sciences (n = 77) and Medicine (n = 45). Regarding sex, the sample included 272 men (53.3%) and 238 women (46.7%). With respect to the academic year: first year (n = 97), second year (n = 110), third year (n = 140), and fourth year (n = 163).
Instrument. The present study used the CAIA test, which consists of 78 Likert-type items with five response options: Always, Almost Always, Sometimes, Almost Never, and Never. The test includes 9 items for each dimension of Bloom’s taxonomy [30], revised by [24]: remember, understand, apply, analyse, evaluate, and create. It also includes 12 ethics items and 12 awareness items. The instrument was designed to be administered to a population of young people aged 15 to 25 years.
The levels of Bloom’s taxonomy are ordered by complexity; therefore, the lower levels assess literacy, whereas the higher levels relate to the measurement of competencies. Below, each level is defined and accompanied by an example item corresponding to that dimension:
-
Remember. At this level, students recall previously learned information without requiring deep understanding. It involves retrieving facts, terms, basic concepts, and answers. Example: I remember chatbots that appear in instant messaging applications.
-
Understand. This involves comprehending information and being able to explain, interpret, or summarize ideas and concepts. Example: I understand how recommendation systems use AI techniques to suggest personalized content.
-
Apply. At this level, students can apply acquired knowledge to new situations or contexts. Example: I apply AI-based facial recognition techniques to tag friends in photos on social media.
-
Analyse. This involves breaking down information into its components or parts to better understand its structure and relationships. Example: I analyse common errors made by AI-based machine translation systems and propose possible improvements to address them.
-
Evaluate. At this level, students can make judgments based on specific criteria and standards. Example: I evaluate the ability of a virtual assistant to understand and respond appropriately to complex and contextual requests.
-
Create. The highest level of the taxonomy, which involves creating new knowledge or synthesizing ideas to generate original solutions. Example: I develop an AI-based strategy game that can adapt to and learn from player behaviour.
Additionally, ethical and awareness competencies were included. The former comprises items related to the fair, responsible, transparent, and beneficial use of AI, whereas the latter assesses awareness of AI’s presence in daily life, its influence on personal actions and decisions, and AI’s consequences and limitations. An example item for the ethics dimension is: “I avoid using AI for fraudulent or deceptive purposes”; while an example item for the awareness is: “I reflect on the effects of AI on the creation and dissemination of fake news”.
The full process of item construction and writing, the theoretical foundations, and the evidence for content validity can be found in [31].
The test was administered in various university settings (cafeterias, classrooms, etc.) with the support of the researchers and collaborating faculty members. Data were collected anonymously and with the participants’ prior informed consent. The sample was then randomly divided into two halves of equivalent size: one for the Exploratory Factor Analysis (EFA; n = 255) and the other for the Confirmatory Factor Analysis (CFA; n = 255), following a cross-validation scheme recommended in the psychometric literature [32,33].

2.1. Data Analysis

The analysis was conducted in four complementary phases:
Phase 1. Exploratory Factor Analysis (EFA). Given the polytomous nature of the items, a polychoric correlation matrix was used as the basis for the EFA. This procedure is more appropriate for ordinal variables [34,35]. The suitability of the data matrix for factor analysis was assessed using Bartlett’s test of sphericity and the Kaiser–Meyer–Olkin (KMO) index, both global and item-level. A KMO value above 0.80 is considered adequate and supports the appropriateness of the analysis [36,37]. Factor extraction was carried out using the minimum residual method (MINRES; [38]), recommended for its computational efficiency and stability in the estimation of communalities, particularly when multivariate normality cannot be assumed, as is the case [39].
The number of retained factors was determined based on Horn’s parallel analysis and the theoretical interpretability of the model. The factor rotation employed was simplimax, an oblique rotation that allows correlations among factors, as the literacy and competence components are assumed to be interrelated [40,41].
This exploratory phase aimed to identify and retain items according to predefined psychometric and theoretical criteria, and establish a solid empirical basis for subsequent confirmatory analyses. The combination of statistical and theoretical criteria ensured that the retained dimensions were not only statistically coherent but also interpretatively meaningful in relation to the conceptualization of AIL and AIC.
Phase 2. Confirmatory Factor Analysis (CFA. Several CFA models were estimated to empirically test the two-factor structure identified in the exploratory phase and to evaluate possible theoretical alternatives: a unidimensional model, a two-correlated-factors model, a second-order model, and a bifactor model. This comparative approach directly supports the validity of the scores and informs their appropriate use, as it allows controlling for bias and delimiting interpretable scores [33,40]; and gathering convergent and discriminant validity evidence through the analysis of standardized loadings and their R2 values, as well as the Average Variance Extracted (AVE): an AVE above 0.50 indicates that the factor explains more true variance than error. Discriminant validity was also assessed using the Fornell–Larcker criterion, verifying that √AVE for each factor exceeded the interfactor correlations, and through latent-variable indices such as HTMT, which should remain below 0.85 [40,41].
The Akaike Information Criterion (AIC), Bayesian Information Criterion (BIC), and the sample-size adjusted BIC (SABIC) were calculated to evaluate the relative parsimony of the four models, with lower values indicating preferable models [42]. This indicator allows examining the parsimony of the models by comparing information criteria, favouring general structures, and avoiding capitalization on chance, thereby strengthening the interpretation of the scores [41].
Model estimation was performed using the Robust Maximum Likelihood (MLR) method, which adjusts significance tests and standard errors through the Huber–White corrections and the Yuan–Bentler scaled test (T2*). This estimator provides more stable and accurate results in the presence of skewness, kurtosis, or heteroscedasticity, as is the case [35,43]. MLR requires moderate sample sizes and permits the simultaneous modeling of covariances among factors, making it particularly suitable when items have five or more categories and distributions are not extremely skewed [44]. Moreover, even with the ordinal nature of Likert items, robust estimators are recommended when categories ≥ 5.
The quality of model fit was evaluated using a set of complementary global and incremental indices. Among the absolute fit indices, the Satorra–Bentler scaled χ2 statistic was considered. For approximate fit, the Root Mean Square Error of Approximation (RMSEA) was used, along with its 90% confidence interval and the probability of close fit (p_close); values below 0.06 indicate satisfactory fit [45]. The Standardized Root Mean Square Residual (SRMR) was also examined, with values below 0.08 recommended for acceptable fit [33].
Among the incremental fit indices, the Comparative Fit Index (CFI) and the Tucker–Lewis Index (TLI) were examined. Both indices compare the specified model with a null model that assumes no correlations among variables. Values of CFI and TLI above 0.95 are interpreted as evidence of excellent fit [40,45].
Phase 3. Reliability and Measurement Error. To assess reliability, the full sample of participants was used. Reliability was evaluated comprehensively through multiple coefficients capturing different aspects of internal consistency for each subscale and the total test score. Cronbach’s α, McDonald’s total ω, and the hierarchical ω_H coefficient were estimated, along with their ordinal versions (αord, ωord, ωH,ord), which are based on polychoric correlation matrices and are more appropriate for Likert-type items [46]. Ninety-five percent confidence intervals were computed using bootstrap resampling with 1500 replicates, providing a robust estimate of the precision of each coefficient [47].
Additionally, indicators related to score precision and measurement error were estimated to quantify the magnitude of measurement error and the instrument’s sensitivity to detecting real differences. First, the Standard Error of Measurement (SEM) was calculated using the expression SEM = SD × √(1 − ρ), where SD is the standard deviation of the scale and ρ is the reliability coefficient considered.
Second, the Minimum Detectable Change at 95% confidence (MDC95) was computed. At the individual level, this was obtained as MDC95,ind = SEM × 1.96 × √2. This indicator represents the amount of change required to consider a difference between two measurements or groups as real rather than attributable to measurement error [48]. For the group level, the error was adjusted by the effective sample size of each subgroup using the formula MDC95,group = MDC95/√n, allowing for the comparison of the relative stability of means between two independent groups [49].
This comprehensive approach combines classical and ordinal reliability estimation with measures of error and sensitivity, allowing for a more rigorous interpretation of the extent to which the CAIA can distinguish between AIL and AIC among individuals and groups in a precise and replicable manner.
Phase 4. Hypotheses Testing. These analyses were made using the full sample and aimed to examine potential differences in CAIA scores according to sex, faculty (seven groups), and academic year (four groups). Group comparisons were conducted using robust statistical methods to account for potential deviations from normality and heterogeneous variances. First, Yuen’s robust t-test, based on 20% trimmed means, was applied to compare mean scores between men and women for each subscale and for the total CAIA score. This approach provides a more stable alternative to the classical t-test, particularly in asymmetric distributions or in the presence of outliers [50]. Second, comparisons across faculties and academic years were conducted using a Welch-type robust ANOVA and Games–Howell post hoc tests. This procedure is appropriate when variances are unequal or when group sizes differ [51].

2.2. Software

All analyses were conducted in the R statistical environment, version 4.4.1 [52]. Data management and processing followed the recommendations of [53] for reproducible psychometric analyses in R, prioritizing transparency and traceability for each procedure. For the EFA, the packages psych (version 2.4.6) [54] and MBESS (version 4.9.3) [55] were used. The CFA was carried out using the lavaan package (version 0.6-18) [56]. For the reliability and measurement error analyses, the ltm [57], ufs, and psych packages were used to compute the α, ω, and ω_H coefficients and their ordinal versions, along with bootstrap confidence intervals. Custom routines were also developed to estimate SEM and tMDC95 at both the individual and group levels, following the formulas proposed by Stratford and Goldsmith [58].

3. Results

This section presents the empirical findings following the same analytical sequence described in the Materials and Methods section.

3.1. Exploratory Factor Analysis

The EFA was carried out in two successive stages: a first stage using the 78 original items, and a second stage using 34 items selected based on empirical and theoretical criteria. The aim was to compare the parsimony, interpretability, and overall fit of both solutions, thereby justifying the retention of the abbreviated version as the basis for the subsequent confirmatory factor analysis. The item reduction strategy followed both statistical and theoretical criteria. In the first stage, corresponding to the EFA of the 78 items, Bartlett’s test of sphericity was significant (χ2 = 8975, df = 3003, p < 0.001), and the KMO index reached a high value (KMO = 0.865), indicating excellent sampling adequacy and supporting the suitability of factorization. The extraction yielded a five-factor solution with a relatively low cumulative variance (33.9%). The interfactor correlations were practically zero, suggesting independence between dimensions.
This pattern is theoretically implausible, as the components of AIL and AIC would be expected to organize along a cognitive continuum, rather than as entirely independent domains. Furthermore, the factor loadings showed notable dispersion, with several modest loadings and high uniqueness values for a considerable number of items, indicating a heterogeneous structure and the presence of measurement noise derived from the initial length and diversity of the instrument.
The global fit indices for this 78-item solution were moderate (see Table 2). Although the RMSEA value appears low, the TLI, falling below the 0.90 threshold, suggests that the five-factor model does not adequately reproduce the covariance structure among the items. Taken together, this first solution is characterized by weak factorial coherence and limited parsimony, which supports the need for item reduction and selection procedures.
In the second stage, corresponding to an EFA with the 34 items that showed the highest factor loadings, the same sample and estimation criteria were retained. Bartlett’s test remained significant (χ2 = 2938, df = 561, p < 0.001), while the global KMO reached a high value (0.874), again confirming the suitability of the data for factor analysis.
The emerging factorial structure was two-dimensional and interpretable, with substantive and differentiated loadings on both factors. Factor 1 comprised items associated with the Create and Apply dimensions, along with an Ethical–operational component linked to practical AI competence; Factor 2 grouped items related to Awareness, Understand, Remember, and Evaluate, representing the domain of literacy and critical understanding.
The interfactor correlation was low (r = 0.184), indicating that the two factors are related yet clearly distinguishable, consistent with the theoretical distinction between competence and literacy in AI. The cumulative variance reached 31.8%, a value expected in psychological instruments, but with a cleaner and more parsimonious structure than in the initial version.
Regarding the global fit indices (Table 2), the 34-item solution showed a substantial improvement: although the TLI remains slightly below the optimal criterion (0.90), the improvement compared to the previous analysis is clear, and the overall set of indicators supports the adequacy of the two-correlated-factors structure. Moreover, the conceptual coherence between the item groupings and the underlying theoretical framework of the CAIA reinforces the instrument’s internal validity.
In summary, from both a psychometric and substantive standpoint, the 34-item version outperforms the 78-item version. First, it presents a cleaner simple structure, with higher and more consistent factor loadings within each factor and reduced cross-loading. Second, the interfactor correlation, although low, is theoretically coherent, with the model distinguishing between AI literacy and AI competence, as well as with the notion of a cognitive continuum grounded in Bloom’s taxonomy. Third, it offers a markedly improved global fit (TLI 0.863 versus 0.808) and maintains excellent sampling adequacy (high KMO and significant sphericity). Finally, it provides a more parsimonious and theoretically solid basis for subsequent confirmatory validation.

3.2. Confirmatory Factor Analysis

Four confirmatory specifications were estimated: (a) a unidimensional model, (b) a two-correlated-factors model, (c) a second-order hierarchical model in which CAIA explains both first-order factors, and (d) a bifactor model (a general factor plus two orthogonal specific factors). All estimations were conducted using robust maximum likelihood, Huber–White robust standard errors, and Yuan–Bentler scaled corrections, given evidence of multivariate non-normality (Mardia: skewness χ2(1140) = 1619, kurtosis z = 8.37, p < 0.001).
Table 3 summarizes fit indices and information criteria for all tested CFA models. The unidimensional solution showed clearly inadequate fit. In contrast, the correlated two-factor, second-order, and bifactor models demonstrated excellent global fit. Although the bifactor model showed the best statistical fit, several substantive and interpretative problems limited its usefulness. Considering both fit and theoretical interpretability, the correlated and second-order solutions provided the most adequate representation of the CAIA structure.
Factor loadings and validity metrics for the selected model (second-order model, n = 255) are presented in Table 4. The two-correlated-factors model shows good item-level convergent validity, with moderate–high loadings and acceptable R2 values, although AVE does not reach the 0.50 threshold. In the second-order model, the general factor explains the applied performance factor more strongly than the literacy factor, indicating moderate convergent validity for the global score. Both models provide solid evidence of discriminant validity. In the two-factor model, the interfactor correlation is low, HTMT is well below the cut-off, and the shared variance is lower than each factor’s AVE. The second-order model shows a similar pattern, with literacy retaining specific variance not captured by the general factor. Overall, the two domains are related but clearly distinct.

3.3. Item Reduction Procedure

Item reduction followed both statistical and theoretical criteria. In the first stage (78 to 34 items), items showing low factor loadings, substantial cross-loadings, high uniqueness values, and conceptual redundancy were removed. Subsequently, the reduction from 34 to the final 18 items was guided by CFA modification indices, item redundancy analyses, and theoretical considerations aimed at preserving balanced representation of AIL and AIC domains while improving model parsimony and interpretability (Table 5).
Item response distributions were additionally examined to identify potential ceiling effects. Ceiling response frequencies were generally low, with most items remaining below 20%. Only a small number of items approached values around 25%, suggesting limited concentration in the highest response category.

3.4. Final Composition of CAIA

Factor 1. Creative—Applied Competence in Artificial Intelligence (AIC, 10 items). Refers to an integrated ability to mobilize knowledge, skills, and attitudes in real or simulated contexts to design, implement, adapt, and evaluate AI-based solutions responsibly. It is a procedural, strategic, and situated competence, involving informed decision-making, uncertainty management, transfer to new domains, and the incorporation of ethical and social-impact criteria [6,14,16,59]. From an educational perspective, AIC builds on AI literacy and extends it through higher-order cognitive performance like apply, analyse, and create [24]. It includes designing workflows with models, preparing and refining data, evaluating and improving performance, integrating AI services, and ensuring safety and fairness. AIC is shown when individuals design or adapt models and prompts, integrate AI systems into applications, automate processes, assess and mitigate risks, communicate technical and ethical decisions, and transfer solutions across domains with effectiveness and responsibility [1].
Factor 2. Critical—Conceptual Literacy in Artificial Intelligence (AIL, 8 items). Refers to declarative knowledge, conceptual understanding, and attitudinal dispositions that enable individuals to understand what AI is, how it works, and where it is applied, as well as to recognize its limits, risks, and socio-ethical implications. It emphasizes informed understanding and critical judgment, supporting the ability to interpret claims, identify biases, and establish responsible-use criteria [1,22,26].
Aligned with the cognitive levels of remembering, understanding, and critical evaluation [24], AIL includes knowledge of key concepts (e.g., recommendation algorithms, voice recognition, classification systems) and awareness of ethical considerations such as privacy, fairness, and social impact. It is demonstrated when individuals recognize and describe AI systems in everyday contexts and critically analyse their implications and risks, without requiring technical or situated action.
General factor. The global construct Competence and Literacy in Artificial Intelligence (CAIA) integrates two related yet distinct domains (AIC and AIL). Although often used interchangeably, these domains correspond to different forms of knowledge and performance and to different levels of cognitive and situational demand [1,17,22]. International policy frameworks similarly describe literacies and competences as complementary, progressive goals rather than equivalent ones [6,60]. CAIA reflects a comprehensive readiness to understand, think critically, apply, create, and act responsibly with AI, combining declarative knowledge and ethical dispositions with procedural and situated capabilities.

3.5. Reliability

Internal reliability was evaluated for the two subscales and for the composite CAIA score in the total sample (N = 510). For AIC, internal consistency was high (see Table 6). Inspection of the “alpha if item deleted” index did not indicate any substantive gains from item removal, suggesting that all 10 indicators contribute relatively homogeneously to the subscale. For AIL, internal consistency was adequate (Table 6). Although acceptable, the magnitude was lower than that observed for AIC, consistent with somewhat smaller loadings and greater item-specific variance. Deleting any indicator would minimally affect Cronbach’s α, providing no justification for item removal. For the global CAIA test score, reliability was good. Although overall consistency was sufficient, the proportion of variance attributable to a common general factor was lower than for the AIC factor. In summary, all scores show high and stable reliability across all estimators (including ordinal versions), suitable for group-level decisions and applied research. The total score reaches adequate levels of internal consistency; however, its ωH indicates that the common general variance is moderate, supporting the combined use of a global score and subscales, in line with the second-order hierarchical model [61,62].

3.6. Standard Errors of Measurement (SEM) and Minimum Detectable Change (MDC)

For AIC, SEM values ranged from 2.73 to 3.08, implying that individual changes below 7.6–8.5 points fall within measurement error. At the group level by sex, the MDC was very small, indicating high sensitivity for detecting mean differences. For AIL, SEM values ranged from 2.77 to 2.95, with individual MDC95 estimates of about 7.7–8.2 points. At the sex-group level, the MDC was around 0.48–0.51 points. This pattern reflects moderate/adequate reliability and lower score dispersion than in AIC (Table 7). For the total score, SEM values ranged from 4.2 to 4.7 depending on the coefficient used, yielding individual MDC95 thresholds between 10.6 and 13.1 points. Ordinal estimates slightly improved precision, while hierarchical omega increased uncertainty due to the larger proportion of specific variance. At the sex-group level, MDC values were low (0.66–0.82), indicating good sensitivity to detect small mean differences between groups. In practical terms, individual changes smaller than 7.5–8.5 points in the subscales or 10.5–13 points in the total score may reflect measurement error, whereas sex-group differences above roughly 0.5–0.8 points can be interpreted as real.

3.7. Hypotheses Testing

Robust analyses showed no sex differences across AIL, AIC, or CAIA, with trivial effect sizes (Table 8). Faculty differences emerged for AIC and CAIA, although only one post hoc comparison reached statistical significance (Table 9). No differences across academic year were observed, suggesting relative stability across training stages.

4. Discussion

The psychometric findings for the CAIA provide encouraging evidence of a clear and parsimonious latent structure: two correlated factors and a second-order hierarchical model with acceptable-to-good fit and theoretically interpretable multidimensional solutions. Overall, these findings suggest that the CAIA may extend aspects of the psychometric evidence commonly reported in recent AI literacy and competence instruments, which frequently emphasize internal consistency and confirmatory analyses but provide more limited information regarding ordinal-data estimation procedures, measurement invariance, and responsiveness analyses [25]. Literacy-focused instruments such as AILQ, SNAIL, the Meta AI Literacy Scale, and the Arabic version of AILS have reported good model fit and reliability; however, multi-group invariance testing, broader reliability indicators, and measurement-error or responsiveness indices remain less frequently examined. Moreover, many of these instruments focus primarily on declarative literacy rather than competence [25,27,59,63]. By contrast, the CAIA was designed to distinguish between critical—conceptual AI literacy (AIL) and creative—applied AI competence (AIC) while also modelling a global trait aligned with recent higher education frameworks requiring differentiated operationalisations [63,64].
From a construct validity perspective, confirmatory analyses supported the superiority of multidimensional models relative to the unidimensional alternative, with relatively homogeneous factor loadings, substantial R2 values, and a moderate interfactor correlation suggesting differentiation between AIL and AIC. This pattern differs from previous studies in which the combination of declarative and performance indicators may complicate construct separation and structural interpretation [25]. Furthermore, the hierarchical modelling approach adopted for the CAIA may represent a useful alternative for integrating literacy and competence dimensions within a broader latent structure, although further replication is warranted [25,59].
Regarding convergent and discriminant validity, factor loadings and R2 values provided initial support for convergent validity at the indicator level. However, AVE values did not reach conventional thresholds for AIL and remained moderate for AIC, suggesting that additional refinement of literacy indicators may improve shared variance. Nevertheless, discriminant validity was supported by low HTMT values, indicating adequate differentiation between AIL and AIC. Although these indices remain infrequently reported in previous validation studies using latent-variable approaches [25,27,59], taken together, these findings provide preliminary support for the proposed structural solution while also indicating areas for future refinement.
Reliability evidence extended beyond Cronbach’s α to include total ω, hierarchical ωH, and ordinal reliability estimates, accompanied by bootstrap confidence intervals and precision indicators intended to facilitate applied interpretation at both individual and group levels. This approach may broaden the type of psychometric information available relative to many previous instruments, which have often focused primarily on internal consistency estimates [25]. In addition, hypothesis-testing results showed no statistically significant differences according to gender or year of study, whereas differences across faculties emerged. These findings provide preliminary validity evidence that may be consistent with theoretical expectations regarding the contextual sensitivity of competence-related dimensions [27,63].
The present study contributes an instrumental design incorporating EFA and CFA with ordinal estimation procedures, explicit comparison of structural specifications, multiple reliability indices, and measurement precision indicators. In addition, the study attempts to clarify the conceptual and operational distinction between AI literacy and AI competence, an issue repeatedly identified as problematic in the recent literature [25,63,64]. The resulting instrument is brief and structurally interpretable and provides coherent global and subscale scores with quantitative interpretation guidelines that may support research and group-level applications in higher education contexts.
An additional contribution of the present study involves the evaluation of score precision beyond conventional internal consistency estimates frequently reported in AI literacy instruments. In addition to Cronbach’s α, the CAIA validation incorporated ordinal reliability coefficients and hierarchical omega (ωH), which may provide complementary information regarding the proportion of variance attributable to the general factor and may assist interpretation of global and subscale scores. Furthermore, measurement precision was examined through estimation of the Standard Error of Measurement (SEM) and the Minimum Detectable Change at the 95% confidence level (MDC95), providing interpretable thresholds that may help distinguish score differences from measurement error at individual and group levels. These indicators remain relatively uncommon in current AI literacy assessment studies, which frequently rely primarily on internal consistency estimates without incorporating broader indicators of measurement precision.
In addition, the comparison among correlated-factor, second-order, and bifactor specifications provided a detailed examination of the latent structure of the instrument. Although the bifactor model showed excellent global fit, the absence of a clearly defined general factor favored the interpretability and practical utility of the second-order hierarchical solution. Together with the low HTMT ratio observed between literacy and competence dimensions, these findings suggest structural differentiation between both domains while supporting the interpretation of an integrated higher-order construct. This modelling strategy may contribute to improving construct representation and score interpretability in the assessment of AI-related competencies in higher education contexts.
Despite these strengths, several limitations remain. AVE-based convergence for the literacy dimension should be improved through item revision and increased semantic homogeneity. Although the hierarchical CAIA model was stable, the general factor showed weaker loadings on AIL, suggesting the need to expand and refine the literacy item pool.
Exploratory measurement invariance analyses across sex and academic year were conducted; however, configural models showed inadequate fit and inadmissible latent covariance solutions in several subgroups, including interfactor correlations approaching or exceeding 1.0. Consequently, measurement invariance could not be established and subgroup comparisons should be interpreted cautiously. Multicentre replications and longitudinal or intervention studies are therefore needed to examine responsiveness and temporal stability (test–retest). As a Likert-type self-report instrument, the CAIA should be complemented with performance-based tasks and product-based assessments aligned with frameworks that emphasize behavioural evidence of competence [27,63,64]. In addition, some self-report items may be susceptible to socially desirable responding. Future studies should examine this possibility by incorporating specific response-bias measures.
In summary, the CAIA provides encouraging initial evidence regarding structural validity and reliability and may address several limitations identified in previous instruments through the explicit distinction between literacy and competence dimensions, the use of ordinal-data estimation procedures, and the incorporation of measurement precision indicators. Although additional evidence is needed regarding invariance, predictive validity, responsiveness, and broader generalizability, the instrument may provide a useful basis for research and educational assessment in higher education contexts. Taken together, these findings suggest that CAIA represents a promising instrument for future research examining AI literacy and AI competence while incorporating hierarchical score interpretation supported by ordinal reliability and measurement precision indicators.

Author Contributions

Conceptualization, X.G.O.C. and S.J.R.M.; methodology, X.G.O.C. and S.J.R.M.; software, X.G.O.C.; validation, X.G.O.C. and S.J.R.M.; formal analysis, X.G.O.C.; investigation, X.G.O.C. and S.J.R.M.; resources, S.J.R.M.; data curation, X.G.O.C.; writing, original draft preparation, X.G.O.C. and S.J.R.M.; writing, review, and editing, X.G.O.C. and S.J.R.M.; visualization, X.G.O.C.; supervision, S.J.R.M. All authors have read and agreed to the published version of the manuscript.

Funding

This research received no external funding.

Institutional Review Board Statement

The study was conducted in accordance with the Declaration of Helsinki. Ethical review and approval were waived for this study due to the anonymous and voluntary nature of participation and the absence of sensitive personal data collection.

Informed Consent Statement

Informed consent was obtained from all subjects involved in the study.

Data Availability Statement

The dataset supporting the conclusions of this article has been deposited in the Open Science Framework (OSF) repository. During the peer-review process, the data are available to reviewers through a view-only link: https://osf.io/afs87/overview?view_only=359be57bc89c44b79fbf3b930fa326e3 (accessed on 1 June 2026). The dataset will be made publicly available upon publication.

Conflicts of Interest

The authors declare no conflicts of interest.

References

  1. Long, D.; Magerko, B. What is AI literacy? Competencies and design considerations. In Proceedings of the 2020 CHI Conference on Human Factors in Computing Systems, Honolulu, HI, USA, 25–30 April 2020; pp. 1–16. [Google Scholar] [CrossRef]
  2. Touretzky, D.S.; Gardner-McCune, C.; Martin, F.G.; Seehorn, D. Envisioning AI for K-12: What should every child know about AI? In Proceedings of the AAAI Conference on Artificial Intelligence, Honolulu, HI, USA, 27 January–1 February 2019; Volume 33, pp. 9795–9799. [Google Scholar] [CrossRef]
  3. Zawacki-Richter, O.; Marín, V.I.; Bond, M.; Gouverneur, F. Systematic review of research on artificial intelligence applications in higher education—Where are the educators? Int. J. Educ. Technol. High. Educ. 2019, 16, 39. [Google Scholar] [CrossRef]
  4. Luckin, R.; Holmes, W.; Griffiths, M.; Forcier, L.B. Intelligence Unleashed: An Argument for AI in Education; UCL Knowledge Lab: London, UK, 2016. [Google Scholar]
  5. UNESCO. Literacy and Digital Literacy Frameworks; UNESCO: Paris, France, 2024. [Google Scholar]
  6. UNESCO Institute for Statistics. A Global Framework of Reference on Digital Literacy Skills for Indicator 4.4.2; UNESCO: Paris, France, 2017. [Google Scholar]
  7. Gee, J.P. Social Linguistics and Literacies: Ideology in Discourses, 2nd ed.; Routledge: London, UK, 1996. [Google Scholar]
  8. Lankshear, C.; Knobel, M. New Literacies: Everyday Practices and Social Learning, 3rd ed.; McGraw-Hill/Open University Press: Maidenhead, UK, 2011. [Google Scholar]
  9. Street, B.V. Literacy in Theory and Practice; Cambridge University Press: Cambridge, UK, 1984. [Google Scholar]
  10. Street, B.V. What’s “new” in new literacy studies? Crit approaches to literacy in theory and practice. Curr. Issues Comp. Educ. 2003, 5, 77–91. [Google Scholar]
  11. Eraut, M. Developing Professional Knowledge and Competence; RoutledgeFalmer: London, UK, 2004. [Google Scholar]
  12. Hager, P.; Gonczi, A. What is Competence? Australian National Training Authority: Brisbane, Australia, 1996.
  13. OECD. Definition and Selection of Competencies (DeSeCo): Theoretical and Conceptual Foundations; OECD: Paris, France, 2005. [Google Scholar]
  14. OECD. The Future of Education and Skills: Education 2030; OECD Publishing: Paris, France, 2018. [Google Scholar]
  15. Rychen, D.S.; Salganik, L.H. Key Competencies for a Successful Life and a Well-Functioning Society; Hogrefe & Huber: Göttingen, Germany, 2003. [Google Scholar]
  16. Pellegrino, J.W.; Chudowsky, N.; Glaser, R. Knowing What Students Know: The Science and Design of Educational Assessment; National Academies Press: Washington, DC, USA, 2001. [Google Scholar]
  17. Ng, W. Can we teach digital natives digital literacy? Comput. Educ. 2012, 59, 1065–1078. [Google Scholar] [CrossRef]
  18. Chiu, T.K.F. AI literacy and competency: Definitions, frameworks, development and future research directions. Interact. Learn. Environ. 2025, 33, 3225–3229. [Google Scholar] [CrossRef]
  19. Kassorla, M.; Georgieva, M.; Papini, A. Defining AI literacy for higher education. Educ. Rev. 2024, 59, 44–59. [Google Scholar]
  20. Lee, I.; Ali, S.; Zhang, H.; DiPaola, D.; Breazeal, C. Developing Middle School Students’ AI Literacy. In Proceedings of the 52nd ACM Technical Symposium on Computer Science Education; Association for Computing Machinery: New York, NY, USA, 2021. [Google Scholar] [CrossRef]
  21. Mills, K.; Ruiz, P.; Lee, K.; Coenraad, M.; Fusco, J.; Roschelle, J.; Weisgrau, J. AI Literacy: A Framework to Understand, Evaluate, and Use Emerging Technology; Digital Promise: Washington, DC, USA, 2024. [Google Scholar] [CrossRef]
  22. Chiu, T.K.F.; Xia, Q.; Zhou, X.; Chai, C.S.; Cheng, M. Systematic literature review on opportunities, challenges, and future research recommendations of artificial intelligence in education. Comput. Educ. Artif. Intell. 2023, 4, 100118. [Google Scholar] [CrossRef]
  23. Mikeladze, T.; Meijer, P.C.; Verhoeff, R.P. A comprehensive exploration of artificial intelligence competence frameworks for educators: A critical review. Eur. J. Educ. 2024, 59, e12663. [Google Scholar] [CrossRef]
  24. Anderson, L.W.; Krathwohl, D.R. A Taxonomy for Learning, Teaching, and Assessing: A Revision of Bloom’s Taxonomy of Educational Objectives; Longman: London, UK, 2001. [Google Scholar]
  25. Lintner, T. A systematic review of AI literacy scales. npj Sci. Learn. 2024, 9, 50. [Google Scholar] [CrossRef]
  26. Ng, D.T.K.; Leung, J.K.L.; Chiu, T.K.F.; Chu, S.K.W. Design and validation of the AI literacy questionnaire. Br. J. Educ. Technol. 2024, 55, 1082–1104. [Google Scholar] [CrossRef]
  27. Laupichler, M.C.; Aster, A.; Haverkamp, N.; Raupach, T. Development of the scale for the assessment of non-experts’ AI literacy (SNAIL): An exploratory factor analysis. Comput. Hum. Behav. Rep. 2023, 12, 100338. [Google Scholar] [CrossRef]
  28. Koch, M.J.; Carolus, A.; Wienrich, C.; Latoschik, M. Meta AI literacy scale: Further validation and development. Heliyon 2024, 10, e39686. [Google Scholar] [CrossRef]
  29. Hobeika, E.; Hallit, R.; Malaeb, D.; Sakr, F.; Dabbous, M.; Merdad, N.; Rashid, T.; Amin, R.; Jebreen, K.; Zarrouq, B.; et al. Multinational validation of the Arabic version of the Artificial Intelligence Literacy Scale (AILS) in university students. Cogent Psychol. 2024, 11, 2395637. [Google Scholar] [CrossRef]
  30. Bloom, B.S. Taxonomy of Educational Objectives. Longmans, Green. 1956. Available online: https://ia600508.us.archive.org/24/items/bloometaltaxonomyofeducationalobjectives/Bloom%20et%20al%20-Taxonomy%20of%20Educational%20Objectives.pdf (accessed on 12 February 2026).
  31. Ordóñez, X.G.; Romero, S.J. Percepciones de los Futuros Maestros y Pedagogos Sobre el uso Ético del CHATGPT y sus Límites en la Formación Universitaria; Complutense University of Madrid: Madrid, Spain, 2025; Available online: https://hdl.handle.net/20.500.14352/132022 (accessed on 2 February 2026).
  32. Floyd, F.J.; Widaman, K.F. Factor analysis in the development and refinement of clinical assessment instruments. Psychol. Assess. 1995, 7, 286–299. [Google Scholar] [CrossRef]
  33. Kline, R.B. Principles and Practice of Structural Equation Modeling, 4th ed.; Guilford Press: New York, NY, USA, 2016. [Google Scholar]
  34. Gadermann, A.M.; Guhn, M.; Zumbo, B.D. Estimating ordinal reliability for Likert-type and ordinal item response data: A conceptual, empirical, and practical guide. Pract. Assess. Res. Eval. 2012, 17, n3. [Google Scholar] [CrossRef]
  35. Rhemtulla, M.; Brosseau-Liard, P.E.; Savalei, V. When can we treat Likert-type scales as interval scales? Psychol. Methods 2012, 17, 354–373. [Google Scholar] [CrossRef]
  36. Kaiser, H.F. An index of factorial simplicity. Psychometrika 1974, 39, 31–36. [Google Scholar] [CrossRef]
  37. Lloret-Segura, S.; Ferreres-Traver, A.; Hernández-Baeza, A.; Tomás-Marco, I. Exploratory item factor analysis: A practical guide revised and updated. An. Psicol. 2014, 30, 1151–1169. [Google Scholar] [CrossRef]
  38. Harman, H.H.; Jones, W.H. Factor analysis by minimizing residuals (MINRES). Psychometrika 1966, 31, 351–368. [Google Scholar] [CrossRef]
  39. Beavers, A.S.; Lounsbury, J.W.; Richards, J.K.; Huck, S.W.; Skolits, G.J.; Esquivel, S.L. Practical considerations for using exploratory factor analysis in educational research. Pract. Assess. Res. Eval. 2013, 18, n6. [Google Scholar] [CrossRef]
  40. Brown, T.A. Confirmatory Factor Analysis for Applied Research, 2nd ed.; Guilford Press: New York, NY, USA, 2015. [Google Scholar]
  41. Fabrigar, L.R.; Wegener, D.T.; MacCallum, R.C.; Strahan, E.J. Evaluating the use of exploratory factor analysis in psychological research. Psychol. Methods 1999, 4, 272–299. [Google Scholar] [CrossRef]
  42. Schumacker, R.E.; Lomax, R.G. A Beginner’s Guide to Structural Equation Modeling, 4th ed.; Routledge: London, UK, 2015. [Google Scholar]
  43. Yuan, K.H.; Bentler, P.M. Three likelihood-based methods for mean and covariance structure analysis with nonnormal missing data. Sociol. Methodol. 2000, 30, 165–200. [Google Scholar] [CrossRef]
  44. Li, C. Confirmatory factor analysis with ordinal data: Comparing robust maximum likelihood and diagonally weighted least squares. Behav. Res. Methods 2016, 48, 936–949. [Google Scholar] [CrossRef] [PubMed]
  45. Hu, L.; Bentler, P.M. Cutoff criteria for fit indexes in covariance structure analysis: Conventional criteria versus new alternatives. Struct. Equ. Model. 1999, 6, 1–55. [Google Scholar] [CrossRef]
  46. Elosua, P.; Zumbo, B.D. Reliability coefficients for ordinal response scales. Psicothema 2008, 20, 896–901. [Google Scholar]
  47. Efron, B.; Tibshirani, R.J. An Introduction to the Bootstrap; Chapman & Hall/CRC: Boca Raton, FL, USA, 1993. [Google Scholar]
  48. de Vet, H.C.W.; Terwee, C.B.; Mokkink, L.B.; Knol, D.L. Measurement in Medicine: A Practical Guide; Cambridge University Press: Cambridge, UK, 2011. [Google Scholar]
  49. Atkinson, G.; Nevill, A.M. Statistical methods for assessing measurement error in variables relevant to sports medicine. Sports Med. 1998, 26, 217–238. [Google Scholar] [CrossRef]
  50. Erceg-Hurn, D.M.; Mirosevich, V.M. Modern robust statistical methods: An easy way to maximize the accuracy and power of your research. Am. Psychol. 2008, 63, 591–601. [Google Scholar] [CrossRef]
  51. Keselman, H.J.; Wilcox, R.R.; Lix, L.M. A generally robust approach to hypothesis testing in independent and correlated groups designs. Psychophysiology 2003, 40, 586–596. [Google Scholar] [CrossRef]
  52. R Core Team. R: A Language and Environment for Statistical Computing; R Foundation for Statistical Computing: Vienna, Austria, 2024; Available online: https://www.R-project.org/ (accessed on 1 June 2026).
  53. Field, A.; Miles, J.; Field, Z. Discovering Statistics Using R and RStudio, 2nd ed.; SAGE Publications: London, UK, 2023. [Google Scholar]
  54. Revelle, W. Psych: Procedures for Psychological, Psychometric, and Personality Research; Northwestern University: Evanston, IL, USA, 2024. [Google Scholar]
  55. Kelley, K. MBESS: Methods for the behavioral, educational, and social sciences. Behav. Res. Methods 2007, 39, 979–984. [Google Scholar] [CrossRef]
  56. Rosseel, Y. Lavaan: An R package for structural equation modeling. J. Stat. Softw. 2012, 48, 1–36. [Google Scholar] [CrossRef]
  57. Rizopoulos, D. Ltm: An R package for latent variable modeling and item response theory analyses. J. Stat. Softw. 2006, 17, 1–25. [Google Scholar] [CrossRef]
  58. Stratford, P.W.; Goldsmith, C.H. Use of the standard error of measurement and minimal detectable change to interpret change scores. Phys. Ther. 1997, 77, 745–750. [Google Scholar] [CrossRef]
  59. Almatrafi, O.; Johri, A.; Lee, H. A systematic review of AI literacy conceptualization, constructs, and implementation and assessment efforts (2019–2023). Comput. Educ. Open 2025, 6, 100173. [Google Scholar] [CrossRef]
  60. Council of the European Union. Council recommendation of 22 May 2018 on key competences for lifelong learning (2018/C 189/01). Off. J. Eur. Union. 2018, C189, 1–13. [Google Scholar]
  61. Dunn, T.J.; Baguley, T.; Brunsden, V. From alpha to omega: A practical solution to the pervasive problem of internal consistency estimation. Br. J. Psychol. 2014, 105, 399–412. [Google Scholar] [CrossRef]
  62. McNeish, D. Thanks coefficient alpha, we’ll take it from here. Psychol. Methods 2018, 23, 412–433. [Google Scholar] [CrossRef]
  63. Filo, Y.; Rabin, E.; Mor, Y. An artificial intelligence competency framework for teachers and students: Co-created with teachers. Eur. J. Open Distance E-Learn. 2024, 26, 93–106. [Google Scholar] [CrossRef]
  64. Miao, F.; Cukurova, M. (Eds.) AI Competency Framework for Teachers; UNESCO: Paris, France, 2024. [Google Scholar] [CrossRef]

Table 1. Recent AI Literacy/AI Competence Instruments: Psychometric Synthesis and Limitations.
InstrumentPopulationFocusMain StrengthsMain Limitations
AILQ (AI Literacy Questionnaire) [26]StudentsAIL
4 domains
Good factorial structure and internal consistency; multidimensional designLimited criterion validity and lack of measurement invariance evidence
SNAIL (Scale for Non-Experts’ AI Literacy) [27]General public and non-expertsAILInitial factorial validity; non-expert focusNo invariance testing; limited cross-population replication
Meta AI Literacy Scale (additional validation) [28]VariousAILAdditional validation evidence; broader psychometric supportNo test–retest evidence; limited responsiveness data
AILS (traducción árabe) [29]Arabic University StudentsAILGood fit, reliability, and gender invarianceLimited broader validity evidence
ALTL/AL Frameworks in HE [19]HE instructors (PST, POST, PAS)Conceptual frameworkClear conceptual framework for AI literacyNo psychometric validation
AI Literacy Framework (Digital Promise) [20,21]K–HEAILClear conceptual framework for AI literacyNo psychometric validation
UNESCO AI Competency [17]Teachers StudentsAIC and AILClear conceptual framework for AIL and AICNo psychometric validation
AILIT (short AI literacy test) [30]StudentsAILBrief format; initial validity evidenceNo replication, invariance, or test–retest evidence
Source: own elaboration based on [25].
Table 2. Comparison of global fit indices of EFA models.
Index78 Items34 Items
χ 2 (gl), p 3604 (2623), < 0.001 779 (494), < 0.001
RMSEA [IC 90%]0.038 [0.035, 0.041]0.047 [0.041, 0.054]
TLI0.8080.863
BIC 10,931 1958
Nº of factors (% variance)5 (33.9%)2 (31.8%)
Table 3. Comparison of CFA Models and Global Fit Indices.
Modelχ2dfpCFITLIRMSEA [90% CI]SRMRAICBICSABIC
1425135<0.0010.7430.7090.092 [0.083–0.101]0.11414,276.2714,467.5014,296.30
21401340.3390.9950.9940.013 [0.000–0.033]0.04913,953.8614,148.6313,974.26
31391330.3400.9950.9940.013 [0.000–0.033]0.04913,955.8614,154.1713,976.64
41121170.6011.0001.0050.000 [0.000–0.028]0.03713,946.6714,201.6413,973.39
Note. Model: 1. Unidimensional. 2. Two correlated factors. 3. Second-order hierarchical. 4. Bifactor. T Robust/scaled fit indices based on Huber–White standard errors and Yuan–Bentler correction were reported. Lower AIC, BIC, and SABIC values indicate better relative model fit.
Table 4. Standardized loadings ( β ), R2 by item and factor and validity metrics.
Indicator/Factor β IC 95% R 2
Factor 1: AIC (Creative—Applied Competence)
I develop an automatic music generator that uses neural networks to compose original pieces in different genres and styles.0.737[0.662, 0.811]0.542
I create an AI system capable of generating visual art using generative neural networks.0.720[0.653, 0.787]0.518
I develop an AI-based strategy game that can adapt to and learn from the player’s behavior.0.704[0.623, 0.784]0.495
I create a simulation model of social interactions on social media to help users practice communication and empathy skills.0.691[0.616, 0.765]0.477
I use AI-powered chatbots to automate responses on social media.0.695[0.618, 0.773]0.484
I create a natural language generation model that enables a virtual assistant to communicate more naturally and fluently with users.0.701[0.626, 0.776]0.491
I create a machine translation system based on deep learning that dynamically adapts to different linguistic and cultural contexts.0.654[0.570, 0.739]0.428
I develop an AI model that can predict the user’s intentions and anticipate their needs to provide proactive responses.0.597[0.502, 0.693]0.357
I use AI to develop innovative solutions that address global challenges such as poverty and inequality.0.562[0.462, 0.662]0.316
I create an automatic text generation model to help users write more persuasive and engaging social media posts.0.574[0.465, 0.682]0.329
Factor 2: AIL (Critical—Conceptual Literacy)
I recognize the security risks associated with the use of AI systems.0.606[0.504, 0.708]0.367
I understand the role of AI in detecting and removing inappropriate content on social media platforms.0.646[0.552, 0.740]0.417
I understand how AI-based recommendation systems suggest relevant content in my social media feeds.0.565[0.451, 0.679]0.319
I remember that there are recommendation algorithms on mobile gaming platforms that suggest new games based on the player’s preferences.0.593[0.493, 0.693]0.352
I evaluate the accuracy and coherence of summaries automatically generated by AI tools.0.494[0.390, 0.598]0.244
I consider how AI can influence the quality of the education I receive.0.502[0.383, 0.621]0.252
I remember that speech recognition algorithms are applied in personal assistant applications.0.500[0.387, 0.614]0.250
I remember that there are AI algorithms for detecting and filtering fake news or misleading content on social media.0.513[0.411, 0.615]0.263
Second-order structure
CAIA   AIC0.700[0.597, 0.803]0.491
CAIA   AIL0.334[0.144, 0.525]0.112
Convergent validity
AVE AIC0.444
AVE AIL0.306
Table 5. Item selection process.
PhaseInitial ItemsRetained ItemsStatistical CriteriaTheoretical Criteria
Initial pool7878Expert review and content validationCoverage of AIL and AIC domains
EFA refinement7834Low loadings, cross-loadings, high uniqueness, redundancyConceptual clarity and representativeness
CFA refinement3418Modification indices, redundancy, model fit improvementBalanced representation of dimensions and interpretability
Note. Items were retained based on both statistical and theoretical considerations to preserve content coverage and improve model parsimony. AIL = Artificial Intelligence Literacy; AIC = Artificial Intelligence Competence.
Table 6. Comparative summary of reliability indices.
Scale α IC 95% ω IC 95% ω H GLBH α ord ω ord
AIC0.880[0.864, 0.895]0.880[0.865, 0.896]0.7900.9040.8840.905 [0.893, 0.917]0.905 [0.893, 0.918]
AIL0.764[0.733, 0.795]0.765[0.734, 0.796]0.6780.7840.7680.791 [0.764, 0.819]0.792 [0.764, 0.819]
CAIA0.833[0.811, 0.854]0.816[0.792, 0.840]0.6370.8530.8850.852 [0.833, 0.871]0.833 [0.812, 0.854]
Table 7. SEM and MDC95% by scale and reliability coefficient (total sample and sex-based groups).
ScaleCoefficientSDSEMMDC95,indMDC95,group
AIC α 8.8863.0808.5370.535
AIC ω 8.8863.0728.5160.533
AIC ω H 8.8863.0738.5180.533
AIC α ord 8.8862.7387.5880.475
AIC ω ord 8.8862.7317.5700.474
AIC ω H , ord 8.8862.7327.5730.474
AIL α 6.0642.9468.1660.511
AIL ω 6.0642.9418.1520.510
AIL ω H 6.0642.9418.1510.510
AIL α ord 6.0642.7707.6780.481
AIL ω ord 6.0642.7677.6700.480
AIL ω H , ord 6.0642.7677.6700.480
CAIA α 11.5824.73513.1240.822
CAIA ω 11.5824.20611.6570.730
CAIA ω H 11.5826.97819.3431.211
CAIA α ord 11.5824.45712.3550.774
CAIA ω ord 11.5823.83510.6300.666
CAIA ω H , ord 11.5826.80018.8481.180
Table 8. Group comparisons across sex, faculty, and academic year.
VariableOutcomeStatistical TestStatisticpEffect Size [95% CI]Interpretation
SexAICYuen robust t-testt(133) = 0.0590.953ξ = 0.018 [0.000, 0.205]Trivial
SexAILYuen robust t-testt(152) = 0.0410.967ξ = 0.022 [0.000, 0.195]Trivial
SexCAIAYuen robust t-testt(135) = 0.2780.782ξ = 0.033 [0.000, 0.181]Trivial
FacultyAICRobust ANOVAQ = 41.230.004Significant
FacultyAILRobust ANOVAQ = 17.720.237Non-significant
FacultyCAIARobust ANOVAQ = 28.360.030Significant
YearAICRobust ANOVAF(3161) = 1.330.2680.137 [0.049, 0.232]Small
YearAILRobust ANOVAF(3159) = 1.990.1170.164 [0.068, 0.290]Small
YearCAIARobust ANOVAF(3157) = 0.4520.7160.114 [0.037, 0.210]Small
Note. ξ = explanatory effect size for robust Yuen tests. Confidence intervals correspond to 95%. Robust analyses were based on trimmed means procedures.
Table 9. Significant post hoc comparisons across faculties.
OutcomeComparisonMean DifferencepInterpretation
AICMathematics vs. Computer Science−6.610.013Significant difference favoring Computer Science
Note. Post hoc comparisons were conducted using family-wise confidence interval adjustment procedures. Only statistically significant pairwise contrasts are shown.
Disclaimer/Publisher’s Note: The statements, opinions and data contained in all publications are solely those of the individual author(s) and contributor(s) and not of MDPI and/or the editor(s). MDPI and/or the editor(s) disclaim responsibility for any injury to people or property resulting from any ideas, methods, instructions or products referred to in the content.