Re-Examining Organisational Performance: An Empirical Study on the Relationships Between Revenue, Net Profit, Cash Flow per Share, and Earnings per Share in Australian Energy Firms



Abstract
1. Introduction
2. Literature Review and Hypotheses Development
2.1. Organisational Performance
2.2. Relationship Between Revenue, Net Profit and Earnings per Share
2.3. Relationship Between Cash Flow per Share and Earnings per Share
2.4. Relationship Between the Combined Variables Revenue, Net Profit, and Cash Flow per Share with Earnings per Share
2.5. Market Capitalisation as a Predictor of Earnings per Share
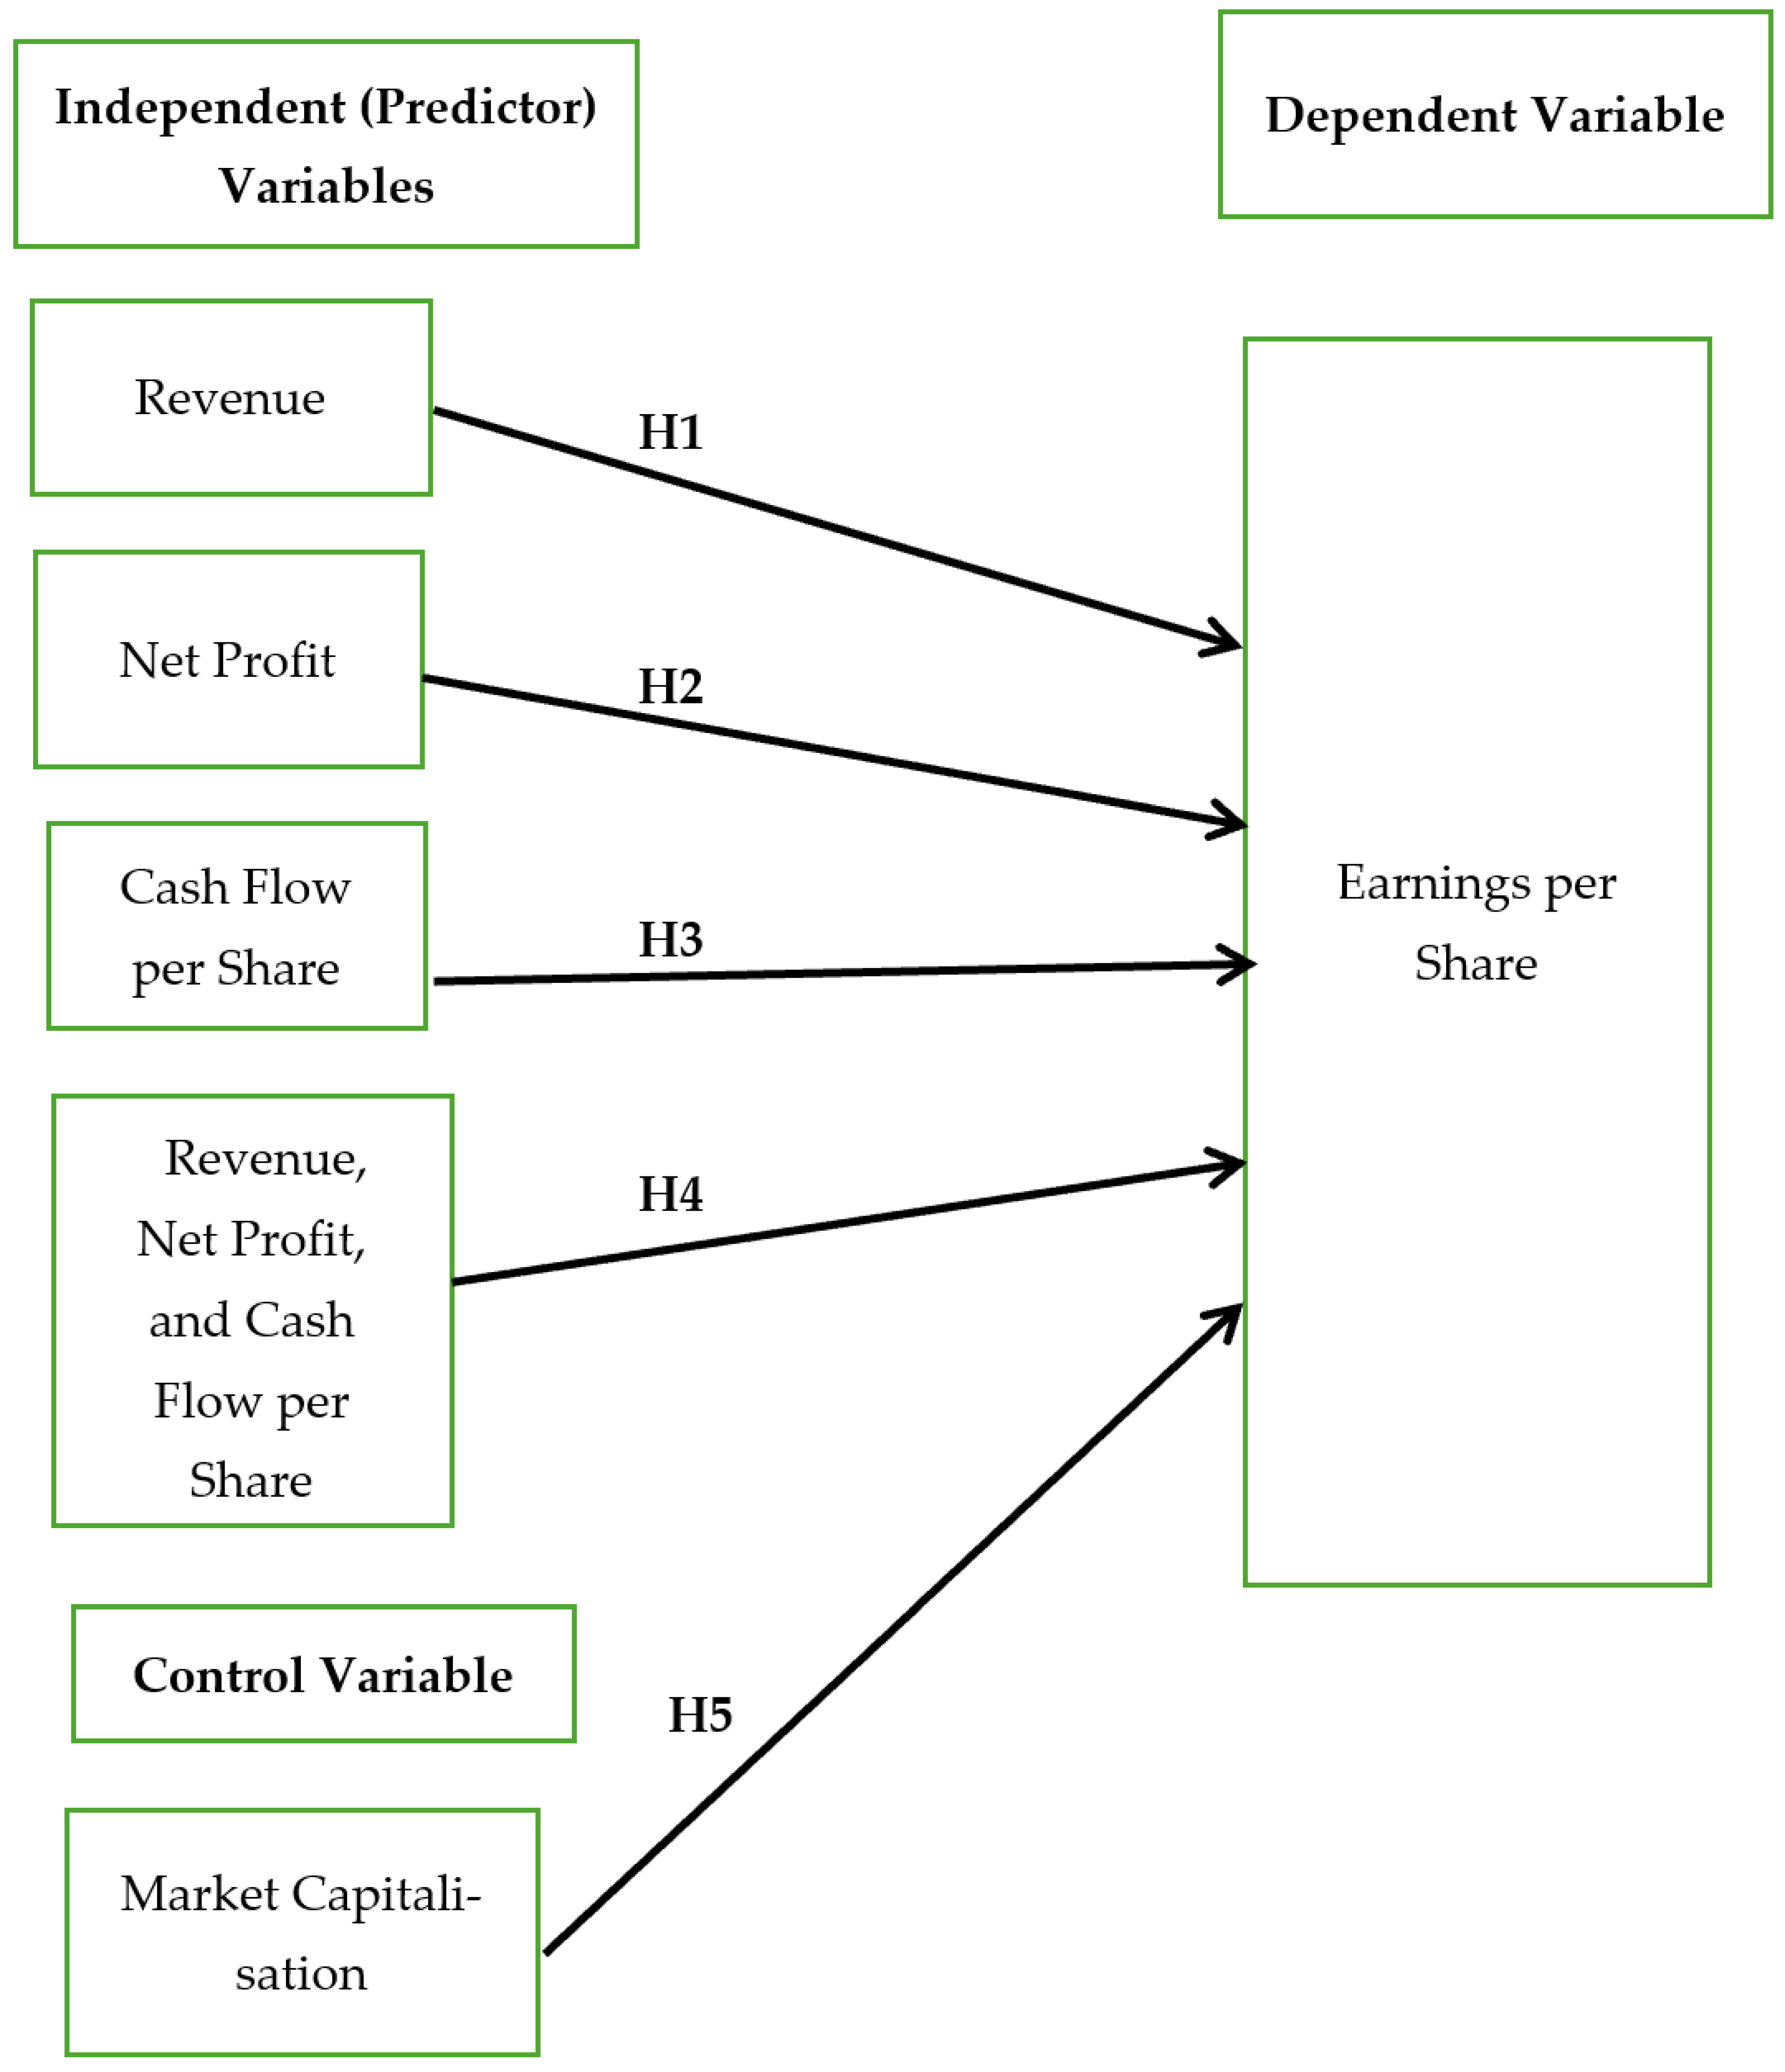
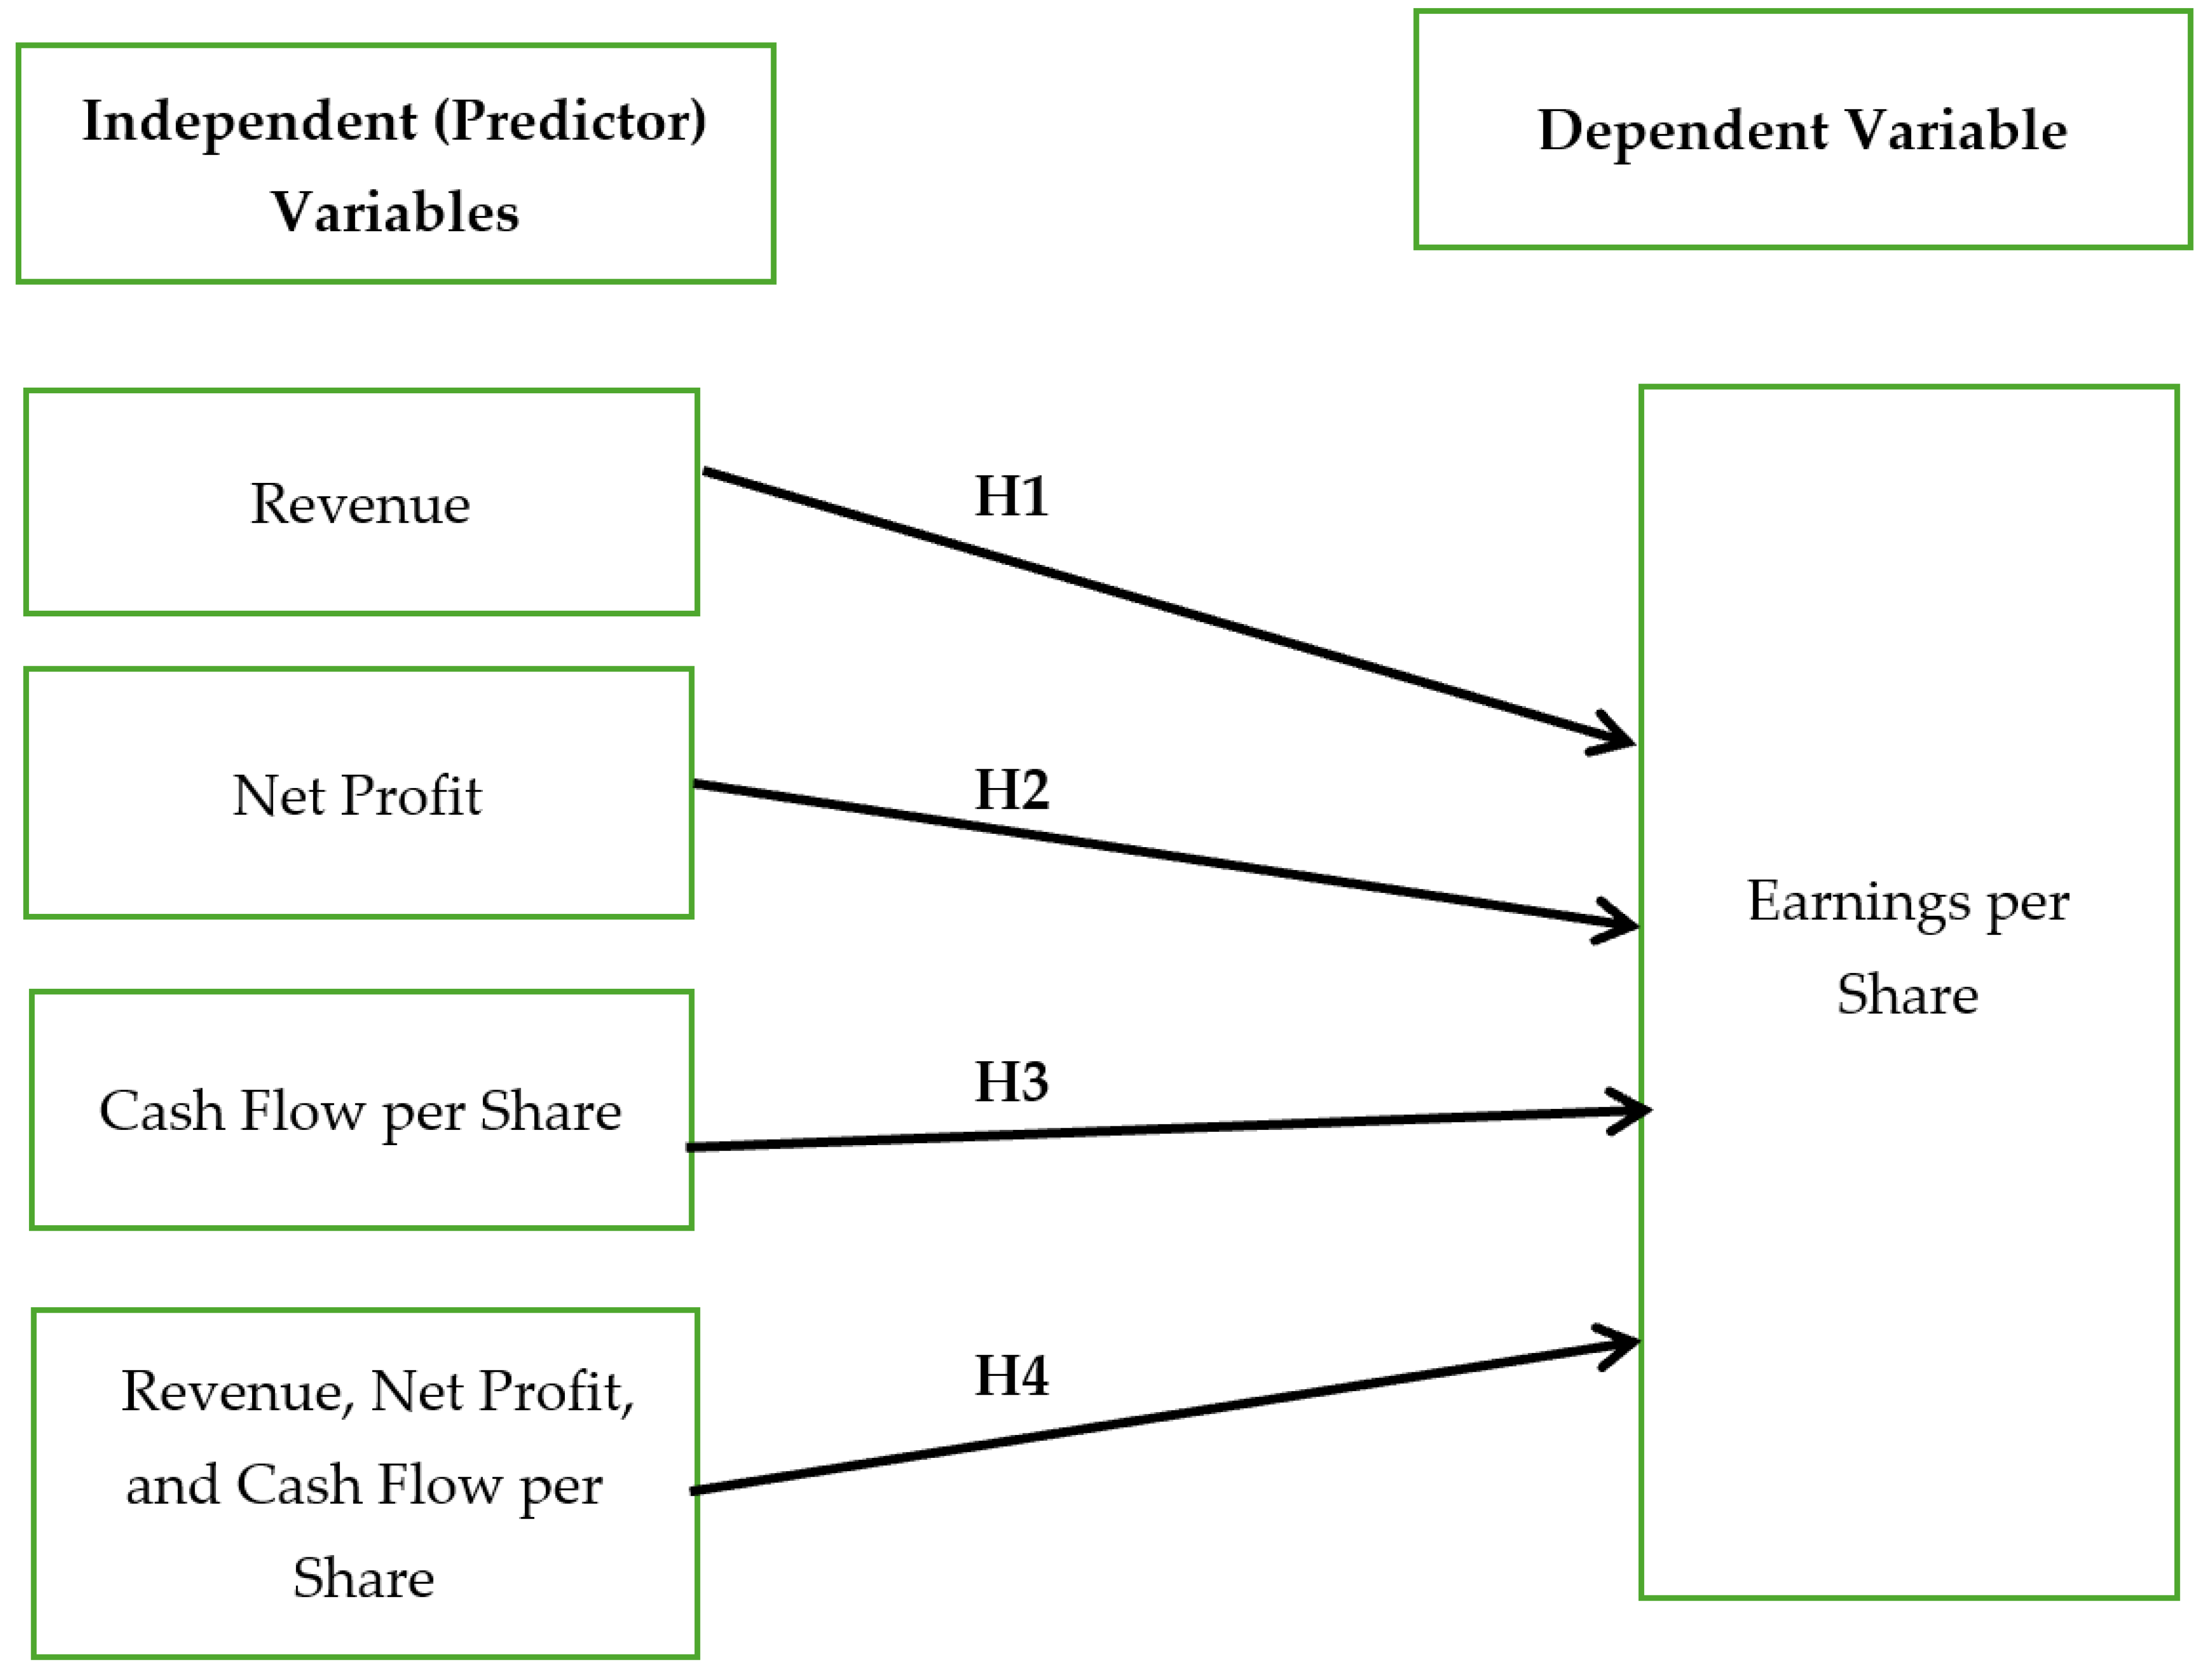
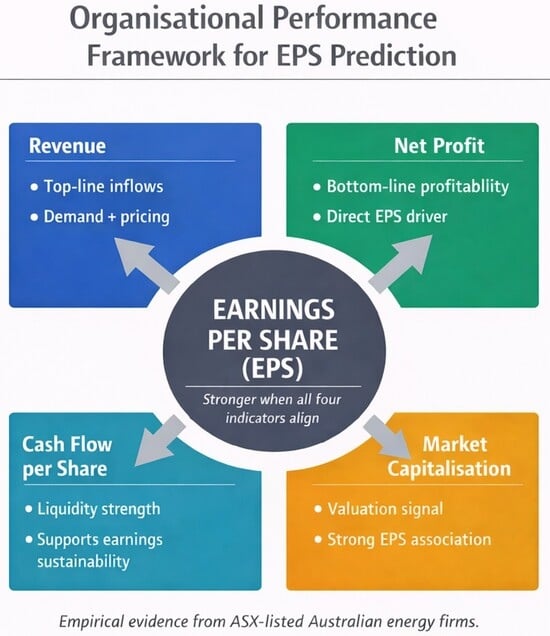
2.6. Research Model and Development of Research Hypotheses
3. Research Methodology
3.1. Sample Selection and Data Collection
- Clear identification of firms:Energy firms were selected using the ASX GICS Energy classification, with explicit inclusion/exclusion criteria to ensure consistency across reporting years.
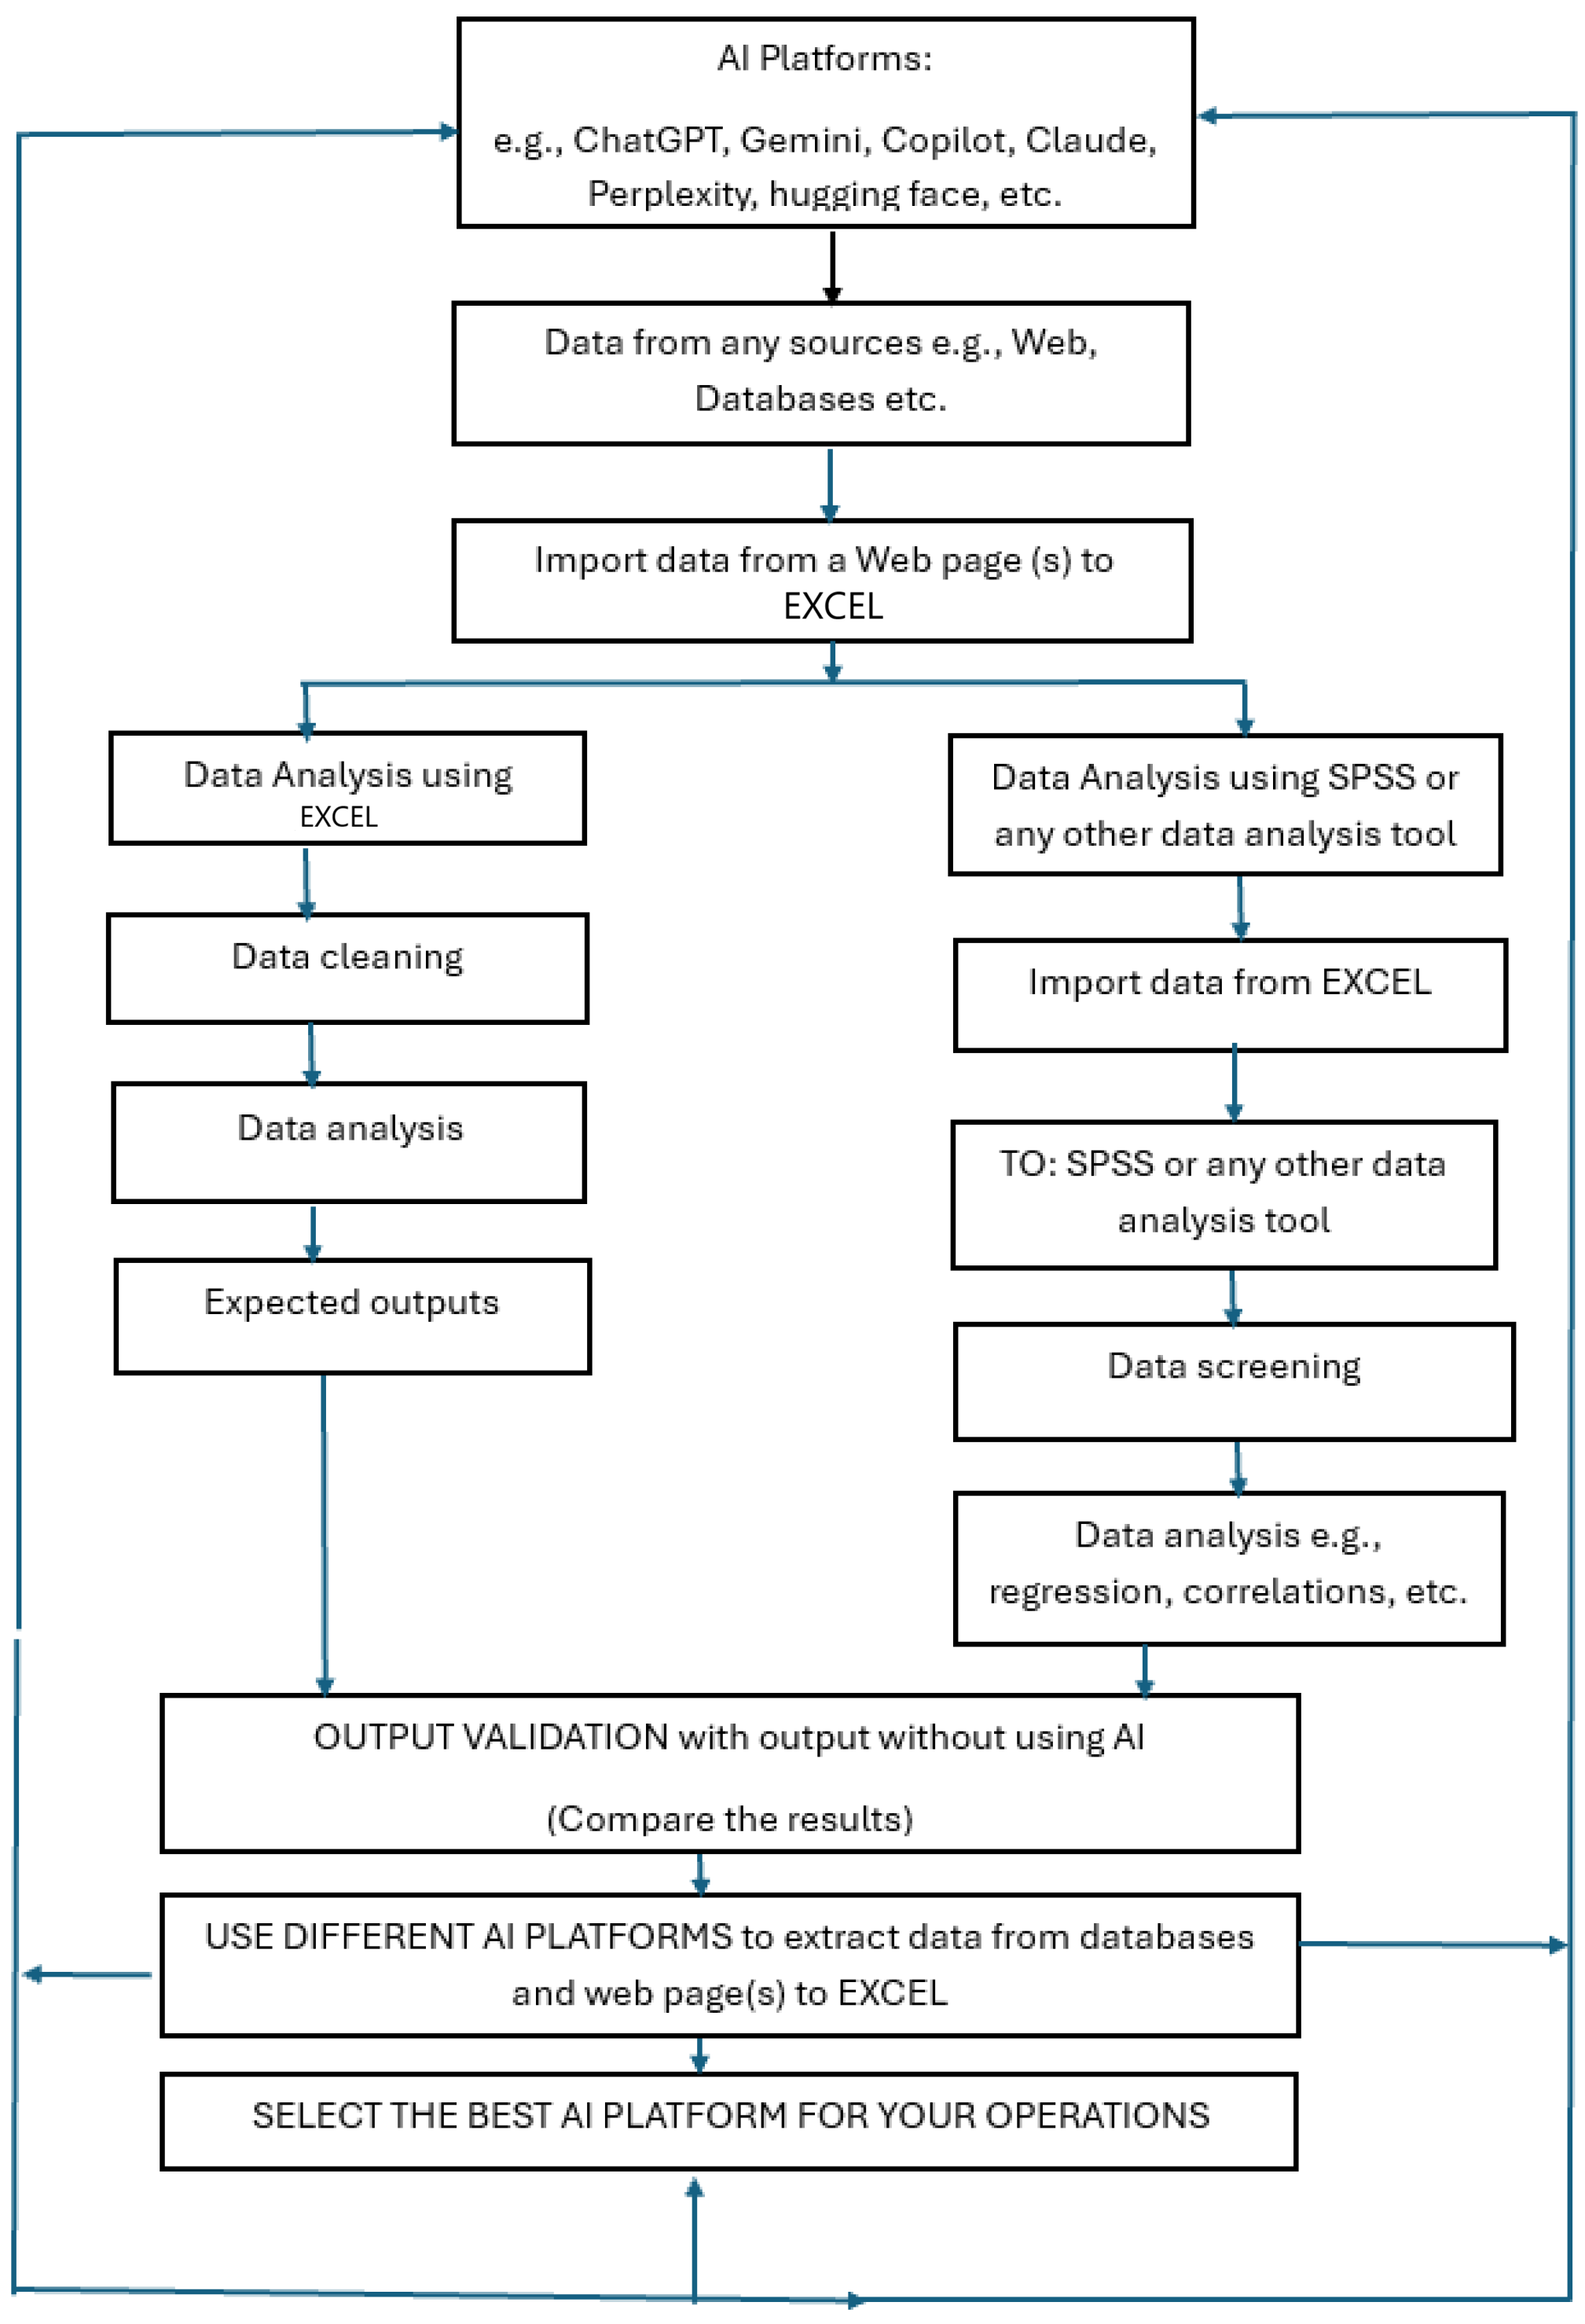
- Transparent data extraction process:Financial variables (revenue, net profit, CFPS, EPS, market capitalisation) were manually extracted from annual reports downloaded from each firm’s ASX announcements page. Two researchers independently extracted and cross-checked all values.
- Detailed data cleaning procedures:The revision explains how the authors handled inconsistent reporting formats, standardised units, verified EPS/CFPS calculations, screened outliers, and removed incomplete observations.
- Reproducible data-matching process:All variables were matched by firm, financial year, and reporting period end date. Firms with non-comparable reporting periods were excluded to maintain dataset integrity.
- Clear explanation of statistical analysis:Pearson correlations and multiple regression were used. Market capitalisation was initially included but removed due to multicollinearity, with justification provided.
3.2. Quantitative Measures of Data
4. Data Analysis
4.1. Profile of Industry and Distribution of Measures of Sample Data
4.2. Distribution of Measures of Sample Data
4.3. Assessing the Validity of Secondary Data for Correlation and Regression Analysis in IBM SPSS Statistics Version 31.0.0.0
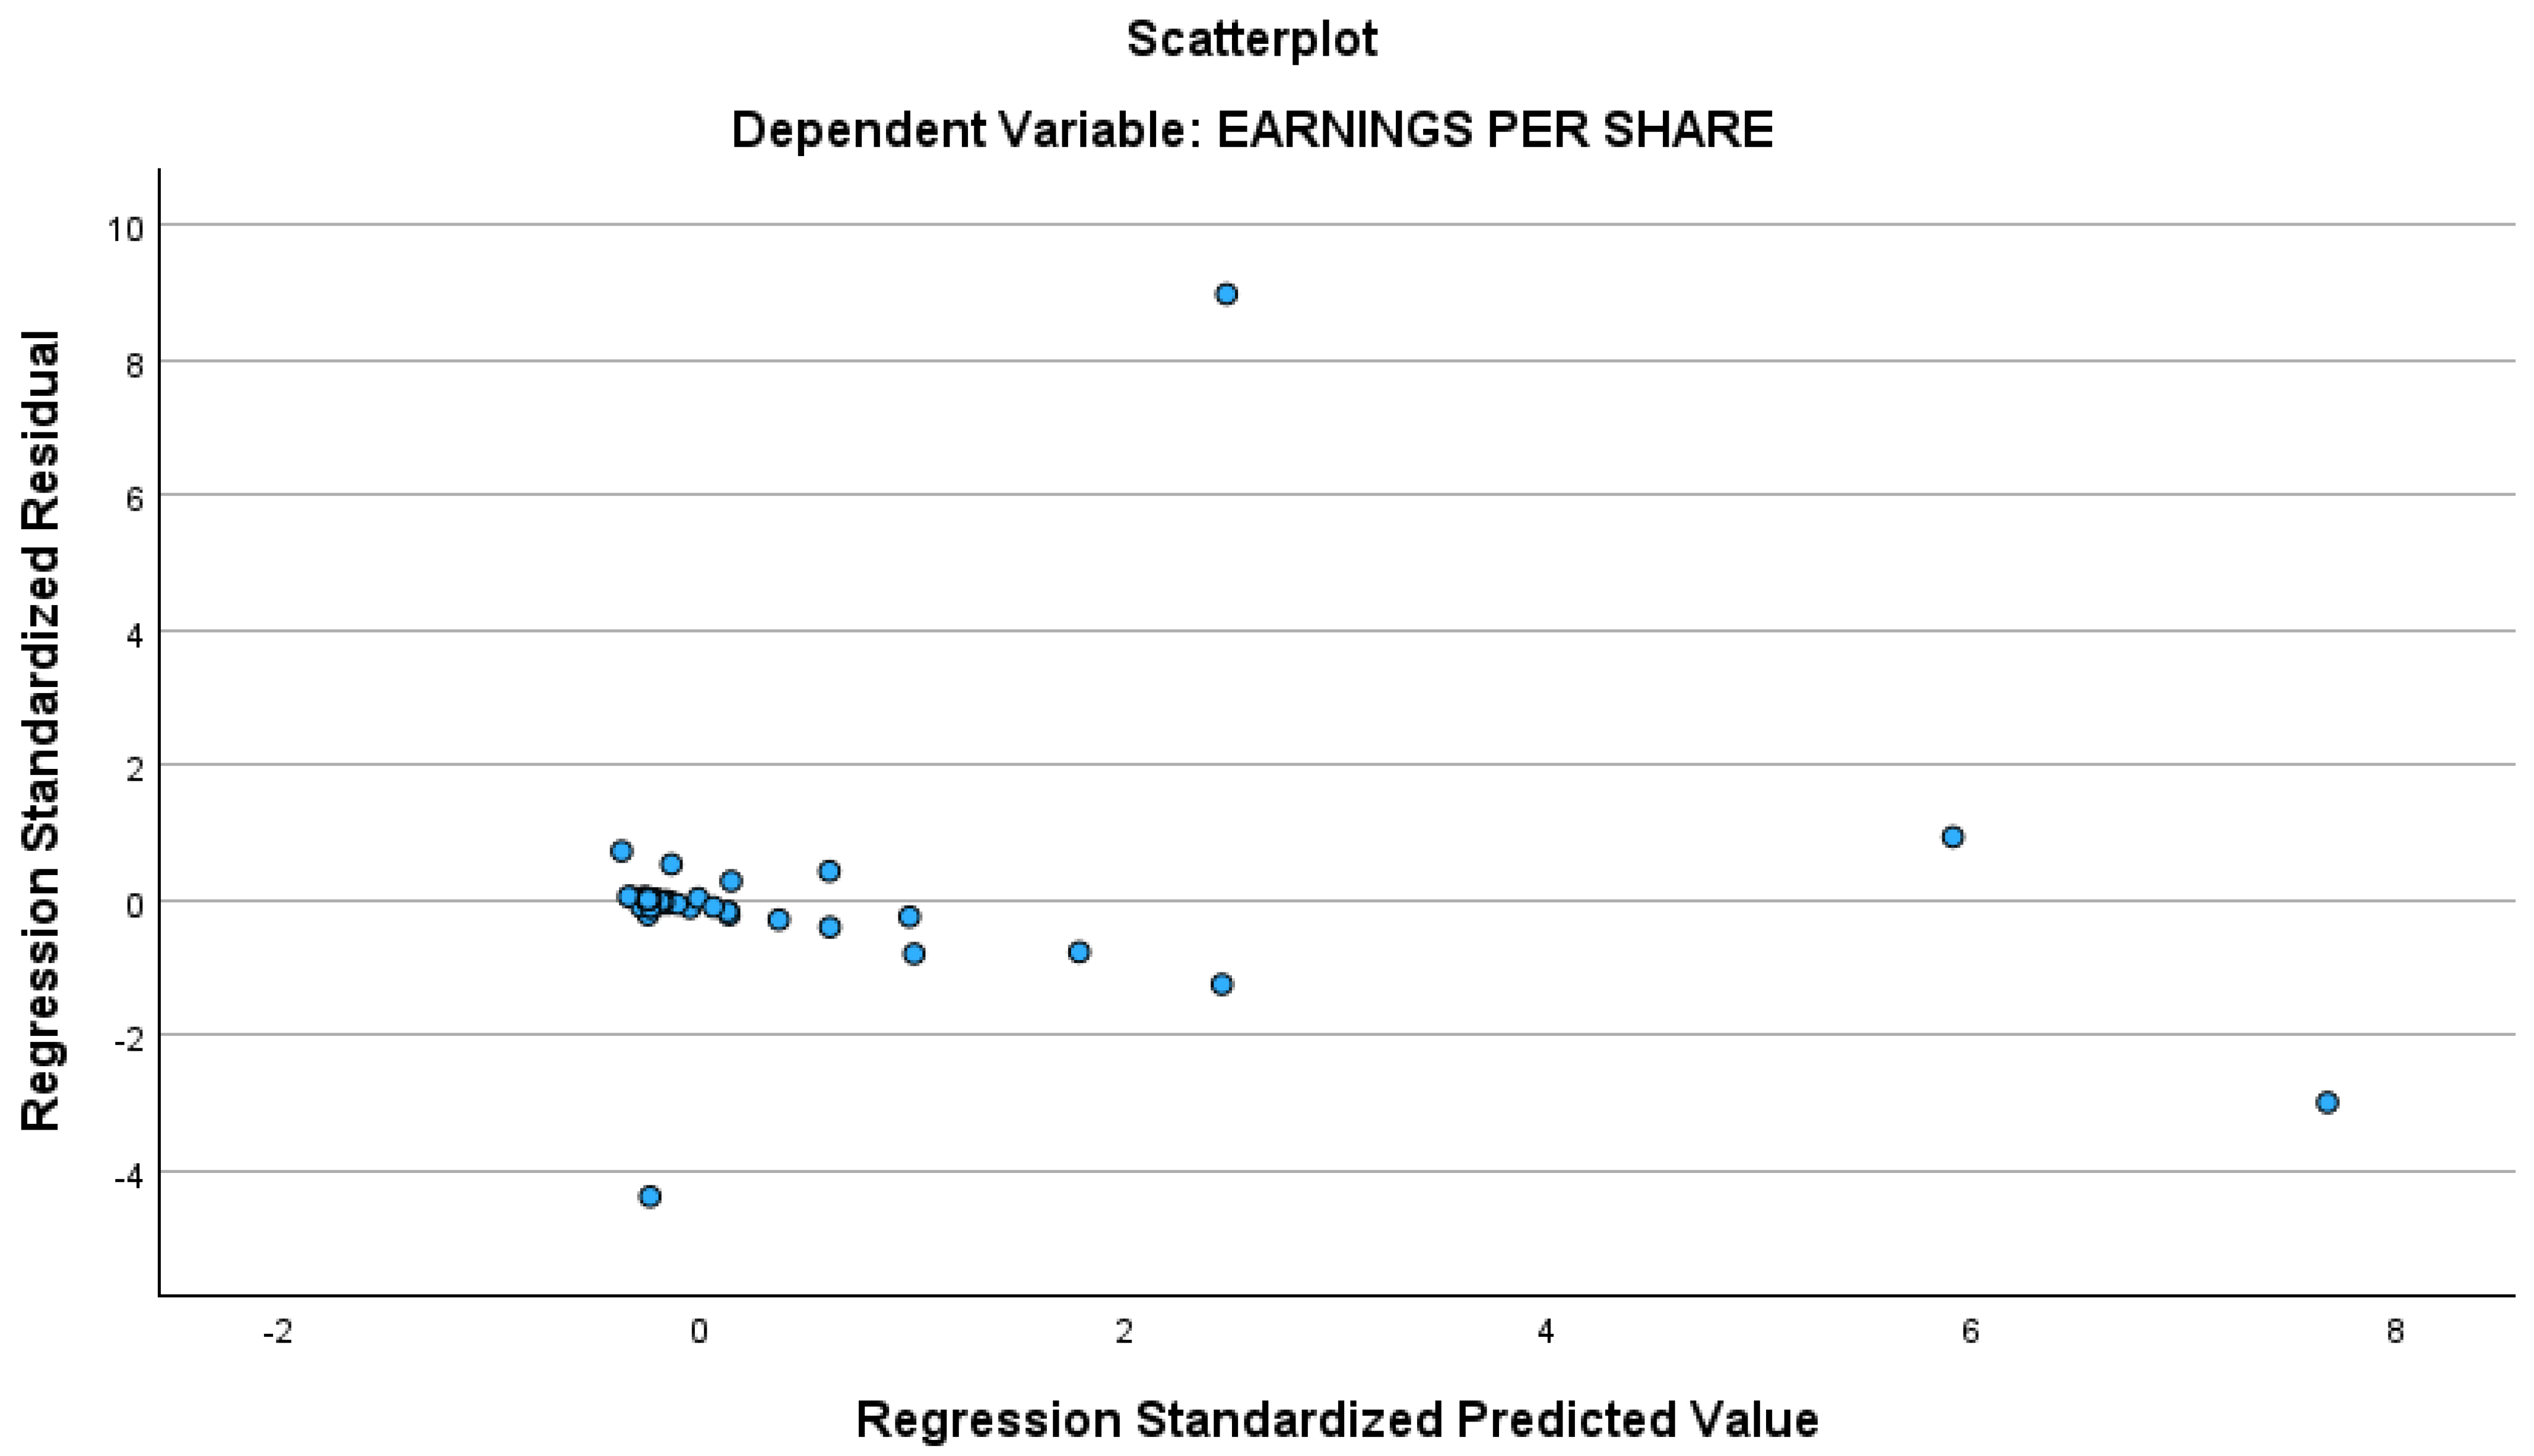
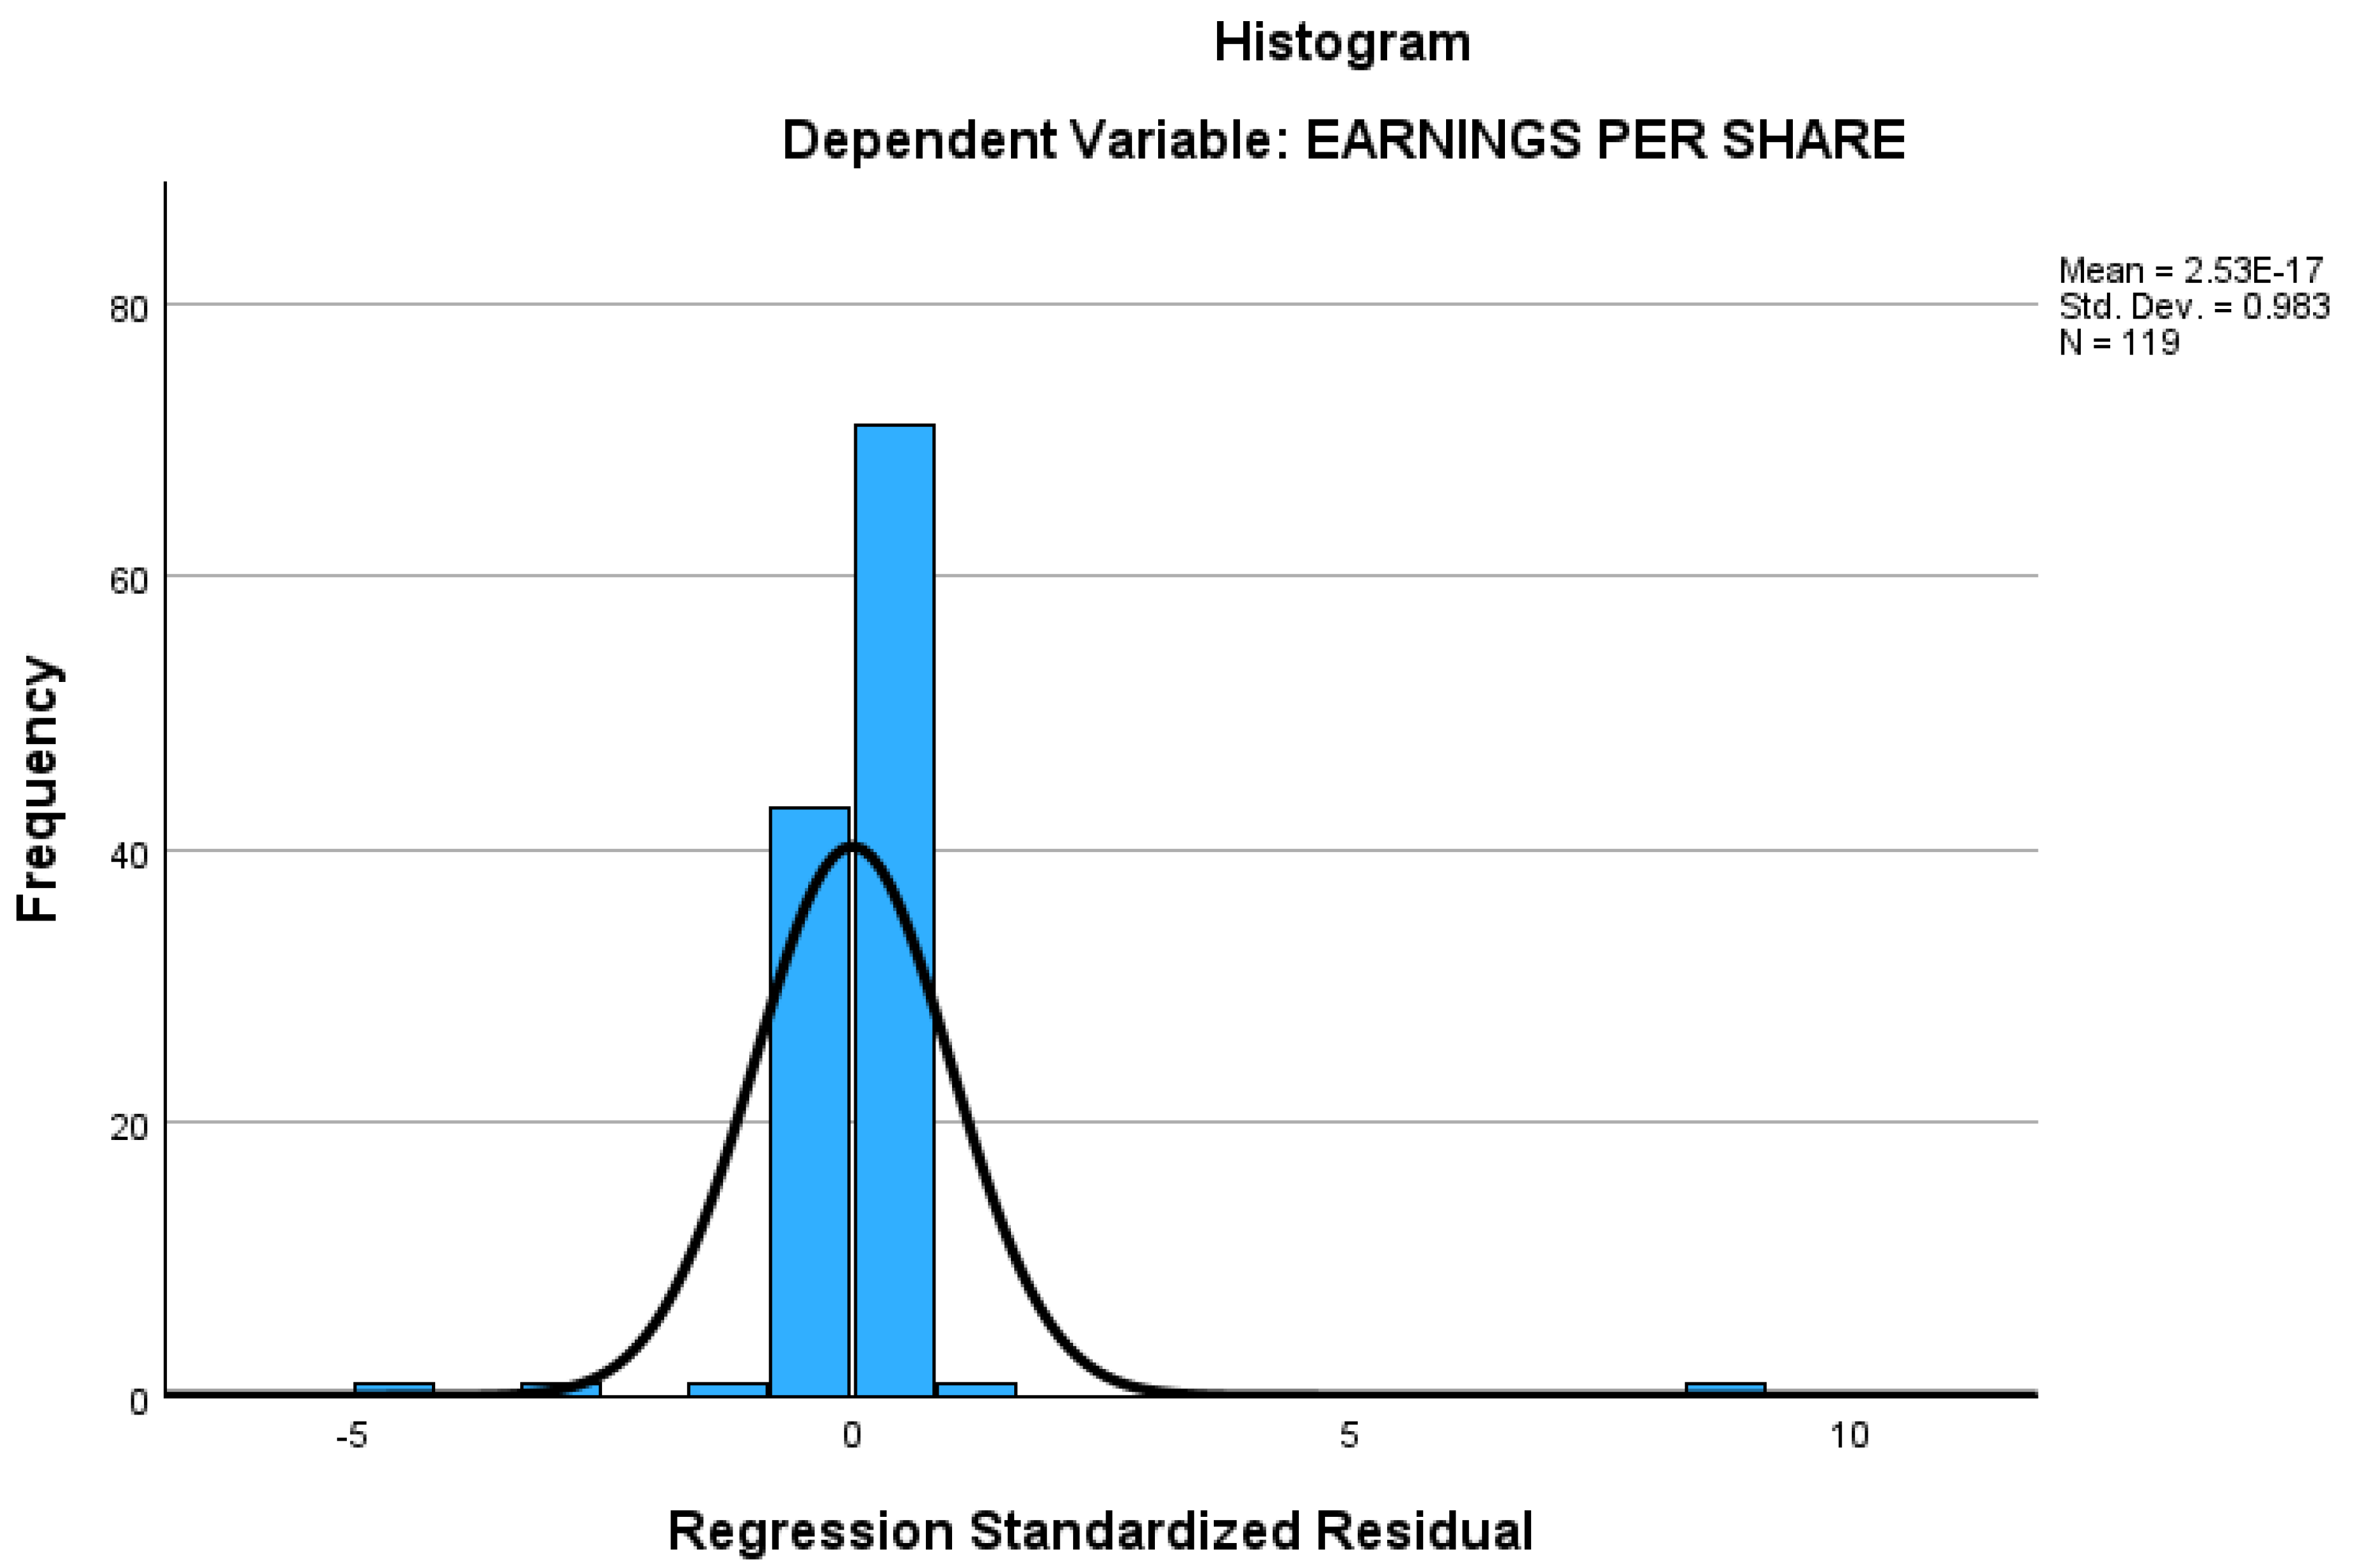
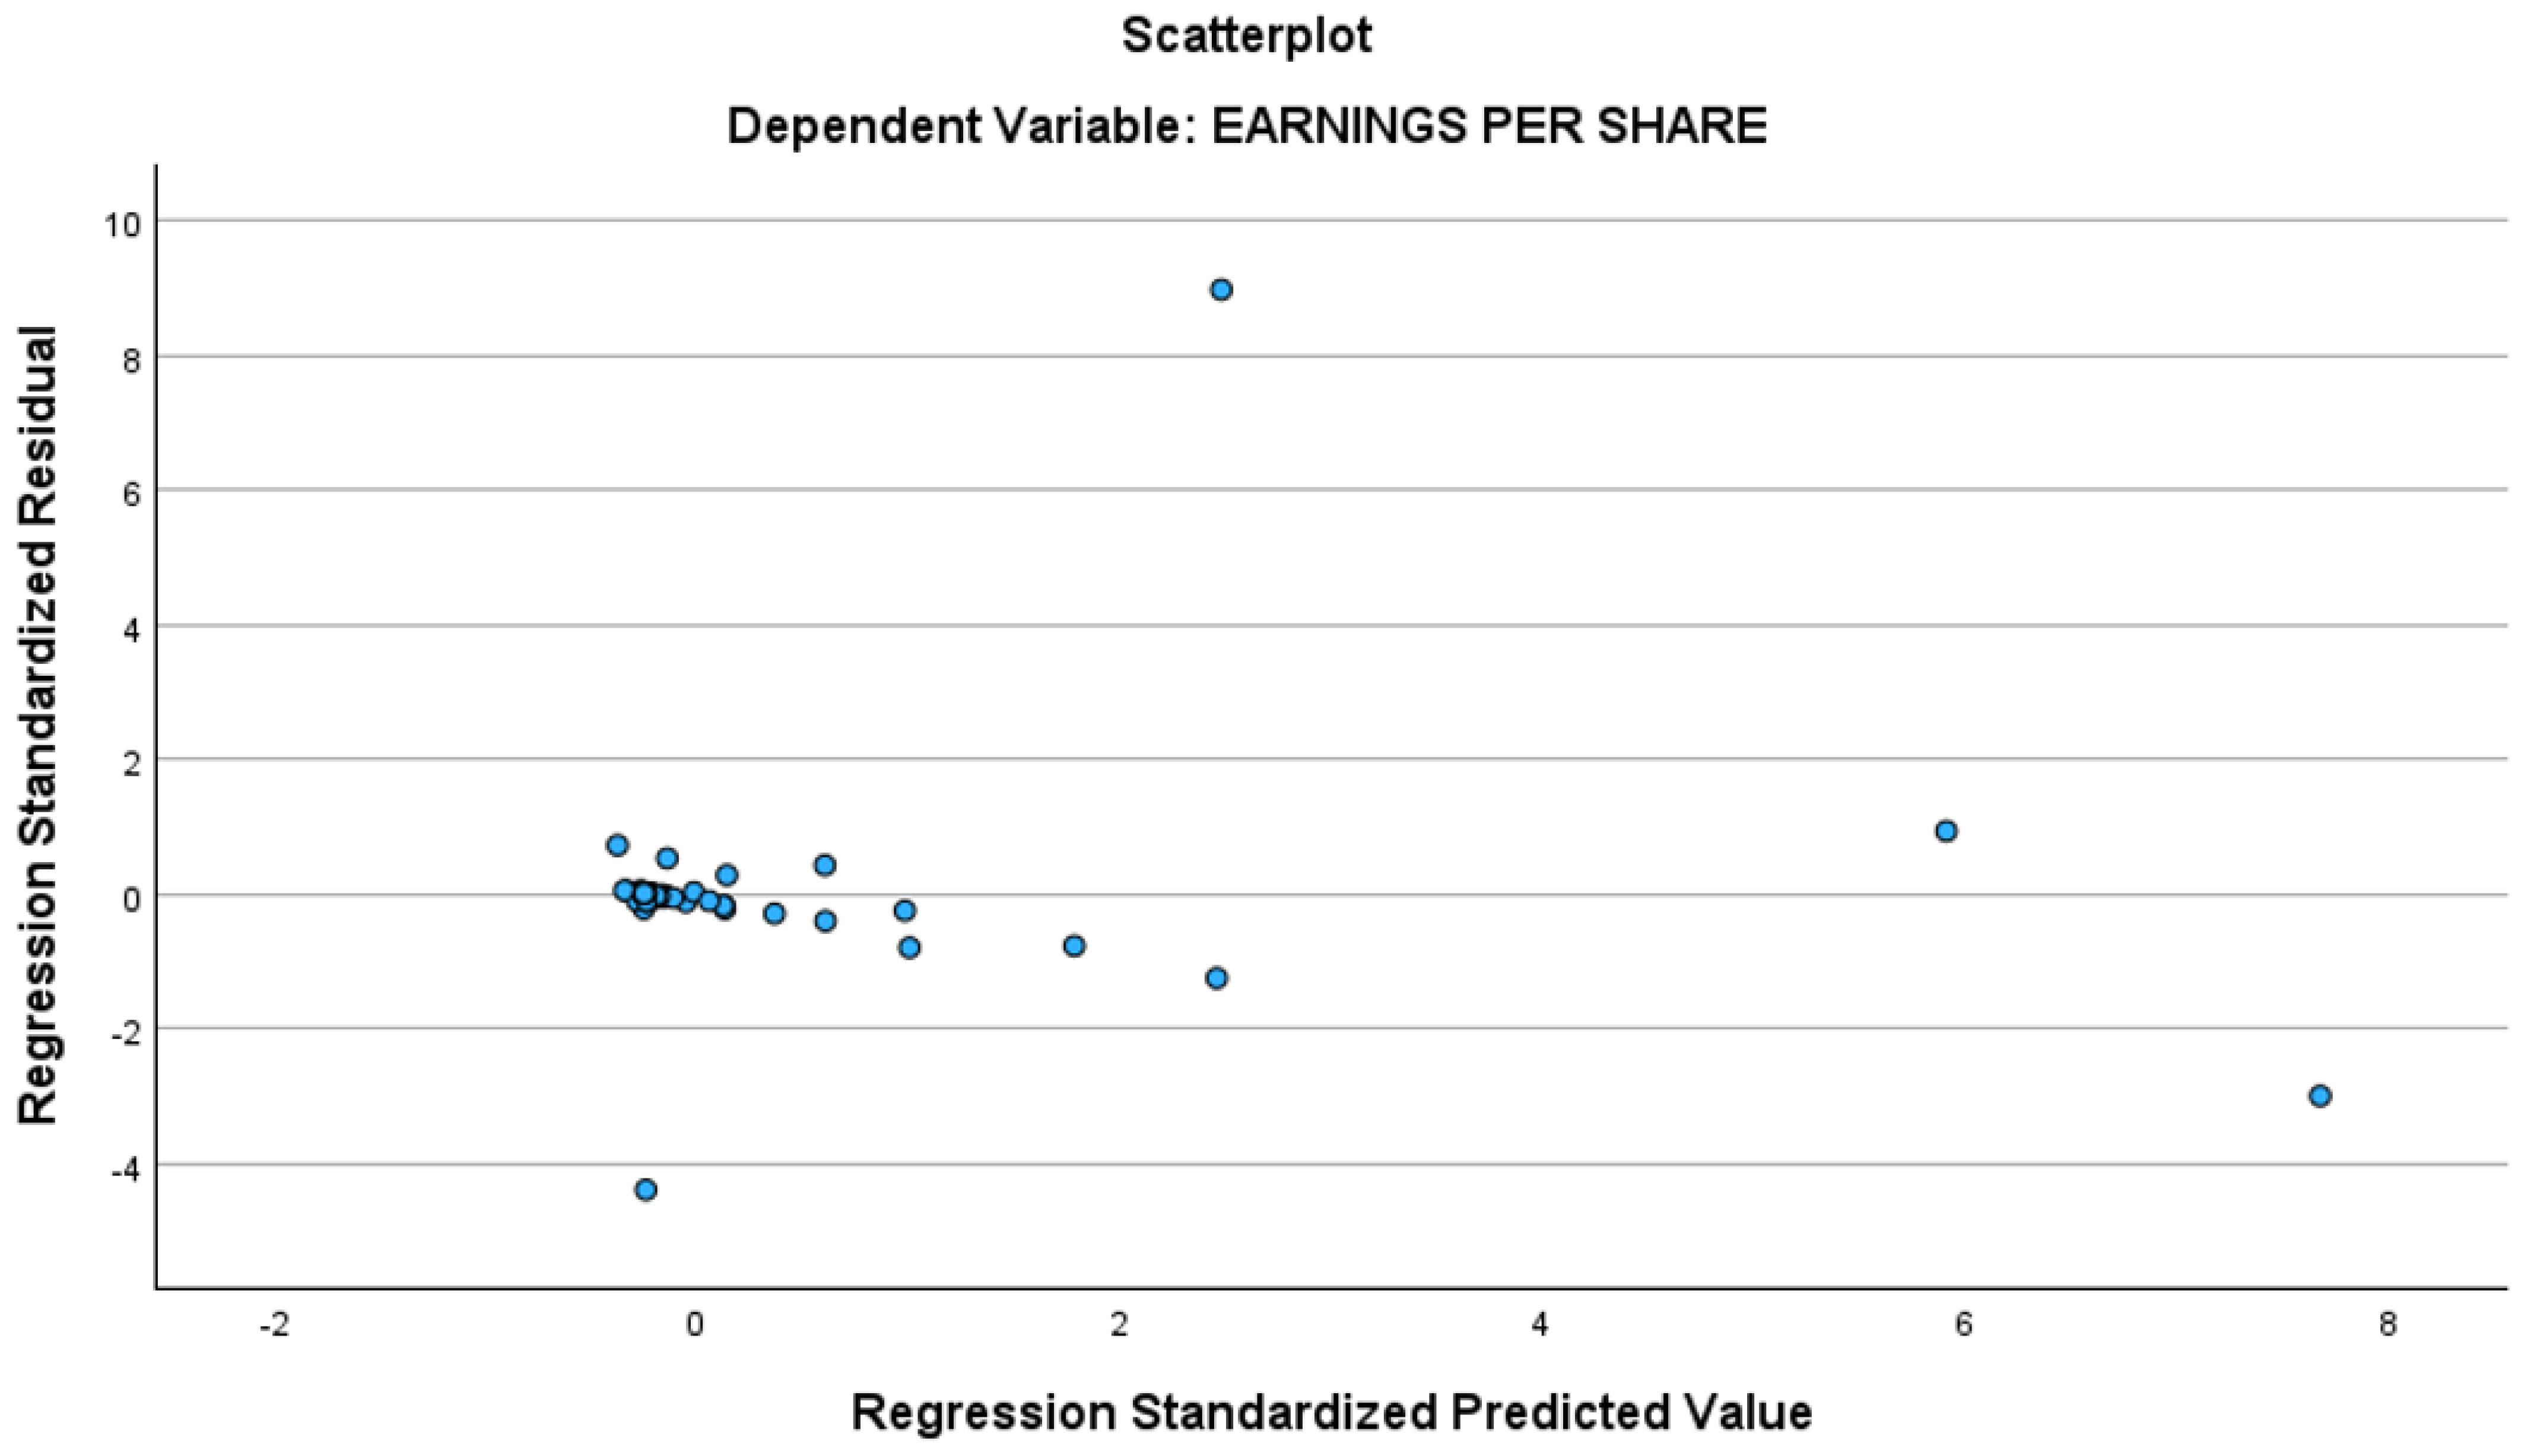
4.3.1. Assumptions Testing
4.3.2. Absence of Multicollinearity
4.3.3. Absence of Multicollinearity (Without a Control Variable)
4.4. Variables Relationships and Hypotheses Testing
4.4.1. Relationship Between Revenue and Earnings per Share (H1)
4.4.2. Relationship Between Net Profit and Earnings per Share (H2)
4.4.3. Relationship Between Cash Flow per Share and Earnings per Share (H3)
4.4.4. Relationship Between the Combined Performance Variables: Revenue, Net Profit, and Cash Flow per Share with Earnings per Share (H4)
5. Discussion of Empirical Findings and Conclusions
5.1. Discussion of Empirical Findings
5.2. Conclusions
6. Recommendations
6.1. Specific Recommendations Related to the Study
6.1.1. Strengthen Net Profit Margins (Derived from Strong Net Profit–EPS Relationship)
- cost efficiency programs in production and operations,
- optimisation of asset utilisation, and
- renegotiation of long term supply contracts to stabilise input costs.
6.1.2. Avoid over Reliance on Revenue Growth Alone (Derived from Weak Revenue–EPS Relationship)
6.1.3. Manage Cash Flow Carefully During High CapEx Cycles (Derived from Negative CFPS–EPS Relationship)
- improve transparency around CapEx cycles,
- adopt staged investment or joint venture financing, and
- maintain adequate liquidity buffers.
6.1.4. Use Combined Performance Metrics for Decision Making (Derived from Strong Combined Model Results)
6.1.5. Technology Enabled Improvements (Reframed to Be Evidence Linked)
- AI driven predictive maintenance to reduce operating costs and increase net profit;
- AI based cash flow forecasting to manage the negative CFPS–EPS dynamics during CapEx cycles;
- ERP and JIT systems only where they demonstrably reduce working capital requirements or operational costs, thereby improving net profit or cash flow.
6.1.6. Market Capitalisation as a Contextual Indicator
- Investors can use the results of this study to make investment decision for the energy industry firms or other industries’ firms. It is important to invest in firms that have higher earnings per share and taking into consideration the firm’s revenue, net profit, and cash flow per share. Revenue and net profit are the best predictors of earnings per share revealed in our current empirical study.
- AI can be used to collect and process data on firm’s revenue, net profit, and cash flow per share fast, and enable potential investors to make investments decisions efficiently and effectively.
- Use AI predictive analytics to forecast firm’s revenue, net profit, cash flow per share, and earnings per share in Australian energy firms. The data will be useful to investors in energy companies to improve investment decisions.
- The above specific recommendations can be used in other business firms of different industries in the global competitive market.
6.2. General Recommendations
6.2.1. Recommendations to Increase Profit Using Proposed Sales Strategies
- Shift the focus on strategic margin optimisation from volume expansion. Traditionally, sales growth is pursued by lowering selling prices to stimulate volume. However, in the context of the Australian energy sector, this study suggests such a strategy may be sub-optimal for enhancing shareholder value. Our empirical findings indicate that Net Profit (r = 0.318, p < 0.001) is a significantly stronger predictor of Earnings Per Share (EPS) than Revenue (r = 0.161, p = 0.040). Because the correlation between revenue and EPS is weak, “top-line” growth through price discounting does not efficiently translate into shareholder value. Furthermore, given that energy demand is often price-inelastic, a decrease in selling price may fail to generate sufficient volume to offset the reduction in unit margins. Consequently, management should shift focus from aggressive volume-based competition to margin preservation and yield management. By prioritising operational cost-efficiency and protecting the net margins of existing contracts, firms can more effectively drive the bottom-line performance as the primary driver of organisational success.
- Increase the competitive selling price to increase the profit margin. Improvement will need to be made to product features, packaging and after-sales service to justify the increase in the selling price. Sales volume may decrease, remain unchanged or increase depending on the success in the improvement of the product.
- Data-driven ML and AI can be used to address dynamic changes in consumer behavior and other business challenges such as COVID-19 pandemic situations by employing accurate sales forecasting models [77]. Predictions of future sales volume and product pricing can be determined more optimally by combining past data and market trends to refine forecasting models.
- Efforts should be focused on satisfying customer needs such as after-sales service while achieving profit maximisation.
- Strategies for the diversification of products and markets should be evaluated and implemented to improve profit performance.
- Marketing strategies should be adjusted according to the change in profitability due to the change in the life cycle of products.
6.2.2. Recommendations to Increase Profit Using Proposed Inventory Control Strategies
- Applying the traditional inventory model of economic order quantity to determine the amount and timing of inventory ordering would help firms to have the optimum amount of inventory in the warehouse in ideal situations. Implementation of inventory optimisation models can help to maintain reasonable inventory levels necessary to meet customers’ demand. Nnamdi [73] stresses that “managing excess inventory must be a strategic focus of inventory planning or supply chain optimisation function in the global distribution chain” (p. 138).
- Using JIT inventory management system is efficient where amount of goods manufactured are based on the current rather than expected demand, and materials purchased are delivered just in time to meet production needs. This will reduce the set-up time and carrying costs of inventory.
- The use of Enterprise Resource Planning (ERP), where sales, inventory, and profit performance can be improved by integrating the suppliers and customers in the supply chain [80]. Supply chain management integration (SCMI) is directly linked to performance metrics as it serves as a primary driver of both top-line growth and bottom-line efficiency. In general, for companies to improve their profit performance, they need to have sustainable service supply chain management in the organisations.
- To control spending on sales and inventories, managers should categorise spend and analyse data to determine if the performance is according to the company’s sales. It is important to balance inventory with sales volume. Using ML algorithms such as Gradient Boosting and Multi-Layer Perceptron (MLP) can optimise inventory management and improve demand forecasting accuracy [77].
- Using lean procurement techniques, such as material requirements planning (MRP) systems, i.e., procuring required goods and avoiding waste inventories can enhance sustainability.
- Strengthening supplier and buyer relationships, with emphasis on effective procurement contract management and trust to solve some of the inventory problems and improve reciprocal customer experience dealing with procurement function (i.e., all suppliers and buyers are customers to each other).
6.2.3. Recommendations to Increase Sales (Part of Revenue) and Profit Using Organisation Restructuring Strategies
- Companies can restructure and decentralise their operations to improve sales and profit performance.
- Applying performance evaluation systems such as balanced scorecard can be useful to arrive at a balanced measurement of financial, non-financial, internal and external performance.
- Data-driven techniques of AI and ML technologies can aid in the digital transformation of business operations that would result in rapid reshaping of organisational structures. AI and ML have profound influence on organisational hierarchies, job roles, decision-making processes, and the overall strategic orientation of companies [81].
- Profit & Revenue Optimisation through smart trading with the use of deep neural networks to forecast renewable output and optimise energy trading. Also, adopting Dynamic Pricing strategies by implementing machine learning algorithms to adjust pricing in real-time based on supply-demand fluctuations, protecting profit margins.
- Operational Efficiency through predictive maintenance by using AI to monitor infrastructure (e.g., wind turbines, grids) to identify faults early. This can reduce grid outages and lower maintenance costs significantly. In addition, cost reduction through AI applications is practically possible in specific energy use cases with increase in productivity.
- Strategic Accounting principles of transparency and disclosure can be adopted using AI-powered platforms for real-time carbon accounting and fraud detection to ensure financial reporting remains transparent and free from “earnings management” bias. AI can automate bookkeeping of routine tasks such as invoice processing and bank reconciliations to free up professionals for strategic analysis.
7. Implications of This Research
8. Limitations of the Study and Future Research
Author Contributions
Funding
Institutional Review Board Statement
Informed Consent Statement
Data Availability Statement
Conflicts of Interest
References
- Carpenter, R.E.; Fazzari, S.M.; Petersen, B.C. Financing Constraints and Inventory Investment: A Comparative Study with High-Frequency Panel Data. Rev. Econ. Stat. 1998, 80, 513–519. [Google Scholar] [CrossRef] [Scilit]
- Roumiantsev, S.; Netessine, S. Should Inventory Policy be Lean or Responsive? Evidence for US Public Companies. SSRN Electron. J. 2007, 9, 1–31. [Google Scholar] [CrossRef] [Scilit]
- Dedeke, A.; Watson, N. Exploring Inventory Trends in Six U.S. Retail Segments; Harvard Business School: Boston, MA, USA, 2008. [Google Scholar]
- Obermaier, R.; Donhauser, A. Zero inventory and firm performance: A management paradigm revisited. Int. J. Prod. Res. 2012, 50, 4543–4555. [Google Scholar] [CrossRef] [Scilit]
- Elsayed, K.; Wahba, H. Reexamining the relationship between inventory management and firm performance: An organizational life cycle perspective. Future Bus. J. 2016, 2, 65–80. [Google Scholar] [CrossRef] [Scilit]
- Egging-Bratseth, R.; Siddiqui, A.S. Stochastic equilibria with capacity expansion: Increasing expected profit with risk aversion. Decis. Anal. J. 2023, 7, 100234. [Google Scholar] [CrossRef] [Scilit]
- Guo, S.; Gu, J.W.; Ching, W.K. Adaptive online portfolio selection with transaction costs. Eur. J. Oper. Res. 2021, 295, 1074–1086. [Google Scholar] [CrossRef] [Scilit]
- Dubelaar, C.; Chow, G.; Larson, P.D. Relationships between inventory, sales and service in a retail chain store operation. Int. J. Phys. Distrib. Logist. Manag. 2001, 31, 96–108. [Google Scholar] [CrossRef] [Scilit]
- Gaur, V.; Kesavan, S. The effects of firm size and sales growth rate on inventory turnover performance in the US retail sector. In Retail Supply Chain Management: Quantitative Models and Empirical Studies; Agrawal, N., Smith, S., Eds.; Springer: New York, NY, USA, 2009; pp. 25–52. [Google Scholar]
- Obermaier, R.; Donhauser, A. Disaggregate and aggregate inventory to sales ratios overtime: The case of German corporations 1993. Logist. Res. 2009, 1, 95–111. [Google Scholar] [CrossRef] [Scilit]
- Ton, Z.; Raman, A. The Effect of Product Variety and Inventory Levels on Retail Store Sales: A Longitudinal Study. Prod. Oper. Manag. 2010, 19, 546–560. [Google Scholar] [CrossRef] [Scilit]
- Tan, C. Sales Performance assessment: A theoretical overview. Int. J. Adv. Multidiscip. Res. Stud. 2023, 3, 1274–1281. [Google Scholar]
- Voulgaris, F.; Doumpos, M.; Zopounidis, C. On the Evaluation of Greek Industrial SME’s Performance via Multicriteria Analysis of Financial Ratios. Small Bus. Econ. 2000, 15, 127–136. [Google Scholar] [CrossRef] [Scilit]
- Cannon, A.R. Inventory improvement and financial performance. Int. J. Prod. Econ. 2008, 115, 581–593. [Google Scholar] [CrossRef] [Scilit]
- Nguyen, D.T.; Pham, T.D. Determinant of Profitability: An Empirical Investigation of the Role of Financial Structure, Technological Innovation, and Managerial Attributes. Economies 2026, 14, 85. [Google Scholar] [CrossRef] [Scilit]
- Hofer, C.; Eroglu, C.; Hofer, A.R. The effect of lean production on financial performance: The mediating role of inventory leanness. Int. J. Prod. Econ. 2012, 138, 242–253. [Google Scholar] [CrossRef] [Scilit]
- Gajamannage, K.; Park, Y.; Jayathilake, D.I. Real-time forecasting of time series in financial markets using sequentially trained dual-LSTMs. Expert Syst. Appl. 2023, 223, 119879. [Google Scholar] [CrossRef] [Scilit]
- Li, T.; Lu, C.; Xu, L. The impact of organisation capital on inventory efficiency. Account. Financ. 2024, 64, 3751–3779. [Google Scholar] [CrossRef] [Scilit]
- Australian Accounting Standards Board. AASB1027 Earnings Per Share. 2001. Available online: https://aasb.gov.au/admin/file/content102/c3/AASB1027_06-01.pdf (accessed on 15 July 2025).
- Australian Accounting Standards Board. AASB1026 Statement of Cash Flows. 1997. Available online: https://aasb.gov.au/admin/file/content102/c3/AASB1026_10-97.pdf (accessed on 15 July 2025).
- Australian Securities Exchange (ASX 200). Company Directory. 2025. Available online: https://www.asx.com.au/ (accessed on 15 July 2025).
- Quester, P.; Mcguiggan, R.; Perreault, W., Jr.; McCarthy, J. Marketing: Creating and Delivering Value; McGraw-Hill: New York, NY, USA, 2007. [Google Scholar]
- Bazley, M.; Hancock, P. Contemporary Accounting; Cengage Learning Pty. Ltd.: Melbourne, VIC, Australia, 2010. [Google Scholar]
- Dai, L.; Fu, R.; Kang, J.-K.; Lee, I. Corporate governance and the profitability of insider trading. J. Corp. Financ. 2016, 40, 235–253. [Google Scholar] [CrossRef] [Scilit]
- Fullerton, R.R.; McWatters, C.S.; Fawson, C. An examination of the relationships between JIT and financial performance. J. Oper. Manag. 2003, 21, 383–404. [Google Scholar] [CrossRef] [Scilit]
- Graman, G.A.; Magazine, M.J. Implementation issues influencing the decision to adopt postponement. Int. J. Oper. Prod. Manag. 2006, 26, 1068–1083. [Google Scholar] [CrossRef] [Scilit]
- Kumar, P.; Bahl, R.N. The effect of inventory management on organizational performance. Int. J. Innov. Sci. Eng. Technol. 2014, 1, 453–459. [Google Scholar]
- Smith, K.V. Profitability versus liquidity trade-offs in working capital management. In Readings on the Management of Working Capital; Smith, K.V., Ed.; West Publishing: St. Paul, MN, USA, 1980; pp. 549–562. [Google Scholar]
- Akinlo, O.O. Determinants of Working Capital Requirements in Selected Quoted Companies in Nigeria. J. Afr. Bus. 2012, 13, 40–50. [Google Scholar] [CrossRef] [Scilit]
- Keep, E.; Mayhew, K.; Corney, M. Review of the Evidence on the Rate of Return to Employers of Investment in Training and Employer Training Measures; SKOPE Research Paper No. 34; Department of Trade and Industry: Washington, DC, USA, 2002. [Google Scholar]
- Batt, R. Managing Customer Services: Human Resource Practices, Quit Rates, and Sales Growth. Acad. Manag. J. 2002, 45, 587–597. [Google Scholar] [CrossRef] [Scilit]
- Storey, D. Education, training and development policies and practices in medium-sized companies in the UK: Do they really influence firm performance? Omega 2002, 30, 249–264. [Google Scholar] [CrossRef] [Scilit]
- Hutchinson, S.; Kinnie, N.; Purcell, J. Bringing Policies to Life: Discretionary Behaviour and the Impact on Business Performance. In Proceedings of the Bath Conference, University of Bath School of Management, Bath, UK, 10–11 April 2002. [Google Scholar]
- Miller, D.; Lee, J. The people make the process: Commitment to employees, decision making, and performance. J. Manag. 2001, 27, 163–189. [Google Scholar] [CrossRef]
- Richard, O.C.; Johnson, N.B. Strategic Human Resource Management Effectiveness and Firm Performance. Int. J. Hum. Resour. Manag. 2001, 12, 299–310. [Google Scholar] [CrossRef]
- Guest, D. CIPD Research Report: Voice from the Boardroom; CIPD: London, UK, 2001. [Google Scholar]
- Chukwunwike, O.D.; Ofoegbu, G.N.; Okoroiwu, K.L.; Okafor, R.G. The Potency of Cash Flow in Predicting Corporate Performance. Acc. Financ. Manag. 2018, 3, 1591–1601. [Google Scholar]
- Olaoye, S.A.; Arise, O.; Akintoye, I.R. Performance Management and Market Capitalisation of Listed Oil and Gas Companies in Nigeria. Int. J. Innov. Res. Dev. 2022, 7, 34–41. [Google Scholar] [CrossRef] [Scilit]
- Mowen, M.; Hansen, D.; Heitger, D.; Sands, J.; Winata, L.; Su, S. Management Accounting; Cengage Learning: Melbourne, VIC, Australia, 2016. [Google Scholar]
- Shah, R.; Shin, H. Relationships among information technology, inventory, and profitability: An investigation of level invariance using sector level data. J. Oper. Manag. 2007, 25, 768–784. [Google Scholar] [CrossRef] [Scilit]
- Koumanakos, D.P. The effect of inventory management on firm performance. Int. J. Prod. Perform. Manag. 2008, 57, 355–369. [Google Scholar] [CrossRef] [Scilit]
- Ahmad, K.; Zabri, S.M. The mediating effect of knowledge of inventory management in the relationship between inventory management practices and performance: The case of micro retailing enterprises. J. Bus. Retail Manag. Res. 2018, 12, 83–93. [Google Scholar] [CrossRef] [Scilit]
- Gupta, A.; Singh, R.; Suri, P. Analysis of Challenges Faced by Indian Logistics Service Providers. Oper. Supply Chain Manag. 2018, 11, 214–225. [Google Scholar] [CrossRef] [Scilit]
- Rachmawati, R.; Sherlita, E. Effect of Sales Growth, Firm Size, Profitability on Earning Per share. Turk. J. Comput. Math. Educ. (TURCOMAT) 2021, 12, 675–680. [Google Scholar]
- Mulindabigwi, J.N.; Mulyungi, P. Effect of inventory management on financial performance in manufacturing firms in Rwanda: A case study of Bralirwa. Int. J. Sci. Res. 2017, 6, 1366–1371. [Google Scholar]
- Boute, R.; Lambrecht, M.; Lambrecht, D.; Sterckx, P. An Analysis of Inventory Turnover in the Belgian Manufacturing Industry, Wholesale and Retail and the Financial Impact on Inventory Reduction; Katholieke Universitieit: Leuven, Belgium, 2006. [Google Scholar]
- Folinas, D.; Shen, C.Y. Exploring links among inventory and financial performance in the agricultural machinery industry. Int. J. Food Agric. Econ. 2014, 2, 1–12. [Google Scholar]
- Panigrahi, A. Relationship between inventory management and profitability: An empirical analysis of Indian cement companies. Asia Pac. J. Mark. Manag. Rev. 2013, 2, 107–120. [Google Scholar]
- Pong, C.K.; Mitchell, F. Inventory investment & control: How have UK companies been doing? Br. Account. Rev. 2012, 44, 173–188. [Google Scholar]
- Sahari, S.; Tinggi, M.; Kadri, N. Inventory Management in Malaysian Construction Firms: Impact on Performance. SIU J. Manag. 2012, 2, 59–72. [Google Scholar]
- Vastag, G.; Whybark, D.C. Inventory Management: Is There a Knock-On Effect? Int. J. Prod. Econ. 2005, 93, 129–138. [Google Scholar] [CrossRef] [Scilit]
- Heizer, J.; Render, B. Operations Management, Sustainability and Supply Chain Management, 11th ed.; Pearson Education: London, UK, 2014. [Google Scholar]
- Balakrishman, R.R.; Linsmeier, J.; Venkatachalam, M. Financial benefits from JIT adoption: Effects of customer concentration and cost structure. Account. Rev. 1996, 71, 43. [Google Scholar] [CrossRef] [Scilit]
- Huson, M.; Nanda, D. The Impact of Just-In-Time Manufacturing on Firm Performance. J. Oper. Manag. 1995, 12, 297–310. [Google Scholar] [CrossRef] [Scilit]
- Lieberman, M.B.; Demeester, L. Inventory Reduction and Productivity Growth: Linkages in the Japanese Automotive Industry. Manag. Sci. 1999, 45, 466–485. [Google Scholar] [CrossRef] [Scilit]
- Kolias, G.D.; Dimelis, S.P.; Filios, V.P. An empirical analysis of inventory turnover behaviour in Greek retail sector: 2000. Int. J. Prod. Econ. 2011, 133, 143–153. [Google Scholar] [CrossRef] [Scilit]
- Chen, H.; Frank, M.Z.; Wu, O.Q. What Actually Happened to the Inventories of American Companies? Manag. Sci. 2005, 51, 1015–1031. [Google Scholar] [CrossRef] [Scilit]
- Demeter, K. Manufacturing Strategy and Competitiveness. Int. J. Prod. Econ. 2003, 31, 205–213. [Google Scholar] [CrossRef] [Scilit]
- Hise, R.; Kelly, J.P.; Gable, M. Factors Affecting the Performance of Individual Chain Store Units: An Empirical Analysis. J. Retail. 1983, 59, 22–39. [Google Scholar]
- McGahan, A.M.; Porter, M.E. How much does industry matter, really? Strateg. Manag. J. 1997, 18, 15–30. [Google Scholar]
- Vidyakala, K.; Madhuvanthi, S.; Poornima, S. Recession in Indian Retail Industry. SSRN Electron. J. 2009. [Google Scholar] [CrossRef] [Scilit]
- Choudhary, H.; Tripathi, G. An Analysis of Inventory Turnover and Its Impact on Financial Performance in Indian Organised Retail Industry. J. Serv. Res. 2012, 12, 43–60. [Google Scholar]
- Eroglu, C.; Hofer, C. Lean, leaner, too lean? The inventory-performance link revisited. J. Oper. Manag. 2011, 29, 356–369. [Google Scholar] [CrossRef] [Scilit]
- Jayaram, J.; Vickery, S.; Droge, C. Relationship building, lean strategy and firm performance: An exploratory study in the automotive supplier industry. Int. J. Prod. Res. 2008, 46, 5633–5649. [Google Scholar] [CrossRef] [Scilit]
- Saleh, B.A. The Effect of Financial Ratios, Firm Size, and Cash Flows from Operating Activities on Earnings per Share. Int. J. Prof. Bus. Rev. 2023, 8, e03317. [Google Scholar] [CrossRef] [Scilit]
- Taani, K.; Banykhaled, M. The effect of financial ratios, firm size and cash flow from operating activities on earnings per share (an applied study on Jordanian industrial sector). Int. J. Soc. Sci. Humanit. Stud. 2011, 3, 197–205. [Google Scholar]
- Martani, D.; Khairurizka, R. The effect of financial ratios, firm size, and cash flow from operating activities in the interim report to the stock return. Chin. Bus. Rev. 2009, 8, 6. [Google Scholar] [CrossRef] [Scilit]
- Larson, P.D.; DeMarais, R.A. Psychic Stock: An Independent Variable Category of Inventory. Int. J. Phys. Distrib. Logist. Manag. 1990, 20, 28–34. [Google Scholar] [CrossRef] [Scilit]
- Huffman, C.; Kahn, B.E. Variety for sale: Mass customization or mass confusion? J. Retail. 1998, 74, 491–513. [Google Scholar] [CrossRef] [Scilit]
- Fisher, M.L.; Ittner, C.D. The Impact of Product Variety on Automobile Assembly Operations: Empirical Evidence and Simulation Analysis. Manag. Sci. 1999, 45, 771–786. [Google Scholar] [CrossRef] [Scilit]
- Grubor, A.; Milicevic, N.; Djokic, N. The Effect of Inventory Level on Product Availability and Sale. Prague Econ. Pap. 2016, 25, 221–233. [Google Scholar] [CrossRef] [Scilit]
- Ton, Z.; Raman, A. Cross-Sectional Analysis of Phantom Products at Retail Stores; Working Paper; Harvard University: Cambridge, MA, USA, 2005. [Google Scholar]
- Nnamdi, O. Strategies for Managing Excess and Dead Inventories: A Case Study of Spare Parts Inventories in the Elevator Equipment Industry. Oper. Supply Chain Manag. 2018, 11, 128–139. [Google Scholar] [CrossRef] [Scilit]
- Ocaña, C.; Zemel, E. Learning from Mistakes: A Note on Just-in-Time Systems. Oper. Res. 1996, 44, 206–214. [Google Scholar] [CrossRef] [Scilit]
- DeHoratius, N.; Raman, A. Inventory Record Inaccuracy: An Empirical Analysis. Manag. Sci. 2008, 45, 771–786. [Google Scholar] [CrossRef] [Scilit]
- Krafcik, J.F. Triumph of the Lean Production System. Sloan Manag. Rev. 1988, 30, 41–51. [Google Scholar]
- Kizgin, K.T.; Alp, S.; Aydin, N.; Yu, H. Machine learning-based sales forecasting during crises: Evidence from a Turkish women’s clothing retailer. Sci. Prog. 2025, 108, 368504241307719. [Google Scholar] [CrossRef] [Scilit]
- Araballi, S.; Devaki, P. A critical review of agri-food supply management with traceability and transparency using block-chain technology. In Intelligent Cyber Physical Systems and Internet of Things: ICoICI; Springer: Cham, Switzerland, 2023; pp. 239–250. [Google Scholar]
- Johnson, T.E.; Schmitt, T.G. Effectiveness of Earnings Per Share Forecasts. Financ. Manag. 1974, 3, 64. [Google Scholar] [CrossRef] [Scilit]
- Msimangira, K.A.; Venkatraman, S. Supply Chain Management Integration: Critical Problems and Solutions. Oper. Supply Chain Manag. Int. J. 2014, 7, 23–31. [Google Scholar] [CrossRef] [Scilit]
- Bhuvan, S. The Impact of AI and ML on Organizational Structure. ShodhKosh J. Vis. Perform. Arts 2024, 5, 1787–1800. [Google Scholar] [CrossRef] [Scilit]
- Wong, S.; Venkatraman, S. Financial Accounting Fraud Detection Using Business Intelligence. Asian Econ. Financ. Rev. 2015, 5, 1187–1207. [Google Scholar] [CrossRef] [Scilit]
- Chhajer, P.; Shah, M.; Kshirsagar, A. The applications of artificial neural networks, support vector machines, and long–short term memory for stock market prediction. Decis. Anal. J. 2022, 2, 100015. [Google Scholar] [CrossRef] [Scilit]
- Bhattacharjee, D.; Ramesh, K.; Jayaram, E.S.; Mathad, M.S.; Puhan, D. An integrated machine learning and DEMATEL approach for feature preference and purchase intention modelling. Decis. Anal. J. 2023, 6, 100171. [Google Scholar] [CrossRef] [Scilit]
- Aygün, B.; Kabakçı Günay, E. Comparison of Statistical and Machine Learning Algorithms for Forecasting Daily Bitcoin Returns. Eur. J. Sci. Technol. 2021, 21, 444–454. [Google Scholar]
- Afriyie, J.K.; Tawiah, K.; Pels, W.A.; Addai-Henne, S.; Dwamena, H.A.; Owiredu, E.O.; Ayeh, S.A.; Eshun, J. A supervised machine learning algorithm for detecting and predicting fraud in credit card transactions. Decis. Anal. J. 2023, 6, 100163. [Google Scholar] [CrossRef] [Scilit]
- Amin, E. Financial fraud detection of the Egyptian companies’ annual reports using artificial bee colony algorithm. Int. J. Bus. Data Anal. 2019, 1, 184–201. [Google Scholar] [CrossRef] [Scilit]
- Rakshit, S.; Aslani, B.; Rajah, E.; Vajjhala, N.R. Exploring the role of artificial intelligence and machine learning for financial intelligence in Nigeria. In Proceedings of the International Conference on Innovative Computing & Communication (ICICC), Delhi, India, 20–21 February 2021. [Google Scholar]
- Durai, S.K.S.; Shamili, M.D. Smart farming using Machine Learning and Deep Learning techniques. Decis. Anal. J. 2022, 3, 100041. [Google Scholar] [CrossRef] [Scilit]
- Pagano, D. A predictive maintenance model using Long Short-Term Memory Neural Networks and Bayesian inference. Decis. Anal. J. 2023, 6, 100174. [Google Scholar] [CrossRef] [Scilit]
- Das, D.; Kayal, P.; Maiti, M. A K-means clustering model for analyzing the Bitcoin extreme value returns. Decis. Anal. J. 2023, 6, 100152. [Google Scholar] [CrossRef] [Scilit]
- Chan, K.C.; Li, K.; Li, T.; Zhang, W. Brand capital and corporate investment efficiency. Eur. Financ. Manag. 2024, 31, 909–951. [Google Scholar] [CrossRef] [Scilit]
- Dwivedi, Y.K.; Hughes, L.; Ismagilova, E.; Aarts, G.; Coombs, C.; Crick, T.; Duan, Y.; Dwivedi, R.; Edwards, J.; Eirug, A.; et al. Artificial Intelligence (AI): Multidisciplinary perspectives on emerging challenges, opportunities, and agenda for research, practice and policy. Int. J. Inf. Manag. 2021, 57, 101994. [Google Scholar] [CrossRef] [Scilit]
- Hassan, Z.; Khreich, W.; Osman, I.H. An international social inclusion index with application in the organization for economic co-operation and development countries. Decis. Anal. J. 2022, 3, 100047. [Google Scholar] [CrossRef] [Scilit]
- Luo, Y.; Cui, H.; Zhong, H.; Wei, C. Business environment and enterprise digital transformation. Financ. Res. Lett. 2023, 57, 104250. [Google Scholar] [CrossRef] [Scilit]
- Chakri, P.; Pratap, S.; Lakshay; Gouda, S.K. An exploratory data analysis approach for analyzing financial accounting data using machine learning. Decis. Anal. J. 2023, 7, 100212. [Google Scholar] [CrossRef] [Scilit]
- Gupta, S.; Chatterjee, P.; Rastogi, R.; Gonzalez, E.D.S. A Delphi fuzzy analytic hierarchy process framework for criteria classification and prioritization in food supply chains under uncertainty. Decis. Anal. J. 2023, 7, 100217. [Google Scholar] [CrossRef] [Scilit]





| (Market Capitalisation)—July 2025 | ||
|---|---|---|
| Range | Number of Companies | Percentages of Companies |
| Australian $ (A$) | N = 119 | 100% |
| 1–100 million | 90 | 75.63 |
| 101 million–1 billion | 15 | 12.61 |
| 1.1 billion–10 billion | 12 | 10.08 |
| Greater than 10 billion | 2 | 1.68 |
| Range | Number of Companies | Percentages of Companies |
|---|---|---|
| Australian $ (A$) | N = 119 | 100% |
| 00–100,000 | 41 | 34.45 |
| 101–700,000 | 25 | 21.01 |
| 701–2,000,000 | 14 | 11.77 |
| 2,000,001–10,000,000 | 15 | 12.61 |
| 10,000,001–50,000,000 | 10 | 8.4 |
| 50,000,001–200,000,000 | 5 | 4.2 |
| 200,000,001–1,000,000,000 | 2 | 1.68 |
| 1,000,000,001–0,000,000,000 | 5 | 4.2 |
| 30,000,000,001–40 billion | 2 | 1.68 |
| Net Profit A$ | Frequency | Percentage |
|---|---|---|
| (Loss) | N = 119 | 100% |
| (20.00)–(100,000) | 2 | 1. 68 |
| (100,001)–(1,000,000) | 21 | 14.29 |
| (1,000,001)–(10,000,000) | 56 | 47.06 |
| (10,000,001)–(30,000,000) | 12 | 10.09 |
| (30,000,001)–(120,000,000) | 4 | 3.36 |
| (120,000,001)–(480,000,000) | 2 | 1.68 |
| 50,000–100,000 | 1 | 0.84 |
| 100,001–500,000 | 1 | 0.84 |
| 500,001–1,000,000 | 1 | 0.84 |
| 1,000,001–10,000,000 | 9 | 7.56 |
| 10,000,001–100,000,000 | 7 | 5.88 |
| 100,000,001–500,000,000 | 4 | 3.36 |
| 500,000,001–1,000,000,000 | 0 | 0.00 |
| 1,000,000,001–10,000,000,000 | 3 | 2.52 |
| Range | Frequency | Percentage |
|---|---|---|
| Profit (Loss) | N = 119 | 100% |
| (0.10)–(10.00) | 67 | 56.3 |
| (11.00)–(50.00) | 23 | 19.33 |
| (51.00)–(120.00) | 3 | 2.52 |
| (121.00)–(250.00) | 4 | 3.36 |
| (251.00)–(1200.00) | 2 | 1.68 |
| (1201.00)–(2500.00) | 0 | 0.0 |
| (2501.00)–(3500.00) | 1 | 0.84 |
| 0.05–10.00 | 13 | 10.93 |
| 11.00–30.00 | 1 | 0.84 |
| 31.00–100.00 | 1 | 0.84 |
| 101.00–600.00 | 1 | 0.84 |
| 601.00–1200.00 | 3 | 2.52 |
| Range | Frequency | Percentage |
|---|---|---|
| A$(Negative) | N = 119 | 100% |
| (0.001)–(0.01) | 44 | 36.97 |
| (0.011)–(0.04) | 20 | 16.81 |
| (0.041)–(0.260) | 9 | 7.56 |
| (4.00)–(5.00) | 1 | 0.84 |
| 0.000–0.100 | 34 | 28.58 |
| 0.101–0.600 | 5 | 4.20 |
| 0.601–1.000 | 4 | 3.36 |
| 1.001–5.000 | 1 | |
| 5.001–12.000 | 1 | 0.84 |
| Coefficients a | |||||||
|---|---|---|---|---|---|---|---|
| Independent Variable (Predictor) | Unstandardised B | Std. Error | Standardized Beta | t | Sig. | Tolerance | VIF |
| Constant | −0.022 | 0.107 | — | −0.204 | 0.839 | — | — |
| Revenue | −1.917 × 10⁻¹¹ | 0 | −0.073 | −0.747 | 0.457 | 0.736 | 1.358 |
| Net Profit | −1.588 × 10⁻⁹ | 0 | −0.701 | −2.23 | 0.028 | 0.072 | 13.944 |
| Cash Flow per Share | 0.001 | 0.001 | 0.227 | 1.39 | 0.167 | 0.267 | 3.746 |
| Market Capitalisation | 2.158 × 10⁻¹⁰ | 0 | 1.284 | 3.549 | <0.001 | 0.054 | 18.457 |
| Collinearity Diagnostics a | ||||||||
|---|---|---|---|---|---|---|---|---|
| Model | Dimension | Eigenvalue | Condition Index | (Constant) | Revenue | Net Profit | Cash Flow per Share | Market Capitalisation |
| 1 | 1 | 3.099 | 1.000 | 0.01 | 0.03 | 0.01 | 0.02 | 0.01 |
| 2 | 0.999 | 1.761 | 0.80 | 0.04 | 0.00 | 0.01 | 0.00 | |
| 3 | 0.666 | 2.158 | 0.14 | 0.86 | 0.00 | 0.01 | 0.00 | |
| 4 | 0.205 | 3.888 | 0.02 | 0.00 | 0.09 | 0.85 | 0.02 | |
| 5 | 0.031 | 9.936 | 0.04 | 0.07 | 0.90 | 0.10 | 0.97 | |
| Residuals Statistics a | |||||
|---|---|---|---|---|---|
| Minimum | Maximum | Mean | Std. Deviation | N | |
| Predicted Value | −0.08579 | 4.20321 | 0.11543 | 532,617 | 119 |
| Residual | −4.875669 | 10.004580 | 0.000000 | 1.095120 | 119 |
| Std. Predicted Value | −0.378 | 7.675 | 0.000 | 1.000 | 119 |
| Std. Residual | −4.376 | 8.979 | 0.000 | 983 | 119 |
| Model | R | R Square | Adjusted R Square | Std. Error of the Estimate |
|---|---|---|---|---|
| 1 | 0.319 a | 0.102 | 0.079 | 1.168978 |
| ANOVA a | ||||||
|---|---|---|---|---|---|---|
| Model | Source | Sum of Squares | df | Mean Square | F | Sig. |
| 1 | Regression | 17.842 | 3 | 5.947 | 4.352 | 0.006 b |
| Residual | 157.149 | 115 | 1.367 | |||
| Total | 174.990 | 118 | ||||
| Coefficients a | |||||||
|---|---|---|---|---|---|---|---|
| Model | Unstandardized Coefficients Std Coefficients | ||||||
| B | Std Error | Beta | t | Sig. | Tolerance | VIF | |
| (Constant) | 0.061 | 0.110 | — | 0.552 | 0.582 | — | — |
| Revenue | 7.408 × 10⁻¹² | 0.000 | 0.028 | 0.288 | 0.774 | 0.805 | 1.242 |
| Net Profit | 6.419 × 10⁻¹⁰ | 0.000 | 0.284 | 1.827 | 0.070 | 0.324 | 3.084 |
| Cash Flow per Share | −9.010 × 10⁻⁵ | 0.001 | −0.027 | −0.176 | 0.861 | 0.330 | 3.026 |
| Collinearity Diagnostics a | ||||||
|---|---|---|---|---|---|---|
| Dimension | Eigenvalue | Condition Index | Constant | Revenue | Net Profit | Cash Flow per Share |
| 1 | 2.184 | 1.000 | 0.02 | 0.08 | 0.05 | 0.05 |
| 2 | 0.989 | 1.486 | 0.85 | 0.02 | 0.01 | 0.02 |
| 3 | 0.645 | 1.840 | 0.13 | 0.89 | 0.04 | 0.05 |
| 4 | 0.182 | 3.466 | 0.01 | 0.00 | 0.90 | 0.88 |
| Descriptive Statistics | |||
|---|---|---|---|
| Variable | Mean | Std. Deviation | N |
| Earnings per Share | 0.11543 | 1.217772 | 119 |
| Revenue | 916,176,442.06 | 4,656,977,320.60 | 119 |
| Variable | Earnings per Share | Revenue | |
|---|---|---|---|
| Pearson Correlation | Earnings per Share | 1 | 0.161 |
| Revenue | 0.161 | 1 | |
| Sig. (1-tailed) | Earnings per Share | — | 0.04 |
| Revenue | 0.04 | — | |
| N | Earnings per Share | 119 | 119 |
| Revenue | 119 | 119 |
| Model | R | R Square | Adjusted R Square | Std. Error of the Estimate | R Square Change | F Change | df1 | df2 | Sig. F Change |
|---|---|---|---|---|---|---|---|---|---|
| 1 | 0.161 a | 0.026 | 0.018 | 1.206989 | 0.026 | 3.118 | 1 | 117 | 0.08 |
| ANOVA a | ||||||
|---|---|---|---|---|---|---|
| Model | Source | Sum of Squares | df | Mean Square | F | Sig. |
| 1 | Regression | 4.542 | 1 | 4.542 | 3.118 | 0.080 b |
| Residual | 170.448 | 117 | 1.457 | |||
| Total | 174.99 | 118 | ||||
| Coefficients a | ||||||
|---|---|---|---|---|---|---|
| Model | Variable | B | Std. Error | Beta | t | Sig. |
| 1 | (Constant) | 0.077 | 0.113 | — | 0.681 | 0.497 |
| REVENUE | 4.213 × 10⁻¹¹ | 0 | 0.161 | 1.766 | 0.08 | |
| Variable | Mean | Std. Deviation | N |
|---|---|---|---|
| Earnings per Share | 0.11543 | 1.217772 | 119 |
| Net Profit | 70,669,223.47 | 53,784,438.06 | 119 |
| Variable | Earnings per Share | Net Profit | |
|---|---|---|---|
| Pearson Correlation | Earnings per Share | 1 | 0.318 |
| Net Profit | 0.318 | 1 | |
| Sig. (1-tailed) | Earnings per Share | — | |
| Net Profit | 0 | — | |
| N | Earnings per Share | 119 | 119 |
| Net Profit | 119 | 119 |
| Model | R | R Square | Adjusted R Square | Std. Error of the Estimate | R Square Change | F Change | df1 | df2 | Sig. F Change |
|---|---|---|---|---|---|---|---|---|---|
| 1 | 0.318 a | 0.101 | 0.093 | 1.159584 | 0.101 | 13.14 | 1 | 117 |
| ANOVA a | ||||||
|---|---|---|---|---|---|---|
| Model | Source | Sum of Squares | df | Mean Square | F | Sig. |
| 1 | Regression | 17.668 | 1 | 17.668 | 13.140 | <0.001 b |
| Residual | 157.322 | 117 | 1.345 | |||
| Total | 174.99 | 118 | ||||
| Coefficients a | ||||||
|---|---|---|---|---|---|---|
| Model | Variable | B | Std. Error | Beta | t | Sig. |
| 1 | (Constant) | 0.65 | 107 | — | 0.602 | 0.548 |
| Net Profit | 7.194 × 10⁻¹⁰ | 0 | 0.318 | 3.625 | <0.01 | |
| Variable | Mean | Std. Deviation | N |
|---|---|---|---|
| Earnings per Share | 0.11543 | 1.217772 | 119 |
| Cash Flow per Share | −30.5539 | 365.85366 | 119 |
| Pearson Correlation | Earnings per Share | 1 | 0.270 |
| Cash Flow per Share | −0.270 | 1 | |
| Sig. (1-tailed) | Earnings per Share | — | 0.001 |
| Cash Flow per Share | 0.001 | — | |
| N | Earnings per Share | 119 | 119 |
| Cash Flow per Share | 119 | 119 |
| Model | R | R Square | Adjusted R Square | Std. Error of the Estimate | R Square Change | F Change | df1 | df2 | Sig. F Change |
|---|---|---|---|---|---|---|---|---|---|
| 1 | 0.270 a | 0.073 | 0.065 | 1.177577 | 0.073 | 9.193 | 1 | 117 | 0.003 |
| ANOVA a | ||||||
|---|---|---|---|---|---|---|
| Model | Source | Sum of Squares | df | Mean Square | F | Sig. |
| 1 | Regression | 12.748 | 1 | 12.748 | 9.193 | 0.003 b |
| Residual | 162.242 | 117 | 1.387 | |||
| Total | 174.99 | 118 | ||||
| Coefficients a | ||||||||
|---|---|---|---|---|---|---|---|---|
| Model | B | Std. Error | Beta | t | Sig. | Zero-Order | Partial | Part |
| (Constant) | 0.088 | 0.108 | — | 0.812 | 0.418 | — | — | — |
| Cash Flow Per Share | −0.001 | 0 | −0.270 | −3.032 | 0.003 | −0.270 | −0.270 | −0.270 |
| Variable | Mean | Std. Deviation | N |
|---|---|---|---|
| Earnings per Share | 0.11543 | 1.217772 | 119 |
| Cash Flow per Share | −30.5539 | 365.85366 | 119 |
| Revenue | 916,176,442.06 | 4,656,977,320.60 | 119 |
| Net Profit | 70,669,223.47 | 53,784,438.06 | 119 |
| Earnings per Share | Cash Flow per Share | Revenue | Net Profit | |
|---|---|---|---|---|
| Pearson Correlation | ||||
| EARNINGS PER SHARE | 1 | −0.270 | 0.161 | 0.318 |
| CASH FLOW PER SHARE | −0.270 | 1 | −0.411 | −0.815 |
| REVENUE | 0.161 | −0.411 | 1 | 0.429 |
| NET PROFIT | 0.318 | −0.815 | 0.429 | 1 |
| Sig. (1-tailed) | ||||
| EARNINGS PER SHARE | . | 0.001 | 0.04 | <0.001 |
| CASH FLOW PER SHARE | 0.001 | . | 0 | 0 |
| REVENUE | 0.04 | 0 | . | 0 |
| NET PROFIT | 0 | 0 | 0 | . |
| N | ||||
| EARNINGS PER SHARE | 119 | 119 | 119 | 119 |
| CASH FLOW PER SHARE | 119 | 119 | 119 | 119 |
| REVENUE | 119 | 119 | 119 | 119 |
| NET PROFIT | 119 | 119 | 119 | 119 |
| Model | R | R Square | Adjusted R Square | Std. Error of the Estimate | R Square Change | F Change | df1 | df2 | Sig. F Change |
|---|---|---|---|---|---|---|---|---|---|
| 1 | 0.319 a | 1.02 | 0.079 | 1.168978 | 1.02 | 4.352 | 3 | 115 | 0.006 |
| ANOVA a | ||||||
|---|---|---|---|---|---|---|
| Model | Source | Sum of Squares | df | Mean Square | F | Sig. |
| 1 | Regression | 12.842 | 3 | 5.947 | 4.352 | 0.006 b |
| Residual | 157.149 | 115 | 1.387 | |||
| Total | 174.99 | 118 | ||||
| Coefficients a | ||||||||
|---|---|---|---|---|---|---|---|---|
| Model | Unstandardised Coefficients | Standardised Coefficients | Correlations | |||||
| B | Std. Error | Beta | t | Sig. | Zero-Order | Partial | Part | |
| (Constant) | 0.061 | 0.11 | — | 0.552 | 0.582 | — | — | — |
| Cash Flow Per Share | −9.010 × 10⁻⁵ | 0.001 | −0.027 | −0.176 | 0.861 | −0.270 | −0.016 | −0.016 |
| Revenue | 7.408 × 10⁻¹² | 0 | 0.028 | 0.288 | 0.774 | 0.161 | 0.027 | 0.025 |
| Net Profit | 6.419 × 10⁻¹⁰ | 0 | 0.284 | 1.827 | 0.07 | 0.318 | 0.168 | 0.161 |
| Model Summary | ||||
|---|---|---|---|---|
| Model | R | R Square | Adjusted R Square | Std. Error of the Estimate |
| 1 | 0.437 a | 0.191 | 0.163 | 1.114167 |
| ANOVA a | |||||
|---|---|---|---|---|---|
| Model | Sum of Squares | df | Mean Square | F | Sig. |
| Regression | 33.474 | 4 | 8.369 | 6.741 | <0.001 b |
| Residual | 141.516 | 114 | 1.241 | ||
| Total | 174.99 | 118 | |||
| Hypothesis Testing a | ||||
|---|---|---|---|---|
| Independent Variables (Predictors) | Pearson R | p-Values | Hypothesis | Results |
| Revenue (R) | 0.161 | 0.040 | H1 | Weakly supported |
| Net profit (NP) | 0.318 | <0.001 | H2 | Supported |
| Cash flow per share (CF) | −0.270 | 0.001 | H3 | Not supported |
| Combined variables: | ||||
| R, NP, and CF | 0.318 | <0.001 | H4 | Supported |
| Revenue | Net Profit | Cash Flow per Share | Earnings per Share | Market Capitalisation | |
|---|---|---|---|---|---|
| Revenue—Pearson | 1 | 0.429 ** | −0.411 ** | 0.161 * | 0.489 ** |
| Revenue—Sig. | — | <0.001 | <0.001 | 0.04 | <0.001 |
| Revenue—N | 119 | 119 | 119 | 119 | 119 |
| Net Profit—Pearson | 0.429 ** | 1 | −0.815 ** | 0.318 ** | 0.962 ** |
| Net Profit—Sig. | <0.001 | — | <0.001 | <0.001 | <0.001 |
| Net Profit—N | 119 | 119 | 119 | 119 | 119 |
| Cash Flow Per Share—Pearson | −0.411 ** | −0.815 ** | 1 | −0.270 ** | −0.856 ** |
| Cash Flow Per Share—Sig. | <0.001 | <0.001 | — | 0.001 | <0.001 |
| Cash Flow Per Share—N | 119 | 119 | 119 | 119 | 119 |
| Earnings Per Share—Pearson | 0.161 * | 0.318 ** | −0.270 ** | 1 | 0.379 ** |
| Earnings Per Share—Sig. | 0.04 | <0.001 | 0.001 | — | <0.001 |
| Earnings Per Share—N | 119 | 119 | 119 | 119 | 119 |
| Market Capitalisation—Pearson | 0.489 ** | 0.962 ** | −0.856 ** | 0.379 ** | 1 |
| Market Capitalisation—Sig. | <0.001 | <0.001 | <0.001 | <0.001 | — |
| Market Capitalisation—N | 119 | 119 | 119 | 119 | 119 |
| Independent Variables (Predictors) | Pearson R | p-Values | Hypothesis | Results |
|---|---|---|---|---|
| Revenue (R) | 0.161 | 0.040 | H1 | Weakly supported |
| Net profit (NP) | 0.318 | <0.001 | H2 | Supported |
| Cash flow per share (CF) | −0.270 | 0.001 | H3 | Not supported |
| Combined variables:R, NP, and CF | 0.318 | <0.001 | H4 | Supported |
| Market capitalisation (MC) | 0.379 | <0.001 | H5 | Supported |
Disclaimer/Publisher’s Note: The statements, opinions and data contained in all publications are solely those of the individual author(s) and contributor(s) and not of MDPI and/or the editor(s). MDPI and/or the editor(s) disclaim responsibility for any injury to people or property resulting from any ideas, methods, instructions or products referred to in the content. |
© 2026 by the authors. Licensee MDPI, Basel, Switzerland. This article is an open access article distributed under the terms and conditions of the Creative Commons Attribution (CC BY) license.
Share and Cite
Msimangira, K.A.B.; Wong, S.; Venkatraman, S. Re-Examining Organisational Performance: An Empirical Study on the Relationships Between Revenue, Net Profit, Cash Flow per Share, and Earnings per Share in Australian Energy Firms. Information 2026, 17, 391. https://doi.org/10.3390/info17040391
Msimangira KAB, Wong S, Venkatraman S. Re-Examining Organisational Performance: An Empirical Study on the Relationships Between Revenue, Net Profit, Cash Flow per Share, and Earnings per Share in Australian Energy Firms. Information. 2026; 17(4):391. https://doi.org/10.3390/info17040391
Chicago/Turabian StyleMsimangira, Kabossa A. B., Shirley Wong, and Sitalakshmi Venkatraman. 2026. "Re-Examining Organisational Performance: An Empirical Study on the Relationships Between Revenue, Net Profit, Cash Flow per Share, and Earnings per Share in Australian Energy Firms" Information 17, no. 4: 391. https://doi.org/10.3390/info17040391
APA StyleMsimangira, K. A. B., Wong, S., & Venkatraman, S. (2026). Re-Examining Organisational Performance: An Empirical Study on the Relationships Between Revenue, Net Profit, Cash Flow per Share, and Earnings per Share in Australian Energy Firms. Information, 17(4), 391. https://doi.org/10.3390/info17040391