Article

Information Quality and Audience Engagement of Cesarean Section-Related Videos on YouTube and Bilibili: A Cross-Platform Analysis

by
Gongxin Shen
1,
Lingxuan Wei
2,
Hanliang Tao
2,
Lexuan Chen
2,
Peng Chen
2,
Yuxin Li
2,
Siyuan Chang
1,* and
Dapeng Shen
2,*
1
The College of Information Engineering, Nanjing Polytechnic Institute, Nanjing 210048, China
2
The Clinical Medical College, Nanjing Medical University, Nanjing 211166, China
*
Authors to whom correspondence should be addressed.
Information 2026, 17(3), 273; https://doi.org/10.3390/info17030273
Submission received: 26 January 2026 / Revised: 26 February 2026 / Accepted: 6 March 2026 / Published: 10 March 2026
(This article belongs to the Special Issue Data Mining and Healthcare Informatics)

Abstract

(1) Background: C-section-related health information is increasingly disseminated through short video platforms such as YouTube and Bilibili, yet the quality and audience engagement of this content remain insufficiently understood. (2) Methods: A cross-sectional study analyzed the top 90 C-section-related videos from each platform (180 total). C-section video characteristics and engagement metrics were collected. Information quality and reliability were assessed using GQS, DISCERN, and JAMA benchmarks. Associations between quality scores and engagement indicators were examined using Spearman’s correlation analysis. (3) Results: YouTube videos were longer and more frequently produced by medical professionals. Although GQS scores were comparable, YouTube content demonstrated higher reliability, with significantly higher DISCERN and JAMA scores (p < 0.001). C-section engagement metrics were strongly intercorrelated but showed weak associations with objective quality measures. (4) Conclusions: Significant cross-platform disparities exist in C-section information quality, with a pronounced dissociation between clinical reliability and audience engagement. This “quality-popularity paradox” underscores a critical mismatch between evidence-based rigor and digital dissemination. Our findings necessitate multi-sectoral interventions, including standardized creator credentialing and algorithm recalibration, to align high-quality obstetric knowledge with public attention.

1. Introduction

Cesarean section (C-section) is a pivotal surgical intervention in modern obstetric practice, essential for safeguarding maternal and neonatal health when clinically indicated. Over the past several decades, global cesarean delivery rates have risen markedly, far exceeding earlier benchmarks and prompting ongoing public health debate. Worldwide C-section rates increased from approximately 7% in 1990 to over 20% by the late 2010s, with projections estimating that nearly 30% of births may be by C-section by 2030 in many regions, and an estimated 38 million cesarean births globally every year if current trends persist [1]. While lifesaving in emergencies such as fetal distress or placenta previa, the surge in medically unnecessary procedures carries significant risks of maternal morbidity and long-term surgical complications. This trend is increasingly driven by low health literacy and fear of childbirth, which shift patient preferences toward elective surgeries.
Concurrently, pregnant individuals and their families have become increasingly engaged in decisions regarding delivery mode, reflecting broader shifts toward patient-centered care and shared decision-making in obstetrics C-section [2]. These preferences are shaped not only by clinical consultation but also by the information environments to which they are exposed. Traditionally, patients relied predominantly on direct communication with healthcare providers and printed educational materials. However, as “digital natives,” a vast majority of pregnant women now utilize social media and video platforms as primary information sources—often as a “first-line” resource before formal medical interactions [3]. A substantial proportion of individuals report using social media and video platforms to explore health topics, often before or in lieu of formal clinical interaction [4,5].
Platforms such as YouTube and Bilibili have emerged as influential venues for disseminating perinatal and obstetric information, owing to their vast reach and multimodal content capabilities. By blending narrative, animation, and realistic scenarios, video content can convey complex procedural steps, perioperative considerations, and recovery expectations more intuitively than text alone, potentially reducing cognitive barriers and enhancing retention among lay audiences [6,7]. In general health communication research, exposure to online narratives and visual depictions has been shown to shape user knowledge, attitudes, and intentions regarding health behaviors, including delivery preferences and pain management strategies [8,9]. However, these platforms operate under divergent “structural affordances”—YouTube serves as a team-dominated global repository, while Bilibili fosters a community-driven “danmaku” (bullet comment) culture that creates a pseudo-synchronous learning environment.
Despite these potential benefits, digital health information environments pose significant challenges. The relatively low barrier to content creation and the absence of systematic peer review allow videos of uneven quality and scientific validity to proliferate [10]. Cremers et al. have documented that health education videos on major social platforms frequently lack comprehensive, evidence-based information and that metrics such as view counts or likes do not reliably correspond to informational accuracy [11,12]. Short-form health content studies have similarly found overall poor quality and completeness in medically relevant content, even when produced by professionals, raising concerns about user reliance on algorithm-recommended materials [13,14,15].
While prior research has evaluated online videos for various chronic conditions, systematic, cross-cultural assessments of C-section content remain remarkably limited [16,17]. Given the cultural and linguistic differences between Western and Eastern digital ecosystems, a comparative analysis is both timely and necessary. This study aims to evaluate C-section-related videos on YouTube and Bilibili using validated quality instruments (DISCERN, JAMA, GQS). By identifying patterns in information reliability and interactional dynamics, this research seeks to support pregnant individuals in navigating digital information critically and provide empirical evidence to optimize obstetric health communication.

2. Methods

2.1. Search Strategy and Data Extraction

To systematically collect and analyze user-generated video content related to cesarean delivery on major social media platforms, we developed a standardized cross-platform data collection protocol, consistent with previously published methodologies for online health information analysis [18,19,20].

2.2. Platform and Keyword Selection

Bilibili and YouTube were selected as the data source platforms, representing major video-sharing ecosystems in Chinese- and English-speaking internet environments, respectively. This dual-platform design has been widely used to enable cross-linguistic and cross-cultural comparisons of health information quality [19,21]. To capture both professional terminology and commonly used lay expressions, platform-specific keywords were predefined. On Bilibili, the Chinese terms “poufuchan” and “pougongchan” were used, while on YouTube, the English keywords “Caesarean” and “C-section” were applied.
To ensure the reproducibility of the study and minimize algorithmic bias, searches were conducted using a standardized protocol. All searches were performed in December 2025 using a clean browser (Incognito mode) with cleared cookies and cache, and without logging into any personal accounts to avoid personalized recommendation bias. For YouTube, the regional setting was set to ‘United States’ with the language as ‘English’ to capture global English-language content, while Bilibili utilized default regional settings for Mainland China.

2.3. Search Execution and Initial Sampling

All searches were conducted within a fixed 24 h period on 22 December 2025, to ensure temporal comparability and reduce bias related to daily content updates. To minimize the influence of personalization and recommendation algorithms, searches were performed using newly registered accounts with no browsing or viewing history, as recommended by prior social media content analyses [18,20]. Each keyword was searched independently on both platforms, with results sorted by the default “relevance” setting. After merging results and removing duplicates, the top 90 most relevant videos from each platform were selected, yielding an initial sample of 180 videos (90 per platform).
The decision to include the top 90 videos from each platform (total N = 180) was based on both practical feasibility and methodological precedents in social media health communication research. Prior studies have demonstrated that users rarely browse beyond the first few pages of search results; the top 90 videos represent approximately 4–5 pages of content, covering the vast majority of audience traffic and interaction [18].

Video Screening and Final Sample Determination

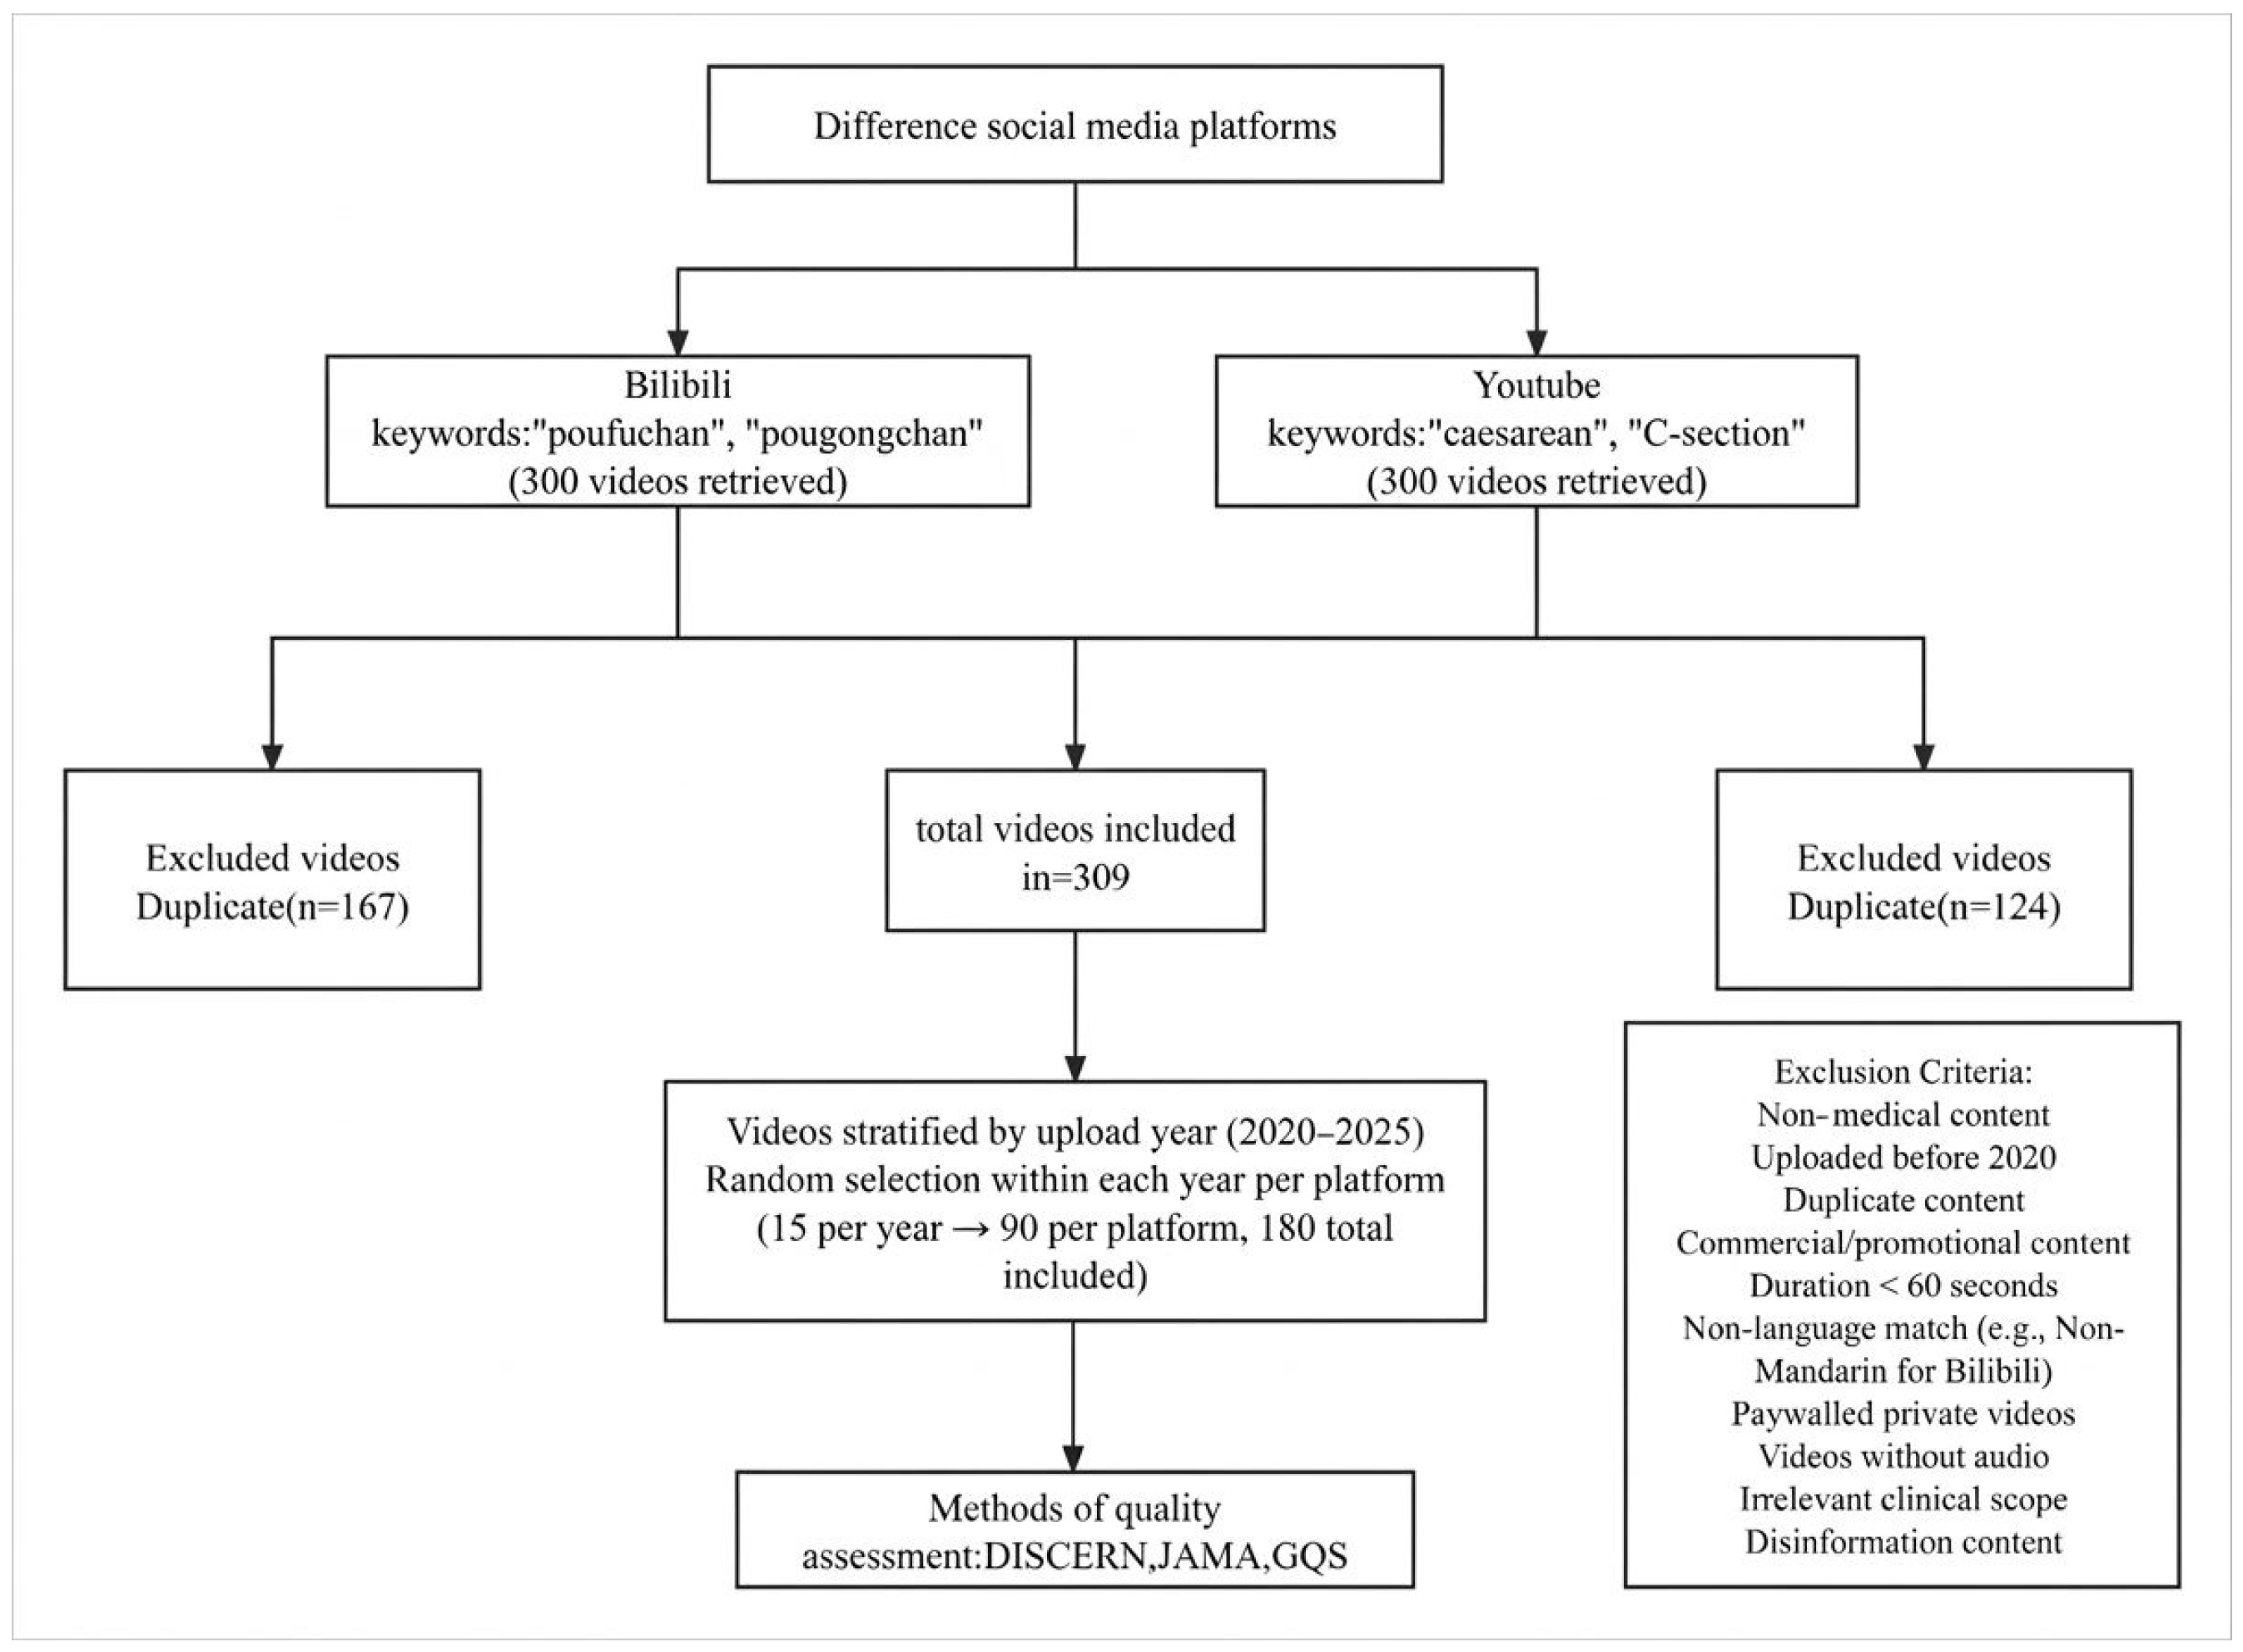
The initial sample pool was screened according to predefined inclusion and exclusion criteria adapted from established video quality assessment studies [19]. Following a structured screening process inspired by the PRISMA framework to ensure the transparency and reproducibility of the video filtering process, this study is positioned as a cross-sectional content analysis. The flowchart (Figure 1) illustrates the systematic identification, screening, and inclusion of videos, ensuring that the selection criteria were applied consistently across both YouTube and Bilibili. Videos were excluded if they:
  • were not directly related to human cesarean delivery;
  • had a duration of less than 60 s;
  • were paid, private, or archived live-stream content;
  • consisted primarily of commercial advertising or promotional material;
  • lacked identifiable uploader information;
  • were not in the target language of the platform;
  • represented duplicate content.
The final analytical sample consisted of 90 videos per platform (total N = 180), a size considered sufficient for descriptive and comparative analyses while remaining feasible for detailed manual coding.

2.4. Data Extraction

For each included video, the following variables were extracted:
Basic metadata: Time since publication, video duration, number of likes, number of comments, and channel subscriber count;
Source attributes: Platform verification status and uploader type (certified medical professionals, certified medical institutions, patients or family members, independent non-medical users, or news media organizations);
Content characteristics: Primary thematic focus (disease basics; clinical presentation and diagnosis; treatment strategies; complications; patient reporting) and presentation format (live recordings, animations, interview dialogues, or news reports).
All data extraction and classification were conducted independently by two trained researchers. Inter-rater reliability was assessed using Cohen’s Kappa coefficient, and disagreements were resolved by discussion or adjudication by a third researcher, following established methodological standards [18].

2.5. Videos Assessments

Video quality and reliability were evaluated using three validated instruments: the DISCERN tool, the Global Quality Scale (GQS), and the Journal of the American Medical Association (JAMA) benchmark criteria. These tools are widely used for assessing online health information and have demonstrated acceptable validity and reliability across multiple media formats [18].

2.5.1. DISCERN Tool

The DISCERN instrument was originally developed to evaluate the reliability of consumer health information. In this study, the first five items were applied to assess information reliability including clarity, source validity, balance and bias, provision of additional references, and acknowledgment of uncertainty. Each item was scored as 0 (“No”) or 1 (“Yes”), yielding a total score ranging from 0 to 5. Scores were categorized as Unreliable (0–1), Fairly Unreliable (2), Moderately Reliable (3), Fairly Reliable (4), and Reliable (5), consistent with previous video-based applications [18].

2.5.2. Global Quality Scale (GQS)

The GQS is a 5-point Likert scale used to provide an overall assessment of educational quality, usefulness, and information flow from a patient perspective. Scores range from 1 (poor quality) to 5 (excellent quality).

2.5.3. JAMA Benchmark Criteria

The JAMA benchmark criteria assess transparency and credibility across four domains: authorship, attribution, currency, and disclosure. Each domain was assigned one point if fulfilled, resulting in a total score of 0–4.
Two reviewers with medical backgrounds independently assessed all videos after standardized training, including pilot scoring. All assessments were conducted independently and blinded to each other’s results. Inter-rater reliability was evaluated using Cohen’s Kappa for GQS and JAMA scores and the intraclass correlation coefficient (ICC) for total DISCERN scores. Discrepancies were resolved through consensus with a senior reviewer.

2.6. Statistical Analysis

Statistical analyses were performed using IBM SPSS Statistics (version 29.0), with data visualization conducted using GraphPad Prism (version 10.0). Normality was assessed using the Shapiro–Wilk test [2]. As continuous variables did not follow a normal distribution, data are presented as medians and interquartile ranges (IQR), and non-parametric methods were applied.
The Mann–Whitney U test was used for comparisons between two independent groups, while the Kruskal–Wallis H test was applied for comparisons among three or more groups. Dunn’s post hoc tests with Bonferroni correction were used when appropriate. Inter-rater reliability was assessed using Cohen’s Kappa, and correlations were examined using Spearman’s rank correlation coefficient. A two-sided p value < 0.05 was considered statistically significant.

2.7. Ethical Considerations

This study analyzed publicly available videos and associated metadata from YouTube and Bilibili. No private, identifiable, or restricted-access information was collected. As a non-interventional secondary analysis of publicly accessible data, formal institutional ethics approval was not required. All procedures adhered to relevant ethical guidelines and platform terms of service, and findings are presented in an anonymized and aggregated manner.

3. Results

3.1. Video Characteristics

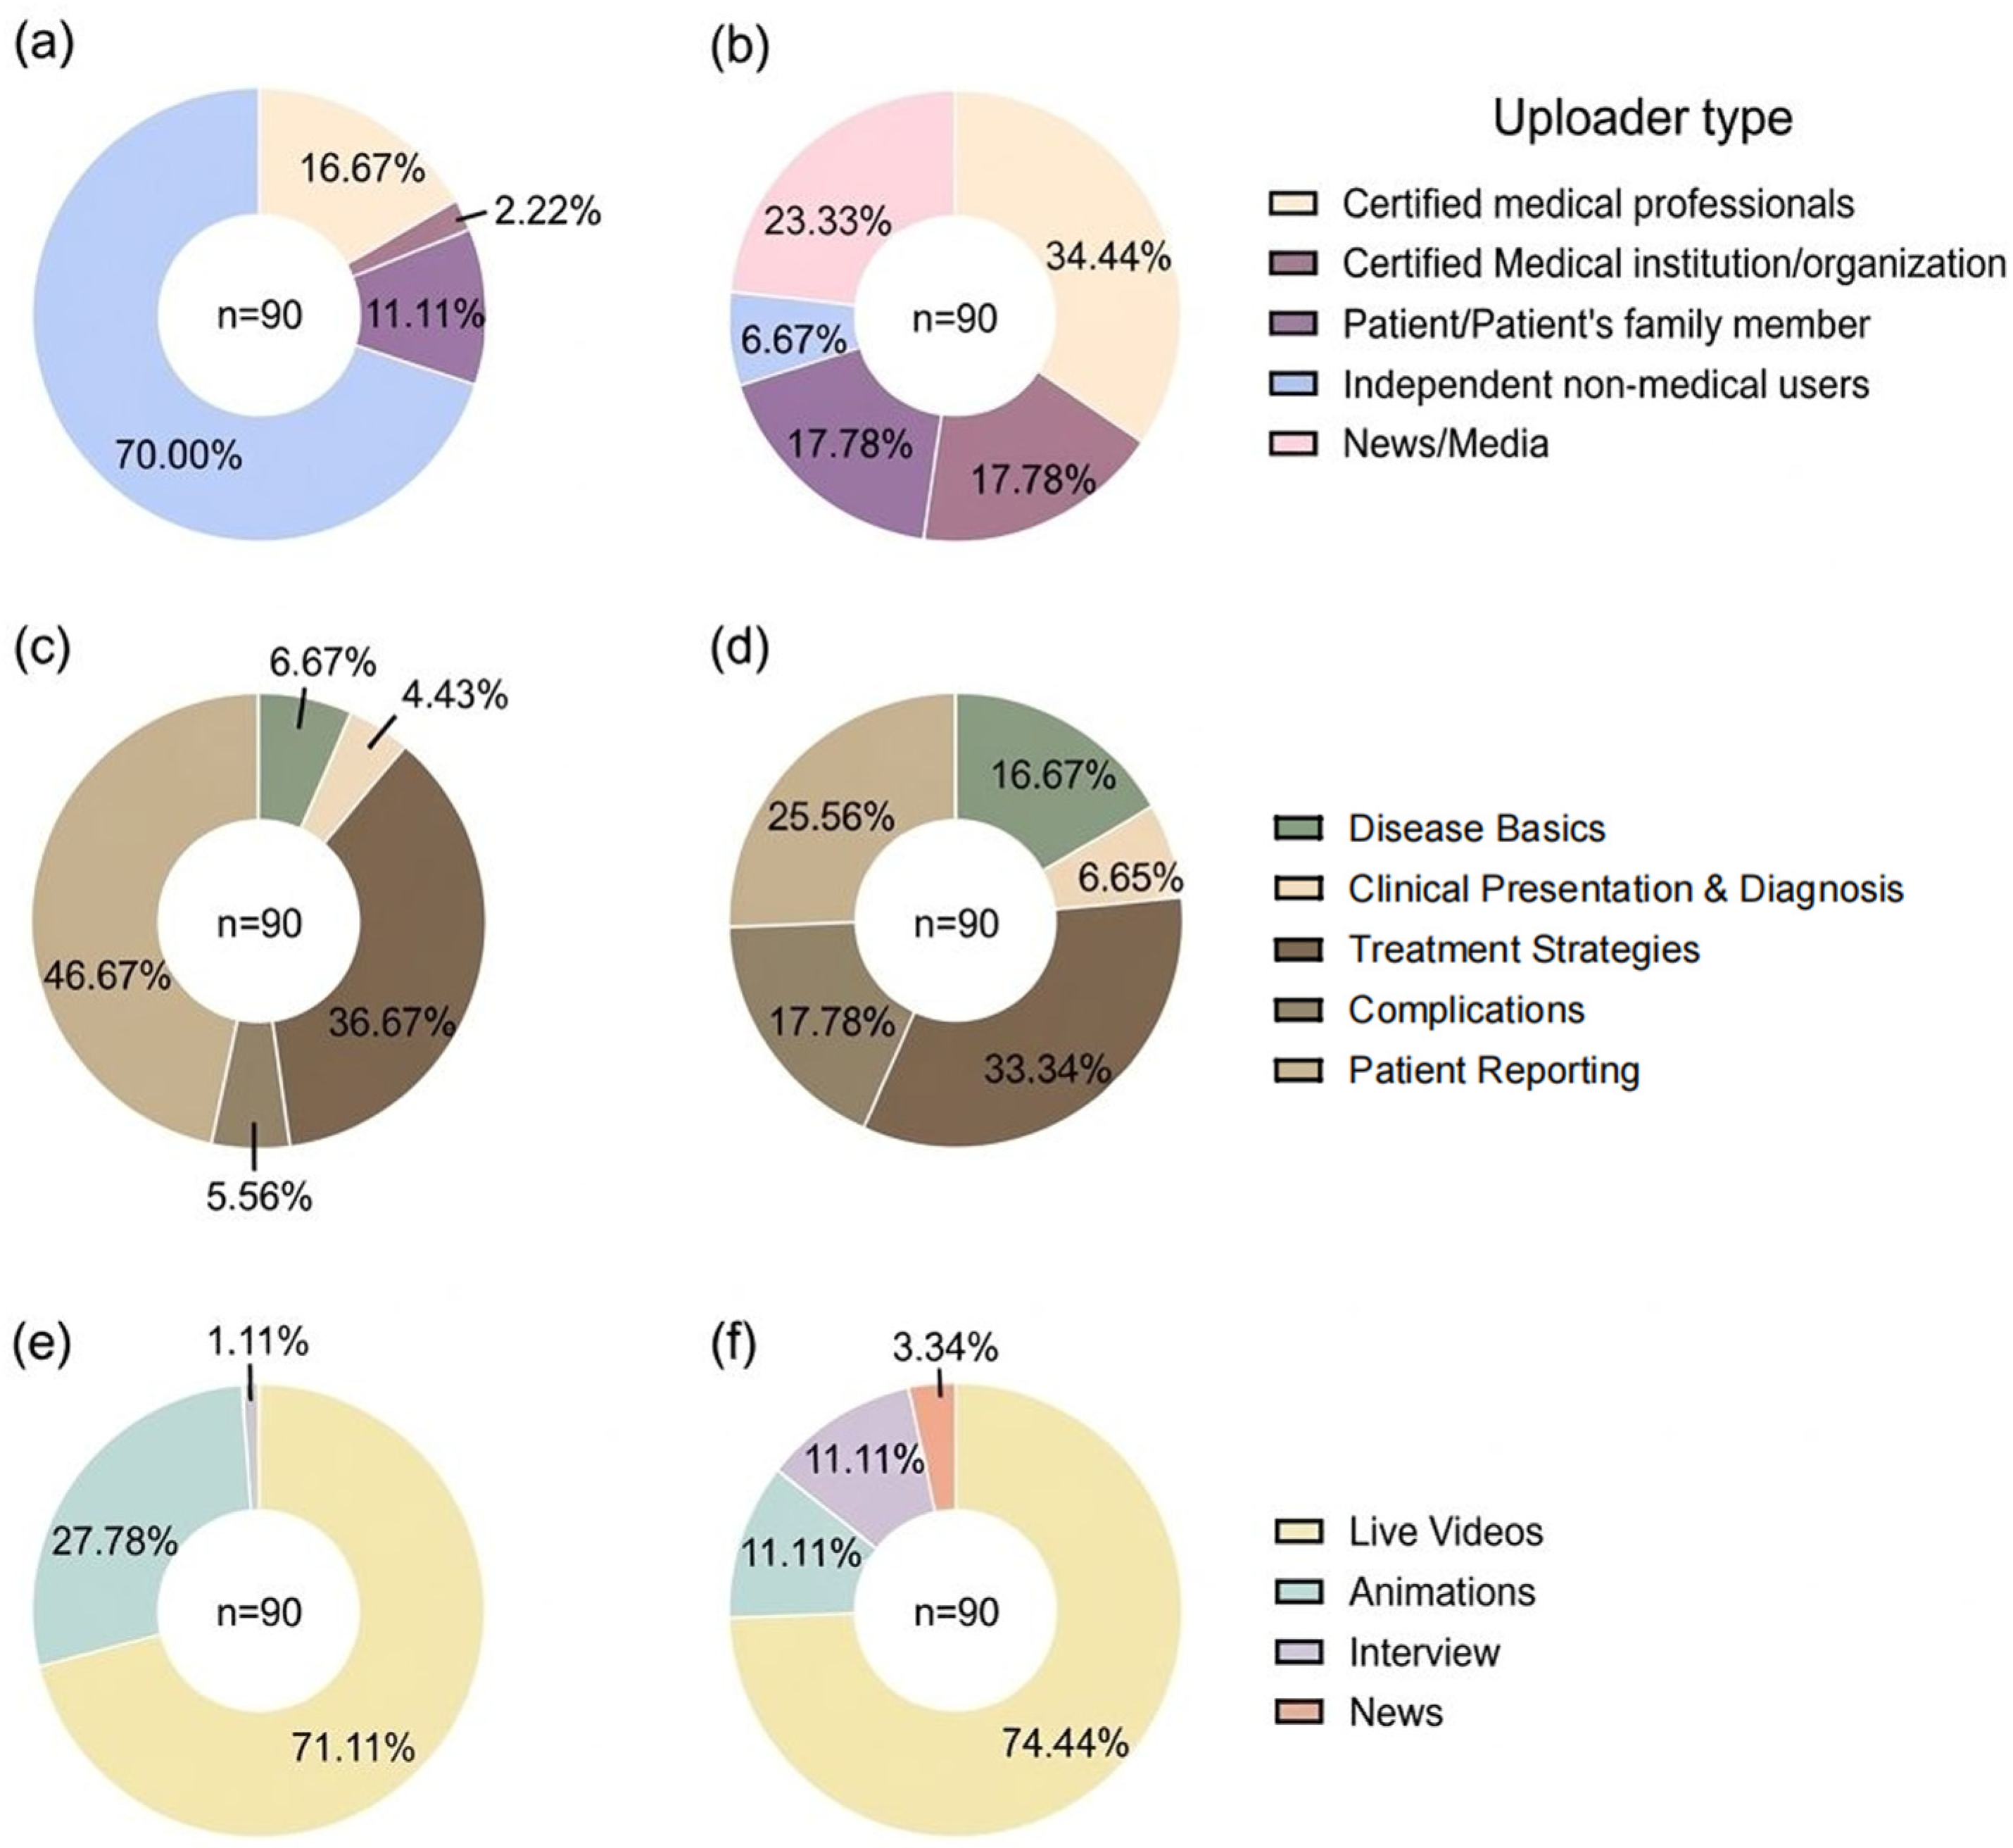
A total of 180 videos (90 from Bilibili and 90 from YouTube) were included in the analysis. Videos on YouTube were significantly longer but garnered fewer views compared to Bilibili, whereas the number of subscriptions was significantly higher on YouTube. No statistically significant differences were found in the counts of likes or comments. Video characteristics are presented in Table 1. Table 2 presents the categorical characteristics of the videos stratified by platform. Verified accounts constituted 44.44% (n = 40) of YouTube uploaders, compared to only 13.33% (n = 12) on Bilibili. In terms of video sources, content was predominantly uploaded by certified medical professionals, medical institutions/organizations, and news/media outlets on YouTube. In contrast, Bilibili was dominated by independent non-medical users. Among the video content, while patient reporting and treatment strategies were common categories on both platforms, videos covering disease basics and complications were more prevalent on YouTube compared to Bilibili. Regarding video format, live streaming was the predominant format on Bilibili (71.11%, n = 64), while animated videos were most common on YouTube (74.44%, n = 67). The breakdown of these characteristics is detailed in Figure 2.

3.2. Video Quality and Reliability Assessment

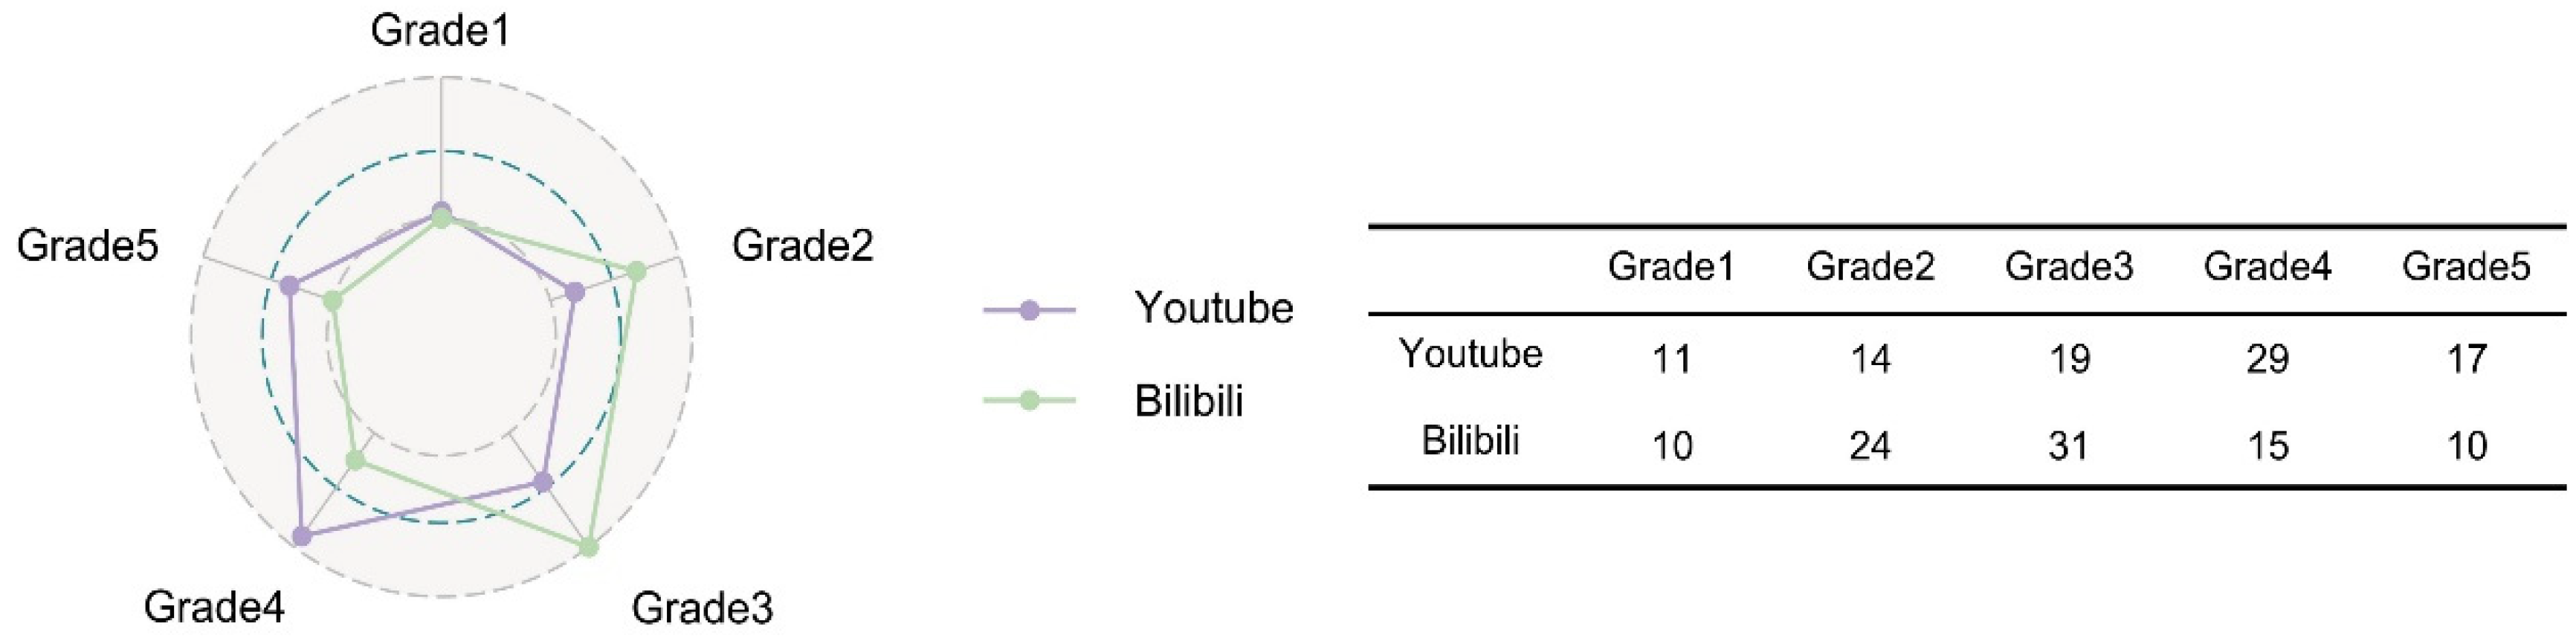
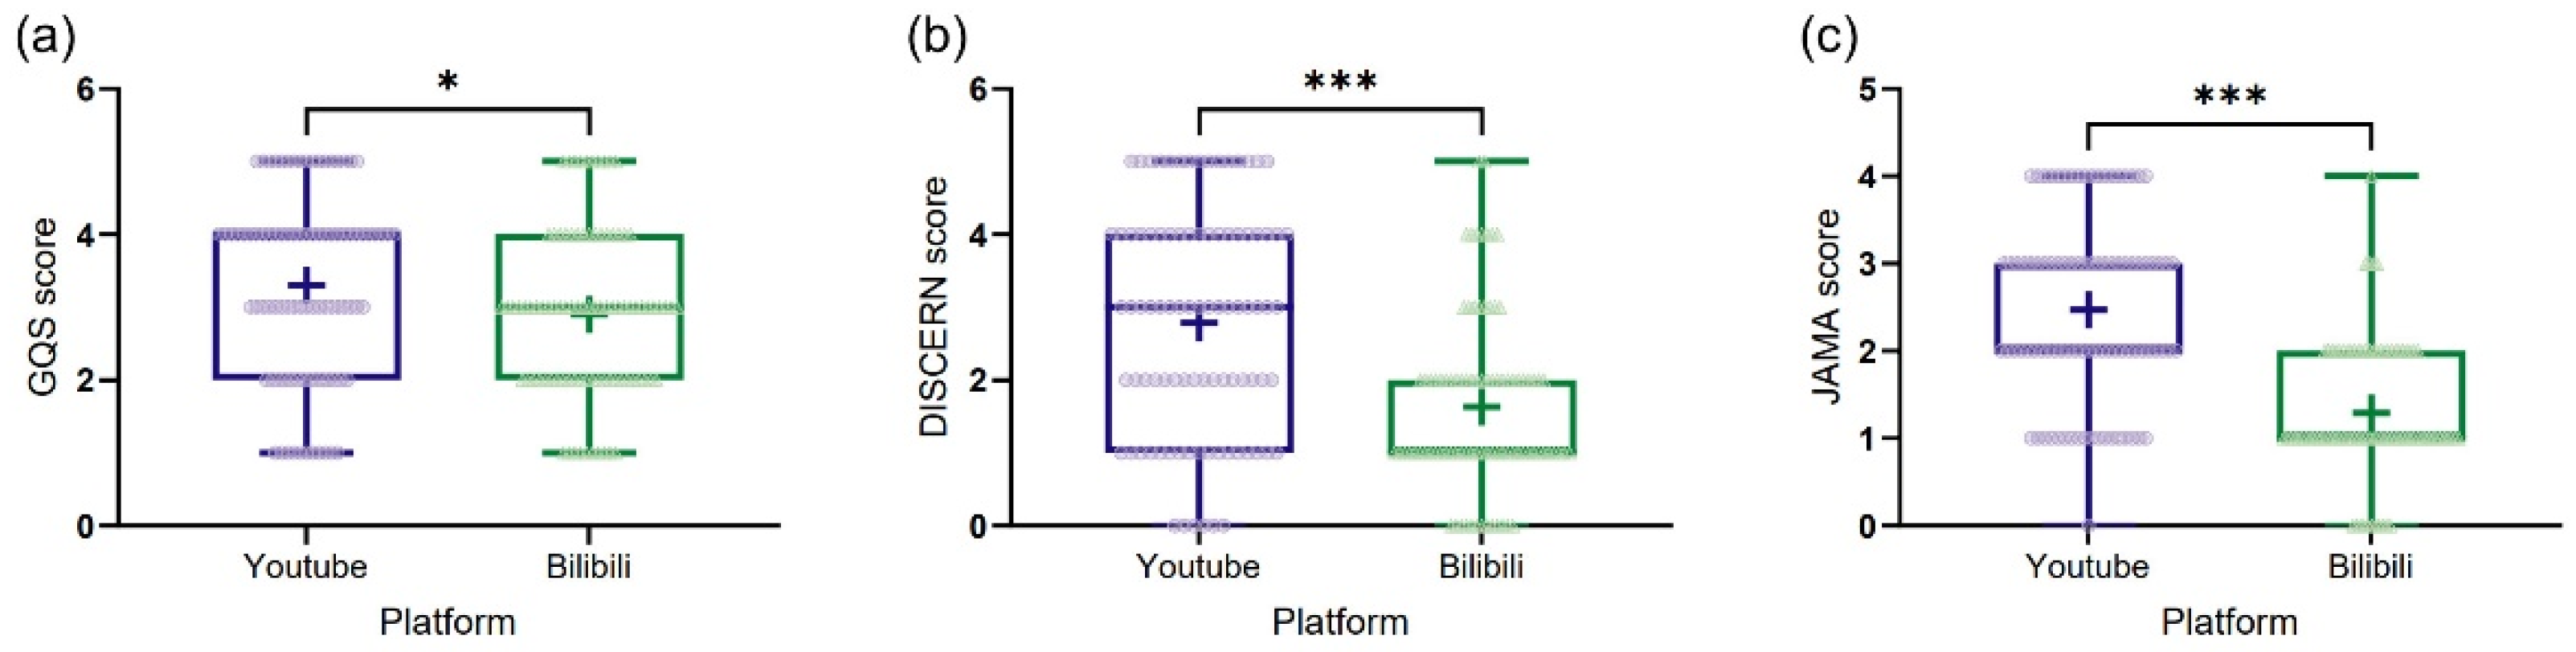
Video quality assessment revealed clear but nuanced differences between platforms. As illustrated in Figure 3, boxplot comparisons showed that videos on YouTube achieved significantly higher DISCERN and JAMA scores than those on Bilibili, indicating stronger performance in information reliability and transparency. Although median GQS scores were comparable, the small yet statistically significant difference suggests that perceived educational quality alone may not fully capture underlying differences in content rigor. The distribution of overall quality grades further contextualizes these findings. As shown in Figure 4, both platforms exhibited a similar “low–high–low” pattern across quality grades; however, YouTube videos were more frequently classified into higher grades, with a peak at Grade 4, whereas Bilibili videos clustered predominantly at Grade 3. This shift toward moderate-quality content on Bilibili suggests that while many videos are informative at a basic level, fewer meet higher standards of completeness and balance.
Item-level analysis in Table 3 helps explain this divergence. YouTube videos more consistently fulfilled key DISCERN and JAMA criteria, particularly in source citation, balanced presentation, and authorship identification. In contrast, Bilibili videos less frequently provided explicit references or disclosures, despite often presenting engaging and experience-based narratives. Notably, disclosure-related items scored poorly on both platforms, highlighting a common weakness in transparency regardless of platform context.
Inter-rater agreement for all quality assessments was excellent (Cohen’s κ = 0.88), supporting the robustness of these findings. Overall, the observed differences appear to be driven less by general presentation quality and more by structural elements related to credibility and information sourcing, which vary systematically between platforms.
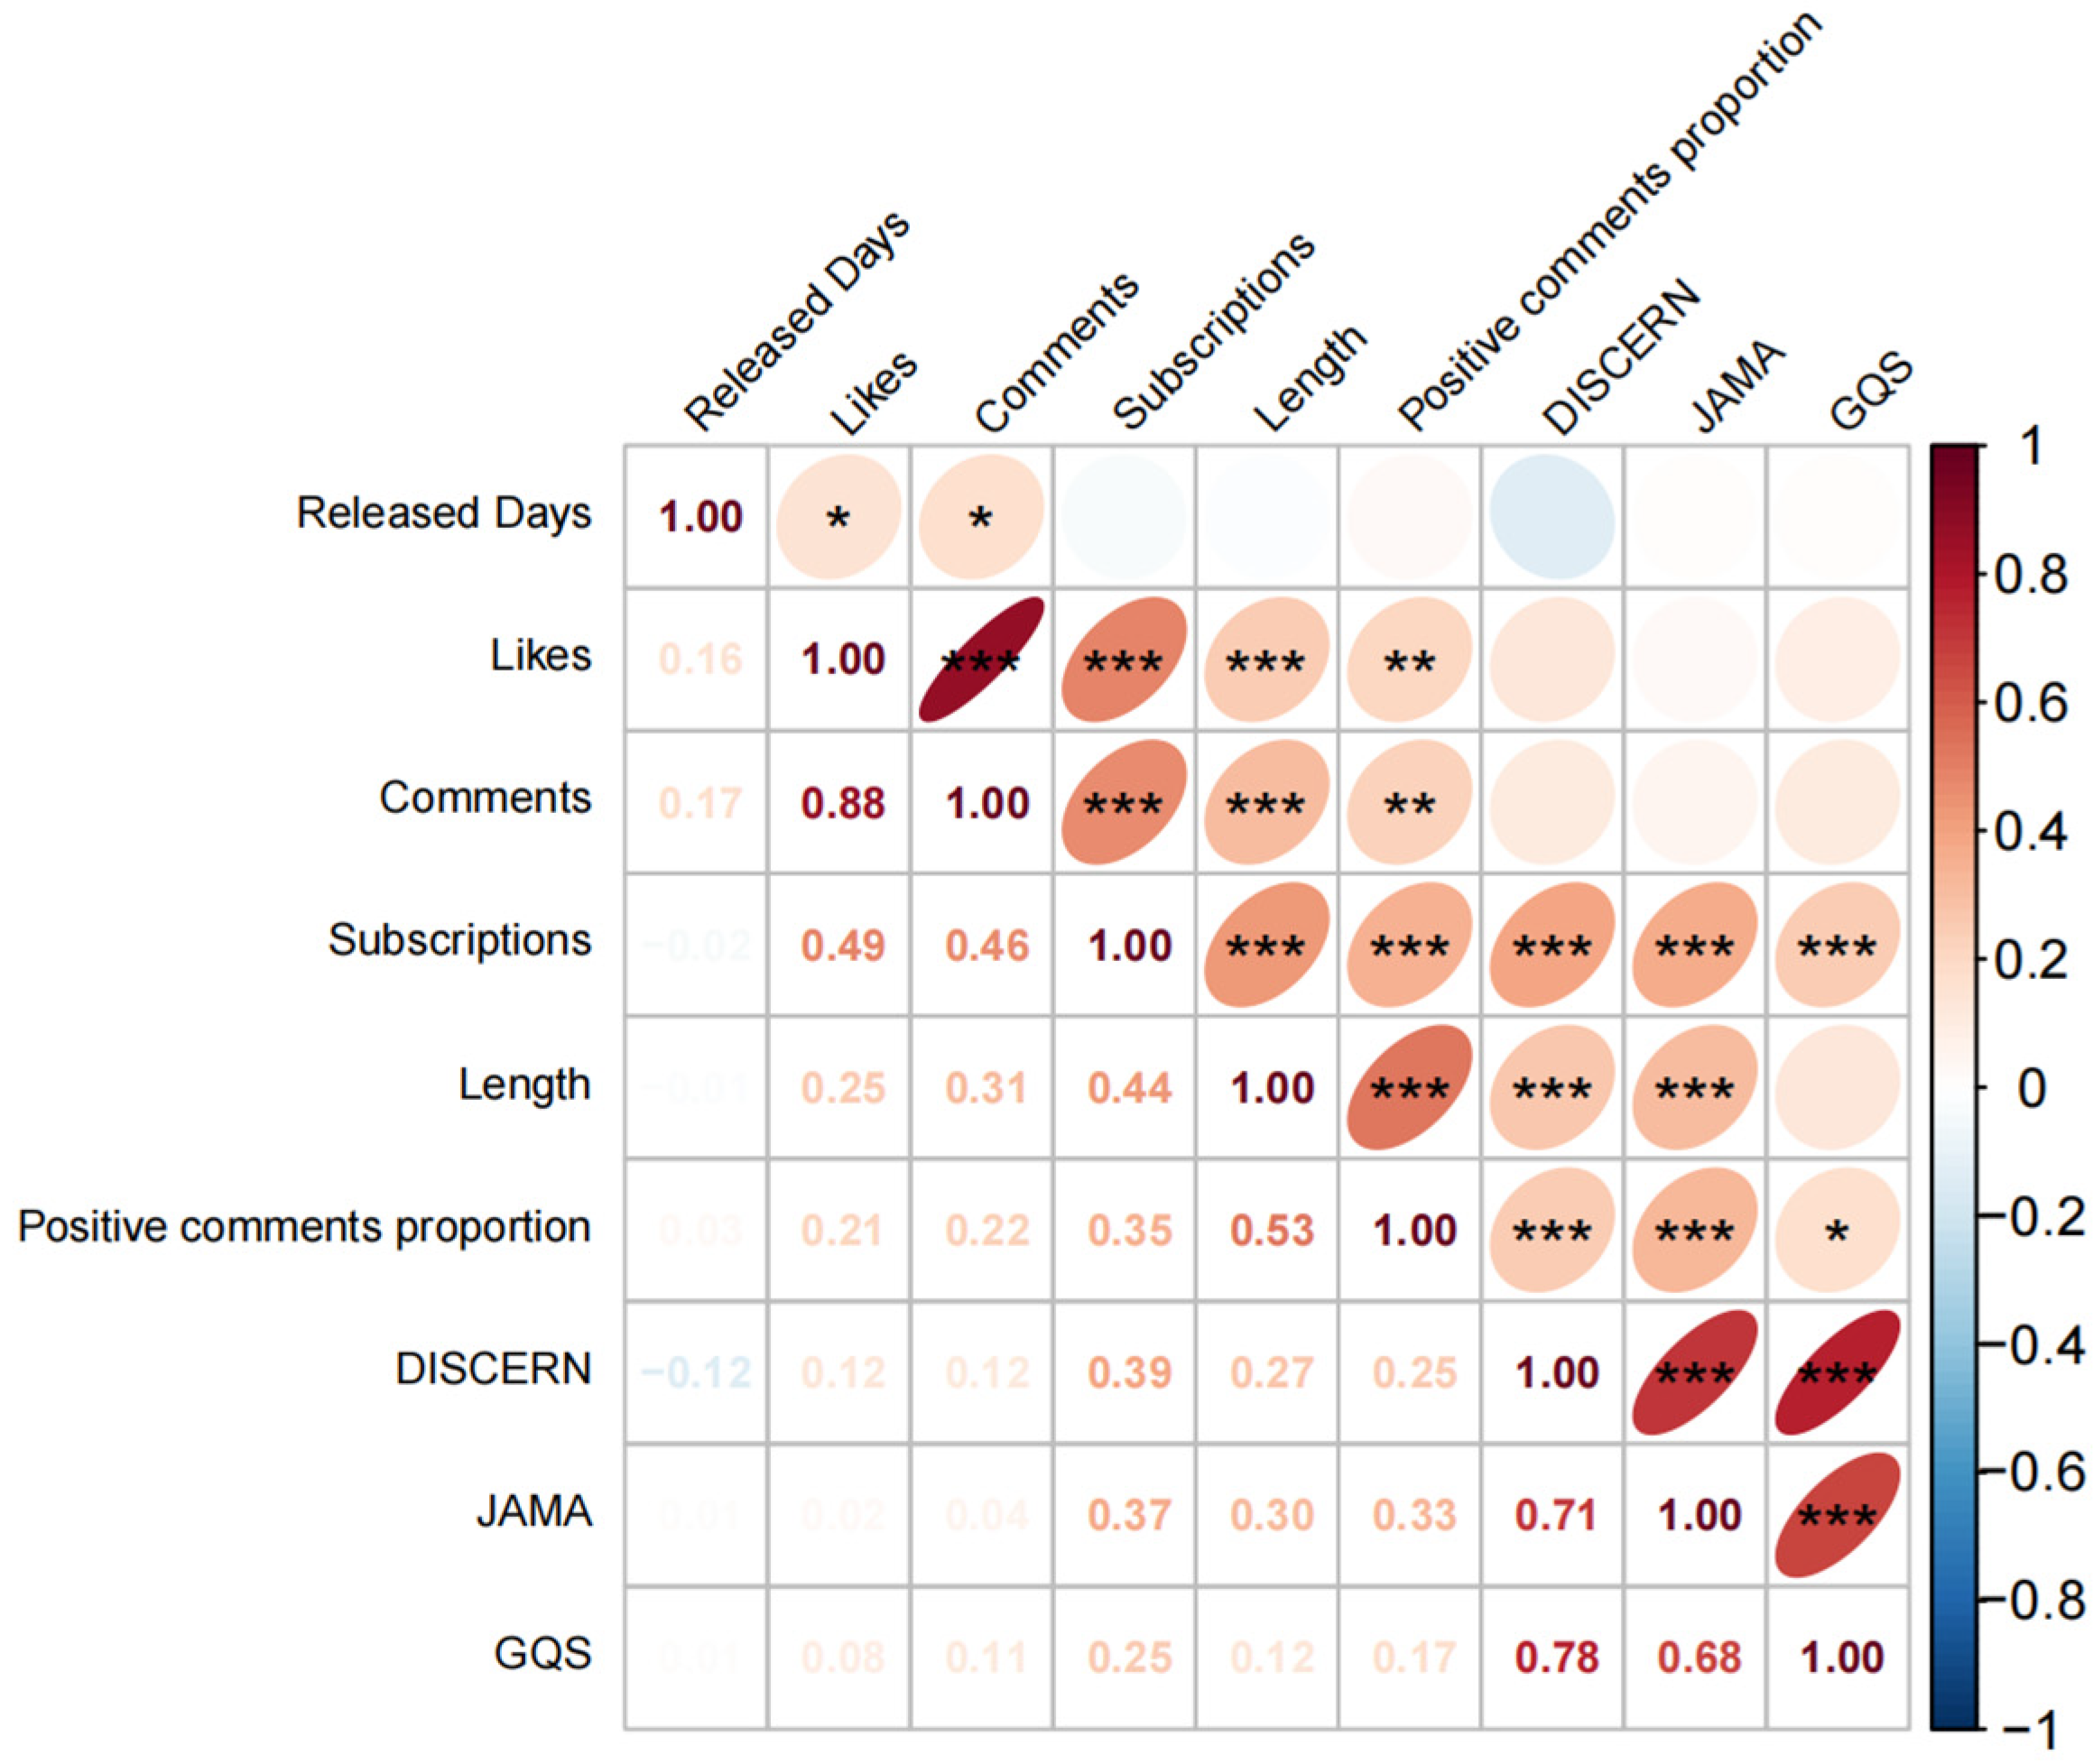
Audience engagement metrics and information quality showed divergent patterns. As illustrated in Figure 5, engagement-related indicators—particularly likes, comments, and subscriptions—were strongly intercorrelated, suggesting clustering effects once user interaction is initiated. However, their associations with objective quality scores were weak. Likes demonstrated a slight negative correlation with DISCERN scores, and released days showed minimal relationships with reliability measures, indicating that popularity or longer online presence does not necessarily reflect higher information quality. In contrast, DISCERN, JAMA, and GQS scores were strongly or moderately correlated with each other, supporting internal consistency among reliability, transparency, and overall educational quality. Stratified analyses by GQS grade (Table 4a,b) further supported this pattern. Following the precedent of previous studies, GQS scores were grouped into three levels—low (1–2), moderate (3), and high (4–5)—to facilitate the comparative analysis of engagement patterns across different quality benchmarks [22,23]. On YouTube, engagement indicators did not differ significantly across quality grades. In contrast, on Bilibili, videos with higher GQS grades received significantly more likes, comments, and higher positive comment ratios, suggesting that audience engagement on Bilibili may be more responsive to perceived content quality.
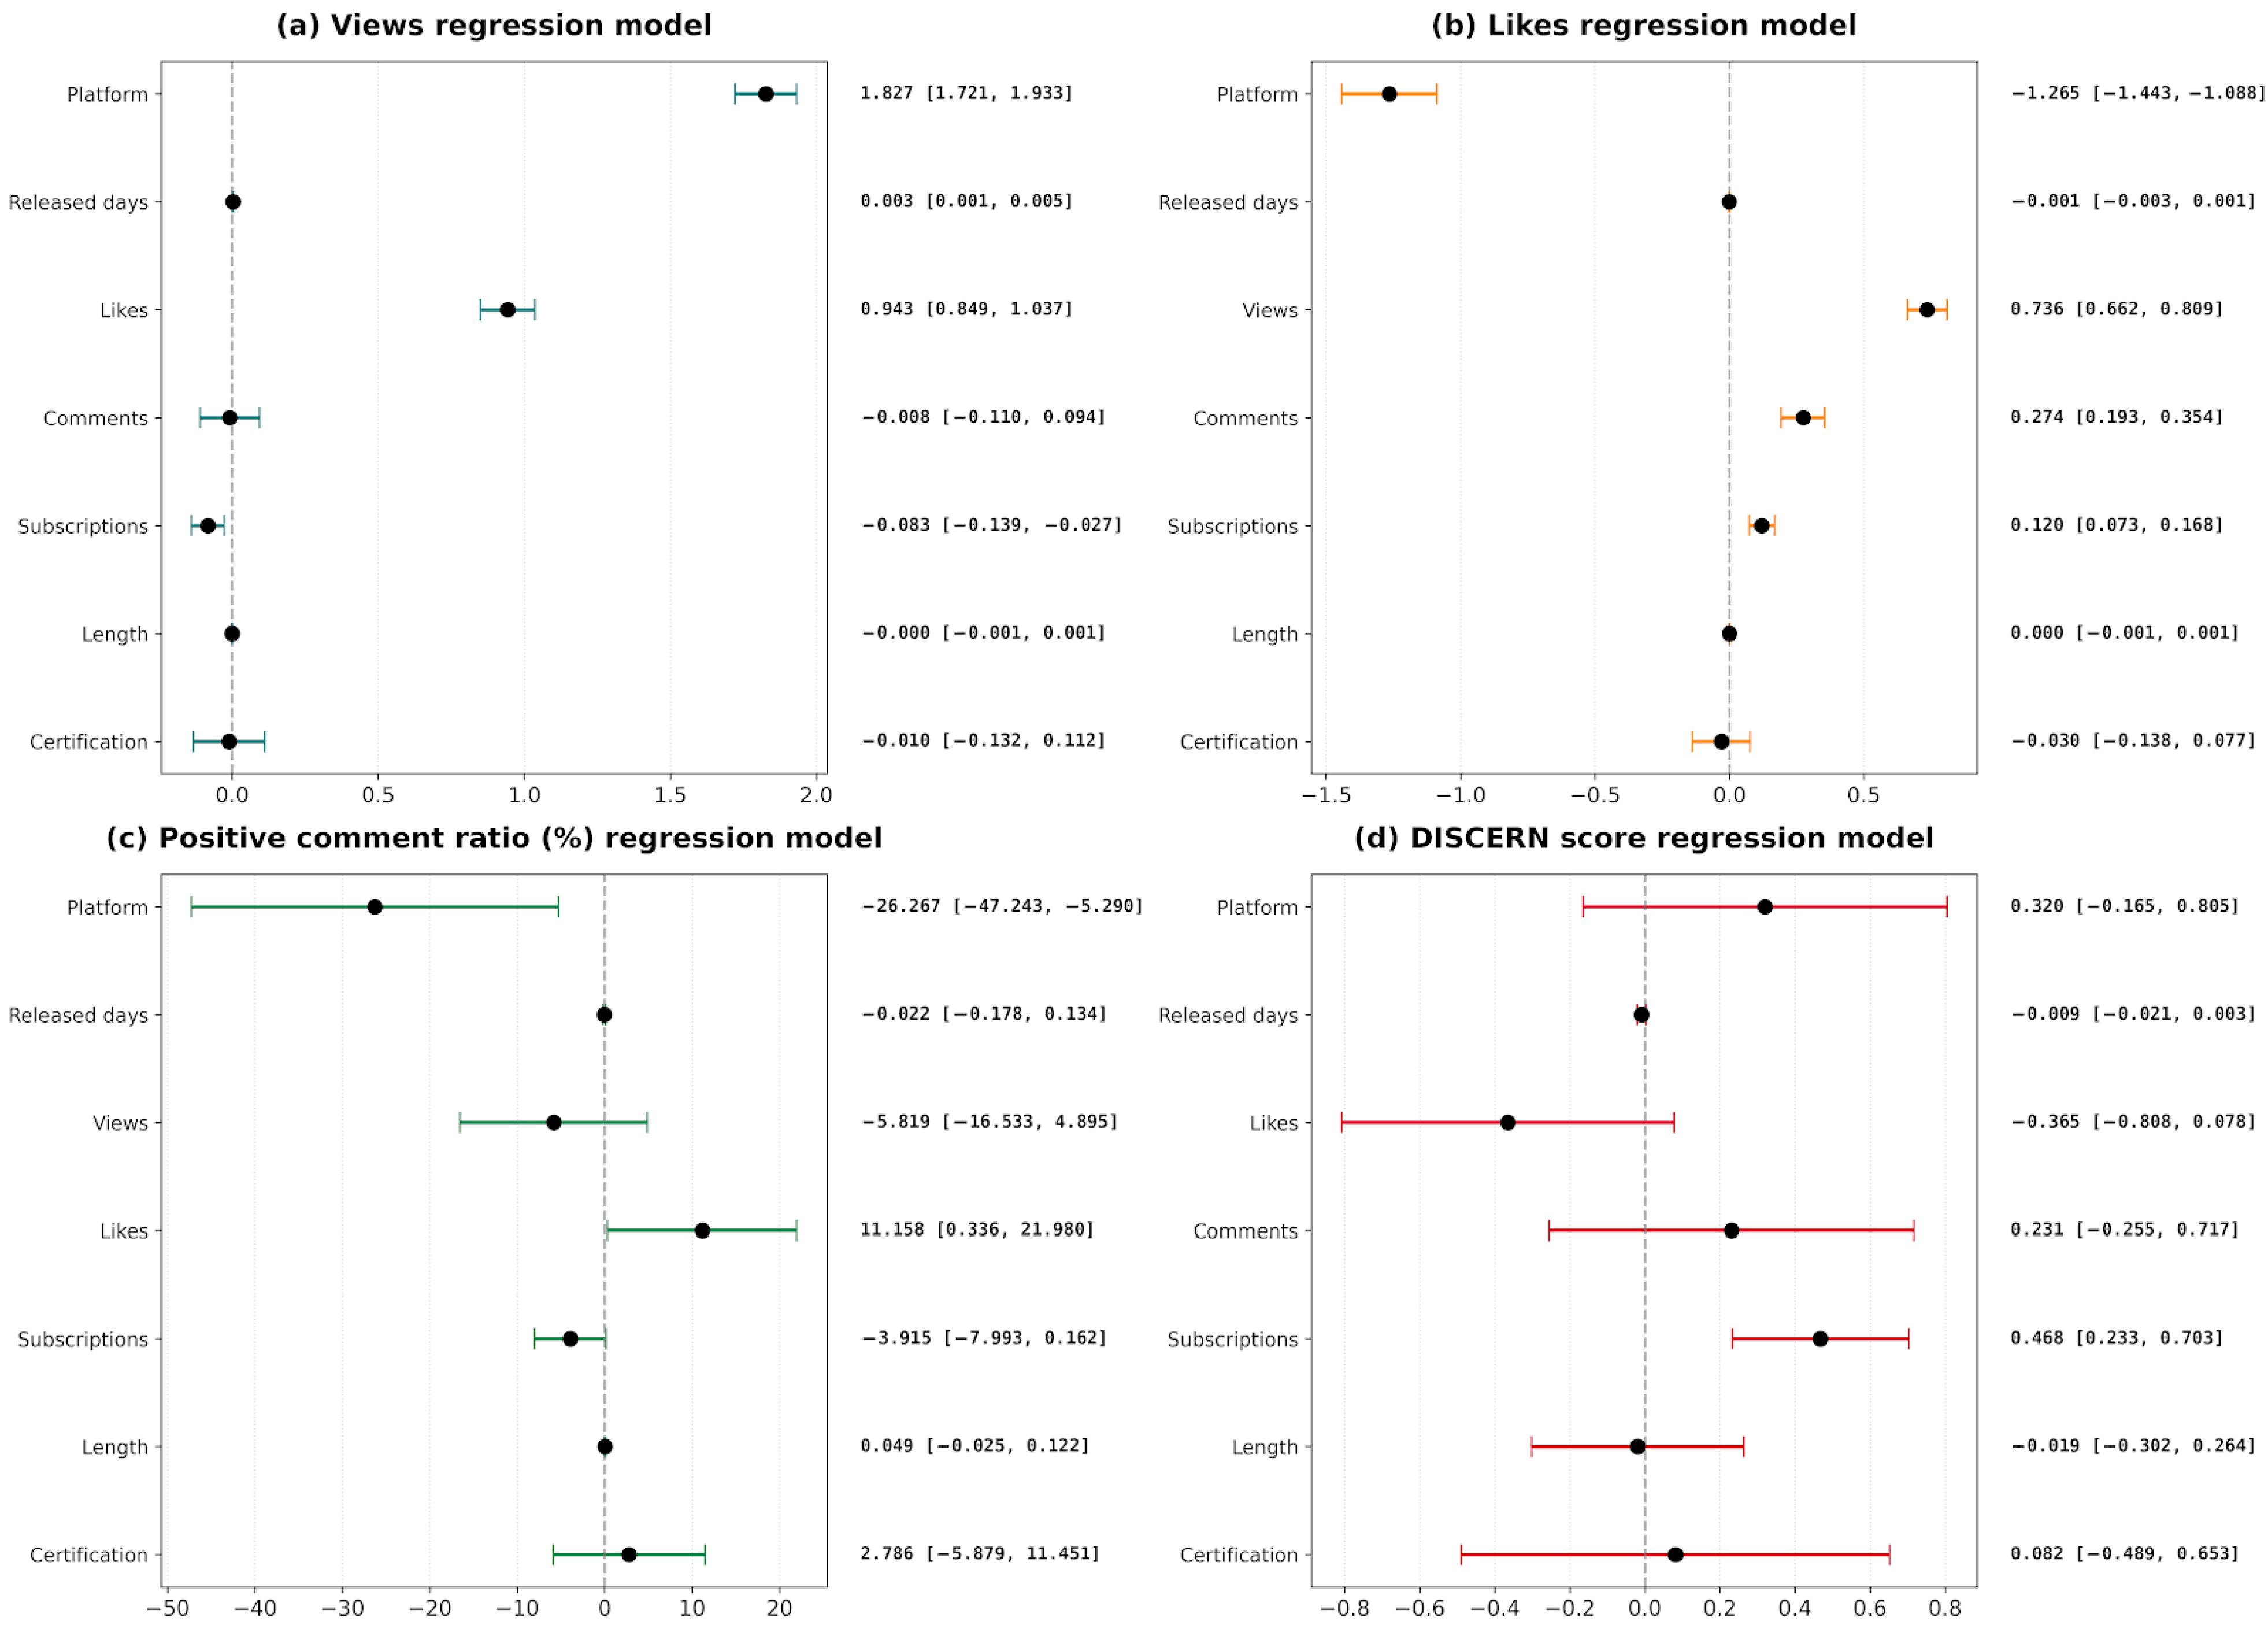
To identify the key determinants of video popularity, audience engagement, and information quality, four multivariable linear regression models were constructed (Figure 6). The comprehensive statistical parameters, including standard errors (SE) and exact p-values for each predictor, are presented in the Supplementary Material (Supplementary Tables S1–S4). Regarding video dissemination, the regression model explained 95.1% of the variance in view counts (R2 = 0.951, Supplementary Table S1). The platform emerged as the most potent predictor; specifically, Bilibili videos (coded as 1) exhibited significantly higher log10-transformed views compared to YouTube videos (coded as 0) when controlling for other covariates (β = 1.827, p < 0.001). Additionally, like counts (β = 0.943, p < 0.001) and uploader subscriptions (β = −0.083, p = 0.004) demonstrated significant associations with view performance (Figure 6a). In terms of audience engagement, the model for like counts also displayed substantial explanatory power (R2 = 0.931, Supplementary Table S2). Notably, while Bilibili dominated in total views, it showed a significant negative coefficient for likes conversion relative to YouTube (β = −1.265, p < 0.001), suggesting distinct platform-specific user interaction patterns (Figure 6b). For the sentiment of user feedback, the positive comment ratio was significantly enhanced by higher like counts (β = 11.158, p = 0.043) but was negatively associated with the Bilibili platform (β = −26.267, p = 0.014), indicating a potentially more critical or polarized discursive environment on Bilibili compared to YouTube (Figure 6c; Supplementary Table S3). Finally, the model predicting information quality—as measured by DISCERN scores—revealed that uploader subscriptions were the sole significant positive predictor (β = 0.468, p < 0.001), independent of platform or professional certification status (Figure 6d; Supplementary Table S4).
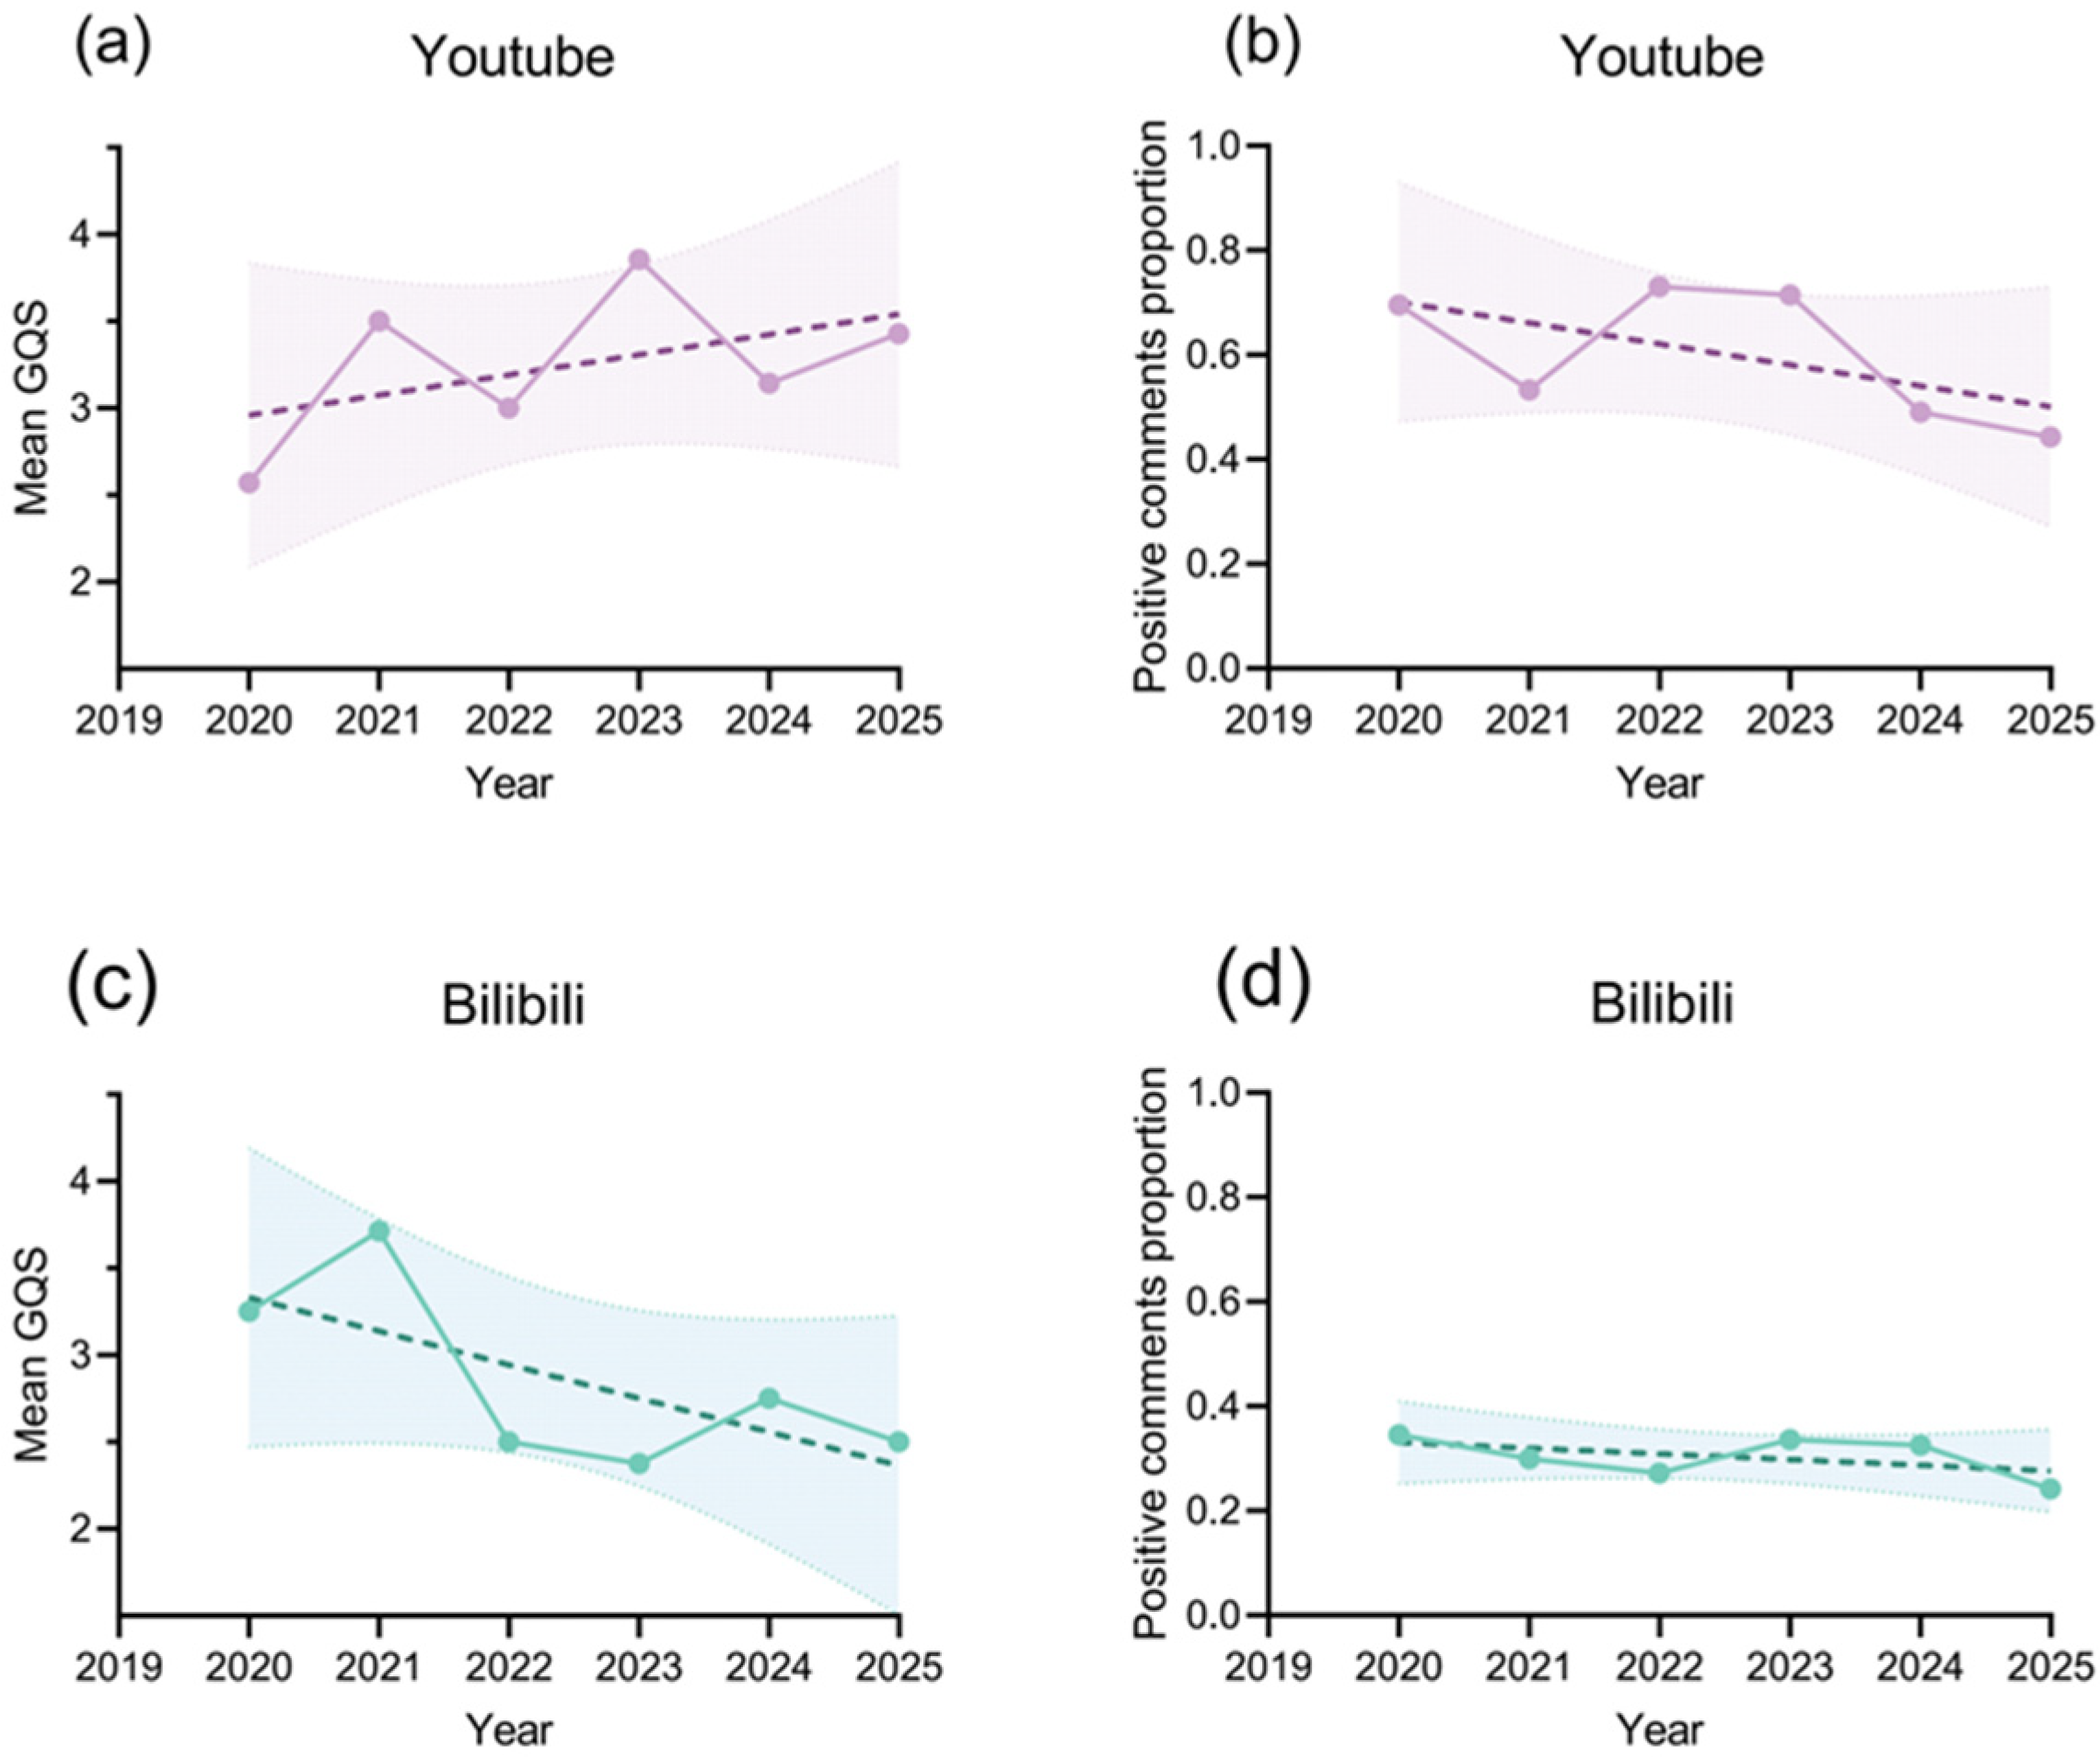
Platform-specific differences were further illustrated in regression analyses (Figure 7). On Bilibili, higher GQS, DISCERN, and JAMA scores were consistently associated with higher engagement-related outcomes, although explanatory power remained limited. Conversely, on YouTube, quality scores showed weak or negative associations with engagement and were largely nonsignificant. This contrast suggests that the relationship between information quality and audience response may depend on platform context rather than content quality alone. Figure 8 presents the temporal variations in video quality (Mean GQS) and audience sentiment (Positive comment proportion) on YouTube and Bilibili from 2020 to 2025. On YouTube, the Mean GQS exhibited fluctuations with a numerical peak observed around 2023, while the proportion of positive comments showed a downward trajectory in its mean values over the study period. Conversely, on Bilibili, the Mean GQS reached its highest recorded value in 2021 before following a lower range in subsequent years. The proportion of positive comments on Bilibili remained relatively low with minor annual variations. Notably, the widening confidence intervals in the later years across both platforms suggest increased data variability, necessitating caution in inferring long-term definitive trends without further statistical validation.
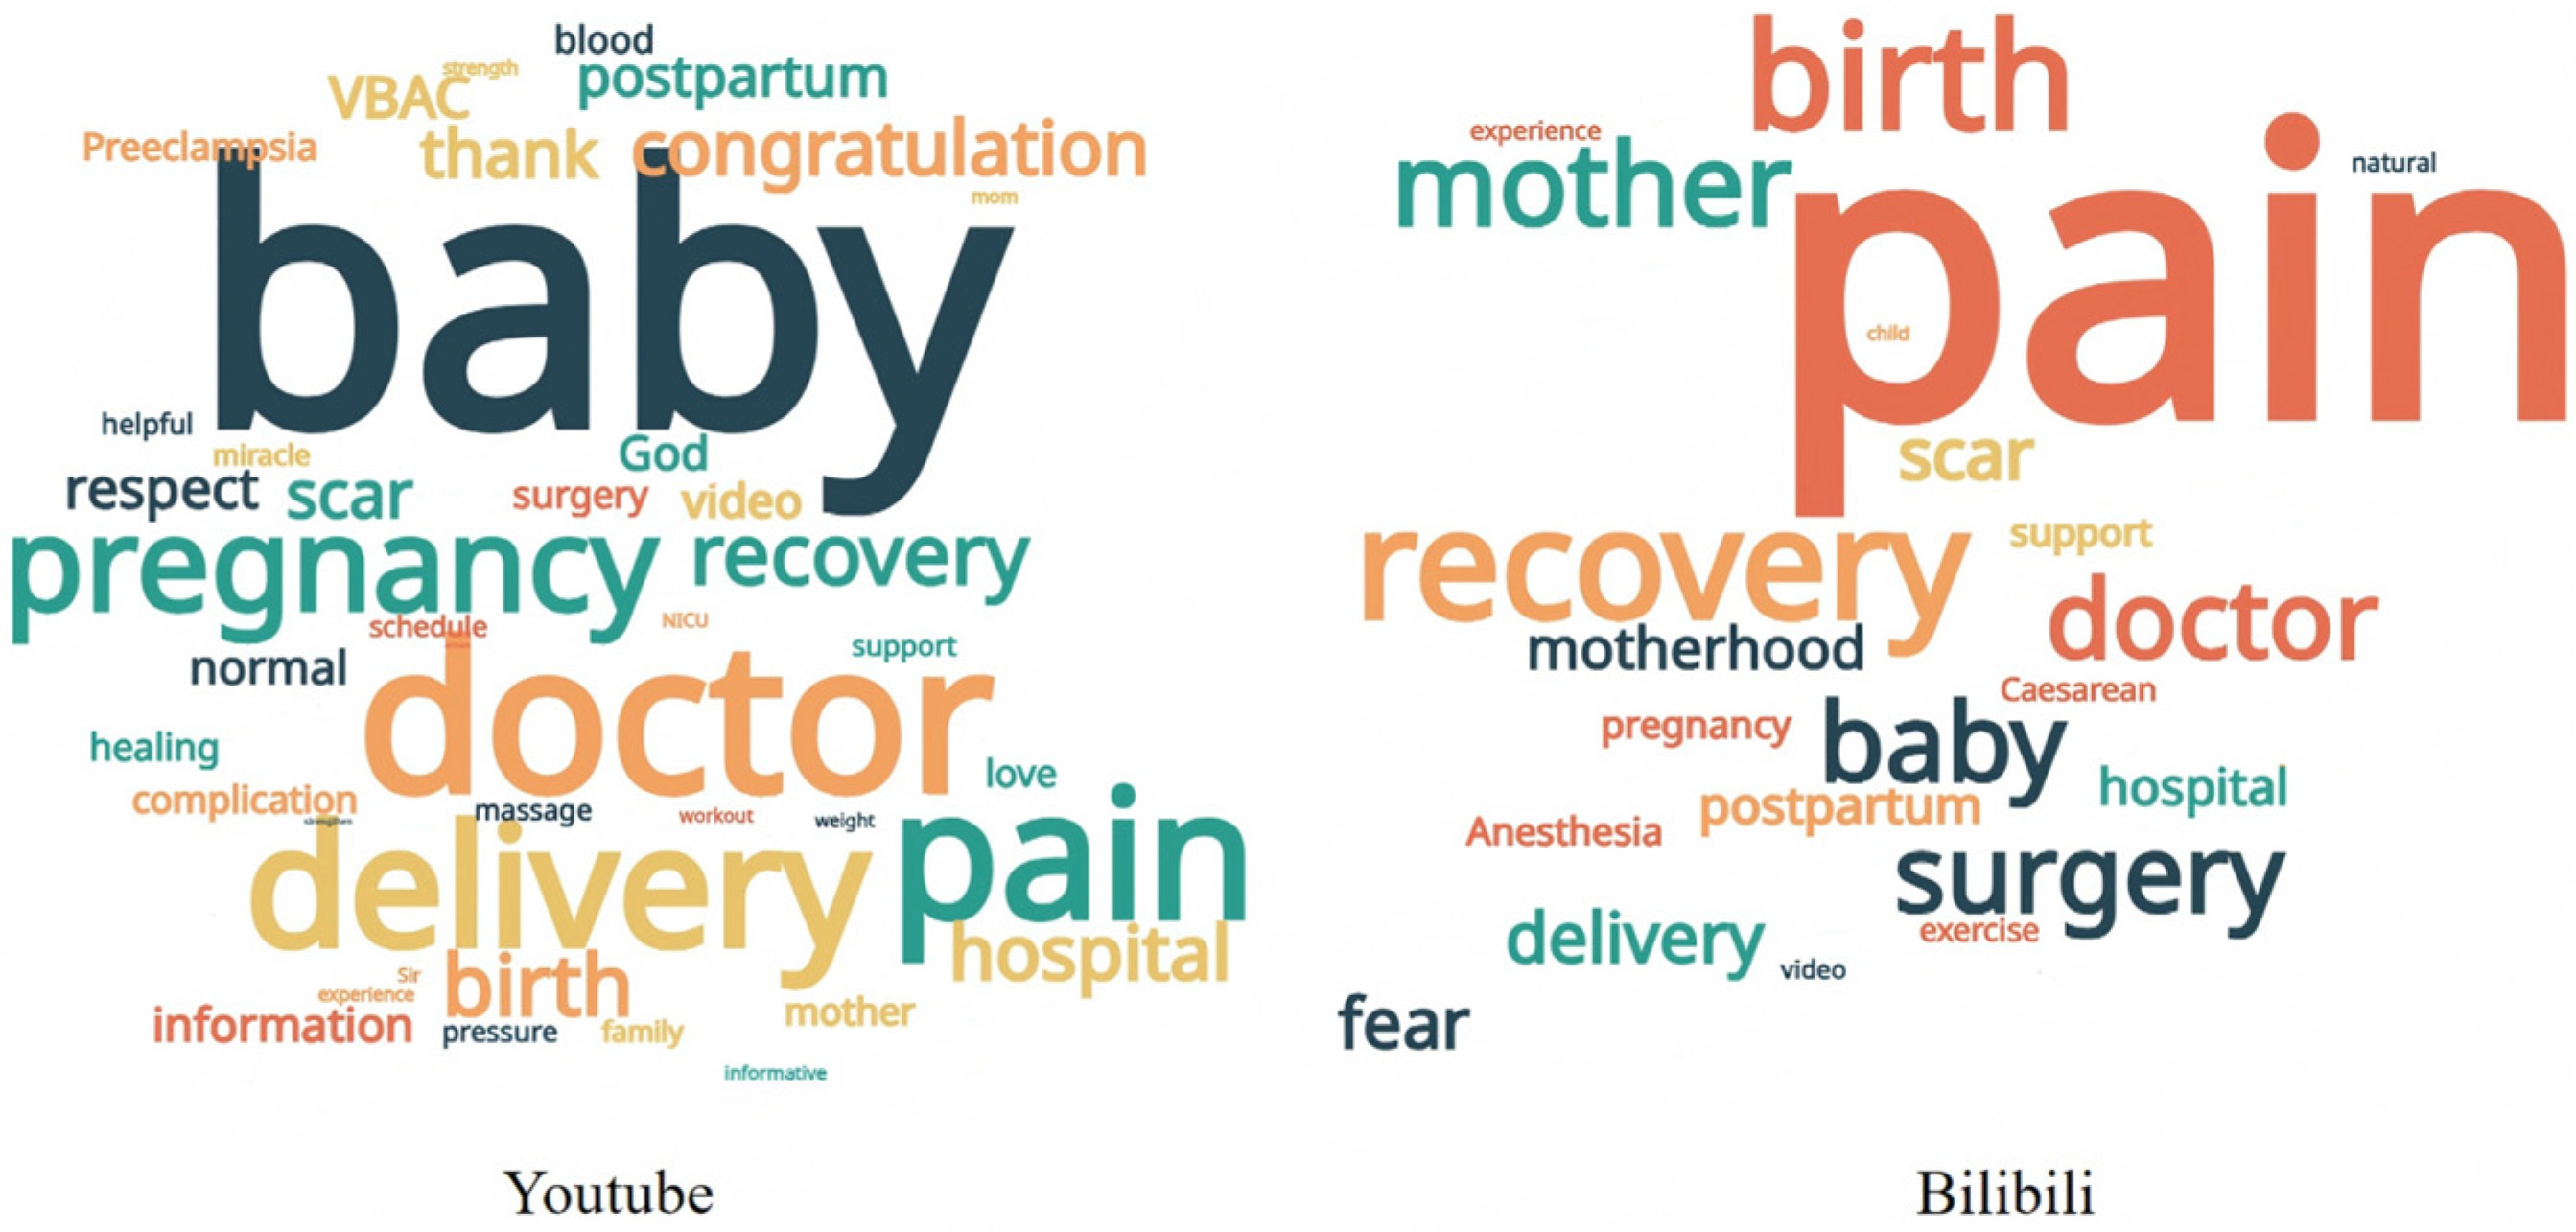
To qualitatively explore the thematic focus of audience engagement, word cloud visualizations were generated (Figure 9). Descriptive analysis of the most frequent terms suggests a divergence in user priorities across platforms: YouTube comments appear to emphasize clinical and neonatal-related outcomes (e.g., “baby,” “doctor,” “delivery”), while the Bilibili discourse centers more prominently on individual physical and emotional experiences (e.g., “pain,” “recovery,” “surgery”). It should be noted that these visualizations serve as an exploratory analysis intended to highlight prevalent keywords; they do not imply statistical significance or causal linkages between video content and audience perception.

4. Discussion

4.1. Summary of Findings and the Reliability Gap

This study reveals a significant “quality-popularity paradox” in C-section (C-section) digital content. While YouTube achieved higher objective quality scores (DISCERN/JAMA), Bilibili dominated in dissemination efficiency [24,25]. This gap is primarily driven by uploader identity: YouTube features a high proportion of institutional accounts (44.4%), which often benefit from algorithmic prioritization, whereas Bilibili is populated mainly by individual, non-medical creators. Although Global Quality Scale (GQS) scores were comparable, Bilibili content frequently lacks explicit source attribution, suggesting that while the content is perceived as useful, it often fails to meet rigorous evidence-based clinical standards [26].

4.2. Structural Affordances and Interaction Patterns

The divergent engagement patterns reflect platform-specific “structural affordances” [27,28]. Bilibili’s “danmaku” interface facilitates “pseudo-synchronicity,” creating a sense of collective viewing that encourages emotional support and experience sharing [29]. This architecture allows viewers to bridge the gap between expert clinical discourse and personal maternal experiences. In contrast, YouTube operates as an atomized archive where institutional accounts prioritize academic rigor over community interaction [24,30]. Our regression models confirm this logic: Bilibili videos (β = 1.827) exhibit significantly higher views but a more critical discursive environment, demonstrating how platform design directly shapes credibility perception [25,27].

4.3. Clinical Implications: Benefits for Patients and Clinicians

Integrating high-quality video education into obstetric care offers measurable advantages. For patients, 5 min videos covering the entire C-section process have been proven to significantly reduce maternal anxiety and improve satisfaction compared to standard counseling. Visual media enhances knowledge retention by up to 95%, helping mothers manage “cognitive overload” during the stressful perioperative period [31]. For clinicians, standardized video tools optimize time efficiency by allowing patients to review fundamental care concepts independently. Furthermore, high-quality video models serve as the basis for Virtual Reality (VR) simulations, which can reduce surgical errors in training by up to 53.7% [29].

4.4. Actionable Policy and Implementation Strategies

To address misinformation risks, we propose a multi-sectoral approach:
Platform Credentialing: Following 2025 NHC guidelines, platforms must implement mandatory medical license verification for creators discussing surgical topics [32].
Algorithm Recalibration: Algorithms should prioritize authoritative, source-attributed content (high DISCERN scores) over purely viral metrics.
Advertising Regulation: Regulators must enforce a strict ban on “disguised advertising” within educational narratives [24].
Institutional Stewardship: Healthcare organizations should co-create “truth-driven” messages that humanize clinical guidelines through personal narratives.

4.5. Limitations

Several limitations warrant acknowledgment. First, our cross-sectional sampling strategy provides a “snapshot” of a dynamic environment, which may be influenced by platform-specific search algorithms, potentially introducing selection bias and limiting the objectivity of the sample [25]. Second, a critical finding is the “professionalism-interaction gap”: uploader professional status and information quality were often weakly or even negatively correlated with audience interactivity on platforms like Bilibili. This suggests that “professionalism” alone is insufficient to drive popularity, as viewers may prioritize entertainment value or personal narrative over clinical credentials [33]. Furthermore, the discretization of information quality and reliability scores into categorical levels, although informed by established literature, remains inherently subjective and may overlook nuanced variations within the same grade. Finally, while our quantitative metrics are robust, we did not perform in-depth qualitative coding of comments, and the focus on English/Chinese ecosystems may limit generalizability to other cultural contexts [34].

5. Conclusions

In conclusion, this research highlights the fundamental tension between informational reliability and user engagement in the obstetric digital ecosystem. While YouTube provides a reliable repository of institutional knowledge, Bilibili leverages community affordances to foster high user interaction. The findings underscore that professional authorship, although a prerequisite for quality, is not a guaranteed driver of popularity, necessitating a shift in how medical professionals approach digital communication.
The clinical value of high-quality C-section videos in reducing maternal anxiety and optimizing clinician efficiency is clear; however, the prevalence of suboptimal content remains a significant challenge. Moving forward, the implementation of stringent 2025 credentialing policies and “quality-first” algorithms are essential to protect patient interests. Clinicians must go beyond providing accurate data, embracing interactive and visual formats to ensure that evidence-based truth outpaces the spread of misinformation. Future research should utilize AI-driven social listening to monitor this evolving “infodemic” and its impact on global maternal health outcomes.

Supplementary Materials

The following supporting information can be downloaded at: https://www.mdpi.com/article/10.3390/info17030273/s1, Table S1. Multivariable Linear Regression Predicting Views (log10-transformed). Note: R2 = 0.951; adjusted R2 = 0.948. p < 0.05. Table S2. Multivariable Linear Regression Predicting Likes (log10-transformed). Note: R2 = 0.931; adjusted R2 = 0.927. p < 0.05. Table S3. Multivariable Linear Regression Predicting Positive Comment Ratio (%). Note: R2 = 0.434; adjusted R2 = 0.411. p < 0.05. Table S4. Multivariable Linear Regression Predicting DISCERN Total Score. Note: R2 = 0.188; adjusted R2 = 0.149. p < 0.05.

Author Contributions

Conceptualization, G.S. and D.S.; Methodology, G.S.; Software, S.C.; Validation, L.C. and P.C.; Formal analysis, L.C. and P.C.; Investigation, S.C.; Resources, D.S.; Data curation, L.W. and H.T.; Writing—original draft preparation, G.S., L.W. and H.T.; Writing—review and editing, G.S. and D.S.; Visualization, S.C.; Supervision, Y.L.; Project administration, D.S.; Funding acquisition, S.C. and D.S. All authors have read and agreed to the published version of the manuscript.

Funding

The project was supported by the National Natural Science Foundation of China (No. 82574719).

Institutional Review Board Statement

No private, identifiable, or restricted-access information was collected in this study. As a non-interventional secondary analysis of publicly accessible data, formal institutional ethics approval was not required.

Informed Consent Statement

Informed consent for participation is not required as per relevant ethical guidelines and platform terms of service.

Data Availability Statement

The data presented in this study are available on request from the corresponding author due to the fact that the dataset contains confidential user privacy information from social media platforms and is subject to the data usage agreements of the relevant platforms, which prohibit public archiving and dissemination.

Conflicts of Interest

The authors declare no conflict of interest.

References

  1. Betran, A.P.; Ye, J.; Moller, A.-B.; Souza, J.P.; Zhang, J. Trends and projections of caesarean section rates: Global and regional estimates. BMJ Glob. Health 2021, 6, e005671. [Google Scholar] [CrossRef]
  2. Lee, K.N.; Joo, Y.J.; Choi, S.Y.; Park, S.T.; Lee, K.Y.; Kim, Y.; Son, G.H. Content Analysis and Quality Evaluation of Cesarean Delivery-Related Videos on YouTube: Cross-sectional Study. J. Med. Internet Res. 2021, 23, e24994. [Google Scholar] [CrossRef] [PubMed]
  3. Squires, N.A.; Soyemi, E.; Yee, L.M.; Birch, E.M.; Badreldin, N. Content Quality of YouTube Videos About Pain Management After Cesarean Birth: Content Analysis. JMIR Infodemiol. 2023, 3, e40802. [Google Scholar] [CrossRef] [PubMed]
  4. Chen, J.; Wang, Y. Social Media Use for Health Purposes: Systematic Review. J. Med. Internet Res. 2021, 23, e17917. [Google Scholar] [CrossRef] [PubMed]
  5. Masilamani, V.; Sriram, A. Health Information in Social Media: An Evaluation of YouTube Videos. J. Media Manag. 2023, 5, 1–9. [Google Scholar] [CrossRef]
  6. Niino, Y. The increasing cesarean rate globally and what we can do about it. Biosci. Trends 2011, 5, 139–150. [Google Scholar] [CrossRef]
  7. Parasiliti, M.; Vidiri, A.; Perelli, F.; Scambia, G.; Lanzone, A.; Cavaliere, A.F. Cesarean section rate: Navigating the gap between WHO recommended range and current obstetrical challenges. J. Matern. Fetal Neonatal Med. 2023, 36, 2284112. [Google Scholar] [CrossRef]
  8. Ojong, S.A.; Temmerman, M.; Nsahlai, C.J.F.; Gidion, D.; Kihara, A. Why do cesarean delivery rates persistently rise despite evidence-based efforts to reduce them? Am. J. Obstet. Gynecol. 2026, 233, S569–S580. [Google Scholar] [CrossRef]
  9. Egala, S.; Afful-Dadzie, A.; Afful-Dadzie, E. Social media in health communication: A literature review of information quality. Health Inf. Manag. J. 2023, 52, 3–17. [Google Scholar] [CrossRef]
  10. Gurler, D.; Buyukceran, I. Assessment of the Medical Reliability of Videos on Social Media: Detailed Analysis of the Quality and Usability of Four Social Media Platforms (Facebook, Instagram, Twitter, and YouTube). Healthcare 2022, 10, 1836. [Google Scholar] [CrossRef]
  11. Thomaidi, S.; Sarantaki, A.; Tzitiridou Chatzopoulou, M.; Orovou, E.; Jotautis, V.; Papoutsis, D. The Rising Global Cesarean Section Rates and Their Impact on Maternal and Child Health: A Scoping Review. J. Clin. Med. 2025, 14, 8102. [Google Scholar] [CrossRef] [PubMed]
  12. Madathil, K.C.; Rivera-Rodriguez, A.J.; Greenstein, J.S.; Gramopadhye, A.K. Healthcare information on YouTube: A systematic review. Health Inform. J. 2015, 21, 173–194. [Google Scholar] [CrossRef]
  13. Paul, B.; Headley-Johnson, S.A. The Impact of Social Media on Health Behaviors, a Systematic Review. Healthcare 2025, 13, 2763. [Google Scholar] [CrossRef] [PubMed]
  14. Zhou, S.; Wu, H.; Zhang, Y.; Zhong, Q.; Diao, Y.; Fang, H.; Xu, Y.; Yu, H. Automated Quality Assessment of Online Medical Science Popularization Videos: A Framework Based on Large Language Models. Array 2026, 29, 100717. [Google Scholar] [CrossRef]
  15. Wang, Z.; Yin, Z.; Argyris, Y.A. Detecting Medical Misinformation on Social Media Using Multimodal Deep Learning. IEEE J. Biomed. Health Inform. 2021, 25, 2193–2203. [Google Scholar] [CrossRef]
  16. Uddin, J. Beyond Physicians: Social and Familial Norms Driving Cesarean Section Decisions in Bangladesh. arXiv 2025, arXiv:2508.12240. [Google Scholar] [CrossRef]
  17. Eysenbach, G. Infodemiology and infoveillance tracking online health information and cyberbehavior for public health. Am. J. Prev. Med. 2011, 40, S154–S158. [Google Scholar] [CrossRef]
  18. Osman, W.; Mohamed, F.; Elhassan, M.; Shoufan, A. Is YouTube a reliable source of health-related information? A systematic review. BMC Med. Educ. 2022, 22, 382. [Google Scholar] [CrossRef]
  19. Chan, C.; Sounderajah, V.; Daniels, E.; Acharya, A.; Clarke, J.; Yalamanchili, S.; Normahani, P.; Markar, S.; Ashrafian, H.; Darzi, A. The Reliability and Quality of YouTube Videos as a Source of Public Health Information Regarding COVID-19 Vaccination: Cross-sectional Study. JMIR Public Health Surveill. 2021, 7, e29942. [Google Scholar] [CrossRef]
  20. Manandhar, M.; Hawkes, S.; Buse, K.; Nosrati, E.; Magar, V. Gender, health and the 2030 agenda for sustainable development. Bull. World Health Organ. 2018, 96, 644–653. [Google Scholar] [CrossRef]
  21. Ge, R.; Dai, H.; Gong, C.; Xia, Y.; Wang, R.; Xu, J.; You, S.; Cao, Y. The Quality and Reliability of Online Videos as an Information Source of Public Health Education for Stroke Prevention in Mainland China: Electronic Media-Based Cross-Sectional Study. JMIR Infodemiol. 2025, 5, e64891. [Google Scholar] [CrossRef] [PubMed]
  22. Kim, S.B.; Cho, S.B.; Choi, H.; Lim, S. Educational value of spinal injection therapy videos in Korean YouTube for back pain patients. Anesth. Pain Med. 2022, 17, 429–433. [Google Scholar] [CrossRef]
  23. Li, M.; Yan, S.; Yang, D.; Li, B.; Cui, W. YouTube™ as a source of information on food poisoning. BMC Public Health 2019, 19, 1146. [Google Scholar] [CrossRef] [PubMed]
  24. Liu, Y. The Role of Platform Affordances in Shaping Audience Engagement on Bilibili and Weibo. Lect. Notes Educ. Psychol. Public Media 2025, 116, 57–63. [Google Scholar] [CrossRef]
  25. Liu, H.; Peng, J.; Li, L.; Deng, A.; Huang, X.; Yin, G.; Ming, J.; Luo, H.; Liang, Y. Assessment of the reliability and quality of breast cancer related videos on TikTok and Bilibili: Cross-sectional study in China. Front. Public Health 2023, 11, 1296386. [Google Scholar] [CrossRef]
  26. Wang, M.; Yao, N.; Wang, J.; Chen, W.; Ouyang, Y.; Xie, C. Bilibili, TikTok, and YouTube as sources of information on gastric cancer: Assessment and analysis of the content and quality. BMC Public Health 2024, 24, 57. [Google Scholar] [CrossRef]
  27. Shu, H.; Zhu, Y.; Yan, T.; Zhang, W.; Huang, Z.; Liang, M.; Long, Z.; Lv, F.; Tu, W. YouTube, Bilibili, and TikTok serve as important stroke-relevant information sources: A cross-sectional study. Digit. Health 2026, 12, 20552076261416720. [Google Scholar] [CrossRef]
  28. Phetprapasri, P.; Chanthasenanont, A.; Prasongvej, P.; Nuallaong, W.; Chaitrakulthong, S.; Pongrojpaw, D. Effect of Informative Cesarean Delivery Operative Steps Video on Maternal Anxiety Level: A Randomized Controlled Trial. F1000Research 2024, 13, 712. [Google Scholar] [CrossRef]
  29. Visan, I.G.; Toma, C.V.; Petca, R.; Petrescu, G.E.D.; Noditi, A.R.; Petca, A. Exploring the Efficacy of Virtual Reality Training in Obstetric Procedures and Patient Care-A Systematic Review. Healthcare 2025, 13, 784. [Google Scholar] [CrossRef]
  30. Gong, X.; Chen, M.; Ning, L.; Zeng, L.; Dong, B. The Quality of Short Videos as a Source of Coronary Heart Disease Information on TikTok: Cross-Sectional Study. JMIR Form. Res. 2024, 8, e51513. [Google Scholar] [CrossRef]
  31. Jeyarani, J.; Rexline, M.; Rosario, B.; Maria, B. Effectiveness of Video-Assisted Preoperative Instructions on Postoperative Pain and Anxiety among Women Undergoing Elective Caesarean Section in Selected Hospitals, Bengaluru. Int. J. Sci. Res. (IJSR) 2024, 13, 1525–1533. [Google Scholar] [CrossRef]
  32. Friedman, M.; Mor, L.; Segman, I.; Mizrachi, Y.; Shushan, N.B.; Eisenberg, H.; Shieldkrot, T.; Weiner, E.; Barda, G. The impact of an informative video on anxiety levels in women undergoing term induction of labor: A randomized controlled trial. Am. J. Obstet. Gynecol. MFM 2025, 7, 101667. [Google Scholar] [CrossRef]
  33. Li, J.; Zhang, J.; Xu, X.; Xiao, L.; Ling, Y.; Liu, S.; Gao, Y.; Zhao, L.; Jia, H. Quality and reliability of Alzheimer’s disease videos on Douyin and Bilibili: A cross-sectional content analysis study. Digit. Health 2025, 11, 20552076251398464. [Google Scholar] [CrossRef]
  34. Ding, Y. Comparative Cross-Cultural Language Studies: An Exploration of English and Chinese Languages and Cultures. Mod. Linguist. 2023, 11, 4901–4908. [Google Scholar] [CrossRef]
Figure 1. The flow chart of this study.
Information 17 00273 g001
Figure 2. YouTube and Bilibili differ in terms of video sources, content, and format proportions. (a,c,e) represent data from Bilibili; (b,d,f) represent data from YouTube. (a,b) Proportions of video sources; (c,d) proportions of video content types; (e,f) proportions of video formats.
Information 17 00273 g002
Figure 3. Comparison of GQS, DISCERN, and JAMA scores between YouTube and Bilibili videos. (a) Comparison of GQS scores between YouTube and Bilibili videos (* p < 0.05). (b) Comparison of DISCERN scores between YouTube and Bilibili videos (*** p < 0.001). (c) Comparison of JAMA scores between YouTube and Bilibili videos (*** p < 0.001).* p < 0.05, *** p < 0.001.
Information 17 00273 g003
Figure 4. Distribution of videos across overall quality score grades on YouTube and Bilibili. The radar chart shows the proportion of videos in each grade category (Grade 1–5) for YouTube (purple line) and Bilibili (green line). The dotted concentric circles represent the reference grid lines for the radar chart axes, with values of 31/3 (inner), 62/3 (middle), and 31 (outer). The table below presents the absolute counts of videos in each grade category for both platforms.
Information 17 00273 g004
Figure 5. Spearman Correlation Analysis among different video variables, GQS and DISCERN score concerning C-section videos. “*”means p < 0.05; “**” means p < 0.01; “***” means p < 0.001.
Information 17 00273 g005
Figure 6. Multivariable regression analyses of factors associated with video metrics and information quality. Forest plots illustrating the unstandardized β coefficients and 95% confidence intervals (CIs) for predictors across four discrete multivariable linear regression models: (a) video views (log10-transformed); (b) like counts (log10-transformed); (c) positive comment ratio (%); and (d) DISCERN total scores. The vertical dashed line indicates the null effect (β = 0). Data points and error bars are color-coded by model type to facilitate comparative analysis.
Information 17 00273 g006
Figure 7. Associations between video quality scores (GQS, DISCERN, and JAMA) and positive comment proportions on YouTube and Bilibili. (a) Association between GQS score and positive comment proportion (r = −0.1237, p = 0.2091 for YouTube; r = 0.2974, p = 0.0031 for Bilibili). (b) Association between DISCERN score and positive comment proportion (r = −0.1889, p = 0.0608 for YouTube; r = 0.1668, p = 0.0946 for Bilibili). (c) Association between JAMA score and positive comment proportion (r = −0.1272, p = 0.1988 for YouTube; r = 0.1568, p = 0.114 for Bilibili).
Information 17 00273 g007
Figure 8. Trends in video quality (GQS) and positive comments for C-section-related videos on YouTube and Bilibili. (a) Temporal trend of Mean GQS on YouTube from 2020 to 2025. (b) Temporal trend of positive comment proportion on YouTube from 2020 to 2025. (c) Temporal trend of Mean GQS on Bilibili from 2020 to 2025. (d) Temporal trend of positive comment proportion on Bilibili from 2020 to 2025.
Information 17 00273 g008
Figure 9. Word cloud visualization of high-frequency keywords in C-section-related videos on YouTube and Bilibili.
Information 17 00273 g009
Table 1. Characteristic of the videos on Youtube and Bilibili.
VariablesBilibili (n = 90), M (Q1, Q3)Youtube (n = 90), M (Q1, Q3)p
Days since published1029 (514, 1598)1054 (457, 1538)0.971
Video duration (s)186 (84.25, 387.00)691 (366, 1184)<0.001
Likes (Counts)1128 (253, 4921)2290 (352, 6903)0.383
Comments (Counts)84 (25, 545)170 (41, 487)0.163
Subscription (Counts)14,720 (3150, 75,114)340,000 (44,725, 1,063,250)<0.001
View (Counts)159,009 (26,408, 443,258)2290 (352, 6903)<0.001
Data are presented as medians with interquartile ranges (Q1–Q3). Between-group comparisons were performed using the Mann–Whitney U test. p < 0.05 was considered statistically significant.
Table 2. Categorical video characteristics by platform.
VariablesTotal N (%)YouTube, n (%)Bilibili, n (%)p-Value
Verified account52 (28.89)40 (44.44)12 (13.33)<0.001
Video source <0.01
 Certified medical professionals46 (25.56)31 (34.44)15 (16.67)
 Medical institution/organization18 (10.00)16 (17.78)2 (2.22)
 Patient/family26 (14.44)16 (17.78)10 (11.11)
 Independent non-medical user69 (38.33)6 (6.67)63 (70.00)
 News/media21 (11.67)21 (23.33)0 (0.00)
Video content type <0.01
 Disease basics21 (11.67)15 (16.67)6 (6.67)
 Clinical presentation and diagnosis10 (5.56)6 (6.67)4 (4.44)
 Treatment strategies63 (35.00)30 (33.34)33 (36.67)
 Complications21 (11.67)16 (17.78)5 (5.56)
 Patient reporting65 (36.11)23 (25.56)42 (46.67)
Video format <0.01
 Live videos131 (72.78)67 (74.44)64 (71.11)
 Animation35 (19.44)10 (11.11)25 (27.78)
 Interview11 (6.11)10 (11.11)1 (1.11)
 News3 (1.67)3 (3.33)0 (0.00)
(Statistical method: Pearson χ2 test). A two-sided p < 0.05 was considered statistically significant.
Table 3. Video quality scores of included videos (YouTube vs. Bilibili).
Quality ScoreYouTube (n = 90)Bilibili (n = 90)p-Value
GQS score4.00 (2.00–4.00)4.0 (2.00–4.00)<0.05
DISCERN total score3.00 (1.25–4.00)1.00 (1.00–2.00)<0.001
D1—Clarity76 (84.44%)73 (81.11%)
D2—Sources cited64 (71.11%)22 (24.44%)
D3—Balanced/unbiased55 (61.11%)21 (23.33%)
D4—Additional sources provided39 (43.33%)18 (20.00%)
D5—Uncertainty mentioned18 (20.00%)13 (14.44%)
JAMA total score2.00 (2.00–3.00)1.00 (1.00–2.00)<0.001
J1—Authorship74 (82.22%)24 (26.67%)
J2—Attribution45 (50.00%)13 (14.44%)
J3—Currency81 (90.00%)77 (85.56%)
J4—Disclosure22 (24.44%)2 (2.22%)
Continuous variables presented as median (IQR); comparison via Mann–Whitney U test.
Table 4. (a). YouTube—comparison of video interaction by GQS grade. (b). Bilibili—comparison of video interaction by GQS grade.
(a)
VariableLow GQS (1–2)
n = 25
Medium GQS (3)
n = 19
High GQS (4–5)
n = 46
p-Value
Likes (counts)2299.00 (1196.00, 5201.00)2554.00 (97.50, 6607.50)1997.00 (222.50, 10,603.50)0.552
Comments (counts)227.00 (120.00, 693.00)68.00 (11.50, 376.50)129.50 (43.00, 474.50)0.129
Positive comment ratio (%)0.77 (0.50, 0.83)0.75 (0.46, 0.83)0.63 (0.40, 0.77)0.371
(b)
VariableLow GQS (1–2)
n = 34
Medium GQS (3)
n = 31
High GQS (4–5)
n = 25
p-Value
Likes (counts)389.00 (131.50, 1796.25)2243.00 (315.50, 11,641.50)2212.00 (783.00, 4996.00)0.007
Comments (counts)40.00 (11.25, 132.50)171.00 (34.50, 825.00)113.00 (55.00, 823.00)0.002
Positive comment ratio (%)0.23 (0.12, 0.30)0.30 (0.17, 0.42)0.33 (0.30, 0.43)0.003
Disclaimer/Publisher’s Note: The statements, opinions and data contained in all publications are solely those of the individual author(s) and contributor(s) and not of MDPI and/or the editor(s). MDPI and/or the editor(s) disclaim responsibility for any injury to people or property resulting from any ideas, methods, instructions or products referred to in the content.