Article

The Art Nouveau Path: From Gameplay Logs to Learning Analytics in a Mobile Augmented Reality Game for Sustainability Education


by
João Ferreira-Santos
* and
Lúcia Pombo
*
CIDTFF—Research Centre on Didactics and Technology in Education of Trainers, Department of Education and Psychology, University of Aveiro, 3810-193 Aveiro, Portugal
*
Authors to whom correspondence should be addressed.
Information 2026, 17(1), 87; https://doi.org/10.3390/info17010087

Submission received: 28 November 2025 / Revised: 29 December 2025 / Accepted: 9 January 2026 / Published: 14 January 2026
(This article belongs to the Collection Augmented Reality Technologies, Systems and Applications)

Abstract

Mobile augmented reality games (MARGs) generate rich digital traces of how students engage with complex, place-based learning tasks. This study analyses gameplay logs from the Art Nouveau Path, a location-based MARG within the EduCITY Digital Teaching and Learning Ecosystem (DTLE), to develop a learning analytics workflow that uses detailed gameplay logs to inform sustainability-focused educational design. During the post-game segment of a repeated cross-sectional intervention, 439 students in 118 collaborative groups completed 36 quiz tasks at 8 Art Nouveau heritage Points of Interest (POI). Group-level logs (4248 group-item responses) capturing correctness, AR-specific scores, session duration and pacing were transformed into interpretable indicators, combined with error mapping and cluster analysis, and triangulated with post-game open-ended reflections. Results show high overall feasibility (mean accuracy 85.33%) and a small subset of six conceptually demanding items with lower accuracy (mean 68.36%, range 58.47% to 72.88%) concentrated in specific path segments and media types. Cluster analysis yields three collaborative gameplay profiles, labeled ‘fast but fragile’, ‘slow but moderate’ and ‘thorough and successful’, which differ systematically in accuracy, pacing and engagement with AR-mediated tasks. The study proposes a replicable event-based workflow that links mobile AR gameplay logs to design decisions for heritage-based education for sustainability.

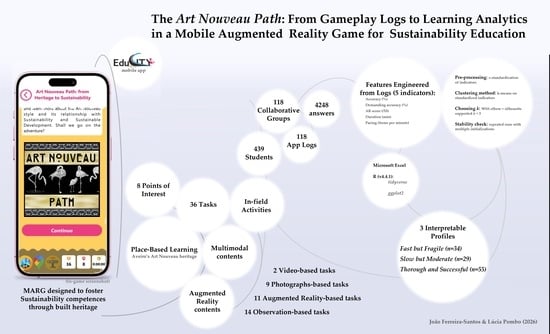
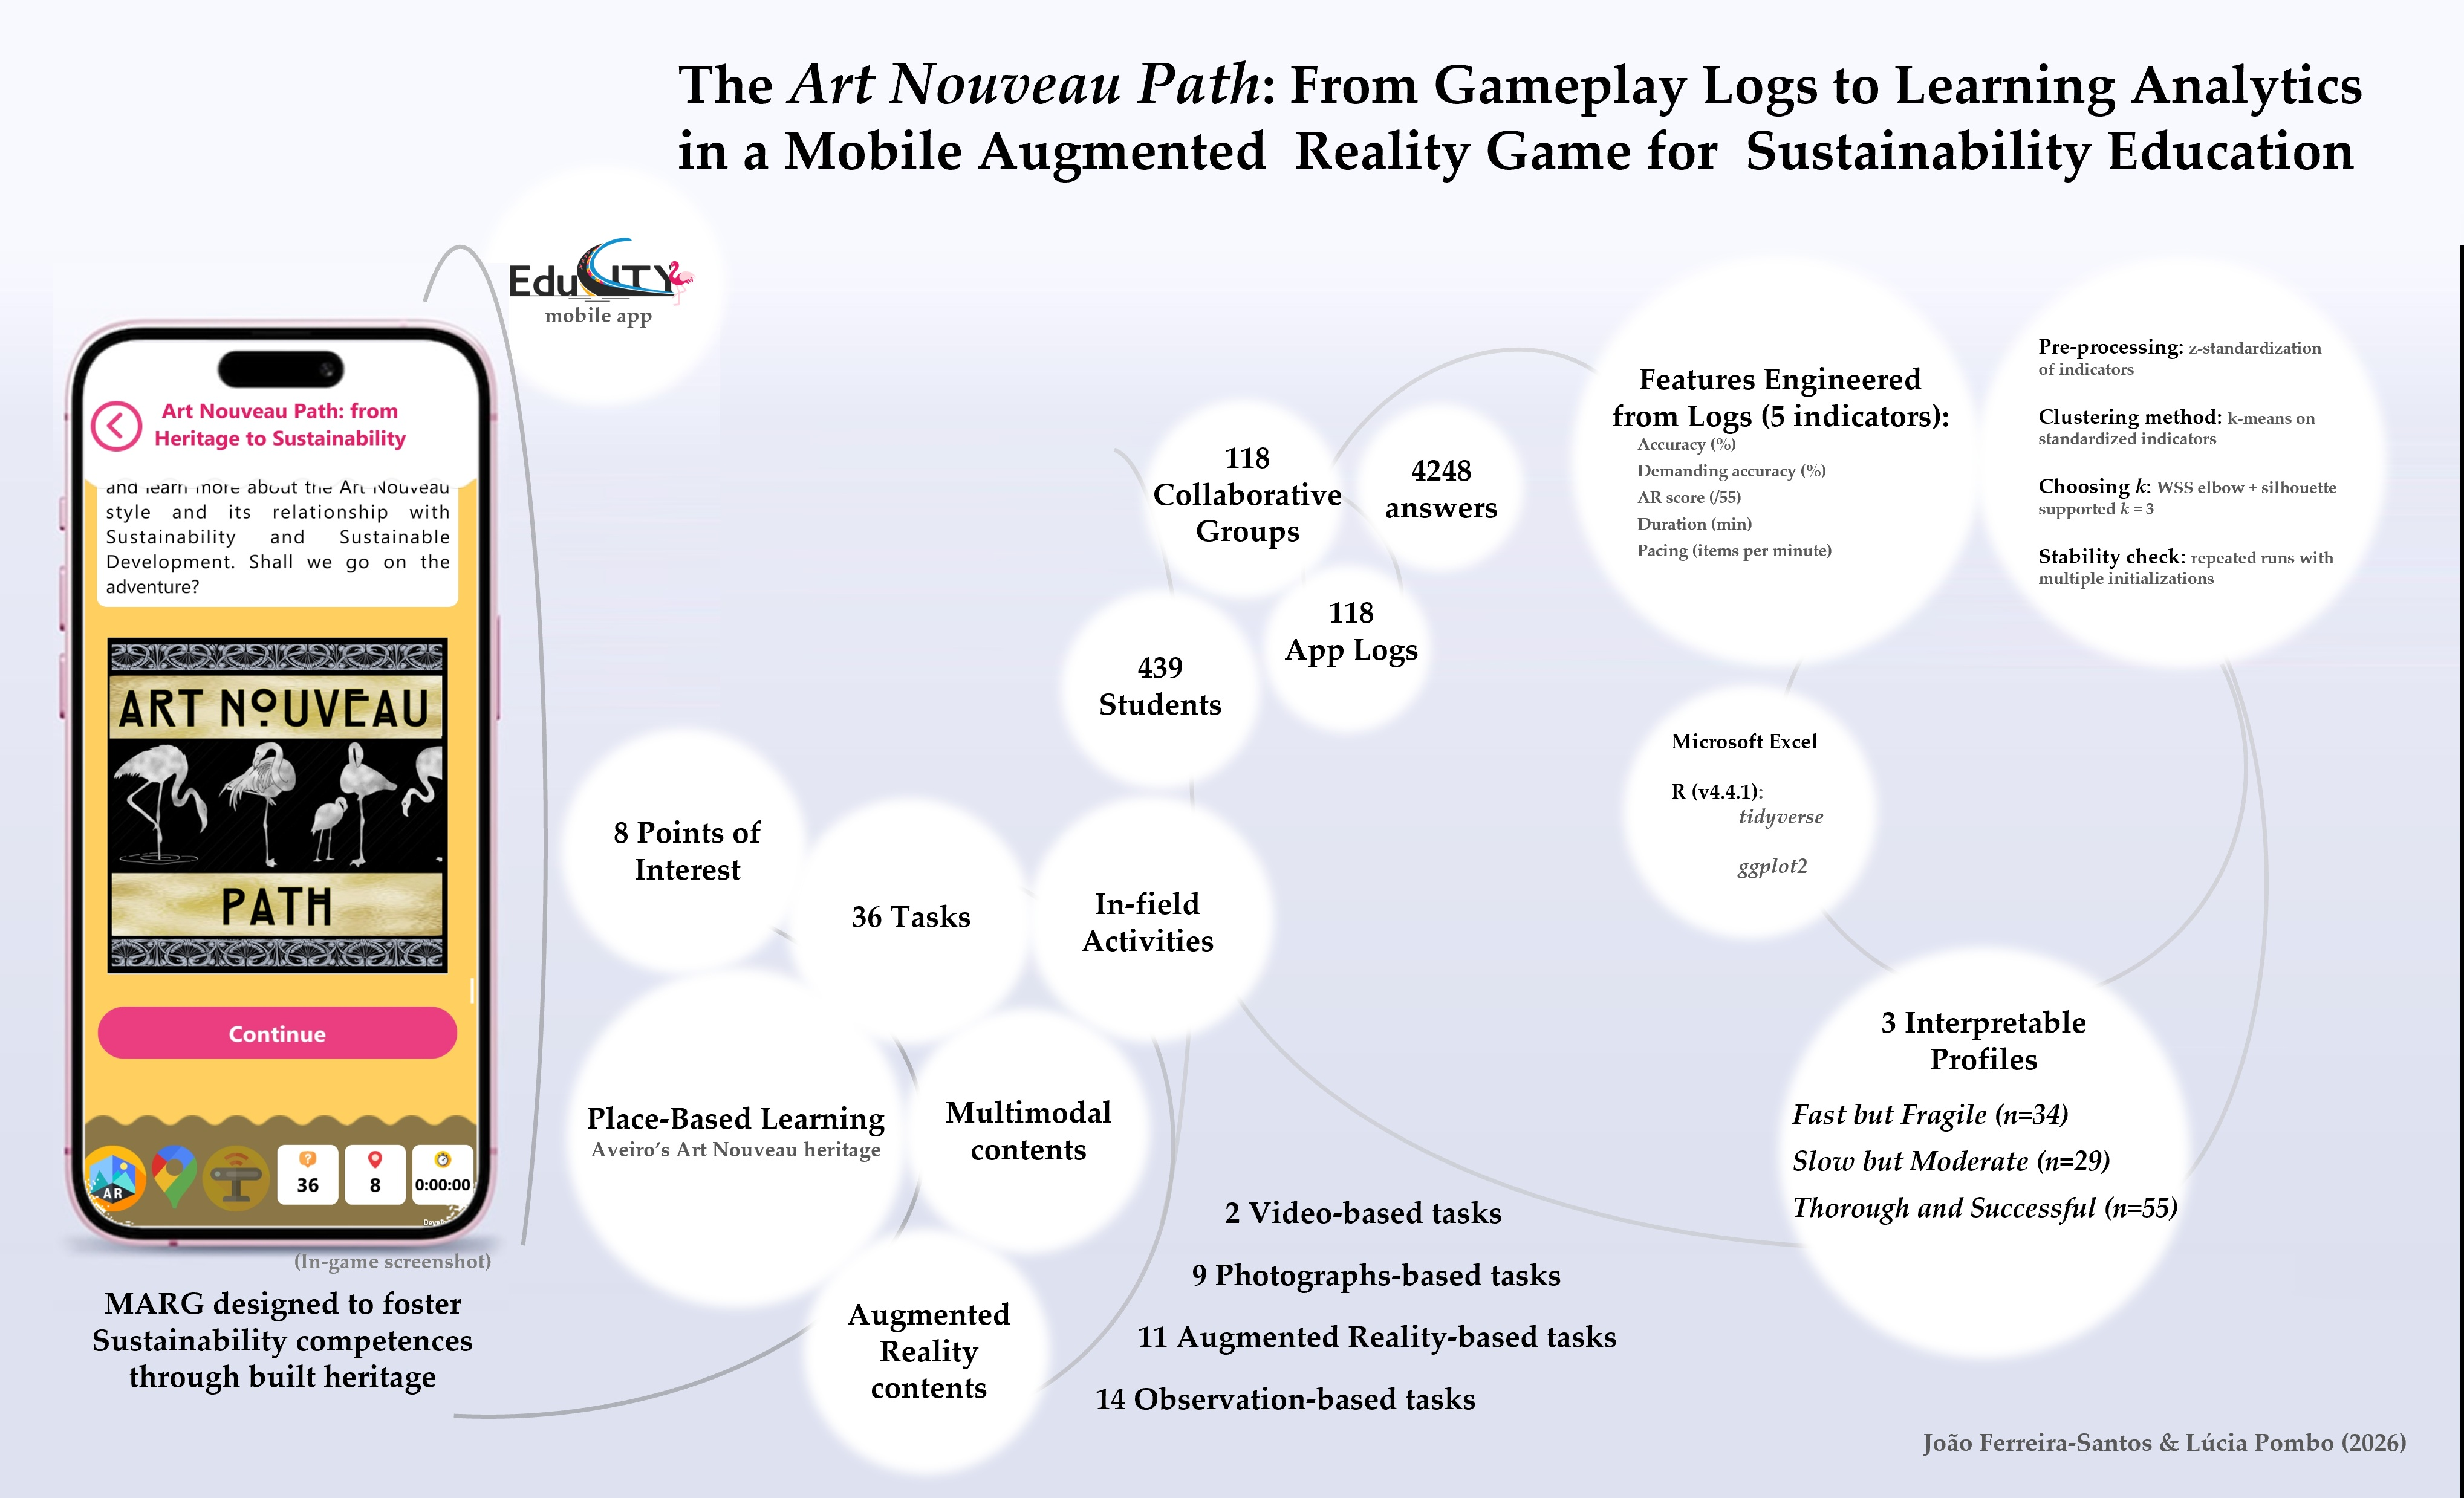
Graphical Abstract

1. Introduction

Augmented Reality (AR) has gained significant attention in education by providing enriched learning experiences that overlay digital information onto the physical environment. In educational contexts, AR activities have been associated with increased engagement, improved conceptual understanding and stronger connections between abstract content and concrete contexts. At the same time, there are significant challenges such as cognitive demands, technological reliability and the adaptation of conventional classroom strategies [1,2]. Research shows that AR can facilitate multiple inquiry-based activities, boosting experimentation as well as game-based learning (GBL) in multiple fields. The positive contributions of AR are highlighted, even though its impact varies depending on design quality and alignment with educational goals [1,2].
When AR is combined with mobile devices and location-based mechanics (LBM), everyday spaces such as school playgrounds, neighborhoods, streets or heritage-enriched areas can be transformed into meaningful and engaging learning environments. Mobile augmented reality games (MARGs) situate learners as active explorers of their surroundings, engaging them in challenge-based activities, supporting the interpretation of contextualized information and, when explicitly designed for this purpose, fostering collaborative decision-making and negotiation as they move through urban space [3]. This is particularly important in activities regarding Education for Sustainability (EfS). In these themed activities, learners engage with complex socio-environmental issues. Typically, these problems are linked to contexts or practices rather than limited to classroom settings or educational materials [4]. Recent studies have investigated AR’s contribution to enhancing environmental literacy and encouraging sustainable behaviors. These studies indicate that immersive experiences can support learners in linking sustainability concepts to their local cultural contexts [5,6,7,8,9,10].
At the same time, learning analytics (LA) has emerged as an important research and development field that uses digital traces of learner activity to understand and optimize learning processes, products and environments. In the context of GBL, game learning analytics (GLA) research has shown how telemetry data can be used to illustrate patterns of play, to identify misconceptions, to predict learning outcomes and to support iterative improvement of educational games [11,12]. Research emphasizes the increasing use of data science and multimodal analytics in gaming, encompassing clustering, sequence mining, predictive modeling, and visual analytics, typically structured within pipelines that convert raw data into meaningful insights for teachers, researchers, and designers [13,14,15,16,17,18,19,20].
Recently, LA and educational data mining have increasingly been applied to immersive technologies, such as Virtual Reality (VR), AR, and Mixed Reality [21,22,23]. However, a rapid analysis of recent literature reviews reveals a predominant focus on VR, with reliance on self-report data and limited systematic use of detailed interaction logs [24,25]. Research on LA for educational MARGs with school-age learners remains scarce, despite instances of telemetry usage to assess disengagement in augmented classrooms and examine mobile AR applications that enhance various competencies, particularly in Cultural Heritage and GBL [26,27,28]. Current studies indicate that the methodological and design possibilities of LA in mobile AR remain underdeveloped, particularly in urban gaming contexts that require collaborative engagement, such as the case study presented in this work.
Recent research has also examined the application of AR in cultural heritage, highlighting its potential to support the interpretation of historic sites, increase visitor engagement and facilitate exploration through mobile devices [29,30,31,32]. Several location-based MARGs and applications guide learners through museums and historic areas, embedding multimedia content and interactive activities at Points of Interest (POIs) [32,33]. However, evaluations of these systems have mainly relied on self-report questionnaires, basic usage metrics and qualitative feedback, with very limited research that uses the rich data produced during AR-enhanced heritage experiences as a resource for learning analytics. This gap is particularly pronounced in EfS, where recent AR-based studies emphasize attitudinal and motivational outcomes while largely neglecting detailed gameplay data and collective learning trajectories [7,8,10,34,35].
Together, these strands reveal a specific gap at the intersection of mobile AR, urban cultural heritage and EfS. While prior work has shown that AR-based heritage experiences and MARGs can foster engagement, environmental literacy and attitudinal change, there is still little evidence on how the fine-grained gameplay logs generated by collaborative groups in real urban settings can be transformed into interpretable learning analytics indicators and used to inform the design of sustainability-oriented educational games.
The present study is situated at the intersection of these strands, focusing on a location-based MARG that integrates urban cultural heritage and sustainability education. The Art Nouveau Path is a location-based MARG implemented in Aveiro, Portugal, within the EduCITY Digital Teaching and Learning Ecosystem (DTLE) (https://educity.web.ua.pt/, accessed on 10 November 2025). It engages student groups in a collaborative exploration of eight Art Nouveau heritage sites through 36 quiz-based tasks that combine multimodal resources, including AR overlays, archival imagery, video clips and narrative storytelling, to explore the educational value of Aveiro’s Art Nouveau heritage for the development of sustainability competences aligned with the GreenComp framework [36]. This MARG and its implementation have been developed within the doctoral research project of the first author.
Previous research on this MARG has analyzed its pedagogical design, teacher validation, alignment with the GreenComp framework [36], and impact on students’ sustainability conceptions and heritage awareness. These studies were based on teachers’ validation instruments: T1-VAL (available at: https://doi.org/10.5281/zenodo.15916129), T1-R (available at: https://doi.org/10.5281/zenodo.15917417), adapted GCQuest sustainability questionnaires administered at three moments: S1-PRE (available at: https://doi.org/10.5281/zenodo.16540741), S2-POST (available at: https://doi.org/10.5281/zenodo.17738943), S3-FU (available at: https://doi.org/10.5281/zenodo.17739015), group-level post-game reflections (S2-POST) and high-level gameplay indicators from the S2-POST logs to address questions about educational effectiveness, sustainability competences and narrative trajectories.
The present study addresses this opportunity by analyzing gameplay logs from 439 students, organized in 118 collaborative groups, who engaged with the Art Nouveau Path during the S2-POST of a repeated cross-sectional intervention designed to foster the development of sustainability competencies. Focusing on the S2 segment (post-game gameplay logs), it proposes and exemplifies a workflow for event-based learning analytics in a location-based mobile AR game and examines how the resulting indicators can be used to identify collaborative gameplay profiles and to inform the design and refinement of AR-mediated learning experiences. To connect behavioral patterns with learners’ own perspectives, the analysis integrates cluster-based profiles of group play with students’ qualitative reflections on collaboration, perceived challenge and perceived learning about sustainability and built heritage, derived from S2-POST group responses.
Building on this context, the study is guided by two research questions (RQ):
  • RQ1. How can raw gameplay logs from a location-based mobile augmented reality game be transformed into a structured set of learning analytics indicators that characterize collaborative group performance, pacing, and task-specific difficulty in sustainability education?
  • RQ2. What distinct collaborative gameplay profiles emerge when these learning analytics indicators are analyzed using cluster analysis, and how do these profiles relate to students’ qualitative reflections on collaboration, perceived challenge, and perceived learning about sustainability and urban cultural heritage?
This paper is structured in six sections. Following the Introduction and Related Work (Section 2), Section 3 details the research design, context, participants, instrumentation, and analytic procedures. Section 4 reports the results derived from gameplay logs, including indicator construction, item-level analyses, and the retained clustering solution. Section 5 provides a brief results synthesis that prepares the concluding argument. Section 6 consolidates the discussion of findings in relation to prior work, summarizes the main contributions, acknowledges limitations, and outlines implications, open problems, and future research directions.

2. Background and Related Work

This section provides a targeted narrative thematic synthesis of prior work directly relevant to the present study. The synthesis is organized around three strands: (i) AR and GBL in educational contexts, (ii) learning analytics in game-based and immersive environments, and (iii) mobile AR in cultural heritage and sustainability-related contexts. Following both a Design-Based Research (DBR) [37,38] and an integrative thematic approaches [39,40,41,42,43,44], it was used hybrid inductive and deductive structuring to consolidate definitions, methodological precedents, and evaluation patterns that inform our logging strategy, indicator design, and interpretation logic. This review is not intended as a systematic mapping of the field; Appendix A lists the core sources used as anchors for the synthesis.
The following subsections examine each strand in turn, beginning with AR and GBL in educational contexts, followed by LA in game-based and immersive environments, and mobile AR in cultural heritage and sustainability-related contexts, and concluding with previous work on the Art Nouveau Path and the specific contribution of the present study.

2.1. AR and GBL in Educational Contexts

Previous works on AR in educational contexts demonstrate that this technology may increase engagement, support conceptual understanding and connect abstract content to real environments, but that its impact depends strongly on careful pedagogical design and curricular integration [1,2]. Studies synthesized in these works span Sciences, Mathematics, History and Language learning, and often report positive learner perceptions while also documenting challenges such as cognitive overload, technical breakdowns and difficulty in promoting activities in a classroom context.
When AR is embedded in GBL, the potential for learners’ immersion and engagement can be extended. Game mechanics such as quests, timed challenges and rewards are layered onto AR overlays and multimodal content, transforming curricular tasks into interactive missions.
Recent empirical work with AR-based games in Mathematics, for example, has presented positive effects on students’ critical thinking and problem-solving competencies when compared to more traditional educational activities, although these gains are not uniform across all learners and tasks [45]. Research with younger learners using games with AR features has also highlighted the importance of age-appropriate interaction design and the role of narrative, storytelling, and properly developed feedback in sustaining both curricular value and engagement [26].
In sustainability-related educational activities, AR has been used to situate environmental issues in authentic, real-world and locally grounded contexts, such as within schoolgrounds, local urban or natural environments. Several studies report that AR can foster environmental literacy, promote attitudes towards Education for Sustainable Development (ESD) and EfS, particularly when activities are designed to be embodied, inquiry-oriented and combined with social interaction [7,10]. Experimental studies with AR texts and immersive scenarios have revealed improvements in students’ attitudes towards environmental issues and sustainable development topics, as well as gains in environmental literacy and self-motivation towards these themes [6,9]. These works suggest that AR-enhanced GBL in educational settings can be a powerful tool for students’ engagement regarding EfS. Nevertheless, most evaluations still rely on pre- and post-questionnaires and other self-report instruments, paying relatively little attention to the rich process data generated during gameplay, such as detailed gameplay logs.

2.2. LA in Game-Based and Immersive Environments

In education, LA is often defined as the measurement, collection, analysis and reporting of data about learners and their contexts, for the purpose of understanding and optimizing learning and the environments in which it occurs [46]. Recent works highlight benefits such as supporting teaching practices, institutional monitoring and the early identification of students at risk, while also pointing to persistent challenges around ethics, privacy, data quality and the evaluation of impact in authentic settings [47,48].
Within this field, this work aligns with studies that use learner-generated traces not only for prediction or risk detection, but also as a basis for design-oriented reflection on how learning activities occur in situ.

2.2.1. LA in Games and Serious Games

LA in GBL is an emergent area that has developed into a substantial subfield often referred to as GLA. Empirical studies illustrate that researchers have used gaming data to discern patterns of gameplay, conceptualize learning processes and their resultant effects, and guide the iterative development of serious games [12]. Alonso-Fernández and colleagues [13] examined the applications of data science techniques to GLA data and distinguished between descriptive, diagnostic, predictive and prescriptive use of gameplay logs, ranging from simple frequency counts to clustering, sequence mining and predictive modeling.
Regarding the value of multimodal and visual analytics, Emerson and colleagues [11] argue that multimodal LA approaches in combination with gameplay logs data with other indicators such as eye tracking, gesture or physical signals, may be used to better capture the complexity of GBL processes. Alonso-Fernández and colleagues [14] proposed a GLA pipeline that blends data mining with visual dashboards, aiming to provide interpretable indicators for teachers and game designers, illustrating how heatmaps, progression charts and error distributions can guide the refinement of game levels, narrative, and feedback mechanisms.
Other research has highlighted the capacity of LA to improve usability and efficacy within formal educational contexts. Daoudi [16] presented a study focused on how LA has been used to improve the usability of serious games in educational contexts, identifying the need for tighter integration between analytics, user-centered design and curricular demands. Banihashem and colleagues [15] synthesized research on LA focused on online GBL. They proposed a framework that organizes metrics into engagement, performance and behavioral categories. Rivera-Uscanga and colleagues [19] equally researched on LA usage in serious games. Their study highlights the predominance of log-based measures of time on tasks, attempts and scores. They also presented emerging work using clustering and predictive models. Sánchez Castro and colleagues [20] used GLA from serious games as predictors of students’ linguistic competence and academic performance, while Lu and colleagues [18] constructed prediction models that operationalize stealth assessment in a game-based learning environment. Calvo-Morata and colleagues [49] stated that LA can guide the development of a programming-themed serious game by revealing players’ difficulties, which strategies they adopt to overcome those difficulties, and how game-design processes have a direct impact on progression patterns.
Within these works, a unifying concept involves the design of pipelines that transform unrefined gameplay logs into performance-related metrics, strategic approaches, engagement levels, and challenge assessments. These indicators can then be used for evaluation and game design, but also to undertake research. At the same time, work on LA has motivated improvements in learning design, but the field remains relatively immature, with limited evidence that analytics pipelines consistently inform or enhance instructional design in systematic ways [50]. This emphasizes the need for contextually aware workflows that link gameplay logs to comprehensible indicators that are readily applicable by teachers and designers.

2.2.2. LA in Extended Realities (XR) and AR

Recent studies on this topic have begun to explore LA and educational data mining in XR environments, including VR, AR and, more recently, metaverse platforms.
Lampropoulos and Evangelidis [24] conducted a review, content analysis and bibliometric study of LA and educational data mining in XR and reported that most of the empirical work focuses on VR, with relatively fewer studies examining AR-based learning experiences. These authors also reported that many XR studies rely predominantly on self-report data collection tools, with limited use of fine-grained interaction logs and advanced analytics techniques. Sakr and Abdullah [25] similarly reviewed research on VR and AR in education from a learning analytics perspective, highlighting the predominance of small-scale studies, the lack of longitudinal designs and the need for more transparent reporting of analytics workflows.
From a location-based perspective, Fonseca and colleagues [51] present a systematic review of 50 empirical studies on Location-Based Augmented Reality (LBAR) in education that confirms these trends. This study reports that most of the interventions relied on descriptive statistics and self-reported instruments regarding motivation, engagement or perceived learning, with only a minority implementing control-group designs or standardized performance-based assessments. It was also reported that very few implementations exploited detailed interaction logs or multimodal traces as part of an explicit analytics pipeline.
Singh and colleagues [28] proposed an AR analytical framework, which harnesses interaction data to recognize and tackle disengagement during the education of young children, demonstrating the role of in situ analytics in guiding educators’ decisions. More recently, Abdul Razak and colleagues [26] researched LA for children through the implementation of augmented reality gaming. This analysis explored the ways these target-aged learners explore AR designs, assessing their performance data and engagement metrics. Cheng [27] analyzed LA derived from a mobile AR app designed to enhance cultural competence in higher education, combining log data with performance and self-report measures to understand how students engaged with AR-mediated cultural content.
These works illustrate that AR-enriched educational experiences can produce intricate interaction data that are amenable to the analysis of learning processes. At the same time, they underline that work in this area is still relatively scarce, particularly in school contexts and in games that unfold in complex physical environments such as cities. Systematic reviews of XR and LBAR research converge in pointing to methodological limitations, including short interventions, lack of control conditions and an overreliance on questionnaires, along with a relative absence of transparent, replicable analytics workflows operating on event-level interaction data. Despite the growing number of studies in this area, there is still a need for research that examines analytical methods for AR data and produces reproducible methodologies suited to the specific features of mobile, collaborative AR games.

2.3. Mobile AR, Cultural Heritage and Sustainability Related Contexts

AR has been widely explored in cultural heritage as a possibility to enhance interaction and learning about historic sites and artifacts. Recent work has extended these approaches into AR, namely MARGs and playful experiences. Xu and colleagues [32] presented HeritageSite AR, a mobile exploration game for a Chinese heritage site that combines AR overlays, navigation and puzzles to support visitor engagement, and evaluated its usability and perceived educational value. Capecchi and colleagues [33] designed an AR-based serious game to engage the so-called alpha generation [52] with urban cultural heritage, showing that mobile AR mechanics can attract young audiences to heritage sites and stimulate discussion about place identity and history.
Chatsiopoulou and Michailidis [29] reviewed AR applications in cultural heritage and synthesized design, development and evaluation approaches, identifying recurrent patterns such as overlaying historical reconstructions onto ruins, providing in situ storytelling and offering interactive tours through mobile devices.
These related projects illustrate how mobile AR can turn heritage districts into real game boards and narrative spaces, where learners navigate between POIs, access multimodal content and perform situated tasks.
Research conducted by Fonseca and colleagues [51] lends further support to these conceptions from the perspective of LBAR. This study reveals that cultural heritage and history are among the most prevalent application domains for LBAR in education, along with environmental science and ecology. A considerable proportion of implementations are performed as field trips, non-compulsory outdoor activities, or informal visits. These are frequently enhanced by mobile AR tours or games that encourage learners to traverse between real-world locations while accessing context-specific information and tasks.
A growing number of recent studies have used AR in environmental and sustainability education. Ladykova and colleagues [7] conducted a comprehensive review of AR within environmental education and discovered that many interventions report enhancements in environmental cognition and attitudes, frequently through experiential activities conducted in natural settings or laboratory environments that integrate AR content with authentic ecosystems. Simon and colleagues’ research [10] executed a scoping review of AR in environmental education, underscoring opportunities for embodied learning and local pertinence, while advocating for more stringent methodological designs and a broader spectrum of evaluative techniques. Experimental studies have shown that AR experiences can augment environmental literacy, intrinsic motivation, and intentions towards sustainable conduct [6,9], and that VR and AR scenarios can facilitate reflection on green energy and sustainability-related behavioral alterations [8] or enhance environmental consciousness among wider audiences [5].
In sum, across both cultural heritage and environmental education, the dominant evaluation methods remain questionnaires, pre- and post-tests, interviews and observations, sometimes complemented by simple usage metrics such as time spent or number of AR triggers activated. Very few studies consider the detailed structure of AR-mediated tasks, the sequence of actions taken by learners in urban heritage routes or the distribution of errors across different types of content and locations as a source of learning analytics. While Cheng [27] offers an example of how mobile AR can be combined with learning analytics to examine cultural competence in higher education, there is still a lack of research that integrates mobile AR, built heritage, sustainability competences and event-based LA derived from gameplay logs in educational contexts.

2.4. Previous Work on the Art Nouveau Path and Contribution of the Present Study

The Art Nouveau Path has already been analyzed in several works that addressed complementary facets of its design and educational impact. One line of work focused on the pedagogical design of the game within the EduCITY DTLE, its alignment with the GreenComp framework [36] and its validation with teachers, showing how mobile AR and built heritage can be combined to foster sustainability competences in school contexts [53,54]. These studies reported the DBR process [37,38], the simulation-based workshop with in-service teachers and the subsequent curricular review, emphasizing the perceived pedagogical value and curricular relevance of the game.
A second line of work examined students’ sustainability conceptions and their relationship with urban heritage before playing the game and over time. Using a longitudinal, repeated cross-sectional design with adapted GCQuest sustainability questionnaires (S1-PRE, S2-POST and S3-FU) with open ended prompts at three moments (pre-, post-, and follow-up, respectively), this research documented how situated, multimodal experiences with the Art Nouveau Path may support changes in how students describe Sustainability, attribute value to the Art Nouveau district and articulate links between built heritage and broader socio-environmental issues [54,55].
More recently, gameplay data from the Art Nouveau Path have also been treated as geoinformation. This study analyzed the physical path itself, and spatial narrative structures emerging from the 118 group sessions, combining gameplay logs, post-game reflections and teachers’ observations (T2-OBS) to explore how students move through and make sense of the Art Nouveau district as a learning landscape [54,55]. This work highlighted the potential of mobile AR to generate semantically enriched movement data and to support narrative cartography in urban heritage education.
These works contribute to the study of AR in EfS-designed activities, DTLE, and heritage-based learning by providing empirical evidence that a MARG, when properly designed, may support curricular integration, promote sustainability-related reflection and generate meaningful spatial storytelling data. Methodologically, however, these works have relied primarily on teachers and students’ questionnaires with open-ended responses, pre- and post-comparisons and high-level gameplay indicators such as total scores, completion rates and aggregate accuracy. The more fine-grained gameplay logs, which record group-level responses to each of the 36 quiz-type tasks, including correctness, AR-specific scoring and completion status across the eight POIs, have not yet been systematically analyzed from an LA perspective.
This study addresses this gap and contributes at three levels. First, at the methodological level, it specifies an event-based, field-ready learning analytics workflow that transforms group-level gameplay logs from a location-based MARG into a compact family of interpretable indicators. Second, at the descriptive level, it applies clustering to these indicators to derive collaborative gameplay profiles that capture co-occurring patterns in accuracy, pacing, and engagement with AR-mediated items. Third, at the design level, it uses item- and POI-level error mapping to identify recurring breakdowns and translate them into actionable implications for task refinement and scaffolding. The study is design-oriented and observational and does not estimate causal effects of AR on learning outcomes.

3. Materials and Methods

3.1. Research Design and Educational Context

This study is part of a broader DBR approach [37,38] centered on the Art Nouveau Path, a location-based MARG implemented in Aveiro, Portugal, within the EduCITY DTLE. The overall research design follows a quasi-longitudinal, repeated cross-sectional structure that combines design, enactment and iterative refinement of the intervention in authentic educational contexts [53,54]. The data collection instruments and sources are presented in Table 1.
Across the wider project, three student questionnaire moments were implemented: a baseline prior to gameplay (S1-PRE, N = 221), an immediate post-game questionnaire (S2-POST, N = 439) and a follow-up questionnaire several weeks later (S3-FU, N = 434). These instruments focus on students’ sustainability conceptions, values, and perceptions of the game and have been analyzed in detail in previous works [53,54]. Teacher validation questionnaires (T1-VAL, N = 30) and interviews with expert teachers (T1-R, N = 3), together with in-field teacher observations during gameplay (T2-OBS, N = 24), complement this student-focused data within the broader research design [53,54].
This study focuses specifically on the post-test implementation segment in which the Art Nouveau Path was played in the field (S2) and on the group-level gameplay logs generated by the EduCITY app (version 1.3) during these sessions. These logs have previously been used to characterize item difficulty and spatial trajectories in an analysis of geoinformation and spatial storytelling, and to explore the relationship between AR exposure and time on task [55]. Here, they are reanalyzed from a learning analytics perspective, with different research questions and methodological emphasis that focus on the construction of indicators and the identification of collaborative gameplay profiles. In addition, a subset of individual-level written reflections collected immediately after gameplay through selected S2-POST open-ended prompts is used to complement and interpret the profile structure [54].
During the S2 implementation considered in this study, 439 students, aged 13–18, were distributed across 19 classes from 6 different grades (7th: N = 19; 8th: N = 135; 9th: N = 156; 10th: N = 37; 11th: N = 20; 12th: N = 72), from urban and peri-urban schools, participated in the Art Nouveau Path activity. The students’ cohort is a convenience sample within the municipal educational action program [56] rather than as a statistically representative sample of all students in the region.
Students were organized by their teachers into collaborative groups that typically comprised three or four members, resulting in 118 groups playing the game in the field. Each group used a single shared EduCITY-owned mobile device, with the EduCITY app (version 1.3) and MARG installed, and gameplay unfolded during regular lessons around the main Art Nouveau district of Aveiro. The use of single mobile devices per group aimed to foster collaboration, reflecting realistic device availability and the same MARG experimentation. Classroom teachers accompanied the groups, handled logistics and ensured that the activity was aligned with curricular goals related to sustainability, urban space and cultural heritage.
Participation was voluntary, and informed consent was obtained from all teachers and from students with supplementary parental or legal guardians’ authorization. No personally identifiable data was collected. Socio-economic background and gender data were not collected, since the study focused on group-level gameplay patterns rather than comparisons between demographic subgroups, and sought to keep data collection as unobtrusive as possible. This decision is consistent with research questioning the explanatory power of specific demographic variables in similar contexts [57], although it limits the examination of group-specific variation.
Participation followed the practical constraints of an authentic educational-based field deployment and should be considered a convenience sample of classes participating in the activity within the project’s implementation context. The study, therefore, targets ecological validity and methodological demonstration of the analytics workflow rather than population-level representativeness.

3.2. The Art Nouveau Path MARG and the EduCITY DTLE

The Art Nouveau Path is a MARG embedded in the EduCITY DTLE and played through the EduCITY app (version 1.3). This MARG is designed as a circular path that connects eight georeferenced POIs in Aveiro’s Art Nouveau district. At each POI, participants encounter quiz-like tasks that are anchored in architectural details, historical narratives and sustainability themes, and that are delivered through AR content and multimodal media. In total, this MARG comprises 36 quiz items, internally coded from P1.1 to P8.2. These items draw on a range of resources, including archival photographs, AR overlays anchored to facades, short videos and on-site visual observation, as presented in Table 2.
Overall, Table 2 shows that the 36 quiz items are unevenly distributed across Points of Interest and media types, with AR-mediated tasks concentrated at POIs 1, 2, 4, 5, 6 and 7 and particularly numerous at POIs 5 and 6. Most POIs combine at least two different media.
Tasks prompt students to notice specific architectural elements, to distinguish original from altered features, to connect decorative motifs to local fauna and flora and traditional crafts, and to reflect on tensions between conservation and modernization in the city. The design aligns these tasks with dimensions of the GreenComp sustainability competence framework [36], such as valuing sustainability, embracing complexity and acting for sustainability, while also addressing school curriculum content [53,54].
This MARG’s narrative was designed to be place-based and collaborative. Students navigated the path using the map view in the EduCITY app (version 1.3), which presented the circular path and the eight POIs. The mobile device camera was used to detect AR markers and trigger the AR overlay content when participants were prompted to reveal overlays or to align markers with real facades or architectural details. For each item, the group selected one of several alternatives and submitted the response via the app. Correct responses yielded points, and AR-mediated items contributed to an AR-specific score that summarizes the group’s task performance on AR-mediated items under the app scoring rules. Although this score has been discussed in relation to trajectory analysis and AR exposure [3], in this study, it is treated as an outcome-oriented indicator of AR-mediated task success rather than as a direct measure of AR exposure or learning gains. In the present study this AR-specific score is treated as one of the key LA indicators.

3.3. Data Sources for LA

3.3.1. Automated Gameplay Logs

The primary data source for this study consists of anonymized group-level gameplay logs generated automatically by the EduCITY app (version 1.3) during each session of the Art Nouveau Path. In the 1.3 version of the EduCITY app, the logging system records, for each group and session, the date, start and end timestamps, total score, AR-specific score, number of correct and incorrect responses and the duration of the session in minutes. At the item level, it records the completion status for each of the 36 quiz items (P1.1 to P8.2), item-level correctness and, when a response is incorrect, the specific distractor chosen by the group. Logs are stored at the device (group) level only and do not include usernames, demographic information or individual identifiers. The temporal resolution of the logs is adequate to compute session-level duration and to reconstruct which items were completed, but does not allow precise estimation of dwell time at each POI. Data was recorded at each mobile device due to the absence of SIM cards or mobile data. The data was subsequently synchronized securely to a dedicated server at the University of Aveiro. This practice guaranteed data integrity and mitigated connectivity problems during field operations.
After excluding non-data rows used for summary statistics in the raw file, the log dataset comprises 118 group sessions. For each group, there is a record of responses to up to 36 items. In the cleaned analytical dataset used in previous publications, each of the 36 items has 118 recorded responses, yielding a total of 4248 group-item interactions, of which 3625 are correct and 623 incorrect, corresponding to an overall accuracy of 85.33 percent (%) [3]. The same underlying logs are now used to derive learning analytics indicators that characterize collaborative performance, pacing and task-specific difficulty at the group level.

3.3.2. Group-Level Gameplay and Individual Post-Game Reflections

To complement behavioral traces with learners’ own accounts, the study also draws on individual responses to selected open-ended questions from the immediate post-game questionnaire (S2-POST), which are subsequently considered at the group level. At the end of the Art Nouveau Path implementation, each participant was invited to answer the post-game questionnaire, which had a brief set of open prompts that asked, for example, what they felt they had learned about sustainability and urban heritage, which tasks or moments they found most challenging, how they collaborated as a group and how the AR features influenced their experience. In total, 439 individual reflections were collected, corresponding to a mean of 3.72 reflections per collaborative group (439 reflections across the 118 groups). Because reflection submission was not uniform across groups and students, reflections are used for qualitative triangulation and illustration rather than for profile-level prevalence statements.
Whereas previous work has subjected S2-POST open responses to full reflexive thematic analysis with a GreenComp-oriented codebook [36,54], this study uses these written reflections in a more targeted way. Individual reflections that can be reliably associated with the groups represented in the logs are linked to the corresponding group-level gameplay records and to cluster membership in the gameplay profiles. These reflections are then used to interpret and illustrate the collaborative gameplay profiles identified through cluster analysis. The aim is not to recode the full dataset, but rather to connect quantitatively derived profiles with how participants described their collaboration, perceived challenge and perceived learning. Considering that gameplay was conducted in teacher-formed collaborative groups, multiple individual reflections can correspond to a single gameplay session. Given 439 students distributed across 118 groups, the average group size is approximately 3.7 students, which implies up to about three to four reflections per group, although response completeness may vary. In this study, reflections are used for illustrative triangulation of profile interpretations and are not treated as individual-level outcome measures.

3.4. Data Processing and Feature Engineering

Raw device-level gameplay logs and post-game reflections were (i) screened and cleaned for integrity, (ii) transformed into group-level indicators capturing performance, AR-mediated task performance, and temporal organization, (iii) used to derive item-level error maps and an empirically defined demanding-item subset, and (iv) standardized to support descriptive mapping and cluster-based profiling.
Data processing integrated the automated gameplay logs and the individual-level reflections and proceeded in four main stages: data were initially cleaned and preprocessed in Microsoft Excel, then analyzed and visualized in R (version 4.4.1), using the tidyverse ecosystem (including readxl, dplyr and ggplot2) and base stats functions. Cross-checks were performed to ensure analytical correctness.
First, a data cleaning stage addressed basic integrity issues in the logs. Session records were reviewed for missing or inconsistent values, such as cases where start or end timestamps were absent or where item completion statuses were clearly incompatible with the recorded number of responses. Non-data rows corresponding to pre-calculated means and counts were removed, as were obvious duplicate entries. Although no groups were affected by documented technical failures, such as app crashes, students and teachers were asked to report this. This was cross validated with gameplay logs.
Second, event-level log entries were transformed into group-level indicators that summarize performance and behavior across the session. For each group, the following baseline indicators were computed, building on previous analyses of the same dataset [3]: (1) total number of items completed out of 36; (2) overall accuracy, defined as the proportion of correctly answered items; (3) mean accuracy per POI, obtained by aggregating correctness across items within each of the eight POI; (4) mean accuracy by media type, distinguishing between AR-mediated items, video-based items, direct-observation items and photograph-based items, as in earlier work; and, (5) session duration in minutes, computed as the difference between end and start timestamps.
In addition, we used the app-recorded AR-specific score as an indicator of success in AR-mediated tasks. At the session level, the logs store an AR-specific score that summarizes performance on the subset of 11 items mediated by augmented reality, with values ranging from 0 to 55 points under the app’s scoring rules. Given the log granularity available in this deployment, this variable should be interpreted as AR-task performance (successful completion and correctness within AR-mediated items), rather than as a direct measure of time-on-AR exposure or as evidence of AR-facilitated learning gains. In earlier analyses [55], this score was used to operationalize higher vs. lower AR-task performance in relation to exploration time; in the present study, it is included as a continuous feature to support multivariate profiling of collaborative gameplay behavior.
Conceptually, the five indicators used for profiling do not represent homogeneous “learning outcomes”. Overall accuracy, accuracy on demanding items, and the AR-specific score primarily capture cognitive task performance under the implemented scoring rules, while session duration and pacing index capture temporal and strategic organization of collaborative activity (how groups allocate time, regulate speed, and progress across tasks). Moreover, reflections were not uniformly distributed across groups, which further constrains interpretability and precludes prevalence statements at the profile level. This distinction is important to avoid overinterpretation, because the study is observational and log-based, and the derived profiles should be read as behavioral configurations that can inform design decisions rather than as causal evidence of instructional effectiveness. Accordingly, these indicators are treated as proxies for observable interaction patterns and in-game task performance within this specific design and deployment context, and they do not establish learning gains or sustainability competence development. Learning-relevant interpretations are therefore made cautiously and are supported through triangulation with participants’ post-game reflections and the design rationale, rather than inferred from the logs alone.
Third, error mapping indicators were derived at the item and category levels. For each one of the 36 items, the proportion of incorrect responses was calculated, yielding an item difficulty index that complements the accuracy measures. Items previously identified as particularly challenging in terms of conceptual load or contextual complexity in earlier path analysis work on the same dataset, such as those that demand interpretation of dense facades or abstract sustainability concepts, were used to construct a composite indicator of performance on demanding tasks [55]. Specifically, the demanding items subset comprised the six tasks with the lowest accuracy in the dataset, namely P5.4 (58.47%), P6.4 (67.80%), P2.1 (69.49%), P4.4 (69.49%), P1.5 (72.03%) and P6.5 (72.88%). Items were also grouped by media type and by POI, allowing the computation of error rates for categories such as AR-mediated items in dense streetscapes or non-AR items focused on more abstract sustainability concepts.
Fourth, a subset of these group-level indicators was selected as inputs for cluster analysis and standardized to have a mean of zero and unit variance. This subset included overall accuracy, accuracy on the demanding items subset (defined as the proportion of correct responses on the six lowest-accuracy items in the full sample, identified through item-level error mapping), the AR-specific score, session duration, and a pacing index defined as the ratio between the number of completed items and the session duration. Standardization ensured that indicators measured on different scales, such as percentages, scores and times, contributed comparably to the distance metrics used in the clustering procedure. Indicators with negligible variance, such as the share of completed items given that all groups completed the 36 tasks, and highly collinear indicators were inspected and, where necessary, omitted to improve stability and interpretability of the clusters.
Analytically, the study follows an end-to-end pipeline. First, raw gameplay traces are aggregated at the collaborative group level, preserving the unit at which tasks were completed in the field. Second, these traces are transformed into five indicators that capture complementary facets of performance and in-the-wild interaction organization: overall accuracy, accuracy on demanding items, an AR-specific score recorded by the system, session duration, and a pacing index (items per minute). Third, the indicator set is used for descriptive mapping (item and POI error patterns) and for profile derivation via clustering on standardized indicators. Finally, interpretation connects profile-level patterns to external evidence through targeted reading of post-game reflections and teacher observations, treated as contextual explanations rather than causal estimates.

3.5. Analytical Procedures

3.5.1. Descriptive Analytics and Error Mapping

To address the first RQ, the study began with descriptive LA of the gameplay logs. Distributions of overall accuracy, AR-specific scores, session durations and completion rates were examined across the 118 groups. Accuracy and error rates were summarized by media type and by POI, and item difficulty indices were used to identify tasks that posed challenges. These summaries extend, based on a LA perspective, the earlier descriptive statistics reported for the same dataset by connecting them explicitly to performance, pacing and task difficulty indicators relevant for educational design [55].
Visualizations such as bar charts and heatmaps were used to map error distributions across items and POI and to compare performance patterns between AR-mediated and non-AR items. This descriptive layer established an overview of how collaborative groups performed along the path and where difficulties tended to concentrate, providing the empirical basis for the construction and interpretation of collaborative gameplay profiles.

3.5.2. Cluster Analysis and Collaborative Gameplay Profiles

To address the second RQ, the cluster analysis technique was used to identify the possibility of existence of different collaborative gameplay profiles based on the standardized group-level indicators described above. These different profiles were perceived by the researcher during the Art Nouveau Path implementation sessions. An exploratory hierarchical clustering analysis, using Ward linkage and Euclidean distance, was first calculated to inspect the structure of the data and to obtain an initial sense of how many clusters might be substantively meaningful. Dendrograms and changes in within-cluster variance were examined to identify plausible solutions.
Building on this process, k-means clustering was then applied for a range of candidate cluster numbers. The final number of clusters was defined by combining statistical criteria, such as the elbow method and average silhouette width, with considerations of pedagogical interpretability, cluster size, and by cross-checking with in situ researcher fieldnotes. The aim was to obtain a solution in which clusters differed in coherent ways along key indicators such as overall accuracy, AR-specific score, performance on demanding items and pacing, while avoiding clusters with very few groups. Concretely, the total within-cluster sum of squares (WSS) and average silhouette width across candidate solutions (k = 2 to k = 6) were inspected on the z-standardized 118 × 5 indicator matrix. WSS decreased from 339.790 (k = 2) to 251.224 (k = 3), with progressively smaller marginal improvements thereafter; although average silhouette width was highest for k = 2 (0.414), the k = 3 solution (0.369) remained acceptable and was retained as a parsimonious and pedagogically interpretable compromise. For practical stability, k-means was run with multiple random initializations (nstart = 50), and reruns under alternative seeds produced identical memberships (0 groups changing; Adjusted Rand Index (ARI) = 1.000 vs. the reference run). Table 3 reports the model selection diagnostics (WSS and average silhouette width) for candidate solutions (k = 2–6), supporting k = 3 as a parsimonious and interpretable compromise.
Table 3 shows that WSS drops markedly from k = 2 to k = 3 and then flattens, indicating diminishing returns for additional clusters. Although average silhouette width is highest for k = 2, the k = 3 solution remains acceptable and was retained as a parsimonious and pedagogically interpretable compromise. Table 4 reports the corresponding seed-based stability checks (ARI and number of groups switching membership) for the retained k = 3 solution.
As presented in Table 4, the k = 3 solution was invariant across alternative random seeds with nstart = 50 (ARI = 1.000 in all comparisons and 0 groups changing membership), indicating high practical stability with respect to centroid initialization.
Once the clustering solution was fixed, each cluster was characterized by its mean values and distributions for all learning analytics indicators. These comparative profiles were then used to propose descriptive labels for the clusters, for example, highlighting groups that combined high AR-task performance with high accuracy, groups that progressed quickly but with more errors or groups that completed fewer items but performed strongly on conceptually difficult tasks. This analysis moves beyond single indicators to capture patterns of co-occurring behaviors that define collaborative gameplay styles.

3.5.3. Integration of Gameplay Profiles and Individual Reflections

In a final analytic step, cluster membership was linked to the subset of individual post-game reflections as previously described. This linkage was implemented to associate reflections with the group contexts represented in the logs. Because reflections are written individually and anonymously, the association should be interpreted as approximate and used for contextual interpretation rather than as a definitive attribution. No attempt was made to quantify theme prevalence at the individual level; reflections are used illustratively to triangulate the log-derived profiles. For each cluster, reflections associated with groups assigned to that cluster were examined to identify recurrent ways in which they described their collaboration, perceived challenges and perceived learning about sustainability and urban heritage. This qualitative reading was conducted in a focused, interpretive manner and aimed to illuminate how the behavioral patterns captured by gameplay indicators were experienced and narrated by participants within each collaborative group.
Illustrative excerpts were selected for each cluster to exemplify typical or contrasting perspectives, with particular attention to comments about the role of augmented reality, the negotiation of answers, attention to architectural details and connections to sustainability concepts. The qualitative material was not used to modify the clusters, but rather to enrich their interpretation and to provide a more holistic understanding of how different collaborative gameplay profiles relate to students’ sense-making during the mobile AR experience. Figure 1 summarizes the learning analytics pipeline described in this section, from raw gameplay logs to derived indicators and collaborative gameplay profiles. To mitigate ecological fallacy risks, interpretations are framed at the group-profile level, and individual excerpts are presented as illustrative evidence rather than as direct explanations of individual learning trajectories.
The visual scheme summarizes the event-based LA workflow used in this study. Raw group-level gameplay logs from the Art Nouveau Path (step 1) are cleaned and transformed into session and item-level indicators (step 2), including accuracy, AR-specific scores, pacing and error rates by Point of Interest and media type. These indicators were then aggregated and standardized (step 3) to support descriptive analytics and cluster analysis (step 4), which yields collaborative gameplay profiles. Finally, the profiles are interpreted in connection with group-level post-game reflections and teacher observations (step 5), linking quantitative patterns to students’ and teachers’ perceptions.

4. Results

4.1. Overall Patterns of Collaborative Gameplay Performance

Across this MARG implementation, 439 students played the Art Nouveau Path in 118 collaborative groups, generating a total of 4248 group item responses to the 36 quiz tasks of this MARG (118 groups multiplied by 36 items). Out of the total, 3625 responses were correct and 623 incorrect, corresponding to an overall accuracy of 85.33%. On average, groups answered slightly more than 30 out of 36 items correctly, with individual group accuracy ranging from 41.67% to 100% and a median of 88.89%. This indicates that most groups were able to complete the path with relatively high levels of success, while a smaller subset struggled with a substantial proportion of items.
The sessions’ duration ranged from 26 to 55 min, with a mean of 42.38 min (Standard Deviation (SD) = 6.20). Given that each session included orientation and short transitions between heritage POIs, this duration suggests that most groups engaged with the MARG for almost the entire session, and that relatively few groups either rushed through the tasks or were unable to complete the path within the allocated time. A pacing index, defined as the number of items answered per minute, had a mean of 0.87 items per minute, with values ranging from 0.65 to 1.38 items per minute. Overall, groups tended to answer slightly fewer than one item per minute, which is consistent with an exploratory learning activity rather than a rapid quiz-like interaction.
The AR-specific score, which summarizes performance on the subset of AR-mediated items, ranged from 15 to the maximum of 55 points, with a mean of 46.99 points (SD = 8.60). Many groups achieved values close to the upper end of the AR-specific score scale, while a smaller number of groups accumulated substantially lower AR-specific scores. This distribution indicates that most groups did not avoid AR-mediated tasks and that they tended to answer them correctly, although there is also evidence of variation in AR-mediated task performance as captured by the AR-specific score. This variation should not be interpreted as a direct proxy for time-on-AR exposure or as evidence of AR-facilitated learning gains. Table 5 summarizes the main group-level learning analytics indicators derived from the gameplay logs and used in the subsequent analyses.
The indicators in Table 5 show a pattern of generally successful but heterogeneous collaborative gameplay. Overall accuracy is high and relatively concentrated (M = 85.33%, SD = 13.53), yet performance on the demanding items subset (the six lowest-accuracy items identified via item-level error mapping) is markedly lower and more dispersed (M = 68.36%, SD = 29.02, range 0–100%), indicating that a small subset of conceptually dense or contextually complex tasks concentrates much of the difficulty and differentiates groups more strongly. The pacing index also exhibits moderate variability (M = 0.87 items per minute, SD = 0.13), suggesting that some groups progressed notably faster or slower than the average, even though all groups completed the 36 items. The AR-specific score is skewed towards the upper end of the scale (median = 50 out of 55) but still shows substantial spread (SD = 8.60, min = 15), pointing to meaningful differences in how extensively and successfully groups engaged with AR-mediated items. These patterns justify the subsequent use of multivariate clustering to capture joint variations in accuracy, pacing and AR engagement across collaborative groups.

4.2. Item and Path Level Difficulty Patterns

To analyze how more demanding tasks were distributed along the Art Nouveau Path, group-level responses were disaggregated by POI and by item, using the item-mapping previously summarized and presented in Table 2. When accuracy is examined at the level of the eight heritage POIs, clear path-specific patterns emerge. Mean accuracy per POI remained high throughout the path, with values between 79.38% and 90.68%. Performance was strongest around the third and eighth POIs, where mean accuracies reached 90.68% and 90.25%, respectively, and slightly weaker around the fifth and sixth POIs, where mean accuracy was 82.34% and 79.38%. Overall, the path did not contain any segment that systematically overwhelmed groups, but some sections appear to concentrate on more demanding tasks that require more careful observation or abstraction.
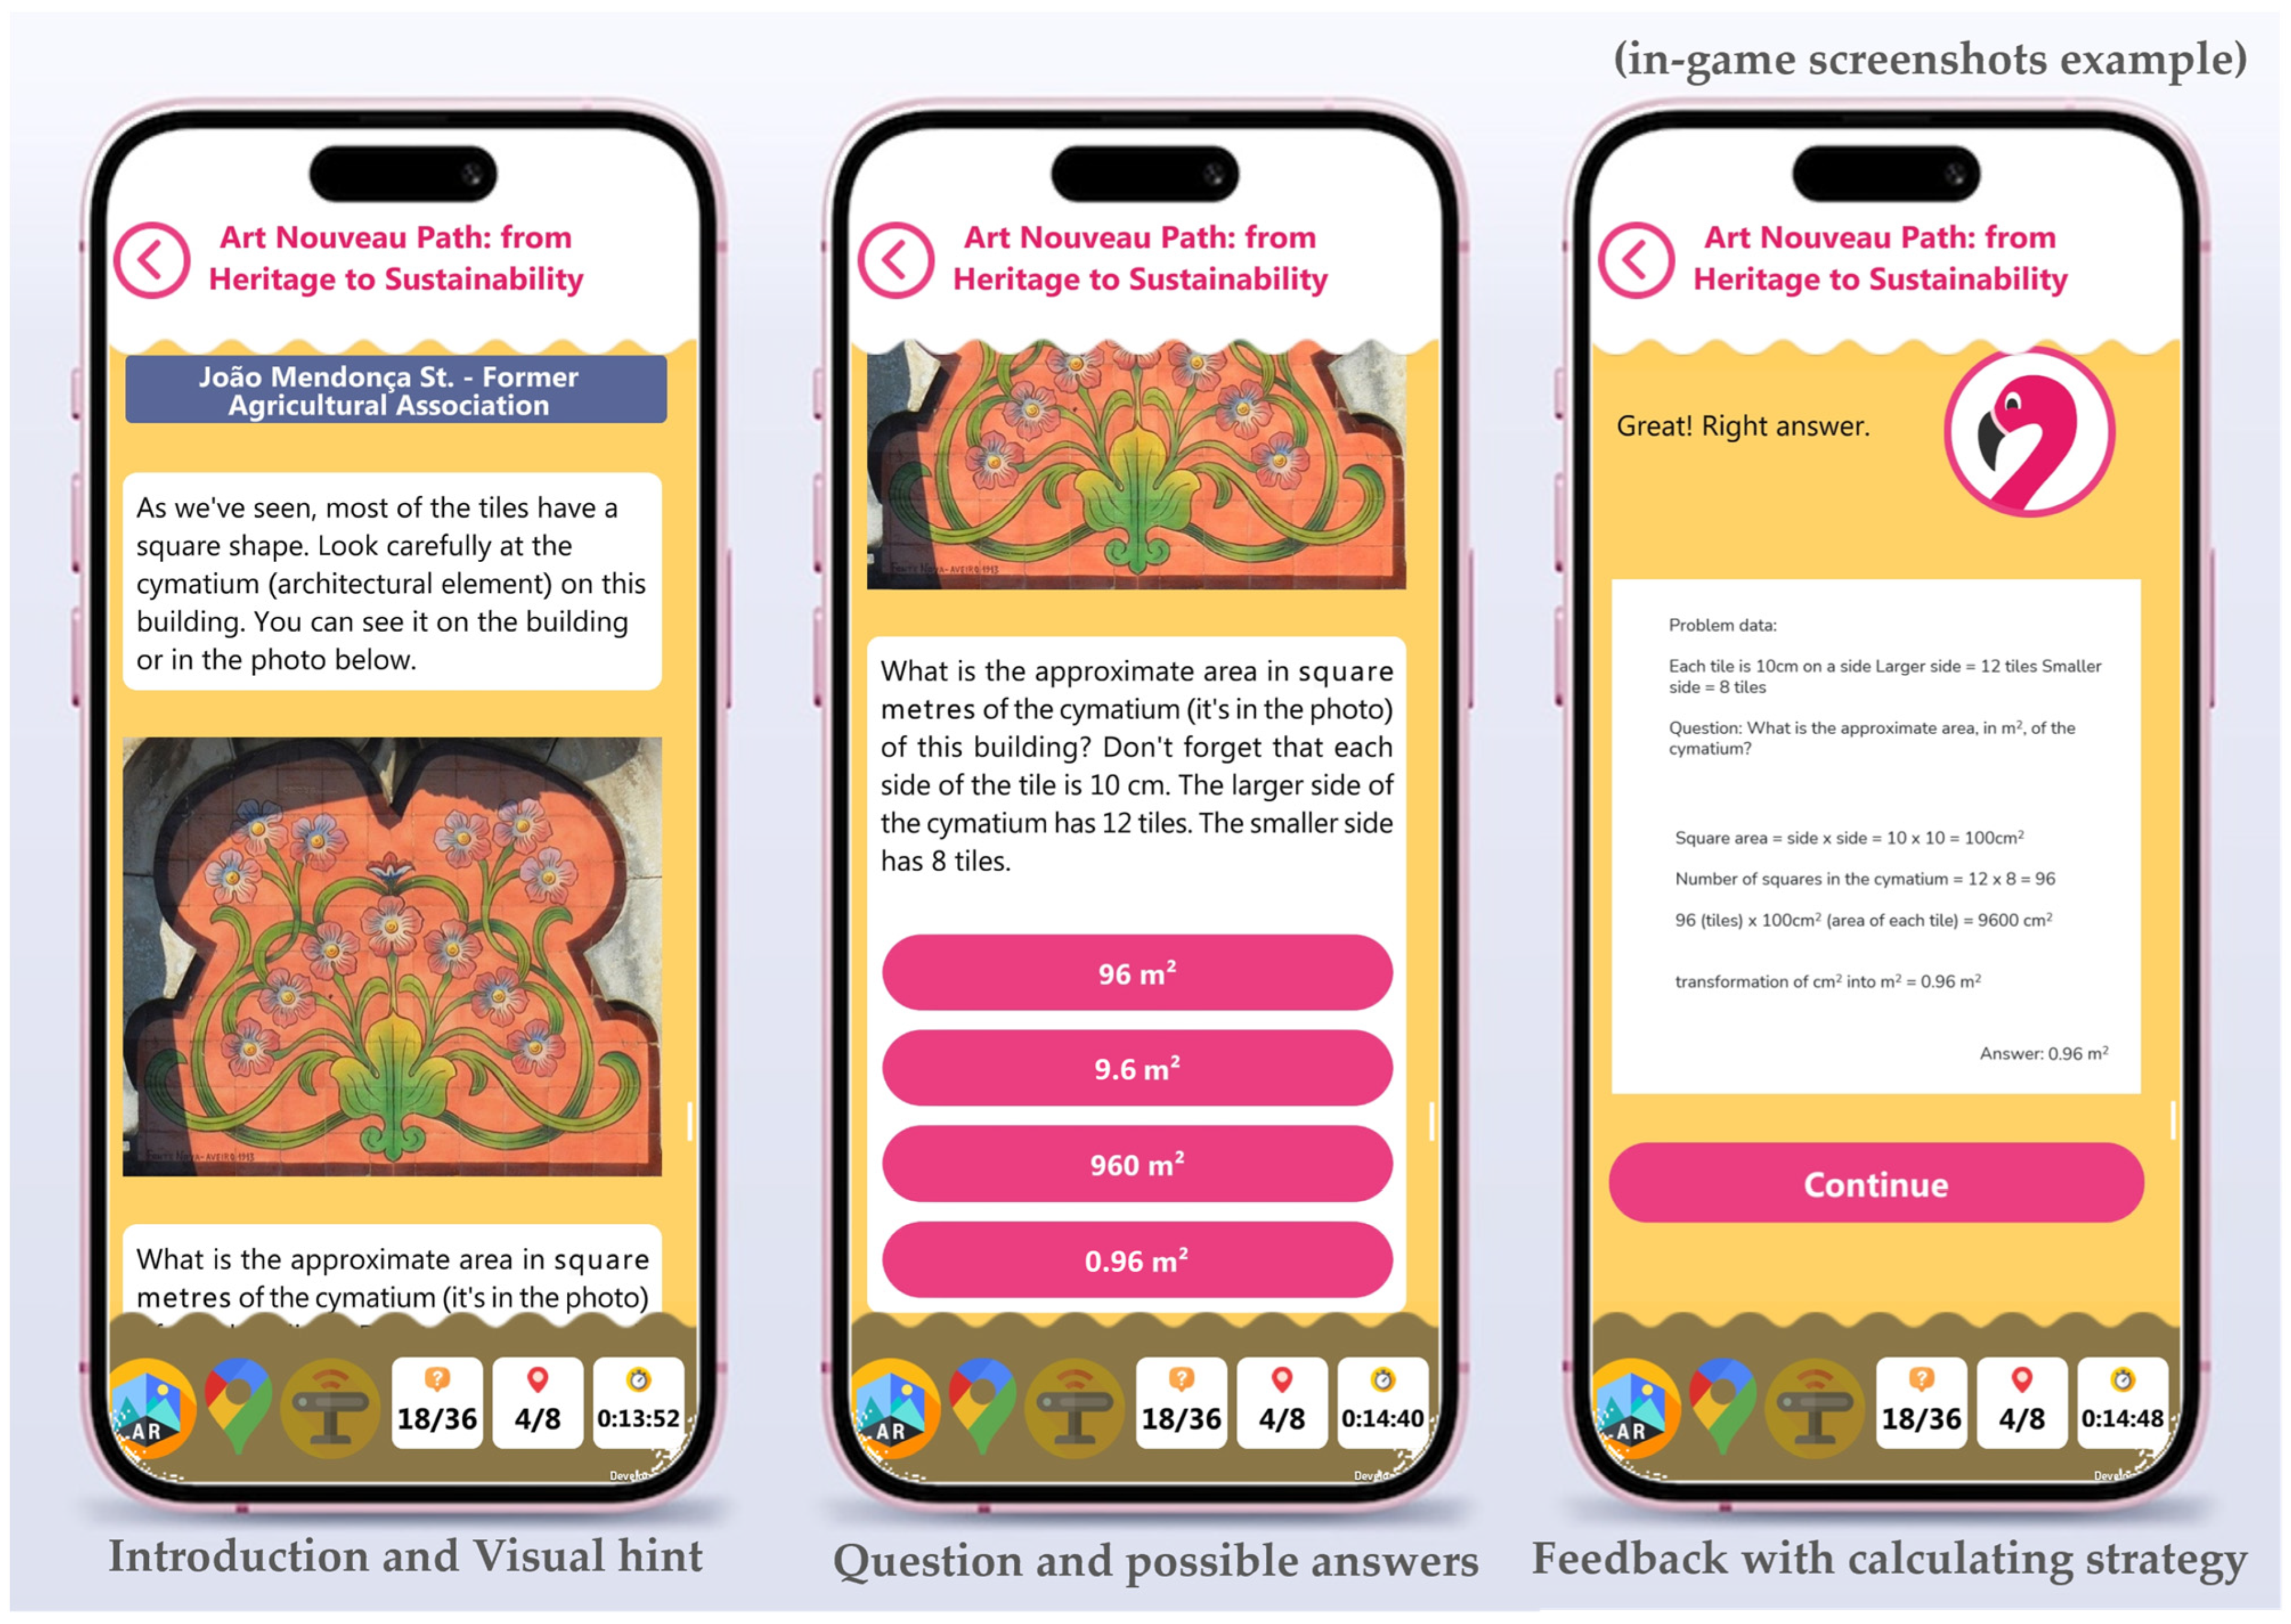
At the item level, error mapping shows that difficulties were not evenly distributed. The six most demanding items, defined as those with the lowest accuracies in the dataset and grouped in the demanding items subset introduced in Section 3.4, yielded accuracy between 58.47% and 72.88%. These tasks include, for example, questions that ask students to infer advantages of reusing heritage buildings, to identify which plant species are not represented in a dense Art Nouveau facade, to compare archival and contemporary photographs in order to detect urban transformations, to estimate the approximate area of a decorative architectural element (Figure 2), to recall the year in which a major flood inundated the city center and to distinguish between photographs with and without an Art Nouveau aesthetic.
These demands combine spatial reasoning, interpretation of visual detail and the mobilization of contextual knowledge about sustainability and urban change, which may help explain their relatively lower accuracy, as presented in Table 6.
Table 6 shows that the six most demanding items operate in a medium difficulty range, with accuracy values between 58.47% and 72.88%. The most challenging task, P5.4, which asks participants to infer advantages of reusing an Art Nouveau building, was answered correctly by 69 out of 118 groups (58.47%), meaning that almost half of the groups struggled with this inference. The remaining demanding items also attracted a substantial number of incorrect responses, with around one third of groups answering P6.4, P2.1, P4.4, P1.5 and P6.5 incorrectly. These tasks present several POIs and focus on higher-order processes such as visual comparison of archival and contemporary photographs [58], estimation of decorative tiled-areas, identification of absent elements in dense facades and distinction between subtle aesthetic features, indicating that conceptual and perceptual complexity, rather than mere factual recall, is a key source of difficulty. This six-item set defines the demanding items subset used to compute the group-level “accuracy on demanding items” indicator included in the clustering feature set.
By contrast, items that required more straightforward recognition of architectural elements or direct retrieval of information explicitly highlighted by AR overlays and multimedia resources tended to show very high levels of accuracy, often above 95%. This suggests that the MARG effectively scaffolds noticing and recalling when cues are explicit, whereas items that require extrapolation, estimation or the integration of multiple sources of information remain more challenging. Importantly, even the most demanding items were solved correctly by a substantial proportion of groups, which indicates that they operate more as productive challenges than as barriers to engagement.
At the level of the complete sample, mean accuracy on AR-mediated items was slightly lower than on non-AR items, but the difference was modest. This pattern suggests that AR does not simply make tasks easier or harder in itself. Instead, AR tends to support performance when it is used to foreground relevant features of the built environment or to make invisible processes visible, while performance drops in AR items that also integrate more complex reasoning about sustainability, spatial relationships or aesthetic criteria.
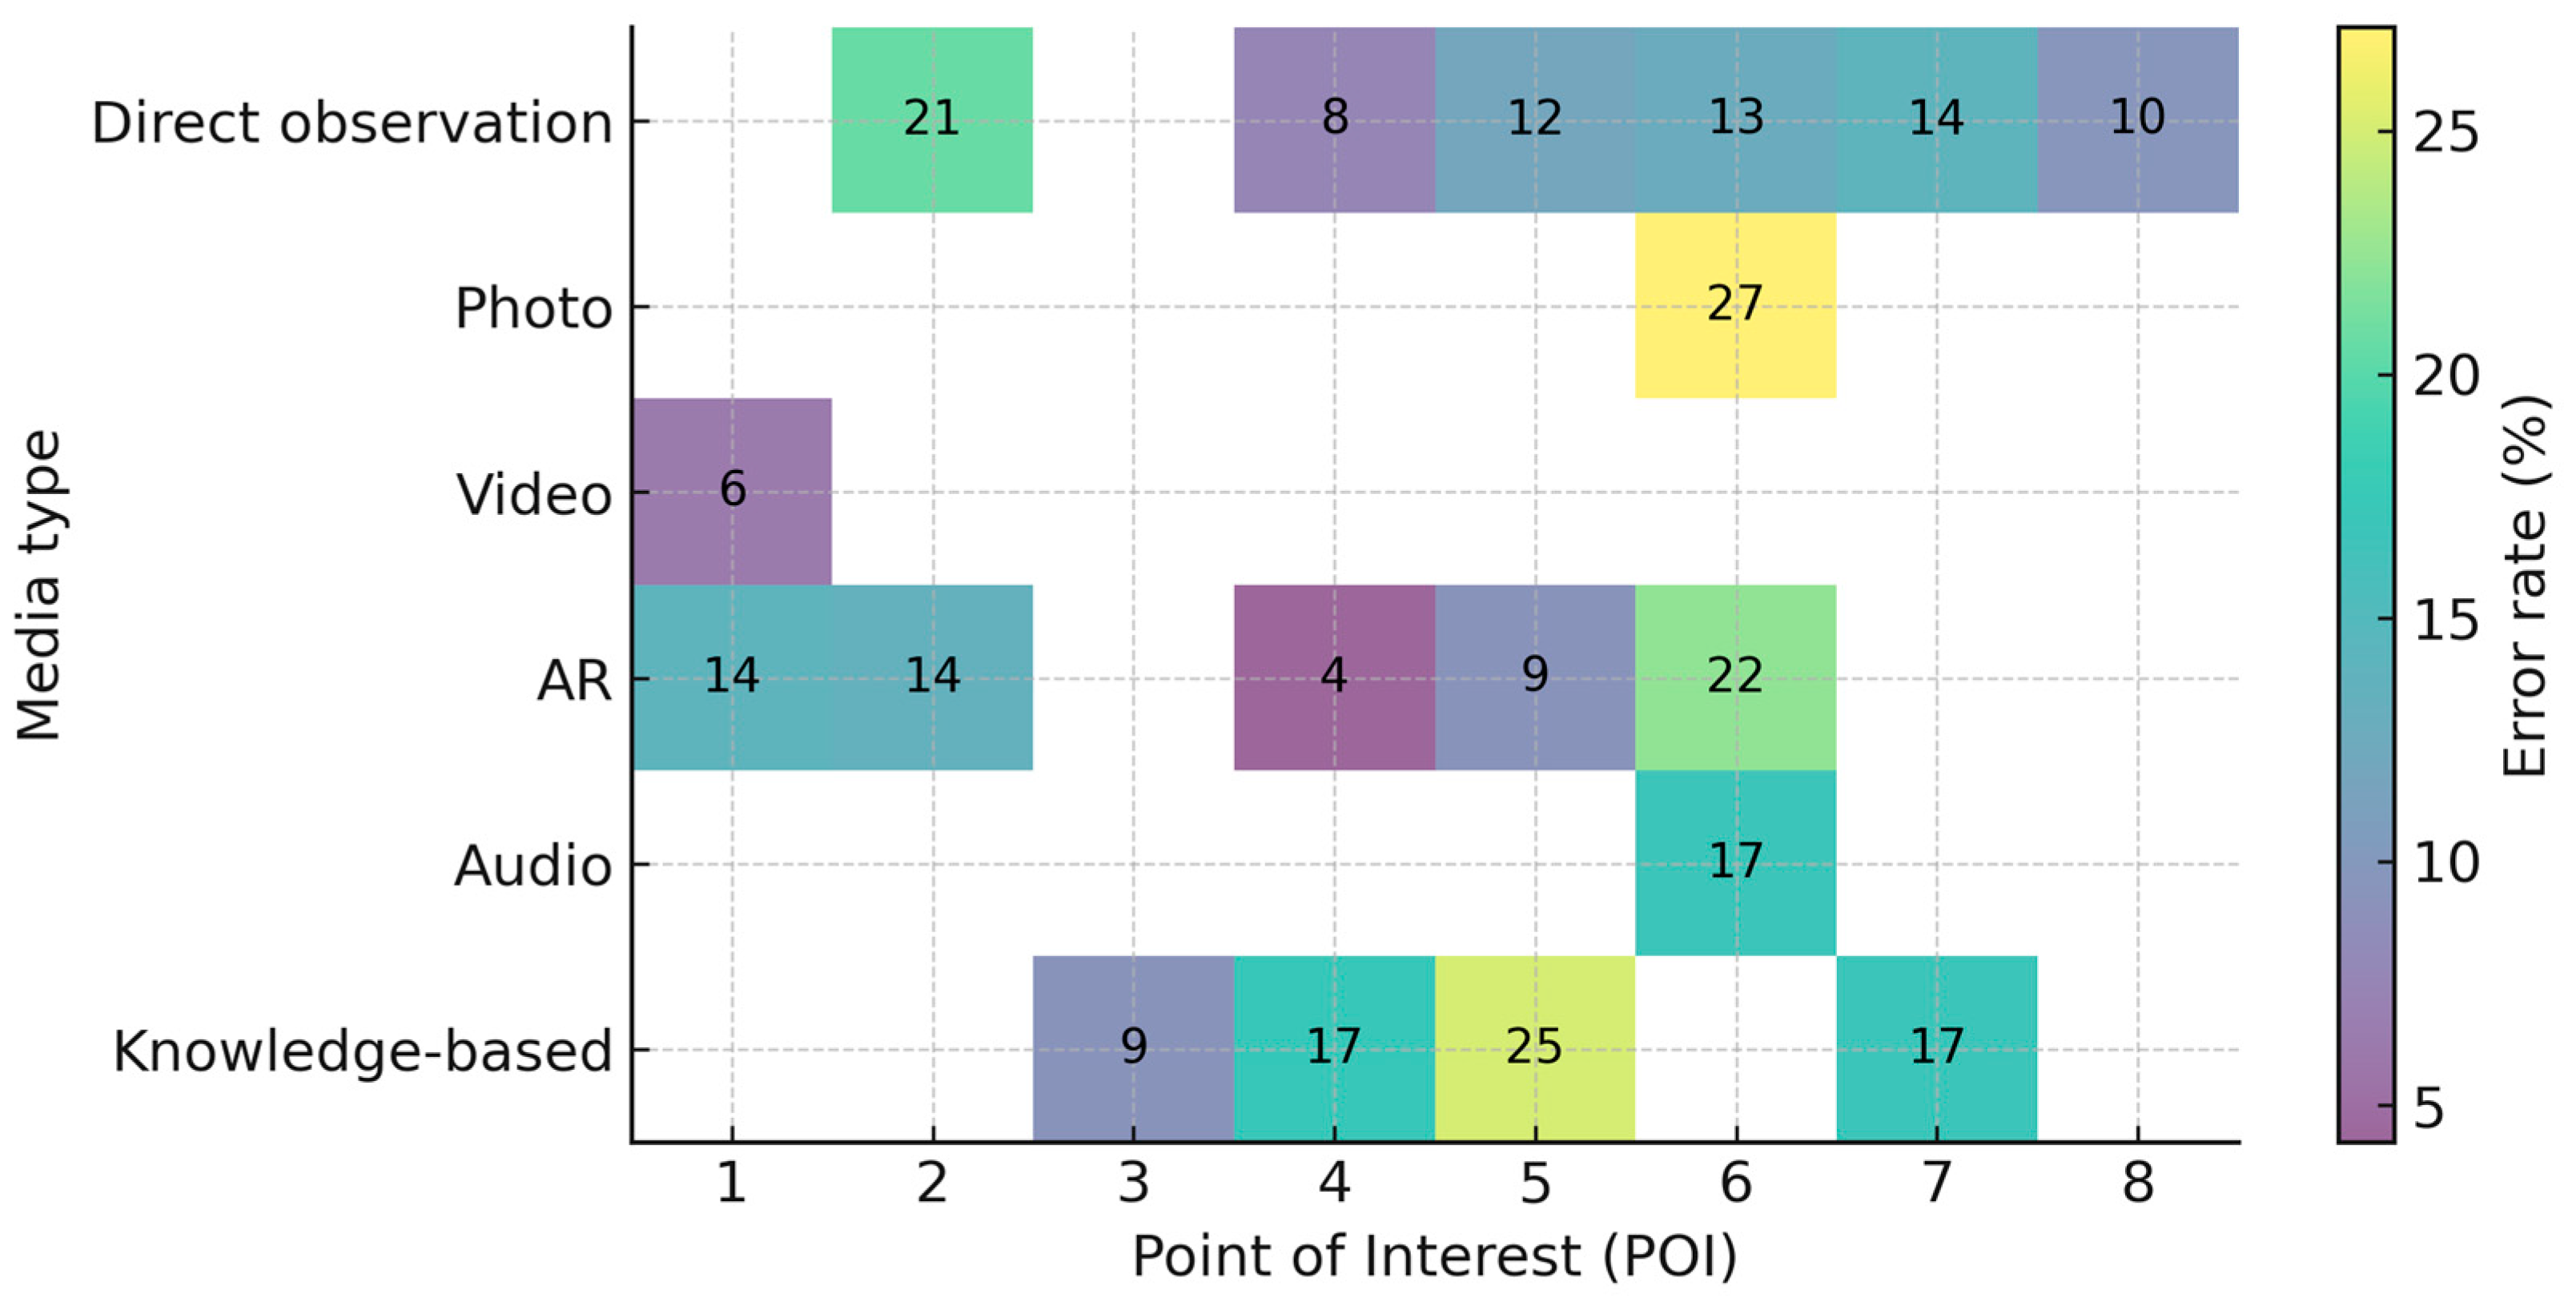
To make these difficulty patterns more visible, Figure 3 maps error rates by POI and media category. Each cell represents the percentage of incorrect responses for all items of a given media type at a given POI, highlighting local spikes for conceptually demanding questions and AR-mediated tasks that require fine-grained noticing in complex facades.
The heatmap displays the proportion of incorrect responses for each combination of media type and POI, aggregating across the 36 quiz-type items. Darker cells indicate higher error rates. The figure highlights that errors tend to concentrate in categories that include conceptually demanding items, particularly AR-mediated tasks that require multi-step reasoning with dense visual information or the integration of archival and contemporary views, while most recognition-oriented item groups show very low error rates.
Together, these descriptive LA address the first RQ by showing that the Art Nouveau Path produces stable patterns of collaborative performance, that difficulties cluster around a small subset of conceptually demanding tasks and path segments and that AR-mediated items are not uniformly easier or harder than non-AR items. This provides a basis for the more synthetic analysis of gameplay profiles presented in the following subsection.

4.3. Collaborative Gameplay Profiles Derived from Learning Analytics

To address the second RQ, cluster analysis was carried out on a set of group-level LA indicators, including overall accuracy, accuracy on the demanding items subset, the AR-specific score, pacing and session duration. All indicators were standardized, and a three-cluster solution was retained as a balance between statistical fitting and interpretability.
The resulting profiles differ systematically in both performance and AR-mediated task performance (as captured by the AR-specific score) and are summarized in Table 7.
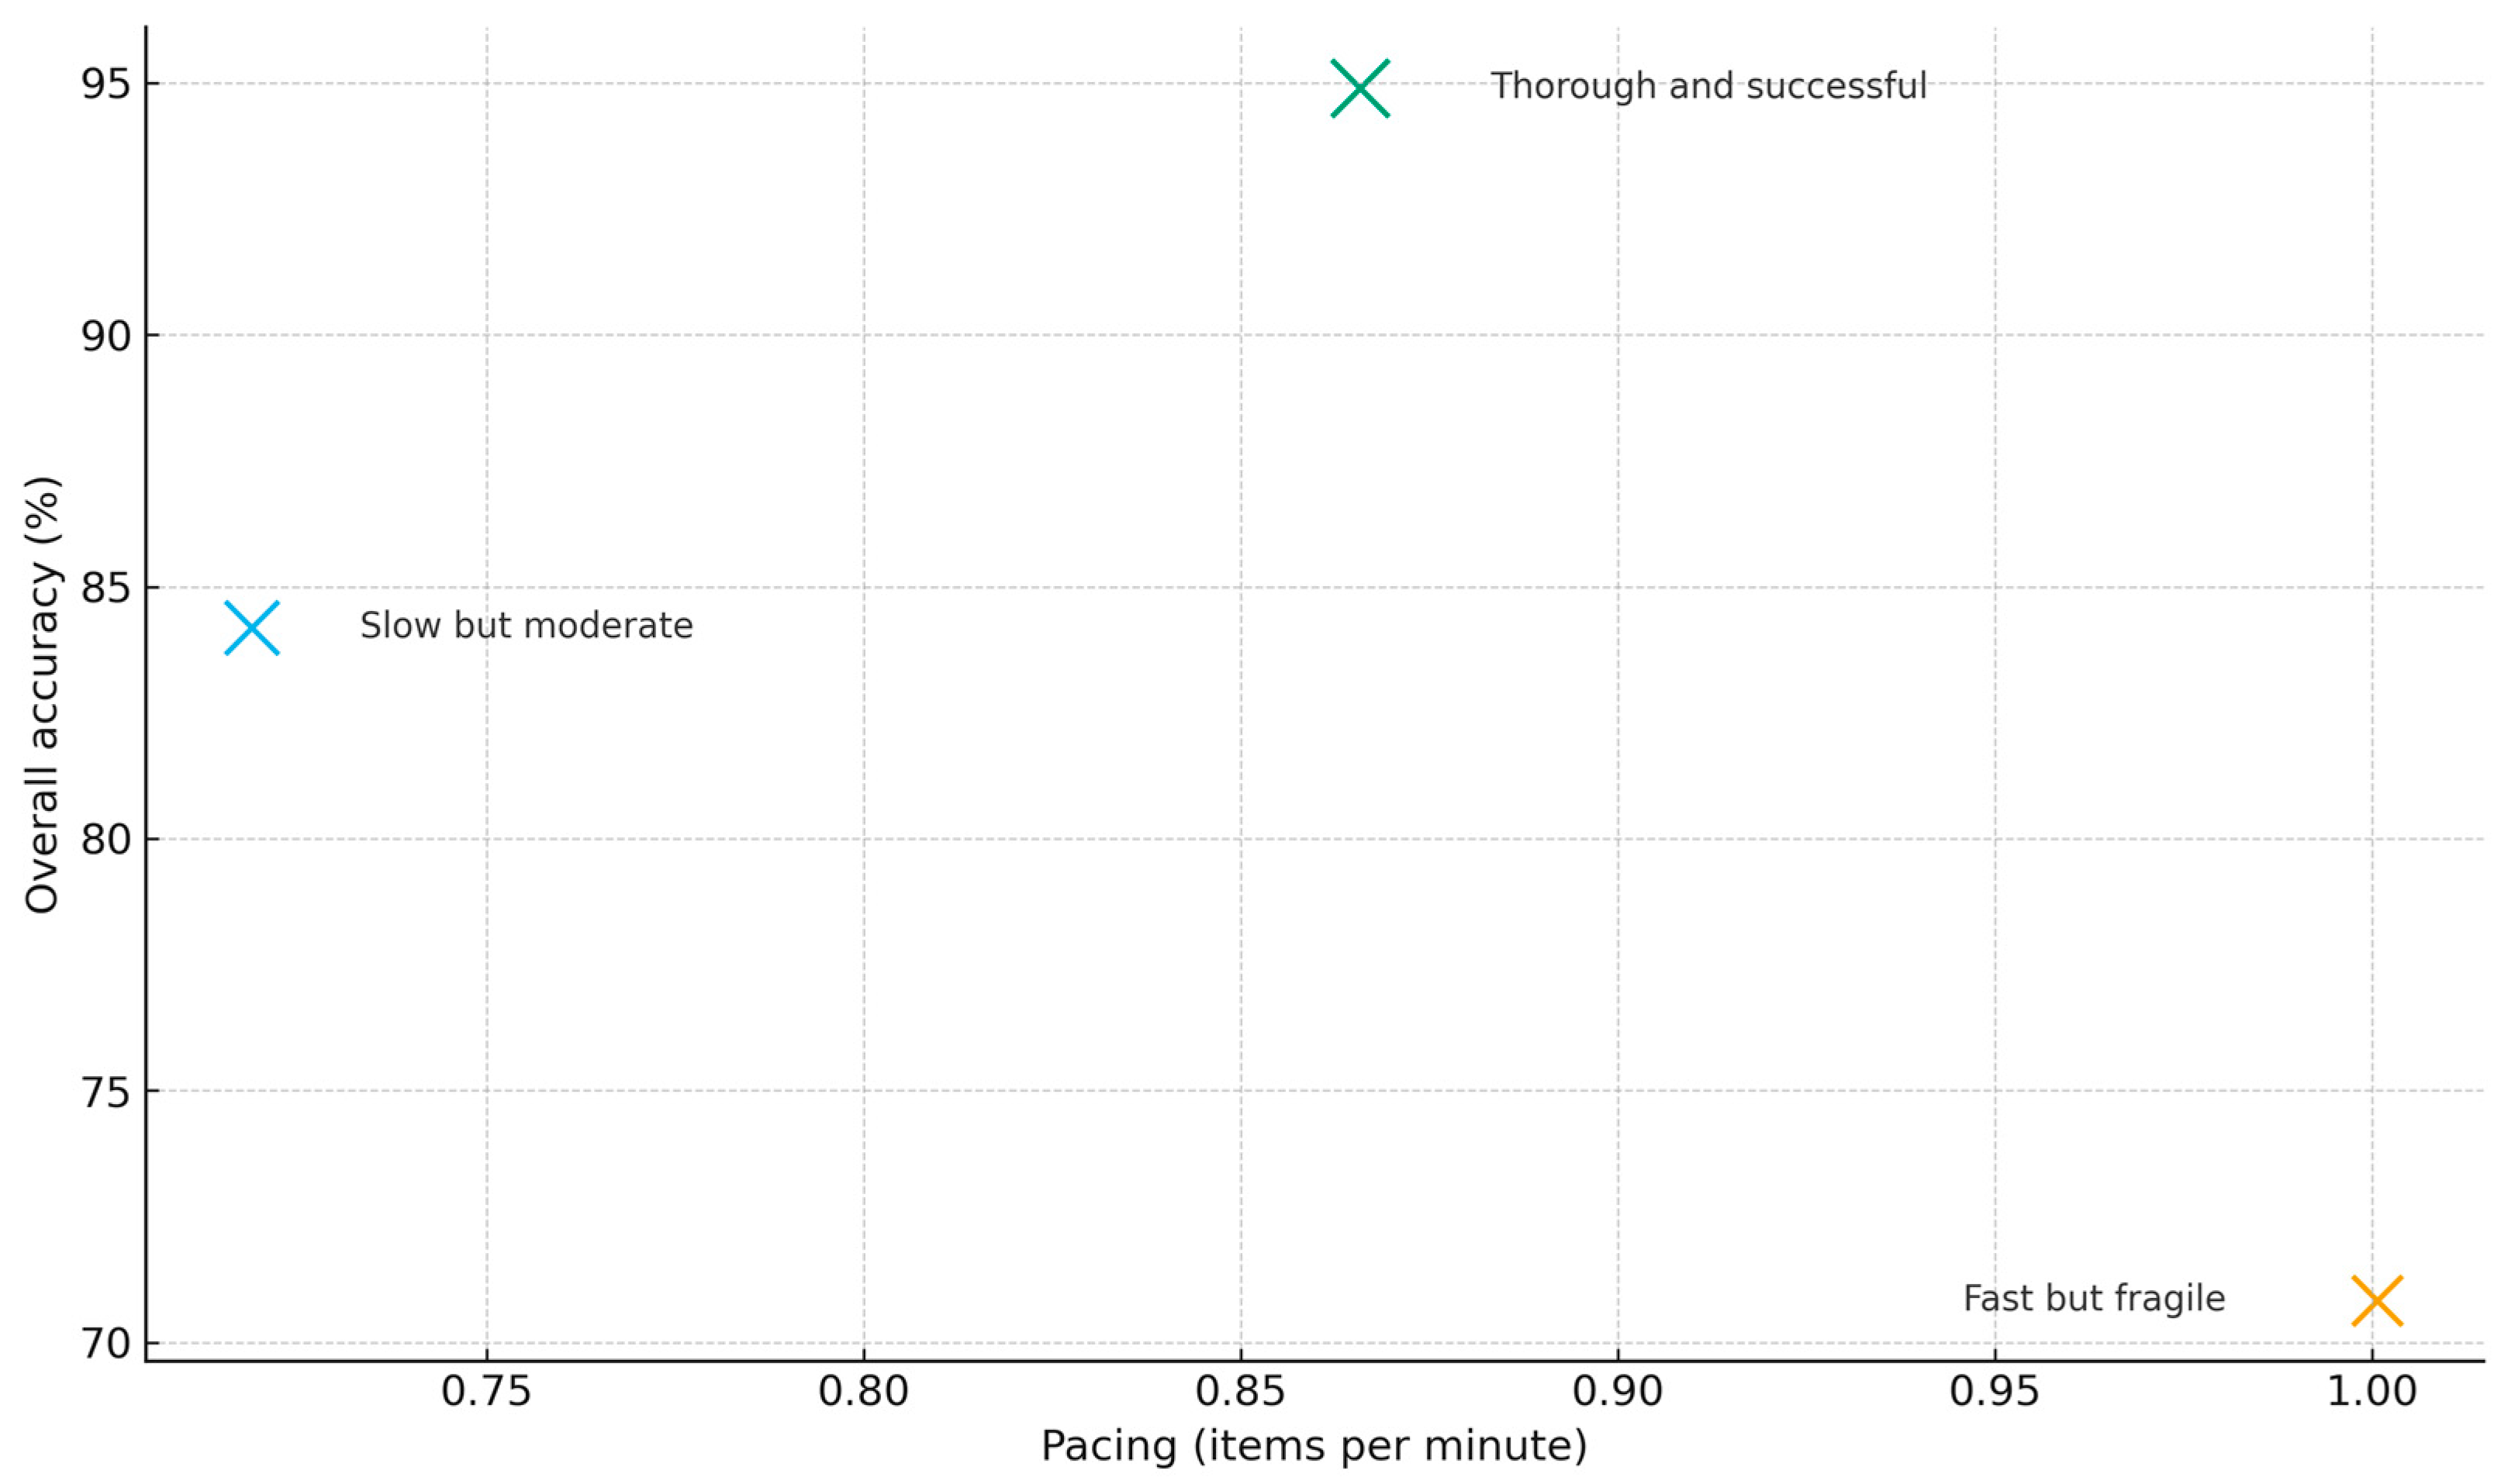
As presented in Table 7, the ‘fast but fragile’ profile consists of 34 groups (28.81% of the sample), demonstrating a mean overall accuracy of 70.83% and a mean accuracy of 37.25% on challenging items. This profile recorded a mean AR-specific score of 39.41 points, with session durations averaging 36.53 min and a maximum of 55 points. The pacing index was the highest among all profiles, averaging 1.00 items per minute, indicating rapid task completion often compromises accuracy, especially on difficult items. Thus, this cluster is characterized as a ‘fast but fragile’ collaborative gameplay profile.
The ‘slow but moderate’ profile comprises 29 groups (24.58% of the sample) and presents an intermediate pattern. Groups in this cluster attained a mean overall accuracy of 84.20% and a mean accuracy of 62.07% on demanding items. This cluster’s mean AR-specific score was 45.69 points, and its sessions were the longest, averaging 50.31 min in duration. The pacing index was the lowest at 0.72 items per minute, suggesting a slow advancement through tasks. This profile is characterized as ‘slow but moderate’, reflecting significant time investment and moderate AR-mediated task performance (AR-specific score), albeit without achieving exceptional performance levels.
The ‘thorough and successful’ profile is the largest, comprising 55 groups (46.61% of the sample), exhibiting a high performance and engagement pattern. Groups in this cluster achieved a mean overall accuracy of 94.90% and a mean accuracy of 90.91% on the most demanding items. The average score in the AR category for this cluster reached 52.36 points, nearing the cap, and the mean duration of sessions was 41.82 min. The pacing index is set at a moderate 0.87 items each minute, which is beneath the quick but delicate profile, while it is above the ‘slow but moderate’ profile. Groups in this cluster appear to have adopted a balanced approach, progressing at a measured pace that enabled them to answer nearly all items accurately, including complex tasks, while achieving high performance on AR-mediated items (as reflected in their near-ceiling AR-specific scores). Hence, this cluster can be interpreted as a ‘thorough and successful’ collaborative gameplay profile.
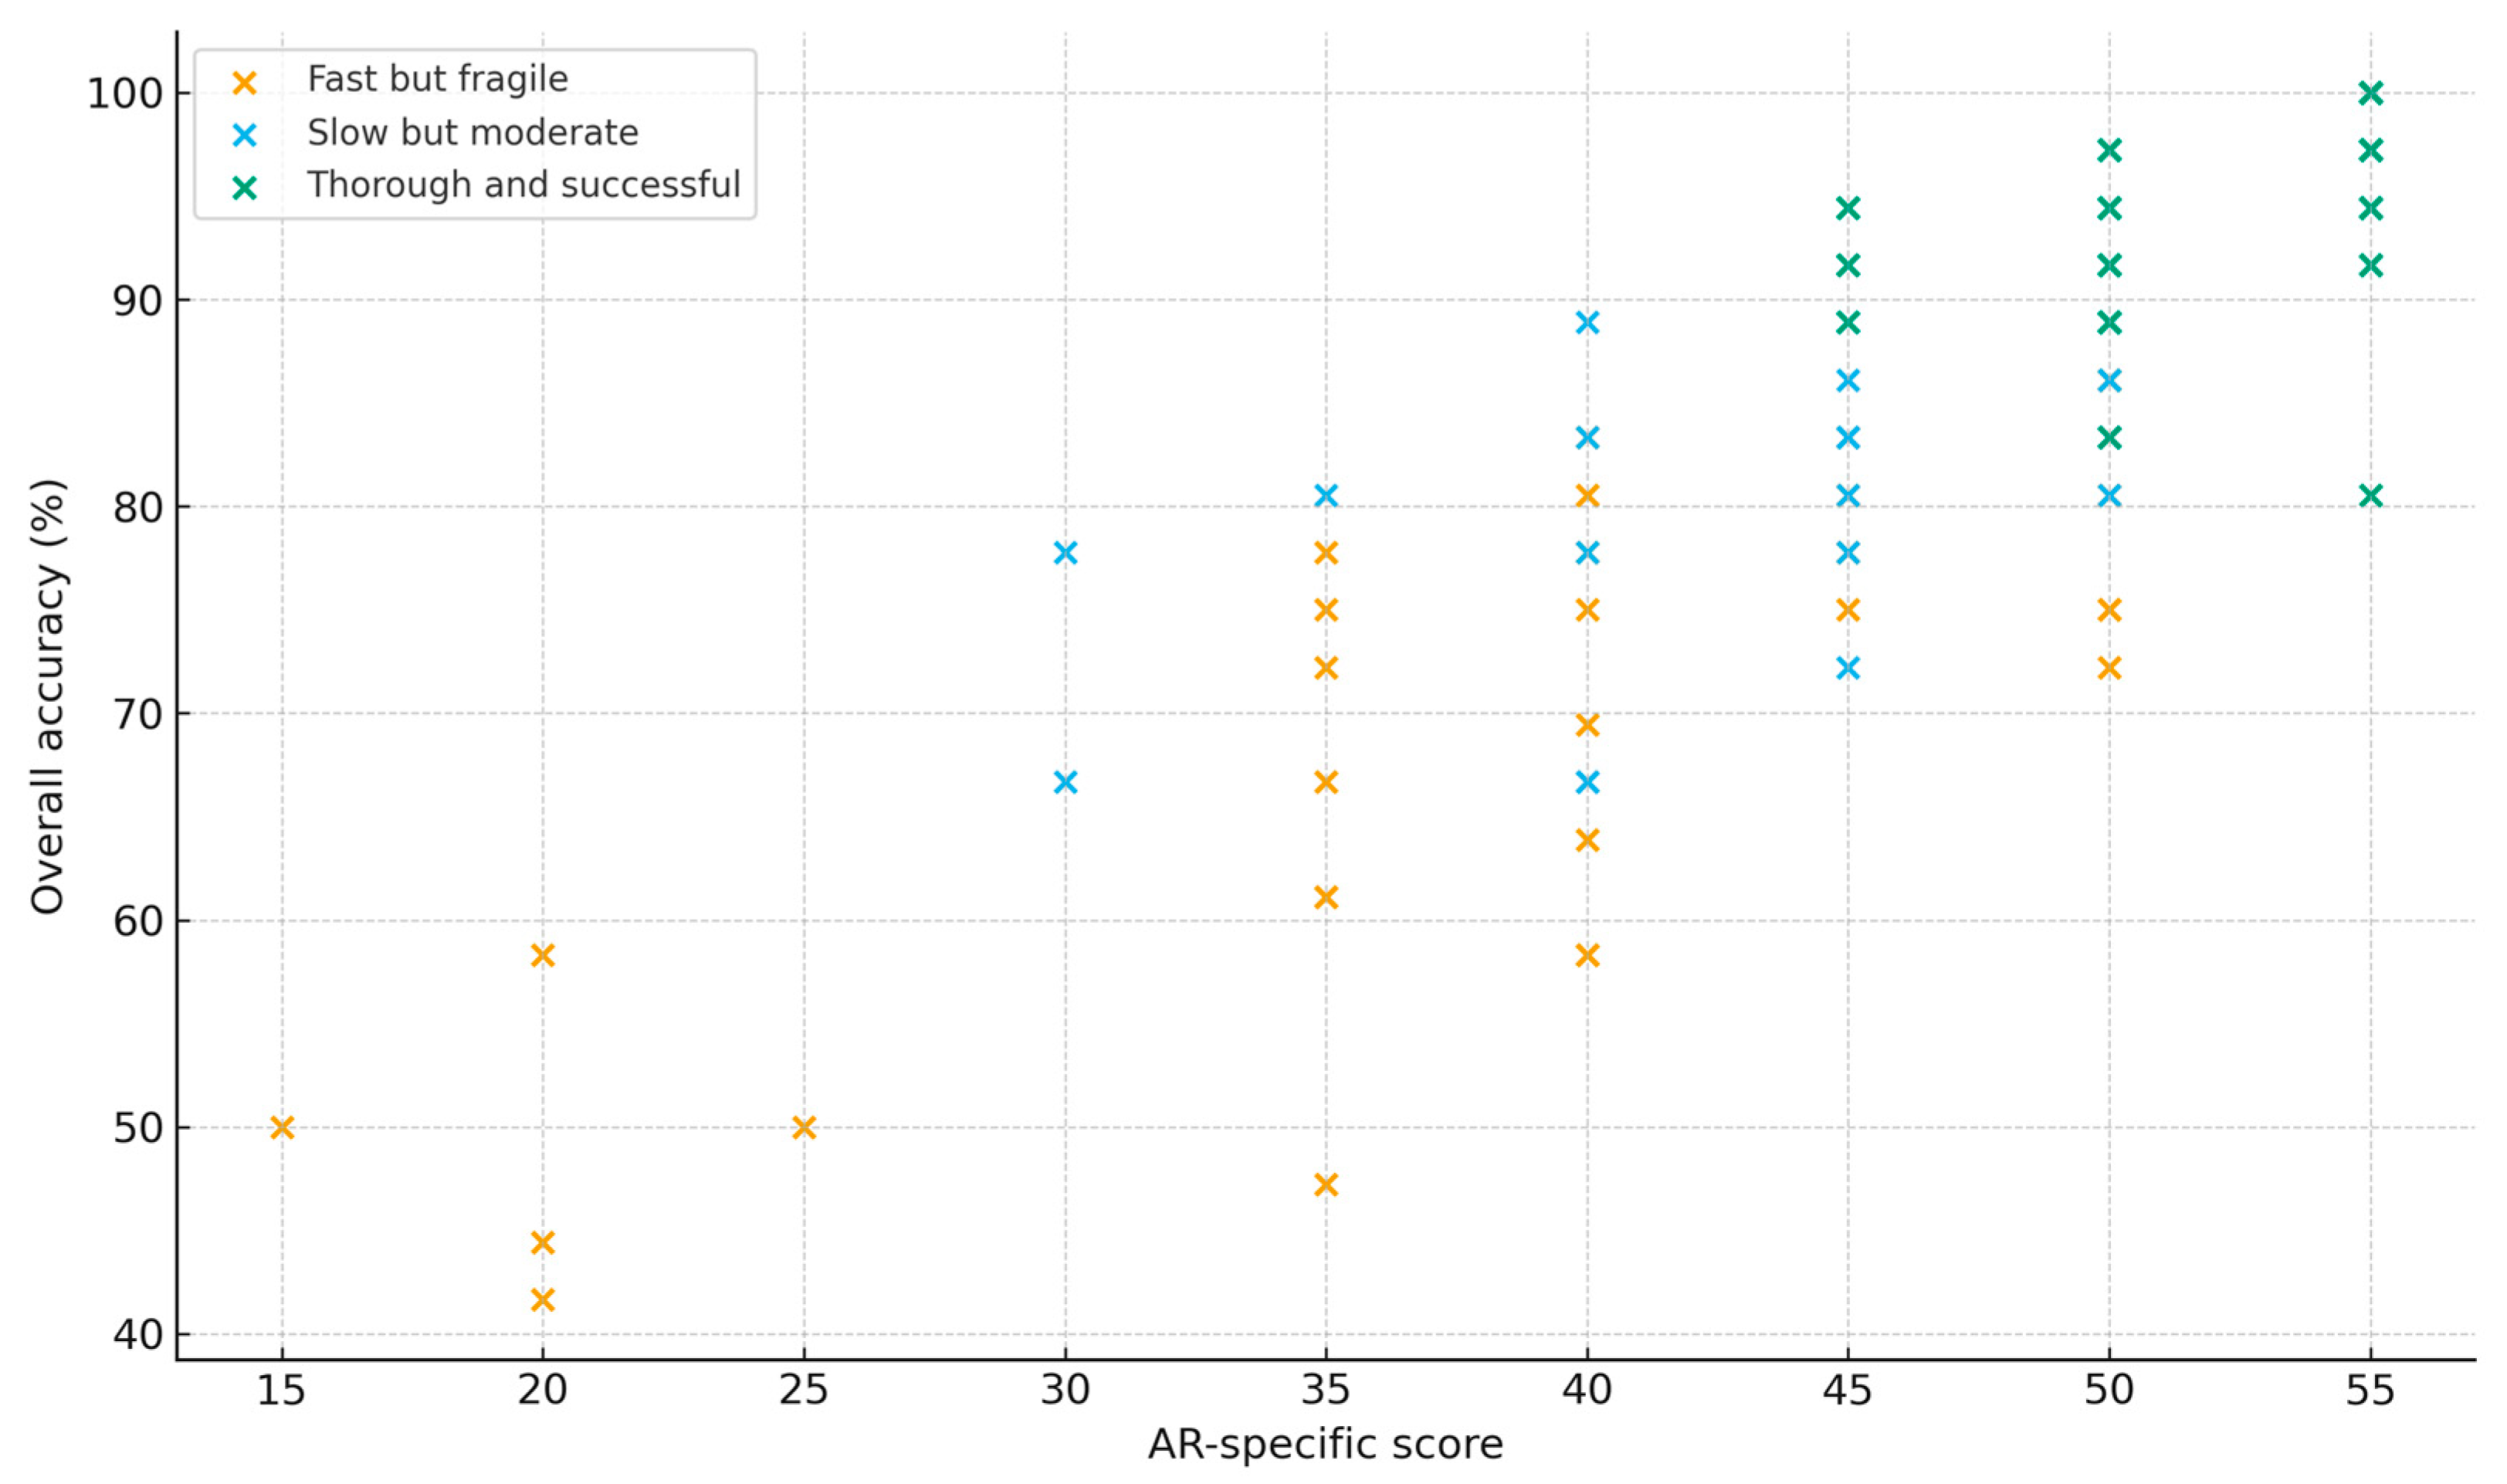
Figure 4 visually locates the three collaborative gameplay profiles in the joint space of overall accuracy and AR-specific score. ‘Fast but fragile’ groups cluster in the lower left region, combining lower accuracy with lower AR-specific scores. ‘Slow but moderate’ groups occupy an intermediate band, with moderate accuracy and AR-specific scores but longer session durations. ‘Thorough and successful’ groups concentrate in the upper right region, combining high accuracy with high AR-specific scores. This pattern indicates that higher AR-specific scores tend to co-occur with higher overall accuracy, but only when supported by appropriate collaborative strategies and pacing; given the log granularity, this should be read as co-occurring task-performance patterns rather than as evidence about AR exposure.
Each marker position may represent one or more of the 118 collaborative groups, ranked by accuracy and AR-specific scores. Overlapping markers signify groups with equivalent scores. Colors represent three identified collaborative gameplay profiles: ‘fast but fragile’, ‘slow but moderate’, and ‘thorough and successful’. ‘Fast but fragile’ groups are found in the lower left quadrant, characterized by low accuracy and AR-specific scores. The groups that are identified as ‘slow but moderate’ occupy an intermediary zone, showcasing moderate levels of performance and engagement with the AR-specific score. ‘Thorough and successful’ groups are concentrated at the upper right quadrant, indicated by their substantial accuracy and engagement with AR-mediated items.
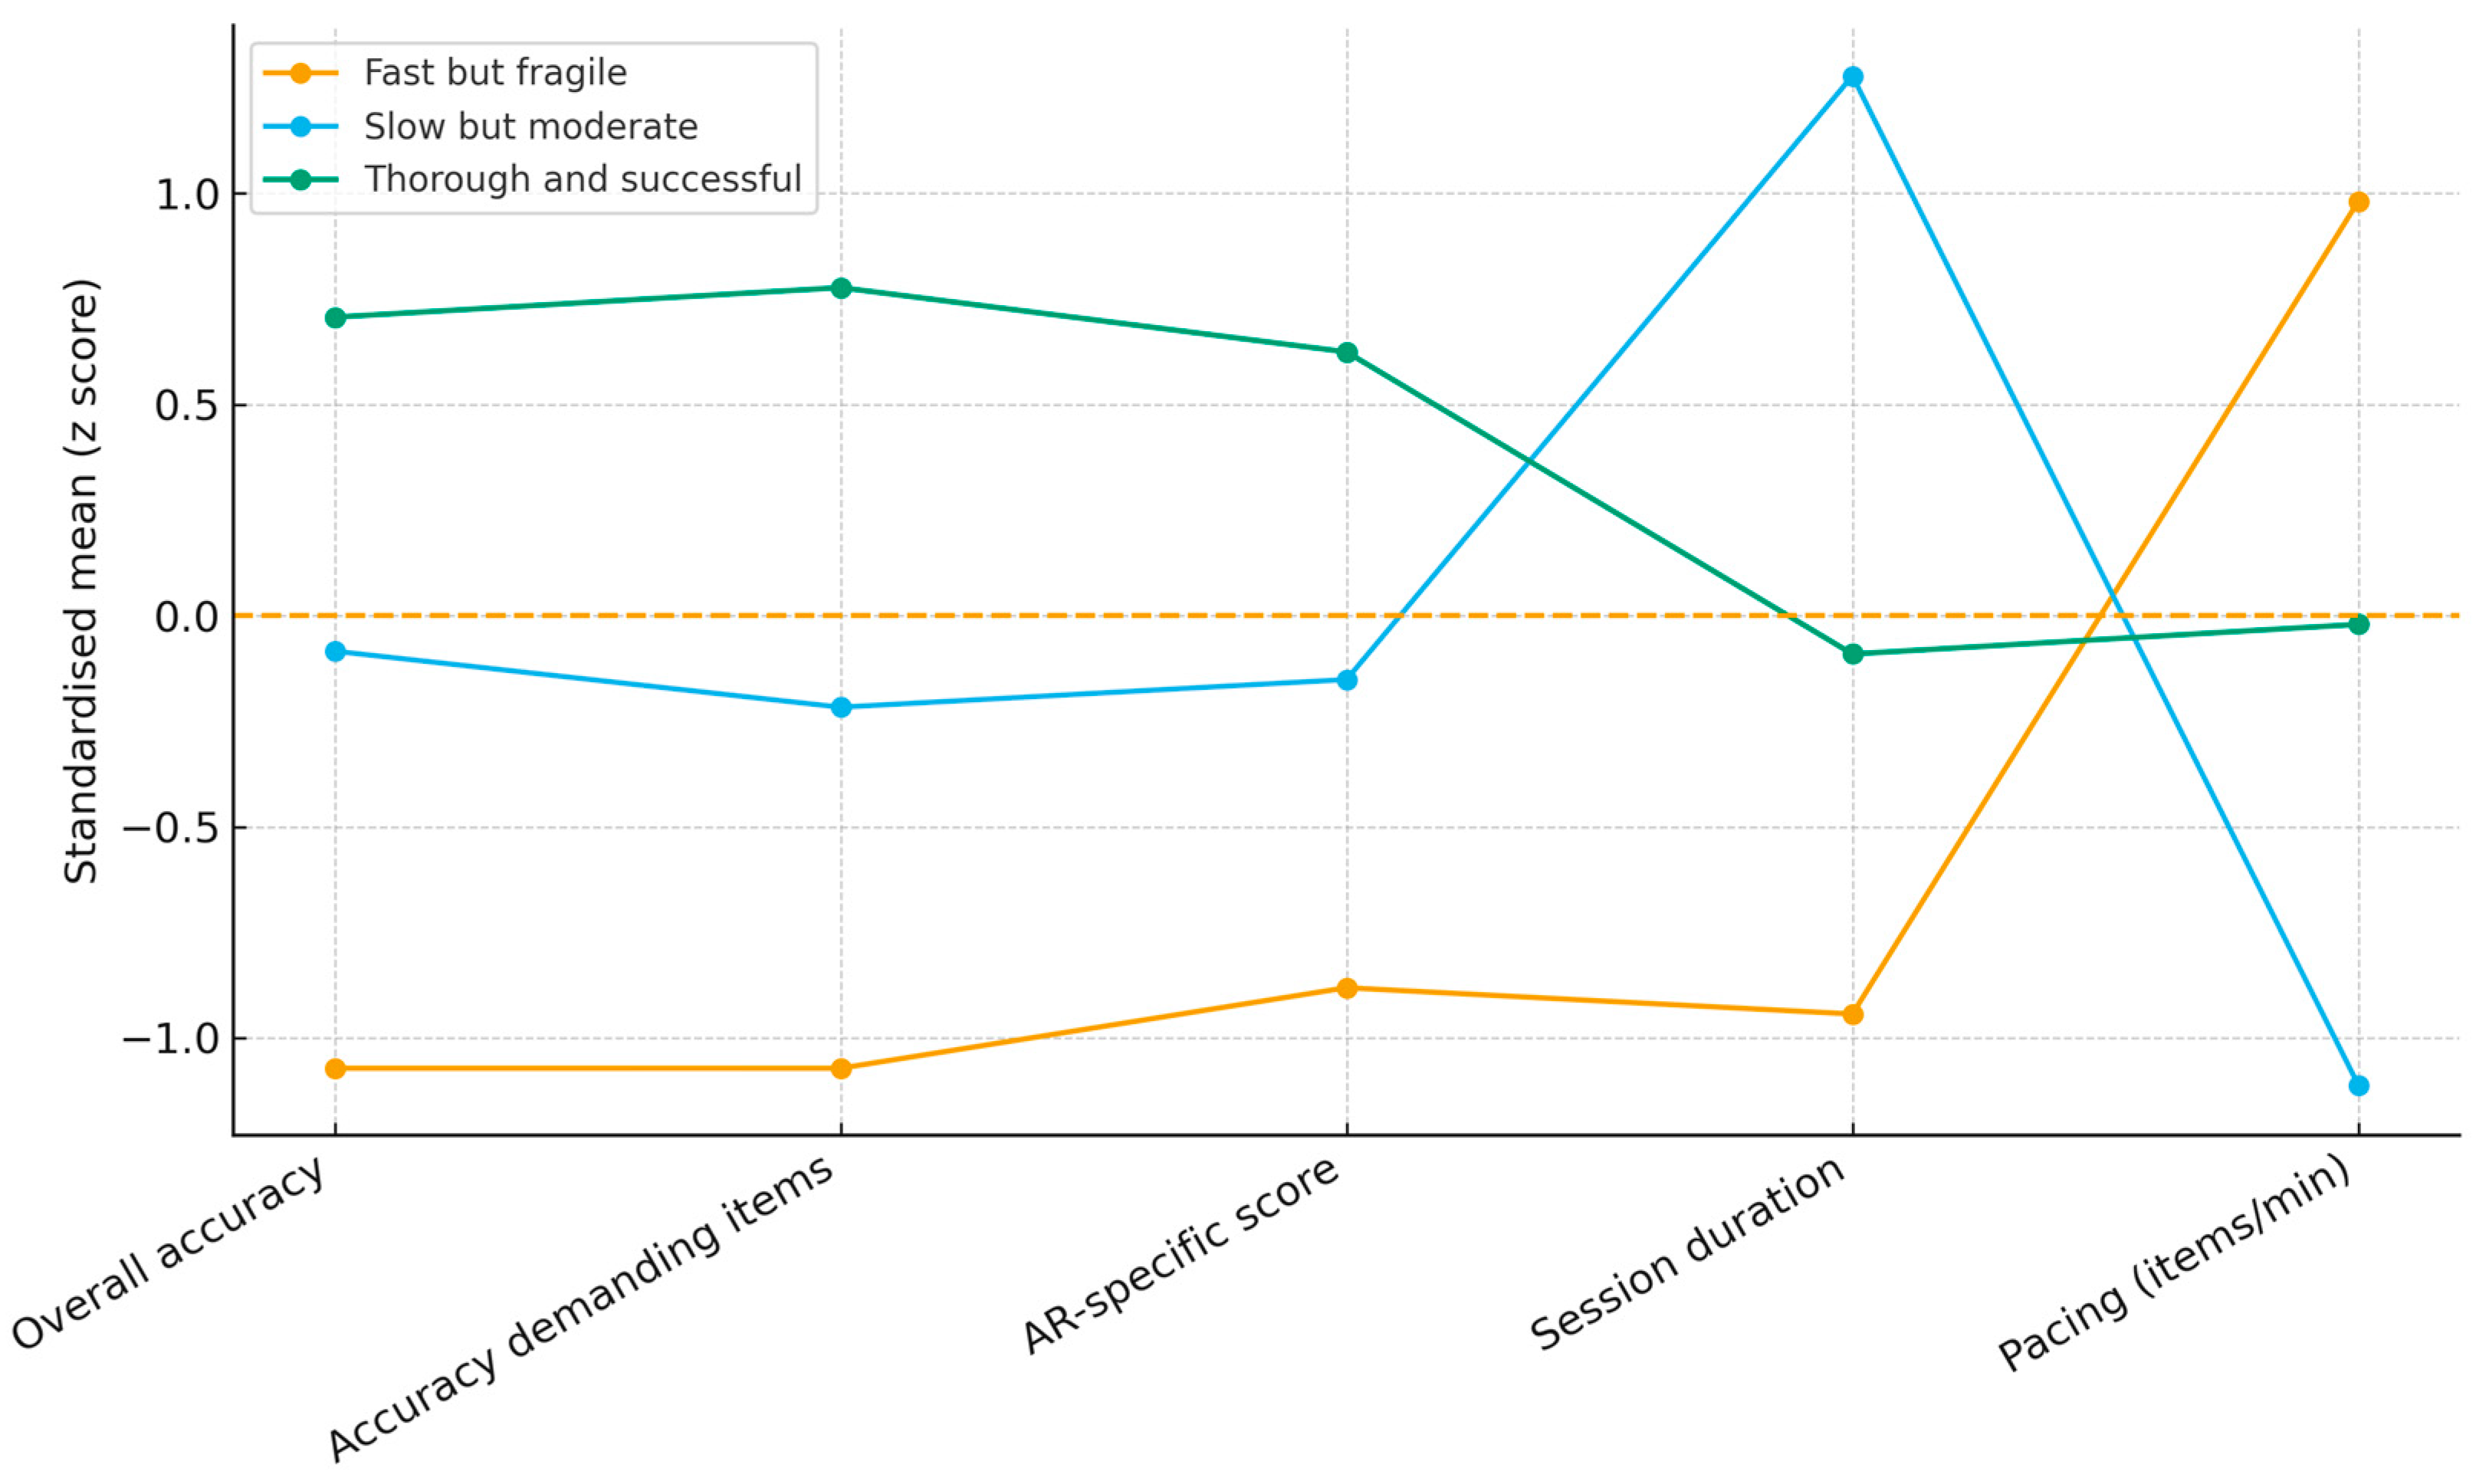
Figure 5 provides a complementary view by displaying standardized means for each LA indicator across the three profiles. The ‘fast but fragile’ profile scores clearly below the overall mean on both accuracy indicators and on AR-specific score and above the mean on pacing, reflecting a tendency to sacrifice accuracy for speed. The ‘slow but moderate’ profile scores moderately above the mean on accuracy and AR-specific score but well above the mean on duration and below the mean on pacing, suggesting a slower but not maximally effective use of time. The ‘thorough and successful’ profile scores clearly above the mean on all performance indicators and around the mean on duration and pacing, which is consistent with an efficient but not rushed pattern of collaborative engagement.
Figure 5 shows, for each collaborative gameplay profile, the mean values of the main learning analytics indicators expressed as standardized scores (z-scores, with mean 0 and standard deviation 1). Indicators include overall accuracy, accuracy on the subset of demanding items, AR-specific score, session duration and pacing (items per minute). ‘Fast but fragile’ groups score below the overall mean on both accuracy indicators and on AR-specific score, but above the mean on pacing, reflecting a tendency to prioritize speed over accuracy. ‘Slow but moderate’ groups show intermediate accuracy and AR-specific scores, combined with long durations and low pacing. ‘Thorough and successful’ groups score clearly above the mean on both accuracy indicators and AR-specific score, with intermediate values for duration and pacing, indicating an efficient but not rushed pattern of collaborative engagement.
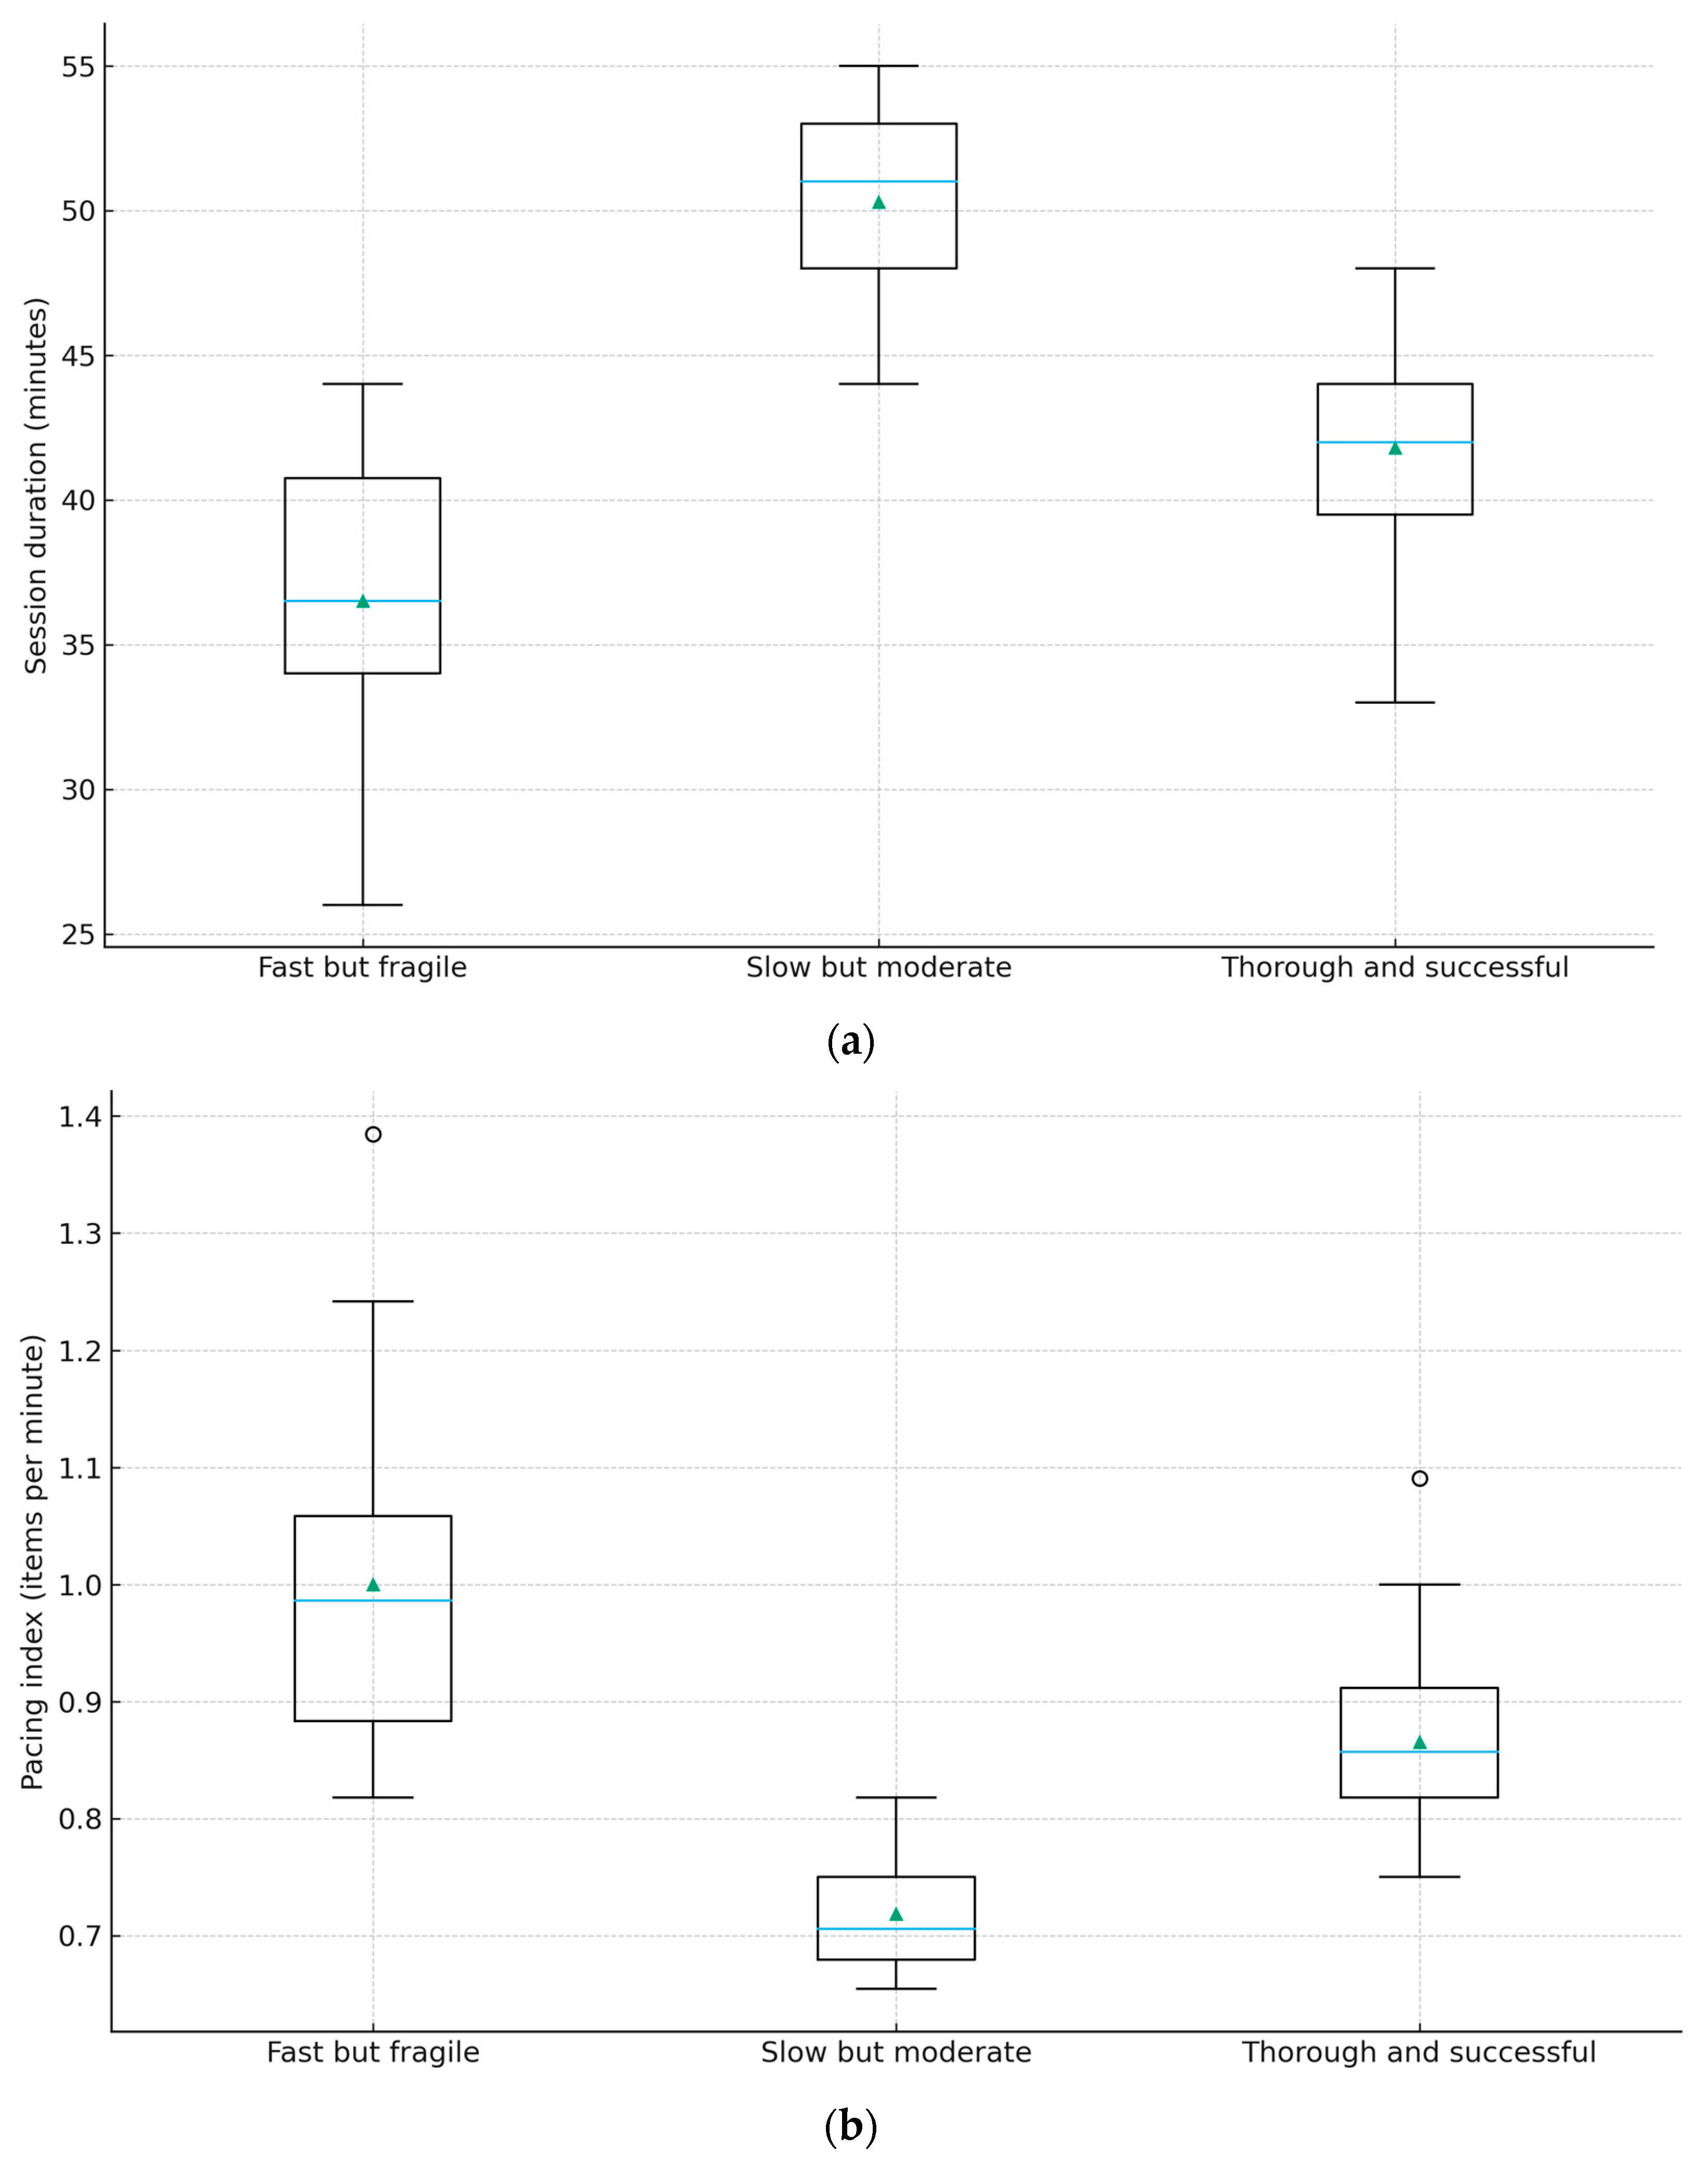
Both Figure 6a,b compare the distributions of session duration (Figure 6a—first) and pacing (Figure 6b—second) across the three collaborative gameplay profiles. ‘Fast but fragile’ groups show relatively short sessions with higher variability in pacing. ‘Slow but moderate’ groups show the longest sessions and the lowest pacing, with values tightly clustered. ‘Thorough and successful’ groups cluster around intermediate durations with moderately high pacing. These differences reinforce the interpretation that the three profiles do not simply reflect different levels of ability, but rather distinct ways in which groups orchestrate time, AR interaction and task solving during the mobile AR experience.
Figure 6a shows boxplots of session duration in minutes for each profile, and Figure 6b shows boxplots of the pacing index, defined as the number of items answered per minute. ‘Fast but fragile’ groups tend to have shorter sessions and higher pacing, reflecting rapid progression through the route. ‘Slow but moderate’ groups display the longest sessions and the lowest pacing, indicating extended time on task without matching gains in performance. ‘Thorough and successful’ groups cluster around intermediate durations with moderately high pacing, consistent with a balanced strategy that allows for careful collaboration while maintaining steady progress.
These three profiles address the second RQ by showing that the same MARG and heritage-contextualized path can give rise to qualitatively distinct patterns of collaborative engagement. The profiles differ not only in overall success but also in how groups trade off speed against accuracy, how they respond to more demanding items and how fully they engage with AR-mediated tasks. Importantly, the presence of a sizeable high-performance profile indicates that, under favorable conditions, students can leverage the Art Nouveau Path to work collaboratively with complex sustainability-related content in an urban setting. At the same time, the existence of ‘fast but fragile’ and ‘slow but moderate’ profiles highlights the need for differentiated scaffolding, which is further explored in the discussion considering game-based LA and EfS.

4.4. Interpreting Gameplay Profiles Through Students’ Post-Game Reflections

Although this work focuses primarily on log-based LA, linking the clusters to post-game reflections provides additional insight into how these collaborative gameplay profiles were experienced by participants within each group. For each cluster, S2-POST reflections associated with the corresponding groups were examined at the group level, focusing on whether and how they described collaboration, perceived challenges and perceived learning about sustainability and the value of Art Nouveau heritage. Because reflections are anonymous and not uniquely attributable to specific log actions, they are interpreted at the profile level and used to contextualize the quantitative patterns rather than to support individual-level claims.
Reflections from groups in the ‘thorough and successful’ profile frequently foreground joint exploration and shared decision-making. Participants in these groups often report that they discussed each question together, divided attention across different architectural details and used the AR overlays as a common reference point that helped them notice facade details, tiles and decorative elements they would otherwise overlook. Several responses also emphasize that the activity made them “learn more about sustainability and the city” and that the combination of walking, observing and answering questions felt demanding but rewarding, which is consistent with the high accuracy and strong performance on the demanding items subset shown in the logs.
By contrast, reflections associated with ‘fast but fragile’ groups more often mention time pressure, difficulty coordinating answers and uncertainty about where to look or what to prioritize in the context. Participants in groups assigned to this profile sometimes describe the activity as feeling like a race, noting that they “answered quickly so we could finish” or that they “did not have time to look carefully at all the details”. Across groups in this cluster, participants also referred to moments of confusion about navigation or about how to interpret more complex tasks, which aligns with the lower accuracy on the demanding items subset and the higher pacing index observed in this cluster.
Groups in the ‘slow but moderate’ profile tend to occupy an intermediate position between these two narratives. Their reflections acknowledge both the support provided by AR and multimedia resources and the challenges posed by complex questions, crowded urban spaces and the need to keep the group together. Students in this profile often report taking time to discuss answers and to explore the surroundings, but also mention hesitations, repeated checking of AR content or difficulties managing time along the path. This combination mirrors their longer session durations, moderate pacing and intermediate performance levels.
These qualitative tendencies are consistent with the quantitative indicators, although it is not possible to guarantee perfectly accurate attribution of every individual reflection to a specific cluster. Teacher observations (T2-OBS) were also examined, given their value for understanding the dynamics of the implementation activities and for cross-checking the patterns suggested by the logs and reflections.
Considered as a whole, and by cross-validating previous analyses of the datasets with the present gameplay logs, high-performance groups appear to adopt collaborative strategies that slow down decision-making when needed, distribute attention across team members and use AR overlays and other media as shared artifacts for joint sense-making. ‘Fast but fragile’ groups seem more prone to treating the game as a speed-focused challenge, which can undermine deeper engagement with sustainability concepts and with the cultural heritage context, while ‘slow but moderate’ groups illustrate how extended time on task does not automatically translate into high performance without sufficient focus and coordination. In this sense, the LA profiles do not simply classify groups by achievement; they also point to distinct ways in which collaborative learning with mobile AR unfolds in real urban environments. These patterns open design possibilities for differentiated scaffolding and for supporting teachers, researchers and game designers, which will be further explored in the discussion.

5. Discussion

In the previous section, we reported the empirical patterns extracted from field logs, including descriptive statistics, item-level error mapping, and three collaborative gameplay profiles derived from multivariate clustering. In this section, these patterns are interpreted as design-relevant configurations of collaborative behavior, emphasizing how the proposed learning analytics workflow supports task refinement, scaffolding decisions, and reporting practices for outdoor mobile AR deployments, without making causal claims about learning effects attributable to AR.

5.1. Interpreting Collaborative Gameplay Patterns in a Mobile AR Heritage Context

The results indicate that the Art Nouveau Path is generally feasible within regular lesson constraints while still revealing systematic between-group variability in accuracy, time management, and AR-mediated task performance (Section 4.1; Table 5). This pattern is consistent with prior work arguing that mobile AR can support engagement and conceptual understanding when aligned with curricular goals and classroom realities [1,2]. Importantly, the log-based indicators make this variability explicit and comparable across groups, supporting interpretation beyond what can be consistently observed in situ.
Temporal indicators reinforce this interpretation, considering that session duration and pacing suggest that most groups engaged with the activity for nearly a full lesson and progressed at roughly one item per minute. This pattern is more compatible with an exploratory field-based activity than with a rapid quiz and fits earlier arguments that AR and mobile games can transform everyday spaces into sites for inquiry-oriented learning rather than simple testing [27,32]. It is also indicated, as presented in Table 5, substantial between-group variation in the AR-specific score, suggesting meaningful differences in AR-mediated task performance even when most groups engaged with AR-mediated content. Many groups obtained values close to the upper end of this scale, while a smaller subset accumulated lower AR-specific scores, indicating that most groups did not avoid AR-mediated content but that there was meaningful variation in AR-mediated task performance as captured by the AR-specific score.
Item- and POI-level error mapping refines the global picture by showing that difficulty is concentrated in a small subset of tasks rather than being evenly distributed across the path. The demanding items subset captures prompts that require multi-step reasoning and contextual interpretation (for example, inference about reuse of heritage buildings, comparison of archival and contemporary photographs, or abstraction from dense facade details). By contrast, recognition-oriented prompts supported by explicit media cues tend to show consistently high performance. This pattern is analytically useful because it supports targeted redesign and scaffolding choices without treating the overall route as uniformly difficult.
From a game design perspective, this pattern suggests, when cues are explicit, the Art Nouveau Path may scaffold noticing and recall, while still incorporating conceptually demanding tasks that require abstraction, estimation and the integration of multiple sources of information. In line with GLA work that uses gameplay logs to distinguish between routine tasks and productive challenges [12,13], the most difficult items in this MARG operate as desirable difficulties rather than as barriers, since a substantial proportion of groups still solved them correctly. At the same time, the concentration of errors in a small subset of conceptually dense items raises questions about how groups manage collaborative dynamics, pacing and attention in a noisy, dynamic urban environment, particularly in EfS activities where learners must connect local heritage to broader socio-environmental issues [7,10].
These questions are addressed by the cluster analysis of group-level indicators. The retained three-cluster solution highlights qualitatively distinct collaborative gameplay profiles. The ‘fast but fragile’ profile progresses quickly through the route, but at the cost of lower overall accuracy, particularly on demanding items. The ‘slow but moderate’ profile spends the longest time on task, with intermediate performance and a slower pace, suggesting extended engagement without reaching the highest performance levels. The ‘thorough and successful’ profile combines very high accuracy, including on demanding items, with strong AR-mediated performance and a measured pace, indicating a balanced pattern of coordinated progression and effective use of AR. Figure 7 summarizes this analysis.
In this sense, the profiles obtained in this study exemplify how an LA pipeline can transform raw gameplay logs into interpretable patterns of collaborative strategy in mobile AR settings, complementing prior calls for more transparent and context-sensitive analytics workflows in XR and location-based AR research [24,51].

5.2. Contributions to LA in Game-Based and Immersive Environments

This study’s outcomes relate to current work on how LA can capture meaningful patterns in game-based and immersive learning. Previous studies on GLA stress the importance of building pipelines that turn raw telemetry into indicators that are both methodologically sound and pedagogically useful, for example, by distinguishing descriptive, diagnostic, predictive and prescriptive uses of in-game logs [12,13,14,15]. Yet most of this research still focuses on digital games in controlled or virtual settings, with relatively few examples drawn from mobile, location-based or AR-enhanced games implemented under outdoor educational contexts.
The present work offers an analytics workflow that starts from relatively simple group-level logs and progresses to a compact set of indicators that characterize collaborative performance, pacing and task-specific difficulty in a contextualized MARG. The indicators include overall accuracy, accuracy on a subset of demanding items, an AR-specific score, session duration and a pacing index, complemented by error mapping by POI and media type. All of them are directly grounded in the empirical data generated by 118 collaborative groups and 4248 group-item responses, yet can be read and discussed by teachers and game designers without additional technical expertise. For instance, isolating the subset of demanding items makes it possible to distinguish groups that mainly struggle with complex tasks from those that face difficulties across the route, while combining duration and pacing helps to move beyond simple contrasts between fast and slow players and towards a more nuanced view of how groups manage time in the field.
The clustering approach is a second contribution. Profiles such as ‘fast but fragile’, ‘slow but moderate’ and ‘thorough and successful’ are not merely statistical artifacts. They correspond to recognizable configurations of performance and engagement. As previously summarized in Table 5, ‘fast but fragile’ groups combine relatively low overall accuracy and very low accuracy on demanding items with shorter sessions and the highest pacing values. ‘Thorough and successful’ groups, by contrast, show very high overall and demanding-item accuracy, high AR-specific scores and intermediate session durations. ‘Slow but moderate’ groups fall between these two extremes, with moderate accuracy, substantial AR-mediated task performance (AR-specific score) and the longest sessions. These configurations, summarized numerically in Table 8, are derived from the cluster means reported in Table 6 and translate the three collaborative profiles into design-relevant categories.
Table 8 extends this contribution by translating the quantitative profiles into design-relevant categories. It brings together each profile’s main indicators, the qualitative tendencies observed in students’ post-game reflections and possible scaffolding strategies. In doing so, it shows how learning analytics can be used not only to describe student behavior but also to inform decisions about where and how to intervene, responding to calls for analytics that support teacher decision-making and iterative game design rather than functioning solely as retrospective reporting tools [14,16,19,50].
Finally, the study also speaks to the emerging field of LA in XR environments and AR-enhanced activities. Previous works on XR analytics point out that most empirical studies are centered on VR and rely mainly on self-report data and simple usage counts, with limited use of fine-grained interaction logs [24,25]. In comparison with VR works, a smaller body of work has begun to explore telemetry in AR settings, for example, to detect disengagement, monitor gameplay in AR apps for children or analyze cultural competence in higher education [26,27,28]. The present work adds to this landscape by showing, in an education-based urban heritage context, how event-level interaction logs from a MARG can be turned into transparent indicators and collaborative gameplay profiles that are both analytically robust and pedagogically meaningful.

5.3. Mobile AR, Built Heritage and Sustainability Competences

The results also relate to ongoing debates on how mobile AR may help bridge-built heritage and EfS. Research in heritage settings suggests that AR and virtual environments can enhance students’ engagement with monuments, historic sites and landscapes, but that educational benefits depend strongly on pedagogical framing and integration into broader programs [29,30,32,33]. In parallel, reviews of AR in environmental and sustainability education report gains in environmental knowledge, attitudes and motivation, particularly when activities are embodied, inquiry-oriented and socially shared, while emphasizing the need for more rigorous designs and diversified assessment methods [5,6,7,8,9,10]. Across both strands, evaluation still relies largely on questionnaires, interviews and simple usage metrics, with limited attention to how specific AR-mediated tasks behave in real paths or how difficulties are distributed along urban paths.
Within this setting, the Art Nouveau Path offers a possible glimpse of how a city area can be treated as a structured learning path aligned with sustainability competences learning goals. Item- and path-level analyses show that not all heritage-related tasks function in the same way. Items that invite students to recognize architectural details explicitly highlighted by AR overlays or other media tend to be solved with very high accuracy, which is consistent with the interpretation that explicit AR-mediated cues may support noticing and recall in situ, without being interpreted as evidence of causal learning benefit. By contrast, the subset of demanding items shows substantially lower accuracy and requires students to interpret urban change, evaluate arguments for reusing heritage buildings and connect decorative motifs to broader environmental and landscape issues. These tasks combine dense visual information with inferential reasoning and, in some cases, abstract knowledge mobilization.
The profile contrasts on the demanding items subset show a marked separation between groups that combine high overall accuracy with strong performance on conceptually loaded tasks and groups that progress quickly but struggle on those demanding prompts. This suggests that embedding sustainability-related reasoning in a heritage path is not simply a matter of adding AR content, but depends on how visual cues, narrative prompts, time constraints, and collaboration are orchestrated.
From the viewpoint of sustainability competences, several of these demanding items were deliberately designed as proxies for core GreenComp dimensions, such as valuing sustainability, systems thinking and futures literacy [36]. Tasks that ask students to infer advantages of reusing Art Nouveau buildings, to recognize unsustainable urban transformations or to reflect on landscape and facade preservation require them to link situated, local scenarios to broader socio-environmental principles. The empirical pattern whereby high-performing groups solve these items with very high accuracy, within feasible session durations, may indicate that MARGs contextualized in real built heritage can support more complex sustainability-related thinking when collaborative strategies and pacing are favorable. At the same time, the persistent difficulties observed in ‘fast but fragile’ and ‘slow but moderate’ groups point to the need for additional scaffolding if all students are to benefit from this potential.
These findings have practical implications for the design of AR-mediated heritage experiences that aim to contribute to EfS. Also, error maps and cluster-based profiles can inform revisions to specific tasks, for example, by simplifying instructions at demanding POIs, adding intermediate prompts that guide the comparison of archival and contemporary images or providing teacher guidance tailored to different collaborative profiles. For ‘fast but fragile’ groups, teachers might emphasize the value of pausing to compare interpretations and allocate explicit time to the most complex items, so that the activity is not experienced primarily as a race. For ‘slow but moderate’ groups, support may focus on decision-making and on helping students prioritize key visual cues in visually dense spaces. For ‘thorough and successful’ groups, designers can introduce optional extension tasks that deepen engagement with sustainability themes, turning high performance into opportunities for advanced exploration.
Scalability is not only a technical issue of logging and analytics, but also a pedagogical and organizational issue mediated by teacher readiness, classroom norms, and perceived value of AR-supported activities. Marín-Marín and colleagues (2023) highlighted that teachers’ attitudes toward developing and adopting good practices with AR can shape implementation conditions and the stability of classroom routines needed for meaningful use [59].
More broadly, this study shows that gameplay logs from a MARG embedded in a DTLE can be transformed into valuable LA that make visible where and how students attend to built heritage, how they manage time in the city and how they respond to sustainability-related challenges, complementing the questionnaire-based approaches that still dominate the field [27,51]. When these analytics are interpreted alongside students’ own reflections and teacher observations, they offer a way of aligning the design of AR experiences with the goals of ESD. In this sense, the Art Nouveau Path functions not only as a curricular resource, but also as an empirical case that supports the concept that cities can be approached as data-rich, narrative learning environments where AR, heritage and sustainability competences intersect in analytically tractable and pedagogically actionable ways.

6. Conclusions

This study examined how gameplay logs from a location-based MARG contextualized in an urban heritage district can be transformed into meaningful LA for EfS. Focusing on the Art Nouveau Path within the EduCITY DTLE, it addressed two research questions: (RQ1) how raw gameplay logs can be converted into a structured set of indicators that characterize collaborative group performance, pacing and task specific difficulty; and (RQ2) which distinct collaborative gameplay profiles emerge when these indicators are analyzed using cluster analysis, and how these profiles relate to students’ qualitative reflections on collaboration, perceived challenge and perceived learning about sustainability and urban cultural heritage. The analysis was based on data from 439 students organized into 118 collaborative groups, who engaged with 36 quiz-based tasks across 8 POIs in Aveiro’s Art Nouveau area, within a broader DBR project [37,38] on MARGs and sustainability.

6.1. Main Conclusions

This study makes three main contributions. First, at the methodological level, it specifies a field-ready learning analytics workflow that transforms group-level mobile AR logs into interpretable indicators and profiles. Second, at the descriptive level, it identifies three distinct collaborative gameplay profiles that capture meaningful combinations of performance, temporal strategy, and AR-mediated task success. Third, at the design level, it demonstrates how error mapping and profile interpretation can inform concrete refinement of task narratives, scaffolding choices, and reporting practices for future deployments.
Regarding RQ1, the study showed that group-level mobile AR logs can be transformed into an interpretable set of learning analytics indicators capturing overall feasibility, temporal strategy, AR-mediated task performance, and localized difficulty patterns at the item and POI level. This operationalizes performance and interaction dynamics in a field-ready way, aligning with calls in game learning analytics to move from raw traces to interpretable indicators [12,13,14,15,19], while keeping the interpretation epistemically bounded to logged performance rather than direct learning claims.
Concerning RQ2, the use of cluster analysis on the standardized indicators revealed three distinct collaborative gameplay profiles that are both statistically coherent and pedagogically interpretable. The ‘fast but fragile profile’, comprising 34 groups (28.81% of the sample), the ‘slow but moderate’ profile, including 29 groups (24.58%), and the ‘thorough and successful’ profile, the largest with 55 groups (46.61%).
The definition of these profiles demonstrates that the same MARG and heritage-contextualized path can elicit qualitatively distinct patterns of collaborative engagement, rather than a simple continuum from weaker to stronger performers, aligning with previous work that uses clustering to identify game-based learning profiles [11,20,49].
Methodologically, the retained k = 3 solution reflects an explicit trade-off between statistical separation and interpretability. While k = 2 yielded the highest silhouette value, the WSS pattern showed diminishing returns after k = 3 and the three-cluster partition better captured three distinct, design-relevant configurations observed in situ (speed-accuracy trade-offs and differential engagement with AR-mediated tasks), avoiding an overly coarse dichotomy. This decision is therefore treated as a pedagogical modeling choice supported by quantitative diagnostics and practical stability evidence rather than as a uniquely optimal clustering structure.
These profiles are not merely statistical abstractions: (1) ‘Fast but fragile’ groups tend to frame the game as a race, progressing quickly at the cost of accuracy, especially on complex tasks: (2) ‘Slow but moderate’ groups invest substantial time but do not fully convert this investment into high performance, suggesting challenges in coordination or decision making in the field; and, (3) ‘thorough and successful’ groups balance pacing and depth, using the available time and AR resources to achieve very high performance, including on the demanding items.
The use of the qualitative reflections, based on students’ open-ended answers, reinforced these profile analyses and interpretation textually. This alignment between behavioral indicators and self-reported experiences is consistent with recommendations in LA and XR research to combine log-based profiles with qualitative data when studying immersive experiences [26,27,28]. According to this, the present study offers a data-grounded and experience-grounded answer to RQ2: the same MARG can give rise to three distinct collaborative gameplay profiles that differ systematically in performance, pacing, engagement with AR, and perceived experience.
In sum, these findings contribute to three overlapping domains: (1) Regarding LA and GBL, it is exemplified how a pipeline of indicators can be built from group-level logs in a field-based MARG, aligning with and extending existing GLA frameworks to location-based and collaborative contexts [12,13,14,15]. (2) Concerning research on immersive and AR-enhanced learning, empirical evidence is provided showing that fine-grained interaction data in mobile AR are not limited to technical monitoring, but can be instrumental in identifying distinct collaborative gameplay styles and in diagnosing how AR-mediated tasks function at the item and path level, responding to gaps highlighted in recent XR-focused reviews [24,25]. (3) Regarding EfS through built heritage, it is demonstrated that a MARG aligned with the GreenComp framework can function as both a curricular resource and a data-rich testbed [3,16,32,33], revealing how students collaboratively engage with complex sustainability-related content in a real urban environment while also indicating where additional scaffolding is needed.

6.2. Limitations

The study’s contributions should be interpreted considering several limitations.
First, all analyses were conducted at the group level, without individual identifiers. This design choice precludes analysis of within-group role distributions and equity issues related to participation and voice, which are increasingly recognized as important in LA and data-informed education [25]. Future research could combine group-level logs with additional, consented data sources, such as short interviews combined with anonymized participation records, to better understand how individual experiences are embedded within the collaborative profiles.
Second, the analysis focused on a single city, heritage area and MARG. This focus supports ecological validity but limits generalizability. Cultural, curricular and infrastructural conditions in other contexts may shape how students engage with mobile AR, how heritage is interpreted and how sustainability competences are mobilized. Replicating the workflow in other cultural and environmental contexts, with different age groups and educational contexts, would help clarify which aspects of the indicators and profiles are context-specific and which may be transferable across mobile AR sustainability development experiences. Relatedly, the ‘demanding items’ subset was defined empirically for this specific path and item set; in other paths or thematic implementations, it should be re-identified rather than assumed to transfer unchanged.
Third, although the logs are sufficiently detailed to support the indicators used in this study, their temporal and spatial granularity is constrained. Data was recorded at the level of complete sessions and item outcomes, without dwell time estimates per POI or fine-grained micro navigation traces. This makes it impossible, for example, to reconstruct precise trajectories within each POI or to compare time allocation between specific segments of the path. More detailed logging would permit closer alignment with high-resolution trajectory methods and spatial analytics developed in Geographic Information Science.
Increasing data granularity also raises ethical and privacy considerations. While the present study relies on device-level group logs without usernames or demographic identifiers, finer-grained traces can increase re-identification risk, particularly in small classes or repeated deployments. Future instrumentation should therefore follow data minimization principles, clearly communicate purposes and retention periods, and prioritize aggregation strategies that preserve analytic value while reducing identifiability.
Fourth, the linking of post-game reflections to cluster membership is necessarily approximate, since reflections are written individually and anonymously, but interpreted at the group level. Moreover, reflections were not uniformly distributed across groups, which further constrains interpretability and precludes prevalence statements at the profile level. While care was taken to associate reflections with the corresponding groups and to use them in a complementary rather than determinative way, it is not possible to guarantee perfect attribution of every individual comment to a specific profile. Teacher observations (T2-OBS) help to triangulate these interpretations but are likewise limited by their qualitative and selective nature.
In addition, we used the app-recorded AR-specific score as an indicator of success in AR-mediated tasks. At the session level, the logs store an AR-specific score that summarizes performance on the subset of 11 items mediated by augmented reality, with values ranging from 0 to 55 points under the app’s scoring rules. Given the log granularity available in this deployment, this variable should be interpreted as AR-task performance (successful completion and correctness within AR-mediated items), rather than as a direct measure of time-on-AR exposure or as evidence of AR-facilitated learning gains. In earlier analyses [55], this score was used to operationalize higher vs. lower AR-task performance in relation to exploration time; in the present study, it is included as a continuous feature to support multivariate profiling of collaborative gameplay behavior.
Conceptually, the five indicators used for profiling do not represent homogeneous “learning outcomes”. Overall accuracy, accuracy on demanding items, and the AR-specific score primarily capture cognitive task performance under the implemented scoring rules, while session duration and pacing index capture temporal and strategic organization of collaborative activity (how groups allocate time, regulate speed, and progress across tasks). Moreover, reflections were not uniformly distributed across groups, which further constrains interpretability and precludes prevalence statements at the profile level. This distinction is important to avoid overinterpretation, because the study is observational and log-based, and the derived profiles should be read as behavioral configurations that can inform design decisions rather than as causal evidence of instructional effectiveness. Accordingly, these indicators are treated as proxies for observable interaction patterns and in-game task performance within this specific design and deployment context, and they do not establish learning gains or sustainability competence development. Learning-relevant interpretations are therefore made cautiously and are supported through triangulation with participants’ post-game reflections and the design rationale, rather than inferred from the logs alone.
Table 5 also indicates substantial between-group variation in the AR-specific score, suggesting meaningful differences in AR-mediated task performance even when most groups engaged with AR-mediated content. Many groups obtained values close to the upper end of this scale, while a smaller subset accumulated lower AR-specific scores, indicating that most groups did not avoid AR-mediated content but that there was meaningful variation in AR-mediated task performance as captured by the AR-specific score. Fifth, bootstrap-based stability indices or resampling-based clustering validation were not conducted; therefore, the reported stability checks should be interpreted as pragmatic robustness evidence rather than as a full inferential assessment of cluster stability. Cluster robustness was assessed through multi-start k-means and sensitivity to alternative random seeds; nevertheless, the absence of resampling-based validation limits the strength of claims about the uniqueness of the derived profiles.
Finally, the study adopted a single condition design focused on the Art Nouveau Path and did not include a comparison or control group, such as an analog or non-AR version of the path. Also, the student cohort constitutes a local convenience sample of classes participating in the municipal educational action program [56]. Therefore, no causal claims can be made about the specific impact of the AR component relative to alternative formats. The evidence reported here is observational and design-oriented, concentrating on feasibility and collaborative gameplay patterns rather than on causal effects on learning outcomes. Likewise, the LA indicators derived from gameplay logs should be interpreted as proxies for interaction and task performance, not as direct measures of sustainability competence development. Transfer of learning beyond the activity and retention effects was not assessed and will need to be examined in conjunction with longitudinal data and psychometric validation in future work.

6.3. Implications and Future Work

Despite these limitations, the empirical patterns and profiles identified in this study have concrete implications for the design and orchestration of MARGs in educational-based EfS, as well as for future LA research.
At the level of task design, concentration of difficulty in a subset of items with accuracies between 58.47% and 72.88% suggests that these tasks may function as key points in the activity trajectory. Error maps by POI and media type, combined with profile-specific performance on these items, can guide targeted refinements. Tasks that require interpreting archival and contemporary photographs, evaluating arguments for reusing heritage buildings or connecting decorative motifs to broader environmental and landscape issues may benefit from clearer instructions, intermediate prompts or additional visual cues that help students focus on the most relevant aspects of the scene. Conversely, items that already achieve accuracy above 95.00% may be candidates for optional extension questions that deepen engagement without increasing overall cognitive load. This form of iterative refinement is consistent with DBR approaches to serious games and AR applications in education [16,32,33].
At the level of the collaborative dynamics, the three gameplay profiles suggest differentiated support strategies. These differentiated strategies echo broader discussions on using LA to support adaptive strategies in real game-based environments [14,15,49].
From an LA perspective, future work should prioritize a small set of actionable extensions that strengthen inference while remaining feasible within the current logging architecture. First, increasing trace granularity to support POI-level dwell time and within-item timing would allow the decomposition of pacing beyond session totals and enable interpretable analyses of how groups allocate time across easier and harder segments. Second, profile-informed redesign can be tested across comparable implementations by revising a small subset of high-error tasks and evaluating pre-specified indicators (e.g., demanding items subset accuracy, error-map concentration, and profile membership proportions). Third, integrating gameplay profiles with repeated competence measures, such as GCQuest data from pre-, post- and follow-up questionnaire moments, would enable analyses of whether collaborative gameplay styles co-occur with different competence trajectories in a framework anchored in GreenComp [36]. Together, these extensions respond to calls in environmental and EfS for multi-method and longitudinal assessment of mobile AR interventions [5,6,7,8,9,10].
The indicators and profiles developed here can also inform the design of analytics-informed feedback tools. Teachers facing dashboards that visualize, for each class, distributions of overall accuracy, AR-specific scores, pacing and cluster membership could support orchestration in real time, helping teachers decide when and where to intervene during the route. Students facing feedback, either in situ or post-game, could draw on the same indicators to foster metacognitive reflection on collaboration, time management and attention to urban details. Implementing and evaluating such tools in subsequent DBR cycles would test the practical utility of the proposed learning analytics beyond research reporting and align with ongoing efforts to operationalize LA in authentic learning environments [11,12,19].
Open problems emerging from this study are primarily methodological and design-oriented. The first immediate extension is to increase temporal granularity in trace capture to enable robust POI-level dwell time and within-item timing, which would support stronger interpretations of pacing strategies beyond session totals. This extension is feasible within the current device-level logging approach by recording POI entry and exit timestamps and item start and completion timestamps, while preserving anonymization and avoiding collection of direct identifiers. A second immediate extension is to operate profile-informed redesign in a subsequent DBR cycle by revising a small set of high-error tasks and empirically evaluating whether item-level error signatures and the distribution of gameplay profiles shift across comparable implementations using pre-specified indicators (e.g., demanding items subset accuracy, error-map concentration, and profile membership proportions). This evaluation can be operationalized as a pre-specified comparison of the same indicators across matched cohorts and routes using identical scoring rules and logging settings. Finally, cross-path replication remains an open problem: “demanding items” should be treated as context-dependent and re-identified when paths, narratives, or curricular emphases change, rather than assumed to transfer unchanged. An additional open problem is to test whether the same profile structure and indicator distributions remain stable under heterogeneous devices and connectivity conditions, which may alter pacing, AR rendering consistency, and trace completeness in real deployments.

6.4. Final Reflection

In summary, the Art Nouveau Path and its associated gameplay logs functioned as a testbed for an event-based LA workflow in a mobile AR game for EfS. This study has presented that raw group-level logs can be transformed into interpretable indicators, empirically grounded collaborative profiles and design-relevant insights, without losing sight of the situated and collaborative nature of gameplay in urban heritage settings. These results support the view that MARGs situated in built heritage can operate as analytical lenses on how students learn to notice, value and reason about sustainability issues in place, rather than as mere motivational add-ons.
By transforming raw logs into a coherent set of indicators and profiles, the proposed workflow suggests that LA can support sustainability educational frameworks, such as the GreenComp [36], without eclipsing the embodied, collaborative and aesthetic dimensions of fieldwork. Extending and adapting this approach to other contexts can help consolidate cities as data-informed learning landscapes for ESD, in which the traces of students’ movements are used not only to register participation but to guide more equitable, reflective and substantively rich learning experiences.

Author Contributions

Conceptualization, J.F.-S.; methodology, J.F.-S.; validation, J.F.-S. and L.P.; formal analysis, J.F.-S.; investigation, J.F.-S.; resources, J.F.-S.; data curation, J.F.-S.; writing—original draft, J.F.-S.; writing—review and editing, J.F.-S. and L.P.; visualization, J.F.-S.; supervision, L.P.; project administration, J.F.-S. and L.P. All authors have read and agreed to the published version of the manuscript.

Funding

This work was funded by National Funds through the FCT—Fundação para a Ciência e a Tecnologia, I.P., under Grant Number 2023.00257.BD., with the following DOI: https://doi.org/10.54499/2023.00257.BD. The EduCITY project is funded by National Funds through the FCT—Fundação para a Ciência e a Tecnologia, I.P., under the project PTDC/CED-EDG/0197/2021.

Institutional Review Board Statement

This study was conducted in accordance with the Declaration of Helsinki, approved by the GDPR (27 November 2024), and approved by the Ethics Committee of the University of Aveiro (protocol code 1-CE/2025 on 5 February 2025).

Informed Consent Statement

Informed consent was obtained from all participants involved in the study.

Data Availability Statement

The datasets supporting the findings of this study were generated during the implementation of the Art Nouveau Path mobile augmented reality game in Aveiro, Portugal. The raw research datasets (student questionnaires S1-PRE, S2-POST, and S3-FU; teacher reflection forms T1-R; and teacher observation records T2-OBS) contain sensitive information and are therefore not publicly available due to participant privacy, GDPR, and ethical restrictions. De-identified versions of these datasets may be made available by the corresponding author upon reasonable request, subject to institutional approval and applicable data-sharing conditions. To support transparency and reuse, non-sensitive instruments and aggregated resources are openly available in the project’s Zenodo community “Art Nouveau Path”, including: the complete Art Nouveau Path MARG and its mapping to the GreenComp framework (DOI: 10.5281/zenodo.16981236), and the automated gameplay logs summary (DOI: 10.5281/zenodo.17507328). All publicly shared files omit sensitive fields, and full item-level gameplay logs are available upon reasonable request under the same ethical and institutional conditions.

Acknowledgments

The authors acknowledge the support of the research team of the EduCITY project. The authors also appreciate the willingness of the participants to contribute to this study. During the preparation of this manuscript, the authors used Microsoft Word, Excel and PowerPoint (Microsoft 365), DeepL (DeepL Free Translator) (version released 5 November 2025), ChatGPT (GPT-5, released 7 August 2025), R (version 4.4.1) and Julius.AI (version released 29 May 2025, https://julius.ai/changelog) for the respective purposes of writing and editing text, cleaning and organizing data, designing schemes and tables, translation and language improvement, statistical analysis and data visualization, and cross checking descriptive statistics, clustering procedures and wording consistency. Quantitative data were initially cleaned and preprocessed in Excel and subsequently analyzed and visualized in R (version 4.4.1) using the tidyverse ecosystem and ggplot2 to generate publication-quality figures. Julius.AI was used only as an auxiliary environment to recalculate selected statistics and to validate the reproducibility of the R-based analyses. The authors have reviewed and edited all outputs and take full responsibility for the content of this publication.

Conflicts of Interest

The authors declare no conflicts of interest. The funders had no role in the design of the study; in the collection, analyses, or interpretation of data; in the writing of the manuscript; or in the decision to publish the results.

Abbreviations

The following abbreviations are used in this manuscript:
ARAugmented Reality
GBLGame-Based Learning
LBMLocation-Based Mechanics
MARGMobile Augmented Reality Game
EfSEducation for Sustainability
LALearning Analytics
GLAGame Learning Analytics
VRVirtual Reality
POIPoint of Interest
DTLEDigital Teaching and Learning Ecosystem
T1-VALTeachers’ Questionnaire MARG Validation
T1-RTeachers’ Questionnaire MARG’s Curricular Review
S1-PREStudents’s Baseline Questionnaire
S2-POSTStudents’s Post Questionnaire
S3-FUStudents’s Follow-UP Questionnaire
RQResearch Question
DBRDesign-Based Research
ESDEducation for Sustainable Development
XRExtended Reality
LBARLocation-Based Augmented Reality
T2-OBSTeachers’ Observation Questionnaire
%Percent
WSSWithin-Cluster Sum of Squares
ARIAdjusted Rand Index
SDStandard Deviation
MMean

Appendix A

Table A1. Corpus and its central use in the paper.
CategoryNReferenceAuthor(s) (Year)Central Use in the Paper
Peer-reviewed
Articles
45[1] *, **Akçayır & Akçayır (2017)Section 1; Section 2.1; Section 2.3
[2] *, **Radu (2014)Section 1; Section 2.1
[4] **Chen et al. (2022)Section 1
[5] **Attanasi et al. (2025)Section 1; Section 2.3; Section 5.1; Section 5.3
[6] **Koparan (2025)Section 1; Section 2.3; Section 5.1; Section 5.3
[7] **Ladykova et al. (2024)Section 1; Section 2.3; Section 5.1; Section 5.3
[8] **Negi (2024)Section 1; Section 2.3; Section 5.1; Section 5.3
[9] **Shakirova et al. (2024)Section 1; Section 2.3; Section 5.1; Section 5.3
[10] **Simon et al. (2025)Section 1; Section 2.3; Section 5.1; Section 5.3
[11] **Emerson et al. (2020)Section 1; Section 2.2; Section 2.2.1; Section 4.2; Section 5.2; Section 6.1; Section 6.3
[12] **Tlili et al. (2021)Section 1; Section 2.2; Section 2.2.1; Section 5.2
[13] **Alonso-Fernández et al. (2019)Section 1; Section 2.2; Section 2.2.1; Section 5.2; Section 6.1; Section 6.3
[14] **Alonso-Fernández et al. (2022)Section 1; Section 2.2.1; Section 2.2.2; Section 5.2; Section 6.1; Section 6.3
[15] **Banihashem et al. (2024)Section 2.2.1; Section 5.2; Section 5.3
[16] **Daoudi (2022)Section 2.2.1; Section 5.2
[17] **Kim et al. (2022)Section 2.2.1; Section 5.2
[18] **Lu et al. (2025)Section 2.2.1; Section 4.1; Section 5.2; Section 5.3; Section 6.3
[19] **Rivera-Uscanga et al. (2025)Section 2.2.1; Section 5.2
[20] **Sánchez Castro et al. (2024)Section 2.2.1; Section 5.2; Section 5.3
[21] **Blikstein & Worsley (2016)Section 2.2.2; Section 5.3
[22] **Gašević et al. (2015)Section 2.2.2; Section 5.3; Section 6.1; Section 6.3; Section 6.4
[23] **Walkington et al. (2024)Section 2.2.2; Section 2.3
[24] **Lampropoulos & Evangelidis (2025)Section 2.2.2; Section 2.3; Section 5.1; Section 5.3
[25] **Sakr & Abdullah (2024)Section 2.2.2; Section 5.3; Section 6.1; Section 6.3; Section 6.4
[26] **Abdul Razak et al. (2024)Section 2.2.2; Section 4.1; Section 5.3
[27] **Cheng (2023)Section 2.2.2; Section 2.3; Section 4.1; Section 5.1; Section 5.3
[28] **Singh et al. (2022)Section 2.2.2; Section 2.3; Section 4.1; Section 5.1; Section 5.3
[29] **Chatsiopoulou & Michailidis (2025)Section 2.3; Section 5.1; Section 5.3
[30] *, **Ibañez-Etxeberria et al. (2020)Section 2.3; Section 5.1; Section 5.3
[31]Wang et al. (2024)Section 2.3; Section 5.1
[32] *, **Xu et al. (2023)Section 2.3; Section 5.1; Section 5.3
[33] **Capecchi et al. (2024)Section 2.3; Section 3.1; Section 4.1; Section 5.1; Section 5.3
[34] **Ricca et al. (2022)Section 2.3; Section 5.1; Section 5.3
[35] **Raber et al. (2022)Section 2.3; Section 5.1; Section 5.3
[45] **Hanggara et al. (2024)Section 2.1
[46] **Samuelsen et al. (2019)Section 2.2
[47] **Mian et al. (2022)Section 2.2
[48] **Sharif & Atif (2024)Section 2.2
[49] **Calvo-Morata et al. (2025)Section 2.2.1; Section 6.1; Section 6.3
[50] **Drugova et al. (2024)Section 2.2.1; Section 5.2
[51] **Fonseca et al. (2025)Section 2.2.2; Section 2.3; Section 5.1; Section 5.3
[52] **Kohli & Arora (2024)Section 2.3
[57] *, **Boeve-de Pauw et al. (2014)Section 3.1
[58] **Forbus & Lovett (2021)Section 4.2
[59] *, ***Marín-Marín et al. (2023)Section 5.3
Policy and institutional framework1[36] *Bianchi et al. (2022)Section 1; Section 2.4; Section 3.2; Section 3.3.2; Section 5.3; Section 6.1; Section 6.3
Prior authors’ works4[3] *, **Ferreira-Santos & Pombo (2025)Section 1; Section 2.4; Section 3.1; Section 3.2; Section 3.3.1; Section 3.3.2; Section 3.4; Section 3.5.1; Section 6.1; Section 6.3
[53] *, **Ferreira-Santos & Pombo (2025)Section 1; Section 2.4; Section 3.1; Section 3.2; Section 3.3.1; Section 3.3.2; Section 3.4; Section 3.5.1; Section 6.1; Section 6.3
[54] *, **Ferreira-Santos & Pombo (2025)Section 1; Section 2.4; Section 3.1; Section 3.2; Section 3.3.1; Section 3.3.2; Section 3.4; Section 3.5.1; Section 6.1; Section 6.3
[55] *, **Ferreira-Santos & Pombo (2026)Section 1; Section 2.4; Section 3.1; Section 3.2; Section 3.3.1; Section 3.3.2; Section 3.4; Section 3.5.1; Section 6.1; Section 6.3
* Sourced from previous works. ** Peer-reviewed. *** Included after revision.

References

  1. Akçayır, M.; Akçayır, G. Advantages and challenges associated with augmented reality for education: A systematic review of the literature. Educ. Res. Rev. 2017, 20, 1–11. [Google Scholar] [CrossRef] [Scilit]
  2. Radu, I. Augmented reality in education: A meta-review and cross-media analysis. Pers. Ubiquit Comput. 2014, 18, 1533–1543. [Google Scholar] [CrossRef] [Scilit]
  3. Ferreira-Santos, J.; Pombo, L. The Art Nouveau Path: Trajectory Analysis and Spatial Storytelling Through a Location-Based Augmented Reality Game in Urban Heritage. ISPRS Int. J. Geo-Inf. 2025, 14, 469. [Google Scholar] [CrossRef] [Scilit]
  4. Chen, F.H.; Tsai, C.C.; Chung, P.Y.; Lo, W.S. Sustainability Learning in Education for Sustainable Development for 2030: An Observational Study Regarding Environmental Psychology and Responsible Behavior through Rural Community Travel. Sustainability 2022, 14, 2779. [Google Scholar] [CrossRef] [Scilit]
  5. Attanasi, G.; Buljat, B.; Festré, A.; Guido, A. Raising environmental awareness with augmented reality ✩. Ecol. Econ. 2025, 233, 108563. [Google Scholar] [CrossRef] [Scilit]
  6. Koparan, B. Examining the Impact of Augmented Reality Texts on Students ’ Attitudes Toward Environmental Issues and Sustainable Development. Sustainability 2025, 17, 6172. [Google Scholar] [CrossRef] [Scilit]
  7. Ladykova, T.I.; Sokolova, E.I.; Sakhieva, R.G.; Lapidus, N.I. Augmented reality in environmental education: A systematic review. EURASIA J. Math. Sci. Technol. Educ. 2024, 20, em2488. [Google Scholar] [CrossRef] [Scilit] [PubMed]
  8. Negi, S.K. Exploring the Impact of Virtual Reality and Augmented Reality Technologies in Sustainability Education on Green Energy and Sustainability Behavioral Change: A Qualitative Analysis. Procedia Comput. Sci. 2024, 236, 550–557. [Google Scholar] [CrossRef] [Scilit]
  9. Shakirova, N.; Berechikidze, I.; Gafiyatullina, E. The effects of immersive AR technology on the environmental literacy, intrinsic motivation, and cognitive load of high school students. Educ. Inf. Technol. 2024, 29, 9121–9138. [Google Scholar] [CrossRef] [Scilit]
  10. Simon, P.D.; Zhong, Y.; Dela, I.C.; Luke, C. Scoping Review of Research on Augmented Reality in Environmental Education. J. Sci. Educ. Technol. 2025, 34, 919–935. [Google Scholar] [CrossRef] [Scilit]
  11. Emerson, A.; Cloude, E.B.; Azevedo, R.; Lester, J. Multimodal learning analytics for game-based learning. Br. J. Educ. Technol. 2020, 51, 1505–1526. [Google Scholar] [CrossRef] [Scilit]
  12. Tlili, A.; Chang, M.; Moon, J.; Liu, Z.; Burgos, D.; Chen, N. A Systematic Literature Review of Empirical Studies on Learning Analytics in Educational Games. Int. J. Interact. Multimed. Artif. Intell. 2021, 7, 250–261. [Google Scholar] [CrossRef] [Scilit]
  13. Alonso-Fernández, C.; Calvo-Morata, A.; Freire, M.; Martínez-Ortiz, I.; Fernández-Manjón, B. Applications of data science to game learning analytics data: A systematic literature review. Comput. Educ. 2019, 141, 103612. [Google Scholar] [CrossRef] [Scilit]
  14. Alonso-Fernández, C.; Calvo-Morata, A.; Freire, M.; Martínez-Ortiz, I.; Fernández-Manjón, B. Game Learning Analytics: Blending Visual and Data Mining Techniques to Improve Serious Games and to Better Understand Player Learning. J. Learn. Anal. 2022, 9, 32–49. [Google Scholar] [CrossRef] [Scilit]
  15. Banihashem, S.K.; Dehghanzadeh, H.; Clark, D.; Noroozi, O.; Biemans, H.J.A. Learning analytics for online game-Based learning: A systematic literature review. Behav. Inf. Technol. 2024, 43, 2689–2716. [Google Scholar] [CrossRef] [Scilit]
  16. Daoudi, I. Learning analytics for enhancing the usability of serious games in formal education: A systematic literature review and research agenda. Educ. Inf. Technol. 2022, 27, 11237–11266. [Google Scholar] [CrossRef] [Scilit]
  17. Kim, Y.J.; Valiente, J.A.R.; Ifenthaler, D.; Harpstead, E.; Rowe, E. Analytics for Game-Based Learning. J. Learn. Anal. 2022, 9, 8–10. [Google Scholar] [CrossRef] [Scilit]
  18. Lu, W.; Griffin, J.; Sadler, T.D.; Laffey, J.; Goggins, S.P. Game-Based Learning Prediction Model Construction. J. Learn. Anal. 2025, 12, 293–321. [Google Scholar] [CrossRef] [Scilit]
  19. Rivera-Uscanga, G.J.; Rosales-Morales, V.Y.; Benítez-Guerrero, E.I. Learning Analytics Applied to Serious Games: A Systematic Literature Review. In Proceedings of the 19th Latin American Conference on Learning Technologies (LACLO 2024); Springer: Singapore, 2025; pp. 209–220. [Google Scholar] [CrossRef] [Scilit]
  20. Castro, S.S.; Sevillano, M.Á.P.; Cadavieco, J.F. Learning Analytics in Serious Games as Predictors of Linguistic Competence in Students at Risk. Technol. Knowl. Learn. 2024, 29, 1551–1577. [Google Scholar] [CrossRef] [Scilit]
  21. Blikstein, P.; Worsley, M. Multimodal Learning Analytics and Education Data Mining: Using computational technologies to measure complex learning tasks. J. Learn. Anal. 2016, 3, 220–238. [Google Scholar] [CrossRef] [Scilit]
  22. Gašević, D.; Dawson, S.; Siemens, G. Let’s not forget: Learning analytics are about learning. TechTrends 2015, 59, 64–71. [Google Scholar] [CrossRef] [Scilit]
  23. Walkington, C.; Nathan, M.J.; Huang, W.; Hunnicutt, J.; Washington, J. Multimodal analysis of interaction data from embodied education technologies. Educ. Technol. Res. Dev. 2024, 72, 2565–2584. [Google Scholar] [CrossRef] [Scilit]
  24. Lampropoulos, G.; Evangelidis, G. Learning Analytics and Educational Data Mining in Augmented Reality, Virtual Reality, and the Metaverse: A Systematic Literature Review, Content Analysis, and Bibliometric Analysis. Appl. Sci. 2025, 15, 971. [Google Scholar] [CrossRef] [Scilit]
  25. Sakr, A.; Abdullah, T. Virtual, augmented reality and learning analytics impact on learners, and educators: A systematic review. Educ. Inf. Technol. 2024, 29, 19913–19962. [Google Scholar] [CrossRef] [Scilit]
  26. Razak, F.N.A.; Kamsin, A.; Rahman, H. Learning analytics for children’s using augmented reality games. Int. J. e-Learn. High. Educ. 2024, 19, 165–176. [Google Scholar] [CrossRef] [Scilit]
  27. Cheng, C. A study on learning analytics of using mobile augmented reality application to enhance cultural competence for design cultural creation in higher education. J. Comput. Assist. Learn. 2023, 39, 1939–1952. [Google Scholar] [CrossRef] [Scilit]
  28. Singh, M.; Bangay, S.; Sajjanhar, A. Augmented Reality Enhanced Analytics to Measure and Mitigate Disengagement in Teaching Young Children. In Proceedings of the 2022 IEEE International Symposium on Mixed and Augmented Reality Adjunct (ISMAR-Adjunct), Singapore, 17–21 October 2022; pp. 782–785. [Google Scholar] [CrossRef] [Scilit]
  29. Chatsiopoulou, A.; Michailidis, P.D. Augmented Reality in Cultural Heritage: A Narrative Review of Design, Development and Evaluation Approaches. Heritage 2025, 8, 421. [Google Scholar] [CrossRef] [Scilit]
  30. Ibañez-Etxeberria, A.; Gómez-Carrasco, C.J.; Fontal, O.; García-Ceballos, S. Virtual environments and augmented reality applied to heritage education. An evaluative study. Appl. Sci. 2020, 10, 2352. [Google Scholar] [CrossRef] [Scilit]
  31. Wang, H.; Gao, Z.; Zhang, X.; Du, J.; Xu, Y.; Wang, Z. Gamifying cultural heritage: Exploring the potential of immersive virtual exhibitions. Telemat. Inform. Rep. 2024, 15, 100150. [Google Scholar] [CrossRef] [Scilit]
  32. Xu, N.; Liang, J.; Shuai, K.; Li, Y.; Yan, J. HeritageSite AR: An Exploration Game for Quality Education and Sustainable Cultural Heritage. In Proceedings of the Extended Abstracts of the 2023 CHI Conference on Human Factors in Computing Systems, Hamburg, Germany, 23–28 April 2023; pp. 1–8. [Google Scholar] [CrossRef] [Scilit]
  33. Capecchi, I.; Bernetti, I.; Borghini, T.; Caporali, A.; Saragosa, C. Augmented reality and serious game to engage the alpha generation in urban cultural heritage. J. Cult. Herit. 2024, 66, 523–535. [Google Scholar] [CrossRef] [Scilit]
  34. Ricca, D.; Lupo, B.; Diniz, J.; Veras, L.; Mazzilli, C. Attention, stimulus and Augmented Reality for urban daily-life education in a social peripheral setting: The Streets that tell stories AR app. Interact. Des. Archit. 2022, 52, 179–197. [Google Scholar] [CrossRef] [Scilit]
  35. Raber, J.; Ferdig, R.E.; Gandolfi, E.; Clements, R. An analysis of motivation and situational interest in a location-based augmented reality application. Interact. Des. Archit. 2022, 52, 198–220. [Google Scholar] [CrossRef] [Scilit]
  36. Bianchi, G.; Pisiotis, U.; Cabrera, M.; Punie, Y.; Bacigalupo, M. The European Sustainability Competence Framework; European Commission: Brussels, Belgium, 2022.
  37. Mckenney, S.; Reeves, T. Education Design Research. In Handbook of Research on Educational Communications and Technology, 4th ed.; Springer: New York, NY, USA, 2014; p. 29. [Google Scholar]
  38. Anderson, T.; Shattuck, J. Design-Based Research. Educ. Res. 2012, 41, 16–25. [Google Scholar] [CrossRef] [Scilit]
  39. Siddaway, A.P.; Wood, A.M.; Hedges, L.V. How to Do a Systematic Review: A Best Practice Guide for Conducting and Reporting Narrative Reviews, Meta-Analyses, and Meta-Syntheses. Annu. Rev. Psychol. 2019, 70, 747–770. [Google Scholar] [CrossRef] [Scilit]
  40. Thomas, J.; Harden, A. Methods for the thematic synthesis of qualitative research in systematic reviews. BMC Med. Res. Methodol. 2008, 10, 45. [Google Scholar] [CrossRef] [Scilit]
  41. Goddard, Y.L.; Ammirante, L.; Jin, N. A Thematic Review of Current Literature Examining Evidence-Based Practices and Inclusion. Educ. Sci. 2023, 12, 38. [Google Scholar] [CrossRef] [Scilit]
  42. Boyd, P. Reasoning within Hybrid Thematic Analysis. Link. J. 2024, 8, 1–14. [Google Scholar]
  43. Braun, V.; Clarke, V. Using thematic analysis in psychology. Qual. Res. Psychol. 2003, 3, 77–101. [Google Scholar] [CrossRef] [Scilit]
  44. Fereday, J.; Muir-Cochrane, E. Demonstrating Rigor Using Thematic Analysis: A Hybrid Approach of Inductive and Deductive Coding and Theme Development. Int. J. Qual. Methods 2006, 5, 80–92. [Google Scholar] [CrossRef] [Scilit]
  45. Hanggara, Y.; Qohar, A.; Sukoriyanto. The Impact of Augmented Reality-Based Mathematics Learning Games on Students’ Critical Thinking Skills. Int. J. Interact. Mob. Technol. 2024, 18, 173–187. [Google Scholar] [CrossRef] [Scilit]
  46. Samuelsen, J.; Chen, W.; Wasson, B. Integrating multiple data sources for learning analytics—Review of literature. Res. Pract. Technol. Enhanc. Learn. 2019, 14, 11. [Google Scholar] [CrossRef] [Scilit]
  47. Mian, Y.S.; Khalid, F.; Qun, A.W.C.; Ismail, S.S. Learning Analytics in Education, Advantages and Issues: A Systematic Literature Review. Creat. Educ. 2022, 13, 2913–2920. [Google Scholar] [CrossRef]
  48. Sharif, H.; Atif, A. The Evolving Classroom: How Learning Analytics Is Shaping the Future of Education and Feedback Mechanisms. Educ. Sci. 2024, 14, 176. [Google Scholar] [CrossRef] [Scilit]
  49. Calvo-Morata, A.; Alonso-Fernández, C.; Santilario-Berthilier, J.; Martínez-Ortiz, I.; Fernández-Manjón, B. Learning Analytics to Guide Serious Game Development: A Case Study Using Articoding. Computers 2025, 14, 122. [Google Scholar] [CrossRef] [Scilit]
  50. Drugova, E.; Zhuravleva, I.; Zakharova, U.; Latipov, A. Learning analytics driven improvements in learning design in higher education: A systematic literature review. J. Comput. Assist. Learn. 2024, 40, 510–524. [Google Scholar] [CrossRef] [Scilit]
  51. Fonseca, X.; Spangenberger, P.; Baer, M.; Schmidt, R.; Söbke, H. Location-based augmented reality in education: A systematic literature review. Comput. Educ. Open 2025, 9, 100277. [Google Scholar] [CrossRef] [Scilit]
  52. Kohli, A.; Arora, S. An Unconventional Education Landscape For Unconventional ‘Generation Alpha’. Int. J. Multidiscip. Res. 2024, 6, 14. [Google Scholar] [CrossRef]
  53. Ferreira-Santos, J.; Pombo, L. The Art Nouveau Path: Promoting Sustainability Competences Through a Mobile Augmented Reality Game. Multimodal Technol. Interact. 2025, 9, 77. [Google Scholar] [CrossRef] [Scilit]
  54. Ferreira-Santos, J.; Pombo, L. The Art Nouveau Path: Integrating Cultural Heritage into a Mobile Augmented Reality Game to Promote Sustainability Competences Within a Digital Learning Ecosystem. Sustainability 2025, 17, 8150. [Google Scholar] [CrossRef] [Scilit]
  55. Ferreira-Santos, J.; Pombo, L. The Art Nouveau Path: Valuing Urban Heritage Through Mobile Augmented Reality and Sustainability Education. Heritage 2026, 9, 4. [Google Scholar] [CrossRef] [Scilit]
  56. Municipal Educational Action Program of Aveiro 2024–2025 (PAEMA). Available online: https://tinyurl.com/PAEMAveiro (accessed on 26 December 2025).
  57. Pauw, J.B.-D.; Jacobs, K.; van Petegem, P. Gender Differences in Environmental Values: An Issue of Measurement? Environ. Behav. 2014, 46, 373–397. [Google Scholar] [CrossRef] [Scilit]
  58. Forbus, K.D.; Lovett, A. Same/different in visual reasoning. Curr. Opin. Behav. Sci. 2021, 37, 63–68. [Google Scholar] [CrossRef] [Scilit]
  59. Marín-Marín, J.A.; Moreno-Guerrero, A.J.; López-Belmonte, J. Attitudes towards the development of good practices with augmented reality in secondary education teachers in Spain. Technol. Knowl. Learn. 2023, 28, 1443–1459. [Google Scholar] [CrossRef] [Scilit]
Figure 1. Learning analytics pipeline for the Art Nouveau Path.
Information 17 00087 g001
Figure 2. Example of a heritage-based quiz-type task narrative.
Information 17 00087 g002
Figure 3. Item difficulty and error patterns across POIs and media types.
Information 17 00087 g003
Figure 4. Collaborative gameplay profiles in the joint space of accuracy and AR-specific score (AR-mediated task performance).
Information 17 00087 g004
Figure 5. Standardized LA indicators by collaborative gameplay profile.
Information 17 00087 g005
Figure 6. Session duration (a) and pacing distributions by collaborative gameplay profile (b).
Information 17 00087 g006
Figure 7. Conceptual positioning of collaborative gameplay profiles along accuracy, AR engagement and pacing.
Information 17 00087 g007
Table 1. Overview of data sources.
Data Collection Tools/SourcesDescriptionParticipants/UnitsPurpose in this Study
Gameplay logs (S2-POST)Automated group-level logs recorded during the Art Nouveau Path sessions, including correctness, timestamps, AR-specific score and completion of 36 items.118 groups (439 students);
4248 group–item responses
Primary dataset for constructing learning analytics indicators (accuracy, pacing, AR-specific score, demanding items) and for cluster analysis.
S2-POST individual
open-ended reflections
Written reflections on collaboration, challenge and perceived learning.439 students (individual reflections), linked to 118 gameplay groups where feasible 1Used to interpret gameplay profiles and triangulate log-based indicators (illustrative, not used to form clusters).
Teachers’ observations
(T2-OBS)
Field notes recorded during gameplay in the urban environment.24 observationsContextual information supports interpretation of pacing, collaboration and difficulty.
GCQuest questionnaires
(phases S1-PRE, S2-POST, and S3-FU)
Pre, post and follow-up sustainability questionnaires (GreenComp-aligned).S1-PRE: 221;
S2-POST: 439;
S3-FU: 434
Contextualization; connects with previous publications. Not analyzed in this work.
Teachers’ validation
(T1-VAL, T1-R)
Validation questionnaires and interviews with teachers.T1-VAL: 30; T1-R: 3Positions the study within the wider DBR approach and pedagogical alignment.
1 Analyses draw on targeted subsets of these groups, for example, groups within each collaborative gameplay profile.
Table 2. Mapping of Quiz Items by POI and Media Type.
POIItem CodesAR Items (n)Video Items (n)Photograph/Image Items (n)Direct Observation Items (n)Total Items (n)
1P1.1, P1.2, P1.3, P1.4, P1.512025
2P2.1, P2.2, P2.3, P2.420204
3P3.1, P3.2, P3.3, P3.4, P3.500325
4P4.1, P4.2, P4.3, P4.4, P4.510225
5P5.1, P5.2, P5.3, P5.4, P5.5, P5.630126
6P6.1, P6.2, P6.3, P6.4, P6.5, P6.630126
7P7.1, P7.2, P7.310023
8P8.1, P8.200022
Table 3. Cluster model selection diagnostics for k = 2–6 computed on the z-standardized 118 × 5 indicator matrix (overall accuracy, demanding-item accuracy, AR-specific score, session duration, pacing). WSS denotes total within-cluster sum of squares; silhouette values denote average silhouette width.
kTotal WSS
(z-Standardized Indicators)
Average Silhouette Width
2339.7900.414
3251.2240.369
4194.6550.358
5156.0090.363
6136.7730.334
Table 4. Stability checks for the retained k-means solution (k = 3) under alternative random seeds (nstart = 50). ARI denotes Adjusted Rand Index comparing each run to the reference solution.
Seed Set/RunGroups Changing
Membership
ARI vs. Reference
Run 1 (seed = 123)01.000
Run 2 (seed = 456)01.000
Run 3 (seed = 789)01.000
Run 4 (seed = 999)01.000
Run 5 (seed = 2025)01.000
Table 5. Descriptive statistics for key learning analytics indicators (N = 118 groups; 4248 group-item responses).
IndicatorDescriptionUnit/ScaleMean (M)SDMinMaxMedian
Overall
accuracy
Proportion of correctly
answered items per group
%85.3313.5341.67100.0088.89
Accuracy on demanding itemsProportion correct on
six demanding items
%68.3629.020.00100.0083.33
Correct
responses
Correct group-item
responses
count3625----
Incorrect
responses
Incorrect group-item
responses
count623----
Total group-item responsesTotal responsescount4248----
Session
duration
Duration of
session
minutes42.386.2026.0055.0042.00
Pacing indexItems answered
per minute
items/min0.870.130.651.380.86
AR-specific scoreScore on 11
AR-mediated items
points (0–55)46.998.6015.0055.0050.00
Items
completed
Items out of 36count36.000.0036.0036.0036.00
Table 6. Most Demanding Items (Ordered by Accuracy).
Item CodePOIDescriptionResponses (N)CorrectIncorrectAccuracy (%)
P5.45Inferring advantages of reusing an
Art Nouveau building
118694958.47
P6.46Identifying plant species absent
from a dense facade
118803767.80
P2.12Comparing archival and contemporary photos to detect change118823669.49
P4.44Estimating the approximate area
of a decorative element
118823669.49
P1.51Recalling the year of a major flood118853372.03
P6.56Distinguishing photos with vs.
without Art Nouveau aesthetic
118863272.88
Table 7. Collaborative gameplay profiles based on learning analytics indicators (N = 118 groups).
IndicatorFast but
Fragile (n = 34)
Slow but
Moderate (n = 29)
Thorough and Successful (n = 55)
Share of groups (%)28.8124.5846.61
Overall accuracy (%)70.8384.2094.90
Accuracy on
demanding items (%)
37.2562.0790.91
AR-specific score (0–55)39.4145.6952.36
Session duration (minutes)36.5350.3141.82
Pacing (items/min)1.000.720.87
Table 8. Summary of collaborative gameplay profiles, quantitative and qualitative characteristics and design implications.
ProfileQuantitative
Pattern
Qualitative
Pattern
Qualitative
Tendencies
Scaffolding
Strategies
Fast
but fragile
Overall accuracy = 70.83%; demanding = 37.25%; AR = 39.41; duration = 36.53 min; pacing = 1.00Low overall accuracy; very low demanding-items accuracy; moderate AR-specific score; short-to-moderate session duration; fastest pacing.Time pressure; coordination difficulties; confusion where to lookPre-brief; role allocation; planned pauses at demanding POIs
Slow
but moderate
Overall accuracy = 84.20%; demanding = 62.07%; AR = 45.69; duration = 50.31 min; pacing = 0.72Moderate-to-high overall accuracy; moderate demanding-items accuracy; mid-to-high AR-specific score; longest session duration; slowest pacing.Extended discussion; occasional indecision; distractionTime management prompts; progress indicators; teacher cues
Thorough
and successful
Overall accuracy = 94.90%; demanding = 90.91%; AR = 52.36; duration = 41.82 min; pacing = 0.87Very high overall accuracy; very high demanding-items accuracy; near-ceiling AR-specific score; intermediate session duration; moderate pacing.Joint exploration; negotiated answers; AR as shared lensExtension tasks; open questions; peer explanation opportunities
Disclaimer/Publisher’s Note: The statements, opinions and data contained in all publications are solely those of the individual author(s) and contributor(s) and not of MDPI and/or the editor(s). MDPI and/or the editor(s) disclaim responsibility for any injury to people or property resulting from any ideas, methods, instructions or products referred to in the content.