Article

Benchmarking Virtual Physics Labs: A Multi-Method MCDA Evaluation of Curriculum Compliance and Pedagogical Efficacy

by
Rama M. Bazangika
1,
Ruffin-Benoît M. Ngoie
2,
Jean-Roger M. Bansimba
3,
God’El K. Kinyoka
1,4 and
Billy Nzau Matondo
5,*
1
Department of Physics, Institut Supérieur Pédagogique de Mbanza-Ngungu, Mbanza-Ngungu B.P. 127, Democratic Republic of the Congo
2
Department of Mathematics, Institut Supérieur Pédagogique de Mbanza-Ngungu, Mbanza-Ngungu B.P. 127, Democratic Republic of the Congo
3
Department of Biology, Institut Supérieur Pédagogique de Mbanza-Ngungu, Mbanza-Ngungu B.P. 127, Democratic Republic of the Congo
4
Department of Physics and Applied Sciences, Université Pédagogique Nationale, Kinshasa B.P. 8810, Democratic Republic of the Congo
5
Management of Aquatic Resources and Aquaculture Unit (UGERAA), Freshwater and Oceanic Science Unit of Research (FOCUS), Department of Biology, Ecology and Evolution, University of Liège, 22 Quai E. Van Beneden, B-4020 Liège, Belgium
*
Author to whom correspondence should be addressed.
Information 2025, 16(7), 587; https://doi.org/10.3390/info16070587
Submission received: 22 May 2025 / Revised: 2 July 2025 / Accepted: 3 July 2025 / Published: 8 July 2025
(This article belongs to the Special Issue New Applications in Multiple Criteria Decision Analysis, 3rd Edition)

Abstract

In this paper, we propose the use of virtual labs (VLs) as a solution to bridge the gap between theory and practice in physics education. Through an experiment conducted in two towns in the Democratic Republic of the Congo (DRC), we demonstrate that our proposed lab (BRVL) is more effective than global alternatives in correcting misconceptions and ensuring compliance with the current curriculum in the DRC. We combine Conjoint Analysis (from SPSS) to weigh selected criteria—curriculum compliance, knowledge construction, misconception correction, and usability—alongside eight MCDA methods: AHP, CAHP, TOPSIS, ELECTRE I, ELECTRE II, ELECTRE TRI, PROMETHEE I, and PROMETHEE II. Our findings show that, among six VLs, BRVL consistently outperforms global alternatives like Algodoo and Physion in terms of pedagogical alignment, curriculum compliance, and correction of misconceptions for Congolese schools. Methodologically, the respondents are consistent and in agreement, despite individual differences. The sensitivity analysis of the ELECTRE and PROMETHEE methods has shown that changes in parameter values do not alter the conclusion that BRVL is the best among the compared VLs.

1. Introduction

Using technology in education, especially through virtual labs (VLs), transforms students from passive listeners into active investigators and enhances conceptual mastery [1,2,3]. The teaching of physics in the Democratic Republic of the Congo (DRC) plays a central role in students’ scientific education. In the towns of Inkisi and Kimpese, schools face significant challenges, such as a lack of hands-on laboratories, a shortage of well-trained educators, frequent power outages, and poor internet connectivity.
This situation has forced physics teachers to favor a strictly theoretical approach, thereby limiting students’ experience to a bookish and abstract assimilation of fundamental concepts. The repercussions of this educational shortfall are numerous, including a series of common conceptual and terminological confusions in mechanics, such as the distinction between path and trajectory, speed and acceleration, or weight and mass [4,5,6]. These difficulties are further exacerbated by misconceptions, which are considered cognitive obstacles, making the acquisition of key concepts even more challenging [7].
Moreover, as some studies confirm, there is a significant gap between students’ performance in physics in sub-Saharan African countries compared to developed nations. This gap is attributed, among other factors, to the lack of material resources, the pedagogical shortcomings of teachers, the prioritization of theory over practice, and insufficient mastery of technology [8].
VLs are often considered a reliable solution to the shortage of physics laboratories in schools across sub-Saharan Africa. They help overcome economic challenges related to acquiring equipment for the construction of physical hands-on labs [8,9]. However, most of them are global, meaning they are designed for practical physics education in a general context. As a result, they overlook the specific needs of physics education in the DRC and do not always align with the current curriculum.
In this article, we propose a VL that addresses both the economic challenges faced by developing countries and the curricular requirements of the DRC: Bazin-R VirtLab (BRVL). Such an approach has already been proposed by several researchers in various parts of the world [1,10,11,12,13].
However, most of publications on VLs focus solely on the purely technical aspects or the pedagogical and didactic implications of VLs. The evaluations they present of VLs overlook the robust comparative methodologies offered by multi-criteria aggregation functions.
In our study, we not only propose a custom-designed VL tailored for physics education in the DRC, but, more importantly, we evaluate it alongside other VLs using multi-criteria analysis methods, based on pedagogical criteria established by professionals.
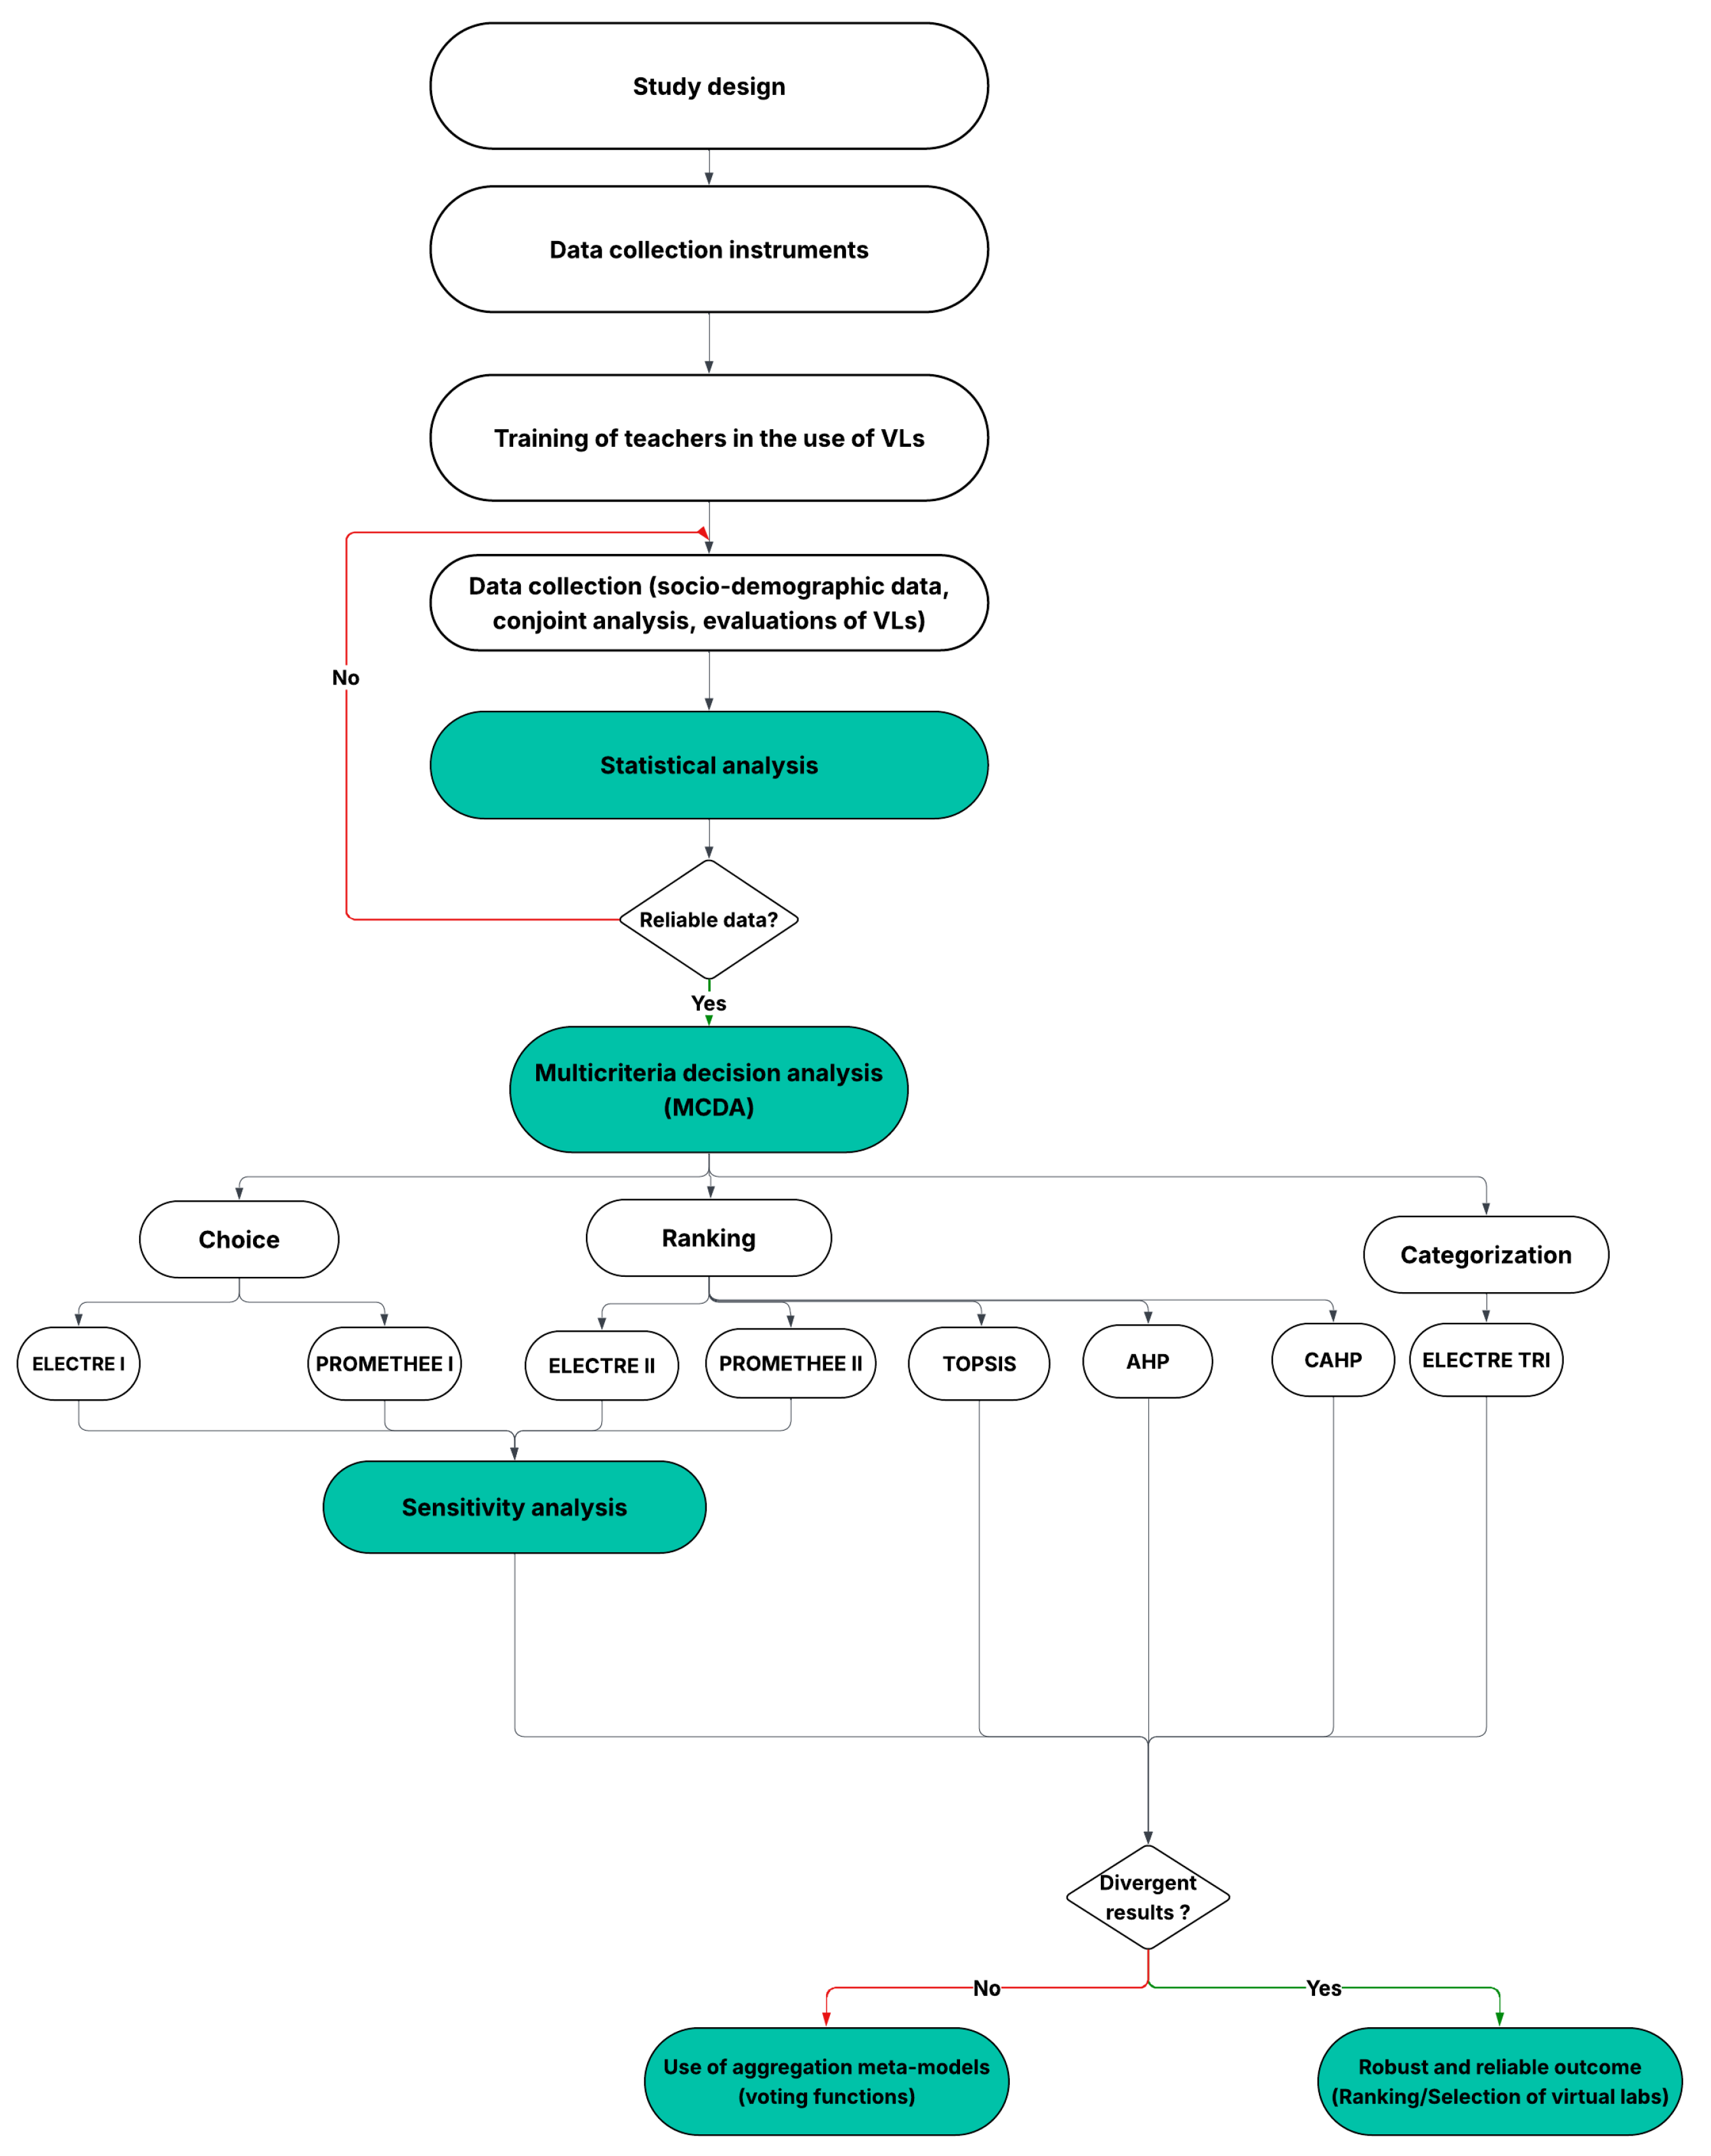
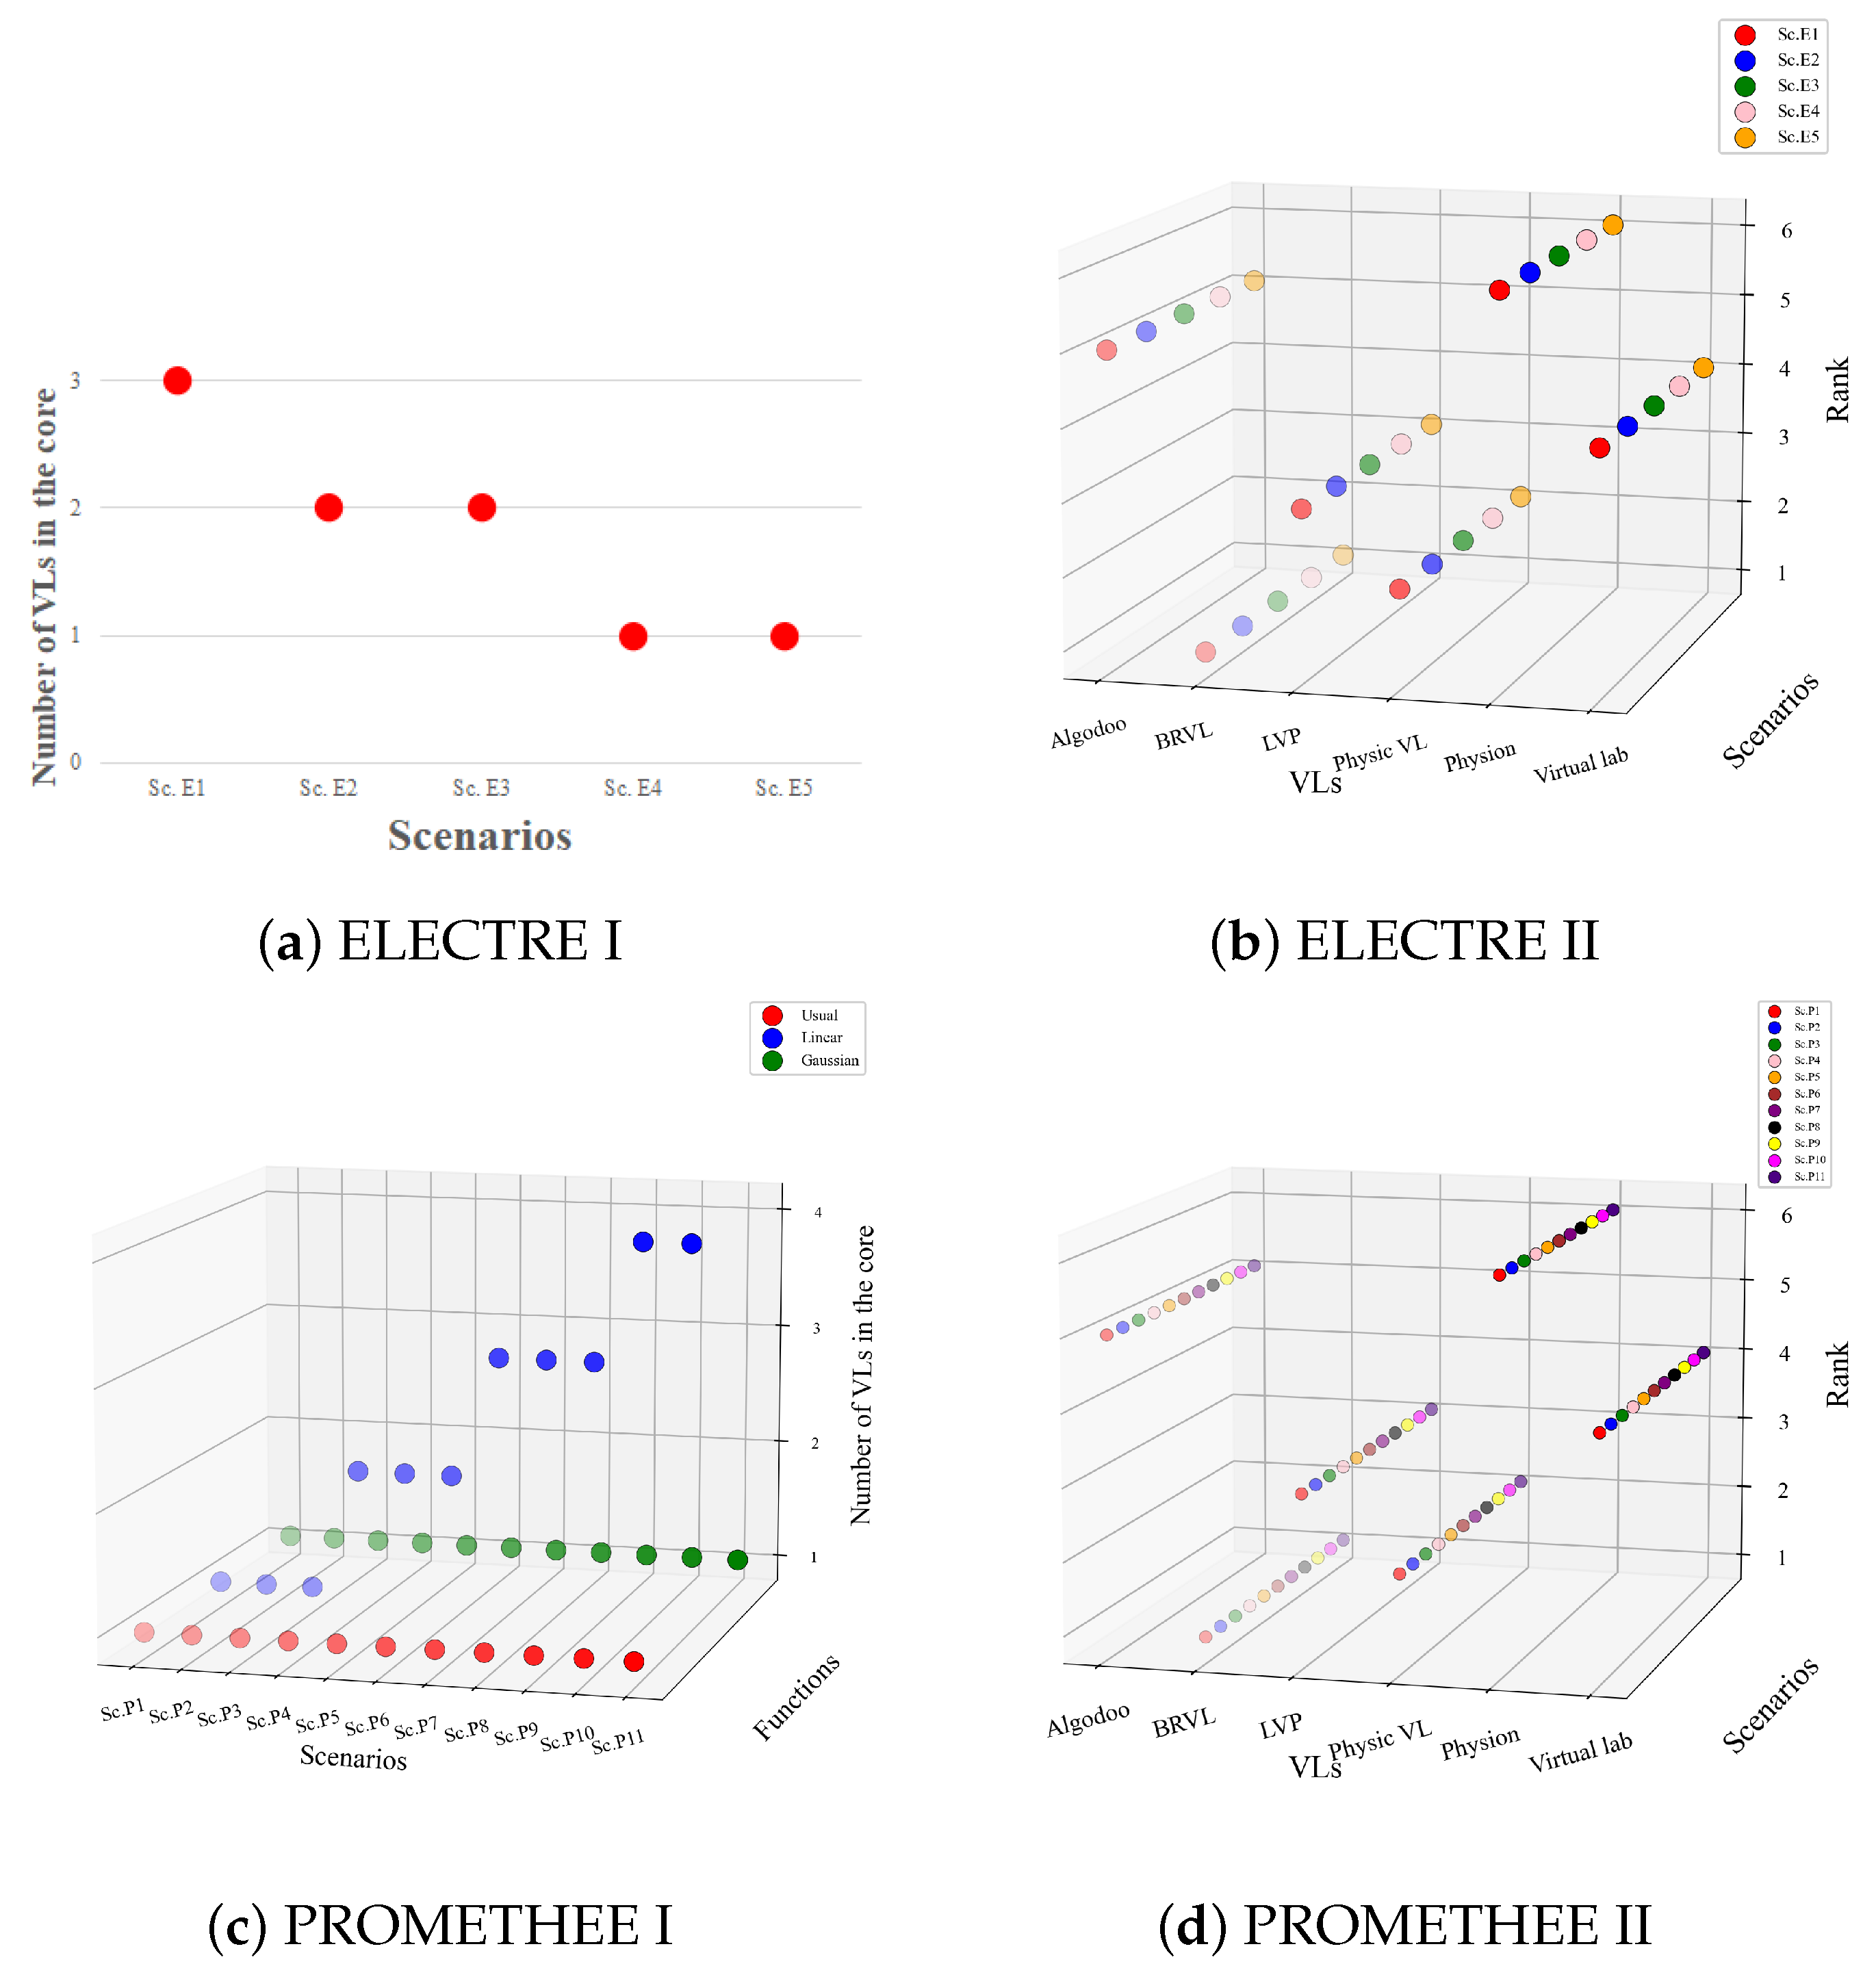
To validate BRVL, we used the ELECTRE I, ELECTRE II, ELECTRE TRI, PROMETHEE I, PROMETHEE II, TOPSIS, CAHP, and AHP methods. These approaches were independently applied to compare BRVL with several global, free, and offline VLs. Prior to this, the weights of the selected criteria were determined using Conjoint Analysis (CA). The TOPSIS, AHP, CAHP, ELECTRE II, and PROMETHEE II methods allow for ranking alternatives (VLs) from best to worst. Although ELECTRE I and PROMETHEE I are designed for a different type of decision problem (choice), they help identify a set of non-dominated alternatives called the “core.” ELECTRE TRI is dedicated to categorizing alternatives into different levels (“High”, “Medium”, and “Low”). The advantage of ELECTRE methods is that they reveal non-compensatory dynamics. Indeed, with ELECTRE, a low performance on a single criterion could eliminate an alternative despite its excellent performance on other criteria.
The main objectives pursued in our study are:
  • Performing a statistical analysis of the collected data to assess its reliability and consistency.
  • Comparing and ranking competing VLs using multicriteria decision-making methods.
  • Assessing the robustness and reliability of VL rankings against parameter shifts using sensitivity analysis.
  • Examining the consistency of outcomes across MCDA methods and proposing aggregation strategies for divergent results.
Our study focuses exclusively on documented hypotheses—even implicit ones—provided they are testable and stakeholder-relevant. The hypotheses framing our decision-making are:
  • H1: Using multiple MCDA methods makes VL assessments more robust and reduces methodological bias [14,15,16].
  • H2: Statistically validated input data improves the reliability and consistency of VL rankings across decision models [17].
  • H3: VL alternative rankings can differ significantly based on the MCDA method used, showing how sensitive the results are to methodology [18].
  • H4: Sensitivity analysis should confirm whether the preferred VL solution stays stable across different parameter settings [19].
  • H5: When rankings disagree, combining them using meta-decision models (e.g., voting rules) can help reach consensus [20,21,22].
The remainder of this paper is organized as follows: Section 2 presents the literature review. In Section 3, we outline our research methodology. Section 4 summarizes the key findings of our work (Results). The results are discussed in Section 5, followed by the conclusion of our study in Section 6.

2. Literature Review

2.1. Virtual Labs in Science, Technology, Engineering, and Mathematics Education

Virtual labs (VLs) are digital environments where students engage in hands-on activities and experiments simulations to explore scientific concepts [23]. They provide a safe and cost-effective alternative to physical laboratories, particularly in contexts where limited resources or safety concerns hinder implementation [2]. Science, Technology, Engineering, and Mathematics (STEM) education has experienced rapid growth thanks to recent advancements in VLs. Indeed, more and more, educators and learners see VLs as an essential tool for interactive and evolving experimentation. Table 1 highlights several recent studies on the pedagogical impact of VLs in STEM education. While most of these studies emphasize advantages such as cost-effectiveness, time savings, and user-friendliness [10], gaps remain in assessing curriculum alignment, particularly in sub-Saharan Africa. This table underscores the need for tools that prioritize educational outcomes specific to a given region.
Table 1. Summary of selected studies related to VLs in STEM education.
ReferencesDescriptionFieldCountry
[24]Proposes an online virtual lab to impart lab skills to students through a 3D environment.STEMGreece
[12]Highlights that the integration of technologies is essential to modernize STEM education.STEMSouth Africa
[13]Demonstrates that virtual labs, such as those in Project NEWTON, enhance hands-on STEM education.STEMIreland
[25]Proposes the VESLL virtual laboratory as a solution to overcome learning barriers, such as limited access to resources and the underrepresentation of women in STEM.EngineeringUSA
[26]Examines the role of artificial intelligence in STEM education and its potential to improve the learning of struggling students.STEMUnspecified
[27]Shows that VLs allow students to better assimilate mechanics concepts and more effectively apply their knowledge to real-life situations than physical labs.PhysicsUnspecified
[28]Develops a remote renewable energy laboratory for secondary schools.PhysicsUnspecified
[29]Presents an online learning solution to address the shortage of teachers and the lack of hands-on science laboratories.STEMIndia
[30]Presents a cost-effective virtual laboratory as an alternative to physical laboratories.STEMMorocco
[31]Analyzes the impact VLs in higher education and highlights their essential role in distance learning.STEMAustralia

2.2. An Overview of Competing Virtual Labs

2.2.1. Presentation of Bazin-R VirtLab

“Bazin-R VirtLab” (BRVL) is an educational tool designed to digitize hands-on activities traditionally conducted in physical laboratories through 3D simulations on a computer. It is developed in alignment with the current school curriculum of the Democratic Republic of the Congo.
BRVL consists of several modules, including essential knowledge to master (courses), identification and correction of misconceptions, simulations, quizzes distributed across all six taxonomic levels of Bloom’s scale [32], and answer keys for the quizzes. Figure 1 illustrates some of BRVL’s interfaces. These interfaces—Home page (Figure 1a), menu page of essential knowledge (Figure 1b), misconceptions identification page (Figure 1c), and example of a simulation (Figure 1d)—are designed to be user-friendly, and their ease of use is so remarkable that almost no prior training is required before using BRVL.

2.2.2. Considered Alternatives: Competing Virtual Labs

The towns of Kimpese and Kisantu face several challenges that hinder the integration of ICTs in education. The most significant difficulties include frequent power outages, poor internet connectivity, the high cost of internet subscriptions, unemployment, and widespread poverty.
Given these factors, we have selected only VLs that are free and capable of functioning offline. BRVL, of course, has also been designed with these challenges in mind.
In total, five VLs have been selected and compared to BRVL based on criteria that will be defined later in this paper. Table 2 provides a technical description of the six competing VLs.

2.3. Multi-Criteria Decision Aiding in Educational Technology

Multi-Criteria Decision Aiding (MCDA) methods provide a systematic approach to objectively evaluating educational technologies. Table 3 lists several recent studies that apply multi-criteria aggregation methods to assess learning tools. As the reader may notice, none of these studies incorporate conjoint analysis for determining criterion weights. Furthermore, the criteria considered in these studies are often technical rather than pedagogical. By introducing BRVL, we hope to bridge this gap.
Table 3. Summary of selected studies applying MCDA methods in educational technology.
ReferencesDescriptionApplicationUsed Methods
[33]Proposes an assessment of blockchain innovation in free basic education to improve governance and optimize strategic decisions.EducationCognitive Analytics Management (CAM)
[34]Explores the application of MCDA in mathematics education to optimize pedagogical decision-making.Mathematics educationF-DEMATEL
[14]Proposes a hybrid MCDM approach to evaluate and rank online learning platforms.E-learningBWM, SAW, Delphi, and AHP
[35]Evaluates the use of additive manufacturing to create healthcare educational materials.Health sciences educationAHP
[36]Explores several MCDA methods to assess the quality of learning scenarios.EducationAHP, Fuzzy logic-based methods
[37]Analyzes decision-making strategies in education and explores emerging innovations to improve educational decision-making.EducationUnspecified

2.4. Conjoint Analysis

Conjoint Analysis (CA) is a technique that employs a decomposition approach to evaluate the value of different attribute levels based on respondents’ assessments of hypothetical profiles called “plan cards” [38]. CA was introduced by Green and Srinivasan [39] in the early 1970s. The first mention of CA appeared a few years later [40], before being updated and expanded in the early 1990s. Since its proposal, CA has gained significant popularity among researchers and industry professionals as a key methodology for assessing buyer preferences and trade-offs between products and services with multiple attributes [41].
The CA involves three steps:
1.
Preference measurement: Preferences are assessed through ranking or rating tasks. The relative importance I k of attribute k is given by Equation (1):
I k = max j u k j min j u k j i max j u i j min j u i j
where u k j is the utility of the level j of the attribute k.
2.
Utility estimation: Utilities values u k j are estimated using models such as MONANOVA, OLS, LINMAP, PROBIT, or LOGIT as shown in Equation (2), in the case of linear models:
u k j = β k j · x k j
where β k j represents the parameter estimate for level j of attribute k.
3.
Experiential design: Fractional factorial designs, such as Latin squares, reduce the number of profiles required for analysis. For three attributes A, B, and C, each with three levels, a Latin square reduces the total profiles from 27 to 9.

3. Methodology

3.1. Study Design

Selected Criteria

A criterion is a partial evaluation function that assigns a value to alternatives and allows their comparison according to a specific dimension. Without criteria, evaluations would be purely subjective. Criteria ensure comparability and guarantee the reliability of the decisions made.
Table 4 presents the most commonly used criteria for evaluating educational tools (such as digital, ICT, and mechanical tools) and supports their selection with the latest references.
The criteria were selected based on their relevance and frequency in scientific publications addressing the evaluation of educational tools. There are many such criteria, but to avoid overlap, we only retained those that provide the most comprehensive explanation of our problem.
Table 4. Selected criteria for VL assessment.
CriterionDescriptionReferences
Curriculum complianceAlignment between the content of the VL and the official curriculum (objectives, skills to develop, methodological approaches, essential knowledge, etc.). This criterion evaluates whether the simulations cover the concepts required for the target level (e.g., teaching physics in the 4th year of scientific humanities in the DRC) and adhere to the pedagogical progression set by educational authorities.[42,43,44,45,46]
Knowledge buildingThe ability of a VL to foster active, constructive, and even autonomous learning, in which the learner formulates hypotheses, conducts experiments, and draws conclusions.[47,48,49,50]
Misconceptions correctionEffectiveness of the VL in identifying and correcting students’ misconceptions (e.g., 1 kg of stone is heavier than 1 kg of paper). This criterion also evaluates the remediation strategies provided by the VL.[51,52,53,54,55]
UsabilityThis criterion refers to the technical accessibility and ergonomics of the VL (user-friendly interface, reduced learning time, compatibility with existing equipment). It includes the clarity of instructions and the autonomy of use by teachers/students.[56,57,58,59,60,61,62,63,64]

3.2. Preparation Phase

The preparatory phase of our experiment involved designing and validating the survey tool, as well as training the participating physics teachers in the use of the competing VLs.

3.2.1. Design and Validation of the Survey Tool

The data collection instrument employed in this study was a structured questionnaire divided into four distinct sections (see Appendix A). The first section provided an introductory note to participants, outlining the purpose of the study and affirming the confidentiality of any information they would disclose (see Appendix A.1).
The second section gathered respondents’ socio-demographic data, including gender, age, and professional experience in teaching physics. This information was used to contextualize evaluation patterns and ensure a representative participant base (see Appendix A.2).
In the third section, respondents were asked to assess fictional VLs generated through IBM SPSS Statistics 23 (ORTHOPLAN). Each alternative was rated on a 0–10 scale (see Appendix A.3).
The final section focused on the evaluation of actual VLs. Using the same 0–10 scale, participants rated each laboratory based on predefined criteria such as curriculum compliance, usability, or misconceptions corrections (see Appendix A.4).

3.2.2. Training of Teachers in the Use of Virtual Laboratories

We engaged an independent ICT specialist with STEM teaching experience to train the participating teachers. However, for the BRVL, we were occasionally invited to contribute to the training sessions. The total duration of training across all VLs was 23 days, comprising 3 days per lab plus 5 days for remedial sessions. A formative assessment was conducted to verify the respondents’ proficiency in using each VL, thereby ensuring their technical mastery prior to the evaluation phase. All assessments were administered in a neutral setting to preserve objectivity in judgment.

3.3. Data Collection

We conducted a full-population survey of secondary school teachers in the towns of Inkisi ( 5 07 60 S/ 15 04 00 E) and Kimpese ( 5 33 00 S/ 14 25 60 E), in the DRC. The study population comprised 22 teachers in total (10 in Inkisi and 12 in Kimpese), with each school employing a single physics teacher responsible for the 4th grade science classrooms.

3.3.1. Socio-Demographic Data

Table 5 presents the socio-demographic information of the respondents. Categories with zero frequency have been excluded. For example, since all surveyed physics teachers were male, the category “Female” does not appear in the table. Relative frequencies (in %) are provided in parentheses next to the absolute counts.

3.3.2. Requested Data for Conjoint Analysis

Conjoint analysis is commonly used to determine how much each attribute contributes to respondents’ decisions—that is, the share of utility attributed to each attribute from the respondents’ point of view. This method relies on participants’ evaluations of cards representing combinations of options based on the levels of their attributes. These preferences can be either ordinal or cardinal. In the former case, respondents rank the cards from best to worst; in the latter, they assign scores to each card using a numerical rating scale.
Evaluations can become challenging when many attributes are involved, each with multiple levels. For instance, with just four attributes each having three levels, the total number of cards would be 81. In such cases, expecting evaluators to maintain complete consistency in their rankings or ratings would be unrealistic. The PLANCARD procedure in SPSS helps generate a manageable number of cards while preserving the reliability of the conjoint analysis. By using CA, we ensure that the weights of the criteria (attributes) considered in multi-criteria decision support are obtained with methodological rigor. This approach is also widely adopted in various multi-criteria analysis studies [65,66,67].
The respondents were asked to rate the fictional VLs generated using the ORTHOPLAN method in SPSS on a scale from 0 to 10. Only nine cards were generated, whereas an exhaustive set would have contained 54. The nine generated VLs are listed in Table 6. Applying conjoint analysis (CA) to these data enables the determination of the respondents’ utility shares for the criteria based on their modalities. These utility shares will subsequently be considered as weights for these criteria.
The rationale for using a 0–10 grading scale is that it is the most commonly used scale for evaluation in many Francophone and African educational systems. Choosing such a scale reduces cognitive load and improves response reliability among surveyed individuals. In addition, a 0–10 scale provides sufficient sensitivity to detect subtle distinctions without overwhelming raters, as a 0–100 scale might.

3.3.3. Assessment of Virtual Labs

After evaluating the fictional VLs, the respondents were invited to assess the real VLs that were to be compared. They were asked to rate each VL on a scale from 0 to 10 for each criterion. Prior training on the use of each of the six competing VLs was required before this exercise.
We then aggregated the data by calculating the arithmetic mean of the scores for each VL per criterion. For example, the average score of the VL Algodoo for “Usability” is the arithmetic mean of all the ratings assigned to it by the 22 respondents.
The decision table consists of criteria, weights for selected criteria, alternatives (VLs), and the performance of these alternatives on the chosen criteria. The four selected criteria were chosen due to their high frequency in publications evaluating educational tools. The VLs considered do not represent the entire universe of VLs; their selection was based on the socio-economic conditions of the investigated areas.
It was essential to prioritize VLs that do not require highly powerful computers (which would, of course, be expensive), that function without an Internet connection (offline), and that are primarily designed for teaching physics in secondary school.

3.4. Exploratory Statistical Analysis

3.4.1. Consistency Analysis of Survey Data

To validate the internal coherence and reliability of the data collected through the evaluation instrument, a series of complementary statistical procedures was conducted prior to the implementation of MCDA techniques. These procedures aimed not to test theoretical hypotheses but to ensure that the data structure was statistically sound, allowing meaningful preferential modeling.
A Pearson χ 2 test was first employed to examine potential associations between categorical socio-demographic variables (e.g., gender, age, education level) and declared VL preferences. In all cases where this test indicated a statistically significant dependency, a linear regression analysis was subsequently conducted to determine whether the identified groups could statistically explain variations in performance scores across the four evaluation dimensions. This step allowed the validation of a potential predictive relationship between socio-demographic factors and the evaluation patterns, even in the absence of normal distribution for most variables. The choice of linear regression was justified by its ability to model the influence of categorical predictors—transformed where appropriate—on continuous rating outcomes, while keeping the analysis interpretable and aligned with the survey’s real-world structure.
To assess the consistency of individual judgments across respondents who jointly evaluated the six VLs on four criteria, the Intraclass Correlation Coefficient (ICC) was calculated. This reliability index offered evidence on the degree of inter-rater agreement and justified the aggregation of individual ratings into a collective evaluation matrix.
To determine whether the six VLs received significantly different evaluations from the same group of respondents, the Friedman test was applied. This test was selected because the rating data, although measured on a 0–10 interval scale, did not meet the assumptions of normality required for parametric repeated-measures approaches. As a rank-based non-parametric method, the Friedman test offered a robust way to detect statistically significant differences among VL alternatives in a within-subjects design, without relying on assumptions of normal distribution or variance homogeneity.
Together, these statistical validations helped establish a robust and consistent data foundation that meets the methodological preconditions for subsequent multicriteria modeling.

3.4.2. Global Reliability Validation

In the event that statistical analyses confirm the internal consistency and reliability of respondents’ evaluations, the dataset is deemed suitable for subsequent multicriteria modeling. However, if the tests reveal incoherence or instability in expressed preferences, a targeted pedagogical feedback loop is initiated. This involves returning to the respondents to clarify expectations and re-administer the survey where needed. The process is repeated iteratively until the collected data meet the statistical and conceptual conditions required for valid multicriteria analysis.

3.5. Multicriteria Decision Analysis

3.5.1. Used Multi-Criteria Decision Aiding Methods

This subsection is dedicated to describing the MCDA methods used either for selecting or ranking competing VLs, depending on their intended application. The choice of methods is based on their acceptance in the academic, research, and industrial sectors. Table 7 presents all the MCDA methods used in our article to compare the VLs, based on the judges’ evaluations conducted using the selected criteria.
A significant number of other MCDA methods exist, some resulting from hybridizations of existing approaches or from their adaptation and extension to incorporate new aspects. Particularly for multi-criteria problems involving multiple decision-makers, there is a growing trend to adapt voting functions from social choice theory for use in multi-criteria analysis [68,69].
Table 7. Selected Multi-Criteria Decision Aiding Methods.
MethodDescriptionPurposeReferences
AHPCompares criteria and alternatives pairwise via a ratio matrix, with consistency check of judgments. Enables complete prioritization.Ranking[70]
CAHPUses the Conjoint Analysis to weigh criteria and the traditional AHP for the subsequent steps (levels of alternatives).Ranking[65,66]
TOPSISRanks alternatives by proximity to ideal solution and distance from anti-ideal solution.Ranking[71]
ELECTRE IIdentifies a core of non-dominated alternatives using concordance/discordance thresholds.Choice[72,73]
ELECTRE IIGenerates a complete ranking (strong/weak pre-order) with veto thresholds.Ranking[73,74]
ELECTRE TRIAssigns alternatives to predefined categories (e.g., High/Medium/Low).Sorting[73,75]
PROMETHEE IGenerates a partial ranking based on outranking flows (incomparabilities possible).Partial ranking[76,77]
PROMETHEE IIGenerates a complete net ranking via net flows, resolving incomparabilities.Complete ranking[78]

3.5.2. Implementation of Multi-Criteria Decision Aiding Methods

The next step is to apply the MCDA methods to the obtained decision table. It should be noted that some methods, such as those in the ELECTRE and PROMETHEE families, require parameter tuning before use. Table 8 specifies the values assigned to the required parameters for each method.
ELECTRE analyses were conducted by considering concordance and discordance thresholds of 0.70 and 0.30, respectively. Additionally, for ELECTRE II, we applied a veto threshold v = 4 , meaning that an alternative is automatically rejected if its performance on at least one criterion is less than or equal to 10 4 = 6 (on a scale of 0–10), even if it excels in other criteria.
For the PROMETHEE methods, we set q = 0.5 and p = 1.5 , implying that a difference of 0.5 or less between two alternatives on a criterion is considered negligible, while a difference of 1.5 or more leads to a clear preference for the superior alternative.
For the AHP, we use Equation (3) to compare alternatives a i and a k according to criterion c j , when c j is to be maximized:
f a i , a k = R d x i j x k j m d + 1 i f x i j > x k j                 1 R d x i j x k j m d + 1 e l s e
where:
  • x i j is the performance of alternative a i on criterion c j .
  • R d ( x ) denotes the nearest integer to the real x. We admit that R d ( 4.5 ) = R d ( 4.9 ) = 5 but R d ( 1.1 ) = R d ( 1.4 ) = 1 .
  • m d = max ( j ) min ( j ) n is the mean deviation, max ( j ) and min ( j ) denote respectively maximal and the minimal values of x i j and n the number of objects.
The reader can easily verify that all AHP pairwise comparison matrices derived using this formula are consistent.

3.6. Sensitivity Analysis

The parameter values chosen in MCDA methods can heavily influence the final decision [19]. That is why we deemed it necessary to verify whether the results obtained with the selected parameter values in Table 8 were stable and not excessively dependent on parameter variation. If they were, a change in parameter settings would lead to different results from those previously obtained, making them questionable. This would indicate that the outcomes are not robust or are merely a product of arbitrary parameter choices.
Although the parameter settings are within standard norms (See Table 9), we conducted a sensitivity analysis by modifying them. Each modified parameter creates a distinct scenario. Thus, for ELECTRE, we considered five scenarios for each veto value, with veto values ranging from 4 to 8, whereas for PROMETHEE, we explored 11 scenarios.
Table 9. Standards and references for MCDA methods.
MethodParameterRoleTypical ValueGuidelinesReferences
ELECTREcMinimal agreement to dominate0.60–0.80Higher = stricter dominance (e.g., 0.70 for robust choices)[72,79]
dMaximal opposition allowed0.20–0.40Lower = more veto power (e.g., 0.30 balances rigor/flexibility)[72,80]
vAbsolute rejection threshold4–820–30% of max scale (e.g., v = 6 rejects ≤ 4). Only applicable to versions subsequent to ELECTRE I.[79,81]
   PROMETHEEqMinimal negligible difference1–10% of scaleDifferences q are ignored[76,82]
pMinimal strong preference10–20% of scaleDifferences p trigger full preference[83]
FunctionShapes preference intensityGaussian-Linear-UsualGaussian for smooth transitions ( s = p 2 )[76]
In Table 10, we provide comprehensive information on the different scenarios of the ELECTRE and PROMETHEE methods. The assigned parameter values are those recommended in the literature (see Table 9). By proceeding in this manner, we aim to assure the reader that the results obtained are not due to a strategic selection of parameter values designed to produce a favorable outcome for us.
Given that, for the ELECTRE methods, the recommended values of c and d fall within the intervals [0.60, 0.80] and [0.20, 0.40], respectively, we generated five scenarios using a step size of 0.05. The concordance index increases from 0.60 to 0.80 in increments of 0.05, while the discordance index decreases from 0.40 to 0.20 by the same step size. With the different veto thresholds (from 4 to 8 in increments of 1), we have a total of 25 scenarios for ELECTRE II (5 scenarios for each of 5 veto values).
For the PROMETHEE methods, we obtained 11 scenarios by varying q from 0.1 to 1 and p from 1 to 2, both in increments of 0.1. In practice, PROMETHEE comprises 33 scenarios, as each of the 11 was successively evaluated using the usual, linear, and Gaussian preference functions.

3.7. Results Consolidation

In cases where the rankings produced by the various MCDA methods diverge, a consolidation stage is introduced to resolve potential inconsistencies. To that end, meta-methods (also known as meta-ranking mechanisms) inspired by social choice theory are recommended to aggregate and arbitrate between the conflicting outputs [20]. When the methods produce outranking-based results, aggregation functions such as Borda count [84] or Copeland’s rule [85] may be employed. In contrast, when the outputs are based on scoring models, techniques such as Majority Judgment [86] or the Mean–Median Compromise Method [87,88] provide robust alternatives to reach a unified ranking. Conversely, if the results from different MCDA methods remain consistent, the outcome may be considered both robust and reliable, with no need for further reconciliation.

3.8. Summary of the Methodological Workflow

To provide the reader with a clear overview of our methodology, we included a visual representation that summarizes its main stages. Figure 2 traces the progression from the study design to the final results, passing through statistical validation and the application of multicriteria decision-making tools. By depicting the entire process, it helps clarify both the logic and structure of the approach adopted in our study. With this overview, the reader can better understand the methodological components and the rationale behind the selection of tools throughout the research process.

4. Results and Analysis

4.1. Data Reliability

Table 11 provides results on the reliability of the data collected from respondents. The single measures ICC (0.133, p < 0.001 ) indicate that judges have significant discrepancies in their assessments and that there is not a high level of individual reliability. The average measures ICC (0.787, p < 0.001 ), on the other hand, suggest good agreement. This means that, collectively, the judges are consistent even though there are individual variations.
The Friedman test result “Between elements” ( χ 2 = 197.939 ) indicates that judges do not give the same evaluations to the VLs, which is expected in a comparative analysis like ours. The differences observed between the evaluated VLs are statistically significant ( p < 0.001 ). The residual value χ 2 = 11.792 ( p = 0.001 ) suggests that there is significant non-additivity. This implies that the criteria or judges’ evaluations are not simply cumulative in a linear manner.
A series of simple linear regressions was performed to evaluate how the education level, the field of study and the physics teaching background in 4th grade science influence the rating of six VLs (see Table 12). The results show that the education level is a good sign of the rating given to two labs: performance of Algodoo on usability (Algo_Us) ( β = 0.703 ; p < 0.001 ; R 2 = 0.494 ) and performance of BRVL on curriculum compliance (BRVL_Curr) ( β = 0.490 ; p = 0.021 ; R 2 = 0.490 ). The strong negative effect for Algo_Us indicates that higher-educated teachers rated this resource more critically. A similar, though weaker, trend was observed for BRVL_Curr. Physics teaching background in 4th grade science significantly influences the rating of performance of Physic Virtual lab on usability (Phys_Us) ( β = 0.505 ; p = 0.016 ; R 2 = 0.255 ), with more experienced teachers giving it a lower rating.
In contrast, the field of study had no significant effect on the ratings of the labs tested ( p > 0.05 in all cases).
These results highlight that certain aspects of teachers’ professional profiles—particularly their level of education and seniority—may influence their judgments about the usefulness of virtual teaching environments, likely related to their exposure to pedagogical innovations or their professional maturity.
Since the evaluations provided by respondents showed both internal consistency and statistical reliability, the dataset may be used for multicriteria analysis with a high degree of confidence. The individual profiles of the evaluators had little influence on the patterns of judgment, and no artificial convergence was observed between their responses (See Table 11: ICC = 0.787; F(21, 483) = 4.694; p < 0.001). This suggests that the expressed preferences were formed independently, without any detectable social influence affecting the overall structure of the evaluations.

4.2. Multicriteria Analysis Results

4.2.1. Averaged Ratings

The grades assigned by the judges (physics teachers from schools in Kimpese and Inkisi) to the VLs, based on the selected criteria, are aggregated using the arithmetic mean (see Table 13). For example, the aggregated rating of 7.4091 obtained by the VL Physion for the criterion ’Knowledge building’ is the arithmetic mean of the ratings assigned by the judges to this VL for the given criterion.

4.2.2. Criteria Weights

Table 14 shows that misconceptions correction and curriculum compliance are the most important criteria, with respective weights of 28.795% and 26.080%. Usability (20.696%) is the least important criterion, according to respondents. Additionally, respondents made two inversions in “Knowledge building” and only one in “Misconceptions correction.” This implies that their choices are consistent and stable. They seem to have a comprehensive understanding and a clear perception of each attribute and its levels.
The Pearson’s correlation coefficient (0.991) is close to 1, which means that the conjoint analysis model accurately explains the respondents’ choices. Kendall’s tau (0.889) suggests strong agreement in the rankings of the alternatives. Therefore, we can confidently conclude that the model is reliable, the responses are consistent, and the preferences are not influenced by random or incoherent answers.

4.2.3. Benchmarking Virtual Labs

Table 15 is the result of combining Table 13 with the weighted criterion vector obtained through CA.
Table 16 provides the final results of the VL evaluation using the selected MCDA methods. There is complete consensus among the ranking-oriented methods: the BRVL virtual lab is ranked first, followed by Physic Virtual Lab, LVP, Virtual Lab, Algodoo, and Physion.
The ELECTRE I and PROMETHEE I methods (using both the usual and Gaussian functions) also agree on the best VLs (core set): BRVL and Physic Virtual Lab are the alternatives that were not outperformed. However, the core set consists only of BRVL when the linear function is used for PROMETHEE I.
The PROMETHEE II method produces the same ranking regardless of the function used. The ELECTRE TRI method classifies BRVL in the “High” category, LVP and Physic Virtual Lab in the “Medium” category, and the remaining VLs in the “Low” category.

4.3. Sensitivity to Parameter Values

The sensitivity analysis results for the ELECTRE and PROMETHEE methods are unequivocal. Regardless of the scenario, BRVL is part of the core for ELECTRE I and PROMETHEE I and ranks first for ELECTRE II and PROMETHEE II. Moreover, the final ranking of VLs remains unaffected by modifications to the parameter values of these methods.
Figure 3 illustrates that, within the context of our study, the ELECTRE methods (Figure 3a for ELECTRE I and Figure 3b for ELECTRE II) and the PROMETHEE methods (Figure 3c for PROMETHEE I and Figure 3d for PROMETHEE II) exhibit strong robustness. However, it is worth noting that, for ELECTRE I, the core shrinks (from 3 to 1) as the concordance threshold increases, while ELECTRE II remains perfectly stable regardless of threshold values. Varying the veto thresholds does not affect the results for ELECTRE II. Figure 3b remains the same for all veto values from 4 to 8. Additionally, the core of PROMETHEE I expands (from 1 to 4) as the values of q and p increase for the linear function, while it remains a singleton for the usual and Gaussian functions, regardless of the values of q and p.
The ranking of VLs in PROMETHEE II remains unchanged, regardless of the values assigned to q and p or the function chosen (usual, linear, or Gaussian). As q and p increase, the net flows decrease, but the ranking order remains the same.
Whatever the parameter setting or scenario applied, BRVL systematically appears among the core alternatives in choice-based methods (ELECTRE I and PROMETHEE I), and ranks first in ranking-based methods (ELECTRE II and PROMETHEE II). These consistent results across all tested configurations allow us to assert with confidence that respondents’ preferences for VLs are robust, and that BRVL consistently maintains its leading position despite variations in methodological parameters.

4.4. Robust Convergence Across MCDA Approaches

All eight MCDA methods used in this study yielded consistent results: BRVL appeared in the core set of every outranking approach and ranked first in all full-ranking methods. To challenge this stability, extensive sensitivity analyses were performed. For ELECTRE, thresholds c (0.60 to 0.80, step 0.05) and d (0.40 to 0.20, step −0.05) were varied across five scenarios, each tested with veto levels of 4–8. In PROMETHEE, parameters q (0.1–1.0) and p (1–2) were varied in 0.1-step increments, testing linear, usual, and Gaussian preference functions. In all cases, BRVL retained its dominance. Given this cross-method alignment (even under substantial parameter shifts), no meta-ranking was required. The results are self-consistent.

5. Discussion

The findings of this study demonstrate that the use of the BRVL adds significant value to physics education in the Democratic Republic of the Congo (DRC), particularly because its solution aligns with the local curriculum and is shown to be more effective than many global alternatives in correcting misconceptions.
In fact, the BRVL is unique in its ability to adapt to the limitations of Congolese secondary schools (limited Internet access, scarce equipment, and specific educational needs). In contrast to VLs made for high-resource contexts [12,13,24,25] or universities [30,31], the BRVL is preferred for its responsiveness to the challenges of Congolese secondary education. As noted by Refs. [28,29], low-cost VLs have the potential to transform STEM education in underequipped areas. Our novelty is in considering a lightweight platform, active pedagogy focused on common misconceptions of local students. This section discuss about how the BRVL goes beyond the bounds of traditional VLs [27] while offering a replicable model for Francophone countries with comparable resources.

5.1. Synthesis of Methodological and Conceptual Contributions

This research introduces a novel paradigm for integrating ICT into sub-Saharan African education through its dual innovation: a pedagogically grounded VL framework, coupled with robust multi-method validation protocols. Two major advances emerge: robustness of results and prioritization of contextual criteria.
Moreover, the analysis of the impact of teachers’ profile on VLs evaluation revealed that educators with higher academic qualifications or more extended physics teaching background in 4th grade science assigned significantly stricter ratings to the following virtual labs: Algodoo (usability), BRVL (curriculum compliance) and Physic virtual lab (usability). The results show how certain professional qualities can shape in structured ways teachers’ views of the pedagogical value of digital tools.This has been noted in much cross-disciplinary literature [89,90], which supports the view that higher education and training build pedagogical acumen and thus encourage more critical evaluation standards.

5.1.1. Robustness of Results

Despite their differences (compensatory vs non-compensatory), ELECTRE, PROME-THEE, AHP, and TOPSIS techniques unanimously agreed that BRVL was the best one. This supports the findings of Ref. [29] on the need for mixed methodologies. Our sensitivity analysis extends this idea by demonstrating that BRVL remains in the core even under highly stringent thresholds ( c = 0.8 , v = 8 , q = 0.1 , p = 1 , etc.). Furthermore, PROMETHEE II net flows withstand variations in preference functions (Usual vs. Gaussian vs. Linear), surpassing standard robustness tests in the literature.

5.1.2. Prioritization of Contextual Criteria

The Conjoint Analysis outcomes (Table 14) provide deep insights into the prioritization of pedagogical and logistical criteria for VLs in resource-constrained contexts. Misconceptions correction (28.795%) and curriculum compliance (26.080%) are premier criteria because together they sum to more than 54% of the weight in the decision. This is what Gnesdilow and Puntambekar [27] would have localized learning gaps, except that here it is attached with dominance quantified within MCDA frameworks regarding misconception correction. A very high weight assigned to curriculum compliance validates El Kharki-Berrada-Burgos’ argument that even marginal deviations from national educational standards reduce pedagogical effectiveness of VLs [30]. The finding is empirically reinforced by the non-compensatory nature of these criteria in our ELECTRE/PROMETHEE analyses.
Knowledge building (24.428%) and usability (20.696%), though secondary, show subtle trade-offs. The lower ranking for usability challenges the “user-first” design philosophy of global VLs such as the NEWTON project [13], implying that pedagogical effectiveness trumps interface simplicity in situations where infrastructure limitations are severe [29]. However, the very small number of inversions (below 2) across all criteria demonstrates a very high degree of respondent consistency, as reflected by both Pearson’s r at 0.991 and Kendall’s τ at 0.889. Such statistical reliability underscores that the preferences are not artifacts of random choice but rather reflect a deliberate prioritization of learning outcomes over technological sophistication.
Misconception correction, cited as the top priority (28.795%), draws attention to the need for VLs that genuinely reflect local cultural and educational contexts. This insight connects with critiques—like those in Ref. [24] —of 3D VLs originally designed for Western contexts. To address this, BRVL was shaped around regional curricula and recurring student misconceptions. We can then concistenly state that BRVL offers a model more grounded in the realities of the Global South. Interestingly, the relatively lower importance placed on usability (20.696%) aligns with El Kharki-Berrada-Burgo’s concept of “good enough” VLs that maintain educational quality without expensive technical requirements [30]. Altogether, these insights push back against the assumption that high-tech, high-fidelity simulations automatically guarantee better educational impact.

5.2. Break from Worldwide Models

BRVL’s use circumvents basic impediments of worldwide arrangements (e.g., Algodoo, Physion): Curricular misalignment, Targeted pedagogical shortcomings, and Technological advances and infrastructure constraints.

5.2.1. Curricular Misalignment

The systematic exclusion of global models from ELECTRE I/PROMETHEE I cores—even under maximally permissive parameter configurations—empirically validates the critical finding of Ref. [30]: without curricular adaptation to national educational standards, virtual laboratories fail to achieve meaningful learning outcomes. Our multi-method analysis establishes that even marginal curricular deviations constitute disqualifying conditions, conclusively demonstrating the non-compensatory dominance of curriculum alignment in MCDA evaluation frameworks.

5.2.2. Targeted Pedagogical Shortcomings

Poor performance in misconception correction (the highest-weighted criterion) reveals a systemic bias in global VLs: some designs centered on 3D immersion [24] neglect the mechanisms of cognitive deconstruction, which are essential in overcrowded classrooms where errors persist due to lack of individualized feedback. In contrast, BRVL establishes a new paradigm for “glocal” VLs—global in technology yet local in pedagogy. Its modular architecture (e.g., pre-encoded misconception library) may inspire adaptations for other STEM disciplines, as suggested by Ref. [12].

5.3. Technological Advances and Infrastructure Constraints

Our thinking makes an essential contribution to the ongoing debate. BRVL distinguishes itself through intelligent dematerialization: unlike bandwidth-intensive VLs [25], BRVL demonstrates that an offline solution for PCs or Android smartphones can also deliver sufficient fidelity for mechanics experiments. Indeed, BRVL’s offline functionality and low footprint address infrastructure barriers while maintaining high-fidelity mechanics. This aligns with UNESCO’s (2022) call for low-tech STEM solutions in Global South contexts [91].
As BRVL addresses technological constraints, its pedagogical effectiveness hinges on teacher competency—a challenge previously noted by Ref. [13]. We therefore propose integrating BRVL into professional development programs (Blended Teacher Professional Development, TPD) by leveraging both its offline accessibility and active, collaborative pedagogical approaches. This approach aligns with the framework of blended TPD while adding the critical dimension of content adaptation tailored to local needs [92].

6. Conclusions

Our study has demonstrated that BRVL significantly outperforms competing global alternatives, particularly concerning the two criteria with the highest weights: misconception correction (weighted at 28.8%) and curricular alignment with the fourth-year scientific physics program in the Democratic Republic of the Congo (weighted at 26.1%). This superiority is further reinforced by the robustness of the results obtained through the eight multicriteria methods employed in this study, as well as by the sensitivity analysis, which confirms BRVL’s resilience to extremely strict thresholds. These results lead us to revisit our initial hypotheses:
  • H1—Confirmed. All eight MCDA methods used converged on the same result: BRVL is part of the core set in outranking methods and ranks first in total aggregation methods. This convergence suggests that methodological bias is negligible and reinforces the overall reliability of the outcome.
  • H2—Partially confirmed. Although statistical validation confirmed the general reliability of the data, we identified and analyzed respondent-related biases using linear regression.
  • H3—Refuted. Unexpectedly, the results remained stable despite the methodological diversity of the MCDA approaches and the range of parameter configurations tested during the sensitivity analysis.
  • H4—Confirmed. Even under varied threshold and preference settings, the outcome showed no significant change, underscoring its stability.
  • H5—Not applicable. Since all methods pointed to the same result, meta-ranking mechanisms were simply unnecessary.
From a pedagogical standpoint, unlike other physics VLs, BRVL is specifically designed to suit the local educational context in the DRC—a developing country facing multiple challenges in equipping its scientific schools with modern laboratory facilities and materials.
From a theoretical perspective, our work has made a significant contribution to the development of a new MCDA evaluation framework for resource-constrained physics VLs. Practically, BRVL, due to its accessible architecture, offline functionality, low cost, and alignment with local curricula, can be replicated in other countries with similar contexts seeking to integrate ICT into their national curricula. The responsibility now lies with policymakers to allocate substantial budgets for the design and implementation of locally tailored virtual laboratories. Moreover, the BRVL could be integrated into the Congolese national curriculum to support not only the correction of misconceptions among young learners but also the teaching, learning, and assessment of physics.
Among its limitations, we highlight the restricted study area and its dependence on regions with easy access to electricity and smartphones. Moving forward, it is necessary to expand this research to other cities and provinces in the DRC, as well as to other STEM disciplines (such as mathematics, chemistry, and biology). Furthermore, versions adapted to Congolese and African regions where populations lack access to electricity should be developed. BRVL could also be used as an interface for conducting practical physics examinations within the Congolese National Baccalaureate. Over several years of longitudinal study, BRVL’s results could serve as the basis for future research aimed at refining its capabilities, including the automation of evaluations through the integration of appropriate algorithms (e.g., Python-based MCDA toolkit).
This work suggests several possibilities for future research. The adaptation of the proposed evaluation framework to different educational settings is an immediate potential advancement, especially within resource-constrained systems. When curricula align with pedagogical relevance at the national level, integration strategies and policy decisions are more effectively crafted for learners by policymakers. Advanced technologies such as AI-enabled knowledge synthesis, augmented reality, mobile-based applications could potentially boost both accessibility and educational impact. Future research should prioritize the simultaneous pursuit of gender equity and geographical inclusion, while guaranteeing resource access for rural areas. The combination of continued long-term research with advancements in MCDA methods will enhance our ability to evaluate the persistent benefits of VLs and support their sustainable integration.

Author Contributions

Conceptualization, R.M.B., R.-B.M.N. and J.-R.M.B.; Data curation, R.M.B., R.-B.M.N. and J.-R.M.B.; Formal analysis, R.-B.M.N., J.-R.M.B. and G.K.K.; Investigation, R.M.B.; Methodology, R.M.B. and R.-B.M.N.; Software, R.-B.M.N. and J.-R.M.B.; Supervision, R.-B.M.N., G.K.K. and B.N.M.; Validation, R.-B.M.N., R.M.B., J.-R.M.B. and B.N.M.; Visualization, R.-B.M.N., R.M.B., G.K.K. and B.N.M.; Writing—original draft, R.M.B. and R.-B.M.N.; Writing—review & editing, R.-B.M.N., J.-R.M.B. and B.N.M. All authors have read and agreed to the published version of the manuscript.

Funding

There was no external funding for this study.

Data Availability Statement

Please contact authors for data and materials requests.

Acknowledgments

The authors express their deep thanks for the referees’ valuable suggestions about revising and improving the manuscript.

Conflicts of Interest

The authors declare that none of the work reported in this paper could have been influenced by any known competing financial interests or personal relationships.

Abbreviations

The following abbreviations are used in this manuscript:
Algo_UsPerformance of Algodoo on usability
Betw. subj.Between subjects
BRVLBazin-R VirtLab
BRVL_CurrPerformance of BRVL on curriculum compliance
BRVL_Misc                 Performance of BRVL on misconceptions correction
Curr. compl.Curriculum compliance
Dep. var.Dependent variable
Dev. Tech.Development Technology
DRCDemocratic Republic of the Congo
dfDegree of freedom
Educ. levelEducation level
Know. build.Knowledge building
ICCIntraclass Correlation Coefficient
ICTInformation and Communication Technology
Ind. var.Independent variable
Intra pop.Intra population
Mast.Master’s equivalent
Misc. corr.Misconceptions correction
MCDAMulti-Criteria Decision Aiding
Nonadd.Nonadditivity
Phys. Back.Physics Teaching Background in 4th Grade Science
Phys_CurrPerformance of Physics Virtual lab on curriculum compliance
Phys_KnowPerformance of Physics Virtual lab on knowledge building
Phys_MiscPerformance of Physics Virtual lab on misconceptions correction
Phys_UsPerformance of Physics Virtual lab on usability
Physion_MiscPerformance of Physion on misconceptions correction
Sec.Upper secondary level
Sig.Significance threshold
Sig. post hoc comp.Significant post hoc comparisons
STEMScience, Technology, Engineering, and Mathematics
Sum Sq.Sum of squares
TPDTeacher Professional Development
VLVirtual lab

Appendix A. Surveyof Secondary School Physics Teachers

Subjects surveyed: Physics teachers in 4th grade science
Submission period: During the school year after testing the virtual laboratories under study.

Appendix A.1. Address to Respondents

Dear physics Teacher in 4th Grade Science,
While ensuring your anonymity, we kindly invite you to participate in this study titled “Selection and Ranking of Offline physics Virtual Laboratories (VLs) by physics Teachers in Inkisi and Kimpese.” Please answer the questions with reference to the provided guidelines. We thank you in advance for your valuable contribution.

Appendix A.2. Sociodemographic Information of the Respondent

1.
Gender: □ Male □ Female
2.
Age: □ <21 yrs □ 21–26 yrs □ 27–32 yrs □ >32 yrs
3.
Education level: □ Upper Secondary □ Bachelor (3 yrs) □ Master equivalent (5 yrs) □ Other
4.
Field of study: □ Mathematics-Physics □ Physics-Technology □ Physics-Electricity □ Physics-Electronics
5.
Physics Teaching Background in 4th Grade Science: □ <1 yr □ 1–5 yrs □ 6–10 yrs □ >10 yrs
6.
Residence area: □ Kisantu □ Kimpese

Appendix A.3. Scoring of Fictional VLs

On a scale from 0 to 10, please rate each of the following combinations. Each combination represents a fictional physics VL for teaching 4th grade science in DRC:
ProfileCurr. Compl.Know. Build.Misc. Corr.UsabilityScore (out of 10)
1CompliantPartiallyNot at allVery easy
2CompliantNot at allEffectivelyEasy
3Non-compliantEffectivelyNot at allEasy
4Non-compliantNot at allPartialVery easy
5Non-compliantPartiallyEffectivelyDifficult
6CompliantNot at allNot at allDifficult
7CompliantEffectivelyEffectivelyVery easy
8CompliantEffectivelyPartiallyDifficult
9CompliantPartiallyPartiallyEasy

Appendix A.4. Scoring of Competing Real-World VLs

Rate each of the following physics VLs (on a scale of 0 to 10) for each of the selected criteria:
Physics VLsCurr. Compl.Know. Build.Misc. Corr.Usability
Algodoo
Bazin-R VirtLab
LVP
Physic virtual lab APK
Physion
Virtual lab

References

  1. Dori, Y.J.; Belcher, J. How does technology-enabled active learning affect undergraduate students’ understanding of electromagnetism concepts? J. Learn. Sci. 2005, 14, 243–279. [Google Scholar] [CrossRef]
  2. Kefalis, C.; Skordoulis, C.; Drigas, A. Digital Simulations in STEM Education: Insights from Recent Empirical Studies, a Systematic Review. Encyclopedia 2025, 5, 10. [Google Scholar] [CrossRef]
  3. Haberbosch, M.; Deiters, M.; Schaal, S. Combining Virtual and Hands-on Lab Work in a Blended Learning Approach on Molecular Biology Methods and Lab Safety for Lower Secondary Education Students. Educ. Sci. 2025, 15, 123. [Google Scholar] [CrossRef]
  4. Bar, V.; Brosh, Y.; Sneider, C. Weight, Mass, and Gravity: Threshold Concepts in Learning Science. Sci. Educ. 2016, 25, 22–34. [Google Scholar]
  5. Taibu, R.; Rudge, D.; Schuster, D. Textbook presentations of weight: Conceptual difficulties and language ambiguities. Phys. Rev. Spec. Top.-Phys. Educ. Res. 2015, 11, 010117. [Google Scholar] [CrossRef]
  6. Taibu, R.; Schuster, D.; Rudge, D. Teaching weight to explicitly address language ambiguities and conceptual difficulties. Phys. Rev. Phys. Educ. Res. 2017, 13, 010130. [Google Scholar] [CrossRef]
  7. Astolfi, J.P.; Peterfalvi, B. Obstacles et construction de situations didactiques en sciences expérimentales. Aster Rech. Didact. Sci. Exp. 1993, 16, 103–141. [Google Scholar] [CrossRef]
  8. Babalola, F.E.; Ojobola, F.B. Improving Learning of Practical Physics in Sub-Saharan Africa—System Issues. Can. J. Sci. Math. Technol. Educ. 2022, 22, 278–300. [Google Scholar] [CrossRef]
  9. Babalola, F. Advancing Practical Physics in Africa’s Schools; Open University: Milton Keynes, UK, 2017. [Google Scholar]
  10. Aljuhani, K.; Sonbul, M.; Althabiti, M.; Meccawy, M. Creating a Virtual Science Lab (VSL): The adoption of virtual labs in Saudi schools. Smart Learn. Environ. 2018, 5, 16. [Google Scholar] [CrossRef]
  11. Darrah, M.; Humbert, R.; Finstein, J.; Simon, M.; Hopkins, J. Are virtual labs as effective as hands-on labs for undergraduate physics? A comparative study at two major universities. J. Sci. Educ. Technol. 2014, 23, 803–814. [Google Scholar] [CrossRef]
  12. Laseinde, O.T.; Dada, D. Enhancing teaching and learning in STEM Labs: The development of an android-based virtual reality platform. Mater. Today Proc. 2024, 105, 240–246. [Google Scholar] [CrossRef]
  13. Lynch, T.; Ghergulescu, I. NEWTON virtual labs: Introduction and teacher perspective. In Proceedings of the 2017 IEEE 17th International Conference on Advanced Learning Technologies (ICALT), Timisoara, Romania, 3–7 July 2017; pp. 343–345. [Google Scholar]
  14. Youssef, A.E.; Saleem, K. A hybrid MCDM approach for evaluating web-based e-learning platforms. IEEE Access 2023, 11, 72436–72447. [Google Scholar] [CrossRef]
  15. Al-Gerafi, M.A.; Goswami, S.S.; Khan, M.A.; Naveed, Q.N.; Lasisi, A.; AlMohimeed, A.; Elaraby, A. Designing of an effective e-learning website using inter-valued fuzzy hybrid MCDM concept: A pedagogical approach. Alex. Eng. J. 2024, 97, 61–87. [Google Scholar] [CrossRef]
  16. Alshamsi, A.M.; El-Kassabi, H.; Serhani, M.A.; Bouhaddioui, C. A multi-criteria decision-making (MCDM) approach for data-driven distance learning recommendations. Educ. Inf. Technol. 2023, 28, 10421–10458. [Google Scholar] [CrossRef] [PubMed]
  17. Leskinen, P.; Kangas, J. Rank reversals in multi-criteria decision analysis with statistical modelling of ratio-scale pairwise comparisons. J. Oper. Res. Soc. 2005, 56, 855–861. [Google Scholar] [CrossRef]
  18. Wątróbski, J.; Jankowski, J.; Ziemba, P.; Karczmarczyk, A.; Zioło, M. Generalised framework for multi-criteria method selection. Omega 2019, 86, 107–124. [Google Scholar] [CrossRef]
  19. Ishizaka, A.; Nemery, P. Multi-Criteria Decision Analysis: Methods and Software; John Wiley & Sons: Hoboken, NJ, USA, 2013. [Google Scholar]
  20. Dias, L.C.; Kadziński, M. Meta-Rankings of Journals Publishing Multiple Criteria Decision Aiding Research: Benefit-of-Doubt Composite Indicators for Heterogeneous Qualitative Scales. In Intelligent Decision Support Systems: Combining Operations Research and Artificial Intelligence-Essays in Honor of Roman Słowiński; Springer: Berlin/Heidelberg, Germany, 2022; pp. 245–268. [Google Scholar]
  21. Ferretti, V. Convergencies and Divergencies in Collaborative Decision-Making Processes. In Proceedings of the International Conference on Group Decision and Negotiation, Toronto, ON, Canada, 6–10 June 2021; Springer: Berlin/Heidelberg, Germany, 2021; pp. 155–169. [Google Scholar]
  22. Luque-Martínez, T.; Faraoni, N. Meta-ranking to position world universities. Stud. High. Educ. 2020, 45, 819–833. [Google Scholar] [CrossRef]
  23. Sellberg, C.; Nazari, Z.; Solberg, M. Virtual laboratories in STEM higher education: A scoping review. Nord. J. Syst. Rev. Educ. 2024, 2, 58–75. [Google Scholar] [CrossRef]
  24. Sypsas, A.; Paxinou, E.; Zafeiropoulos, V.; Kalles, D. Virtual Laboratories in STEM Education: A Focus on Onlabs, a 3D Virtual Reality Biology Laboratory. In Online Laboratories in Engineering and Technology Education: State of the Art and Trends for the Future; May, D., Auer, M.E., Kist, A., Eds.; Springer Nature: Cham, Switzerland, 2024; pp. 323–337. [Google Scholar] [CrossRef]
  25. August, S.E.; Hammers, M.L.; Murphy, D.B.; Neyer, A.; Gueye, P.; Thames, R.Q. Virtual engineering sciences learning lab: Giving STEM education a second life. IEEE Trans. Learn. Technol. 2015, 9, 18–30. [Google Scholar] [CrossRef]
  26. Murdan, A.P. Tailoring STEM Education for Slow Learners Through Artificial Intelligence. In Proceedings of the 2024 5th International Conference on Emerging Trends in Electrical, Electronic and Communications Engineering (ELECOM), Port Louis, Mauritius, 20–22 November 2024; pp. 1–7. [Google Scholar]
  27. Gnesdilow, D.; Puntambekar, S. Middle School Students’ Application of Science Learning From Physical Versus Virtual Labs to New Contexts. Sci. Educ. 2025. early view. [Google Scholar] [CrossRef]
  28. Yordanov, T.; Mihailov, N.; Gabrovska-Evstatieva, K. Low-cost Remote Lab on Renewable Energy Sources with a Focus on STEM Education. In Proceedings of the 2023 18th Conference on Electrical Machines, Drives and Power Systems (ELMA), Varna, Bulgaria, 29 June–1 July 2023; pp. 1–5. [Google Scholar]
  29. Nedungadi, P.; Raman, R.; McGregor, M. Enhanced STEM learning with Online Labs: Empirical study comparing physical labs, tablets and desktops. In Proceedings of the 2013 IEEE Frontiers in Education conference (FIE), Oklahoma City, OK, USA, 23–26 October 2013; pp. 1585–1590. [Google Scholar]
  30. El Kharki, K.; Berrada, K.; Burgos, D. Design and implementation of a virtual laboratory for physics subjects in Moroccan universities. Sustainability 2021, 13, 3711. [Google Scholar] [CrossRef]
  31. Hassan, J.; Devi, A.; Ray, B. Virtual laboratories in tertiary education: Case study analysis by learning theories. Educ. Sci. 2022, 12, 554. [Google Scholar] [CrossRef]
  32. Krathwohl, D.R. A revision of Bloom’s taxonomy: An overview. Theory Pract. 2002, 41, 212–218. [Google Scholar] [CrossRef]
  33. Sonje, S.A.; Pawar, R.S.; Shukla, S. Assessing blockchain-based innovation for the “right to education” using MCDA approach of value-focused thinking and fuzzy cognitive maps. IEEE Trans. Eng. Manag. 2021, 70, 1945–1965. [Google Scholar] [CrossRef]
  34. Jeong, J.S.; González-Gómez, D. MCDA/F-DEMATEL/ICTs Method Under Uncertainty in Mathematics Education: How to Make a Decision with Flipped, Gamified, and Sustainable Criteria. In Decision Making Under Uncertainty Via Optimization, Modelling, and Analysis; Springer: Berlin/Heidelberg, Germany, 2025; pp. 91–113. [Google Scholar]
  35. Ransikarbum, K.; Leksomboon, R. Analytic hierarchy process approach for healthcare educational media selection: Additive manufacturing inspired study. In Proceedings of the 2021 IEEE 8th International Conference on Industrial Engineering and Applications (ICIEA), Virtual Conference, 23–26 April 2021; pp. 154–158. [Google Scholar]
  36. Kurilovas, E.; Kurilova, J. Several decision support methods for evaluating the quality of learning scenarios. In Proceedings of the 2015 IEEE 3rd Workshop on Advances in Information, Electronic and Electrical Engineering (AIEEE), Riga, Latvia, 13–14 November 2015; pp. 1–6. [Google Scholar]
  37. Hisamuddin, M.; Faisal, M. Exploring Effective Decision-Making Techniques in Learning Environment: A Comprehensive Review. In Proceedings of the 2024 Second International Conference Computational and Characterization Techniques in Engineering & Sciences (IC3TES), Lucknow, India, 15–16 November 2024; pp. 1–8. [Google Scholar]
  38. Kuzmanovic, M.; Savic, G. Avoiding the privacy paradox using preference-based segmentation: A conjoint analysis approach. Electronics 2020, 9, 1382. [Google Scholar] [CrossRef]
  39. Green, P.E.; Rao, V.R. Conjoint measurement-for quantifying judgmental data. J. Mark. Res. 1971, 8, 355–363. [Google Scholar]
  40. Green, P.E.; Srinivasan, V. Conjoint analysis in consumer research: Issues and outlook. J. Consum. Res. 1978, 5, 103–123. [Google Scholar] [CrossRef]
  41. Green, P.E.; Srinivasan, V. Conjoint analysis in marketing: New developments with implications for research and practice. J. Mark. 1990, 54, 3–19. [Google Scholar] [CrossRef]
  42. Van Etten, B.; Smit, K. Learning material in compliance with the Revised National Curriculum Statement: A dilemma. Pythagoras 2005, 2005, 48–58. [Google Scholar] [CrossRef]
  43. Abbasi-Ghahramanloo, A.; Abedi, M.; Shirdel, Y.; Moradi-Asl, E. Examining the Degree of Compliance of the Continuing Public Health Bachelor’s Curriculum with the Job Needs of Healthcare Networks. J. Health 2024, 15, 180–186. [Google Scholar] [CrossRef]
  44. Fazeli, S.; Esmaeili, A.; Mohammadi, Y.; Raeisoon, M. Investigating the Compliance of the Curriculum Content of the Psychiatric Department of Medicine (Externship and Internship) with the Future Job Needs from the Perspective of General Practitioners. Res. Med. Educ. 2021, 13, 72–79. [Google Scholar] [CrossRef]
  45. Reyes, R.L.; Isleta, K.P.; Regala, J.D.; Bialba, D.M.R. Enhancing experiential science learning with virtual labs: A narrative account of merits, challenges, and implementation strategies. J. Comput. Assist. Learn. 2024, 40, 3167–3186. [Google Scholar] [CrossRef]
  46. Kilani, H.; Markov, I.V.; Francis, D.; Grigorenko, E.L. Screens and Preschools: The Bilingual English Language Learner Assessment as a Curriculum-Compliant Digital Application. Children 2024, 11, 914. [Google Scholar] [CrossRef]
  47. Queiroz-Neto, J.P.; Sales, D.C.; Pinheiro, H.S.; Neto, B.O. Using modern pedagogical tools to improve learning in technological contents. In Proceedings of the 2015 IEEE Frontiers in Education Conference (FIE), Washington, DC, USA, 21–24 October 2015; pp. 1–8. [Google Scholar]
  48. Gutiérrez-Braojos, C.; Montejo-Gámez, J.; Marín-Jiménez, A.E.; Poza-Vilches, F. A review of educational innovation from a knowledge-building pedagogy perspective. In The Future of Innovation and Technology in Education: Policies and Practices for Teaching and Learning Excellence; Emerald Publishing: Leeds, UK, 2018; pp. 41–54. [Google Scholar]
  49. Mishra, S. The world in the classroom: Using film as a pedagogical tool. Contemp. Educ. Dialogue 2018, 15, 111–116. [Google Scholar] [CrossRef]
  50. Lee, H.Y.; Chen, P.H.; Wang, W.S.; Huang, Y.M.; Wu, T.T. Empowering ChatGPT with guidance mechanism in blended learning: Effect of self-regulated learning, higher-order thinking skills, and knowledge construction. Int. J. Educ. Technol. High. Educ. 2024, 21, 16. [Google Scholar] [CrossRef]
  51. Liu, G.; Fang, N. The effects of enhanced hands-on experimentation on correcting student misconceptions about work and energy in engineering mechanics. Res. Sci. Technol. Educ. 2023, 41, 462–481. [Google Scholar] [CrossRef]
  52. Kowalski, P.; Taylor, A.K. Reducing students’ misconceptions with refutational teaching: For long-term retention, comprehension matters. Scholarsh. Teach. Learn. Psychol. 2017, 3, 90. [Google Scholar] [CrossRef]
  53. Liu, G.; Fang, N. Student misconceptions about force and acceleration in physics and engineering mechanics education. Int. J. Eng. Educ. 2016, 32, 19–29. [Google Scholar]
  54. Thomas, C.L.; Kirby, L.A. Situational interest helps correct misconceptions: An investigation of conceptual change in university students. Instr. Sci. 2020, 48, 223–241. [Google Scholar] [CrossRef]
  55. Moosapoor, M. New teachers’ awareness of mathematical misconceptions in elementary students and their solution provision capabilities. Educ. Res. Int. 2023, 2023, 4475027. [Google Scholar] [CrossRef]
  56. Kapenieks, J. User-friendly e-learning environment for educational action research. Procedia Comput. Sci. 2013, 26, 121–142. [Google Scholar] [CrossRef]
  57. Navas, C. User-Friendly Digital Tools: Boosting Student Engagement and Creativity in Higher Education. Eur. Public Soc. Innov. Rev. 2025, 10, 1–17. [Google Scholar] [CrossRef]
  58. Park, H.; Song, H.D. Make e-learning effortless! Impact of a redesigned user interface on usability through the application of an affordance design approach. J. Educ. Technol. Soc. 2015, 18, 185–196. [Google Scholar]
  59. Pham, M.; Singh, K.; Jahnke, I. Socio-technical-pedagogical usability of online courses for older adult learners. Interact. Learn. Environ. 2023, 31, 2855–2871. [Google Scholar] [CrossRef]
  60. Rakic, S.; Softic, S.; Andriichenko, Y.; Turcin, I.; Markoski, B.; Leoste, J. Usability Platform Test: Evaluating the Effectiveness of Educational Technology Applications. In Proceedings of the International Conference on Interactive Collaborative Learning, Tallinn, Estonia, 24–27 September 2024; Springer: Berlin/Heidelberg, Germany, 2024; pp. 250–258. [Google Scholar]
  61. Lefkos, I.; Mitsiaki, M. Users’ preferences for pedagogical e-content: A utility/usability survey on the Greek illustrated science dictionary for school. In Research on e-Learning and ICT in Education: Technological, Pedagogical and Instructional Perspectives; Springer International Publishing: Cham, Switzerland, 2021; pp. 197–217. [Google Scholar]
  62. Balanyà Rebollo, J.; De Oliveira, J.M. Teachers’ evaluation of the usability of a self-assessment tool for mobile learning integration in the classroom. Educ. Sci. 2024, 14, 1. [Google Scholar] [CrossRef]
  63. Almusharraf, A.I. An Investigation of University Students’ Perceptions of Learning Management Systems: Insights for Enhancing Usability and Engagement. Sustainability 2024, 16, 10037. [Google Scholar] [CrossRef]
  64. Uchima-Marin, C.; Murillo, J.; Salvador-Acosta, L.; Acosta-Vargas, P. Integration of Technological Tools in Teaching Statistics: Innovations in Educational Technology for Sustainable Education. Sustainability 2024, 16, 8344. [Google Scholar] [CrossRef]
  65. Ngoie, R.B.M.; Bansimba, J.R.; Mpolo, F.; Bazangika, R.; Sakulu, J.A.; Mbaka, R.; Bonkile, F. A Hybrid approach combining Conjoint Analysis and the Analytic Hierarchy Process for multicriteria group decision-making. Int. J. Anal. Hierarchy Process 2025, 17. [Google Scholar] [CrossRef]
  66. Ngoie, R.B.M.; Dibakidi, O.; Mbaka, R.; Sakulu, J.A.; Musoni, D. Combining AHP, TOPSIS and Conjoint Analysis to rank shopping centers in the locality of Mbanza-Ngungu. In Proceedings of the International Symposium on the Analytic Hierarchy Process, Virtual Conference, 15–18 December 2022. Paper presentation, DRC. [Google Scholar] [CrossRef]
  67. Hong, B.X.; Ichihashi, M.; Ngoc, N.T.B. Analysis of Consumer Preferences for Green Tea Products: A Randomized Conjoint Analysis in Thai Nguyen, Vietnam. Sustainability 2024, 16, 4521. [Google Scholar] [CrossRef]
  68. Ngoie, R.B.M.; Kamwa, E.; Ulungu, B. Joint use of the mean and median for multi criteria decision support: The 3MCD method. Econ. Bull. 2019, 39, 1602–1611. [Google Scholar]
  69. Balinski, M.; Laraki, R. Majority Judgment: Measuring, Ranking, and Electing; MIT Press: Cambridge, MA, USA, 2011. [Google Scholar]
  70. Saaty, T.L. The analytic hierarchy process (AHP). J. Oper. Res. Soc. 1980, 41, 1073–1076. [Google Scholar]
  71. Hwang, C.L. Multiple Attributes Decision Making. Methods and Applications; CRC Press: Boca Raton, FL, USA, 1981. [Google Scholar]
  72. Roy, B. Classement et choix en présence de points de vue multiples. Rev. Fr. Inform. Rech. Oper. 1968, 2, 57–75. [Google Scholar] [CrossRef]
  73. Figueira, J.R.; Greco, S.; Roy, B.; Słowiński, R. ELECTRE methods: Main features and recent developments. In Handbook of Multicriteria Analysis; Springer: Berlin/Heidelberg, Germany, 2010; pp. 51–89. [Google Scholar]
  74. Roy, B.; Bertier, P. La Méthode ELECTRE II; Technical Report; METRA International: Paris, France, 1973. [Google Scholar]
  75. Mousseau, V.; Slowinski, R.; Zielniewicz, P. ELECTRE TRI 2.0 a. Methodological Guide and User’s Manual; Document du Lamsade; Université Paris–Dauphine: Paris, France, 1999; Volume 111, pp. 263–275. [Google Scholar]
  76. Brans, J.P.; Vincke, P. Note—A Preference Ranking Organisation Method (The PROMETHEE Method for Multiple Criteria Decision-Making). Manag. Sci. 1985, 31, 647–656. [Google Scholar] [CrossRef]
  77. Brans, J.P.; Vincke, P.; Mareschal, B. How to select and how to rank projects: The PROMETHEE method. Eur. J. Oper. Res. 1986, 24, 228–238. [Google Scholar] [CrossRef]
  78. Figueira, J.; Greco, S.; Ehrogott, M.; Brans, J.P.; Mareschal, B. PROMETHEE methods. In Multiple Criteria Decision Analysis: State of the Art Surveys; Springer International Publishing: Cham, Switzerland, 2005; pp. 163–186. [Google Scholar]
  79. Greco, S.; Ehrgott, M.; Figueira, J. ELECTRE methods. In Multiple Criteria Decision Analysis: State of the Art Surveys; Springer: New York, NY, USA, 2016; pp. 155–185. [Google Scholar]
  80. Maystre, L.Y.; Pictet, J.; Simos, J. Méthodes Multicritères ELECTRE: Description, Conseils Pratiques et Cas d’Application à la Gestion Environnementale; EPFL Press: Lausanne, Switzerland, 1994; Volume 8. [Google Scholar]
  81. Roy, B. The outranking approach and the foundations of ELECTRE methods. Theory Decis. 1991, 31, 49–73. [Google Scholar] [CrossRef]
  82. Behzadian, M.; Kazemzadeh, R.B.; Albadvi, A.; Aghdasi, M. PROMETHEE: A comprehensive literature review on methodologies and applications. Eur. J. Oper. Res. 2010, 200, 198–215. [Google Scholar] [CrossRef]
  83. Brans, J.P.; Mareschal, B. Promethee Methods. Available online: https://link.springer.com/chapter/10.1007/0-387-23081-5_5 (accessed on 2 July 2025).
  84. Davies, J.; Katsirelos, G.; Narodytska, N.; Walsh, T.; Xia, L. Complexity of and algorithms for the manipulation of Borda, Nanson’s and Baldwin’s voting rules. Artif. Intell. 2014, 217, 20–42. [Google Scholar] [CrossRef]
  85. Brams, S.J.; Fishburn, P.C. Voting procedures. In Handbook of Social Choice and Welfare; North Holland: Amsterdam, The Netherlands, 2002; Volume 1, pp. 173–236. [Google Scholar]
  86. Balinski, M.; Laraki, R. Majority judgment vs. majority rule. Soc. Choice Welf. 2020, 54, 429–461. [Google Scholar] [CrossRef]
  87. Ngoie, R.B.M.; Kasereka, S.K.; Sakulu, J.A.B.; Kyamakya, K. Mean-Median Compromise Method: A Novel Deepest Voting Function Balancing Range Voting and Majority Judgment. Mathematics 2024, 12, 3631. [Google Scholar] [CrossRef]
  88. Ngoie, R.B.M.; Savadogo, Z.; Ulungu, B.E.L. New Prospects in Social Choice Theory: Median and Average as Tools for Measuring, Electing and Ranking. Adv. Stud. Contemp. Math. 2015, 25, 19–38. [Google Scholar]
  89. Cardy, R.L.; Bernardin, H.J.; Abbott, J.G.; Senderak, M.P.; Taylor, K. The effects of individual performance schemata and dimension familiarization on rating accuracy. J. Occup. Psychol. 1987, 60, 197–205. [Google Scholar] [CrossRef]
  90. Govaerts, M.J.; Schuwirth, L.W.; Van der Vleuten, C.P.; Muijtjens, A.M. Workplace-based assessment: Effects of rater expertise. Adv. Health Sci. Educ. 2011, 16, 151–165. [Google Scholar] [CrossRef] [PubMed]
  91. UNESCO. UNESCO Spotlights How Digital Learning Can Promote Equity in Low-Resource Contexts. 2025. Available online: https://www.unesco.org/en/articles/unesco-spotlights-how-digital-learning-can-promote-equity-low-resource-contexts (accessed on 24 June 2025).
  92. Graham, C.R. Blended learning systems. Handb. Blended Learn. Glob. Perspect. Local Des. 2006, 1, 3–21. [Google Scholar]
Figure 1. Some user interfaces of BRVL.
Information 16 00587 g001
Figure 2. Overview of the Research Methodology.
Information 16 00587 g002
Figure 3. Sensitivity analysis of ELECTRE and PROMETHEE.
Information 16 00587 g003
Table 2. Technical specifications of competing VLs.
Virtual LabVersionDev. Tech.YearBasic Concepts
Algodoo2.1.0C++2009Classical mechanics (motion, forces, gravity, collisions), Kinetic and potential energy, Friction and air resistance, Simple machines (levers, pulleys, inclined planes), Fluids and buoyancy, Geometric optics (reflection, refraction), Electricity and simple circuits (in some versions).
Bazin-R VirtLab1.0C++, Javascript, Blender, Babylon.js, Node.js, SQLite2024Kinematics and dynamics (motion, forces, Newton’s laws) and Applications of Principles (Mechanical work, energy, and power).
LVPStableJava, Python1990–2000Kinematics and dynamics (motion, forces, Newton’s laws), Energy and power, Fluid mechanics (pressure, flow rate), Thermodynamics (gas laws, specific heat), Electricity (Ohm’s law, series and parallel circuits), Optics (mirrors, lenses, interference).
Physic Virtual lab1.0Java, Kotlin, C# (Unity)2010Mechanics (motion, forces, gravity), Energy and work, Electricity (simple circuits, resistances), Magnetism (magnetic fields, induction), Waves and sound (frequency, amplitude), Optics (reflection, refraction).
Physion1.20C++2010Mechanics (motion, collisions, forces), Kinetic and potential energy, Friction and resistance, Simple machines (pulleys, levers), Fluids (buoyancy, pressure), Oscillations (springs, pendulums).
Virtual Lab2023.2JavaScript, Python, C++, Java, C#1990–2010Mechanics (kinematics, dynamics, gravity), Energy and work, Thermodynamics (heat transfer, gas laws), Electricity and magnetism (circuits, fields), Waves and optics (reflection, refraction, interference), Modern physics (relativity, quantum mechanics in some advanced cases).
Table 5. Socio-demographic information of the respondents ( N = 22 ).
VariableCategoryFrequency (%)
GenderMale22 (100)
Age<21 yrs2 (9.1)
27–32 yrs6 (27.3)
>32 yrs14 (63.6)
Education levelUpper secondary1 (4.5)
Bachelor (3 yrs)18 (4.5)
Master equivalent (5 yrs)3 (13.6)
Field of StudyMathematics-Physics1 (4.5)
Physics-Technology8 (36.4)
Physics-Electricity7 (31.8)
Physics-Electronics6 (27.3)
Physics Teaching Background<1 yr1 (4.5)
in 4th Grade Science a1–5 yrs6 (27.3)
6–10 yrs5 (22.7)
>10 yrs10 (45.5)
a The 4th Grade Science is the final year of the STEM secondary curriculum in DRC.
Table 6. Fictional VLs generated by SPSS.
ProfileCurr. Compl.Know. Build.Misc. Corr.Usability
1CompliantPartiallyNot at allVery easy
2CompliantNot at allEffectivelyEasy
3Non-compliantEffectivelyNot at allEasy
4Non-compliantNot at allPartiallyVery easy
5Non-compliantPartiallyEffectivelyDifficult
6CompliantNot at allNot at allDifficult
7CompliantEffectivelyEffectivelyVery easy
8CompliantEffectivelyPartiallyDifficult
9CompliantPartiallyPartiallyEasy
Table 8. Parameter tuning of the applied MCDA methods.
MethodParameters
AHPNone
TOPSISNone
ELECTRE I c = 0.70 , d = 0.30
ELECTRE II c = 0.70 , d = 0.30 , v = 4
ELECTRE TRI c = 0.70 , d = 0.30 , v = 4
PROMETHEE I q = 0.50 , p = 1.50 , all the functions (usual, linear, and Gaussian) were used.
PROMETHEE II q = 0.50 , p = 1.50 , all the functions (usual, linear, and Gaussian) were used.
Table 10. Scenarios for ELECTRE and PROMETHEE.
ELECTRE
Scenarioscd
Sc. E10.600.40
Sc. E20.650.35
Sc. E30.700.30
Sc. E40.750.25
Sc. E50.800.20
PROMETHEE
Scenariosqp
Sc. P10.11.0
Sc. P20.21.1
Sc. P30.31.2
Sc. P40.41.3
Sc. P50.51.4
Sc. P60.61.5
Sc. P70.71.6
Sc. P80.81.7
Sc. P90.91.8
Sc. P101.01.9
Sc. P111.02.0
Table 11. Reliability and Consistency Statistics for Teacher Ratings Across Virtual Labs.
Friedman’s test with Tukey’s test for nonadditivity
Sum Sq.df χ 2 Sig.
Betw. subj. 166.99421
Intra pop.Betw. items525.80123197.939<0.001
   ResidualsNonadd.19.541111.7920.001
Equil.798.783482
Intraclass Correlation Coefficient (ICC)
ModelICC95% CIF(df1, df2)Sig.
Single measures0.133[0.067, 0.265]F(21, 483) = 4.694<0.001
Average measures0.787[0.634, 0.897]F(21, 483) = 4.694<0.001
Table 12. Impact of teachers’ professional profile on their evaluation of VLs.
Independence χ 2 TestLinear Regressions
Ind. var.Dep. var. χ 2 dfSig. R 2 Stand. a  β tSig.
Educ. levelAlgo_Us18.293 *80.0190.494−0.703 ***−4.415< 0.001
BRVL_Curr23.681 **100.0080.490−0.490 *−2.5120.021
BRVL_Misc14.519 *60.0240.128−0.357−1.7110.103
Phys_Curr26.889 **100.0030.000−0.012−0.0550.957
Phys_Misc23.181 **100.0100.0300.1720.7800.444
Fld std. bPhys_Curr31.287 **150.0080.044−0.210−0.9610.348
Phys_Misc31.463 **150.0080.001−0.028−0.1270.901
Phys. back.Phys_Know25.149 *120.0140.014−0.117−0.5270.604
Phys_Us28.453 *150.0190.255−0.505 *−2.6180.016
Physion_Misc30.152 *150.0110.037−0.193−0.8820.388
a: Standardized; b: Field of Study; *: Significant at 0.05; **: Significant at 0.01; ***: Significant at 0.001.
Table 13. Averaged ratings given by judges for VLs.
VLsCurr. Compl.Know. Build.Misc. Corr.Usability
Algodoo5.27277.36364.81826.6818
BRVL7.59097.27277.72736.7727
LVP5.86367.09095.45457.2273
Physic Virtual lab6.09097.77275.59097.3182
Physion4.72737.40914.68186.8636
Virtual Lab5.54556.77275.36366.9545
Table 14. Results of the Conjoint Analysis.
Weight
Criteria(Importance)ModalitiesUtilitiesStd. ErrorB Coeff.Inversions
in %
Curr. Compl.26.080Compliant−1.9170.211−1.9170
Non-compliant−3.8330.422
Know. Build.24.428Effectively−0.9550.122−0.9552
Partially−1.9090.243
Not at all−2.8640.365
Misc. corr.28.795Effectively−0.8330.122−0.8331
Partially−1.6670.243
Not at all−2.5000.365
Usability20.696Very easy−0.7580.122−0.7580
Easy−1.5150.243
Difficult−2.2730.365
Constant 4.8830.586
ValueSign.
Pearson’s coefficient r0.991<0.001
Kendall’s tau ( τ )0.889<0.001
Table 15. Decision table.
CriteriaCurr. Compl.Know. Build.Misc. Corr.Usability
Weights0.260800.244280.287950.20696
Algodoo5.27277.36364.81826.6818
BRVL7.59097.27277.72736.7727
LVP5.86367.09095.45457.2273
Physic Virtual lab6.09097.77275.59097.3182
Physion4.72737.40914.68186.8636
Virtual Lab5.54556.77275.36366.9545
Table 16. Evaluation of Virtual Labs using MCDA methods.
Physics VLsAHPCAHPTOPSISELECTRE IELECTRE IIELECTRE TRIPROME-THEEPROME-THEEPROME-THEE
(Rank) (Rank) (Rank) (Core) (Rank) (Category) I * (Core) I ** (Core) II *** (Rank)
Algodoo555No5LowNoNo5
BRVL111Yes1HighYesYes1
LVP333No3MediumNoNo3
Physic Virtual lab222Yes2MediumYesNo2
Physion666No6LowNoNo6
Virtual Lab444No4LowNoNo4
* With usual and Gaussian functions; ** With linear function; *** With all functions.
Disclaimer/Publisher’s Note: The statements, opinions and data contained in all publications are solely those of the individual author(s) and contributor(s) and not of MDPI and/or the editor(s). MDPI and/or the editor(s) disclaim responsibility for any injury to people or property resulting from any ideas, methods, instructions or products referred to in the content.

