Article

A Map Information Collection Tool for a Pedestrian Navigation System Using Smartphone

by
Kadek Suarjuna Batubulan
1,
Nobuo Funabiki
1,*,
Komang Candra Brata
1,2,
I Nyoman Darma Kotama
1,
Htoo Htoo Sandi Kyaw
1 and
Shintami Chusnul Hidayati
3
1
Graduate School of Natural Science and Technology, Okayama University, Okayama 700-8530, Japan
2
Department of Informatics Engineering, Universitas Brawijaya, Malang 65145, Indonesia
3
Department of Informatics, Institut Teknologi Sepuluh Nopember, Surabaya 60111, Indonesia
*
Author to whom correspondence should be addressed.
Information 2025, 16(7), 588; https://doi.org/10.3390/info16070588
Submission received: 14 May 2025 / Revised: 15 June 2025 / Accepted: 3 July 2025 / Published: 8 July 2025
(This article belongs to the Special Issue Feature Papers in Information in 2024–2025)

Abstract

Nowadays, a pedestrian navigation system using a smartphone has become popular as a useful tool to reach an unknown destination. When the destination is the office of a person, a detailed map information is necessary on the target area such as the room number and location inside the building. The information can be collected from various sources including Google maps, websites for the building, and images of signs. In this paper, we propose a map information collection tool for a pedestrian navigation system. To improve the accuracy and completeness of information, it works with the four steps: (1) a user captures building and room images manually, (2) an OCR software using Google ML Kit v2 processes them to extract the sign information from images, (3) web scraping using Scrapy (v2.11.0) and crawling with Apache Nutch (v1.19) software collects additional details such as room numbers, facilities, and occupants from relevant websites, and (4) the collected data is stored in the database to be integrated with a pedestrian navigation system. For evaluations of the proposed tool, the map information was collected for 10 buildings at Okayama University, Japan, a representative environment combining complex indoor layouts (e.g., interconnected corridors, multi-floor facilities) and high pedestrian traffic, which are critical for testing real-world navigation challenges. The collected data is assessed in completeness and effectiveness. A university campus was selected as it presents a complex indoor and outdoor environment that can be ideal for testing pedestrian navigations in real-world scenarios. With the obtained map information, 10 users used the navigation system to successfully reach destinations. The System Usability Scale (SUS) results through a questionnaire confirms the high usability.

1. Introduction

Nowadays, a smartphone has become an essential tool in our daily lives. Among various applications of a smartphone, a navigation system has been widely used around the world. The popularity of a smartphone-based navigation system stems from its convenience in guiding a user to the desired destination on foot, driving, or using other transportations [1]. Unlike conventional paper-based maps, a smartphone-based navigation system provides real-time updates, location awareness, and personalized routing, making it a reliable assistant in unfamiliar environments. This system is especially beneficial in urban environments, large campuses, and complicated buildings, where if unfamiliar with the region, a pedestrian may struggle to find his/her specific location without it [2,3].
In order to give appropriate and thorough instructions to a user, a navigation system needs up-to-dated, comprehensive map data of the target area. They may include room numbers, room owners, floor plans, facility names, and locations of organizations or sections [4]. With the correct detailed map information, the system is allowed to give the precise and accurate navigation to a destination in a building [5,6].
However, conventional digital maps and navigation databases do not provide the necessary detailed information [7,8]. They need to be collected from a variety of sources, such as institutional websites or building directories [9]. They should be combined with building geolocation data that is available via a smartphone, and can provide additional data to enrich map information to support smart pedestrian navigations [10].
In this paper, we propose a map information collection tool, specifically, designed to support a pedestrian navigation system using a smartphone. It can improve the accuracy and comprehensiveness of map information in internal building contexts where the whole information is not obtained from conventional digital maps and navigation databases currently in use [11].
The proposed tool works through the following four steps. (1) A camera on a smartphone is used to take pictures of rooms and buildings. (2) Optical Character Recognition (OCR) software is used to process the acquired photos and automatically extract text characters that can be used as a reference to locate map information [12,13,14]. (3) web scraping and crawling techniques are incorporated to automatically extract additional data such as detailed room layouts, facility locations, and information about building occupants from publicly available websites to improve the accuracy and completeness of information collected [15,16]. (4) The collected data is systematically stored in a centralized database of the tool, which is designed to be integrated with a pedestrian navigation system to access accurate and comprehensive map information in real time.
For evaluations of the proposed tool, we conducted a series of experiments of collecting map information from 10 buildings at Okayama University, Japan [17]. The completeness of the data in terms of room and building names, numbers of floors, occupants, and other internal building information is evaluated along with effectiveness in supporting accurate navigations to users. Completeness refers to how well the system captures all the relevant details, while effectiveness evaluates how accurately and reliably the system supports the navigation tasks within these buildings.
In addition, we conducted pedestrian navigation experiments to assess the navigation system using the collected map information. 10 participants used the system to be navigated to their destinations inside the campus. After participants reached destinations, they were asked to complete a questionnaire for the System Usability Scale (SUS) evaluation [18]. The results of the SUS scores confirmed that the navigation system could successfully navigate the users to their destinations. They highly rated ease of use, accuracy, and overall satisfactions with the navigation process. Based on the limitations identified in the literature (e.g., reliance on static infrastructure [19,20], incomplete map data [7,8], and lack of scalable indoor navigation solutions [21,22], this study addresses the following research questions.
  • Data collection efficiency: How can spatial map information be efficiently collected using the smartphone-based OCR and the web crawling technique, overcoming the limitations of manual inputs and proprietary datasets (e.g., LiDAR/BIM [23,24])?
  • Usability in real-world settings: How intuitive and effective is the system for novice users navigating in complex indoor environments, particularly where GPS or pre-mapped data are unavailable (e.g., non-intuitive corridors)?
  • Data quality assurance: How can the accuracy and completeness of the automatically collected map data (e.g., room numbers and occupant details) be validated and maintained, given inconsistencies in signage and web sources?
The above questions guide our methodology Figure 1 and evaluations Section 5 and Section 6.
The rest of this paper is organized as follows: Section 2 presents works related to this paper. Section 3 introduces tools adopted within the proposed tool. Section 4 and Section 5 present the design and the implementation, respectively, of the map information collection tool. Section 6 discusses the evaluation results. Finally, Section 7 concludes this paper with future works.

2. Related Works

In this section, we introduce relevant works in literature.

2.1. Pedestrian Navigation System

Various studies have been conducted on pedestrian navigation systems. Several of them focused on positioning methods suitable for indoor environments where GPS performs poorly due to signal obstruction [21]. For instance, Triyono et al. [25] utilized RSSI fingerprinting for indoor positioning, which works well in static conditions but suffers in dynamic settings. Other approaches explored sensor fusion and hybrid systems. Khairi et al. [22] investigated the use of BLE, Wi-Fi, and UWB, though their system was tailored for rehabilitation contexts and lacked real-time navigation features. Similarly, Leitch et al. [19] conducted a comparative study using WiFi, BLE, UWB, and IMU technologies, concluding that BLE and PDR can be effective with significant calibration efforts. Jin et al. [26] attempted to reduce PDR drift by combining BLE beacons with pedestrian dead reckoning, but their system required personalized tuning. Gang et al. [27] proposed a hybrid system using geomagnetic fields and motion sensors, which relies on 3D models not always available in practice. Other researchers incorporated navigation algorithms such as Dijkstra’s with Augmented Reality (AR) [28], or used Bluetooth low energy (BLE) beacons for pathfinding. Recent works have also explored semantic and AR-based navigation. Rubio et al. [29] proposed integrating AR and semantic web technologies using QR codes and contextual information, while Bibbò et al. [20] combined AR with static markers. However, these systems are less adaptable in unstructured environments. In contrast, our approach avoids static infrastructure and enables more flexible navigation using Wi-Fi signal strength, inertial sensors, and OCR-based visual cues.

2.2. Map Information Collection

Map information collection has been widely studied with various technologies. LiDAR-based indoor mapping has demonstrated high accuracy for capturing building interiors and integrating visual markers such as autoTags [23]. Another approach integrated Building Information Modeling (BIM) with AR for construction navigations, though it relies on proprietary data that is not always publicly available [24]. Ultra-Wideband (UWB) systems offer excellent precisions, but their dependency on dedicated infrastructure limits scalability [30]. In contrast, our method leverages crowdsourced, vision-based data collection using smartphones. Previous OCR implementations have focused on document digitization [21], while others, such as Pivavaruk et al. [31], applied OCR to room-level indoor navigation without relying on wireless signals, although constrained by signage consistency. Wu et al. [32] developed an OCR-RTPS system that identifies parking positions using OCR, demonstrating the technology’s potential in real-time positioning without GPS. To complement OCR data, AI-enhanced web scraping techniques have also been proposed. Weerasinghe et al. [33] emphasized structured data collection through scraping but did not apply it to navigation. Brenning et al. [34] and Hernandez et al. [35] showed that web scraping and spatial overlays are valuable for gathering geographic data from online sources. These studies validate the effectiveness of automated web data collection, which our work extends into the pedestrian navigation context.

3. Adopted Technologies

In this section, we discuss adopted software and technologies in the proposed map information collection tool.

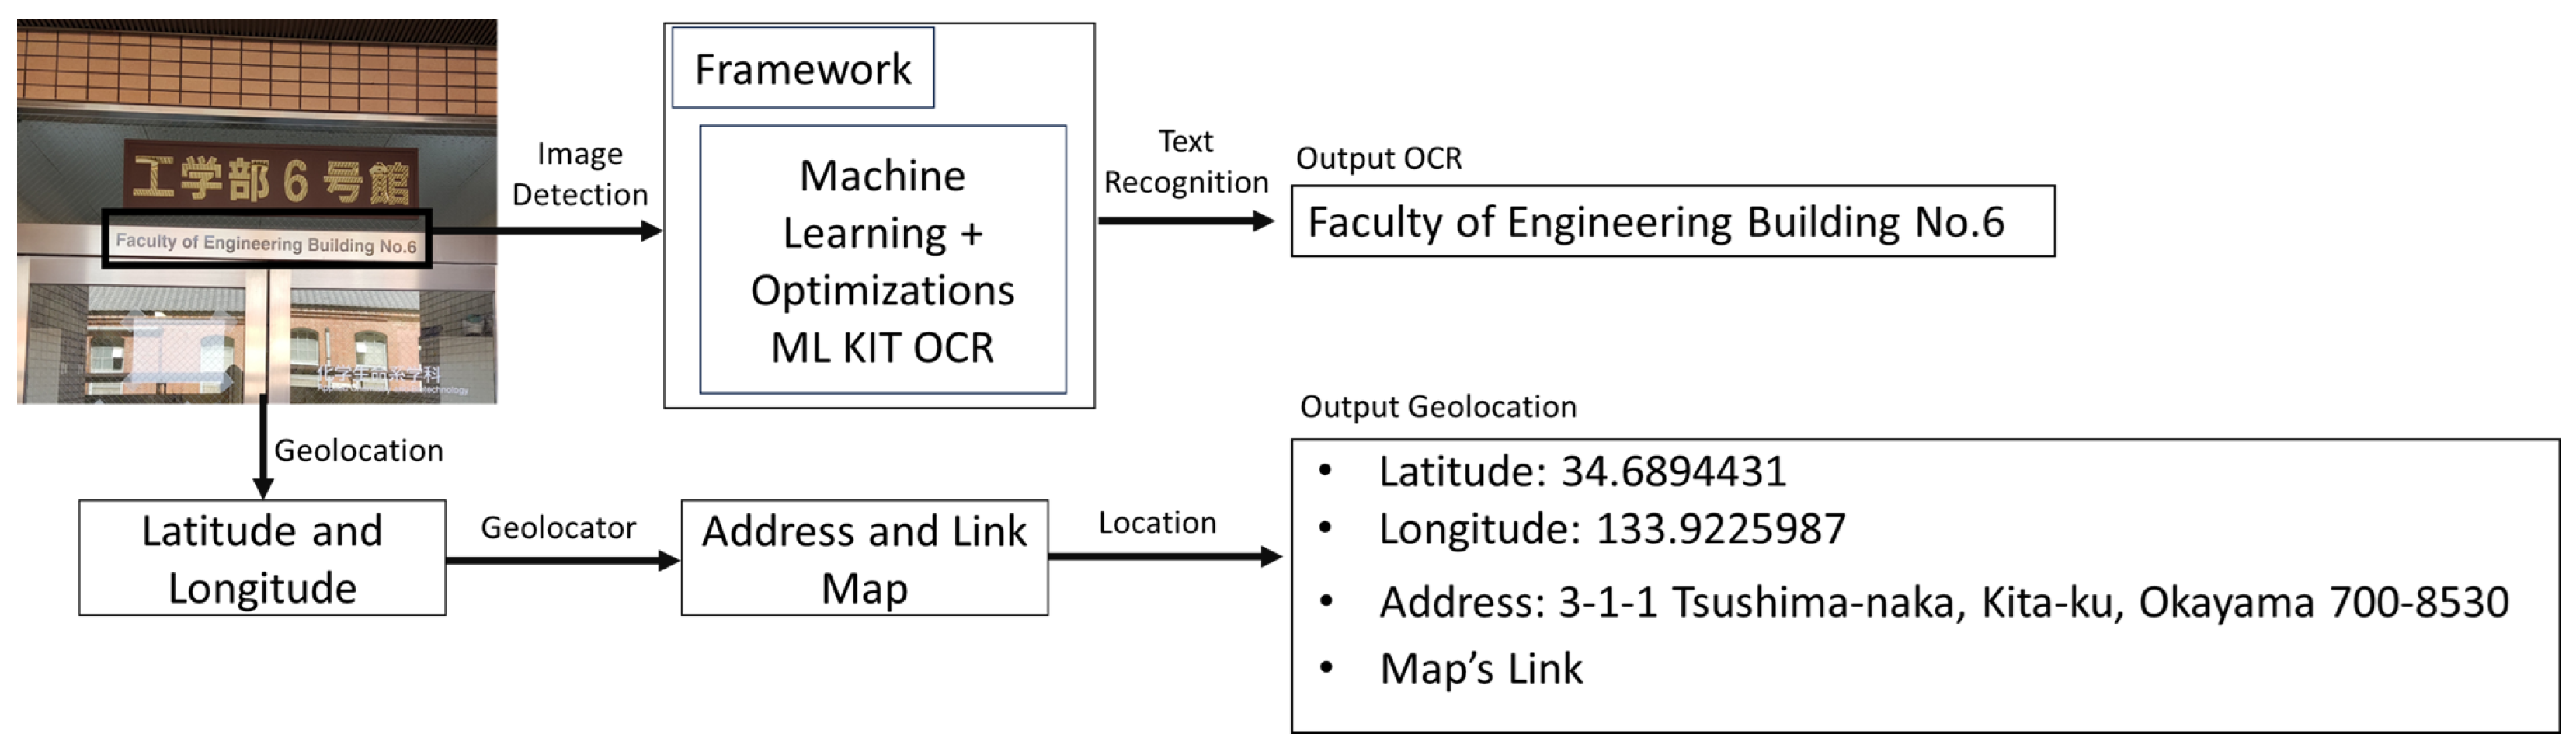
3.1. ML Kit for OCR and Geolocation for Data Collection

The Optical Character Recognition (OCR) tool of Google ML Kit v2 [36] is adopted. Google ML Kit v2 provides lightweight, real-time text recognition capabilities that can be easily integrated into Android smartphone applications [37]. This tool enables detections and extractions of texts directly from cameras, specifically targeting building names, room numbers, and occupant names displayed on physical signs.
In parallel with text recognitions, our tool captures the latitude, longitude, and address information by using the smartphone’s built-in geolocation service [38]. The text data and the location data are combined into one data record and will be sent to the database. The tool generates contextualized, real-time datasets that support the efficient and accurate creation of the internal building information map. Figure 2 shows the workflow for data collections.

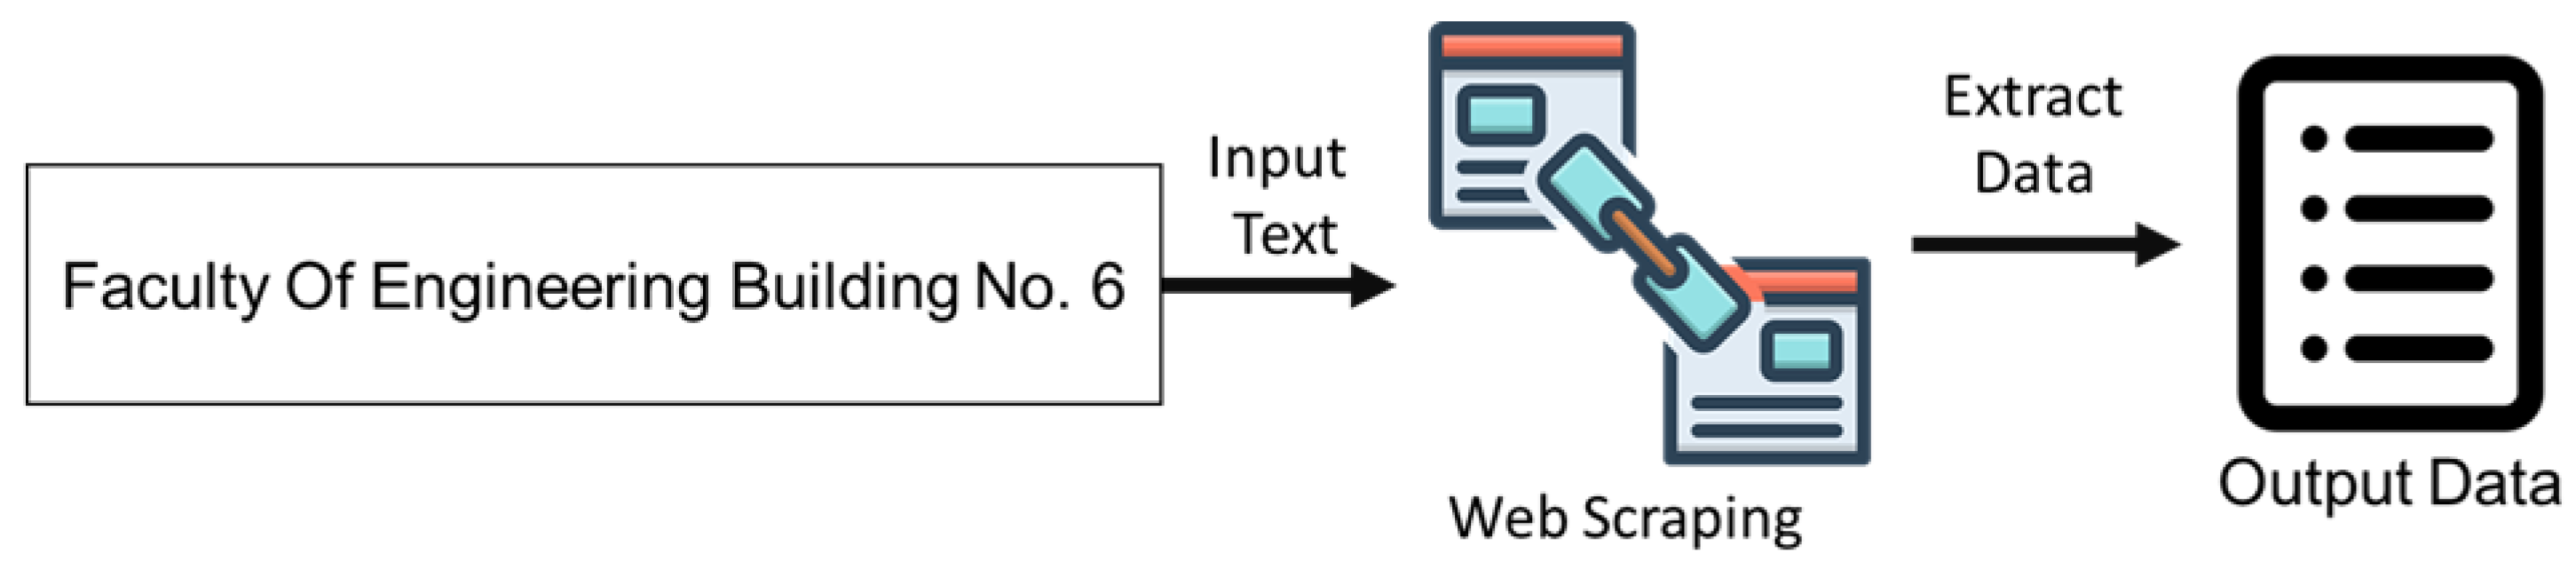
3.2. Web Scraping with Scrapy Framework

The tool will retrieve additional contextual information through web scraping using Scrapy framework from the text recognized by OCR. This step aims to collect relevant data from websites, such as building detailed information and residence information [39]. By cross-referencing the extracted text with publicly available online sources, it improves the accuracy and completeness of the collected information [40].
The resulting data, once verified and collated, is integrated into the database, will contribute to a more comprehensive and detailed internal map data set. Figure 3 shows the Scrapy framework for web scraping from an OCR recognized text and a smartphone geolocation.

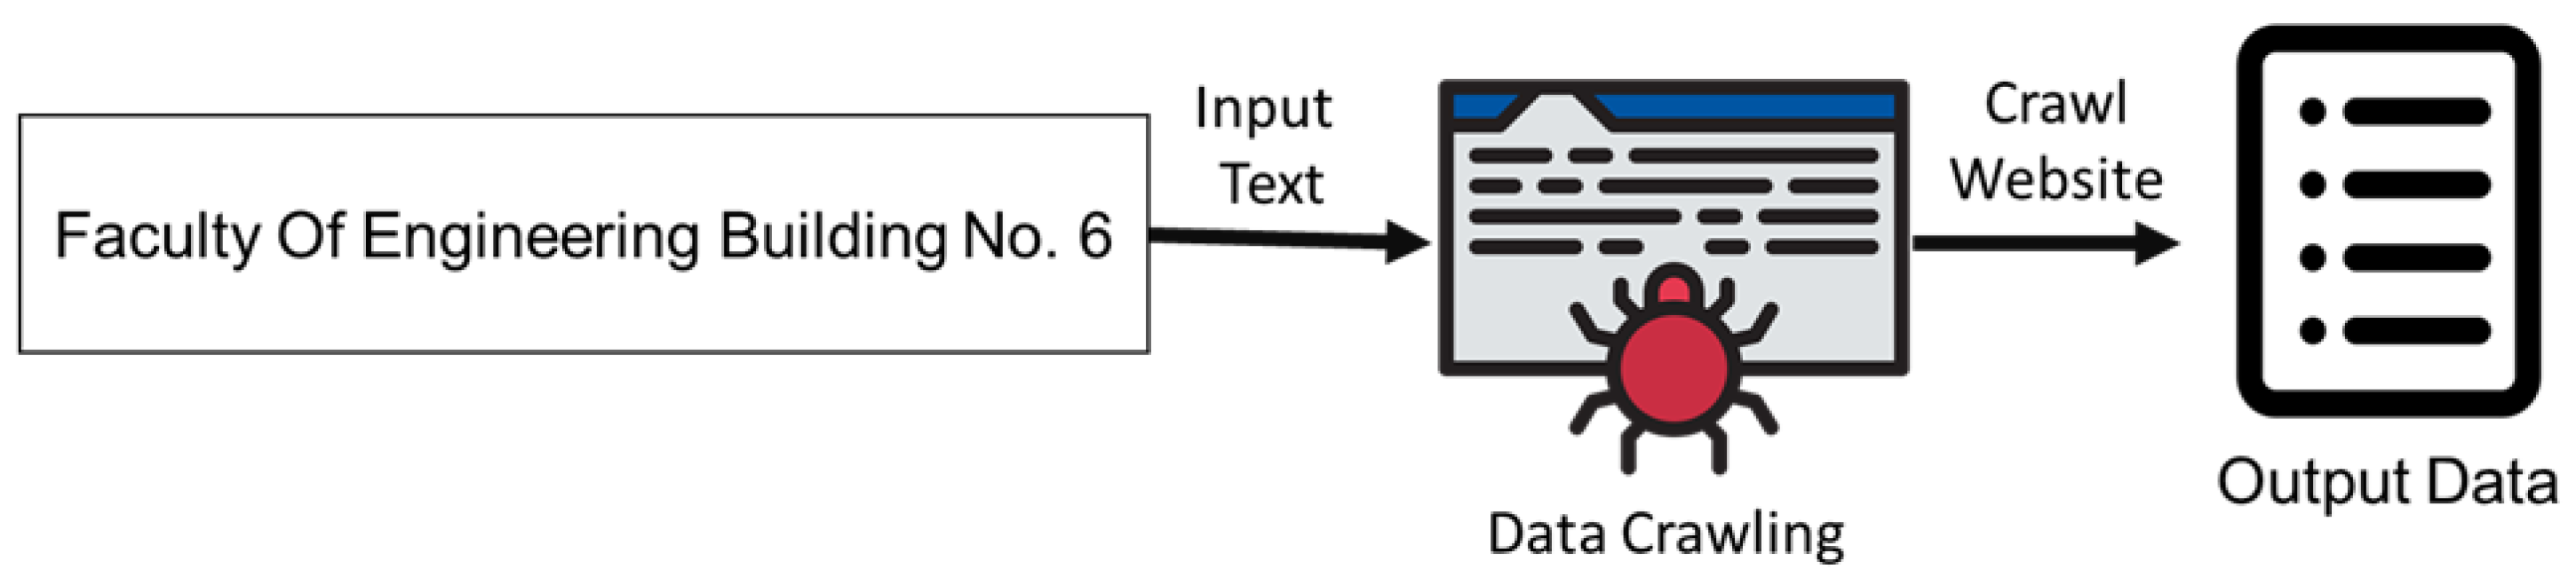
3.3. Data Crawling with Apache Nutch

To collect as much information as possible, the tool uses a crawling process through OCR scanning. The text recognized by OCR is used as the input to automatically search for additional information from online sources. To efficiently navigate the search through multiple web pages and dynamically retrieve relevant contents, the tool employs a crawler engine called Apache Nutch [41]. It collects complementary data such as building functions, sections, or occupant details. This additional information enhances the completeness and accuracy of the collected dataset.
Once extracted, the data is filtered, collated, and stored in the database along with the OCR, geolocation, and web scraping data. Figure 4 shows the crawling mechanism for extracting complementary information from online sources.

4. Design of the Map Information Collection Tool
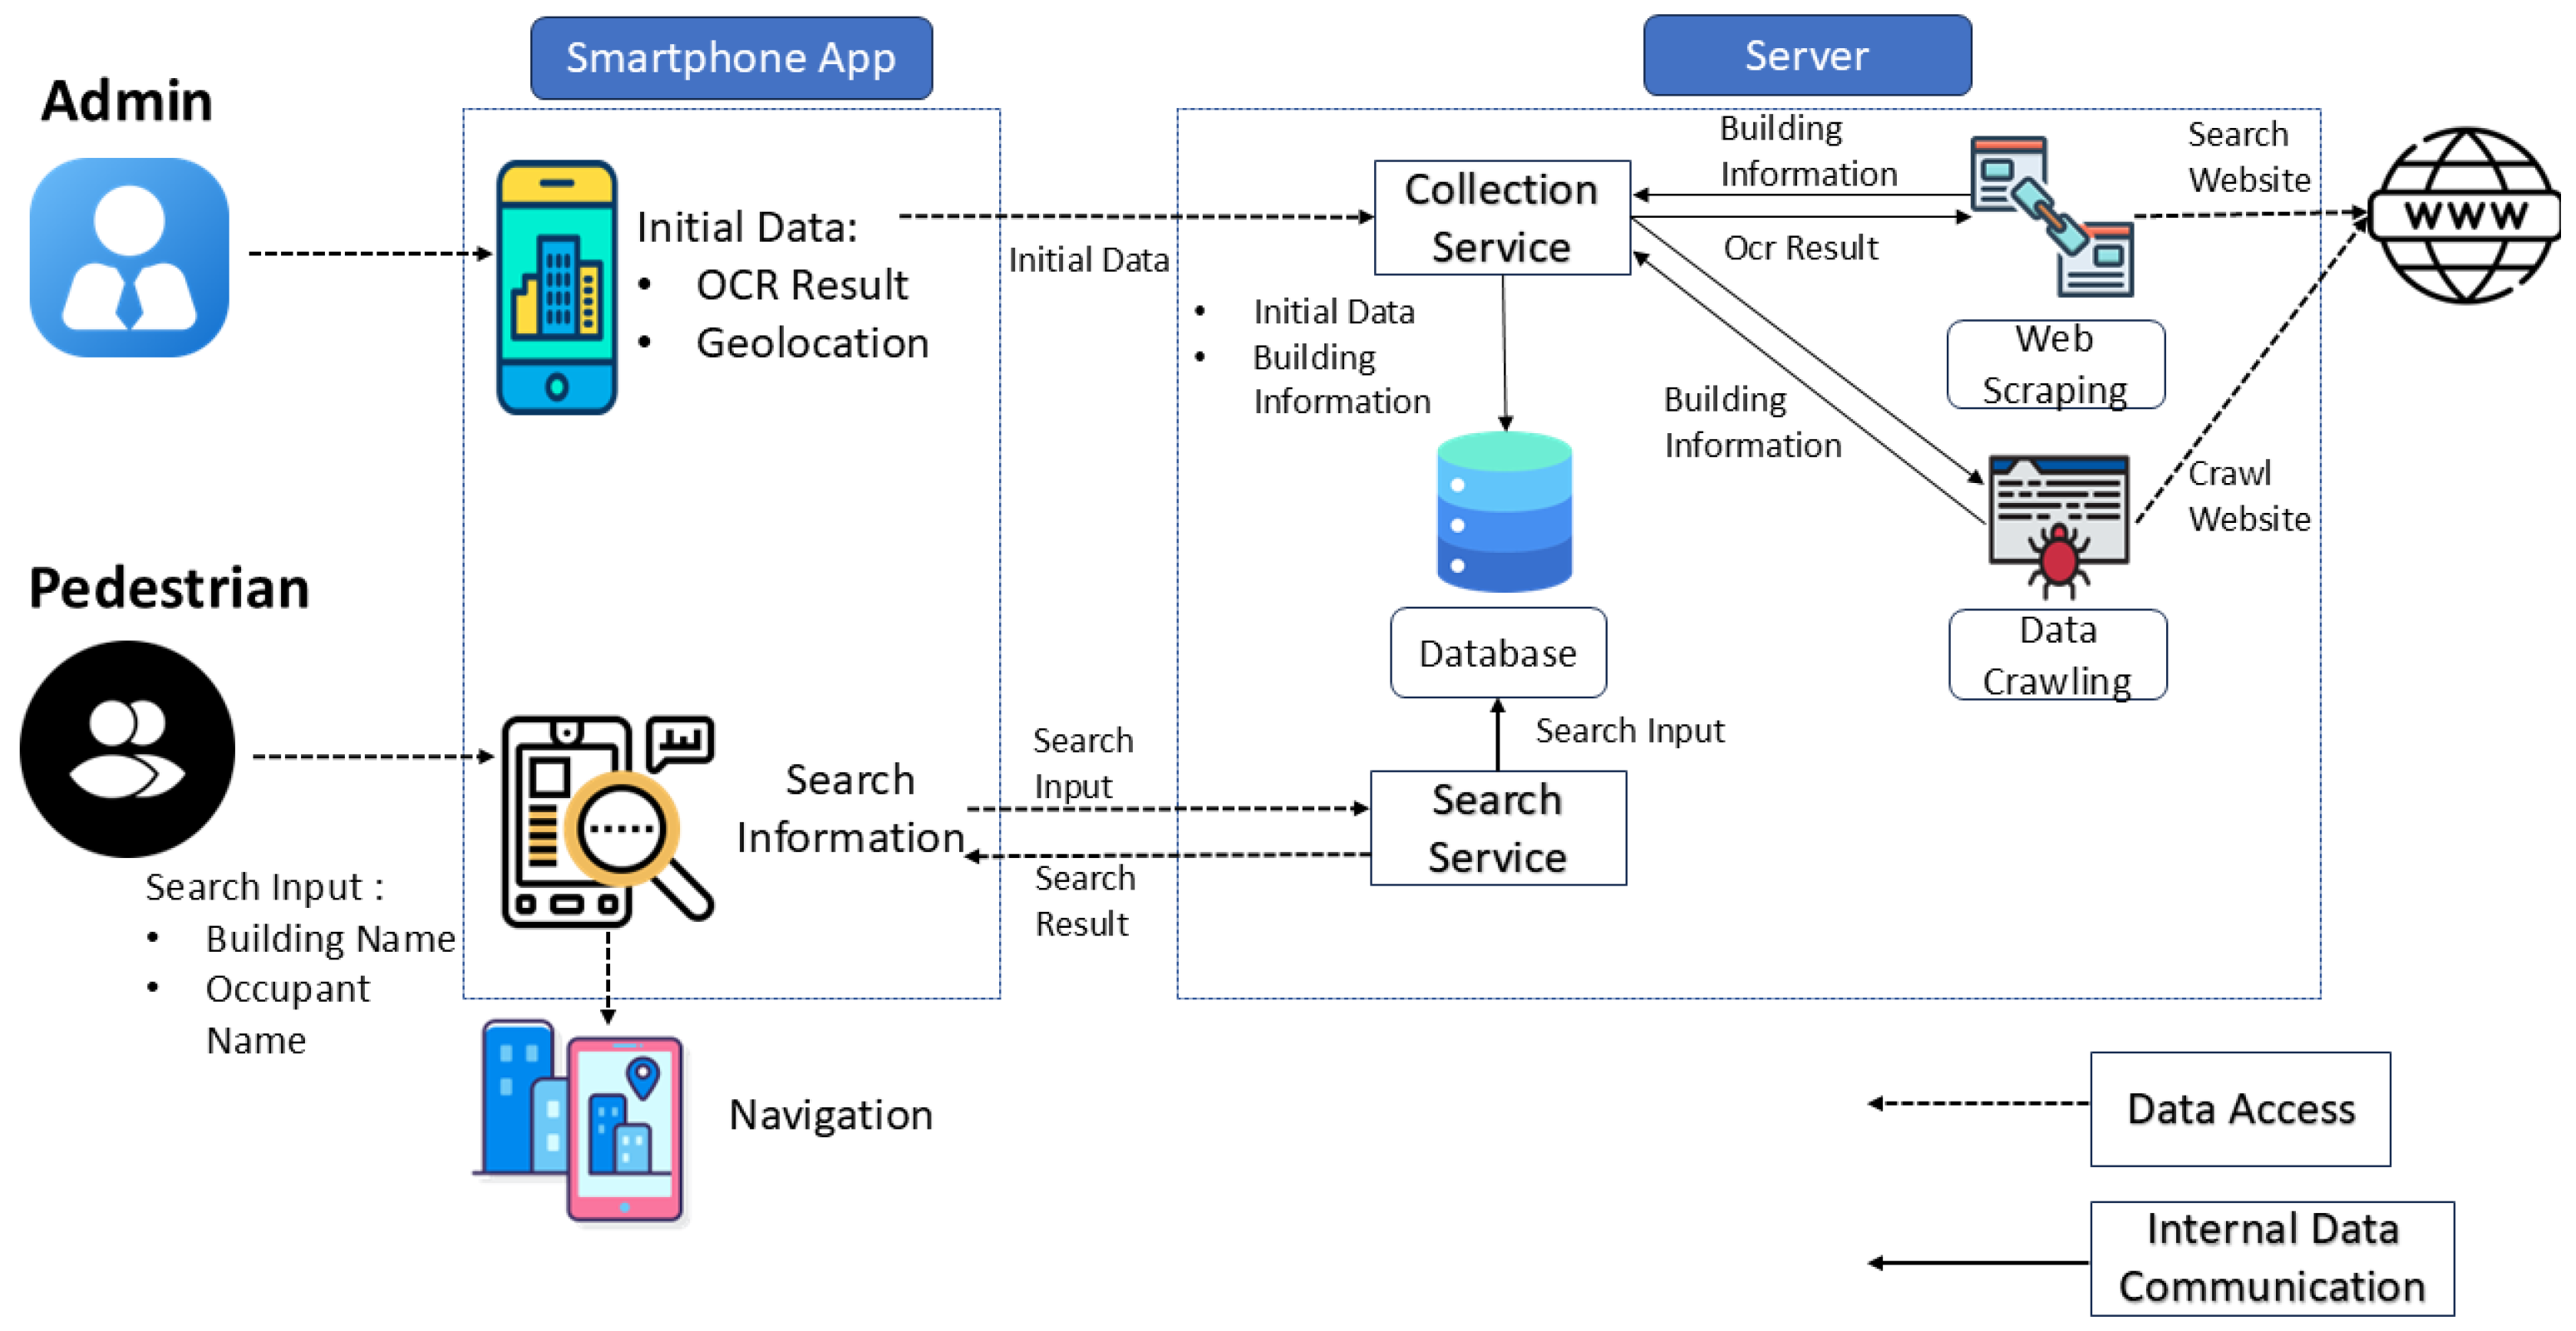
In this section, we present the design of the map information collection tool.

4.1. Tool Overview

The proposed tool collects and integrates detailed internal map information for a pedestrian navigation system, supporting users in navigating complex internal building environments including university campuses. The tool autonomously gathers spatial data through user-driven data collection actions combined with intelligent data enrichment applications.
The tool consists of two main components: a smartphone and a server. Figure 5 shows the design with two components.
On a smartphone, the tool allows an admin user to collect initial data such as OCR results and geolocation. These data are transmitted to the server. On the server, the data is first processed by the collection service, which stores the information in the database.
To complete the dataset, the server further performs web scraping and data crawling to extract additional building-related information from online sources. A tool user can search and interact with the information, such as building names, room numbers, and residence names. The requests are handled by the search service on the server. It accesses the database to retrieve and return the relevant information. Once the search results are displayed, a user can use the app to navigate to the selected building or location.

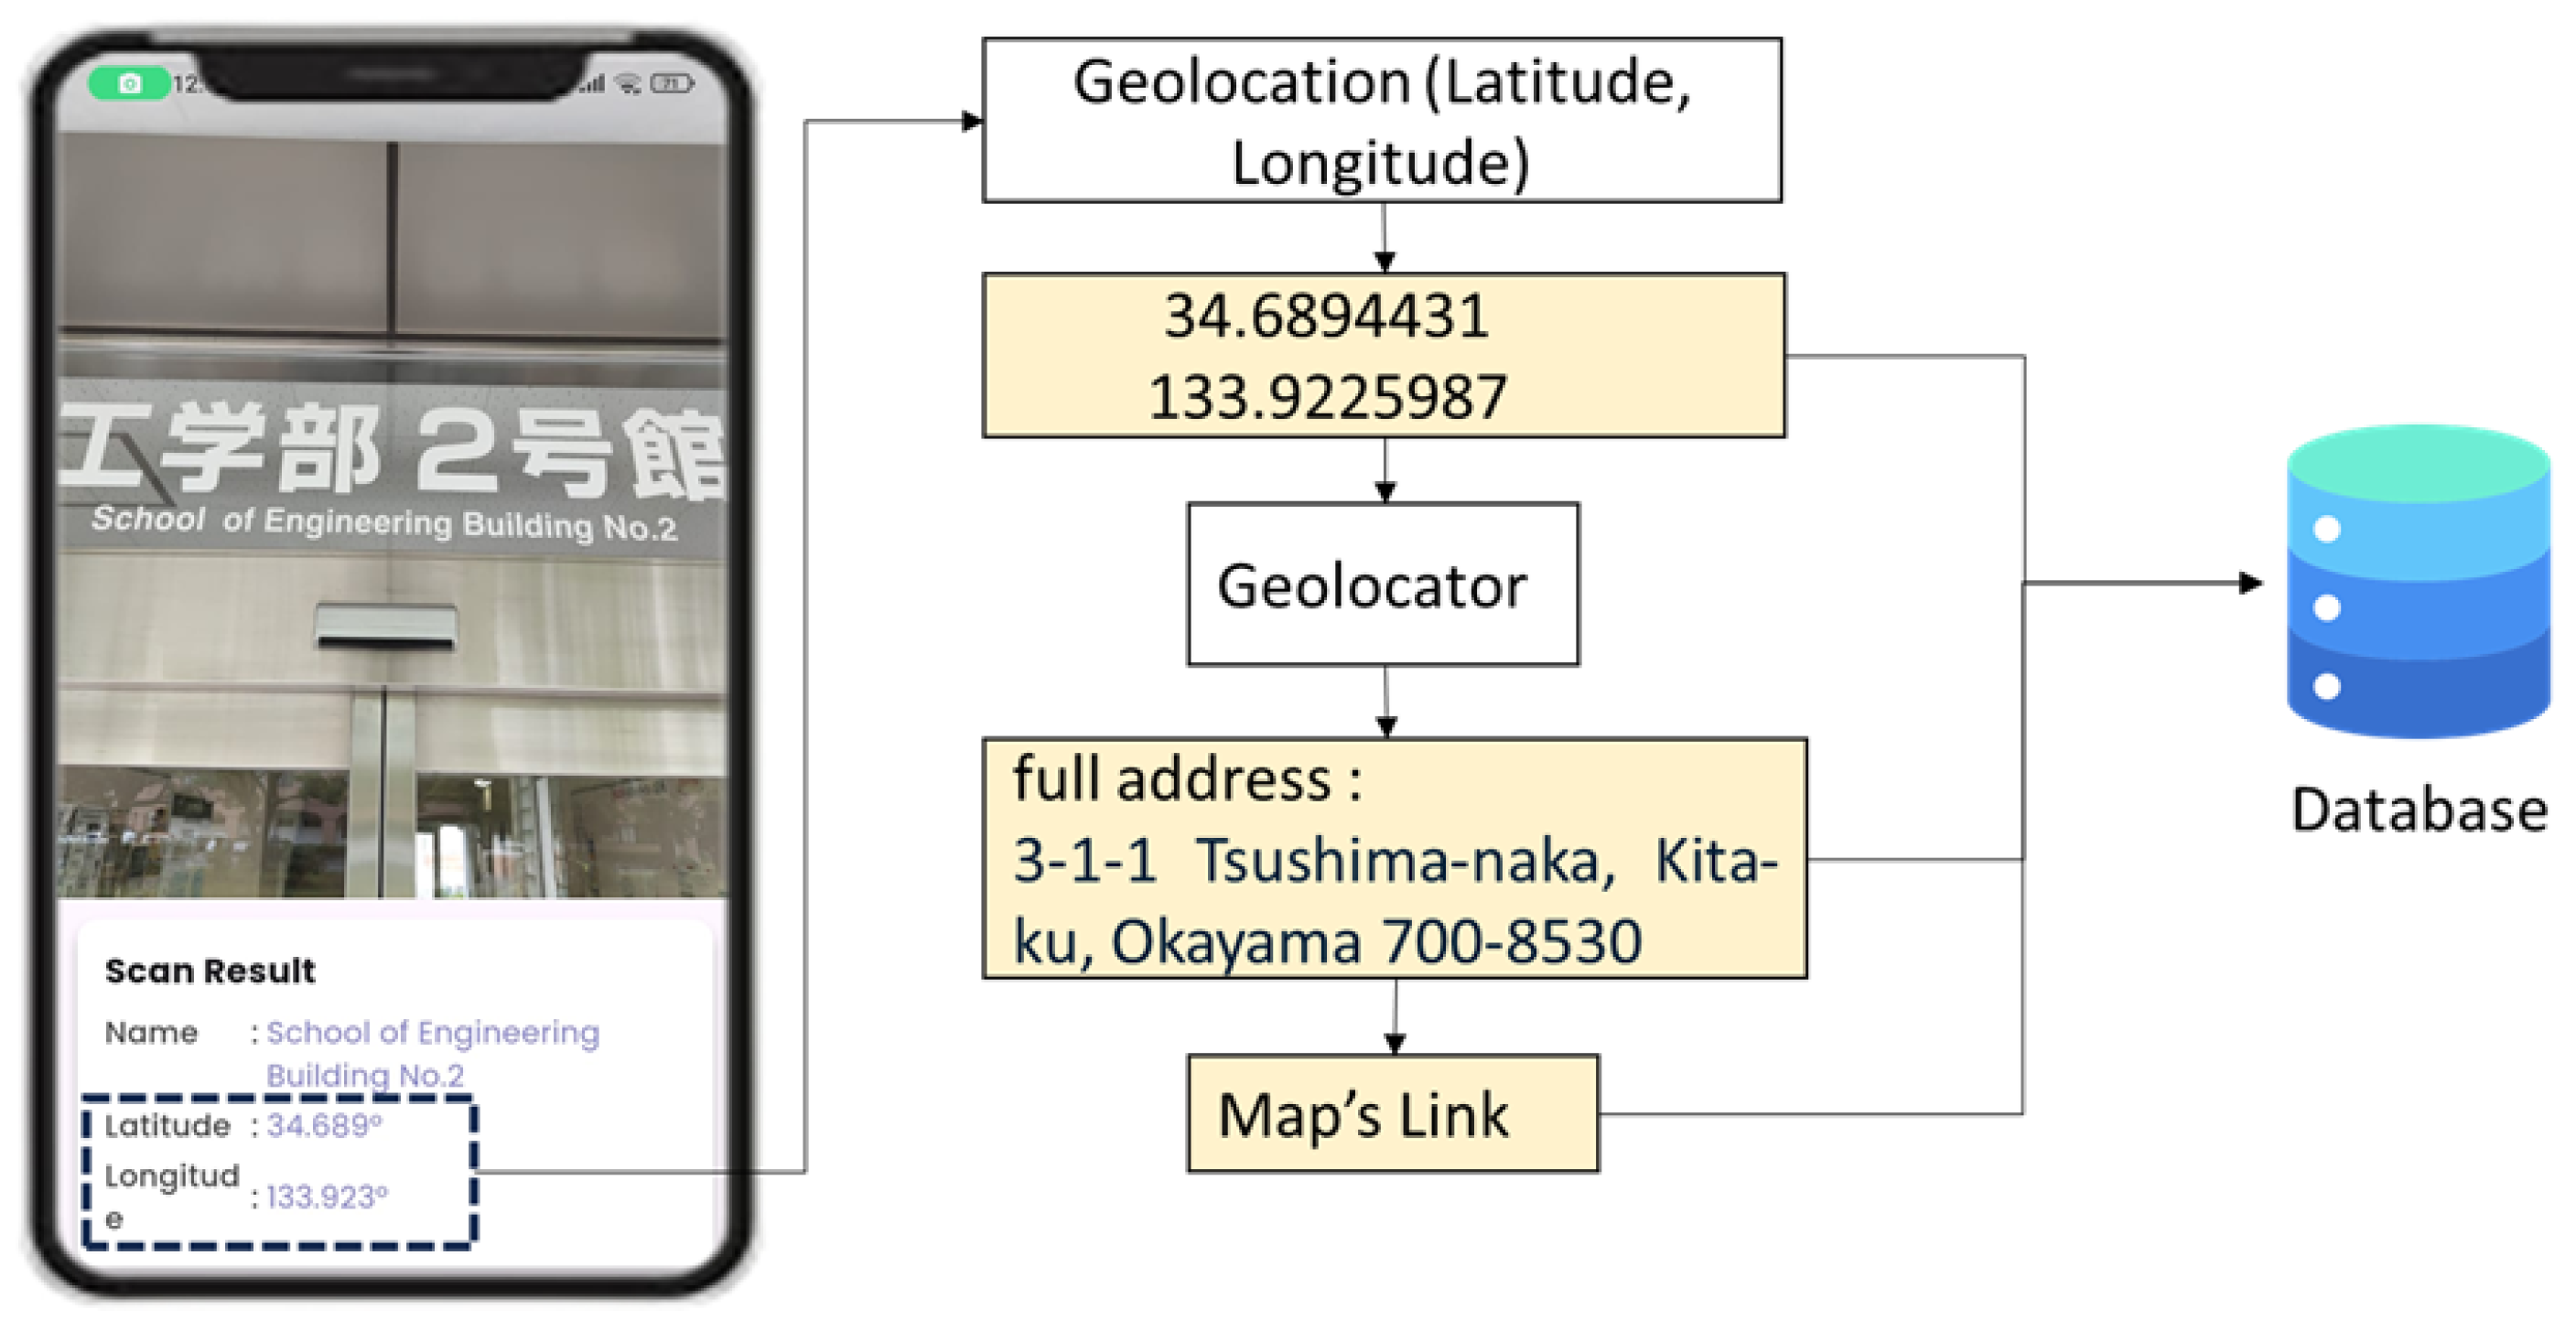
4.2. Image Capture and Geolocation Integration

First, an admin user needs to take photos of buildings and rooms to collect relevant visual information using a smartphone. The smartphone also records metadata such as latitude and longitude, addresses, and maps, which are embedded into the image files. Figure 6 shows the process of taking a photo and finding the geolocation information. The data will be sent to the database.

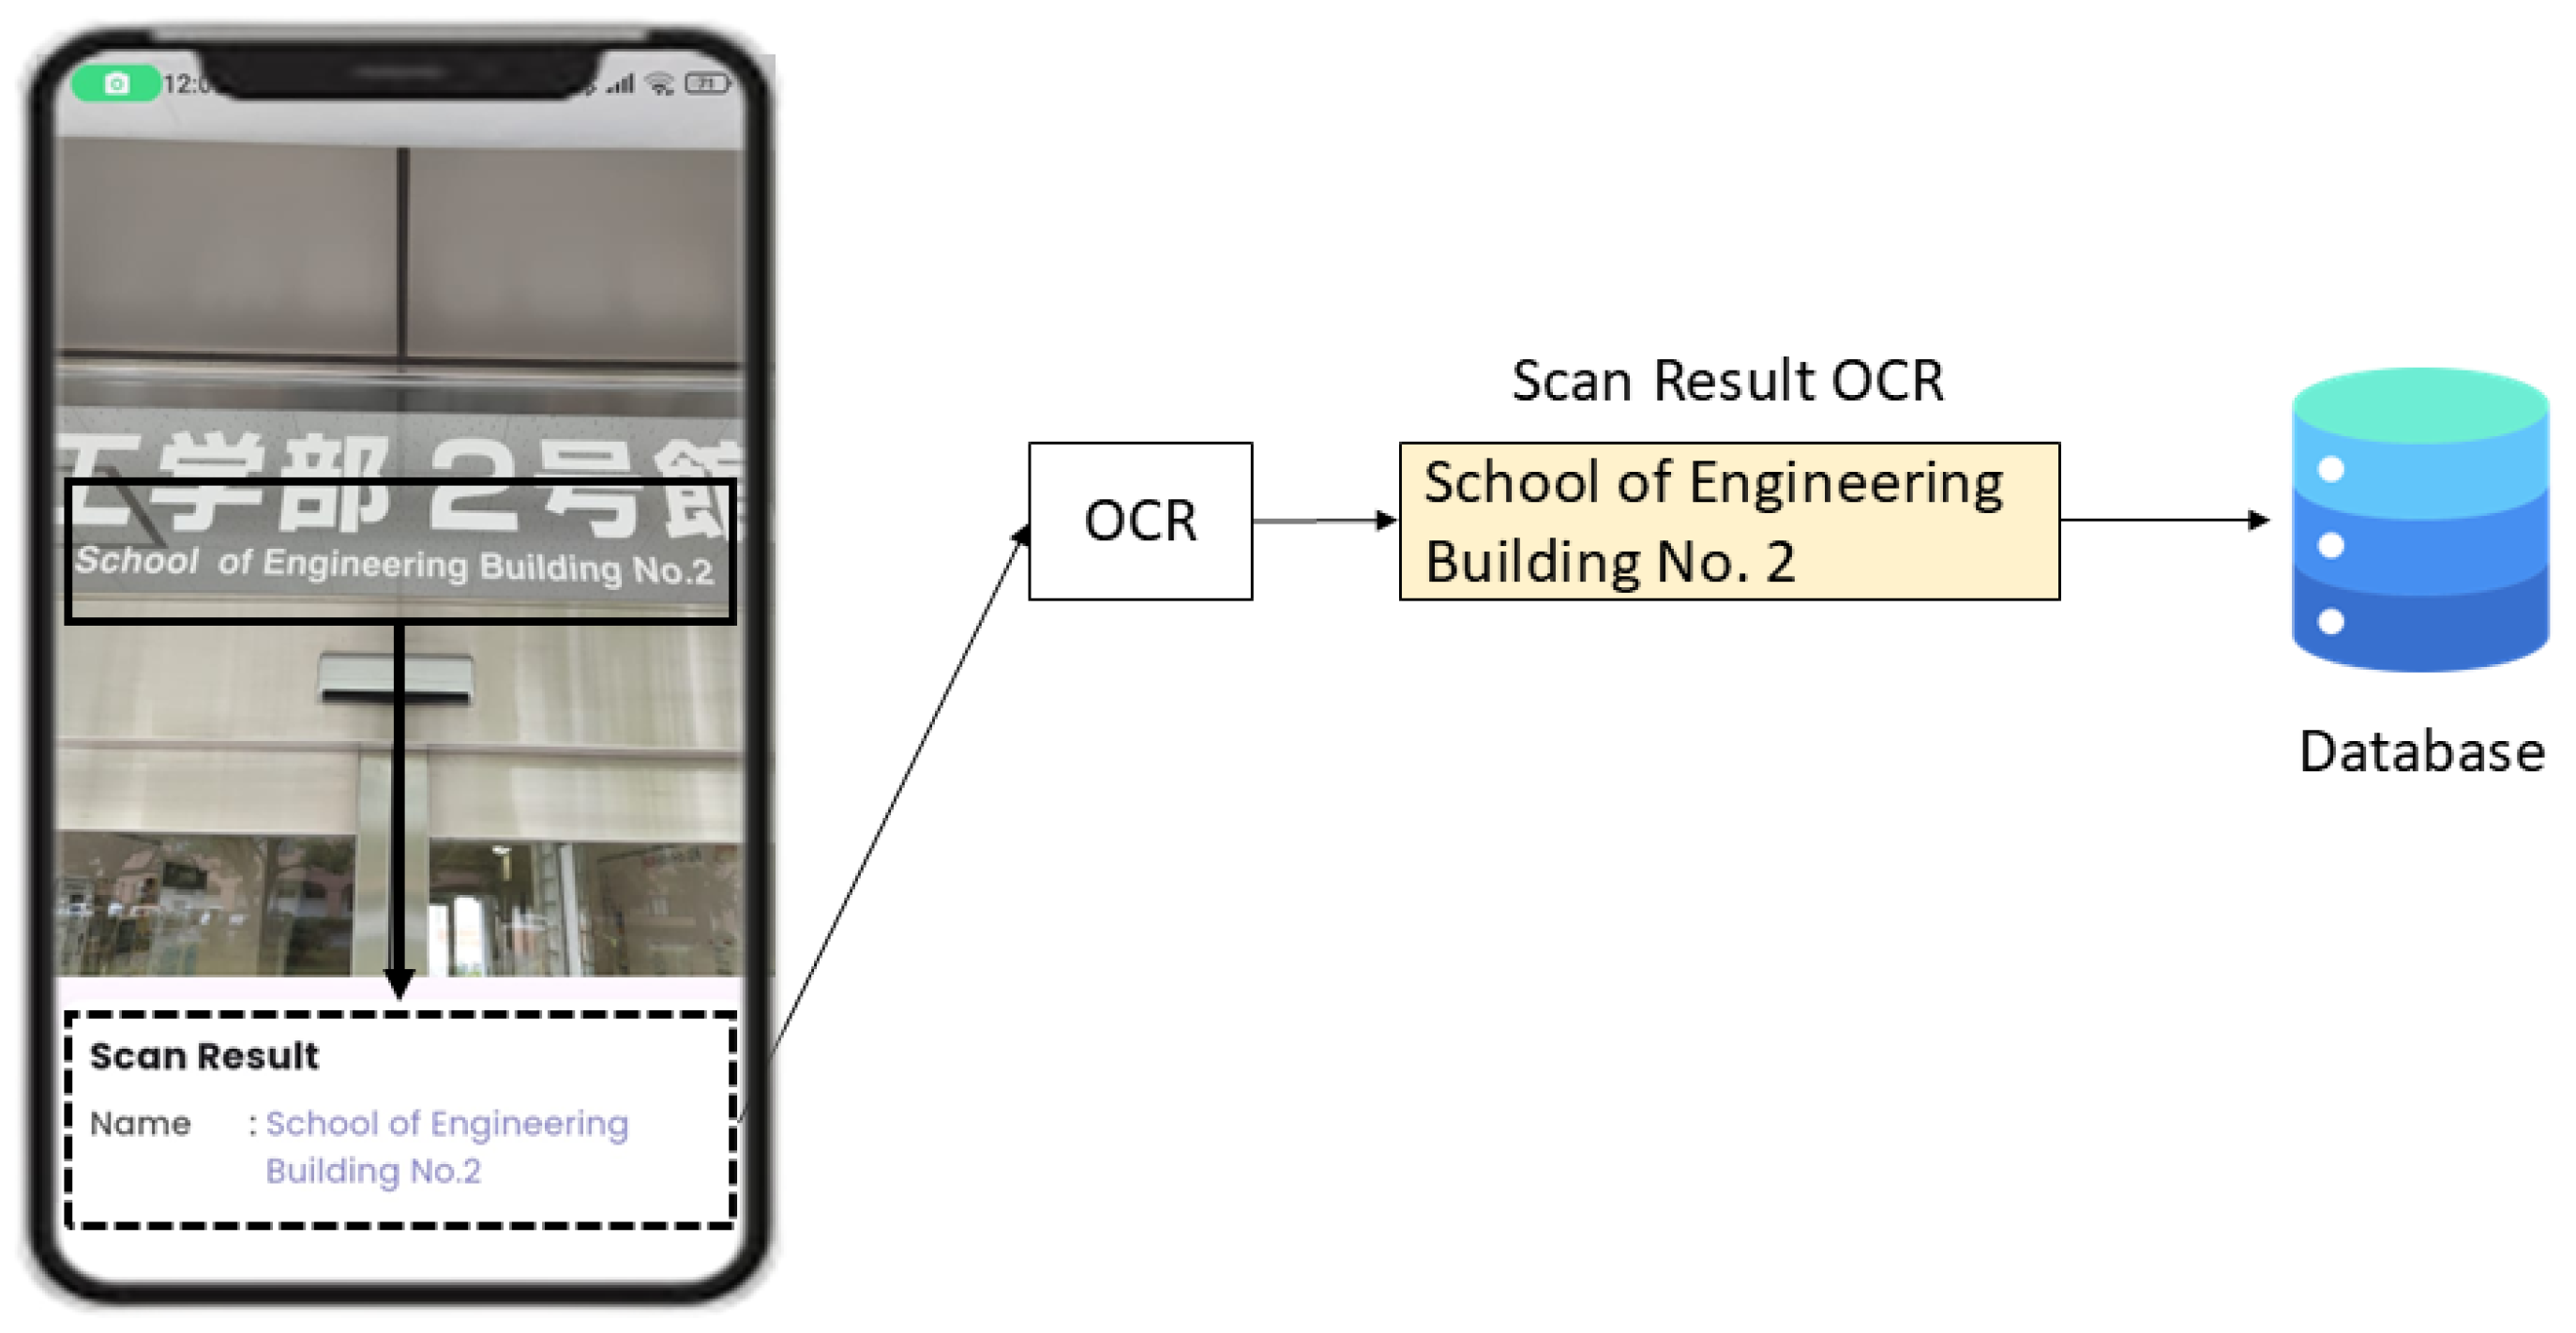
4.3. Text Extraction Using OCR

Next, the optical character recognition (OCR) within Google ML KIT v2 is used to extract texts from photos. The textual information is used for identifying rooms and facilities in the building.
The collected data including photos, texts, and geolocations are transmitted to the server and stored in the database. Figure 7 shows the process of extracting the text, School of Engineering, Building No. 2, using OCR, and sending it to a database.

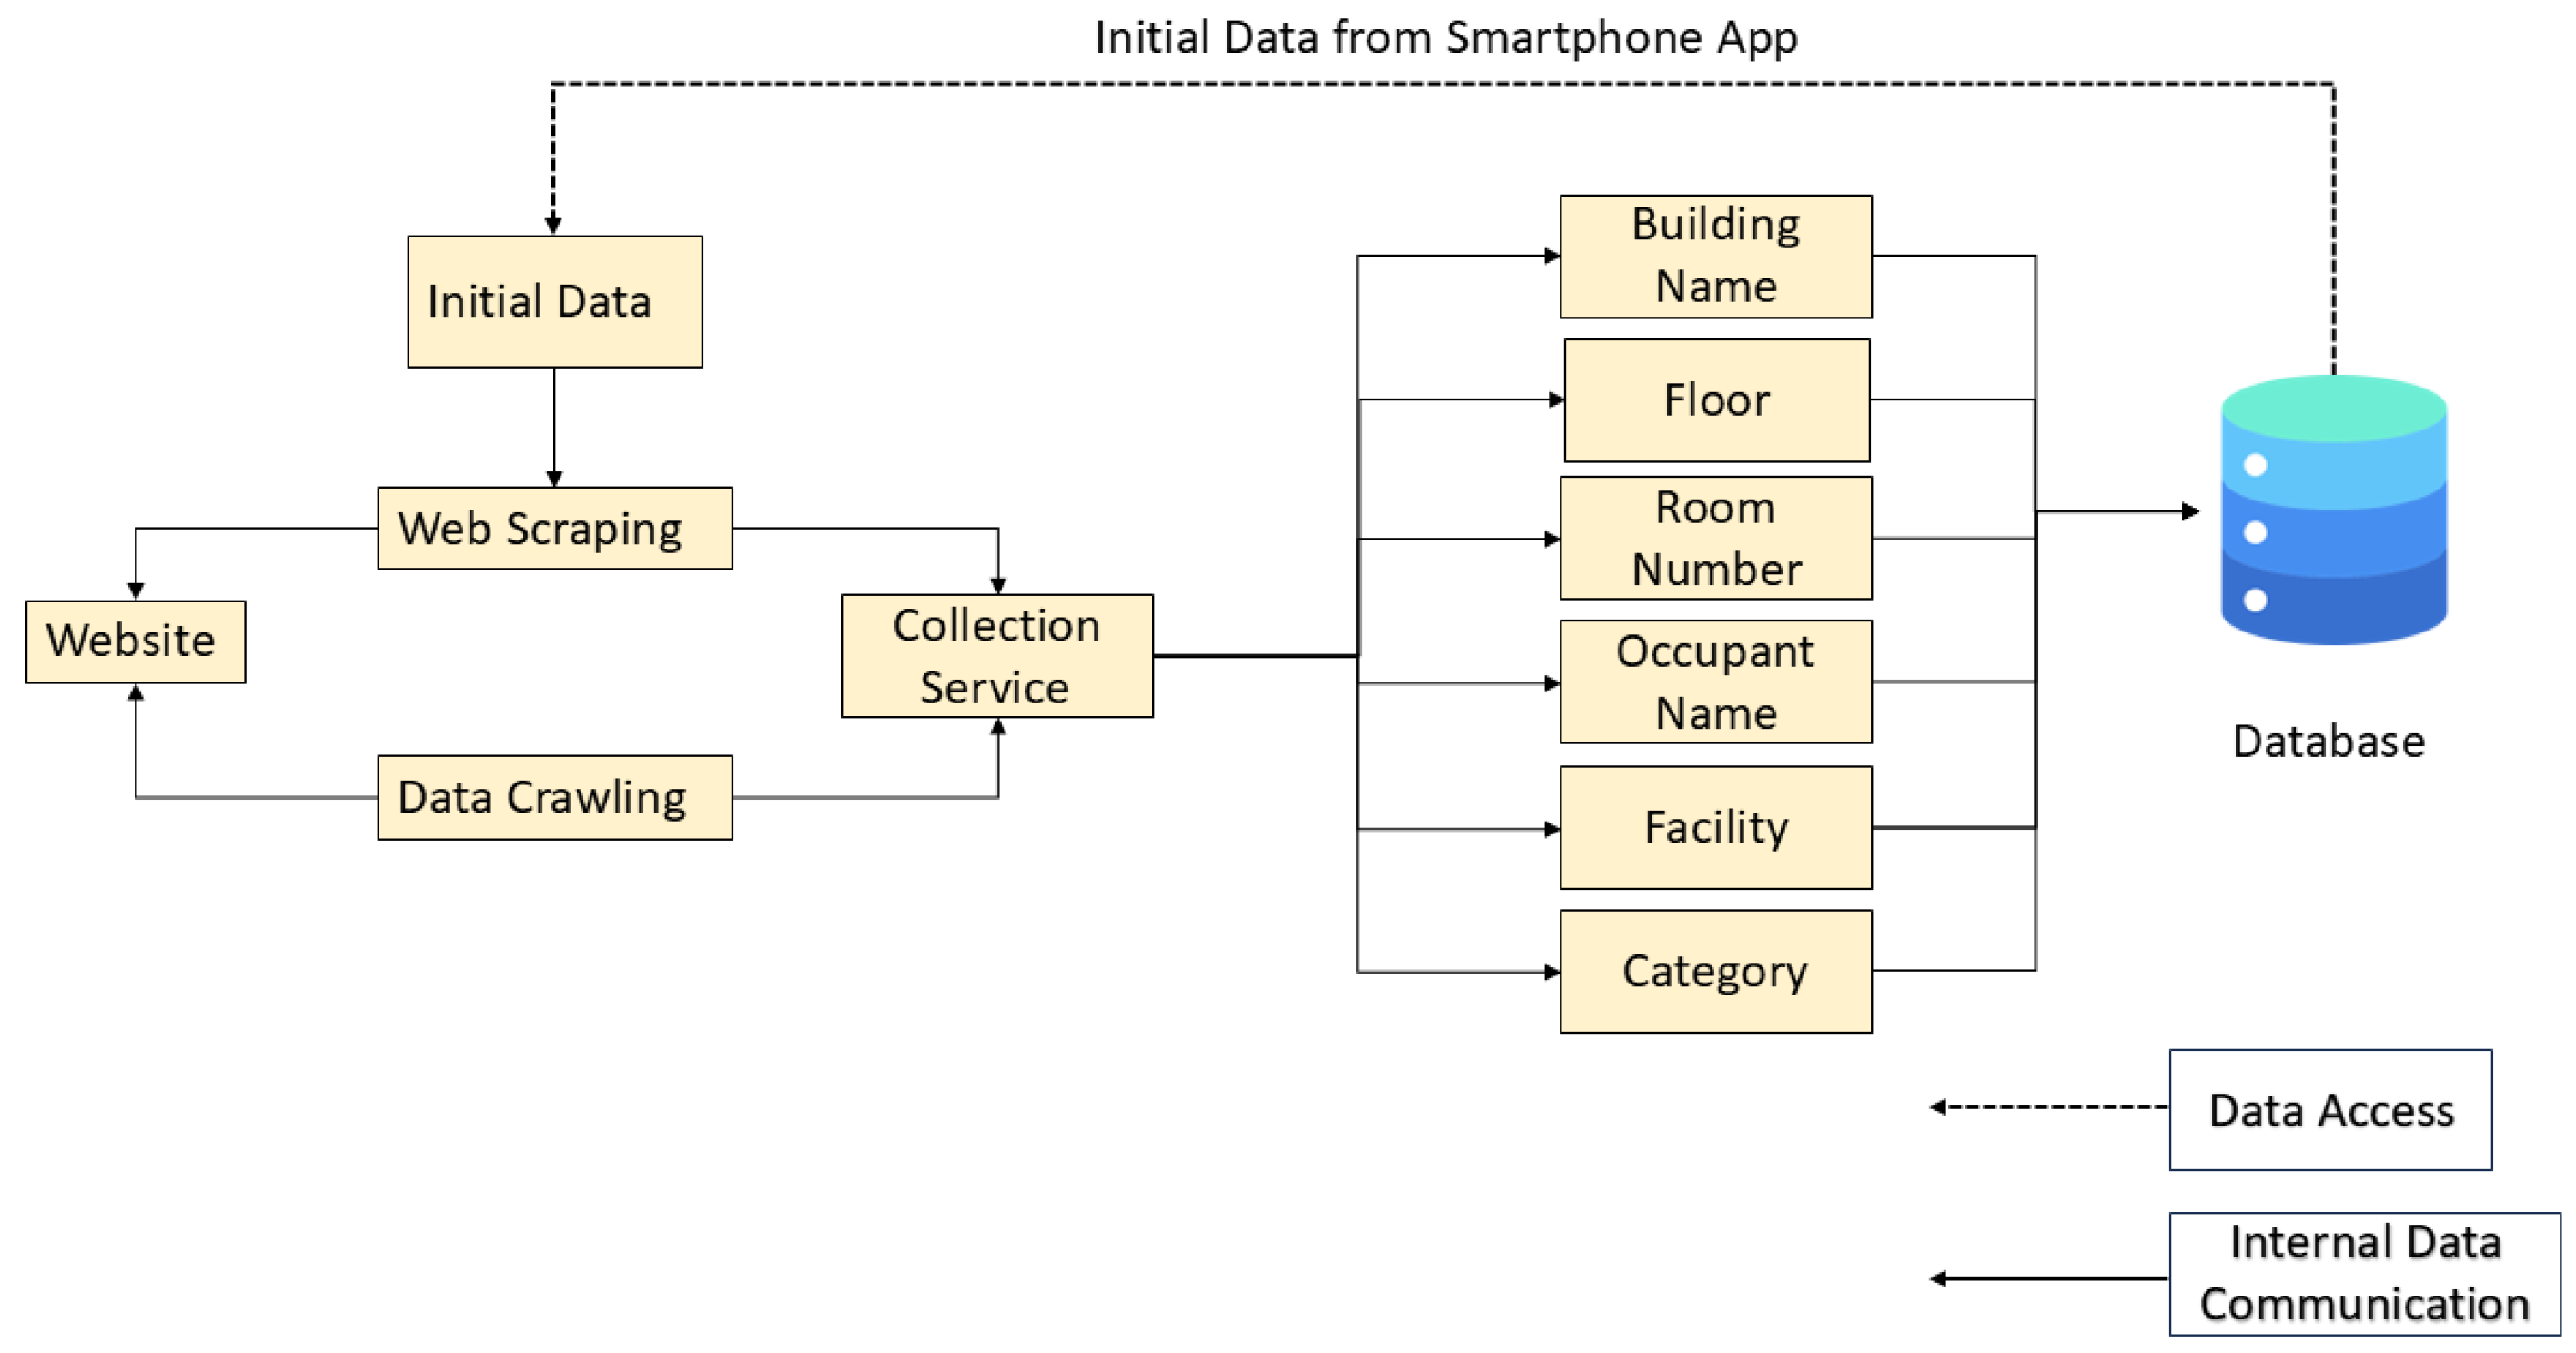
4.4. Information Collection Using Web Scraping and Crawling

Third, web scraping and crawling techniques are applied with the data that are collected through OCR and geolocation, to enhance the map information by retrieving additional contextual data from external websites. Figure 8 shows the workflow for this step.
With the collected data, web scraping directly extracts structured information, such as building names, floors, room numbers, occupants, facilities, and categories, from the targeted web pages. data crawling is responsible for navigating the search to find relevant online contents. Both are fed into the collection service. The datasets are stored in the database. Table 1 shows the differences between web scraping and data crawling [42,43].

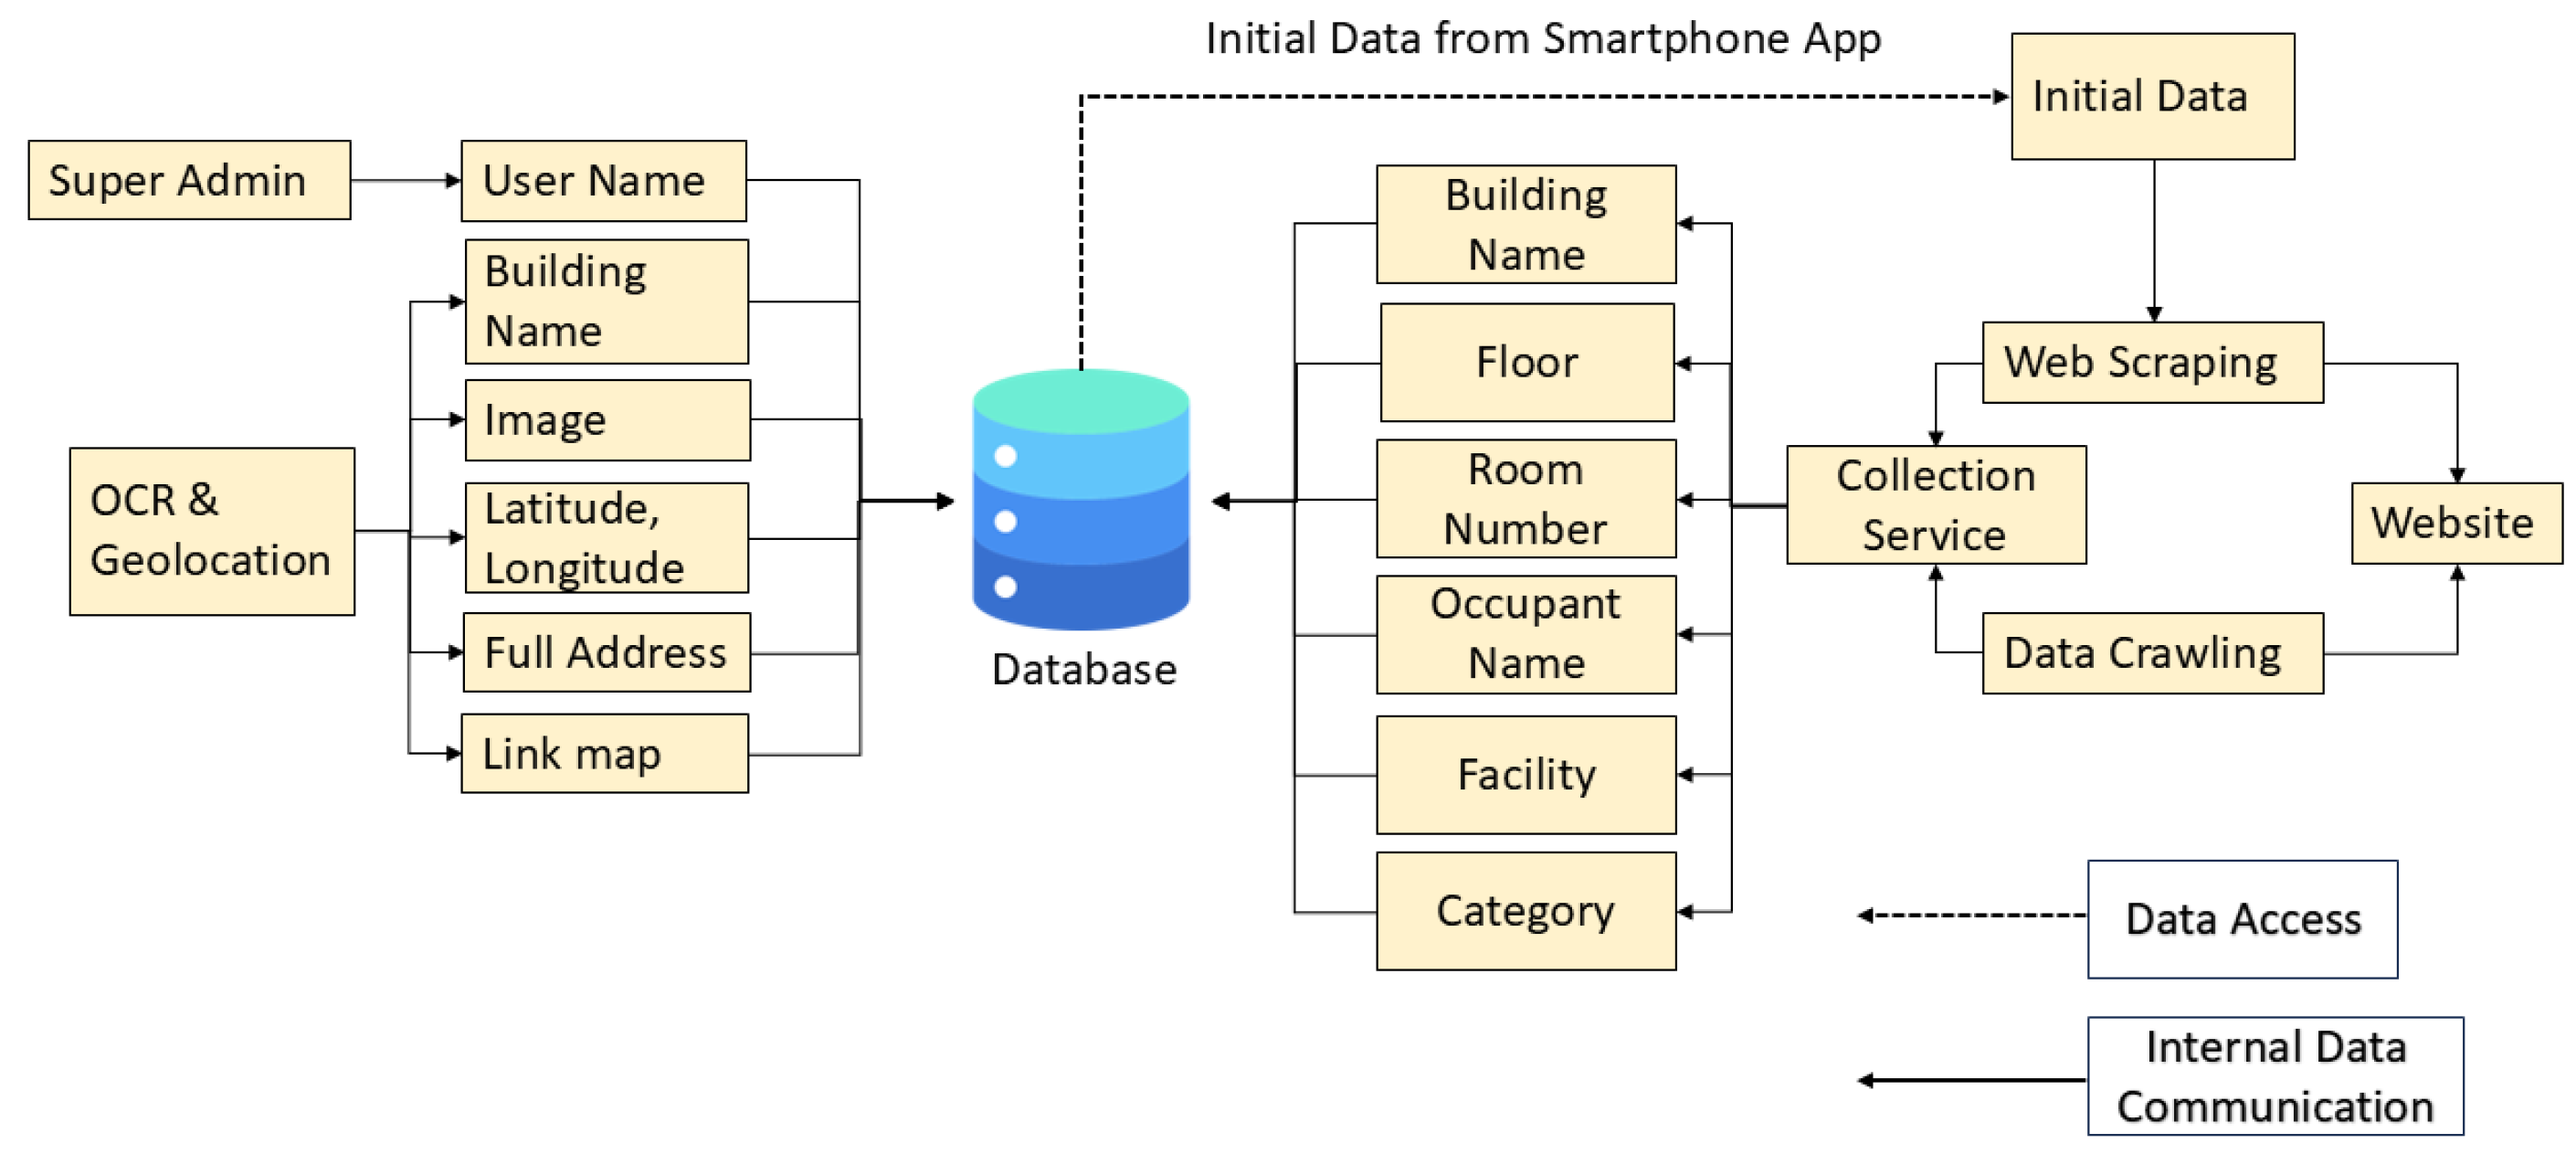
4.5. Data in Database

Fourth, all the data is stored in the database. They include spatial attributes, building names, latitudes and longitudes, addresses, maps, and other information on buildings. This dataset enables the pedestrian navigation system to provide the precise route to the destination even inside a building. The combination of visual and textual data from multiple sources enhances the reliability of the pedestrian navigation system. Figure 9 illustrates the collected data with their sources in the database.

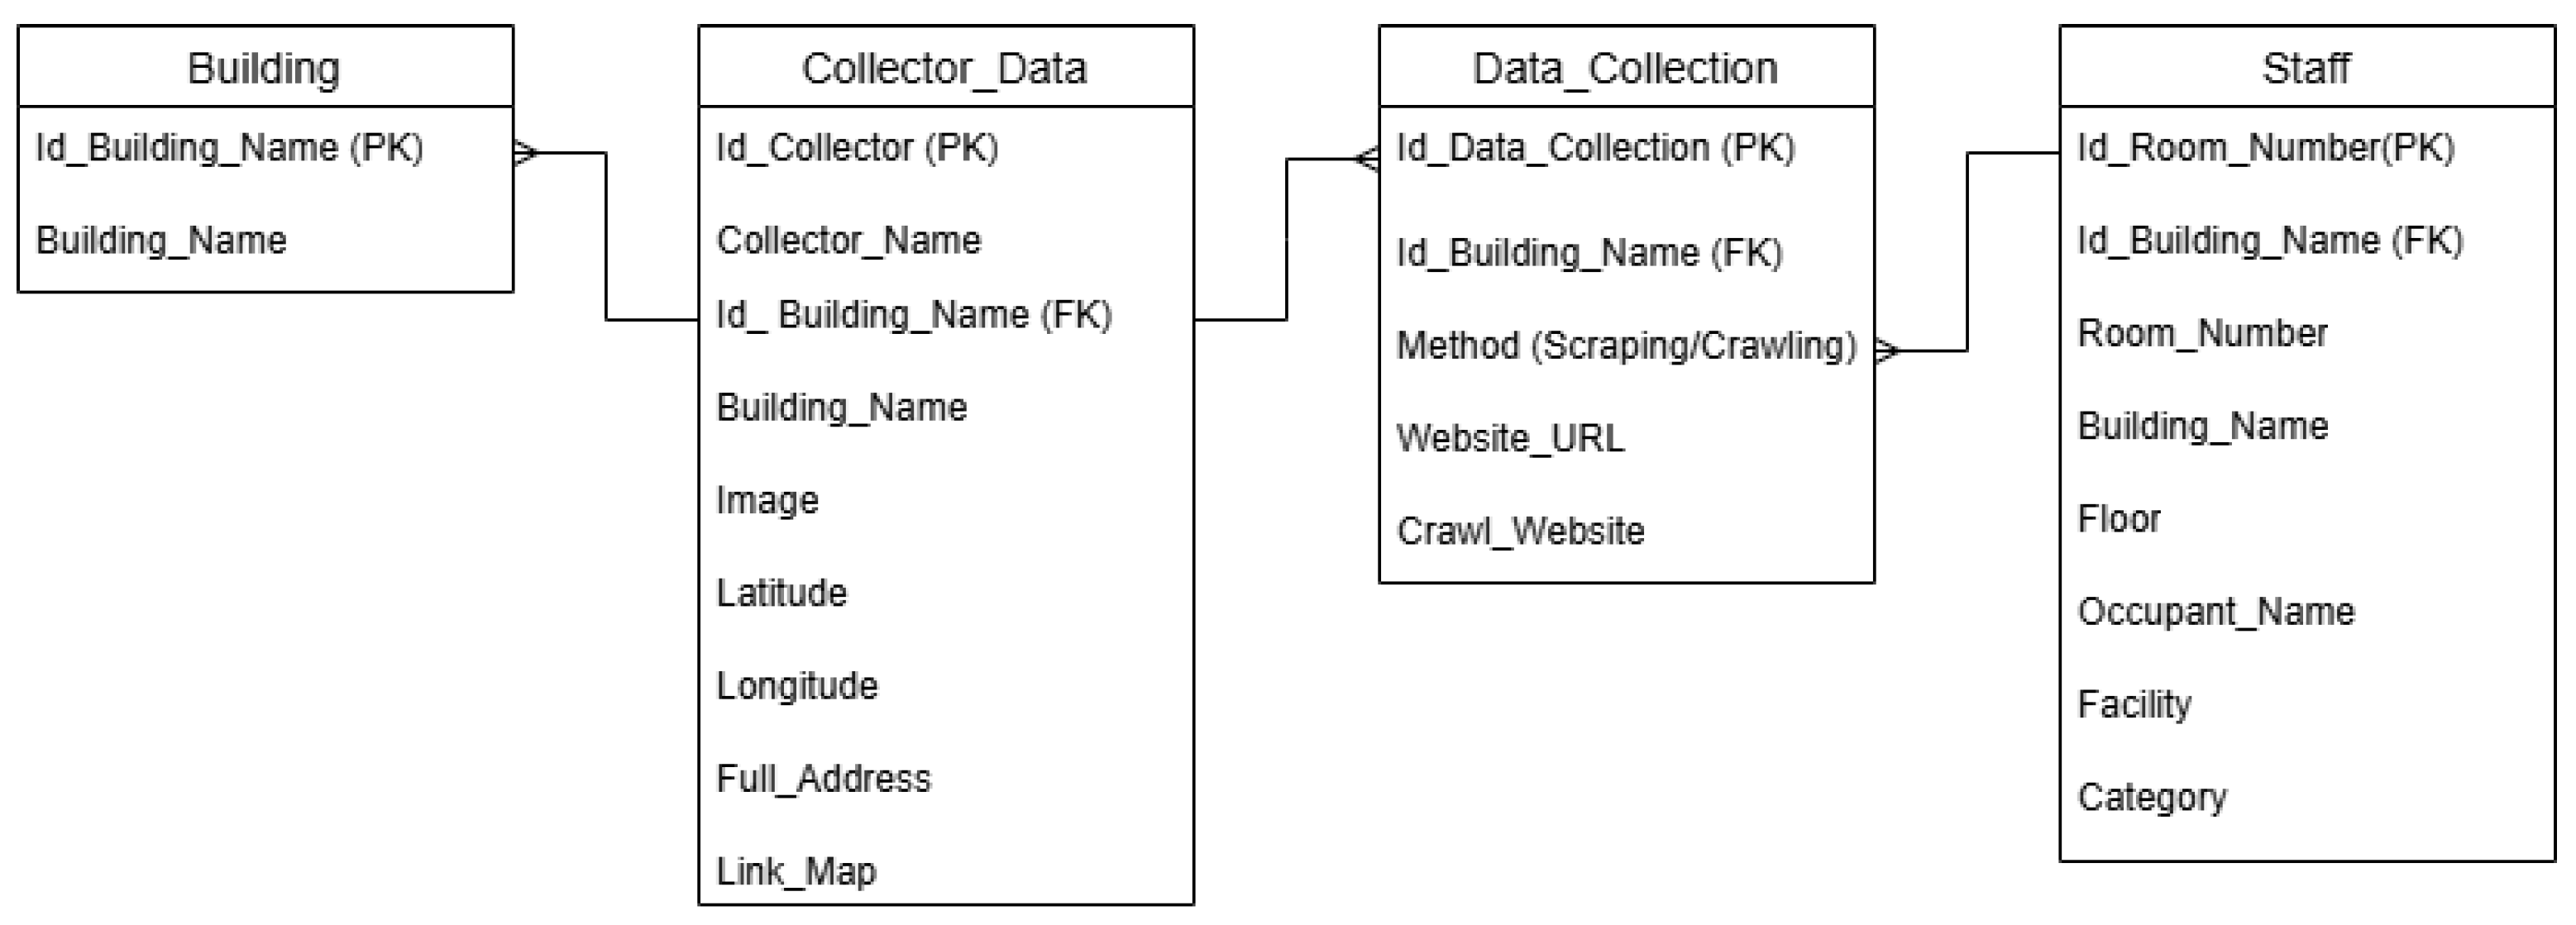
4.6. Database Schema for Building Data

The database schema used in this tool consists of four tables. They are designed to manage and store data related to the building information and the data collection process. The building table serves as the base entity, which stores a unique identifier for each building along with the corresponding building name. The data collector table keeps detailed information about data collectors, including data collector identifiers, names, and their affiliations, as well as geospatial data such as latitudes, longitudes, and full addresses. The data collection table tracks the methodology used for data collection, such as web scraping and crawling techniques, along with relevant website URLs. Finally, the staff table provides a detailed breakdown of each staff member in a building. It includes room numbers, resident names, facility, and categorizations.
These tables are connected through keys, allowing for seamless integrations and retrievals of data across the database. Figure 10 shows the database schema for the relationship between them.

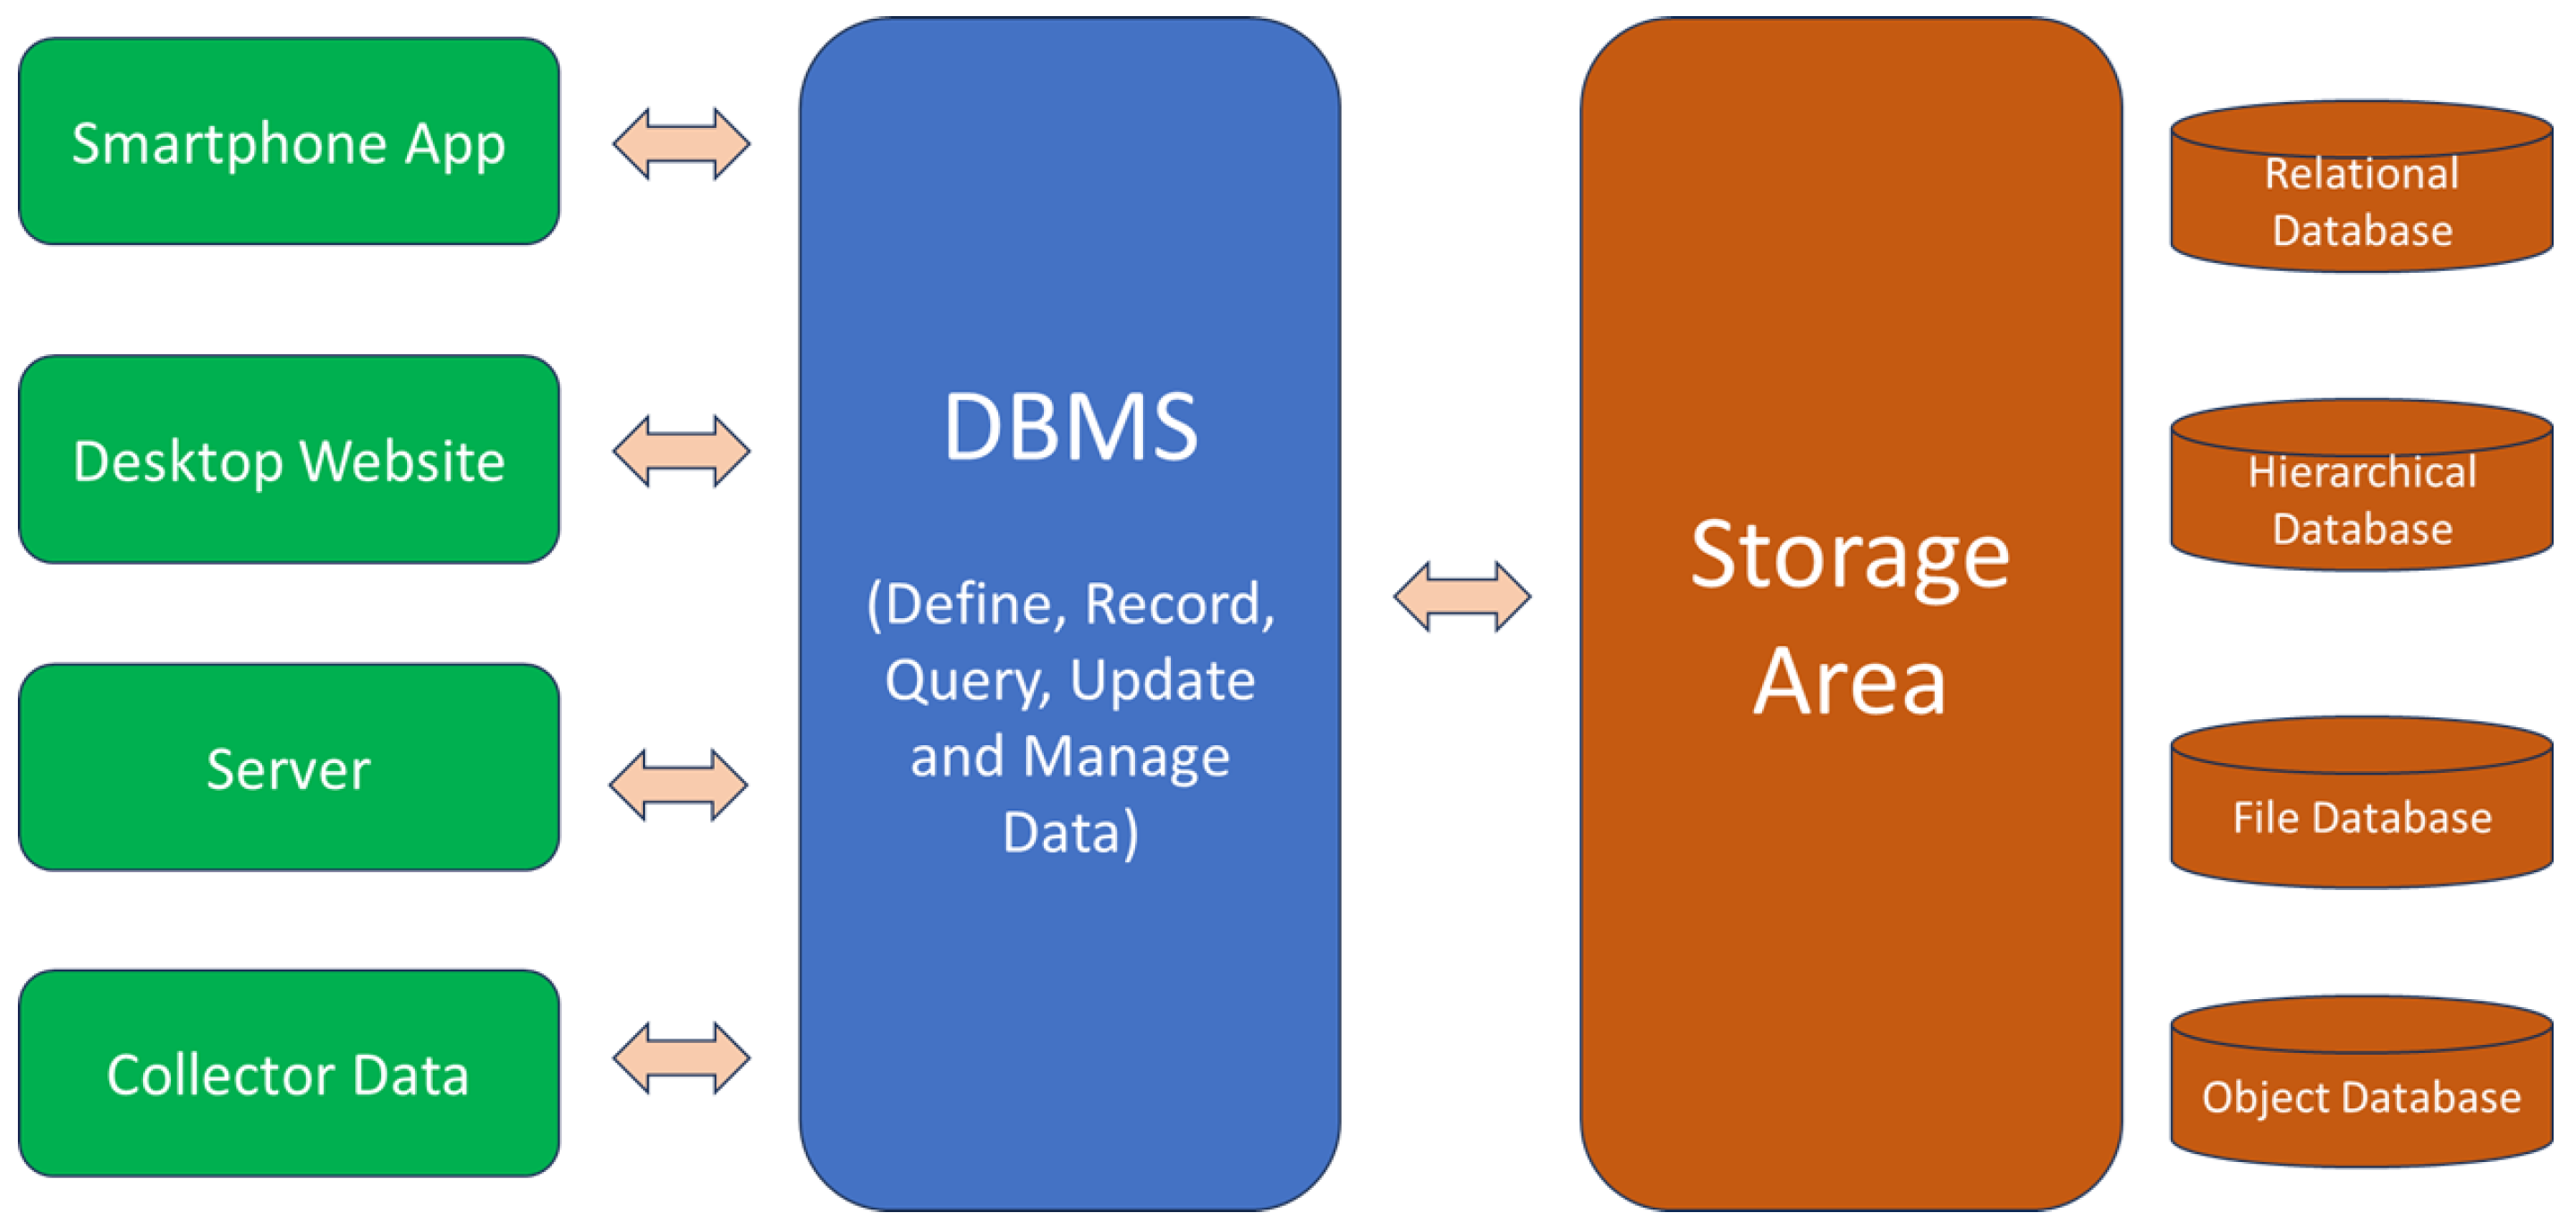
4.7. Data Management Overview of Database

Figure 11 shows the data management overview of the database system. The devices in the left side perform as interfaces to the tool. They include smartphone apps, desktop websites, servers, and data collectors to send or receive data. Database Management System (DBMS) in the middle acts as an intermediate layer, handling tasks such as defining, recording, querying, updating, and managing data. The storage area in the right contains different types of databases, including relational databases, hierarchical databases, file-based databases and object-oriented databases. DBMS processes the requests from an interface, retrieves or stores data in storage, and returns the results.

5. Implementation of Map Information Collection Tool

In this section, we present the implementation of the map information collection system. To evaluate the proposed map information collection tool, we conducted a series of experiments across 10 buildings located within the Tsushima Campus of Okayama University. The campus is used as a suitable testbed because it can offer both indoor and outdoor navigation challenges as well as the diversity in building types and layouts. Figure 12 illustrates the map of the campus used in our field study.

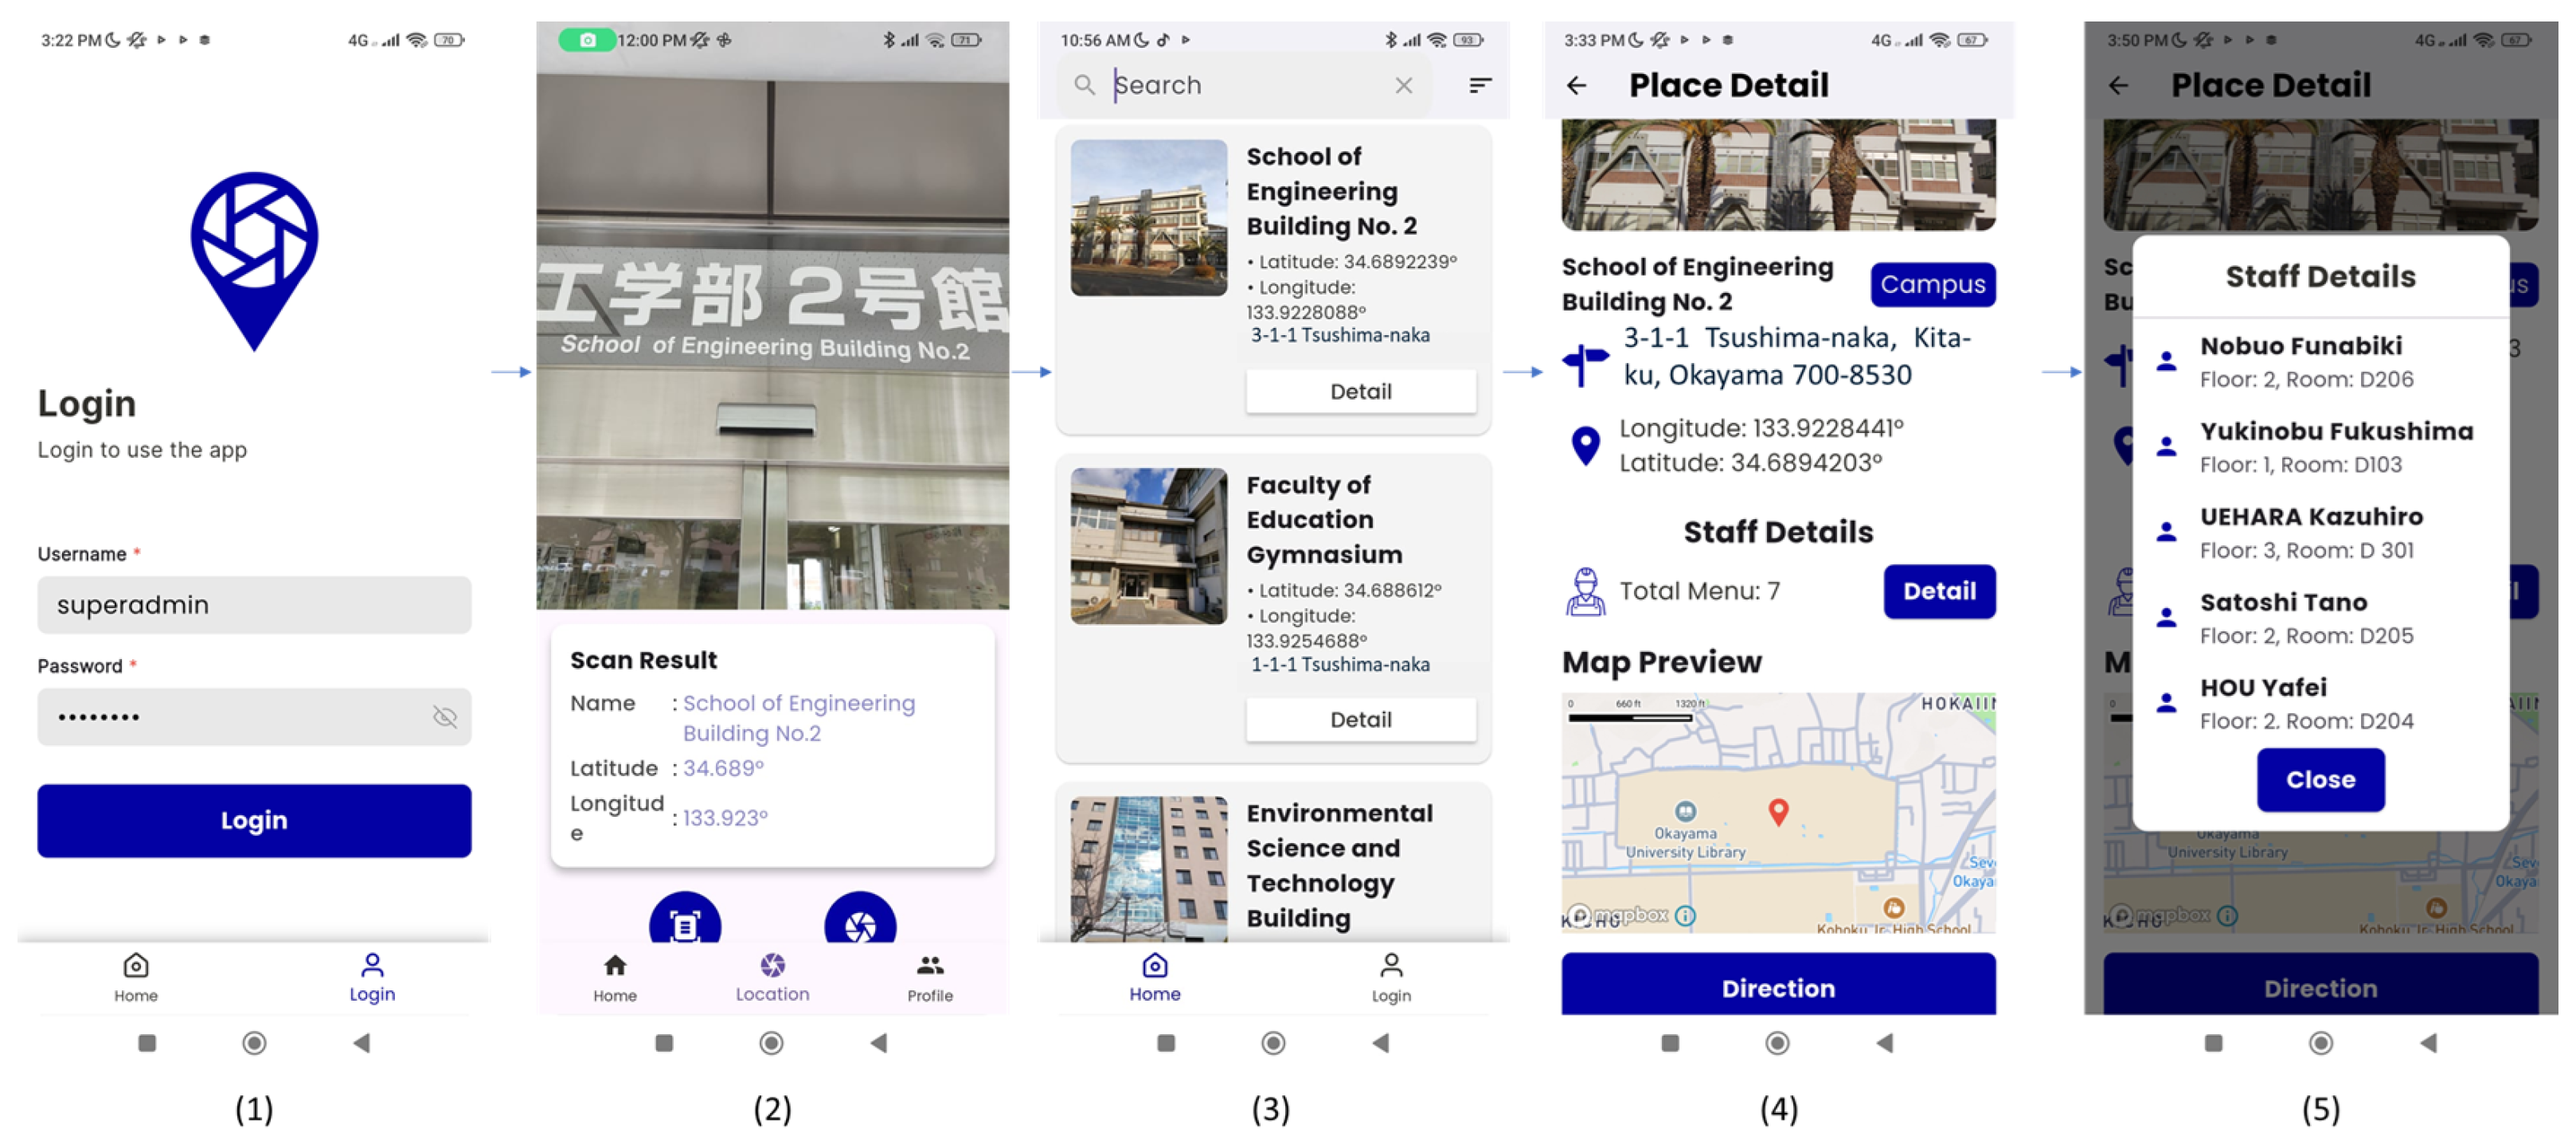
5.1. Data Collection Interface

The data collection interface facilitates a structured workflow within a smartphone application that is designed to support building data acquisition and navigation. The tool initiates with an authentication screen, restricting the access exclusively to the authorized personnel, including super administrators responsible for managing building-related information. Upon successful login, the data collector captures an image of the building signage using the device’s integrated camera. Subsequently, the application processes this image via optical character recognition (OCR) technology to extract relevant textual data, such as the building name and room number. Concurrently, the smartphone’s geolocation module records the precise coordinates (longitude and latitude) of the captured image.
Following the data extraction, the tool presents the collected information in an editable form, allowing the collector to review, modify, or supplement additional details, such as the building category and full address. A preview of the captured photograph is also displayed to assist in verification. Once confirmed, the data entries are catalogued in a collection view, where each item summarizes essential attributes, including room numbers, floor levels, building names, and occupant details. Selecting an entry redirects the user to a detailed view, which provides comprehensive information, such as the occupant’s name, complete address, and mapped location.
Additionally, the application incorporates a navigation feature, activated via a directional button, which guides a pedestrian to the designated location using a specialized pedestrian navigation map. Figure 13 illustrates the interfaces for data collections.
This smartphone application streamlines the acquisition, validation, and utilization of internal building map data by integrating optical character recognition (OCR) for text extractions, geolocation tracking, web scraping, crawling, and navigations into a cohesive workflow. By consolidating the functionalities, the tool allows the efficient gathering of comprehensive spatial and occupancy data while enhancing navigation systems with real-world building information.
Furthermore, this tool facilitates seamless integrations between the mobile application and the centralized web-based dashboard, allowing administrators to manage and monitor the collected data effectively. This synchronized architecture ensures that all data captured via the smartphone is systematically stored in a unified database, improving accessibility and oversight for authorized personnel.

5.2. Implementation of the Database Storage Interface

This section details the implementation of the database storage interface designed to process tabular data extracted via optical character recognition (OCR), geolocation coordinates, and staff-related records. The tool integrates web scraping techniques to automate data retrieval, ensuring a comprehensive and structured repository for building navigation and occupancy information. By unifying the functionalities, the interface enables efficient storage, retrieval, and management of spatial and personnel data within a centralized database architecture.

5.2.1. Integration of OCR and Geolocation for Campus Navigation

The OCR and geolocation database serves as the centralized data repository for all spatial information collected through the smartphone-based acquisition function. Table 2 shows some data. This table stores comprehensive campus location data, including building specifications, room allocations, and occupant details, which form the critical foundation for the pedestrian navigation system. Each database record contains multiple validated data fields: the administrator identification as the collector designation, the campus classification as the location category, the OCR-processed textual information (e.g., “School of Engineering Building No. 1”), the complete physical address, the precise geolocation coordinates (longitude and latitude), the instant map visualization link, and the reference image captured during the data collection for verification. This integrated approach ensures the data accuracy while maintaining the user accessibility to all processed outputs, including OCR-extracted text, geolocation data, and reference images, which are systematically archived in the dedicated “Performing OCR and Geolocation” database table for complete spatial representation and management.
It serves as the primary interface for data administration, enabling the administrator to verify, modify, and update building and room information as required. This functionality ensures that the database maintains accuracy, completeness, and reliability. The critical importance of data quality is highlighted by its direct impact on navigation system efficacy. Following verification, the updated spatial data is automatically synchronized with the pedestrian navigation system, guaranteeing users access to the most current building information for precise wayfinding.

5.2.2. Integration Table Web Scraping and Crawling

The tool combines two distinct data acquisition methods to populate the pedestrian navigation database. The architectural data (left table) is derived from optical character recognition (OCR) processing of building signage images manually captured by data collectors. This process extracts standardized building nomenclature (e.g., “School of Engineering Building No. 2”) from multiple images taken at varying perspectives, ensuring consistent identifications through redundant verification. The complementary personnel data (right table) is automatically harvested through web scraping and crawling of institutional directories, retrieving precise spatial details including occupant names (e.g., “Nobuo Funabiki”), floor designations, and room identifiers (e.g., “D206”). This dual-stream approach creates a comprehensive spatial database in which OCR-derived building geolocations are enriched with scraped room-level specifics, enabling precise navigation. The integrated dataset in Table 3 permanently archives all processed outputs, including OCR-interpreted spatial data and scraped occupant information, forming a complete navigational knowledge base.

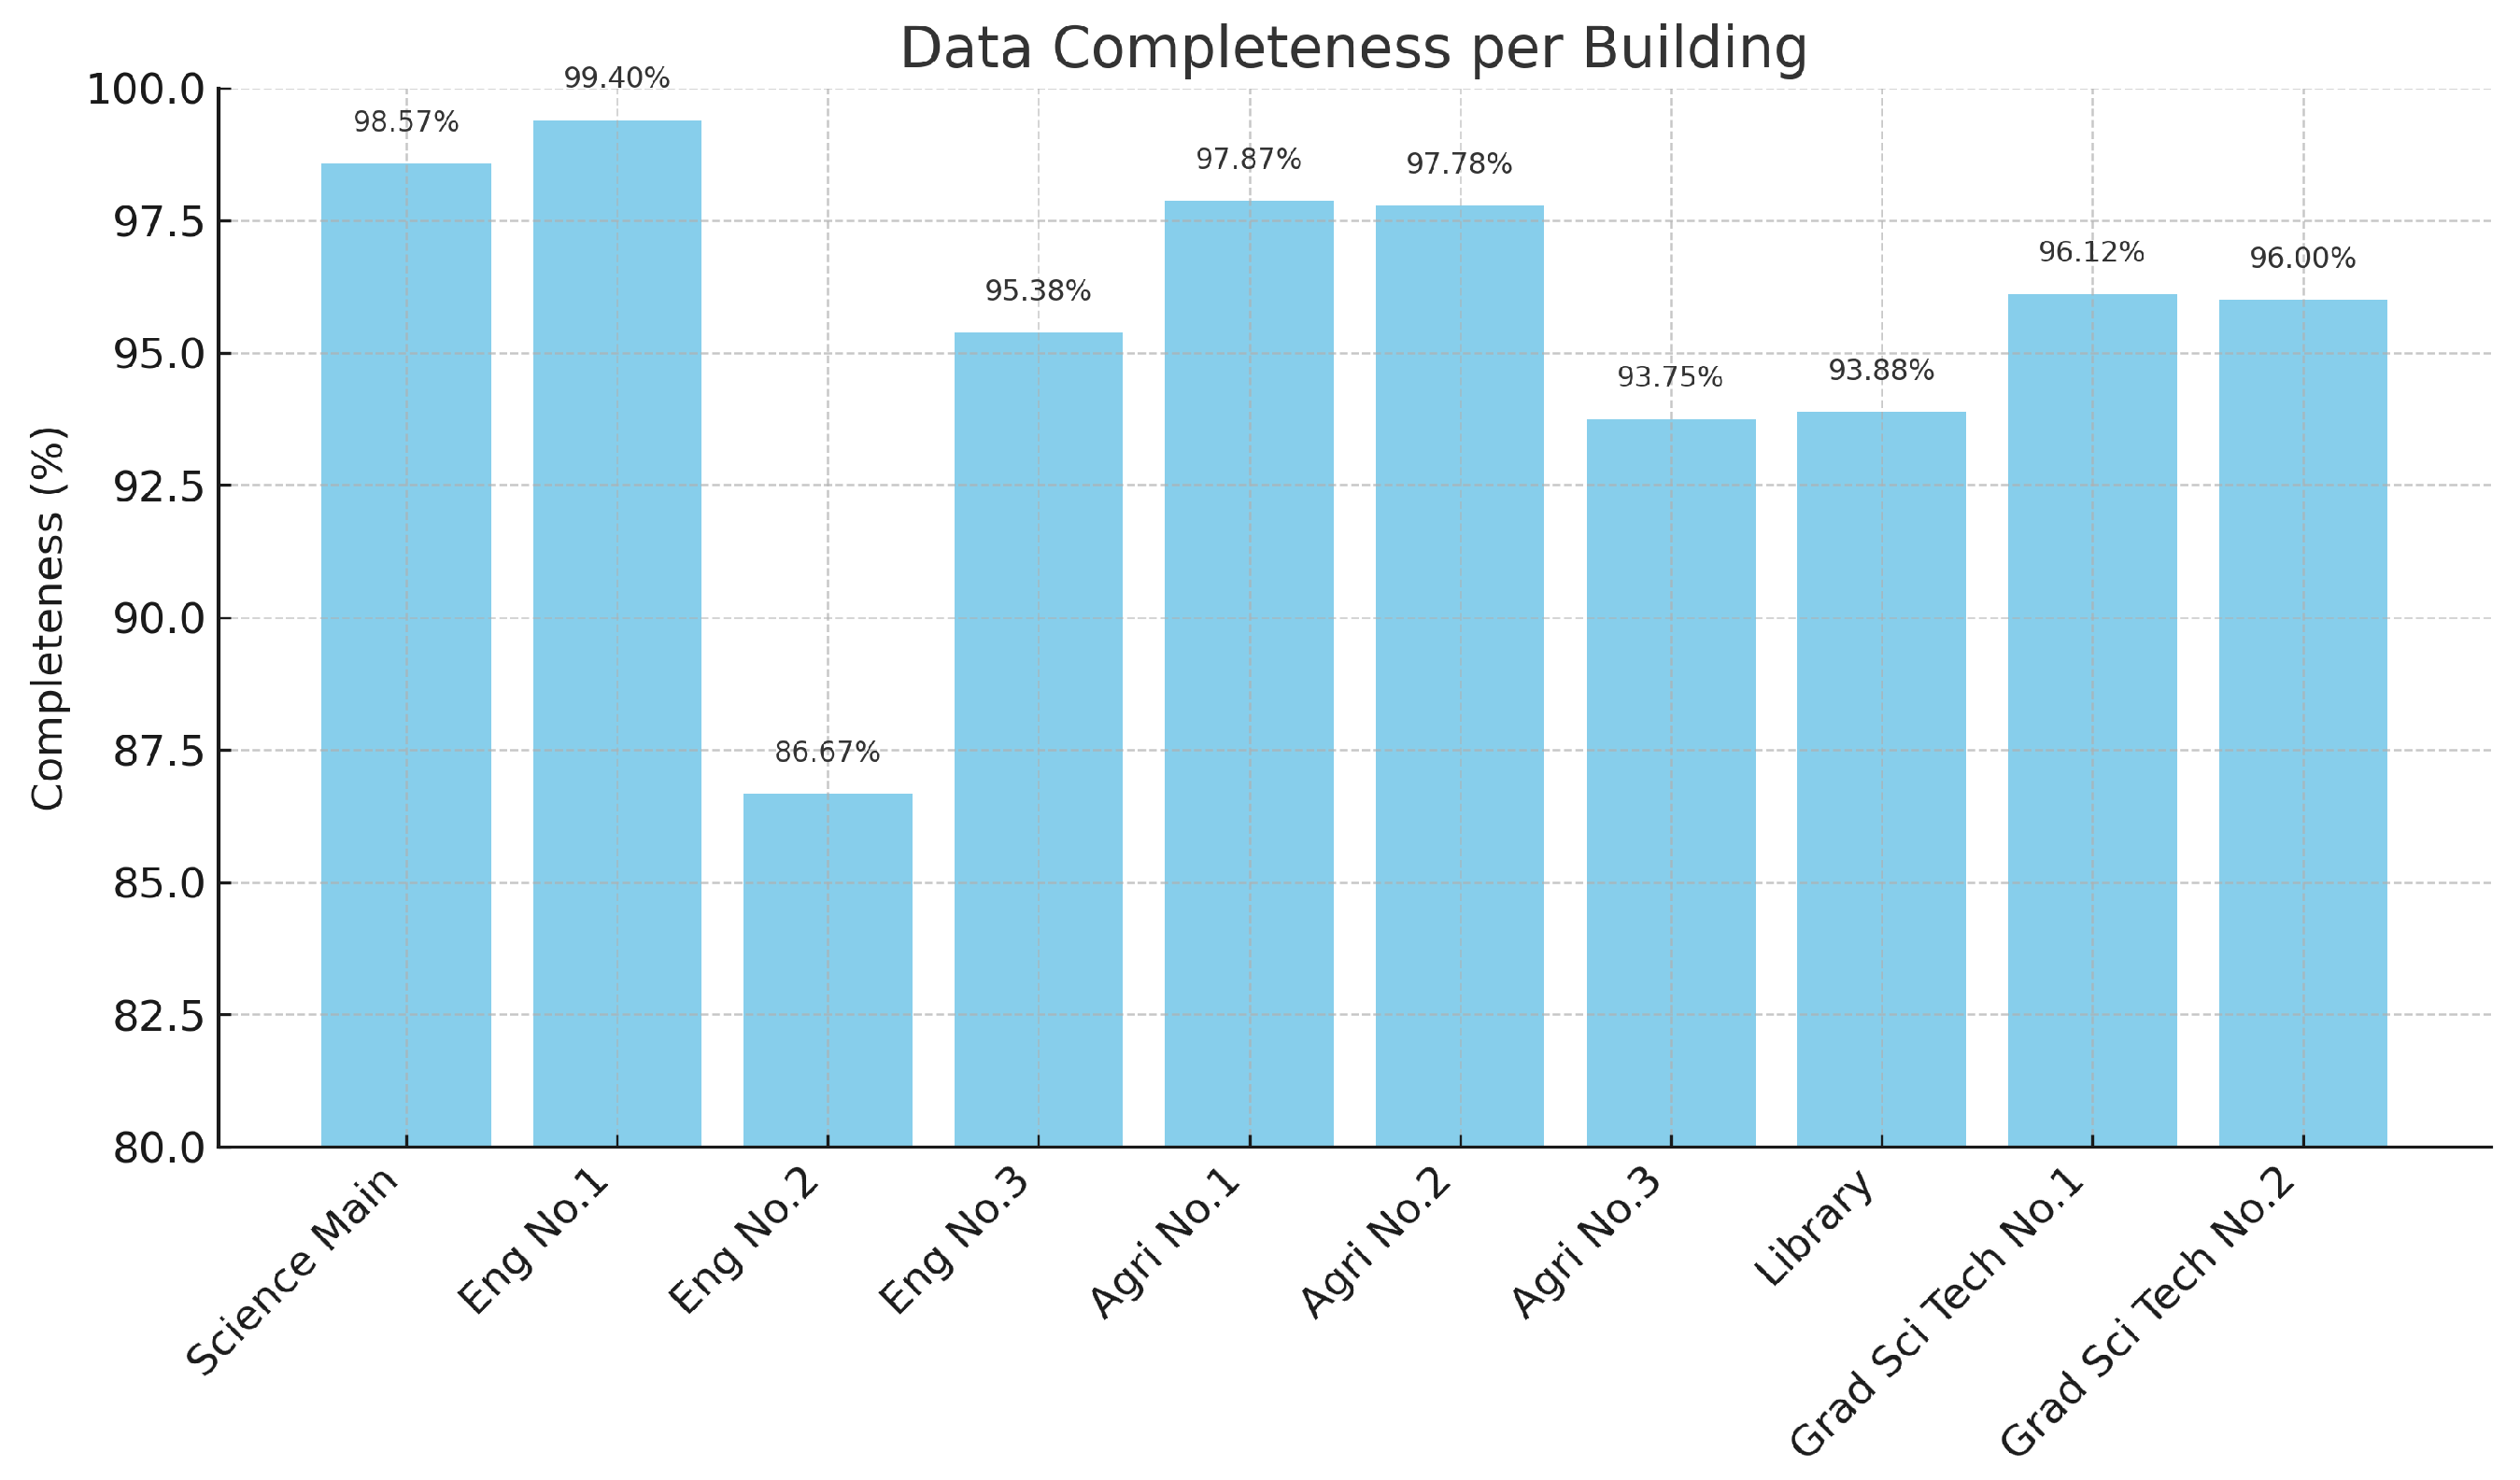
5.2.3. Data Collection Results

Table 4 shows the number of the collected spatial data inventory, categorizing entries by functional classifications in our experiments. The aggregated dataset encompasses (1) academic spaces (faculty offices and instructional rooms), (2) architectural identifiers (building nomenclature), (3) amenity information (dining options), and (4) public infrastructure (restrooms and transit points). This comprehensive collection from processed visual captures and institutional digital resources [17] demonstrates both the methodological robustness and categorical diversity achieved by the integrated data acquisition framework. The tabulated results validate the capacity to capture heterogeneous spatial data types essential for comprehensive campus navigation solutions.

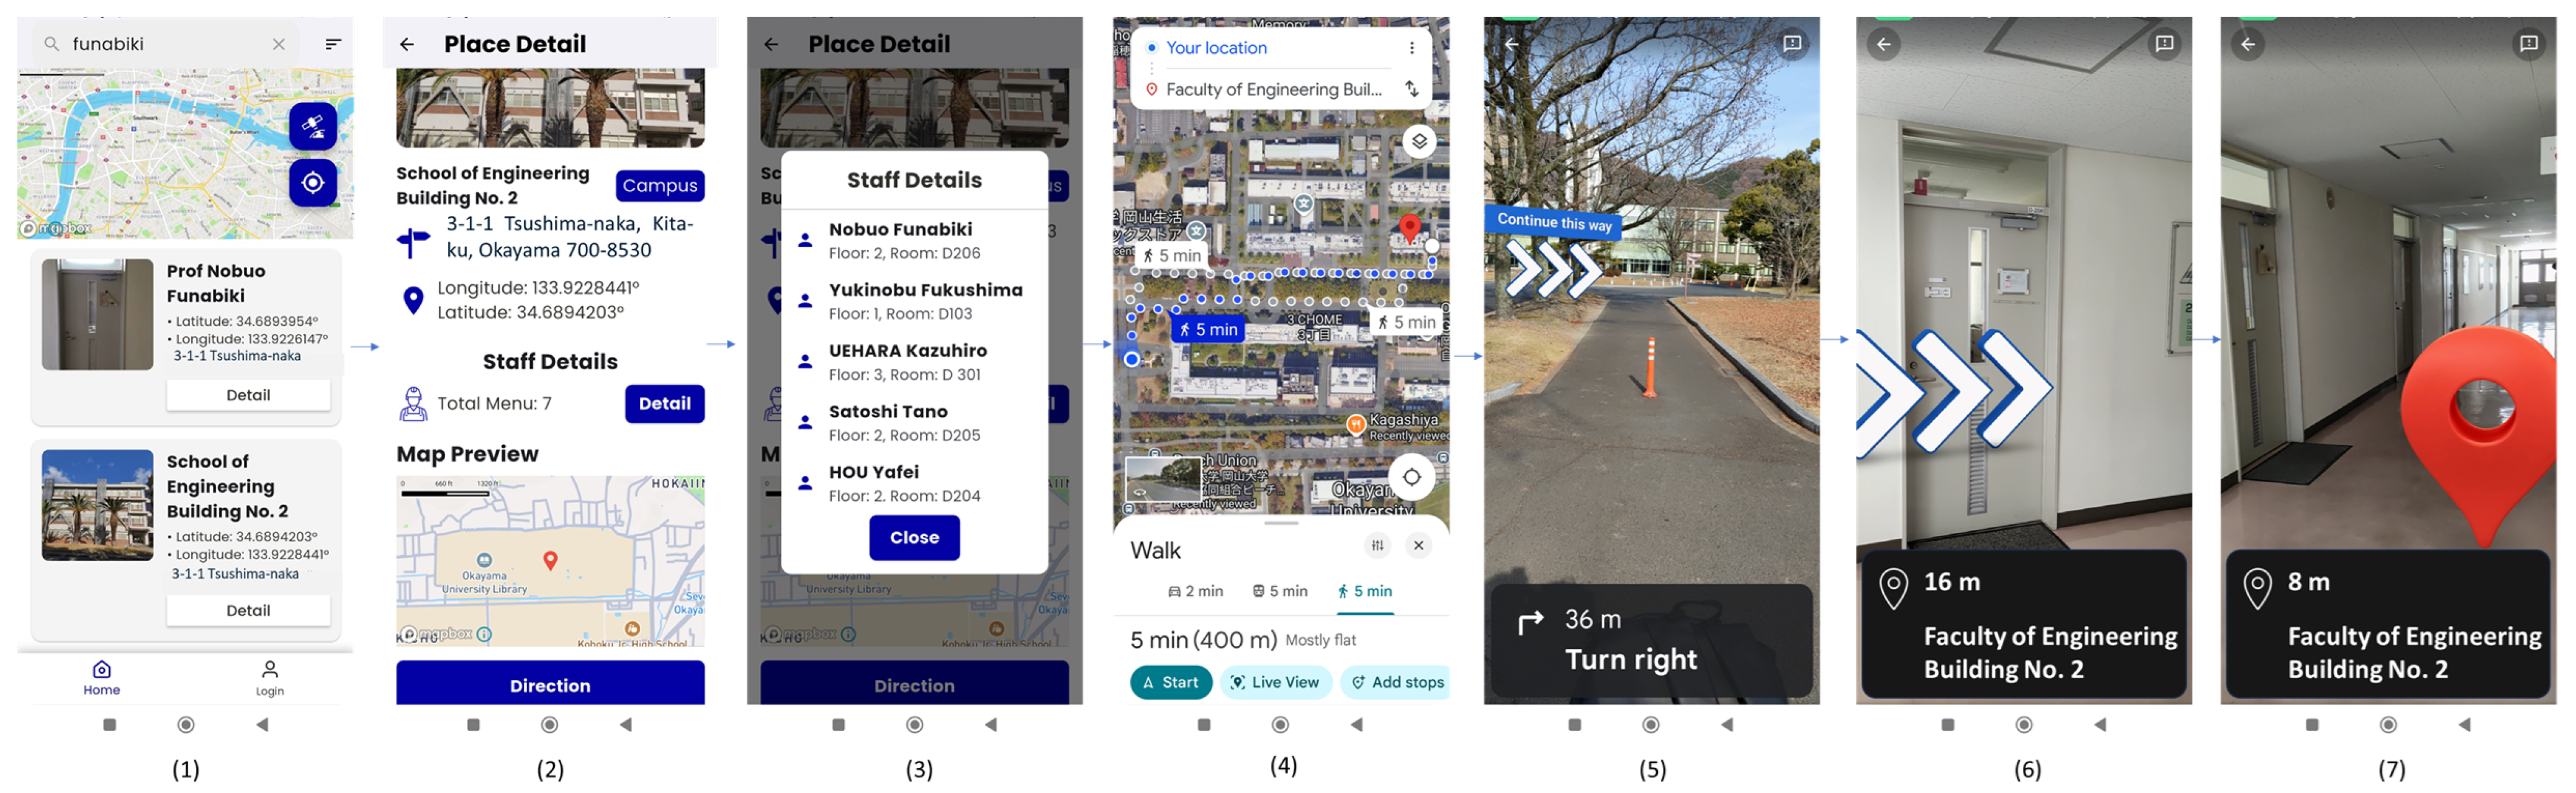
5.3. Pedestrian Navigation Interface

The pedestrian navigation interface offers an intelligent search function capable of processing minimal input (e.g., “Funabiki”) to return comprehensive results including occupant details, room/floor information, building names, addresses, and geocoordinates. A directional module provides multi-stage wayfinding, initially displaying the AR-enhanced outdoor navigation with the overlaid directional arrow and the distance indicator for campus traversal. It is automatically switched to the indoor mode upon building entry to guide the user through corridors via persistent visual cues. The system culminates in the destination identification through a prominent red virtual marker, which is particularly useful in poorly signed areas Figure 14.
The navigation system supports both outdoor and indoor navigation using AR-based guidance. For outdoor environments, the system adopts techniques from previous studies by Brata et al. in [44,45,46]. The system combines VSLAM, Google Street View, and visual–inertial sensor fusions to provide accurate and real-time AR navigation, under varying lighting conditions. For indoor navigations, the system does not rely on detailed indoor maps such as corridor layouts or predefined routing graphs. Instead, it follows the combined concept introduced through the INSUS system by Fajrianti et al in [47,48]. They proposed that smartphone-based navigation using Unity can assist users effectively indoors without full map data. By utilizing the sensors of the compass, gyroscope, and step detector, the system estimates the user’s direction and movement accurately to guide them toward the target room.
The application successfully combines an intelligent search function, comprehensive spatial data, and intuitive pedestrian navigation to facilitate precise wayfinding in complex environments. The user can efficiently locate a specific building or a room through the search interface, which provides detailed information of the precise location, available facilities, and visual references. The system offers step-by-step navigation guidance, seamlessly transitioning between outdoor and indoor wayfinding. This integrated approach significantly enhances the navigation efficiency for an unfamiliar user, reducing disorientations in a large-scale environment while improving the overall user experience. By merging robust data integrations with real-time navigational support, the system substantially improves accessibility and usability, particularly in challenging environments such as university campuses and their associated facilities.

6. Evaluations

In this section, we performed a comprehensive two-stage evaluation of data collection and pedestrian navigation to validate the feasibility and effectiveness of the proposed tool. The experiments were conducted in real-world settings (on-site) across multiple campus buildings at Okayama University, Japan, ensuring practical assessments under authentic usage conditions.

6.1. Data Collection Evaluation

To evaluate the map information collection tool, we conducted field tests across 10 campus buildings at Okayama University, focusing on extractions of building names and room numbers through OCR, web scraping, and crawling techniques. The performance was quantified by comparing the extracted room data against the manual extractions. The completeness was calculated by the percentage of correctly identified rooms among the total rooms [49]. Table 5 demonstrates the tool’s effectiveness in spatial data acquisitions, providing validation of our automated collection methodology under real-world conditions.
Completeness   ( % ) = Number of Captured Rooms Total Number of Rooms × 100
The results reveal consistently high performances across all of the tested buildings. The School of Engineering Building No. 1 achieved the highest rate of 99.40%, and the School of Engineering Building No. 2 achieved the lowest rate of 86.67%. The average accuracy was 93%. The results demonstrate robust room data capture capabilities. Figure 15 indicates the near-perfect correlation between captured data and physical infrastructure, which validates the effectiveness of our automated collection methodology.

6.2. Pedestrian Navigation Evaluation

Then, we evaluated a pre/post-test for pedestrian navigations and a system usability scale (SUS).

6.2.1. Pre-Test and Post-Test

Participants in the user study included first-year students and campus visitors, both representing pedestrian users who were unfamiliar with the target locations. This selection ensured that the evaluation reflected realistic navigation scenarios for users encountering the campus environment for the first time. Prior to the testing, participants answered a pre-test screening question (“Have you ever used this navigation system before?”) to account for prior experiences in subsequent analysis. All participants were unfamiliar with the navigation system and had no prior knowledge of the destination locations. They were not selected based on socioeconomic background. We ensured that they were typical first-time users in real-world scenarios. Following practical application use, participants were asked to answer the questions in Table 6 about the system usability through a standardized post-test questionnaire based on the system usability scale (SUS) [50]. This assessed five key dimensions: (1) interface learnability, (2) operational efficiency, (3) error management, (4) perceived usefulness, and (5) overall satisfaction.

6.2.2. Pre-Test Result

A total of 10 participants in Okayama University’s pedestrian population joined this evaluation. As shown in Table 7, the pre-test screening revealed all the participants (100%) were first-time users of the navigation system, establishing a consistent baseline of zero prior experience across the test group. This uniform novice user profile ensured unimpaired assessment of the system’s initial usability and learnability characteristics.

6.2.3. System Usability Scale Result

We assessed the navigation system’s usability through a standardized system usability scale (SUS) survey administered to 10 participants after practical wayfinding tasks. Participants used the smartphone application to locate specific rooms before completing the 10-item SUS questionnaire with a 5-point Likert scale (1 = strongly disagree to 5 = strongly agree) [51]. The statements were contextually adapted to evaluate wayfinding experiences. Following standard SUS protocols [52], responses were converted to a 0–100 scale, generating an average score of 81.5, which is classified as "Excellent" usability.
  • For each odd-numbered item ( i = 1 , 3 , 5 , 7 , 9 ), compute
    S i = R i 1
  • For each even-numbered item ( i = 2 , 4 , 6 , 8 , 10 ), compute:
    S i = 5 R i
    where R i is the respondent’s score for item i.
  • Sum all adjusted scores:
    S = i = 1 10 S i
  • Multiply the total score by 2.5 to obtain the SUS score for that respondent:
    SUS j = S × 2.5
  • If there are n respondents, the average SUS score is computed as
    Average SUS = SUS 1 + SUS 2 + + SUS n n
Table 8 shows that the proposal effectively collects the map data and is usable and practical for the pedestrian navigation system.
Average SUS Score (10 Participants):
100 + 90 + 72.5 + 100 + 100 + 100 + 87.5 + 100 + 100 + 87.5 10 = 93.75
While the overall average SUS score of 93.75 clearly indicates excellent usability, a closer look at the individual participant scores provides deeper insights into user perceptions and potential variabilities. A significant consistency was observed among the participants, where seven of them (P1, P4–P6, P8–P9) gave the perfect score of 100. Their responses reflected a strong and consistent positive experience with the system’s usability, particularly in terms of intuitiveness and ease of use.
However, some variation was observed. Participant 3 gave a considerably low score of 72.5, which can be regarded as an outlier in the dataset. Unlike others, this participant used moderate values, suggesting a more critical view of the system. This may come from different expectations, possibly encountering a minor issue during testing. In addition, three other participants (P2, P7, and P10) gave slightly lower scores ranging from 87.5 to 90.0. These scores, although still within a good range, indicate the presence of minor concerns, particularly in items related to the system complexity or consistency (e.g., Q7–Q9). Such concerns could arise from slight confusion with the interface, device-specific usability issues, or unfamiliarity with similar systems.
The observed score range, from 72.5 to 100, shows that the system was generally well received. Nonetheless, it also highlights natural differences in user experiences and perceptions, which are common in usability evaluations. These findings underline the importance of continuous refinements. It is recommended that we further explore and address usability issues to improve the system’s robustness and user satisfaction. The individual SUS scores presented in Figure 16 further validate the system’s high accuracy and user-friendly design, confirming its potential for practical deployment.

6.3. Overall Evaluation Results

The evaluation of our map information collection tool across 10 Okayama University buildings demonstrated data accuracy and usability. It achieved high data completeness rates, validating the effectiveness of our proposal. Usability assessment using the system usability scale (SUS) generated an outstanding average score of 93.75, confirming the intuitive nature of the interface design. Furthermore, the tool successfully aggregated comprehensive spatial data through its integrated approach combining OCR technology with web scraping and crawling methodologies. The results collectively demonstrate robustness in both data acquisition and user interaction.

6.4. Discussions

The experimental results are in accordance with existing research, demonstrating the efficacy of integrated OCR, web scraping, and crawling approaches for automated spatial data extraction [53,54,55]. The results (93–99.4% completeness rates and an SUS score of 93.75) validate the methodology for campus navigation applications.
However, two key limitations emerged: (1) dependency on optimal image capture conditions for OCR accuracy, and (2) vulnerability to website structural modifications affecting scraped data consistency. The outlier case of 86.67% completeness in one building specifically resulted from discrepancies between online directory information and physical reality, highlighting the challenge of maintaining synchronized digital–physical datasets. These findings suggest that periodic manual verifications remain necessary to ensure long-term data accuracy, especially in dynamic institutional environments. Future implementations could benefit from incorporating change detection algorithms and crowdsourced verification mechanisms to address these limitations.
Additionally, several missing data points caused practical constraints in the field. In some cases, certain rooms or buildings lacked visible nameplates or had signage that was faded, damaged, or obscured, making it impossible to capture usable photos for OCR processing. These issues were particularly prevalent in older buildings or poorly maintained facilities. Such real-world conditions represent critical challenges in deploying the proposed automated data collection system.

7. Conclusions

Our research delivers actionable values to three key stakeholders through its smartphone-based navigation system. University administrators can enable dynamic digital wayfinding that can improve accessibility, which is of particular value for international visitors (Section 6.2.1). App developers can benefit from the scalable OCR and web scraping frameworks (Section 2.2), which overcomes traditional indoor mapping limitations while achieving exceptional usability (SUS: 93.75, (Table 8)). Urban planners can gain a crowdsourced solution (Section 4) that can address critical gaps in public building maps [7,8], which is especially valuable for complex transit hubs requiring room-level precision.
To maximize impacts, we propose targeted policies. Universities should implement annual map data audits and navigation pilots; app developers should adopt standardized APIs and enhance accessibility features (Section 5.3); and governments should mandate open-access building directories, while subsidizing deployments in high-need areas like hospitals [2,26]. These measures ensure our technology’s benefits extend from campuses to broader public spaces while maintaining ethical data practices (Section 3.3).

Author Contributions

Conceptualization, K.S.B. and N.F.; methodology, K.S.B. and N.F.; software, K.S.B. and I.N.D.K.; visualization, K.S.B., I.N.D.K., K.C.B. and S.C.H.; investigation, K.S.B., K.C.B. and H.H.S.K.; writing original draft, K.S.B.; writing review and editing, N.F.; supervision, N.F. All authors have read and agreed to the published version of this manuscript.

Funding

This research received no external funding.

Institutional Review Board Statement

Not applicable.

Informed Consent Statement

Not applicable.

Data Availability Statement

All data are contained within article.

Acknowledgments

The authors thank the reviewers for their thorough reading and helpful comments and all their colleagues at the Distributed System Laboratory, Okayama University, who were involved in this study.

Conflicts of Interest

The authors declare no conflicts of interest.

References

  1. Fonseca, F.; Conticelli, E.; Papageorgiou, G.; Ribeiro, P.; Jabbari, M.; Tondelli, S.; Ramos, R. Use and perceptions of pedestrian navigation apps: Findings from Bologna and Porto. ISPRS Int. J. Geoinf. 2021, 10, 446. [Google Scholar] [CrossRef]
  2. Fogli, D.; Arenghi, A.; Gentilin, F. User-centered design of a mobile app for accessible cultural heritage. Multimed. Tools Appl. 2020, 79, 33577–33601. [Google Scholar] [CrossRef]
  3. Sheryl Sharon, G.; Rohit Vikaas, P.; Chanduru, A.; Barathkumar, S.; Harsha Vardhan, P.; Mohanapriya, M. Coimbatore Institute of Technology Campus Navigation System. Coimbatore Institute of Technology Campus Navigation System (Version 1.0). Int. J. Res. Appl. Sci. Eng. Technol. (IJRASET) 2023, 11, 1121–1127. [Google Scholar] [CrossRef]
  4. Sheikh, M. Indoor Navigation System. Int. J. Sci. Technol. Eng. 2023, 11, 30–33. [Google Scholar] [CrossRef]
  5. El-Sheimy, N.; Li, Y. Indoor navigation: State of the art and future trends. Satell. Navig. 2021, 2, 7. [Google Scholar] [CrossRef]
  6. Jamshidi, S.; Ensafi, M.; Pati, D. Wayfinding in Interior Environments: An Integrative Review. Front. Psychol. 2020, 11, 549628. [Google Scholar] [CrossRef]
  7. Sarot, R.V.; Delazari, L.S.; Camboim, S.P. Proposal of a spatial database for indoor navigation. Acta Sci. Technol. 2021, 43, e51718. [Google Scholar] [CrossRef]
  8. Wu, Y.; Shang, J.; Chen, P.; Zlatanova, S.; Hu, X.; Zhou, Z. Indoor Mapping and Modeling by Parsing Floor Plan Images. Int. J. Geogr. Inf. Sci. 2021, 35, 1205–1231. [Google Scholar] [CrossRef]
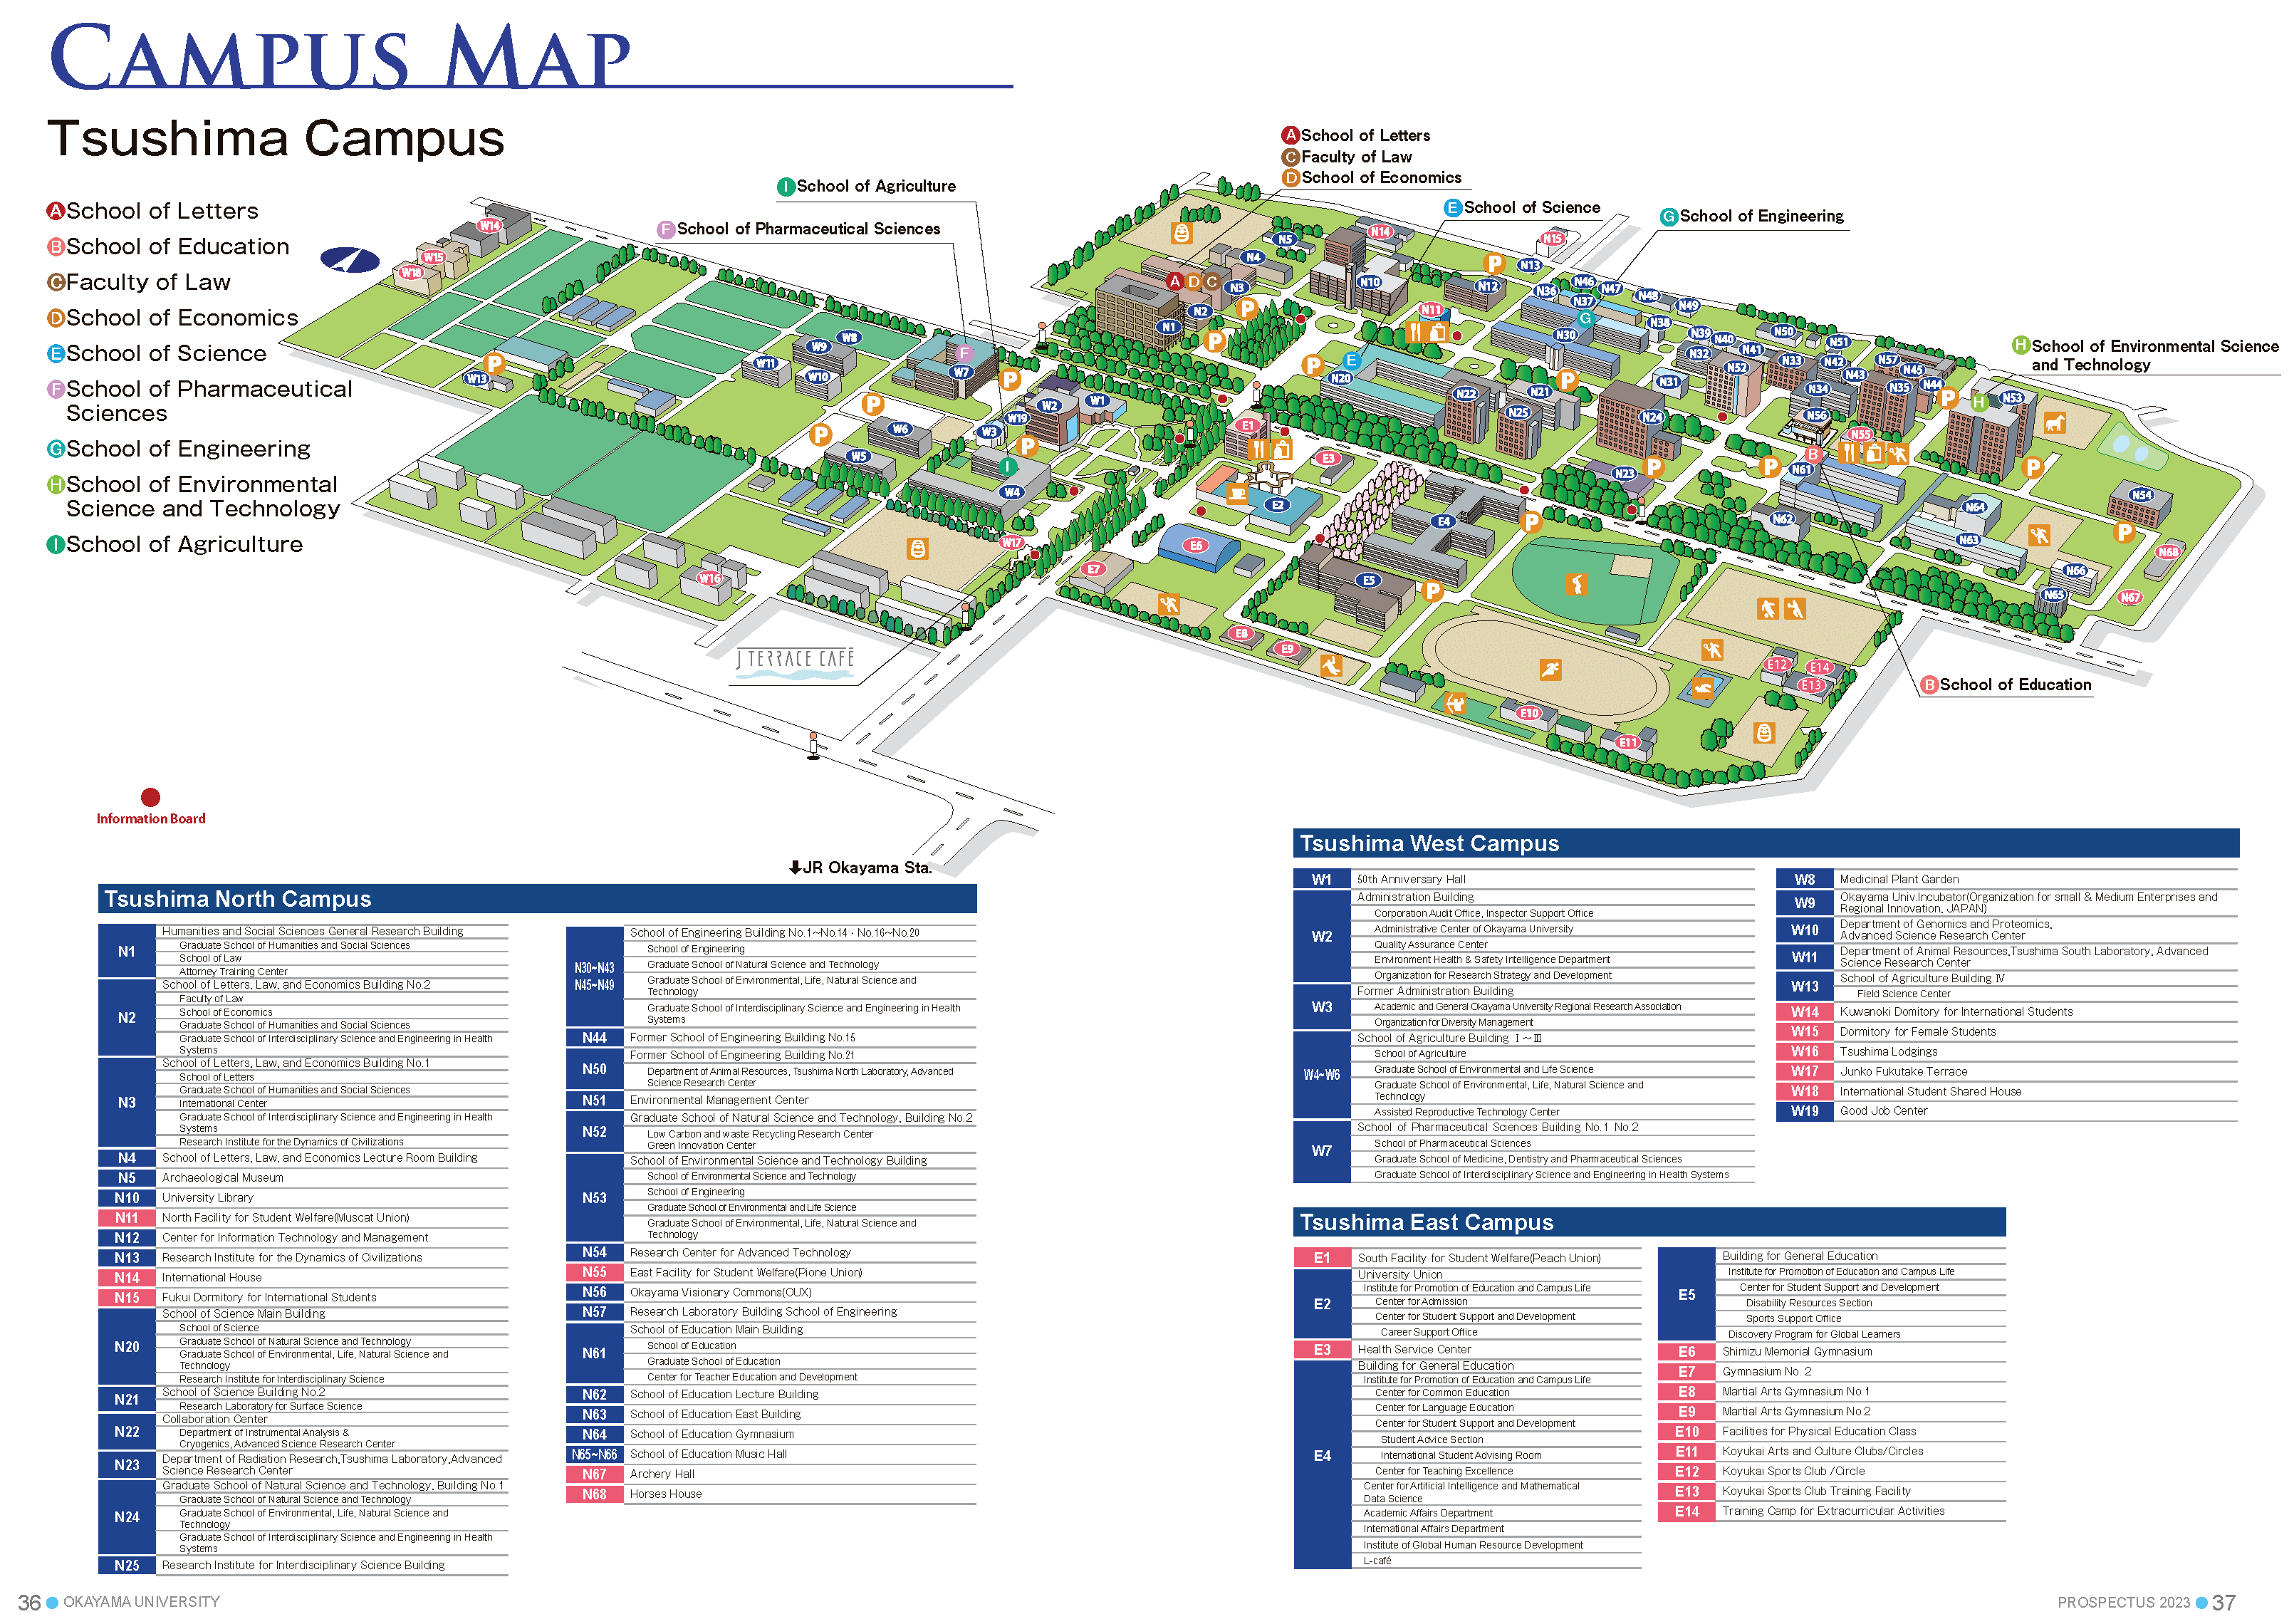
  9. Okayama University. Tsushima Campus Map. Available online: https://www.okayama-u.ac.jp/eng/access_maps/Tsushima_Campus.html (accessed on 12 April 2025).
  10. Park, S.; Kang, T.; Lee, S.; Rhee, J.H. Detection of Pedestrian Turning Motions to Enhance Indoor Map Matching Performance. In Proceedings of the 2023 International Conference on Information and Communication Technology Convergence (ICTC), Jeju Island, Republic of Korea, 11–13 October 2023; IEEE: Piscatway, NJ, USA, 2023. [Google Scholar] [CrossRef]
  11. Hu, Y. The application of SLAM technology in indoor navigation to complex indoor environments. Appl. Comput. Eng. 2023, 12, 52–57. [Google Scholar] [CrossRef]
  12. Wang, J. A Study of The OCR Development History and Directions of Development. Highlights Sci. Eng. Technol. 2023, 72, 409–415. [Google Scholar] [CrossRef]
  13. Rahman, M.M. Text Information Extraction from Digital Image Documents Using Optical Character Recognition. In Computational Intelligence in Image and Video Processing; Patil, M.D., Birajdar, G.K., Chaudhari, S.S., Eds.; CRC Press: Boca Raton, FL, USA, 2022; pp. 1–31. [Google Scholar] [CrossRef]
  14. Archana, D.; Deepak, K.; Lokesh Dhanvanthri, K.S.; Sridharan, S.N.; Vasanth, G.; Sriram Naren, S.; Prawin Balaji, K.S. Image Text Detection and Documentation Using OCR. In Proceedings of the 2024 International Conference on Smart Systems for Electrical, Electronics, Communication and Computer Engineering (ICSSEECC), Coimbatore, India, 28–29 June 2024. [Google Scholar] [CrossRef]
  15. Subramanya, P.K.H. AI-Based Solution for Web Crawling. Int. J. Sci. Res. 2023, 12, 79–183. [Google Scholar] [CrossRef]
  16. Ruchitaa Raj, N.R.; Nandhakumar Raj, S.; Vijayalakshmi, M. Web Scrapping Tools and Techniques: A Brief Survey. In Proceedings of the 2023 International Conference on Innovative Trends in Information Technology (ICITIIT), Kottayam, India, 11–12 February 2023; pp. 1–4. [Google Scholar] [CrossRef]
  17. Okayama University. Okayama University Tsushima Campus Map. 2024. Available online: https://www.okayama-u.ac.jp/up_load_files/freetext/en__Tsushima_Campus/file/map_tsushima.pdf (accessed on 12 April 2025).
  18. Brata, K.C.; Liang, D. Comparative Study of User Experience on Mobile Pedestrian Navigation Between Digital Map Interface and Location-Based Augmented Reality. Int. J. Electr. Comput. Eng. (IJECE) 2020, 10, 2037–2044. [Google Scholar] [CrossRef]
  19. Leitch, S.; Ahmed, Q.; Abbas, W.B.; Hafeez, M.; Laziridis, P.; Sureephong, P.; Alade, T. On Indoor Localization Using WiFi, BLE, UWB, and IMU Technologies. Sensors 2023, 23, 8567. [Google Scholar] [CrossRef] [PubMed]
  20. Bibbò, L.; Bramanti, A.; Sharma, J.; Cotroneo, F. AR Platform for Indoor Navigation: New Potential Approach Extensible to Older People with Cognitive Impairment. BioMedInformatics 2024, 4, 1589–1619. [Google Scholar] [CrossRef]
  21. Biradar, P.M.; Jadhav, S.; Tijore, N.; Tiwari, K.; Jagtap, A. Study of Optical Character Recognition. Alochana Chakra J. 2024, 13, 302–306. [Google Scholar]
  22. Khairi, N.; Rahman, A.; Abdulrahim, K. A Review of Current Trend in Indoor Pedestrian Navigation. J. Eng. Technol. (JET) 2024, 15, 59–82. [Google Scholar] [CrossRef]
  23. Strecha, C.; Rehak, M.; Cucci, D. Mobile Phone Based Indoor Mapping. ISPRS Arch. Photogramm. Remote. Sens. Spat. Inf. Sci. 2024, XLVIII-2, 415–420. [Google Scholar] [CrossRef]
  24. Zhang, W.; Li, Y.; Li, P.; Feng, Z. A BIM and AR-based indoor navigation system for pedestrians on smartphones. KSCE J. Civ. Eng. 2025, 29, 100005. [Google Scholar] [CrossRef]
  25. Triyono, L.; Prayitno; Rahaman, M.; Sukamto; Yobioktabera, A. Smartphone-based Indoor Navigation for Guidance in Finding Location Buildings Using Measured WiFi-RSSI. Int. J. Inform. Vis. 2022, 6, 829–834. [Google Scholar] [CrossRef]
  26. Jin, Z.; Li, Y.; Yang, Z.; Zhang, Y.; Cheng, Z. Real-Time Indoor Positioning Based on BLE Beacons and Pedestrian Dead Reckoning for Smartphones. Appl. Sci. 2023, 13, 4321. [Google Scholar] [CrossRef]
  27. Gang, H.; Pyun, J. A Smartphone Indoor Positioning System Using Hybrid Localization Technology. Energies 2019, 12, 3789. [Google Scholar] [CrossRef]
  28. Huang, B.; Hsu, J.; Chu, E.; Wu, H. ARBIN: Augmented Reality Based Indoor Navigation System. Sensors 2020, 20, 5789. [Google Scholar] [CrossRef] [PubMed]
  29. Rubio-Sandoval, J.; Martinez-Rodriguez, J.; Lopez-Arevalo, I.; Rios-Alvarado, A.; Rodriguez-Rodriguez, A.; Vargas-Requena, D. An indoor navigation methodology for mobile devices by integrating augmented reality and semantic web. Sensors 2021, 21, 5460. [Google Scholar] [CrossRef]
  30. Che, F.; Ahmed, Q.; Lazaridis, P.; Sureephong, P.; Alade, T. Indoor Positioning System (IPS) Using Ultra-Wide Bandwidth (UWB)—For Industrial Internet of Things (IIoT). Sensors 2023, 23, 5392. [Google Scholar] [CrossRef] [PubMed]
  31. Pivavaruk, I.; Fonseca Cacho, J.R. OCR Enhanced Augmented Reality Indoor Navigation. In Proceedings of the 2022 IEEE International Conference on Artificial Intelligence and Virtual Reality (AIVR), Online, 12–14 December 2022; pp. 186–192. [Google Scholar] [CrossRef]
  32. Wu, Z.; Chen, X.; Wang, J.; Wang, X.; Gan, Y.; Fang, M.; Xu, T. OCR-RTPS: An OCR-based real-time positioning system for the valet parking. Appl. Intell. 2023, 53, 17920–17934. [Google Scholar] [CrossRef]
  33. Weerasinghe, M.; Maduranga, M.; Kawya, M.M.V.T. Enhancing Web Scraping with Artificial Intelligence: A Review. In Proceedings of the 4th Student Symposium of General Sir John Kotelawala Defence University, Ratmalana, Sri Lanka, 17 January 2024; Available online: https://www.researchgate.net/publication/379024314_Enhancing_Web_Scraping_with_Artificial_Intelligence_A_Review (accessed on 10 March 2025).
  34. Brenning, A.; Henn, S. Web scraping: A promising tool for geographic data acquisition. arXiv 2023, arXiv:2305.19893. [Google Scholar] [CrossRef]
  35. Galvez-Hernandez, P.; Gonzalez-Viana, A.; Gonzalez-de Paz, L.; Shankardass, K.; Muntaner, C. Generating Contextual Variables From Web-Based Data for Health Research: Tutorial on Web Scraping, Text Mining, and Spatial Overlay Analysis. JMIR Public Health Surveill. 2024, 10, e50379. [Google Scholar] [CrossRef]
  36. Agarwal, D.; Jeevan, J.; Manikandan, R.K.; Ramith, N.R.; Vandana, M.L. Advanced Automated Document Processing Using Optical Character Recognition (OCR). In Proceedings of the 2024 IEEE 9th International Conference for Convergence in Technology (I2CT), Pune, India, 5–7 April 2024; pp. 1–5. [Google Scholar] [CrossRef]
  37. Google Developers. ML Kit Text Recognition v2. 2024. Available online: https://developers.google.com/ml-kit/vision/text-recognition/v2?hl=id (accessed on 27 April 2025).
  38. Isgar, C. System for Social Interaction Regarding Features Based on Geolocation. U.S. Patent US20200219205A1, 9 January 2020. [Google Scholar]
  39. Mustapha, S.; Man, M.; Wan Abu Bakar, W.A.; Yusof, M.K.; Sabri, I.A.A. Demystified Overview of Data Scraping. Int. J. Data Sci. Anal. Appl. 2024, 6, 290–296. [Google Scholar] [CrossRef]
  40. Sharma, G. Web Crawling and Scraping: A Survey. In Proceedings of the 2024 International Conference on Healthcare Innovations, Software and Engineering Technologies (HISET), Karad, India, 18–19 January 2024; pp. 190–192. [Google Scholar] [CrossRef]
  41. Batista, N.A.; Brandão, M.A.; Pinheiro, M.B.; Dalip, D.H.; Moro, M.M. Data from Multiple Web Sources: Crawling, Integrating, Preprocessing, and Designing Applications. In Special Topics in Multimedia, IoT and Web Technologies; Roesler, V., Barrére, E., Willrich, R., Eds.; Springer International Publishing: Cham, Switzerland, 2020; pp. 213–242. [Google Scholar] [CrossRef]
  42. Khder, M.A. Web Scraping or Web Crawling: State of Art, Techniques, Approaches, and Application. Int. J. Adv. Soft Comput. Appl. (IJASCA) 2021, 13, 11–20. [Google Scholar] [CrossRef]
  43. ScrapeHero Team. Web Scraping Vs. Web Crawling: Similarities and Differences. 2023. Available online: https://www.scrapehero.com/web-scraping-vs-web-crawling/?utm_source=chatgpt.com (accessed on 25 April 2025).
  44. Brata, K.C.; Funabiki, N.; Riyantoko, P.A.; Panduman, Y.Y.F.; Mentari, M. Performance Investigations of VSLAM and Google Street View Integration in Outdoor Location-Based Augmented Reality under Various Lighting Conditions. Electronics 2024, 13, 2930. [Google Scholar] [CrossRef]
  45. Brata, K.C.; Funabiki, N.; Panduman, Y.Y.F.; Mentari, M.; Syaifudin, Y.W.; Rahmadani, A.A. A Proposal of In Situ Authoring Tool with Visual-Inertial Sensor Fusion for Outdoor Location-Based Augmented Reality. Electronics 2025, 14, 342. [Google Scholar] [CrossRef]
  46. Brata, K.C.; Funabiki, N.; Panduman, Y.Y.F.; Fajrianti, E.D. An Enhancement of Outdoor Location-Based Augmented Reality Anchor Precision through VSLAM and Google Street View. Sensors 2024, 24, 1161. [Google Scholar] [CrossRef]
  47. Fajrianti, E.D.; Funabiki, N.; Sukaridhoto, S.; Panduman, Y.Y.F.; Dezheng, K.; Shihao, F.; Surya Pradhana, A.A. INSUS: Indoor Navigation System Using Unity and Smartphone for User Ambulation Assistance. Information 2023, 14, 359. [Google Scholar] [CrossRef]
  48. Fajrianti, E.D.; Panduman, Y.Y.F.; Funabiki, N.; Haz, A.L.; Brata, K.C.; Sukaridhoto, S. A User Location Reset Method through Object Recognition in Indoor Navigation System Using Unity and a Smartphone (INSUS). Network 2024, 4, 295–312. [Google Scholar] [CrossRef]
  49. Biljecki, F.; Chow, Y.S.; Lee, K. Quality of Crowdsourced Geospatial Building Information: A Global Assessment of OpenStreetMap Attributes. Build. Environ. 2023, 237, 110295. [Google Scholar] [CrossRef]
  50. Glomb, D.; Wolff, C. User Experience and Multimodal Usability for Navigation Systems. In Annals of Computer Science and Information Systems; Polish Information Processing Society: Warsaw, Poland, 2022; Volume 30, pp. 207–210. [Google Scholar] [CrossRef]
  51. Kotama, I.N.D.; Funabiki, N.; Panduman, Y.Y.F.; Brata, K.C.; Pradhana, A.A.S.; Noprianto; Desnanjaya, I.G.M.N. Improving the Accuracy of Information Retrieval Using Deep Learning Approaches. Information 2025, 16, 108. [Google Scholar] [CrossRef]
  52. Harwati, T.S.; Nendya, M.B.; Dendy Senapartha, I.K.; Lukito, Y.; Tjahjono, F.N.; Jovan, K.I. Usability Evaluation of Augmented Reality Indoor Navigation: A System Usability Scale Approach. In Proceedings of the 2024 2nd International Conference on Technology Innovation and Its Applications (ICTIIA), Medan, Indonesia, 12–13 September 2024; pp. 1–5. [Google Scholar] [CrossRef]
  53. Cao, D.; Yan, X.; Li, J.; Li, J.; Wu, L. Automated Icon Extraction from Tourism Maps: A Synergistic Approach Integrating YOLOv8x and SAM. ISPRS Int. J. Geo-Inf. 2025, 14, 55–67. [Google Scholar] [CrossRef]
  54. Usha, S.M.; Kumar, D.M.; Mahesh, H.B. Traffic Signboard Recognition and Text Translation System using Word Spotting and Machine Learning. ITM Web Conf. 2022, 50, 01010. [Google Scholar] [CrossRef]
  55. Nazeem, M.; Anitha, R.; Navaneeth, S.; Rajeev, R.R. Open-Source OCR Libraries: A Comprehensive Study for Low Resource Language. In Proceedings of the 21st International Conference on Natural Language Processing (ICON), Chennai, India, 19–22 December 2024; Lalitha Devi, S., Arora, K., Eds.; AU-KBC Research Centre: Chennai, India, 2024; pp. 416–421. [Google Scholar]
Figure 1. Overall methodology of the proposed map information collection.
Information 16 00588 g001
Figure 2. Data collection workflow.
Information 16 00588 g002
Figure 3. Web scraping using Scrapy framework.
Information 16 00588 g003
Figure 4. Data crawling using Apache Nutch.
Information 16 00588 g004
Figure 5. Overview of the map information collection tool.
Information 16 00588 g005
Figure 6. Building photo and geolocation findings.
Information 16 00588 g006
Figure 7. Text extraction using OCR.
Information 16 00588 g007
Figure 8. Information collection using web scraping and crawling.
Information 16 00588 g008
Figure 9. Data with sources in database.
Information 16 00588 g009
Figure 10. Database schema for building data.
Information 16 00588 g010
Figure 11. Data management overview of database system.
Information 16 00588 g011
Figure 12. Okayama University Tsushima campus map used as the experiment site [17].
Information 16 00588 g012
Figure 13. Data collection interfaces. (1) Login page for users with superadmin account; (2) Text scanning on a building using the camera, followed by the display of location coordinates (latitude and longitude); (3) Search results of the detected place based on the collected data; (4) Detailed view of the place, including map preview and navigation button; (5) Staff details at the location, including name, floor, and room number.
Information 16 00588 g013
Figure 14. Pedestrian navigation interface. (1) Search results showing location and staff data; (2) Detailed place view including coordinates and building photo; (3) List of staff members and their room locations; (4) Route preview from current location to the destination using map view; (5) AR-based outdoor navigation with directional guidance; (6) AR indoor navigation leading to the correct room; (7) Arrival indicator displayed when close to the destination.
Information 16 00588 g014
Figure 15. Data completeness rates.
Information 16 00588 g015
Figure 16. SUS Scores from 10 Participants.
Information 16 00588 g016
Table 1. Comparison between web scraping and data crawling.
AspectWeb ScrapingData Crawling
ObjectiveTo extract specific data elements from identified web pagesTo discover and index web pages relevant to the input text
FunctionTo retrieve structured or unstructured data from page contentTo navigate through multiple URLs in locating data sources to locate data sources
InputTo input specific web pages (typically from crawling results)To insert/input user-defined keywords or seed URLs
OutputTo obtain the targeted data such as titles, prices, or metadataTo gather/generate a list of relevant URLs or page structures
Technology UsedTo implement parsers, HTML extractors, tools like BeautifulSoup or ScrapyTo implement crawlers, spiders, URL explorers
Table 2. OCR and geolocation data.
NoOCR ResultAddressLatitudeLongitudeMaps Link (accessed on 13 May 2025)Image (accessed on 13 May 2025)
1School of Science Main Building3-1-1 Tsushima-naka, Kita-ku, Okayama 700-8530133.920240934.688476https://www.google.com/maps/search/?api=1&query=34.688476,133.9202409https://geolocation.polinema.web.id/storage/image_building/CmLJAJGfk0bbs1hNsmKVtnIgwzffj8s9xQiWxhZL.jpg
2School of Engineering Building No. 13-1-1 Tsushima-naka, Kita-ku, Okayama 700-8530133.921476634.6892846https://www.google.com/maps/search/?api=1&query=34.6892846,133.9214766https://geolocation.polinema.web.id/storage/image_building/0lCopFVqM5Us6RFgjhYkz19sfbUAsNCiApgBR6ic.jpg
3School of Engineering Building No. 23-1-1 Tsushima-naka, Kita-ku, Okayama 700-8530a34.6894203133.9228441https://www.google.com/maps/search/?api=1query=34.6893954,133.9226147https://geolocation.polinema.web.id/storage/image_building/6RIdXzeadP2s7oVSMFgehQUtoEk1ff6899sSYaFE.jpg
4School of Engineering Building No. 33-1-1 Tsushima-naka, Kita-ku, Okayama 700-8530133.922768434.6898049https://www.google.com/maps/search/?api=1&query=34.6898049,133.9227684https://geolocation.polinema.web.id/storage/image_building/ktI26yeEJ7oOaARmA083fLmLcqr8xEEErcRgLQlL.jpg
5Faculty of Agriculture Building No. 11-1-1 Tsushima-naka, Kita-ku, Okayama 700-8530133.919372934.6858829https://www.google.com/maps/search/?api=1&query=34.6859949040035,133.9190462940186https://geolocation.polinema.web.id/storage/image_building/0MgfvY3k5Z054mc561Zu7BnJDwxIwn6pfDolyoP3.jpg
6Faculty of Agriculture Building No. 21-1-1 Tsushima-naka, Kita-ku, Okayama 700-8530133.917718634.685662https://www.google.com/maps/search/?api=1&query=34.685662,133.9177186https://geolocation.polinema.web.id/storage/image_building/1MH3LAel20NkAT8lXBQooPqWgKydJ4i8viTj44e2.jpg
7Faculty of Agriculture Building No. 31-1-1 Tsushima-naka, Kita-ku, Okayama 700-8530133.917672134.686012https://www.google.com/maps/search/?api=1&query=34.686012,133.9176721https://geolocation.polinema.web.id/storage/image_building/oD3sLYDgWvJoNmYFGiDtUxBJuZRSVhYlzszB4LKP.jpg
8Library University Okayama3-1-1 Tsushima-naka, Kita-ku, Okayama 700-8530133.919565634.6894708https://www.google.com/maps/search/?api=1&query=34.6894708,133.9195656https://geolocation.polinema.web.id/storage/image_building/ZzgYadpwhEpYlAiwhTSpagiBVgUQhZQHf44dmydq.jpg
9Graduate School Natural Science and Technology Building No. 13-1-1 Tsushima-naka, Kita-ku, Okayama 700-8530133.922760734.68881https://www.google.com/maps/search/?api=1&query=34.68881,133.9227607https://geolocation.polinema.web.id/storage/image_building/6ZXIZuxmmQ67uelqaDzRqmKIvOK2vLlwvtLY4rny.jpg
10Graduate School of Natural Science and Technology Building No. 23-1-1 Tsushima-naka, Kita-ku, Okayama 700-8530133.92366834.6894632https://www.google.com/maps/search/?api=1&query=34.6894367,133.9230086https://geolocation.polinema.web.id/storage/image_building/aP6fUxTzEnotKY6sqwmDBHb6RVym3PO7czWxJZxY.jpg
Table 3. Integration of data by OCR, web scraping, and crawling.
No.Name BuildingName StaffFloorRoom
1School of Science Main BuildingKoji Yoshimura1101
2School of Engineering Building No. 1Tomoya Miura3A306
3School of Engineering Building No. 2Nobuo Funabiki2D206
4School of Engineering Building No. 2Htoo Htoo Sandi Kyaw3D308
5School of Engineering Building No. 3Yasuki Nogami2E219
6Faculty of Agriculture Building No. 1Koichiro Ushijima21267
7Faculty of Agriculture Building No. 2Tamura Takashi32325
8Faculty of Agriculture Building No. 3Hiroaki Funahashi23203
9Graduate School Natural Science and Technology Building No. 1Kondo Kei3D303
10Graduate School of Natural Science and Technology Building No. 2Shinichi Nishimura1116
Table 4. Number of collected data.
NoCategoryTotal Entries
1Professor’s Room402
2Room1225
3Building38
4Menu Food in Muscat66
5Menu Food in PIONE52
6Toilet340
7Canteen4
8Bus Stop6
9POS2
10Sports Venue15
Table 5. Data completeness for 10 buildings.
Name of BuildingTotal RoomsCaptured RoomsCompleteness
School of Science Main Building34934498.57%
School of Engineering Building No. 133633499.40%
School of Engineering Building No. 2302686.67%
School of Engineering Building No. 3656295.38%
Faculty of Agriculture Building No. 114113897.87%
Faculty of Agriculture Building No. 2454497.78%
Faculty of Agriculture Building No. 3484593.75%
Library University Okayama494693.88%
Graduate School Natural Science and Technology Building No. 112912496.12%
Graduate School of Natural Science and Technology Building No. 2757296.00%
Table 6. Post-test questions.
No.QuestionCategory
1I think I would like to use this pedestrian navigation system frequently for finding rooms or destinations inside buildings.Usefulness
2I found the navigation system unnecessarily complex when trying to search for room or occupant information.Ease of Use
3I thought the system was easy to use when navigating through building interiors.Ease of Use
4I think I would need technical support to use this system effectively.Learning Curve
5I found the system’s features, such as image capture, OCR results, and navigation integration, were well integrated.Efficiency
6I noticed inconsistencies in the system, such as mismatched or unclear room information.Error Handling
7I believe most people would quickly learn how to use this system for indoor navigation.Learning Curve
8I found the system cumbersome to use when collecting or navigating with map information.Ease of Use
9I felt confident using this system to locate rooms or persons inside campus buildings.Usefulness
10I had to learn a lot before I could start effectively using the system.Learning Curve
Table 7. Pre-test questions.
AnswerPedestrianRate
Yes10100%
No00%
Table 8. SUS scores from 10 participants.
ParticipantResponses (Q1–Q10)SUS Score
15, 1, 5, 1, 5, 1, 5, 1, 5, 1100.0
25, 1, 5, 1, 5, 1, 1, 2, 4, 190.0
34, 3, 4, 3, 4, 4, 4, 2, 4, 172.5
45, 1, 5, 1, 5, 1, 5, 1, 5, 1100.0
55, 1, 5, 1, 5, 1, 5, 1, 5, 1100.0
65, 1, 5, 1, 5, 1, 5, 1, 5, 1100.0
74, 2, 4, 2, 4, 1, 5, 1, 4, 287.5
85, 1, 5, 1, 5, 1, 5, 1, 5, 1100.0
95, 1, 5, 1, 5, 1, 5, 1, 5, 1100.0
104, 2, 5, 2, 4, 2, 5, 1, 4, 287.5
Disclaimer/Publisher’s Note: The statements, opinions and data contained in all publications are solely those of the individual author(s) and contributor(s) and not of MDPI and/or the editor(s). MDPI and/or the editor(s) disclaim responsibility for any injury to people or property resulting from any ideas, methods, instructions or products referred to in the content.

