

Uncovering Key Factors of Student Performance in Math: An Explainable Deep Learning Approach Using TIMSS 2019 Data

Abstract
1. Introduction
- (i)
- What are the most influential contextual factors, drawn from the TIMSS 2019 data, that predict mathematics performance among Moroccan eighth-grade students?
- (ii)
- How can explainable machine learning techniques help uncover these factors and translate them into actionable insights for teachers and policymakers?
2. Related Works
3. Material and Methods
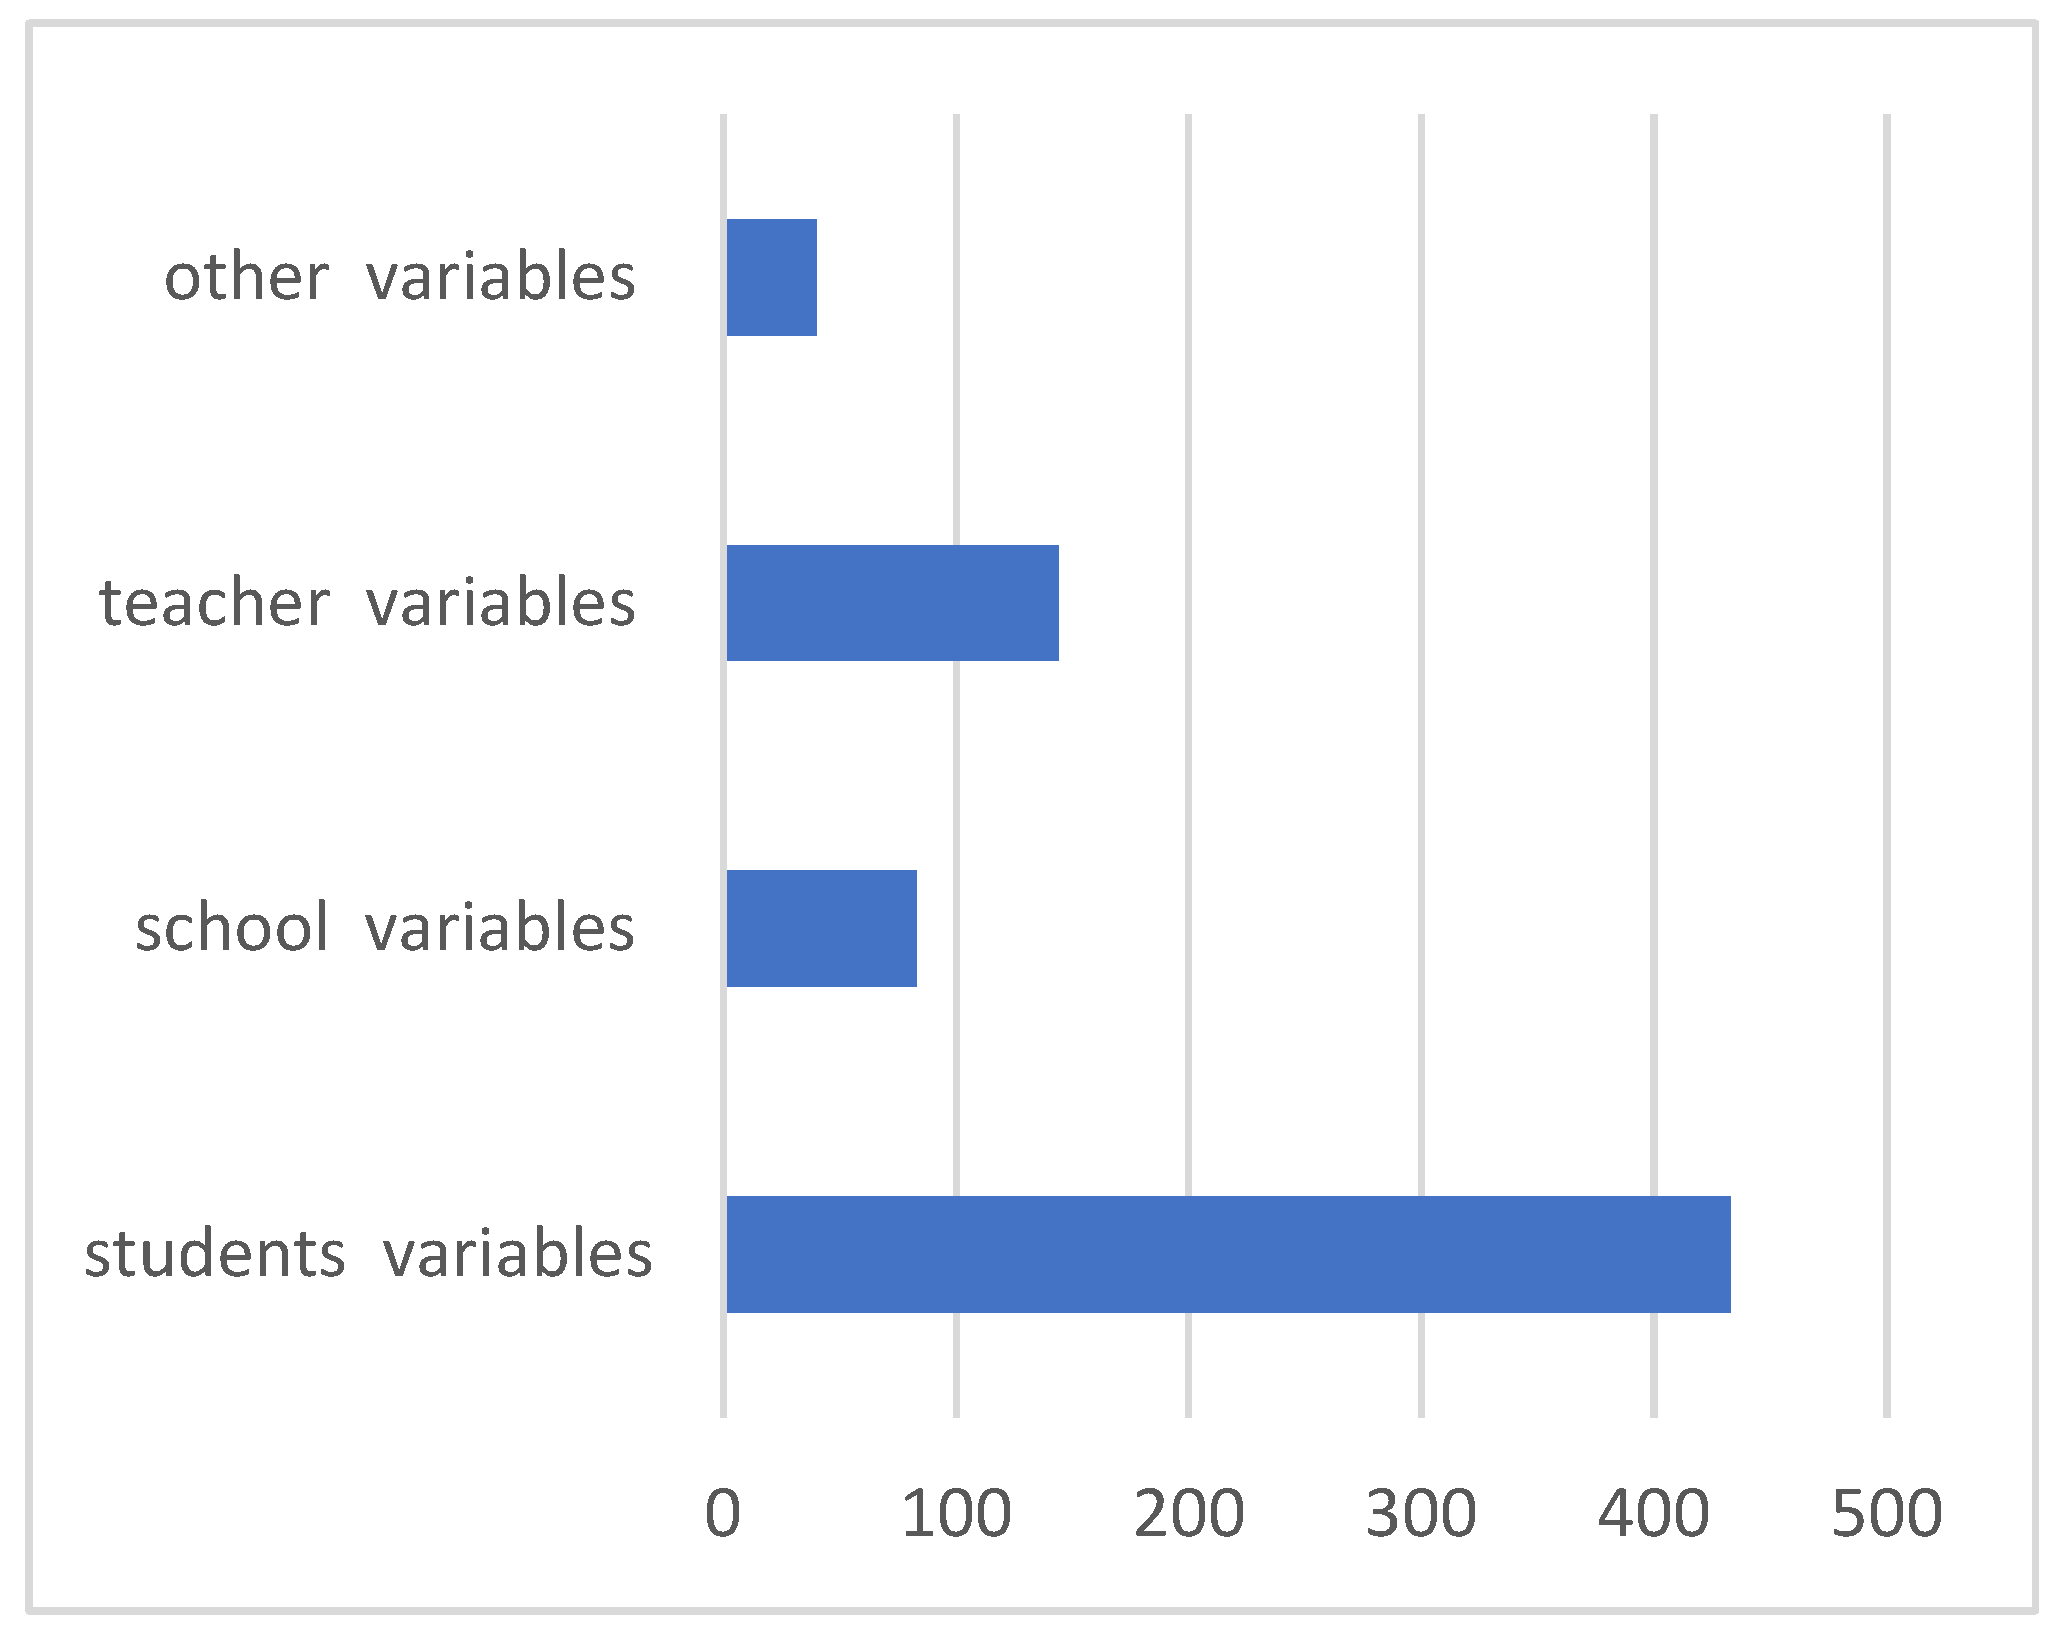
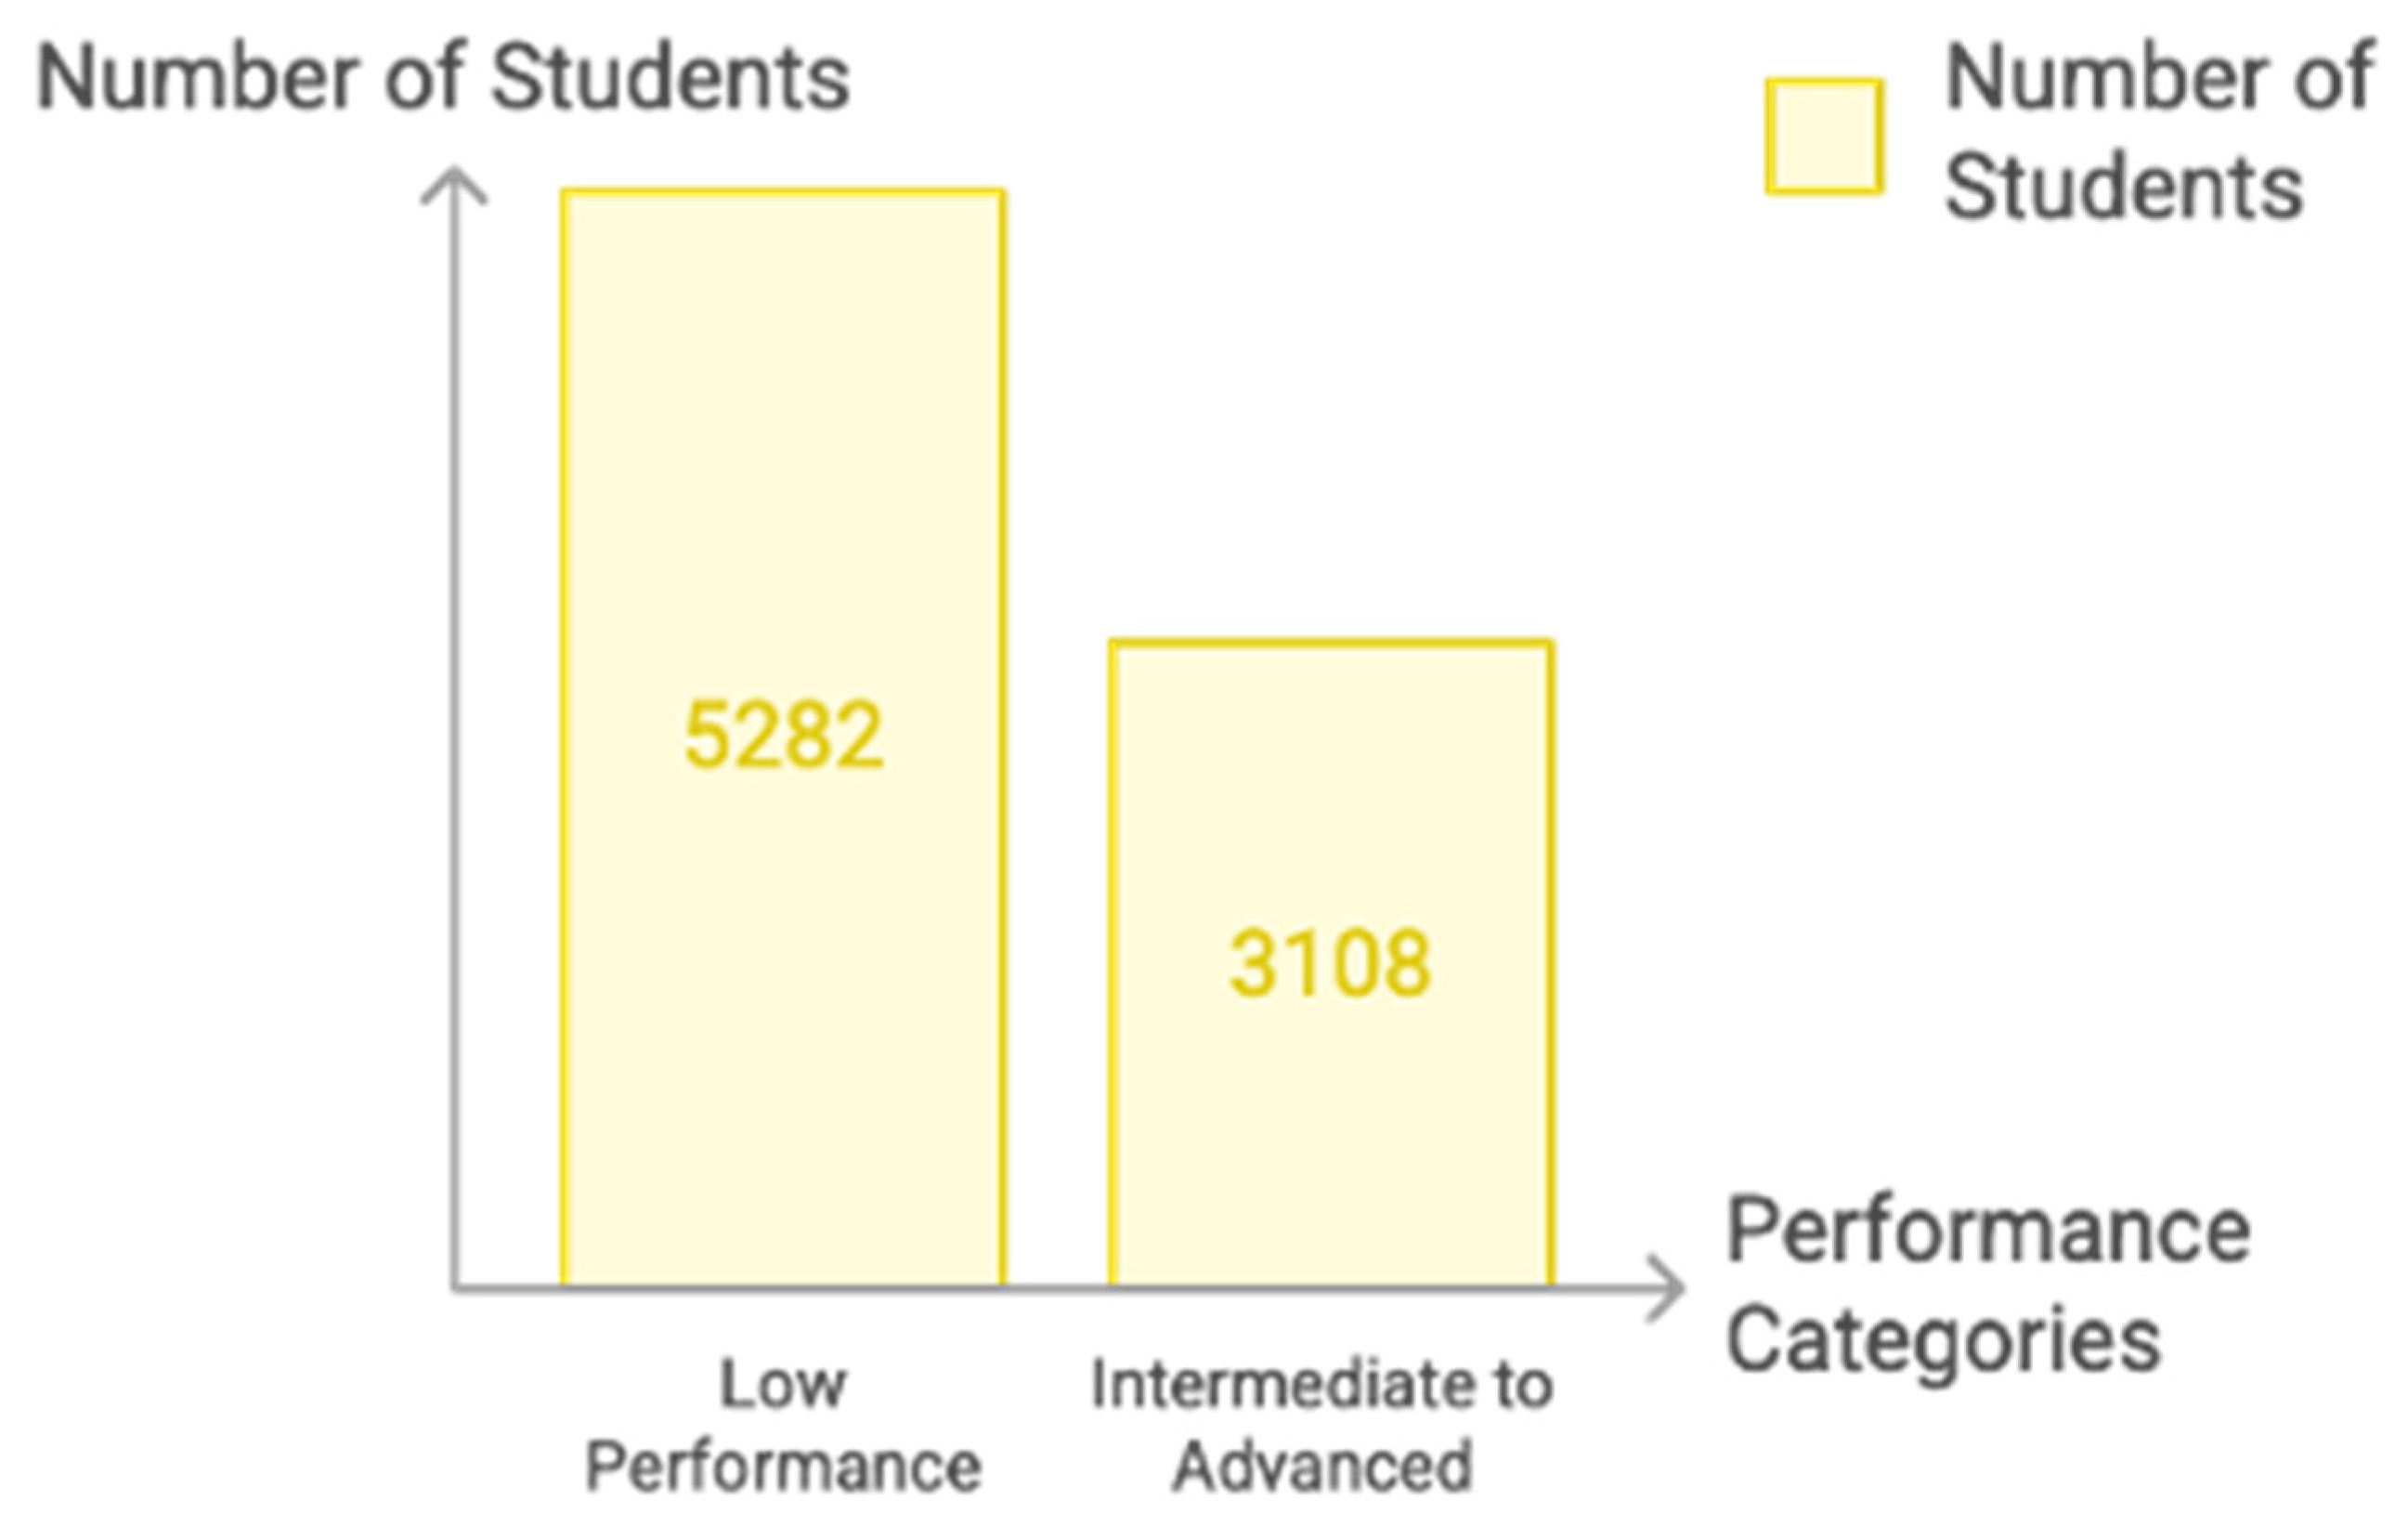
3.1. Data Description
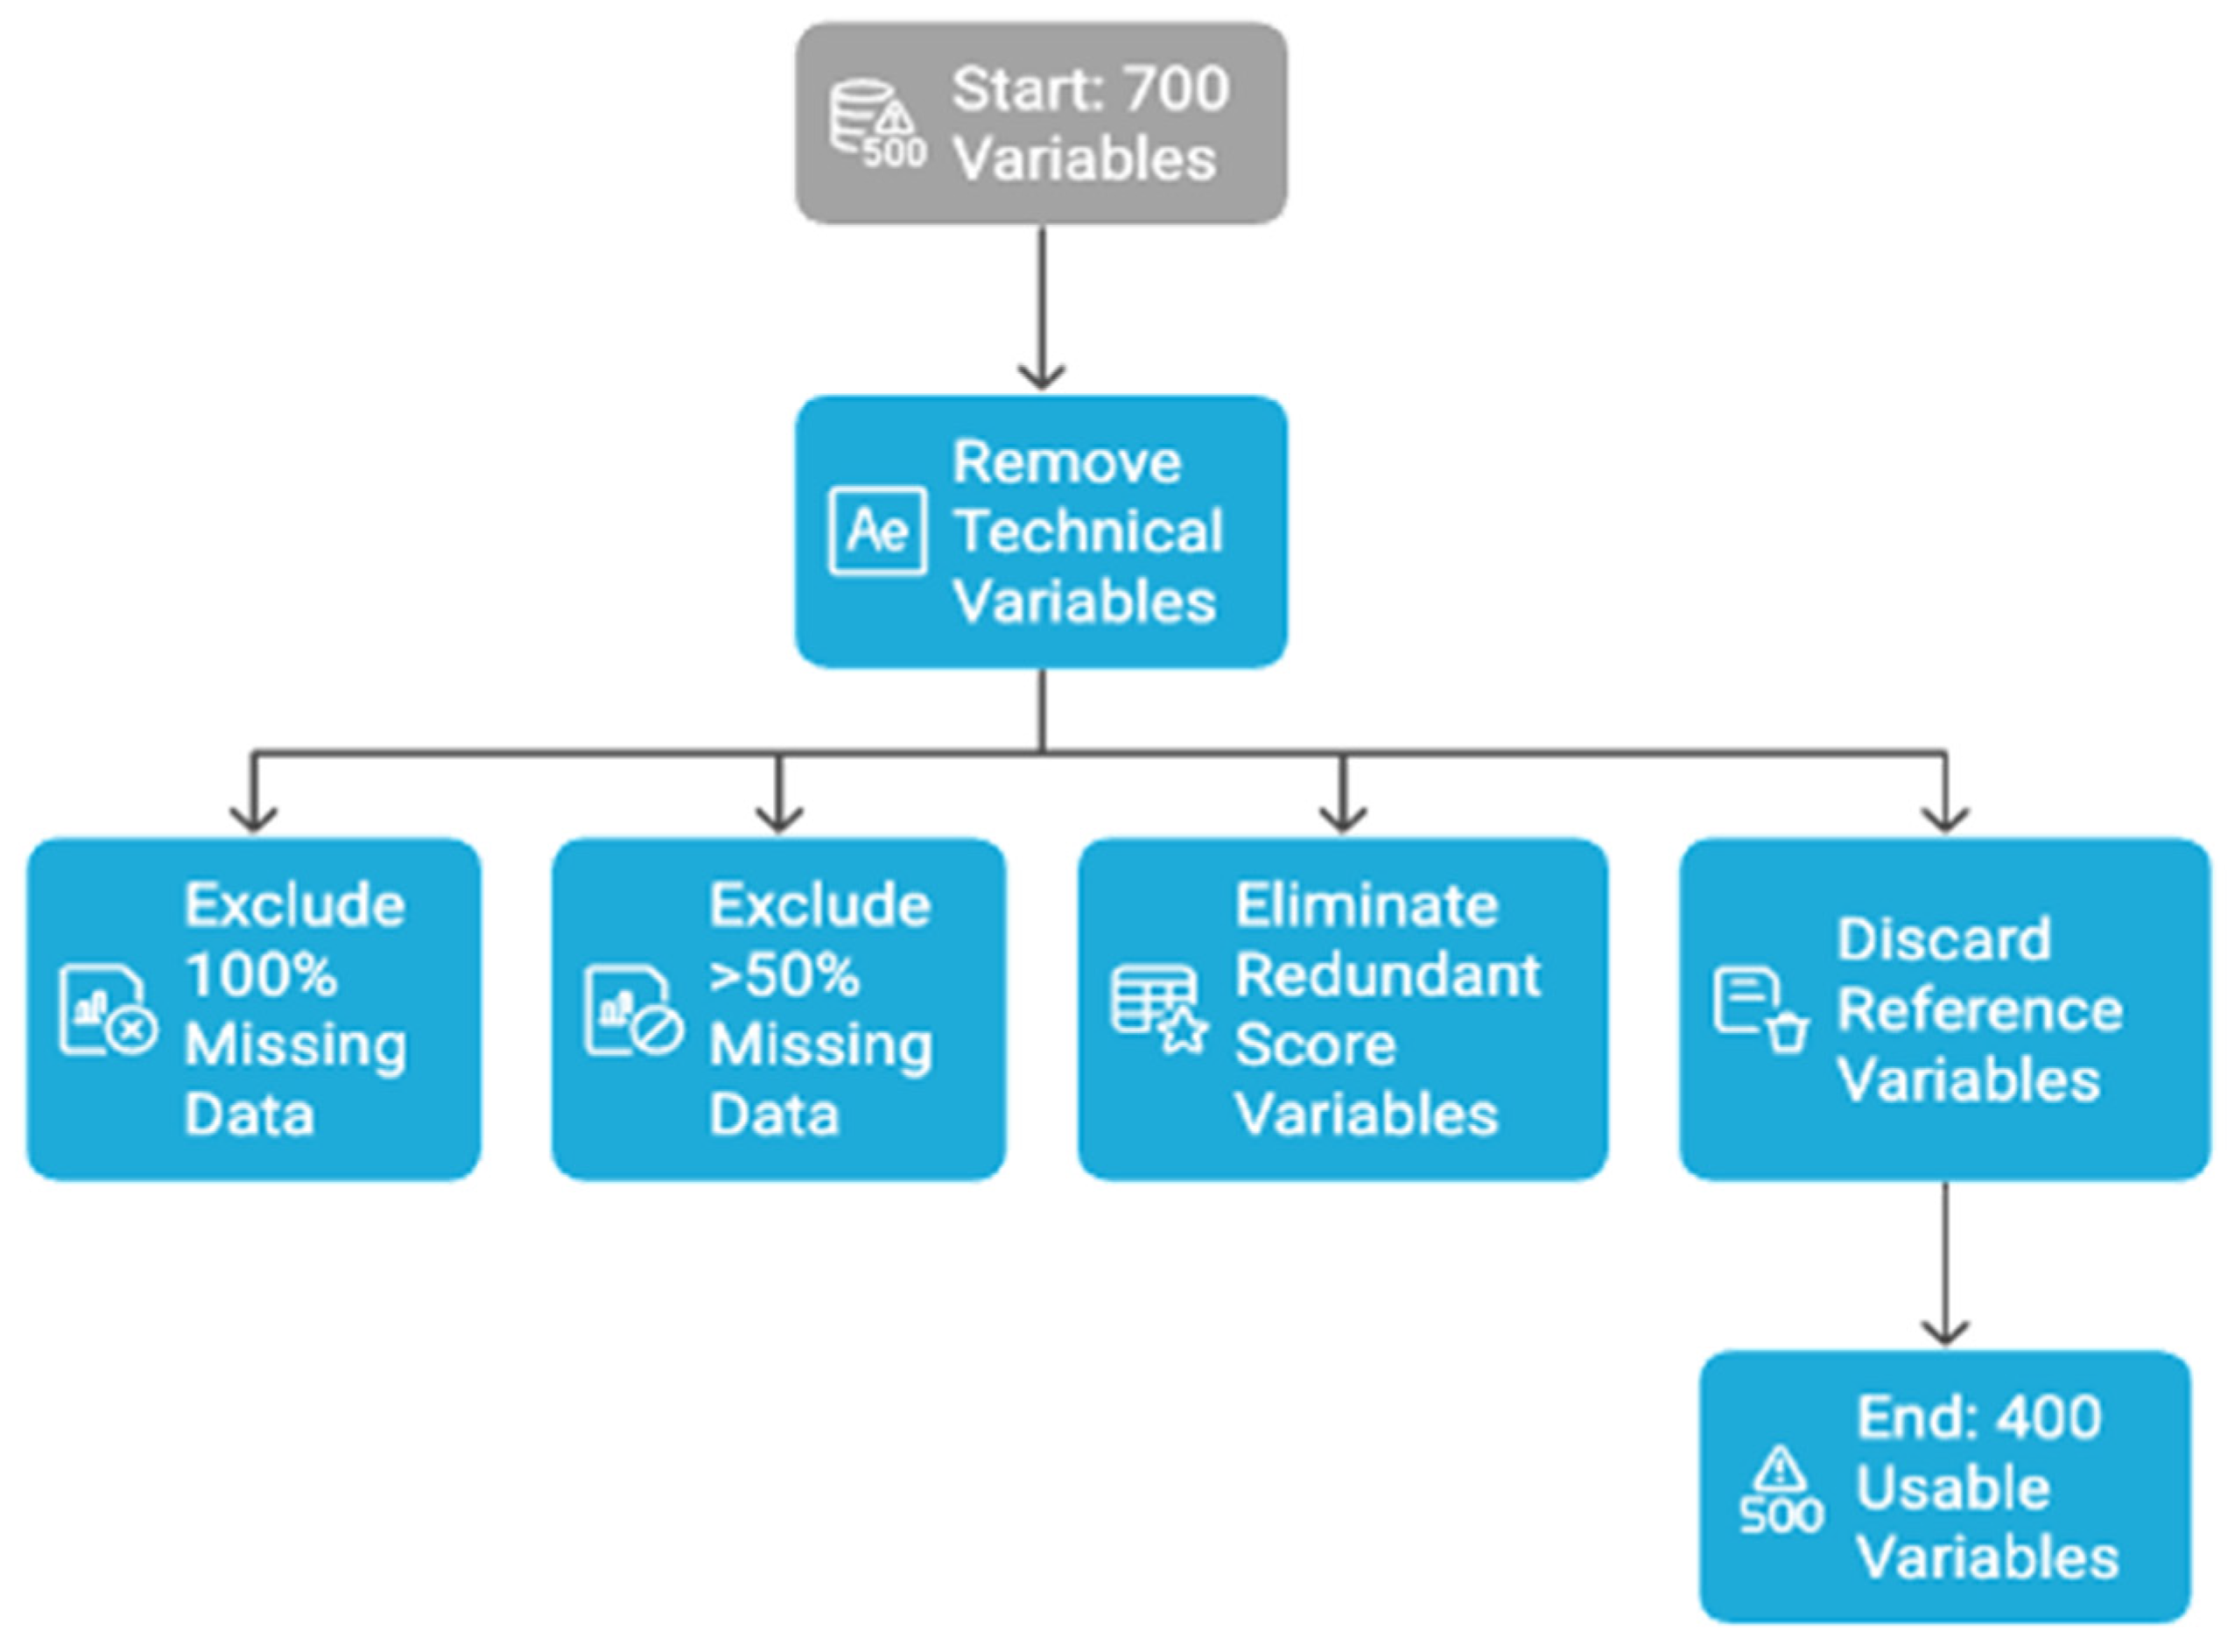
3.2. Data Pre-Processing
3.3. Classification Models
- Random Forest (RF) is an ensemble learning technique that constructs many Decision Trees during the training phase and combines their predictions to enhance overall model accuracy. By aggregating the results of individual trees often through majority voting in classification tasks, Random Forest reduces the risk of overfitting, a common issue in single Decision Trees. This method proves especially effective when dealing with high-dimensional datasets, as it can automatically capture complex feature interactions and identify the most influential variables, making it a robust tool for both prediction and feature importance analysis [25].
- XGBoost (Extreme Gradient Boosting) is a highly efficient and scalable implementation of gradient boosting that builds Decision Trees in a sequential manner. Each new tree is trained to correct the errors made by the previous ones, allowing the model to progressively refine its predictions. What sets XGBoost apart is its incorporation of advanced regularization techniques, which help prevent overfitting—a common challenge in complex models. Additionally, XGBoost is optimized for both computational speed and predictive accuracy, making it a preferred choice for high-dimensional datasets and competitive machine learning tasks [26].
- Support Vector Machine (SVM) is a classification algorithm that aims to find the optimal hyperplane separating different classes with the maximum margin. It is well-suited for high-dimensional spaces and non-linear classification when used with kernel functions, such as the radial basis function (RBF) [27].
- Decision Tree (DT) is a tree structured classifier where each internal node represents a test based on an attribute, each branch corresponds to an outcome, and each leaf node represents a class label. Although it is prone to overfitting when used alone, its interpretability makes it valuable for understanding classification rules [28].
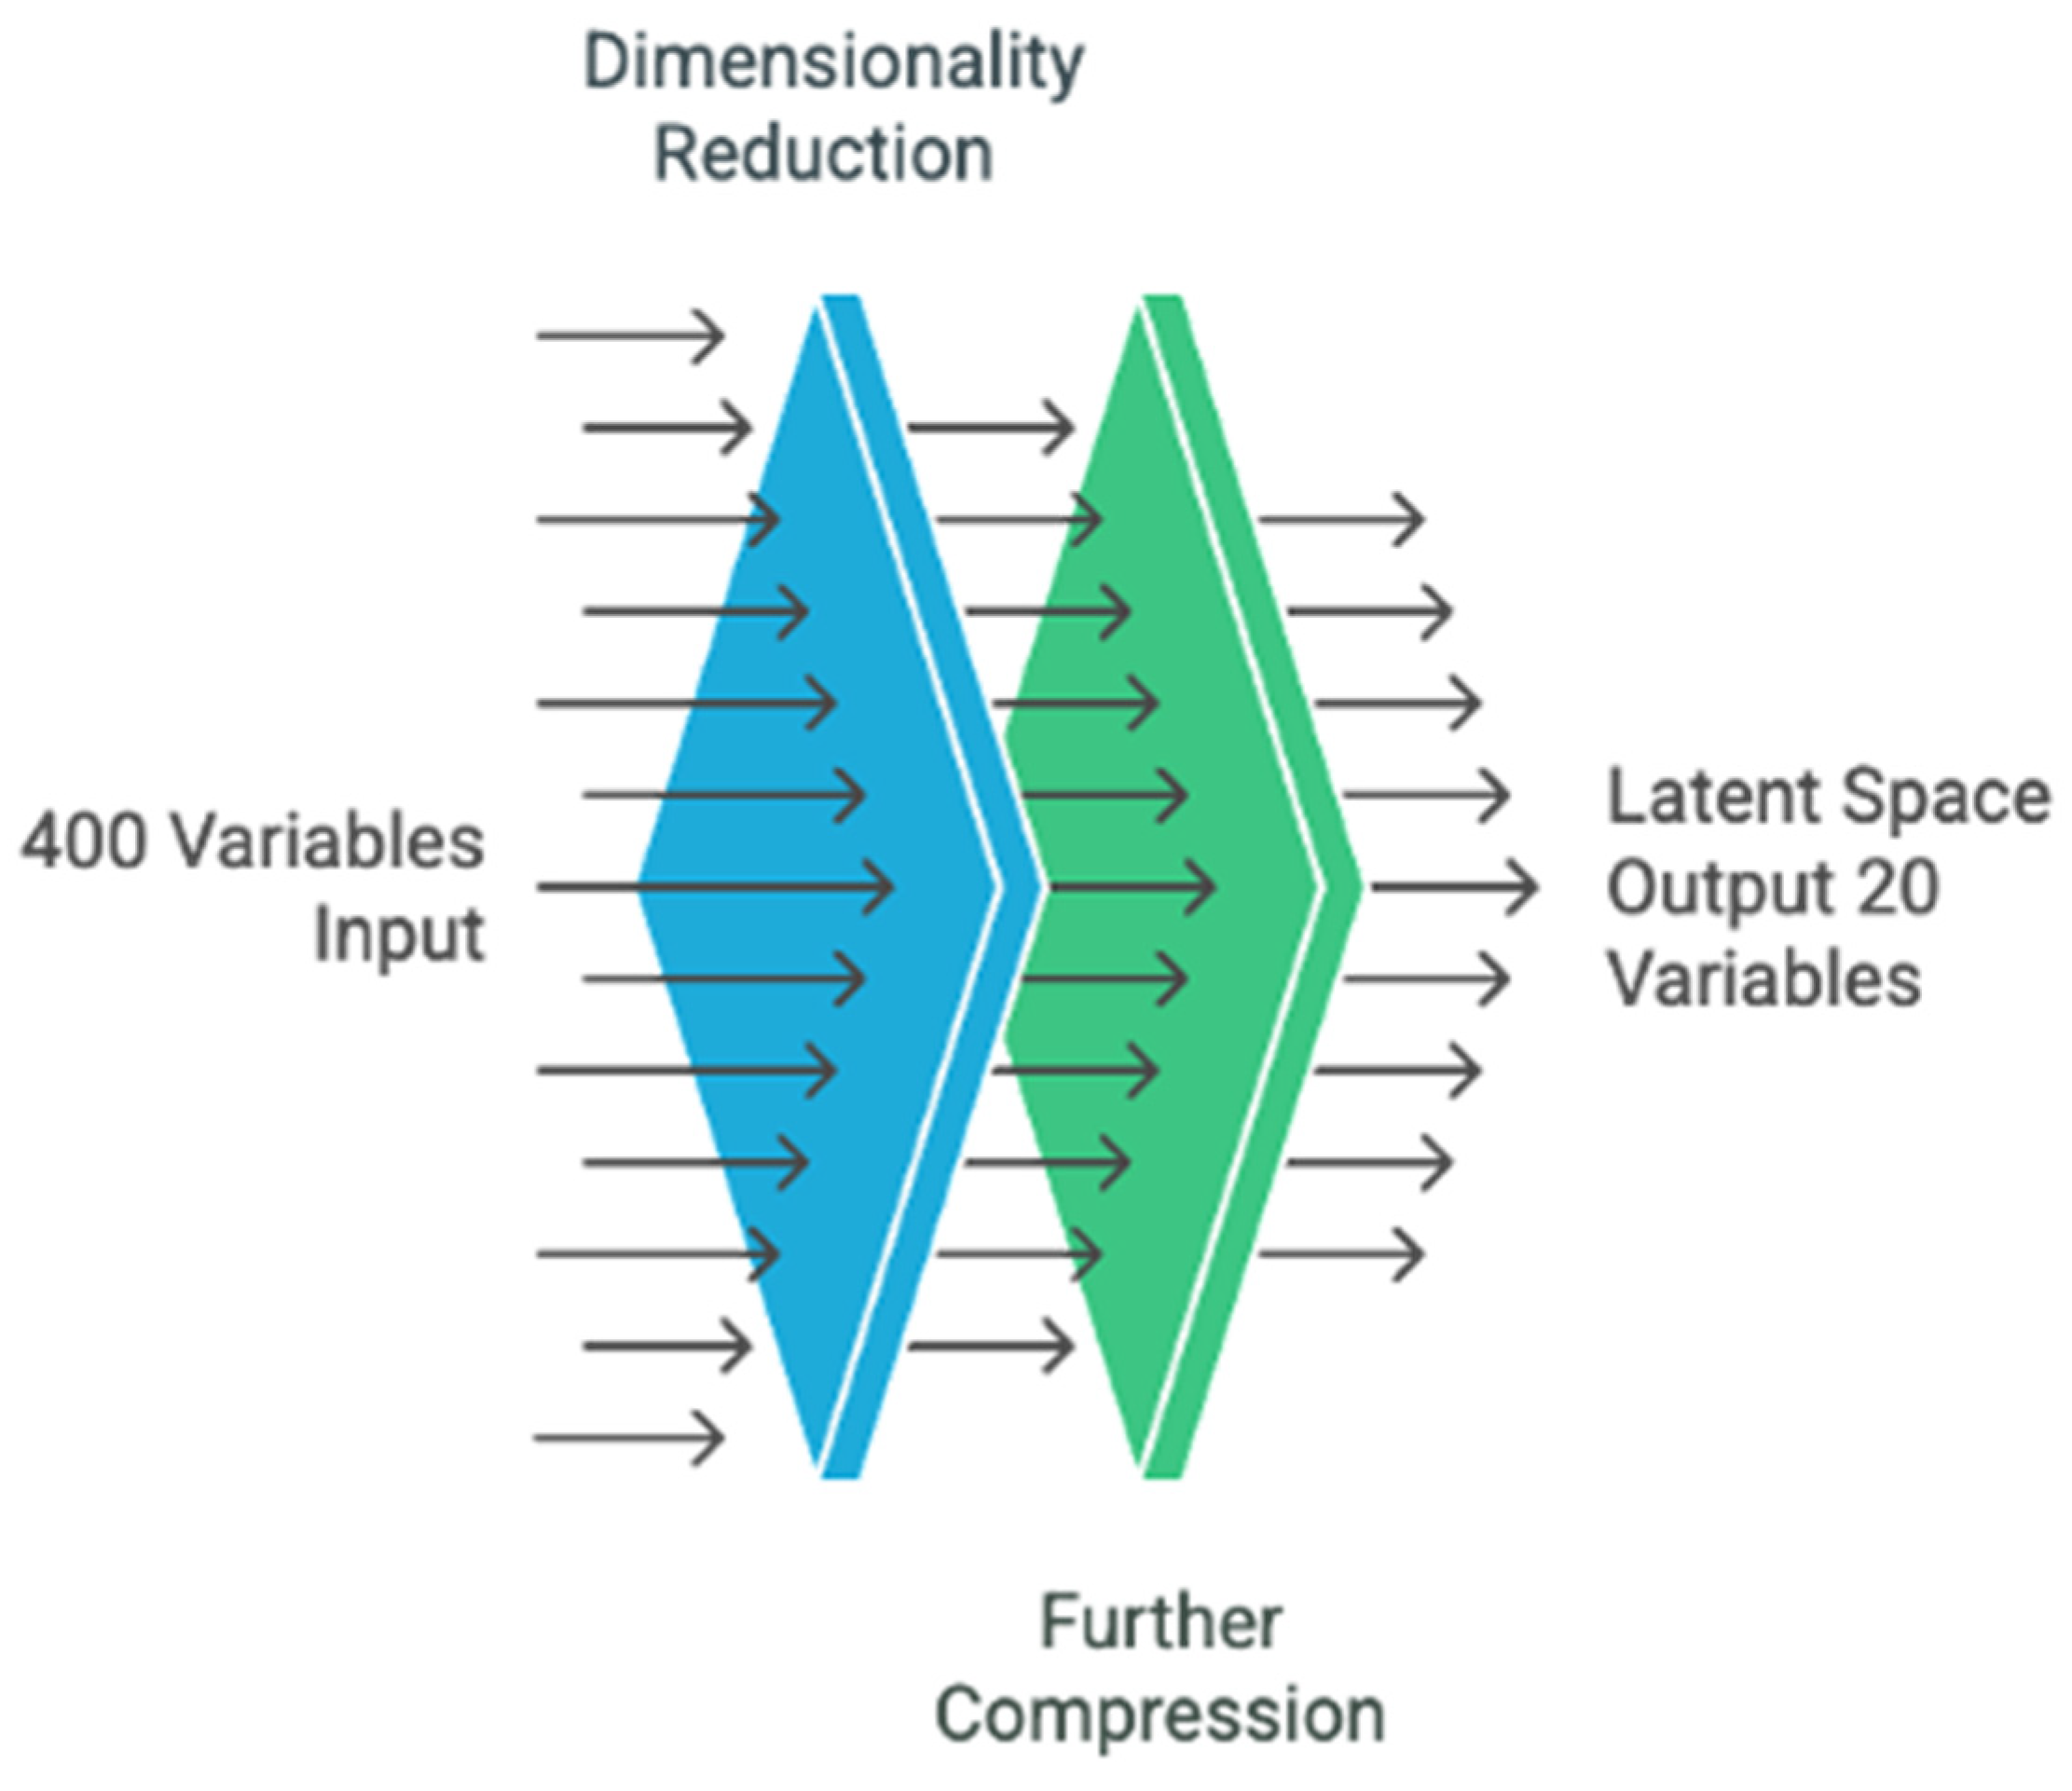
- Extraction of encoder weights: From the trained autoencoder, we retrieved the two core weight matrices: W1, which connects the input layer (original variables) to the first hidden layer, and W2, which connects the hidden layer to the latent space Z. By multiplying these matrices, we constructed a composite matrix Wx-z, which captures the contribution of each original input variable to each latent dimension.
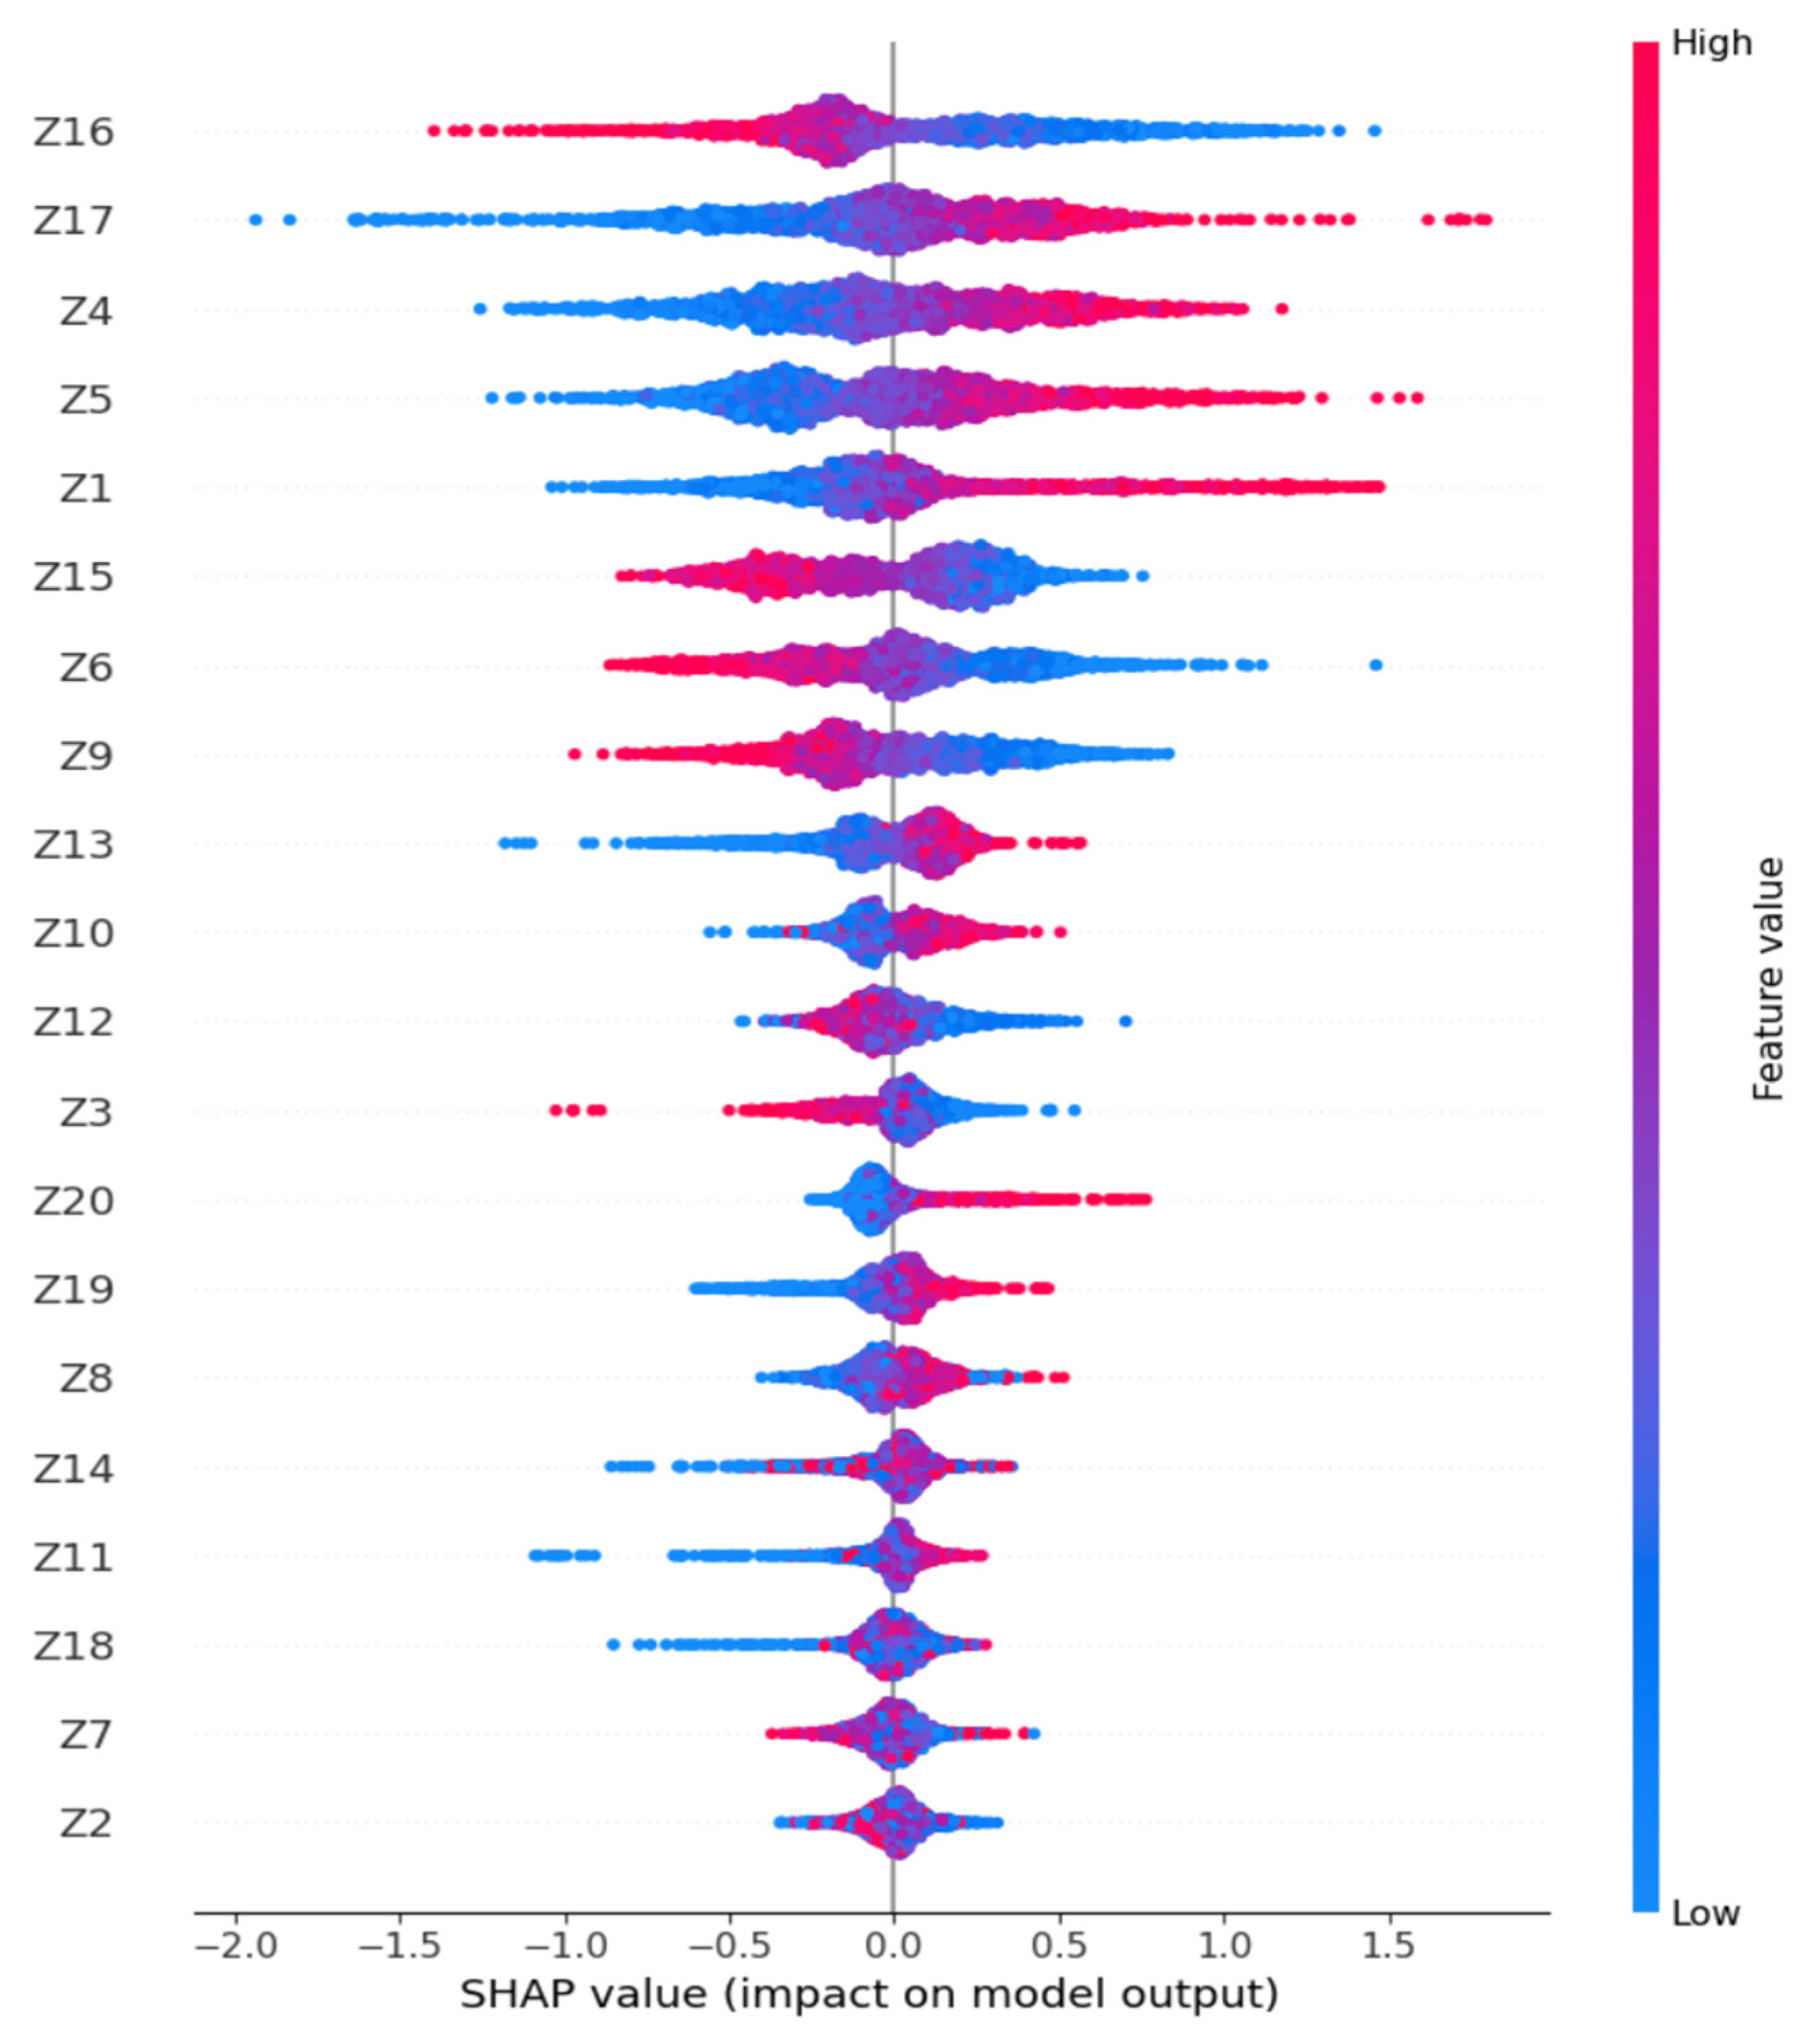
- SHAP-based importance estimation: Next, we trained an XGBoost classifier on the latent variables Z and computed SHAP values for each of these dimensions. These SHAP values quantify the contribution of each latent feature to the final prediction. Averaging the absolute SHAP values across all samples enabled us to identify which latent dimensions were most influential in driving the model’s output.
- Projection to input space: To understand which original variables most contributed to these key latent dimensions, we projected the SHAP importance scores from the latent space back to the original variable space using the Wx-z matrix. This allowed us to compute a global importance score for each input variable, reflecting its indirect impact on the prediction via the latent representations.
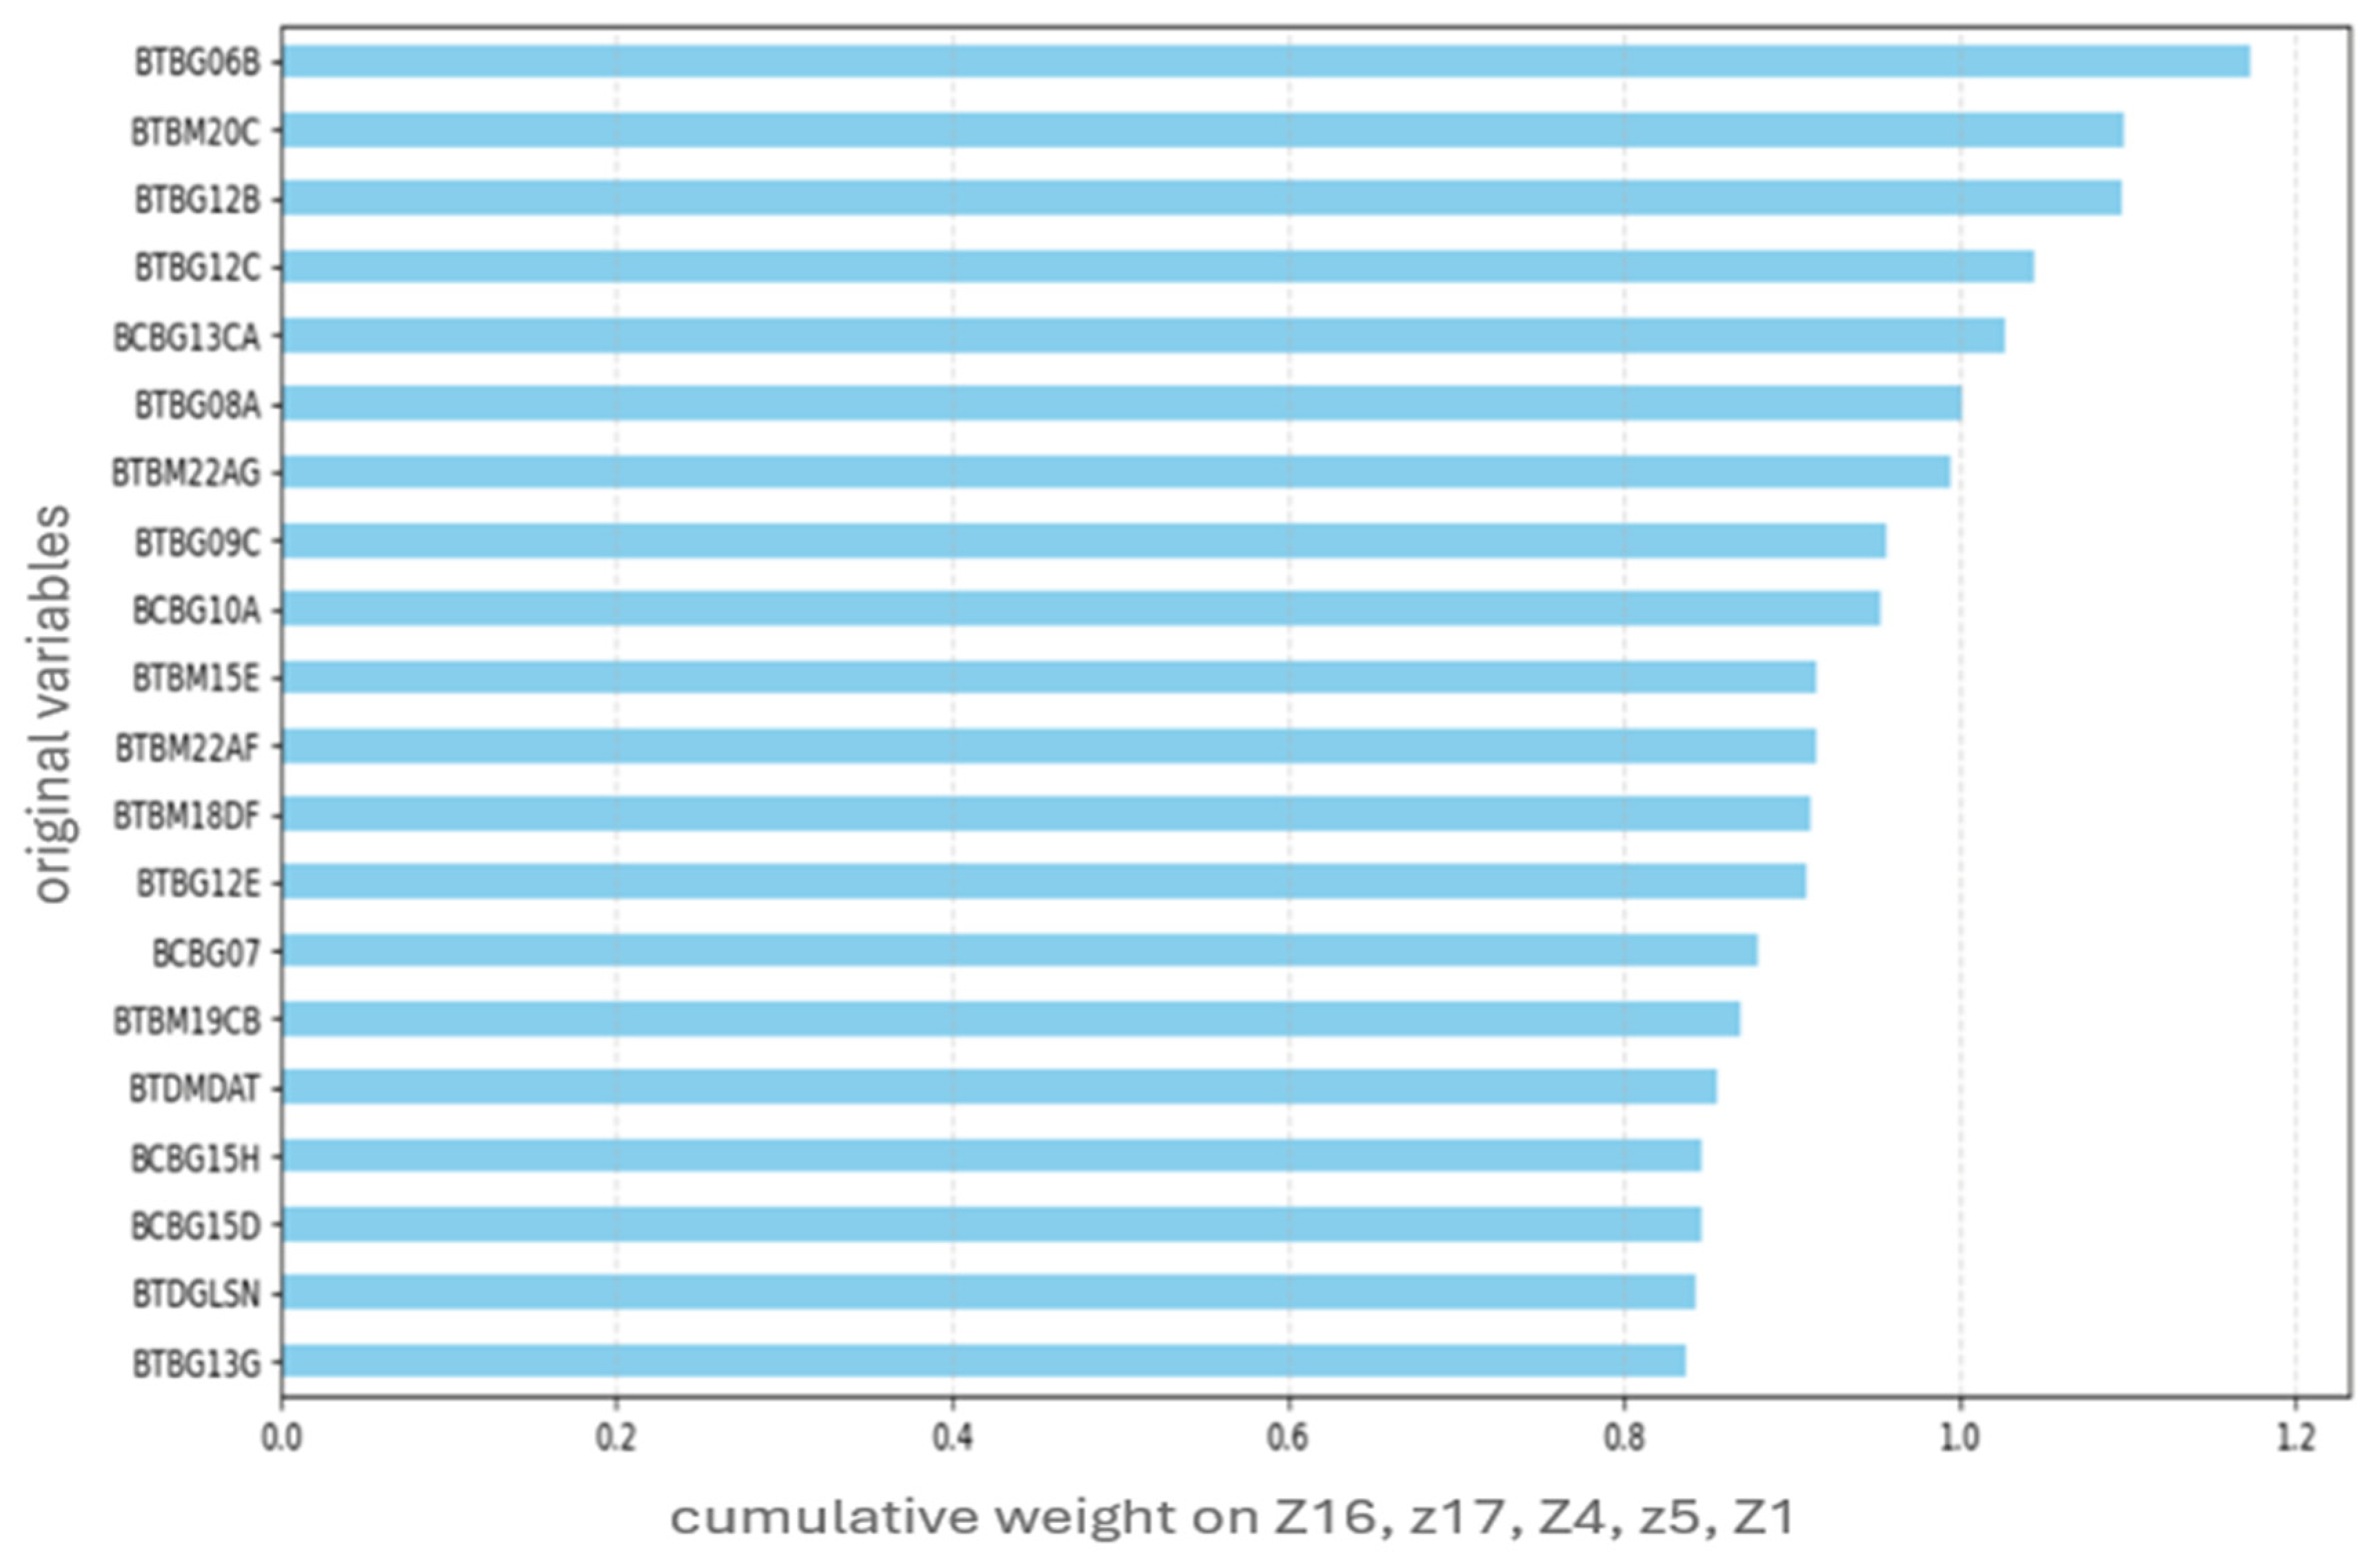
- Feature selection: Based on the aggregated importance scores, we ranked the original variables and selected the top contributors with the greatest influence on the predictive process. These variables capture the most meaningful educational, behavioral, and contextual indicators linked to students’ performance in mathematics.
4. Experimental Results
5. Results and Discussion
5.1. Feature Selection
- The variable BTBG12B shows a significant weight of 0.852 based on latent dimension Z16 and a non-negligible weight based on Z15 (0.218), indicating that it plays a structuring role in at least two model dimensions.
- The variable BTBM20C strongly contributes to Z16 (0.753) and Z4 (0.322), suggesting cross-influence across multiple latent aspects.
- Similarly, BCBG10A stands out with contributions to Z4 (0.694) and Z5 (0.199), highlighting its importance in shaping latent representations.
5.2. Evaluation of Top 20 Original Variables for Classification
6. Implication and Recommendations
- ▪
- Promote Interactive Teaching Practices: Variables such as BTBG12B (teachers asking students to explain their answers) and BTBG12E (linking new knowledge to prior understanding) show strong positive associations with higher achievement. Training programs should emphasize active pedagogy that fosters reasoning and autonomy.
- ▪
- Improve Access to Educational Resources: Features like BTBM20C (use of digital tools) and BCBG10A (availability of school libraries) highlight the importance of infrastructure. Ensuring equitable access to these resources can reduce achievement gaps.
- ▪
- Support Targeted Teacher Development: The role of teacher professional development (e.g., BTBG08A, BTBM22AF) emerged as a key factor. Investment in tailored training focused on formative assessment and differentiated instruction is essential.
- ▪
- Address Foundational Learning Gaps: BTBG06B reflects the frequent challenge of students lacking prerequisite knowledge. Schools should implement diagnostic assessments and remediation programs to support at-risk learners.
7. Conclusions
- Teachers often face students who lack foundational knowledge, underlining the critical need for diagnostic assessments and differentiated instruction.
- Teachers who have received professional development focused on student needs and formative assessment demonstrate greater instructional effectiveness.
- Low student motivation, as perceived by teachers, presents a persistent barrier to success, but one that can be addressed by engaging, learner-centered pedagogical approaches.
- Although school infrastructure contributes to the learning environment, it must be paired with the empowerment and support of teachers to yield meaningful academic improvement.
Author Contributions
Funding
Institutional Review Board Statement
Informed Consent Statement
Data Availability Statement
Conflicts of Interest
Abbreviations
| IEA | International Association for the Evaluation of Educational Achievement |
| TIMSS | International Mathematics and Science Study |
| PVs | plausible values |
| SHAP | SHapley Additive exPlanations |
| SVM | Support Vector Machine |
| AUC | the Area Under the Curve |
| ROC | the Receiver Operating Characteristic |
| DT | Decision Tree |
| XGBoost | eXtreme Gradient Boosting |
| RF | Random Forest |
References
- Nilsen, T.; Kaarstein, H.; Lehre, A.-C. Trend Analyses of TIMSS 2015 and 2019: School Factors Related to Declining Performance in Mathematics. Large-Scale Assess. Educ. 2022, 10, 15. [Google Scholar] [CrossRef]
- Mullis, I.V.S.; Martin, M.O. (Eds.) TIMSS 2019 Assessment Frameworks; International Association for the Evaluation of Educational Achievement: Amsterdam, The Netherlands, 2017; ISBN 978-1-889938-41-7. Available online: http://www.iea.nl (accessed on 1 January 2024).
- Mullis, I.V.S.; Martin, M.O. IEA’s TIMSS and PIRLS: Measuring Long-Term Trends in Student Achievement. In International Handbook of Comparative Large-Scale Studies in Education: Perspectives, Methods and Findings; Nilsen, T., Stancel-Piątak, A., Gustafsson, J.-E., Eds.; Springer International Publishing: Cham, Switzerland, 2020; pp. 1–20. ISBN 978-3-030-38298-8. [Google Scholar]
- Saoudi, K.; Chroqui, R.; Okar, C. Student Achievement in Moroccan Student Achievement in Moroccan Educational Reforms: A Significant Gap Between Aspired Outcomes and Current Practices. Interchange 2020, 51, 117–136. [Google Scholar] [CrossRef]
- Ibourk, A.; Amaghouss, J. Inequality in Education and Economic Growth: Empirical Investigation and Foundations—Evidence from MENA Region. Int. J. Econ. Financ. 2013, 5, 111–124. [Google Scholar] [CrossRef]
- Ibourk, A.; Amaghouss, J. Education and Economic Growth in the MENA Region: Some New Evidence. J. Econ. Sustain. Dev. 2013, 4, 34–45. [Google Scholar]
- Elouafi, A.; Tammouch, I.; Eddarouich, S.; Touahni, R. Evaluating Various Machine Learning Methods for Predicting Students’ Math Performance in the 2019 TIMSS. Indones. J. Electr. Eng. Comput. Sci. 2024, 34, 565. [Google Scholar] [CrossRef]
- Wardat, Y.; Belbase, S.; Tairab, H.; Takriti, R.A.; Efstratopoulou, M.; Dodeen, H. The Influence of School Factors on Students’ Mathematics Achievements in Trends in International Mathematics and Science Study (TIMSS) in Abu Dhabi Emirate Schools. Educ. Sci. 2022, 12, 424. [Google Scholar] [CrossRef]
- Kijima, R.; Lipscy, P.Y. International Assessments and Education Policy: Evidence from an Elite Survey. In The Power of Global Performance Indicators; Kelley, J.G., Simmons, B.A., Eds.; Cambridge University Press: Cambridge, UK, 2020; pp. 174–202. ISBN 978-1-108-76349-3. [Google Scholar]
- OECD. Student Achievement in Türkiye: Findings from PISA and TIMSS International Assessments; OECD: Paris, France, 2022; ISBN 978-92-64-62308-8. [Google Scholar]
- Hammouri, H. Attitudinal and Motivational Variables Related to Mathematics Achievement in Jordan: Findings from the Third International Mathematics and Science Study (TIMSS). Educ. Res. 2004, 46, 241–257. [Google Scholar] [CrossRef]
- Liu, S.; Meng, L. Re-examining Factor Structure of the Attitudinal Items from TIMSS 2003 in Cross-cultural Study of Mathematics Self-concept. Educ. Psychol. 2010, 30, 699–712. [Google Scholar] [CrossRef]
- Topçu, M.S.; Erbilgin, E.; Arikan, S. Factors Predicting Turkish and Korean Students’ Science and Mathematics Achievement in TIMSS 2011. EURASIA J. Math. Sci. Technol. Educ. 2016, 12, 1711–1737. [Google Scholar] [CrossRef]
- Filiz, E.; Öz, E. finding the best algorithms and effective factors in classification of turkish science student success. J. Balt. Sci. Educ. 2019, 18, 239–253. [Google Scholar] [CrossRef]
- Baranyi, P.; Gilanyi, A. Mathability: Emulating and Enhancing Human Mathematical Capabilities. In Proceedings of the 2013 IEEE 4th International Conference on Cognitive Infocommunications (CogInfoCom), Budapest, Hungary, 2–5 December 2013; IEEE: New York, NY, USA, 2013; pp. 555–558. [Google Scholar]
- Chmielewska, K.; Gilanyi, A. Mathability and Computer Aided Mathematical Education. In Proceedings of the 2015 6th IEEE International Conference on Cognitive Infocommunications (CogInfoCom), Gyor, Hungary, 19–21 October 2015; IEEE: New York, NY, USA, 2015; pp. 473–477. [Google Scholar]
- Yoo, J.E. TIMSS 2011 Student and Teacher Predictors for Mathematics Achievement Explored and Identified via Elastic Net. Front. Psychol. 2018, 9, 317. [Google Scholar] [CrossRef] [PubMed]
- AlSalouli, M.; AlGhamdi, M.; AlShaya, F.; AlMufti, A.; Aldarwani, B.; Pagliarani, S. The Impact of Science Teaching Strategies in the Arabic-Speaking Countries: A Multilevel Analysis of TIMSS 2019 Data. Heliyon 2024, 10, e27062. [Google Scholar] [CrossRef] [PubMed]
- Badri, M.; Alnuaimi, A.; Yang, G.; Rashedi, A.A. Examining the Relationships of Factors Influencing Student Mathematics Achievement. Int. J. Innov. Educ. 2020, 6, 12. [Google Scholar] [CrossRef]
- Khoudi, Z.; Nachaoui, M.; Lyaqini, S. Finding the Contextual Impacts on Students’ Mathematical Performance Using a Machine Learning-Based Approach. Infocommun. J. 2024, 16, 12–21. [Google Scholar] [CrossRef]
- Jang, Y.; Choi, S.; Jung, H.; Kim, H. Practical Early Prediction of Students’ Performance Using Machine Learning and eXplainable AI. Educ. Inf. Technol. 2022, 27, 12855–12889. [Google Scholar] [CrossRef]
- Khosravi, H.; Shum, S.B.; Chen, G.; Conati, C.; Tsai, Y.-S.; Kay, J.; Knight, S.; Martinez-Maldonado, R.; Sadiq, S.; Gašević, D. Explainable Artificial Intelligence in Education. Comput. Educ. Artif. Intell. 2022, 3, 100074. [Google Scholar] [CrossRef]
- Bitton, R.; Malach, A.; Meiseles, A.; Momiyama, S.; Araki, T.; Furukawa, J.; Elovici, Y.; Shabtai, A. Latent SHAP: Toward Practical Human-Interpretable Explanations. arXiv 2022, arXiv:2211.14797. [Google Scholar]
- Nuiaa Al Ogaili, R.R.; Mahdi, M.I.; Neamah, A.F.; Alradha Alsaidi, S.A.; Alsaeedi, A.H.; Dashoor, Z.A.; Manickam, S. PhishNetVAE Cybersecurity Approach: An Integrated Variational Autoencoder and Deep Neural Network Approach for Enhancing Cybersecurity Strategies by Detecting Phishing Attacks. Int. J. Intell. Eng. Syst. 2025, 18, 59–72. [Google Scholar] [CrossRef]
- Zeffora, J.; Shobarani, S. Optimizing Random Forest Classifier with Jenesis-Index on an Imbalanced Dataset. Indones. J. Electr. Eng. Comput. Sci. 2022, 26, 505. [Google Scholar] [CrossRef]
- Chen, T.; Guestrin, C. XGBoost: A Scalable Tree Boosting System. In Proceedings of the 22nd ACM SIGKDD International Conference on Knowledge Discovery and Data Mining, San Francisco, CA, USA, 13 August 2016; pp. 785–794. [Google Scholar]
- Huang, S.; Nianguang, C.A.I.; Penzuti Pacheco, P.; Narandes, S.; Wang, Y.; Wayne, X.U. Applications of Support Vector Machine (SVM) Learning in Cancer Genomics. Cancer Genom. Proteom. 2018, 15, 41–51. [Google Scholar] [CrossRef]
- Mienye, I.D.; Jere, N. A Survey of Decision Trees: Concepts, Algorithms, and Applications. IEEE Access 2024, 12, 86716–86727. [Google Scholar] [CrossRef]
- Kim, J.Y. Improving Appendix Cancer Prediction with SHAP-Based Feature Engineering for Machine Learning Models: A Prediction Study. Ewha Med. J. 2025, 48, e31. [Google Scholar] [CrossRef]
- Lee, G. Nuclear Shape and Architecture in Benign Fields Predict Biochemical Recurrence in Prostate Cancer Patients Following Radical Prostatectomy: Preliminary Findings. Eur. Urol. Focus 2017, 3, 457–466. [Google Scholar] [CrossRef] [PubMed]
- Chen, H.; Lundberg, S.M.; Lee, S.-I. Explaining a Series of Models by Propagating Shapley Values. Nat. Commun. 2022, 13, 4512. [Google Scholar] [CrossRef]
- Mullis, I.V.S.; Martin, M.O.; Ruddock, G.; O’Sullivan, C.Y.; Preuschoff, C. TIMSS 2011 Assessment Frameworks; TIMSS & PIRLS International Study Center, Lynch School of Education, Boston College: Chestnut Hill, MA, USA, 2009; ISBN 978-1-889938-54-7. [Google Scholar]


| Predicted Positive | Predicted Negative | |
| Actual Positive | True Positive (TP) | False Negative (FN) |
| Actual Negative | False Positive (FP) | True Negative (TN) |
| Models | Accuracy | F1-Score |
|---|---|---|
| Random Forest | 0.71 | 0.69 |
| Decision Tree | 0.65 | 0.64 |
| XGBoost | 0.73 | 0.71 |
| SVM | 0.74 | 0.73 |
| Z16 | Z17 | Z4 | Z5 | Z1 | Z15 | Z6 | |
|---|---|---|---|---|---|---|---|
| BCBG13BA | Nan | Nan | 0.300745 | 0.369664 | Nan | Nan | Nan |
| BCBG13BB | 0.335501 | Nan | Nan | Nan | Nan | Nan | Nan |
| BCBG13CA | Nan | 0.918100 | Nan | 0.180115 | Nan | Nan | Nan |
| BCBG13CC | 0.280674 | Nan | Nan | Nan | Nan | Nan | Nan |
| BCBG14H | Nan | Nan | Nan | Nan | Nan | Nan | Nan |
| BCBG16B | Nan | Nan | Nan | 0.356161 | Nan | Nan | Nan |
| BCBG16J | Nan | Nan | 0.298822 | Nan | Nan | Nan | Nan |
| BCBG16K | 0.344207 | Nan | Nan | Nan | Nan | Nan | Nan |
| BCBG10A | Nan | Nan | 0.694093 | 0.199053 | Nan | Nan | Nan |
| BTBG01 | Nan | 0.328356 | Nan | Nan | Nan | Nan | Nan |
| BTBG06A | Nan | Nan | 0.299234 | Nan | Nan | Nan | Nan |
| BTBG12B | 0.852109 | Nan | Nan | Nan | Nan | 0.218380 | Nan |
| BTBG08A | Nan | 0.709116 | 0.300014 | Nan | Nan | Nan | Nan |
| BTBG06B | 0.801001 | Nan | 0.327315 | Nan | Nan | Nan | Nan |
| BTBG12C | Nan | 0.623100 | Nan | Nan | 0.779116 | Nan | Nan |
| BTBG09C | Nan | Nan | 0.784053 | Nan | Nan | 0.184053 | Nan |
| BTBG09H | Nan | Nan | Nan | Nan | Nan | 0.220638 | Nan |
| BTBG13F | Nan | Nan | Nan | 0.318046 | Nan | Nan | Nan |
| BTBM20C | 0.753100 | Nan | 0.322244 | Nan | Nan | Nan | Nan |
| BTBM18BF | Nan | Nan | Nan | Nan | 0.332814 | Nan | Nan |
| BTBM22AF | Nan | Nan | Nan | 0.656161 | Nan | Nan | 0.286259 |
| BTBM18CB | Nan | Nan | Nan | Nan | Nan | 0.303042 | Nan |
| Models | Accuracy | F1-Score |
|---|---|---|
| Random Forest | 0.68 | 0.67 |
| Decision Tree | 0.63 | 0.62 |
| XGBoost | 0.72 | 0.70 |
| SVM | 0.73 | 0.72 |
| Feature | Description |
|---|---|
| BTBG06B | Frequency with which the teacher faces students lacking prerequisite knowledge |
| BTBM20C | How often students use computers/tablets to search for ideas/information in math |
| BTBG12B | How often teachers ask students to explain their answers |
| BTBG12C | How often teachers give challenging exercises to students |
| BCBG13CA | Shortage of specialized science teachers according to the school |
| BTBG08A | Frequency of teacher participation in professional development on math content |
| BTBM22AG | Teacher’s recent professional development focus: addressing student needs |
| BTBG09C | Agreement with the statement “Too many teaching hours are required” |
| BCBG10A | Whether the school has a functioning library |
| BTBM15E | How often teachers ask students to apply what they have learned in math |
| BTBM22AF | Professional development focused on mathematics assessment |
| BTBM18DF | Coverage of probability compound events in the curriculum |
| BTBG12E | How often teachers help students link new knowledge with prior knowledge |
| BCBG07 | Total number of computers available in the school |
| BTBM19CB | Whether students are asked to correct their own math homework |
| BTDMDAT | Percentage of students taught data and probability topics |
| BCBG15H | Agreement with the statement students need extra time to complete tasks |
| BCBG15D | Total number of students taught in the mathematics class |
| BTDGLSN | Extent to which teaching is limited by students’ needs or abilities |
| BTBG13G | Teacher’s level of agreement with the statement “Students are not motivated to do well in school.” |
Disclaimer/Publisher’s Note: The statements, opinions and data contained in all publications are solely those of the individual author(s) and contributor(s) and not of MDPI and/or the editor(s). MDPI and/or the editor(s) disclaim responsibility for any injury to people or property resulting from any ideas, methods, instructions or products referred to in the content. |
© 2025 by the authors. Licensee MDPI, Basel, Switzerland. This article is an open access article distributed under the terms and conditions of the Creative Commons Attribution (CC BY) license (https://creativecommons.org/licenses/by/4.0/).
Share and Cite
Elouafi, A.; Tammouch, I.; Eddarouich, S.; Touahni, R. Uncovering Key Factors of Student Performance in Math: An Explainable Deep Learning Approach Using TIMSS 2019 Data. Information 2025, 16, 480. https://doi.org/10.3390/info16060480
Elouafi A, Tammouch I, Eddarouich S, Touahni R. Uncovering Key Factors of Student Performance in Math: An Explainable Deep Learning Approach Using TIMSS 2019 Data. Information. 2025; 16(6):480. https://doi.org/10.3390/info16060480
Chicago/Turabian StyleElouafi, Abdelamine, Ilyas Tammouch, Souad Eddarouich, and Raja Touahni. 2025. "Uncovering Key Factors of Student Performance in Math: An Explainable Deep Learning Approach Using TIMSS 2019 Data" Information 16, no. 6: 480. https://doi.org/10.3390/info16060480
APA StyleElouafi, A., Tammouch, I., Eddarouich, S., & Touahni, R. (2025). Uncovering Key Factors of Student Performance in Math: An Explainable Deep Learning Approach Using TIMSS 2019 Data. Information, 16(6), 480. https://doi.org/10.3390/info16060480