Article

Clinical Applicability and Cross-Dataset Validation of Machine Learning Models for Binary Glaucoma Detection

by
David Remyes
1,
Daniel Nasef
1,
Sarah Remyes
2,
Joseph Tawfellos
1,
Michael Sher
1,
Demarcus Nasef
1 and
Milan Toma
1,*
1
Department of Osteopathic Manipulative Medicine, College of Osteopathic Medicine, New York Institute of Technology, Old Westbury, NY 11568, USA
2
Department of Biological Sciences, School of Arts and Sciences, State University of New York at Old Westbury, Old Westbury, NY 11568, USA
*
Author to whom correspondence should be addressed.
Information 2025, 16(6), 432; https://doi.org/10.3390/info16060432
Submission received: 21 April 2025 / Revised: 16 May 2025 / Accepted: 22 May 2025 / Published: 24 May 2025
(This article belongs to the Special Issue Machine Learning and Artificial Intelligence with Applications)

Abstract

Glaucoma is a progressive optic nerve disease and a leading cause of irreversible blindness worldwide. Early and accurate detection is critical to prevent vision loss, yet traditional diagnostic methods such as optical coherence tomography and visual field tests face challenges in accessibility, cost, and consistency, especially in under-resourced areas. This study evaluates the clinical applicability and robustness of three machine learning models for automated glaucoma detection: a convolutional neural network, a deep neural network, and an automated ensemble approach. The models were trained and validated on retinal fundus images and tested on an independent dataset to assess their ability to generalize across different patient populations. Data preprocessing included resizing, normalization, and feature extraction to ensure consistency. Among the models, the deep neural network demonstrated the highest generalizability with stable performance across datasets, while the convolutional neural network showed moderate but consistent results. The ensemble model exhibited overfitting, which limited its practical use. These findings highlight the importance of proper evaluation frameworks, including external validation, to ensure the reliability of artificial intelligence tools for clinical use. The study provides insights into the development of scalable, effective diagnostic solutions that align with regulatory guidelines, addressing the critical need for accessible glaucoma detection tools in diverse healthcare settings.

Graphical Abstract

1. Introduction

Glaucoma remains a leading cause of irreversible blindness worldwide, affecting over 90 million individuals globally [1], with projections indicating an increase to 111.8 million people by 2040 [2,3]. The progressive nature of this optic nerve degenerative condition, coupled with its asymptomatic presentation until significant vision loss occurs, underscores the critical importance of early detection and intervention [4,5,6].
Traditional diagnostic methods, including intraocular pressure measurement, optical coherence tomography (OCT), and visual field tests, while effective [7,8], present significant limitations in terms of accessibility, cost, and the requirement for skilled interpretation [9]. These challenges are particularly pronounced in resource-constrained settings, where access to specialized equipment and trained professionals is limited [10,11]. Furthermore, the subjective nature of clinical evaluations introduces considerable inter- and intra-observer variability, potentially affecting diagnostic accuracy and consistency [12,13].
Recent advances in artificial intelligence (AI) and machine learning (ML) have shown promising potential in addressing these challenges through automated glaucoma detection systems, deeming it a valuable tool for screening, diagnosing, and referring patients with ophthalmologic concerns [14,15,16,17,18,19]. For example, algorithms such as EyeArt (from Eyenuk), AEYEDS (from AEYE Health), and LumineticsCore (from Digital Diagnostics, formerly IDx-DR) have demonstrated clinical-grade performance in detecting diabetic retinopathy from fundus images and have been FDA-approved for clinical use in DR screening [20]. However, no such FDA-approved diagnostic device currently exists for the detection or staging of glaucoma.
This gap is particularly important given the structural changes that precede functional loss in glaucoma. Morphological indicators of early glaucoma can include an increased cup-to-disc ratio (CDR), thinning of the neuro-retinal rim (NRR), and/or alterations in optic nerve head (ONH). Though these signs may prove critical in early glaucoma detection, they are often overlooked on routine manual inspections and may go unnoticed until patients experience symptoms. However, these features are visually accessible on color fundus photography, forming a promising foundation for AI-based detection systems trained using deep learning architectures like convolutional neural networks (CNNs) [21]. Additionally, while traditional glaucoma risk assessment has focused on intraocular pressure and optic nerve head morphology, recent studies have highlighted the role of systemic features in predicting disease progression, particularly rapid retinal nerve fiber layer (RNFL) thinning [22].
Recent studies have demonstrated that various ML architectures, including CNNs and deep neural networks (DNNs), have demonstrated remarkable capabilities in analyzing retinal fundus images for glaucomatous morphology [23,24,25]. These architectures, often pretrained on large-scale image repositories, enable feature extraction and classification in an end-to-end fashion. However, deep learning models often require significant data volumes and may suffer from poor interpretability or limited generalization to new clinical settings [26].
In contrast, classical ML models, such as Naïve Bayes and Support Vector Machines, depend more heavily on well-curated, lower-dimensional features. In such settings, feature selection and discretization techniques can dramatically affect model performance. For instance, recent studies have demonstrated that feature selection methods can significantly enhance classification accuracy by refining feature boundaries and improving class separability, particularly in the context of heart disease prediction models [27]. Additionally, bio-inspired optimization algorithms like the Cuttlefish Algorithm have proven effective in selecting optimal feature subsets to reduce dimensionality and boost learning efficiency in complex domains [28]. These approaches highlight the importance of intelligent preprocessing, even when working with features derived from deep learning backbones.
Despite these advances, several critical challenges persist in the development and implementation of ML-based glaucoma detection systems. These include issues related to data heterogeneity, model interpretability, and the tendency for overfitting when dealing with diverse datasets [14,29]. In the case of integrated or ensemble methods, overfitting can also be mitigated by adjusting the architecture of the component networks, such as modifying the number or structure of neurons, to improve generalization performance. Additionally, the limited availability of high-quality labeled data and the need for robust cross-dataset validation pose significant challenges to developing clinically applicable solutions [30,31,32].
In response to these challenges and aligned with FDA guidelines for Good Machine Learning Practice (GMLP) [33,
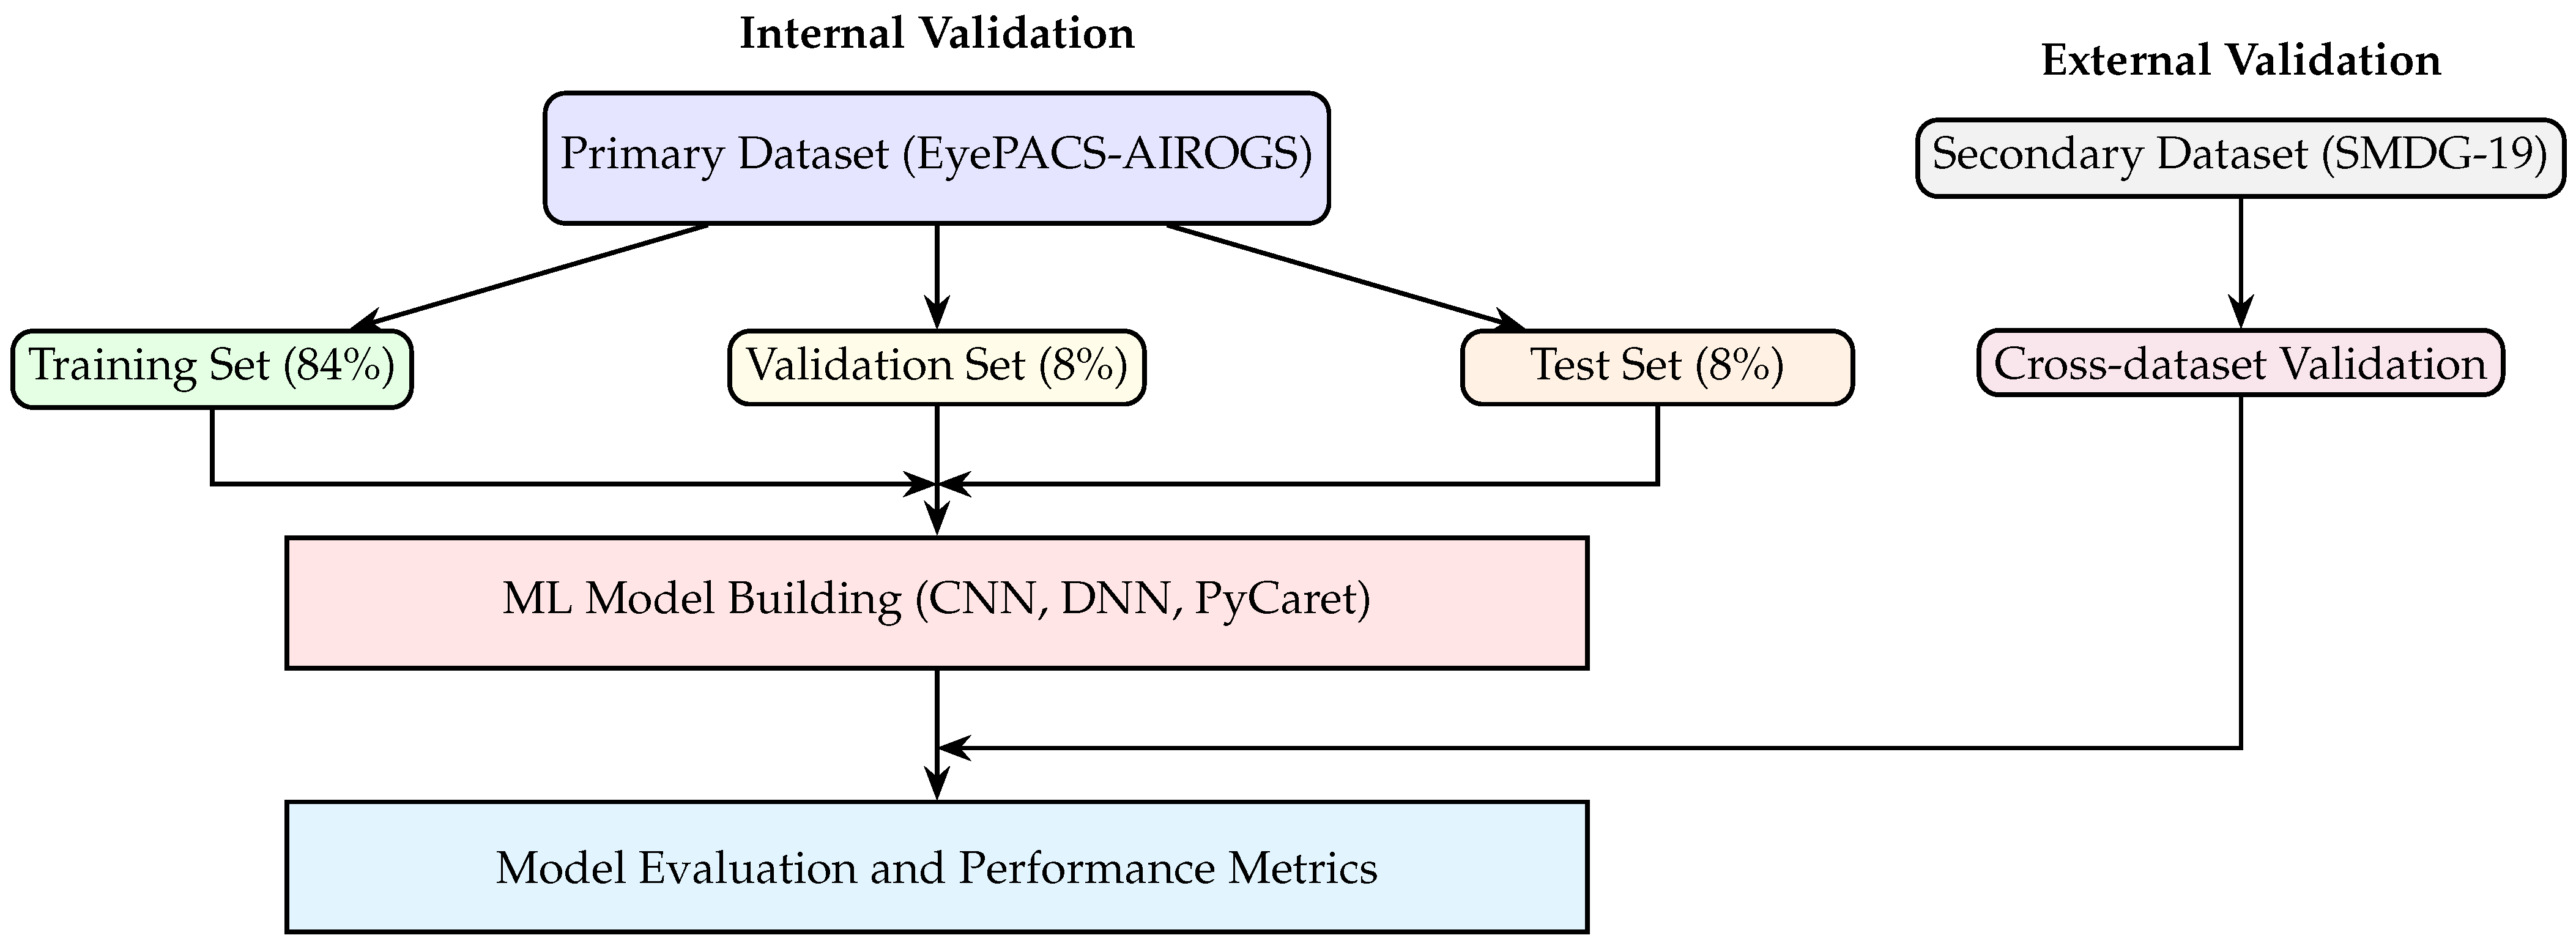
34], our study presents an evaluation of three distinct ML architectures for binary glaucoma detection: CNNs, DNNs, and a PyCaret-based automated ensemble. We specifically address the critical aspect of clinical applicability through cross-dataset validation, utilizing two diverse datasets, enabling us to assess the models’ generalization capabilities and robustness in real-world clinical scenarios.
The primary objectives of this study are to (1) evaluate the performance and reliability of different ML architectures in binary glaucoma detection, (2) assess the models’ generalization capabilities through cross-dataset validation, (3) determine the clinical applicability of these models in accordance with FDA guidelines, and (4) compare the effectiveness of various ML approaches in maintaining consistent performance across different subdatasets.
This research contributes to the growing body of knowledge in automated glaucoma detection by addressing key limitations identified in recent systematic reviews and meta-analyses, particularly regarding model generalizability and clinical validation. Our findings aim to provide insights for the development of more robust and clinically applicable ML solutions for glaucoma detection.

2. Materials and Methods

An evaluation of multiple machine learning models, including DNNs, CNNs, and PyCaret’s suite of 14 classifiers, was conducted to ensure the reliability and robustness of the findings. This evaluation aimed not only to identify the best-performing model but also to examine the convergence behavior of each algorithm. The analysis of learning curves provided insights into the stability and reliability of the performance metrics, ensuring that they reflected genuine learning rather than overfitting or random variability. This framework aligns with recent FDA guidance on the use of AI for Biological Products [33], thereby confirming the effectiveness and reliability of the selected models for glaucoma classification and supporting their potential clinical applicability.

2.1. Dataset Preparation and Clinical Validation Protocol

Two ophthalmological imaging datasets were utilized for training, validation, testing, and cross-testing under a stratified cross-validation paradigm. The primary dataset, EyePACS-AIROGS-light-V2 [35,36,37], consisted of 9542 standardized fundus images from the Rotterdam EyePACS AIROGS set, partitioned evenly into two classes: referable glaucoma (RG) and non-referable glaucoma (NRG). The dataset was split into training, validation, and test sets with proportions of 84%, 8%, and 8%, respectively. The secondary dataset, SMDG-19 [38,39], was used exclusively for cross-testing and consisted of 1923 fundus images formatted for PyTorch 2.7.0 compatibility; it served solely as an independent test set for external validation. Both datasets adhered to a binary classification schema, where 1 indicated glaucoma presence and 0 indicated its absence.

2.2. Standardized Preprocessing Pipeline

All fundus images underwent a standardized preprocessing pipeline to ensure uniformity across datasets. The preprocessing steps included resizing, normalization, and feature extraction using a MobileNetV2-based architecture. The detailed workflow is outlined in Algorithm 1, which describes the step-by-step process for preparing the data.
The feature extraction process can be mathematically represented as follows:
f = GlobalAveragePooling 2 D ( MobileNetV 2 ( x ) ) ,
where x represents the input image, and f is the extracted feature vector.
Algorithm 1 Preprocessing Workflow
  1:
Input: Raw fundus images from class directories (RG/NRG)
  2:
Output: Preprocessed feature vectors
  3:
for each image in the dataset do
  4:
      Resize image to 224 × 224 × 3 spatial dimensions
  5:
      Normalize pixel values using MobileNetV2 preprocessing
  6:
      Extract feature vectors using MobileNetV2 with GlobalAveragePooling2D
  7:
end for
  8:
Construct stratified DataFrames:
  9:
     Training set: 4000 samples (84%)
10:
     Validation set: 385 samples (8%)
11:
     Test set: 385 samples (8%)
To further enhance the relevance and compactness of the extracted feature vectors, an additional feature selection or dimensionality reduction step can be incorporated post-extraction. Specifically, after obtaining the MobileNetV2 feature vectors f as described in Equation (1), methods such as Recursive Feature Elimination (RFE), Principal Component Analysis (PCA), or mutual information-based selection may be applied. For example, RFE iteratively removes the least important features based on model performance, while PCA projects the features onto a lower-dimensional space that preserves maximal variance. Mutual information-based selection ranks features according to their statistical dependency with the target label, allowing retention of the most informative features. Integrating such a step can reduce redundancy, mitigate overfitting, and potentially improve both model efficiency and generalization in downstream classification tasks.

2.3. Comparative Model Architectures

Three distinct machine learning architectures were implemented and evaluated: a PyCaret-based automated ensemble, a DNN, and a fine-tuned CNN. Each model was trained and validated using the primary dataset and subsequently cross-tested on the secondary dataset.

2.3.1. PyCaret Automated Ensemble

The PyCaret framework was employed to automate model selection and hyperparameter tuning. The workflow is summarized in Algorithm 2, which outlines the steps for initializing the experiment, comparing models, and selecting the optimal one.
Algorithm 2 PyCaret Implementation
1:
Initialize classification experiment:
2:
     setup(data = train_df, target = ‘target’, session_id = 42)
3:
Execute model comparison:
4:
     compare_models(ensemble = True, fold = 5, sort = ‘AUC’)
5:
Select the optimal model based on:
6:
     AUC > 0.85, F1 > 0.82, Balanced Accuracy > 81%
7:
Persist the best-performing model for clinical evaluation

2.3.2. Deep Neural Network

A sequential deep neural network was constructed with dense layers and dropout regularization. The architecture is mathematically defined as
f DNN ( x ) = σ W 3 · Dropout 0.3 ϕ ( W 2 · Dropout 0.2 ( ϕ ( W 1 x + b 1 ) ) + b 2 ) + b 3 ,
where ϕ denotes the ReLU activation function, σ represents the sigmoid output normalization, and W i and b i are the weights and biases of the i-th layer.
The training process involved the Adam optimizer with a learning rate of 10 3 , binary cross-entropy loss, and early stopping with a patience of three epochs, as outlined in Algorithm 3, which provides a step-by-step description of the model initialization, compilation, and training workflow.
Algorithm 3 DNN Training Workflow
1:
Initialize a sequential model with
2:
     Dense layers (256, 128 units) and ReLU activation
3:
     Dropout layers (rates: 0.3, 0.2)
4:
     Output layer with sigmoid activation
5:
Compile the model with
6:
     Adam optimizer (learning_rate = 1 × 10 3 )
7:
     Binary cross-entropy loss
8:
Train the model with early stopping (patience = 3)
9:
Save the trained model for evaluation

2.3.3. Fine-Tuned Convolutional Neural Network (CNN)

A MobileNetV2-based CNN was fine-tuned with additional dense layers and data augmentation. In contrast to the PyCaret and DNN models relying on feature extraction, the CNN model was trained end-to-end directly on the original input images, which were resized to standardized dimensions of 224 × 224 pixels with three-color channels, yielding an input shape of 224 × 224 × 3. The loss function incorporated L2 regularization and Kullback–Leibler divergence:
L CNN = 1 N i = 1 N D KL ( y i | | y ^ i ) + λ | | θ | | 2 ,
where D KL is the Kullback–Leibler divergence, y ^ i is the predicted probability, and λ | | θ | | 2 is the L2 regularization term. KL divergence was selected over binary cross-entropy as it provides a more informative measure of dissimilarity between the predicted and actual probability distributions, which is especially beneficial in regularized CNN architectures. This allows for more stable convergence and better generalization. The training process for the CNN is detailed in Algorithm 4, which outlines the steps for initializing, customizing, and training the model.
Algorithm 4 CNN Training Workflow
  1:
Initialize MobileNetV2 as the base model (pre-trained on ImageNet)
  2:
Add custom layers:
  3:
     GlobalAveragePooling2D
  4:
     Dense layer (128 units, ReLU activation)
  5:
     Dropout layers (rates: 0.3, 0.2)
  6:
     Output layer with sigmoid activation
  7:
Compile the model with
  8:
     Adam optimizer
  9:
     Binary cross-entropy loss
10:
Train the model with data augmentation:
11:
     Horizontal flip, zoom (0.2), shift (0.1), rotation (10°)
12:
Save the trained model for evaluation

2.4. Stratified Training Protocol

The training protocol for all models was designed to ensure balanced class distributions across training, validation, and test sets. This was achieved using stratified sampling, which preserved the proportion of RG and NRG cases in each split. Stratified sampling is particularly important in medical imaging datasets, where class imbalance can lead to biased models that favor the majority class [40]. By maintaining proportional representation of both classes, the models were trained to generalize better across unseen data. The training process for each model followed a standardized protocol, which included optimization, regularization, and monitoring steps. The details of the training configuration are described in Algorithm 5.
Algorithm 5 Training Configuration
  1:
Optimization:
  2:
     The Adam optimizer was used with the following parameters:
  3:
         Learning rate: 1 × 10 3
  4:
          β 1 = 0.9 , β 2 = 0.999 (default momentum parameters)
  5:
     Early stopping was applied to prevent overfitting, with
  6:
         Patience: 3 epochs
  7:
         Minimum improvement in validation loss: 0.001
  8:
Regularization:
  9:
     L2 regularization was applied to the model weights to reduce overfitting, with
10:
         Regularization coefficient ( λ ): 0.01
11:
     Dropout layers were added to prevent co-adaptation of neurons:
12:
         Dropout rate for convolutional layers: 0.3
13:
         Dropout rate for dense layers: 0.2
14:
Monitoring:
15:
     The following metrics were monitored during training:
16:
         Training and validation loss curves
17:
         Area under the receiver operating characteristic curve (AUC-ROC)
18:
         Balanced accuracy, which accounts for class imbalance
The training process was conducted in mini-batches to optimize memory usage and improve convergence. A batch size of 32 was used for all models. The models were trained for a maximum of 20 epochs, with early stopping ensuring that training terminated once the validation loss stopped improving for three consecutive epochs. This approach minimized the risk of overfitting while ensuring sufficient training time for convergence.
To further enhance generalization, data augmentation was applied during training for the CNN model. Augmentation techniques included horizontal flipping, random zooming (up to 20%), random shifts (up to 10% of the image width and height), and random rotations (up to 10 degrees). These transformations simulated variations in real-world fundus images, making the model more robust to noise and variability in clinical settings. The stratified training protocol ensured that the models were trained on balanced and representative data, leading to improved performance on both the validation and test sets.

2.5. Cross-Dataset Validation Framework

The clinical utility of the models was assessed through cross-dataset validation using the SMDG-19 dataset, which served as an independent test set to evaluate the generalization performance of the trained models. This validation approach is illustrated in Figure 1, which provides a clear visual representation of the validation framework employed in this study. Specifically, the figure demonstrates how the primary dataset (EyePACS-AIROGS) was systematically partitioned into training, validation, and test subsets, with proportions of 84%, 8%, and 8%, respectively. These subsets were utilized for internal model training, hyperparameter tuning, and initial performance assessment.
Following this internal validation phase, the final trained models (i.e., a CNN, a DNN, and a PyCaret-based automated ensemble) were subjected to external validation using the independent secondary dataset (SMDG-19). The PyCaret framework initially compared the performance metrics of 14 different classifiers, automatically selecting the best-performing classifier based on key metrics such as accuracy, precision, recall, and F1-score. This top-performing PyCaret classifier was then further analyzed and compared directly with the CNN and DNN models to comprehensively evaluate their relative performance and generalization capabilities.
The secondary dataset, consisting of 1923 fundus images, adhered strictly to the same binary classification schema as the primary dataset, where a label of 1 indicated glaucoma presence and 0 indicated its absence. The cross-dataset validation step is crucial, as it provides an unbiased evaluation of the models’ ability to generalize to new, unseen data from a different source, thereby closely simulating real-world clinical scenarios. By employing this validation framework, the study ensures that the reported performance metrics reflect genuine predictive capabilities rather than artifacts of overfitting or dataset-specific biases, ultimately supporting the clinical applicability and robustness of the developed machine learning models.

3. Results

The results of the study are presented in Table 1 and Figure 2 and Figure 3, which summarize the performance of three ML models, i.e., the CNN, DNN, and Light Gradient Boosting Machine (LGBM), across training, validation, test, and cross-dataset evaluation scenarios. The LGBM was selected as the highest-performing model from the 14 classifiers tested using PyCaret. Table 1 provides confusion matrices with row-wise percentages for each model and dataset, alongside key performance metrics, including accuracy, precision, recall, and F1-score. The confusion matrices illustrate the classification performance by showing the distribution of true positives, false positives, true negatives, and false negatives, with percentages calculated relative to the total number of samples in each row.
The performance metrics in Table 1 reveal that the DNN model achieved the highest accuracy (87.0%) on the training dataset, followed by the CNN (79.3%) and LGBM (100.0%, due to overfitting). However, the DNN consistently outperformed the other models across validation and test datasets, with accuracy values of 80.1% and 79.2%, respectively. The LGBM model demonstrated perfect performance on the training dataset (due to overfitting) but exhibited a decline in generalization, as evidenced by lower accuracy and F1-scores on the validation and test datasets. The CNN model showed moderate performance across all datasets, with accuracy values ranging from 79.3% on the training dataset to 72.9% on the cross-dataset evaluation.
Figure 2 provides a visual comparison of the performance metrics (accuracy, precision, recall, and F1-score) for glaucoma detection using the three ML models across the four datasets. The figure highlights clear trends in model performance, illustrating the relative strengths and weaknesses of each model. A properly trained ML model is expected to exhibit a slight and continuous decline in these metrics when transitioning from the training dataset to validation, test, and cross-dataset evaluations, indicative of appropriate generalization to unseen data.
In this context, the CNN model demonstrates the most stable and gradual generalization behavior, with accuracy decreasing consistently from 79.3% (training) to 72.9% (cross-dataset evaluation). In contrast, the DNN model, despite achieving higher initial performance (87.0% accuracy in training), exhibits a relatively steeper decline to 80.1%, 79.2%, and finally 72.7% accuracy in subsequent datasets, indicating slightly less stable generalization. The LGBM model shows an excessively steep drop from perfect accuracy (100%) on the training dataset, which is symptomatic of significant overfitting and poor generalization. Such sharp declines or erratic fluctuations in performance across datasets are indicative of inadequately trained or overfitted machine learning models.
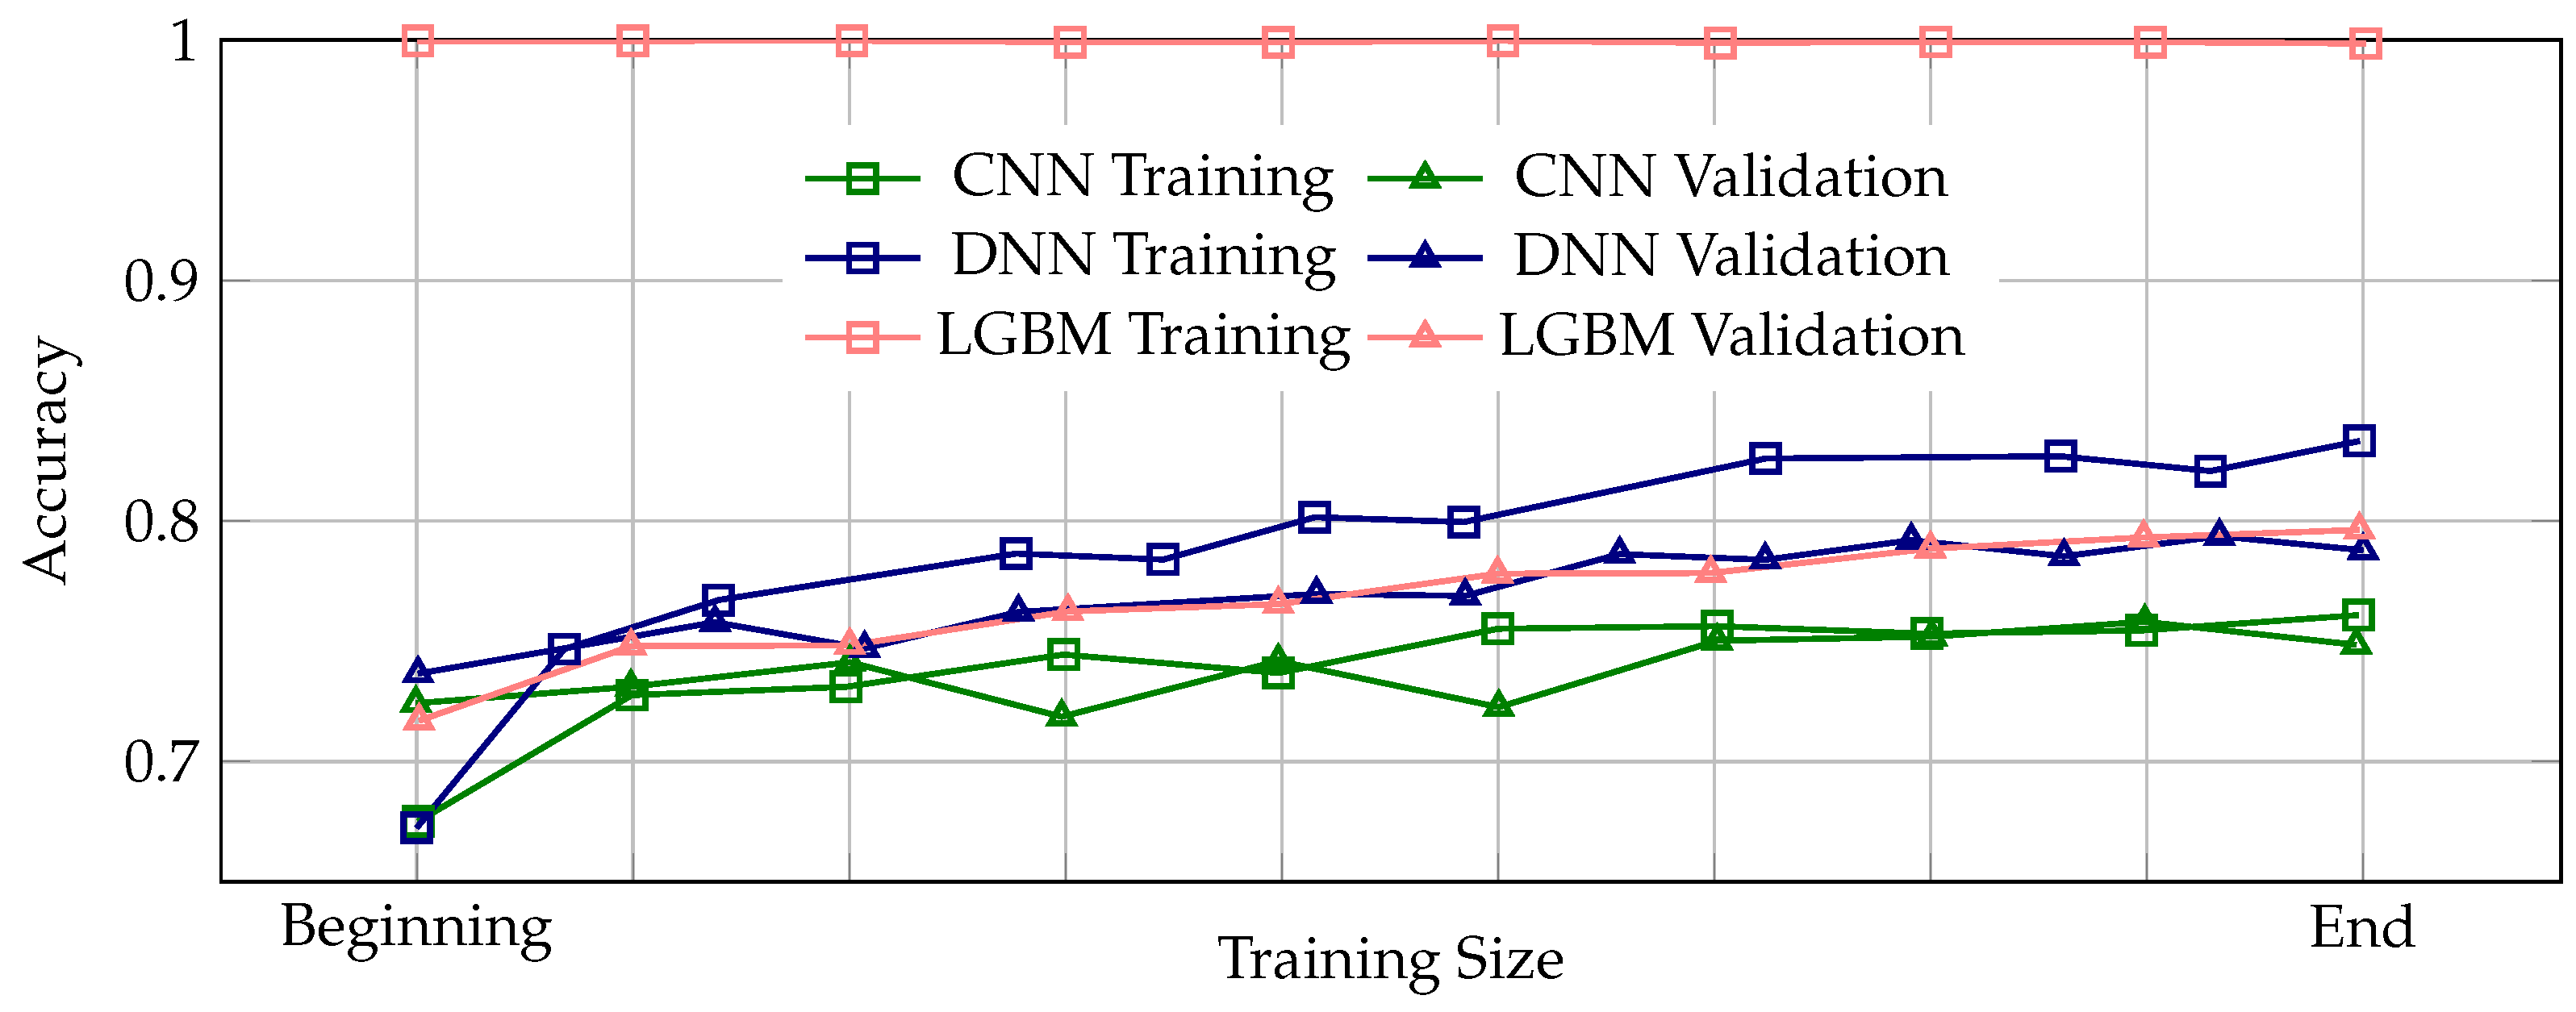
Figure 3 presents the learning curves illustrating the progression of training and validation accuracy across the entire training process for the CNN, DNN, and LGBM models. Learning curves are essential for assessing the stability and reliability of the training process, as they reveal how well a model learns from the data and generalizes to unseen samples. A properly trained model is expected to exhibit a consistent pattern where validation accuracy remains slightly below training accuracy throughout training, indicating stable and appropriate generalization. Among the three models, the DNN demonstrates the most stable and appropriate generalization behavior, with validation accuracy consistently tracking slightly below the training accuracy across all epochs. In contrast, the CNN model shows instances where validation accuracy intermittently rises above the training accuracy, suggesting potential issues in the training process, which may lead to unreliable generalization performance. The LGBM model exhibits perfect training accuracy from the beginning to the end of training, accompanied by a significant and persistent gap between training and validation accuracy, clearly indicative of severe overfitting and poor generalization capability.
Overall, the combined insights from Figure 2 and Figure 3 reinforce the conclusion that the DNN model provides the best balance between high performance and stable generalization, while the CNN model offers moderate but consistent performance. The LGBM model, despite its initially high training accuracy, suffers from severe overfitting, limiting its practical clinical utility. These visualizations underscore the importance of evaluating both absolute performance metrics and training dynamics to ensure robust and clinically applicable ML models for glaucoma detection.

4. Discussion

This study focuses on the clinical relevance and robustness of the ML models developed for binary glaucoma detection, emphasizing their performance across internal and external validation scenarios. The results highlight the importance of proper evaluation frameworks, particularly in the context of medical applications where generalization to unseen data is critical. By employing a cross-dataset validation approach, this study not only assessed the models’ ability to perform on the primary dataset but also evaluated their generalization capabilities using an independent secondary dataset (SMDG-19). This approach aligns with the principles of GMLP outlined by the FDA [34], which emphasize the need for robust validation to ensure the safety and efficacy of ML-enabled medical devices.

4.1. Credibility of ML Training in Alignment with FDA Guidance

The recent FDA guidance underscores that to support regulatory decision-making, ML models must demonstrate credibility, defined explicitly as trust established through rigorous evaluation of model performance in the intended context of use [33]. Our study directly addresses this critical recommendation through comprehensive analyses of both performance metrics and training dynamics for glaucoma detection models.
Many ML studies often report high accuracy metrics as standalone evidence of model effectiveness. However, these metrics alone are insufficient indicators of a model’s true clinical applicability. High performance values can easily be artifacts of model overfitting, data leakage, or inappropriate preprocessing protocols. As our results illustrate, despite LGBM achieving perfect accuracy on the training dataset, it exhibited significant performance degradation on independent validation and cross-dataset evaluations, highlighting a classic instance of severe overfitting. Conversely, our DNN and CNN models demonstrated more stable generalization, as indicated by their gradual performance decline across datasets. To establish credibility, according to FDA guidelines, we systematically analyzed learning curves and performance visualization across training, validation, test, and cross-dataset scenarios. These visualizations allowed us to assess the stability and reliability of the training process comprehensively. Learning curves, in particular, are instrumental in identifying problematic training behaviors, such as the LGBM’s persistent gap between training and validation accuracy, indicative of poor model generalization.
We strongly advocate that future ML-driven diagnostics studies adhere to the FDA’s recommended credibility assessment framework. Specifically, researchers should routinely incorporate analyses of training dynamics alongside traditional performance metrics. Such comprehensive evaluations ensure that reported performance genuinely reflects model robustness and clinical utility, rather than artifacts of overfitting or methodological shortcomings. Without this credibility assessment, claims of high predictive performance must be interpreted cautiously, as they may not translate reliably into clinical practice. Our findings are consistent with recent studies that emphasize the importance of cross-dataset validation and clinical utility metrics in ophthalmic AI [41].

4.2. Limitations and Future Studies

While this study provides some insights into the development and validation of ML models for binary glaucoma detection, several limitations should be acknowledged. First and foremost, the study exclusively focused on a binary classification schema, i.e., distinguishing between RG and NRG. However, glaucoma is a multifaceted condition with several subtypes, such as primary open-angle glaucoma (POAG), angle-closure glaucoma, and normal-tension glaucoma, among others. The binary classification approach does not account for these subtypes, potentially oversimplifying the clinical complexity of glaucoma diagnosis. Future research should explore more nuanced classification schemes that encompass the broader spectrum of glaucoma subtypes to better reflect real-world clinical scenarios.
Additionally, the datasets used in this study (EyePACS-AIROGS and SMDG-19) are limited in terms of their diversity. Both datasets primarily consist of fundus images collected under controlled conditions. While this ensures consistency, it may not fully represent the variability encountered in clinical practice, such as differences in imaging equipment, patient demographics, or disease presentations. The lack of demographic and geographic variability in the datasets could limit the generalizability of the findings to broader populations. This remains as a challenge in the ML diagnostics and limits the clinical applicability of models used in this study. For future studies, a more thorough analysis should include a larger number of diverse yet compatible datasets to evaluate clinical applicability.
Moreover, the models in this study were trained using a standardized protocol without extensive hyperparameter tuning. Although this aids with ensuring comparability, it may not reflect the full performance potential of each architecture. Future work should incorporate systematic optimization techniques to refine model parameters and enhance clinical accuracy.
While this study primarily focused on performance metrics, providing clinicians with interpretable outputs (such as heatmaps or feature importance visualizations) would enhance trust and facilitate the integration of these models into clinical practice. Incorporating explainable AI (XAI) techniques could make the models more transparent and align them with regulatory guidelines, such as those outlined by the FDA. Future research should also consider the integration of genetic data, advanced imaging modalities, and federated learning approaches, as outlined in recent conceptual frameworks for AI-driven glaucoma progression prediction [42].

Author Contributions

All authors (D.R., D.N. (Daniel Nasef), S.R., J.T., M.S., D.N. (Demarcus Nasef) and M.T.) contributed to all aspects of this work. This includes but is not limited to conceptualization, methodology, software management, validation, formal analysis, investigation, resources management, data curation, writing—original draft preparation, writing—review and editing, and visualization. Supervision and project administration were handled by M.T. All authors have read and agreed to the published version of the manuscript.

Funding

This research received no external funding.

Institutional Review Board Statement

Not applicable.

Informed Consent Statement

Not applicable.

Data Availability Statement

The original contributions presented in the study are included in the article; further inquiries can be directed to the corresponding author.

Acknowledgments

During the preparation of this manuscript/study, the authors utilized several tools for grammar checking and corrections, some of which may have been powered by AI. The authors have thoroughly reviewed and edited the output and take full responsibility for the content of this publication.

Conflicts of Interest

The authors declare no conflicts of interest.

Abbreviations

The following abbreviations are used in this manuscript:
CNNConvolutional Neural Network
DNNDeep Neural Network
FDAFood and Drug Administration
MLMachine Learning
AIArtificial Intelligence
GMLPGood Machine Learning Practice
RGReferable Glaucoma
NRGNon-Referable Glaucoma
LGBMLight Gradient Boosting Machine
XAIExplainable Artificial Intelligence
OCTOptical Coherence Tomography
PyCaretPython-based Machine Learning Automation Library
SMDGStandardized Fundus Glaucoma Dataset
EyePACSEye Picture Archive Communication System
CDRCup-to-Disc Ratio
NRRNeuro-Retinal Rim
ONHOptic Nerve Head
RNFLRetinal Nerve Fiber Layer
RFERecursive Feature Elimination
PCAPrincipal Component Analysis

References

  1. Zhang, N.; Wang, J.; Li, Y.; Jiang, B. Prevalence of primary open angle glaucoma in the last 20 years: A meta-analysis and systematic review. Sci. Rep. 2021, 11, 13762. [Google Scholar] [CrossRef]
  2. Jonas, J.B.; Aung, T.; Bourne, R.R.; Bron, A.M.; Ritch, R.; Panda-Jonas, S. Glaucoma. Lancet 2017, 390, 2183–2193. [Google Scholar] [CrossRef]
  3. Tham, Y.C.; Li, X.; Wong, T.Y.; Quigley, H.A.; Aung, T.; Cheng, C.Y. Global Prevalence of Glaucoma and Projections of Glaucoma Burden through 2040. Ophthalmology 2014, 121, 2081–2090. [Google Scholar] [CrossRef]
  4. Allison, K.; Patel, D.; Alabi, O. Epidemiology of Glaucoma: The Past, Present, and Predictions for the Future. Cureus 2020, 12, e11686. [Google Scholar] [CrossRef]
  5. Quigley, H.A. The number of people with glaucoma worldwide in 2010 and 2020. Br. J. Ophthalmol. 2006, 90, 262–267. [Google Scholar] [CrossRef]
  6. Yang, A.S.; Wang, H.S.; Li, T.J.; Liu, C.H.; Chen, C.M. Diagnosis of early glaucoma likely combined with high myopia by integrating OCT thickness map and standard automated and Pulsar perimetries. Sci. Rep. 2025, 15, 13614. [Google Scholar] [CrossRef]
  7. Medeiros, F.A.; Zangwill, L.M.; Bowd, C.; Mansouri, K.; Weinreb, R.N. The Structure and Function Relationship in Glaucoma: Implications for Detection of Progression and Measurement of Rates of Change. Investig. Ophthalmol. Vis. Sci. 2012, 53, 6939. [Google Scholar] [CrossRef]
  8. Stein, J.D.; Khawaja, A.P.; Weizer, J.S. Glaucoma in Adults–Screening, Diagnosis, and Management: A Review. JAMA 2021, 325, 164. [Google Scholar] [CrossRef]
  9. Sharma, P.; Sample, P.A.; Zangwill, L.M.; Schuman, J.S. Diagnostic Tools for Glaucoma Detection and Management. Surv. Ophthalmol. 2008, 53, S17–S32. [Google Scholar] [CrossRef]
  10. Hamid, S.; Desai, P.; Hysi, P.; Burr, J.M.; Khawaja, A.P. Population screening for glaucoma in UK: Current recommendations and future directions. Eye 2021, 36, 504–509. [Google Scholar] [CrossRef]
  11. Kolomeyer, N.N.; Katz, L.J.; Hark, L.A.; Wahl, M.; Gajwani, P.; Aziz, K.; Myers, J.S.; Friedman, D.S. Lessons Learned From 2 Large Community-based Glaucoma Screening Studies. J. Glaucoma 2021, 30, 875–877. [Google Scholar] [CrossRef] [PubMed]
  12. Forbes, H.; Sutton, M.; Edgar, D.F.; Lawrenson, J.; Spencer, A.F.; Fenerty, C.; Harper, R. Impact of the Manchester Glaucoma Enhanced Referral Scheme on NHS costs. BMJ Open Ophthalmol. 2019, 4, e000278. [Google Scholar] [CrossRef]
  13. Moyer, V.A. Screening for Glaucoma: U.S. Preventive Services Task Force Recommendation Statement. Ann. Intern. Med. 2013, 159, 484–489. [Google Scholar] [CrossRef] [PubMed]
  14. Huang, X.; Islam, M.R.; Akter, S.; Ahmed, F.; Kazami, E.; Serhan, H.A.; Abd-alrazaq, A.; Yousefi, S. Artificial intelligence in glaucoma: Opportunities, challenges, and future directions. BioMed. Eng. OnLine 2023, 22, 126. [Google Scholar] [CrossRef] [PubMed]
  15. Balasubramanian, K.; Ramya, K.; Gayathri Devi, K. Improved swarm optimization of deep features for glaucoma classification using SEGSO and VGGNet. Biomed. Signal Process. Control 2022, 77, 103845. [Google Scholar] [CrossRef]
  16. Correia Barão, R.; Hemelings, R.; Abegão Pinto, L.; Pazos, M.; Stalmans, I. Artificial intelligence for glaucoma: State of the art and future perspectives. Curr. Opin. Ophthalmol. 2023, 35, 104–110. [Google Scholar] [CrossRef]
  17. Tonti, E.; Tonti, S.; Mancini, F.; Bonini, C.; Spadea, L.; D’Esposito, F.; Gagliano, C.; Musa, M.; Zeppieri, M. Artificial Intelligence and Advanced Technology in Glaucoma: A Review. J. Pers. Med. 2024, 14, 1062. [Google Scholar] [CrossRef]
  18. Mirzania, D.; Thompson, A.C.; Muir, K.W. Applications of deep learning in detection of glaucoma: A systematic review. Eur. J. Ophthalmol. 2020, 31, 1618–1642. [Google Scholar] [CrossRef]
  19. Zhang, J.; Tian, B.; Tian, M.; Si, X.; Li, J.; Fan, T. A scoping review of advancements in machine learning for glaucoma: Current trends and future direction. Front. Med. 2025, 12, 1573329. [Google Scholar] [CrossRef]
  20. Rajesh, A.E.; Davidson, O.Q.; Lee, C.S.; Lee, A.Y. Artificial Intelligence and Diabetic Retinopathy: AI Framework, Prospective Studies, Head-to-head Validation, and Cost-effectiveness. Diabetes Care 2023, 46, 1728–1739. [Google Scholar] [CrossRef]
  21. Qinghao, M.; Sheng, Z.; Jun, Y.; Xiaochun, W.; Min, Z. Keypoint localization and parameter measurement in ultrasound biomicroscopy anterior segment images based on deep learning. BioMed. Eng. OnLine 2025, 24, 53. [Google Scholar] [CrossRef] [PubMed]
  22. Oh, R.; Kim, H.; Kim, T.W.; Lee, E.J. Predictive modeling of rapid glaucoma progression based on systemic data from electronic medical records. Sci. Rep. 2025, 15, 13101. [Google Scholar] [CrossRef] [PubMed]
  23. Haja, S.A.; Mahadevappa, V. Advancing glaucoma detection with convolutional neural networks: A paradigm shift in ophthalmology. Rom. J. Ophthalmol. 2023, 67, 222–237. [Google Scholar] [CrossRef] [PubMed]
  24. Sivakumar, R.; Penkova, A. Enhancing glaucoma detection through multi-modal integration of retinal images and clinical biomarkers. Eng. Appl. Artif. Intell. 2025, 143, 110010. [Google Scholar] [CrossRef]
  25. Chaurasia, A.K.; Liu, G.S.; Greatbatch, C.J.; Gharahkhani, P.; Craig, J.E.; Mackey, D.A.; MacGregor, S.; Hewitt, A.W. A generalised computer vision model for improved glaucoma screening using fundus images. Eye 2024, 39, 109–117. [Google Scholar] [CrossRef]
  26. Gobira, M.; Nakayama, L.F.; Regatieri, C.V.S.; Belfort, R. Comparing No-Code Platforms and Deep Learning Models for Glaucoma Detection From Fundus Images. Cureus 2025, 17, e81064. [Google Scholar] [CrossRef]
  27. Noroozi, Z.; Orooji, A.; Erfannia, L. Analyzing the impact of feature selection methods on machine learning algorithms for heart disease prediction. Scientific Reports 2023, 13, 22588. [Google Scholar] [CrossRef]
  28. Taheri, R.; Ahmadzadeh, M.; Kharazmi, M.R. A New Approach For Feature Selection In Intrusion Detection System. Cumhur. Sci. J. 2015, 36, 1344–1357. [Google Scholar]
  29. Al-Bander, B.; Al-Nuaimy, W.; Al-Taee, M.A.; Zheng, Y. Automated glaucoma diagnosis using deep learning approach. In Proceedings of the 2017 14th International Multi-Conference on Systems, Signals & Devices (SSD), Marrakech, Morocco, 28–31 March 2017; IEEE: Piscataway, NJ, USA, 2017; pp. 207–210. [Google Scholar] [CrossRef]
  30. Tulsani, A.; Kumar, P.; Pathan, S. Automated segmentation of optic disc and optic cup for glaucoma assessment using improved UNET++ architecture. Biocybern. Biomed. Eng. 2021, 41, 819–832. [Google Scholar] [CrossRef]
  31. Veena, H.; Muruganandham, A.; Senthil Kumaran, T. A novel optic disc and optic cup segmentation technique to diagnose glaucoma using deep learning convolutional neural network over retinal fundus images. J. King Saud Univ.-Comput. Inf. Sci. 2022, 34, 6187–6198. [Google Scholar] [CrossRef]
  32. Lee, J.; Kim, Y.; Kim, J.H.; Park, K.H. Screening Glaucoma with Red-free Fundus Photography Using Deep Learning Classifier and Polar Transformation. J. Glaucoma 2019, 28, 258–264. [Google Scholar] [CrossRef] [PubMed]
  33. U.S. Food and Drug Administration (FDA). Considerations for the Use of Artificial Intelligence to Support Regulatory Decision-Making for Drug and Biological Products. Technical Report, U.S. Department of Health and Human Services, Food and Drug Administration. 2025. Available online: https://www.fda.gov/media/184830/download (accessed on 16 April 2025).
  34. U.S. Food and Drug Administration (FDA); Health Canada; Medicines and Healthcare Products Regulatory Agency (MHRA). Good Machine Learning Practice for Medical Device Development: Guiding Principles. Technical Report, U.S. Food and Drug Administration (FDA), Health Canada, and MHRA. 2021. Available online: https://www.fda.gov/medical-devices/software-medical-device-samd/good-machine-learning-practice-medical-device-development-guiding-principles (accessed on 21 April 2025).
  35. Kiefer, R. Glaucoma Dataset: EyePACS-AIROGS-Light-V2. 2024. Available online: https://www.kaggle.com/datasets/deathtrooper/glaucoma-dataset-eyepacs-airogs-light-v2/versions/4 (accessed on 21 April 2025).
  36. Kiefer, R.; Abid, M.; Ardali, M.R.; Steen, J.; Amjadian, E. Automated Fundus Image Standardization Using a Dynamic Global Foreground Threshold Algorithm. In Proceedings of the 2023 8th International Conference on Image, Vision and Computing (ICIVC), Dalian, China, 27–29 July 2023; IEEE: Piscataway, NJ, USA, 2023; pp. 460–465. [Google Scholar] [CrossRef]
  37. Kiefer, R.; Steen, J.; Abid, M.; Ardali, M.R.; Amjadian, E. A Survey of Glaucoma Detection Algorithms using Fundus and OCT Images. In Proceedings of the 2022 IEEE 13th Annual Information Technology, Electronics and Mobile Communication Conference (IEMCON), Vancouver, BC, Canada, 12–15 October 2022; IEEE: Piscataway, NJ, USA, 2022; pp. 191–196. [Google Scholar] [CrossRef]
  38. Kiefer, R. SMDG, A Standardized Fundus Glaucoma Dataset. 2023. Available online: https://www.kaggle.com/datasets/deathtrooper/multichannel-glaucoma-benchmark-dataset (accessed on 21 April 2025).
  39. Kiefer, R.; Abid, M.; Steen, J.; Ardali, M.R.; Amjadian, E. A Catalog of Public Glaucoma Datasets for Machine Learning Applications: A detailed description and analysis of public glaucoma datasets available to machine learning engineers tackling glaucoma-related problems using retinal fundus images and OCT images. In Proceedings of the 2023 the 7th International Conference on Information System and Data Mining (ICISDM), Atlanta, GA, USA, 10–12 May 2023; ACM: New York, NY, USA, 2023. ICISDM 2023. pp. 24–31. [Google Scholar] [CrossRef]
  40. Husain, G.; Nasef, D.; Jose, R.; Mayer, J.; Bekbolatova, M.; Devine, T.; Toma, M. SMOTE vs. SMOTEENN: A Study on the Performance of Resampling Algorithms for Addressing Class Imbalance in Regression Models. Algorithms 2025, 18, 37. [Google Scholar] [CrossRef]
  41. Sher, M.; Sharma, R.; Remyes, D.; Nasef, D.; Nasef, D.; Toma, M. Stratified Multisource Optical Coherence Tomography Integration and Cross-Pathology Validation Framework for Automated Retinal Diagnostics. Appl. Sci. 2025, 15, 4985. [Google Scholar] [CrossRef]
  42. Yuksel Elgin, C. Democratizing Glaucoma Care: A Framework for AI-Driven Progression Prediction Across Diverse Healthcare Settings. J. Ophthalmol. 2025, 2025, 9803788. [Google Scholar] [CrossRef] [PubMed]
Figure 1. Cross-dataset validation framework. The primary dataset (EyePACS-AIROGS) is partitioned into training, validation, and test subsets for internal model training and assessment. Following internal validation, the final trained models (CNN, DNN, PyCaret) are evaluated externally using the independent secondary dataset (SMDG-19) to assess generalization and clinical applicability.
Information 16 00432 g001
Figure 2. Comparative evaluation of performance metrics (accuracy, precision, recall, and F1-score) for glaucoma detection using three machine learning models (CNN, DNN, LGBM) across training, validation, test, and cross-dataset scenarios. A properly trained machine learning model is expected to exhibit a slight and continuous decline in these metrics when transitioning from the training dataset to validation, test, and cross-dataset evaluations, indicative of appropriate generalization to unseen data. Here, the CNN model demonstrates the most stable and gradual generalization behavior, with accuracy decreasing consistently from 79.3% (training) to 72.9% (cross-dataset evaluation). Conversely, the DNN model, despite higher initial performance (87.0% accuracy in training), shows a relatively steeper decline to 80.1%, 79.2%, and finally 72.7% accuracy in subsequent datasets, indicating slightly less stable generalization. The LGBM model displays an overly steep decline from perfect accuracy (100%) on the training dataset, symptomatic of significant overfitting and poor generalization. Such sharp performance drops or erratic fluctuations across datasets are indicative of inadequately trained or overfitted machine learning models.
Information 16 00432 g002
Figure 3. Learning curves illustrating the progression of training and validation accuracy across the entire training process for the CNN, DNN, and LGBM ML models. A properly trained model is expected to exhibit a consistent pattern where validation accuracy remains slightly below training accuracy throughout training, indicating stable and appropriate generalization. Among the three models, the DNN demonstrates the most stable and appropriate generalization behavior, with validation accuracy consistently tracking slightly below the training accuracy across all epochs. In contrast, the CNN model shows instances where validation accuracy intermittently rises above the training accuracy, suggesting potential issues in the training process, which may lead to unreliable generalization performance. The LGBM model exhibits perfect training accuracy from the beginning to the end of training, accompanied by a significant and persistent gap between training and validation accuracy, clearly indicative of severe overfitting and poor generalization capability.
Information 16 00432 g003
Table 1. Confusion matrices with row-wise percentages and performance metrics for different models and datasets. The values in parentheses represent percentages of the numbers row-wise. For example, in the confusion matrix for the CNN model on the training dataset, 78% of the true positives were correctly identified as positive, while 22% of the true positives were misclassified as negative. Similarly, percentages for false positives and true negatives are calculated row-wise.
ModelTrainValidTestCross
CNN 1908 ( 78 % ) 542 ( 22 % ) 472 ( 19 % ) 1978 ( 81 % ) 255 ( 73 ) 95 ( 27 ) 70 ( 20 ) 280 ( 80 ) 504 ( 72 ) 196 ( 28 ) 156 ( 22 ) 544 ( 78 ) 3931 ( 74 ) 1362 ( 26 ) 977 ( 29 ) 2351 ( 71 )
Accuracy79.3%76.4%74.9%72.9%
Precision78.5%74.7%73.6%71.8%
Recall80.7%78.2%76.2%73.1%
F1-Score79.6%76.4%74.9%72.4%
DNN 2188 ( 89 ) 262 ( 11 ) 373 ( 15 ) 2077 ( 85 ) 281 ( 80 ) 69 ( 20 ) 70 ( 20 ) 280 ( 80 ) 574 ( 82 ) 126 ( 18 ) 165 ( 24 ) 535 ( 76 ) 3910 ( 74 ) 1383 ( 26 ) 967 ( 29 ) 2361 ( 71 )
Accuracy87.0%80.1%79.2%72.7%
Precision85.5%81.2%80.0%73.5%
Recall88.1%79.5%78.4%72.1%
F1-Score86.8%80.3%79.2%72.8%
LGBM 2450 ( 100 ) 0 ( 0 ) 0 ( 0 ) 2450 ( 100 ) 266 ( 76 ) 84 ( 24 ) 61 ( 17 ) 289 ( 83 ) 543 ( 78 ) 157 ( 22 ) 139 ( 20 ) 561 ( 80 ) 3890 ( 75 ) 1313 ( 25 ) 953 ( 29 ) 2375 ( 71 )
Accuracy100.0%79.3%78.9%72.7%
Precision100.0%77.4%79.6%73.2%
Recall100.0%81.2%78.1%72.5%
F1-Score100.0%79.3%78.8%72.8%
Disclaimer/Publisher’s Note: The statements, opinions and data contained in all publications are solely those of the individual author(s) and contributor(s) and not of MDPI and/or the editor(s). MDPI and/or the editor(s) disclaim responsibility for any injury to people or property resulting from any ideas, methods, instructions or products referred to in the content.

