Article

Identifying Smartphone Users Based on Activities in Daily Living Using Deep Neural Networks

by
Sakorn Mekruksavanich
1 and
Anuchit Jitpattanakul
2,3,*
1
Department of Computer Engineering, School of Information and Communication Technology, University of Phayao, Phayao 56000, Thailand
2
Department of Mathematics, Faculty of Applied Science, King Mongkut’s University of Technology North Bangkok, Bangkok 10800, Thailand
3
Intelligent and Nonlinear Dynamic Innovations Research Center, Science and Technology Research Institute, King Mongkut’s University of Technology North Bangkok, Bangkok 10800, Thailand
*
Author to whom correspondence should be addressed.
Information 2024, 15(1), 47; https://doi.org/10.3390/info15010047
Submission received: 4 December 2023 / Revised: 27 December 2023 / Accepted: 10 January 2024 / Published: 15 January 2024

Abstract

:
Smartphones have become ubiquitous, allowing people to perform various tasks anytime and anywhere. As technology continues to advance, smartphones can now sense and connect to networks, providing context-awareness for different applications. Many individuals store sensitive data on their devices like financial credentials and personal information due to the convenience and accessibility. However, losing control of this data poses risks if the phone gets lost or stolen. While passwords, PINs, and pattern locks are common security methods, they can still be compromised through exploits like smudging residue from touching the screen. This research explored leveraging smartphone sensors to authenticate users based on behavioral patterns when operating the device. The proposed technique uses a deep learning model called DeepResNeXt, a type of deep residual network, to accurately identify smartphone owners through sensor data efficiently. Publicly available smartphone datasets were used to train the suggested model and other state-of-the-art networks to conduct user recognition. Multiple experiments validated the effectiveness of this framework, surpassing previous benchmark models in this area with a top F1-score of 98.96%.

1. Introduction

As smartphones become more predominant, they often store sensitive personal information such as medical records, bank details, and login credentials for various services. This has led to growing worries among users about the privacy and security of their data [1,2]. Safeguarding information privacy is crucial since people tend to keep identifiable information on their phones, including medical, financial, and identification information that could be misused if accessed by others [3]. To better protect data confidentiality, biometric user authentication is an essential security measure to implement [4,5].
Recently, methods that recognize human actions and behaviors have started being used for identifying individual users biometrically. These human activity recognition (HAR) approaches are able to capture unique motion patterns and movement signatures that act like a fingerprint for each person [6]. Biometrics is a scientific study that aims to identify individuals based on their characteristics to prevent unauthorized access to devices [7]. Currently, biometric identification relies primarily on a person’s physiological properties. However, there are growing concerns regarding privacy and HAR related to the use of physiological characteristics. This has led to exploring alternative methods that focus on behavioral biometrics [8].
Several advanced analysis techniques have been explored to address prior challenges in this field, with a prominent one being identifying people through their unique behavioral patterns when interacting with wearable technology [9]. Algorithms leveraging deep learning (DL) have succeeded in user authentication research. DL can automatically detect and categorize attributes very accurately, influencing user verification studies [10,11]. Deep neural networks can intrinsically learn distinctive traits from raw input data, offering strong potential for assessing diverse data types and extending to novel contexts. Numerous DL models have emerged to leverage the multiple feature levels available across hierarchies while overcoming limitations of conventional machine learning (ML) approaches reliant on manual feature selection. Models like recurrent neural networks (RNN), convolutional neural networks (CNN), and long short-term memory (LSTM) utilize layered architectures to process both low- and high-level, linear, and nonlinear attributes at different levels, optimizing learned feature representations. DL networks are frequently applied in recognition problems and activity identification research for feature extraction. A downside to DL, particularly with complex system designs, is its high computational overhead for processing substantial datasets. Still, this cost is often justified given the accuracy of the DL model’s classification output is critical for identification techniques.
This paper investigates verifying users’ identities by analyzing various human activities (static, simple, and complex) captured through smartphone sensors. The key contributions examined were:
  • Creating a new smartphone-based user identification framework called DeepUserIden, which utilizes a DL model to fully automate all steps of identifying individuals based on assessing their activities;
  • Putting forward a novel deep residual network named DeepResNeXt that models temporal relationships within attribute representations extracted using convolutional operations;
  • Performing experiments demonstrating the superior accuracy and F1-score of the proposed DL approach over existing baseline DL methods using publicly available benchmark datasets.
The layout of this paper is structured as follows: Section 2 provides a review of existing research on ML and DL techniques for user authentication and mobile sensor data analysis. Section 3 outlines the proposed DeepUserIden framework for biometrically identifying users via mobile sensing. Section 4 describes details of the experimental methodology, while Section 5 discusses and evaluates the obtained findings. Finally, Section 6 concludes by summarizing the study’s conclusions, limitations encountered, and challenges still remaining for future explorations in this area.

2. Related Works

2.1. Sensor-Based User Identification

Wearable tracking devices have emerged as a potentially useful tool for continuous and implicit confirmation of a user’s identity, providing a viable alternative to traditional techniques like personal identification numbers and passwords. Recent research has explored various approaches that employ these devices to recognize individuals by capturing unique bodily features and patterns of behavior.
Recent research [12] demonstrates the potential for accurately identifying smartphone users by analyzing patterns of motion sensor data from actions like walking. By extracting features from accelerometer, gyroscope, and magnetometer readings in time and frequency domains, their ML model achieves impressive F1-scores, exceeding 98.96% for user authentication. Further study [13] develops smartphone-based user recognition through similar sensor data signals and algorithms, attaining over 98% accuracy. Other innovative work [14] explores identifying individuals from detailed wrist movements recorded via smartwatch, using DL on gesture patterns. Their proposed 1D-ResNet-SE neural network architecture highlights the uniqueness of fine-grained hand motions for implicit authentication.
Additional approaches leverage sensor data of day-to-day human activities for biometric verification without interrupts, for example using deep CNN and LSTM models on accelerometer and gyroscope signals to achieve over 91% accuracy. Ahmad et al. [15] showcase a system focused specifically on gait recognition through walking activity logged by a mobile device’s sensors. By selecting key stride features and comparing to user profiles with KNN and bagging classifiers, they demonstrate the capability to distinguish authorized mobile users with 99% or higher precision from small samples, despite variability in patterns.
Across these studies, there are encouraging results for the feasibility of implicit and continuous authentication of smartphone owners from typical user motion, minimizing intrusive security procedures that obstruct natural interactions. The sensor data, machine learning computations, and accuracy metrics signify promise for this area warranting further real-world advances.

2.2. DL Approaches in User Identification

The previously mentioned research has shown promising results, however traditional ML techniques used have difficulty extracting salient features from HAR data. To address this, some studies have explored DL methods like CNNs and RNNa for user verification based on activities [16]. CNNs help obtain spatial patterns from raw sensor inputs ideal for HAR. Still, as smartphone sensor data capturing human actions is temporal in nature, time series models like LSTMs and gated recurrent units (GRUs) have been studied to account for temporal dependencies. For instance, Zhang [17] put forward a user authentication framework with an LSTM network recognizing various gait activities and a verification component using Euclidean distance measures.

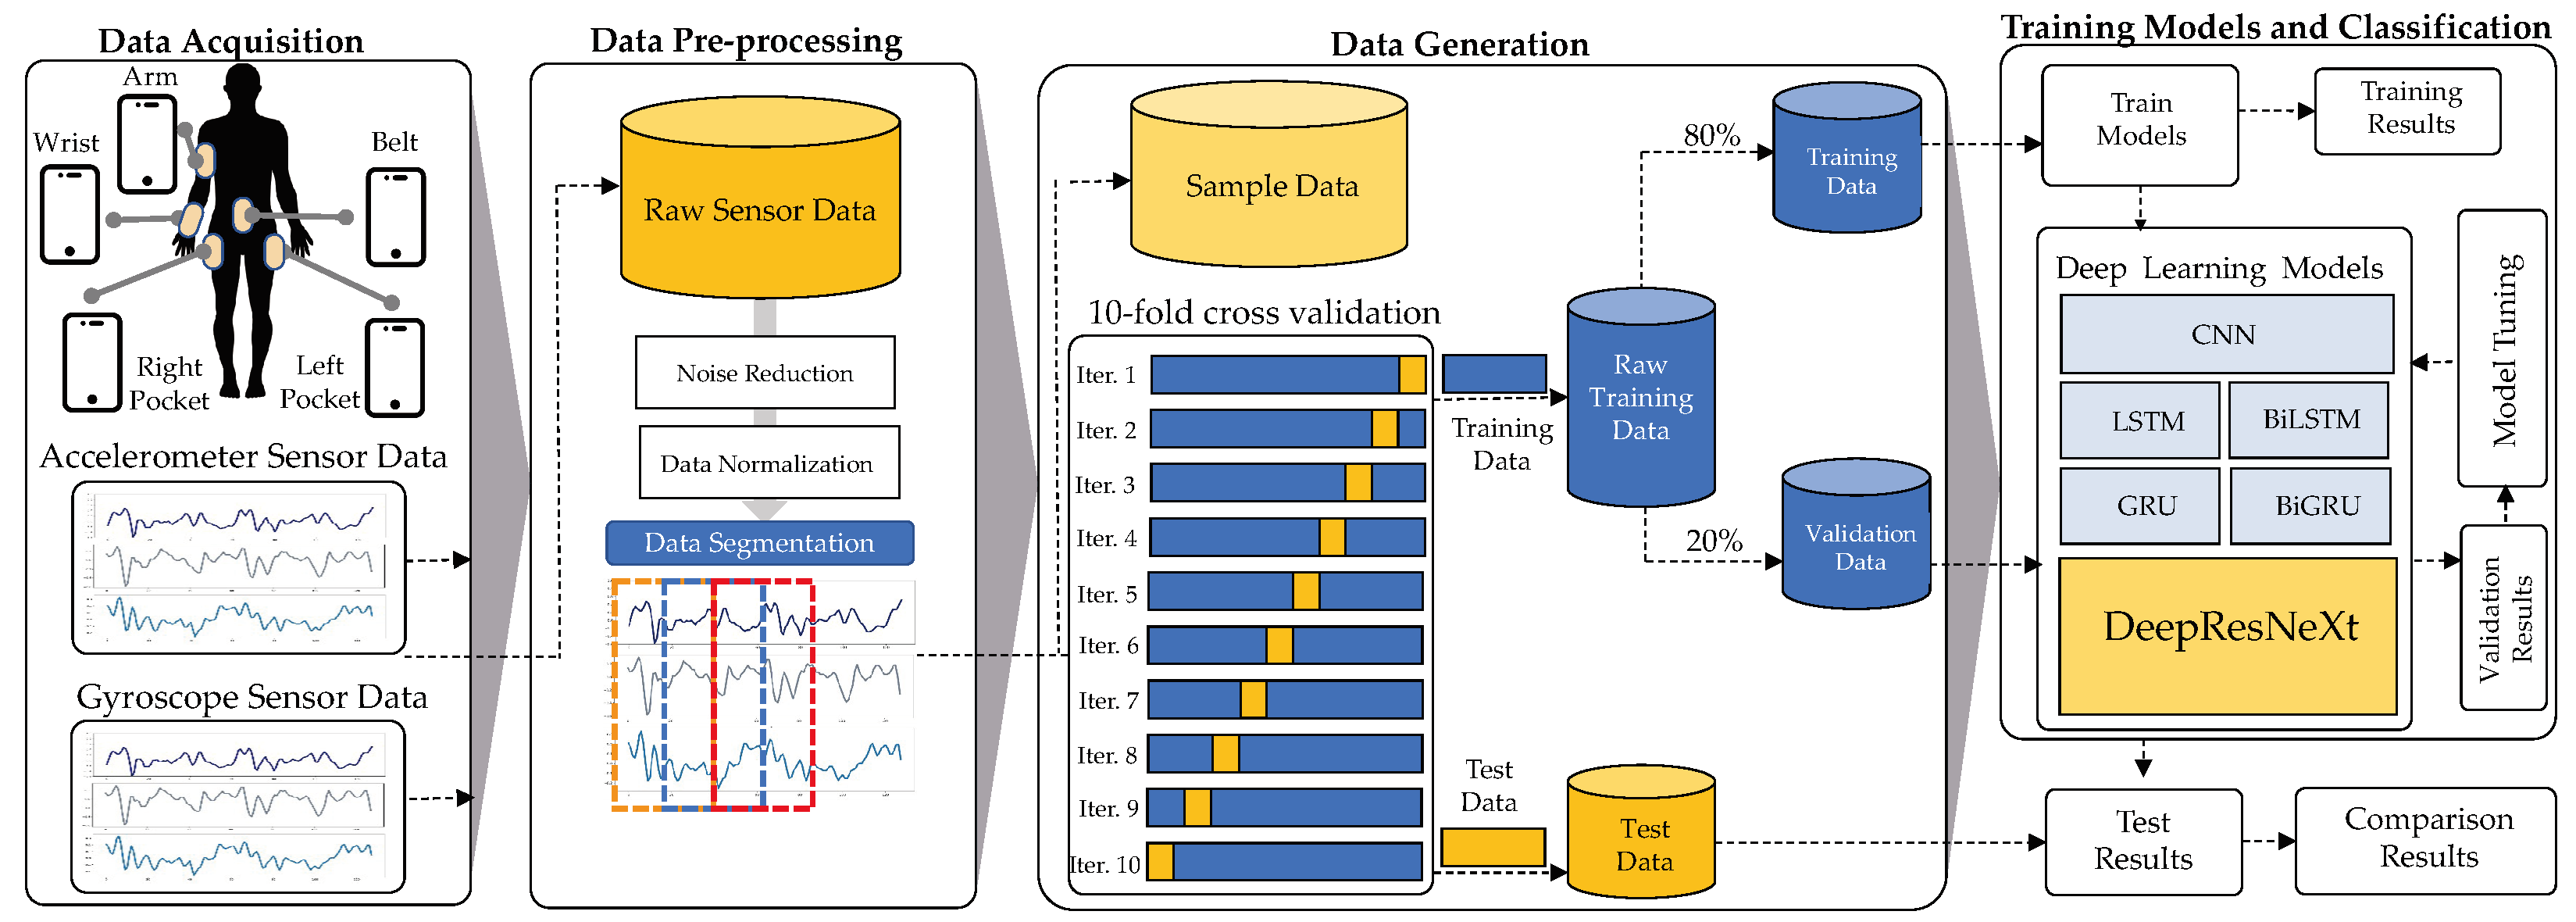
3. The DeepUserIden Framework

The study proposed framework called DeepUserIden to identify users through smartphone sensors and DL. In this research, the goal of identifying different users is framed as a multi-class classification challenge. There are N distinct classes defined upfront, each representing one of the users included in the study. During model development, examples from each user’s data are labeled with their corresponding class. Then, classification algorithms are trained to predict the accurate user class for new unlabeled data samples based on patterns learned from those examples. The proposed framework is illustrated in Figure 1 and consists of four steps: data collection, pre-processing, data generation, and training the model and detecting activity. The complete details of each stage are explained below.
The DeepUserIden system developed in this research collects raw accelerometer and gyroscope data from smartphones worn in various on-body positions. It pre-processes the sensor streams through noise filtering, normalization of values across segments, and splitting the recordings into fixed-duration extracts. This pre-processed data is divided into mutually exclusive training, validation, and test subsets. Using 5-fold stratified cross-validation, DeepUserIden tests and compares DL architectures, including CNNs, LSTMs, bidirectional LSTMs, GRUs, and DeepResNeXt (the proposed model). It evaluates performance metrics such as F1-score and classification accuracy to determine the optimal identification model, which is then fine-tuned based on insights from the validation data. The overarching aim is accurate recognition of device owners from only smartphone sensors capturing their distinctive usage patterns and biomechanics. DeepUserIden seeks to reliably identify individuals through motion signatures measured unobtrusively during natural device interactions by iterating on data pre-processing, model evaluation, and refinement.

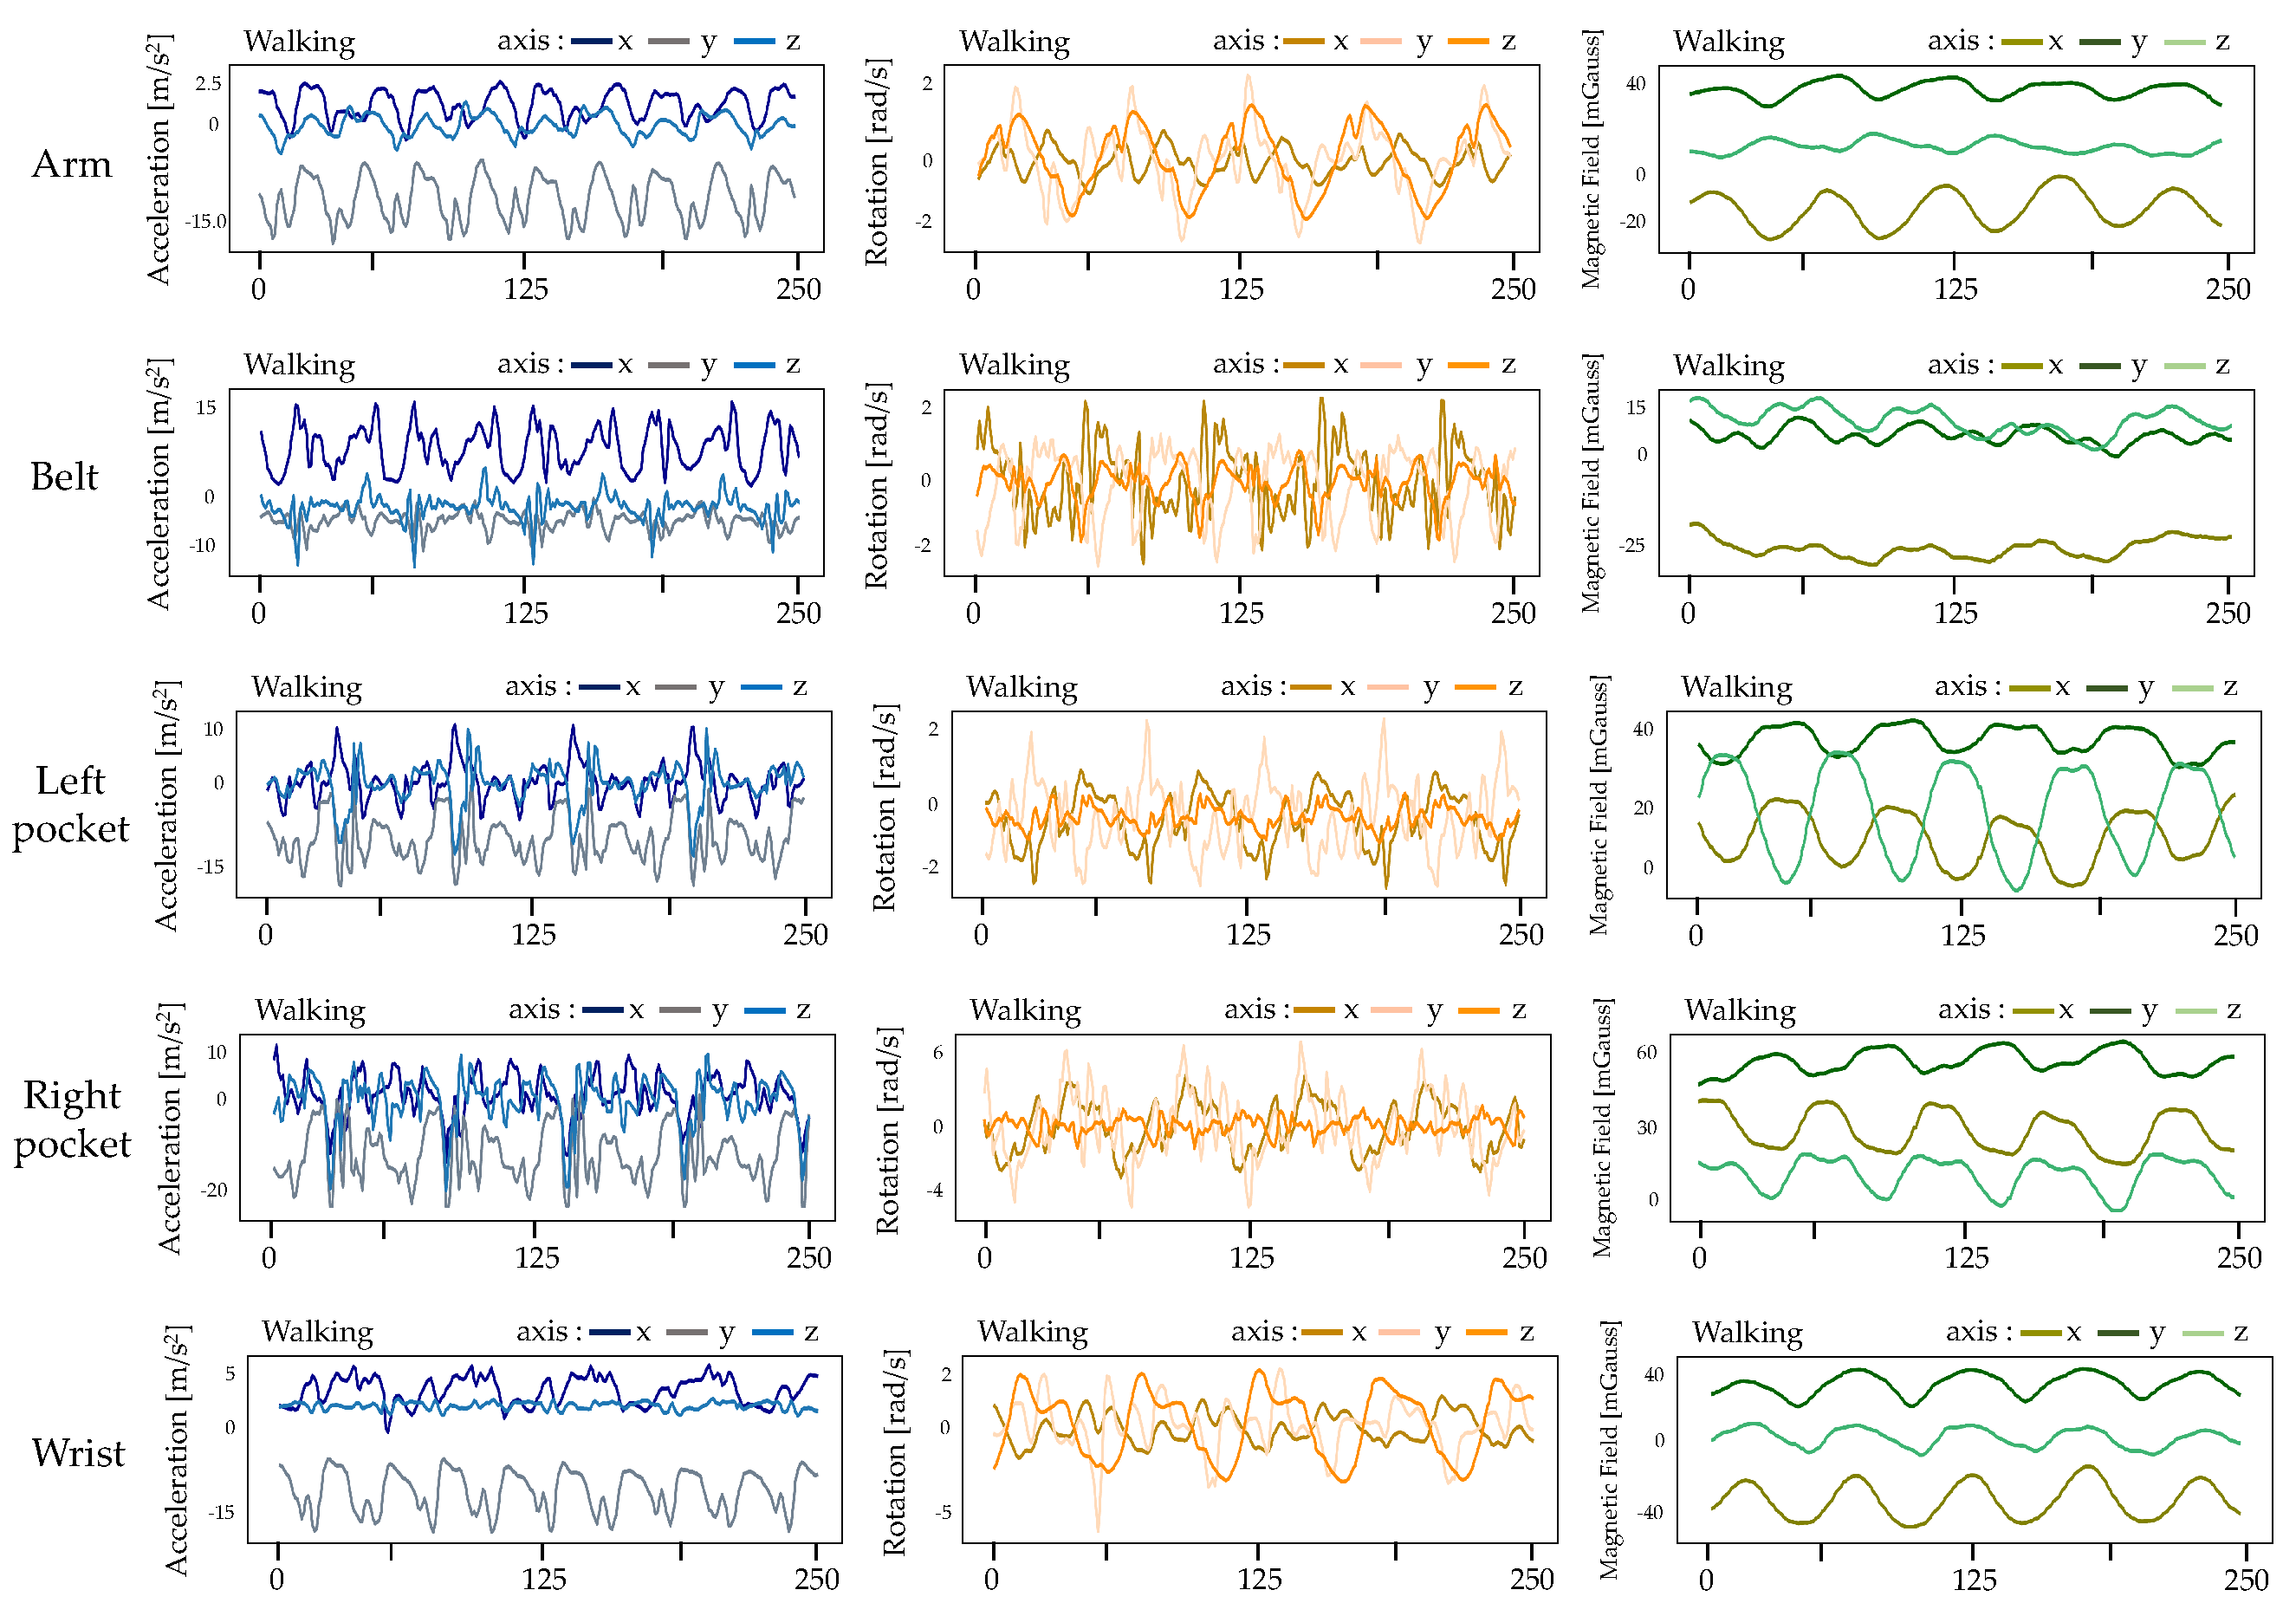
3.1. Data Collection

To examine user identification, this study utilized smartphone sensor data from a dataset called the “pervasive dataset” [18]. This dataset contained data for seven different physical activities: walking, sitting, standing, jogging, biking, ascending stairs, and descending stairs. These common activities represent basic movements in daily life and are frequently used in related research. The data was collected from 10 male participants between 25 and 30 years old who performed each activity for 3–4 min. The experiments were conducted indoors, except biking along a department corridor for walking and jogging. A 5-floor building with stairs was used for ascending and descending stairs. Each participant wore five smartphones in the following locations: both right and left pants pockets, a belt clip on the right leg, upper right arm, and right wrist.
Figure 2 shows data samples from accelerometers, gyroscopes, and magnetometers obtained while an individual was walking. The sensors were placed in various locations on the body. It is evident that there are likely repetitive visible patterns. The arm position would most likely display the greatest acceleration magnitudes since the arms swing rapidly when walking. The steps should be clearly detectable. Measures of rotation and magnetic field would also demonstrate increased frequency changes. Near the waist, vertical axis accelerations may be smaller, yet regular cyclic patterns from stepping are still present. Swaying of the hips could make side-to-side accelerations more visible here. Rotations are less frequent compared to the arms. Placements in pants pockets (right/left) would pick up some vertical accelerations from the legs, but these are decreased because of the damping effect of clothing. While the cyclic pattern of steps remains, amplitudes and peak intensities are reduced. Lateral sway is present but also smaller. On the wrists, substantial dynamic motions are possible depending on arm swinging while walking. There is high variability. Arm swings have a distinct repetitive form. In summary, sensor location impacts observed acceleration magnitudes and the visibility of specific body motions on different axes during walking.

3.2. Pre-Processing Process

During the data collection, the participants were moving actively, which resulted in the raw sensor data being contaminated with measurement noise and other unexpected noises. This kind of noise can distort the information conveyed by the signals. Thus, it was essential to minimize noise interference in the signals so valuable information could be obtained [19]. Popular signal filtering techniques to remove noise include calculating the mean, low-pass filters, and Wavelet filtering. This research applied a third-order Butterworth filter to eliminate noise across all three dimensions of the accelerometer, gyroscope, and magnetometer inputs, using a 20 Hz cut-off frequency. This specific cut-off threshold was selected since it captures over 99.9% of human body motions, making it well-suited for monitoring movement patterns [20].
After removing unwanted noise from the sensor data, it was necessary to make further modifications. Each data point was normalized using a Min-Max normalization approach which rescales the values to be within the range of [0,1]. This normalization helps balance the impact of different dimensions during learning. The normalized data from all sensors were divided into equally sized sections using fixed-size sliding windows during the data segmentation stage of the process. This study used a sliding window with a duration of 10 s to construct sensory data streams with a length as suggested by previous research [21]. The 10-s window was chosen for user identification because it is long enough to capture essential features of a person’s activities, such as multiple repetitions of basic movements like walking and climbing stairs. It allows for faster biometric identification. Moreover, previous studies on activity recognition have shown that a window size of 10 s outperforms other window sizes [22].

3.3. The Proposed DeepResNeXt Architecture

This study proposed a multi-branch aggregation model named DeepResNeXt, which drew inspiration from ResNeXt [23]. The critical innovation in DeepResNeXt is adapting the established ResNeXt computer vision architecture to process smartphone sensor time series effectively for user identification. Specific modifications include converting convolutional blocks to 1D, adding causal convolutions to prevent data leakage between time steps, and leveraging temporal depth to learn distinctive patterns in sensor feeds reflecting user biomechanics incrementally. In contrast, the original ResNeXt structure is restricted to 2D images and does not account for temporal dynamics critical in sequential sensor recognition problems. Rather than spatial images, DeepResNeXt tailors its components and end-to-end flow to extract identifying features efficiently from multi-channel time-series inputs. To emphasize the significance of these alterations from ResNeXt, the DeepResNeXt formulation in our work explicitly details the 1D specialized blocks and architecture, enabling superior user identification accuracy compared to the traditional model. Highlighting the critical adaptations to sensor data and biometrics objectives is vital to convey the differentiating factors underpinning DeepResNeXt’s effectiveness gains.
Unlike InceptionNet [22], which concatenates feature maps of different sizes, DeepResNeXt utilizes a convolutional block followed by coordinated multi-kernel blocks to enhance feature maps uniformly across the network. This unique architecture avoids merging differently-sized feature maps. Instead, the convolutional block first extracts features. Then, the joint multi-kernel blocks transform those features holistically without complex connections between layers of varying dimensions, as in InceptionNet. A detailed description of the DeepResNeXt model can be found in Figure 3.
The convolutional component of the proposed model consists of a convolutional layer (Conv), a batch normalization layer (BN), a rectified linear unit layer (ReLU), and a max-pooling layer (MP). The Conv allows trainable convolutional kernels to learn different features and generate corresponding feature maps. The kernels are one-dimensional, similar to the input spectrum. The BN layer stabilizes and speeds up the training phase, while the ReLU layer enhances the model’s expressive capability. The MP layer compresses the feature map while retaining important elements. The multi-kernel (MK) block is another part of the model. Each MK module contains three different-sized kernels, namely 1 × 3, 1 × 5, and 1 × 7. Before applying the kernels, 1 × 1 convolutions are utilized to decrease overall complexity and the number of learnable parameters in the model. The resulting feature maps are then averaged using Global Average Pooling (GAP) and transformed into a 1D vector via a flat layer. A softmax function converts the fully connected layer’s output into probability scores representing each class. Model training leverages the Adam optimization algorithm, while the cross-entropy loss, commonly used for classification tasks, calculates error to guide learning.

4. Experiments and Results

This section presents the results of experiments we conducted to determine effective DL models for user identification based on sensor data analysis. Utilizing the pervasive dataset, our study identified individuals by examining smartphone sensor information. To evaluate DL model performance, F1-score was employed as assessment metrics.

4.1. Environmental Configuration

The Google Colab Pro+ platform was used in this study. To accelerate DL model training, a Tesla V100-SXM2 graphics processing unit with 16 GB memory was leveraged, yielding excellent performance. Utilizing the Tensorflow backend (version 3.9.1) and CUDA (version 8.0.6) graphics cards, the DeepResNeXt model and other base DL architectures were integrated into the Python library. Several Python packages were used including Numpy and Pandas for processing the sensor data, Matplotlib and Seaborn for visualizing and presenting data analysis and model evaluation outcomes, Scikit-learn for data sampling and generation, and TensorFlow, Keras and other languages for constructing and training DL networks.

4.2. Experiment Setting

In this study, sensor data from the pervasive dataset was utilized to conduct three experiments. These experiments are as follows:
  • Experiment I: DL models were trained using accelerometer and gyroscope data from the wrist location;
  • Experiment II: accelerometer and gyroscope data from the arm location were used to train DL models;
  • Experiment III: DL models were trained using accelerometer and gyroscope data from the belt location;
  • Experiment IV: accelerometer and gyroscope data from the left pocket location were utilized for training DL models;
  • Experiment V: DL models were trained using accelerometer and gyroscope data from the right pocket location.
The performance of several CNNs and RNN models, including the proposed DeepResNeXt model, and their baseline counterparts were evaluated using a 5-fold cross-validation method in 3 separate trials.
DL models can be tuned by setting key hyperparameters, with the DeepResNeXt architecture using: (i) number of epochs, (ii) batch size, (iii) learning rate α , (iv) optimization algorithm, and (v) loss function. To configure these, the number of training epochs was set to 200 and batch size to 128 samples. An early stopping callback halted training if validation loss failed to improve after 20 consecutive epochs. The initial learning rate α was 0.001, lowered to 75% of the previous value if validation accuracy stalled over 6 straight epochs. The Adam optimizer minimized error with parameters β 1 = 0.9, β 2 = 0.999, and ϵ = 1 × 10 8 . The categorical cross-entropy function was used to calculate the error in the optimizer since it has been found to outperform other techniques, such as classification error and mean square error [24].

4.3. Experimental Results

The results of the first experiment, which focused on training and testing models solely with accelerometer and gyroscope data from the wrist location, are presented in Table 1. The DeepResNeXt model that we proposed outperformed all other models in this experiment. It achieved the highest F1-score, significantly improving it over the baseline DL models.
The outcomes in Table 2 demonstrate performance using sensor data from the arm to train and evaluate DL models. The findings show that the proposed DeepResNeXt architecture achieved the highest F1-score at 98.86%, outperforming the other baseline deep networks by a sizable margin.
Experiment III results are presented in Table 3, which shows that DL models trained using accelerometer and gyroscope data from the belt location are effective. The DeepResNeXt model we proposed achieved the highest scores in this experiment. With an F1-score of 99.86%, the suggested model significantly outperformed other baseline DL models.
Experiment IV aimed to use accelerometer and gyroscope data from the left pocket location for training and testing DL models, as summarized in Table 4. The results show that our suggested DeepResNeXt model outperforms other baseline DL models with an outstanding F1-score of 99.71%.
Experiment V leveraged accelerometer and gyroscope data from the right pants pocket to train and evaluate DL models, with results shown in Table 5. The findings demonstrate that our proposed DeepResNeXt architecture performed remarkably well, achieving an exceptional F1-score of 99.29% that surpassed the other deep networks tested.

4.4. Additional Experiments

Additional experiments in this study showcase the proposed DeepResNeXt system’s ability to identify individuals using sensor data gathered from many smartphone owners. The research utilized the publicly available UCI-HAR dataset, captured using waist-worn Samsung Galaxy SII devices [20]. Thirty volunteers performed six everyday activities, including walking, ascending/descending stairs, sitting, standing, and lying while carrying smartphones. The dataset compiled 10,299 total accelerometer and gyroscope measurements at 50 Hz over 2.56-s sliding windows across all participants. This comprehensive collection of sensor streams during varied motions enables analysis of biometric identification efficacy across a representative smartphone user population sample.
We conducted experiments with the public UCI-HAR dataset to evaluate the proposed DeepResNeXt system’s effectiveness in identifying users across three diverse scenarios:
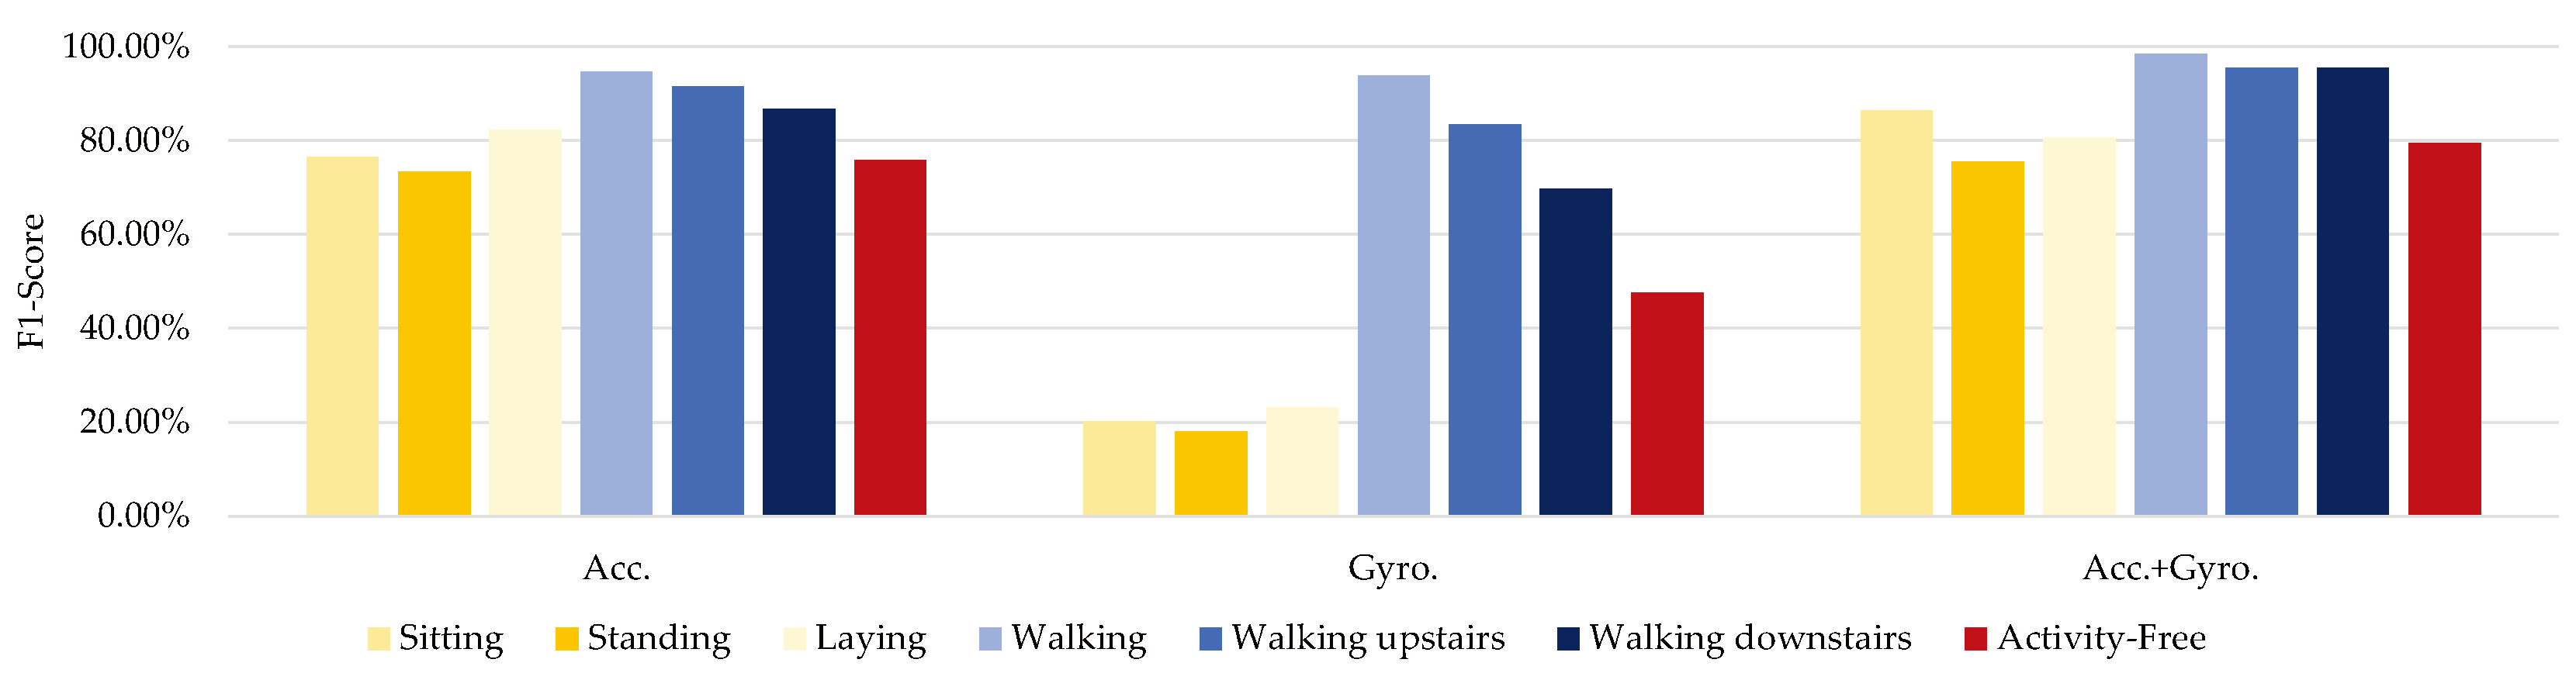
  • The first experiment scenario utilized accelerometer sensor data exclusively. This single motion modality input trained and tested the model using dynamic measurements of bodily movements and actions;
  • The second scenario relied exclusively on gyroscope data to capture rotational motions. Translational accelerations from the accelerometer sensor were omitted in this case. Only orientation changes contributed inputs for analysis rather than bodily dynamics;
  • The third scenario integrated both accelerometer and gyroscope streams as inputs. This multimodal fusion provided multivariate time-series data capturing rotational orientations, bodily movements, and dynamics. The richer input enabled a more comprehensive analysis of the system’s capability to extract distinctive traits from diverse signal types during unrestrained motions.
This study compares identification accuracy across single and multiple sensor input scenarios. The goal is to evaluate how fusing different motion modalities impacts the proposed system’s ability to recognize individuals based on patterns within their daily activity characteristics. The analysis assesses explicitly if integrating orientation and dynamic measurements enhances user distinguishability compared to relying on either accelerometer or gyroscope data alone.
The results summarized in Table 6 enable the following assessments regarding the proposed system’s efficacy across various sensor data scenarios:
  • Using only accelerometer data (Scenario 1), the model achieves an admirable 82–95% accuracy for dynamic activities like walking, climbing stairs, and lying down. However, the accuracy dips comparatively lower to 75–78% for seated and standing tasks that involve greater motion inertia and less overall change. More limited distinguishing traits likely manifest for static poses lacking rich accelerometer differentiators;
  • Without gyroscope inputs (Scenario 2), identification accuracy fluctuates dramatically across activity types. Dynamic motions like walking have significantly higher 94% recognition, given plentiful distinguishing motion cues. However, static poses lacking rotations fare far poorer at 23% accuracy for sitting tasks. Likely, the orientation changes measurable by a gyroscope better differentiates stationary positions that are otherwise hard to characterize uniquely;
  • Fusing accelerometer and gyroscope data (Scenario 3) significantly boosts accuracy to 95–98% across most activities versus individual sensor performance. The complementary orientation and motion measurements provide richer input to characterize user traits better. Likely, the additional modalities capture distinguishing features that are difficult to identify from single sensor streams in isolation uniquely. Multimodal integration enhances recognition efficacy overall;
  • The performance differences across sensor and activity types highlight each modality’s strengths. Gyroscopes better capture rotational motions while accelerometers excel at overall body dynamics. Combining these complementary orientations and translations creates a more comprehensive movement signature. The enriched characterization of user biomechanics and behaviors during daily tasks enables more reliable identification from sensor readings. Fusing distinct signal captures subtle distinguishing traits that individual streams miss in isolation.
The analysis verifies that the proposed system can effectively leverage smartphone sensor data to identify individuals. Fusing accelerometer and gyroscope feeds boosts accuracy by capturing diverse complementary facets of distinctive user motion patterns during daily activities. The multifaceted biomechanical characterization enables more reliable recognition compared to individual data streams.

5. Discussion

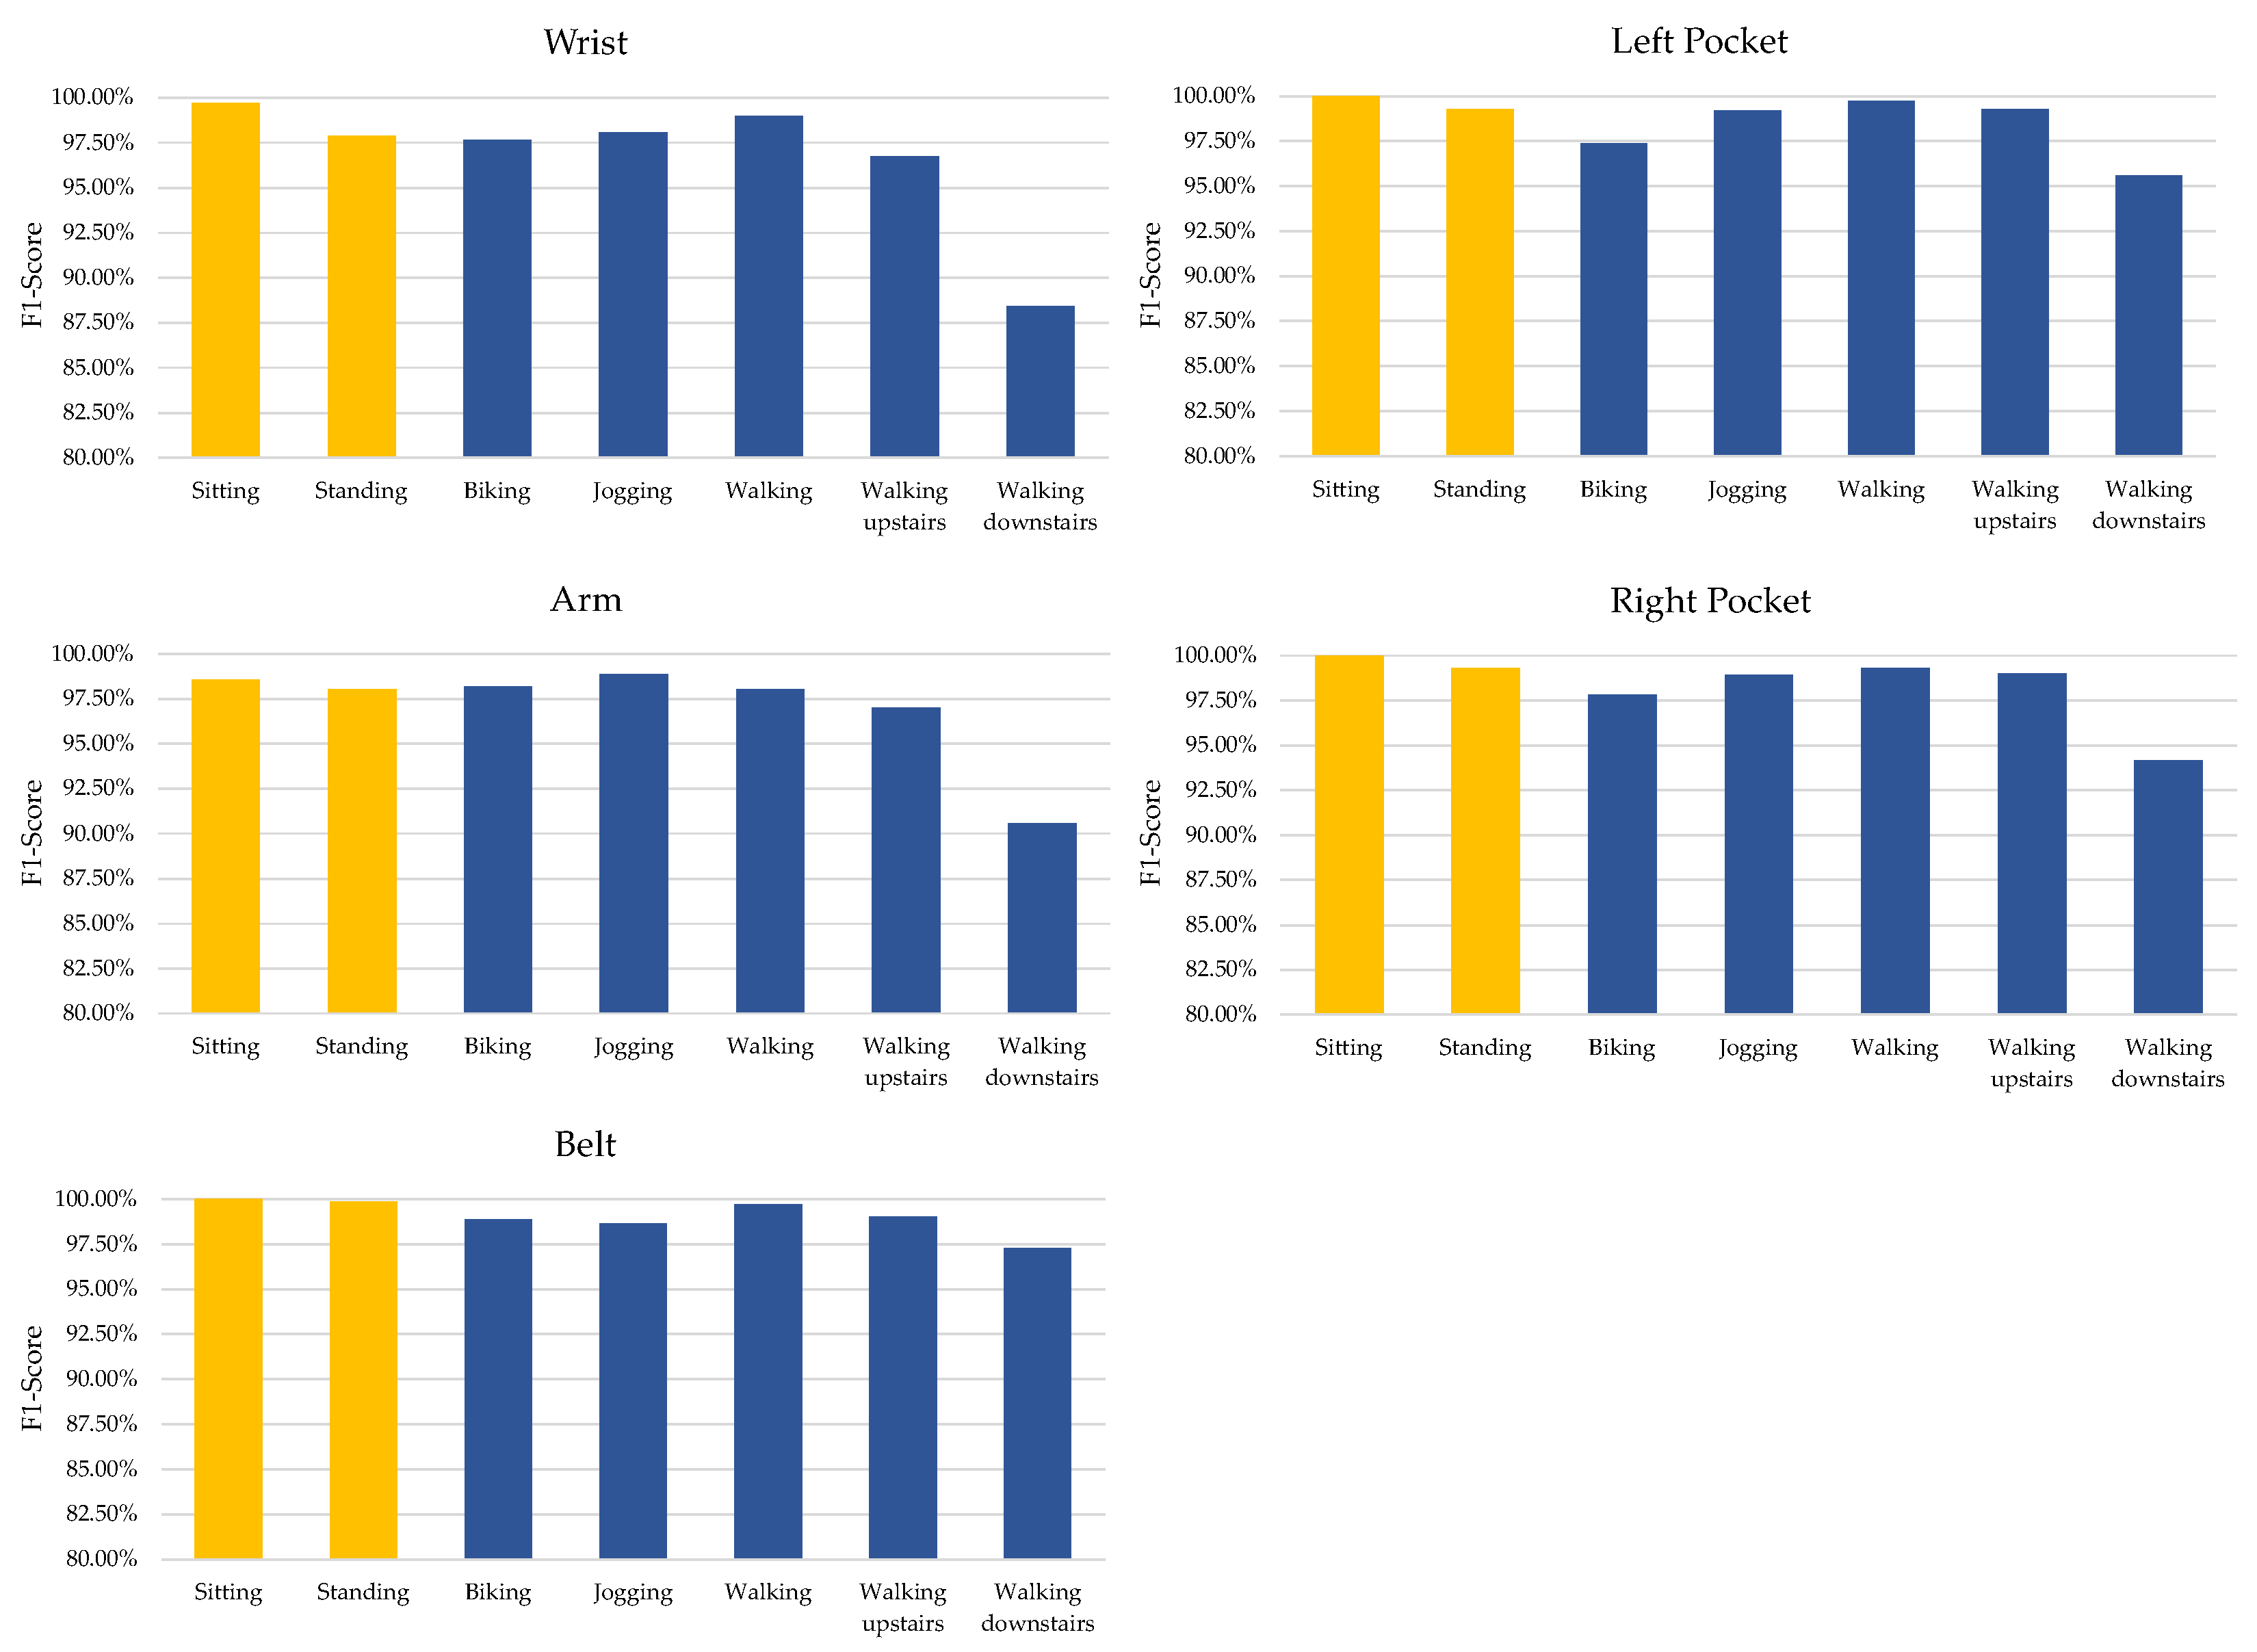
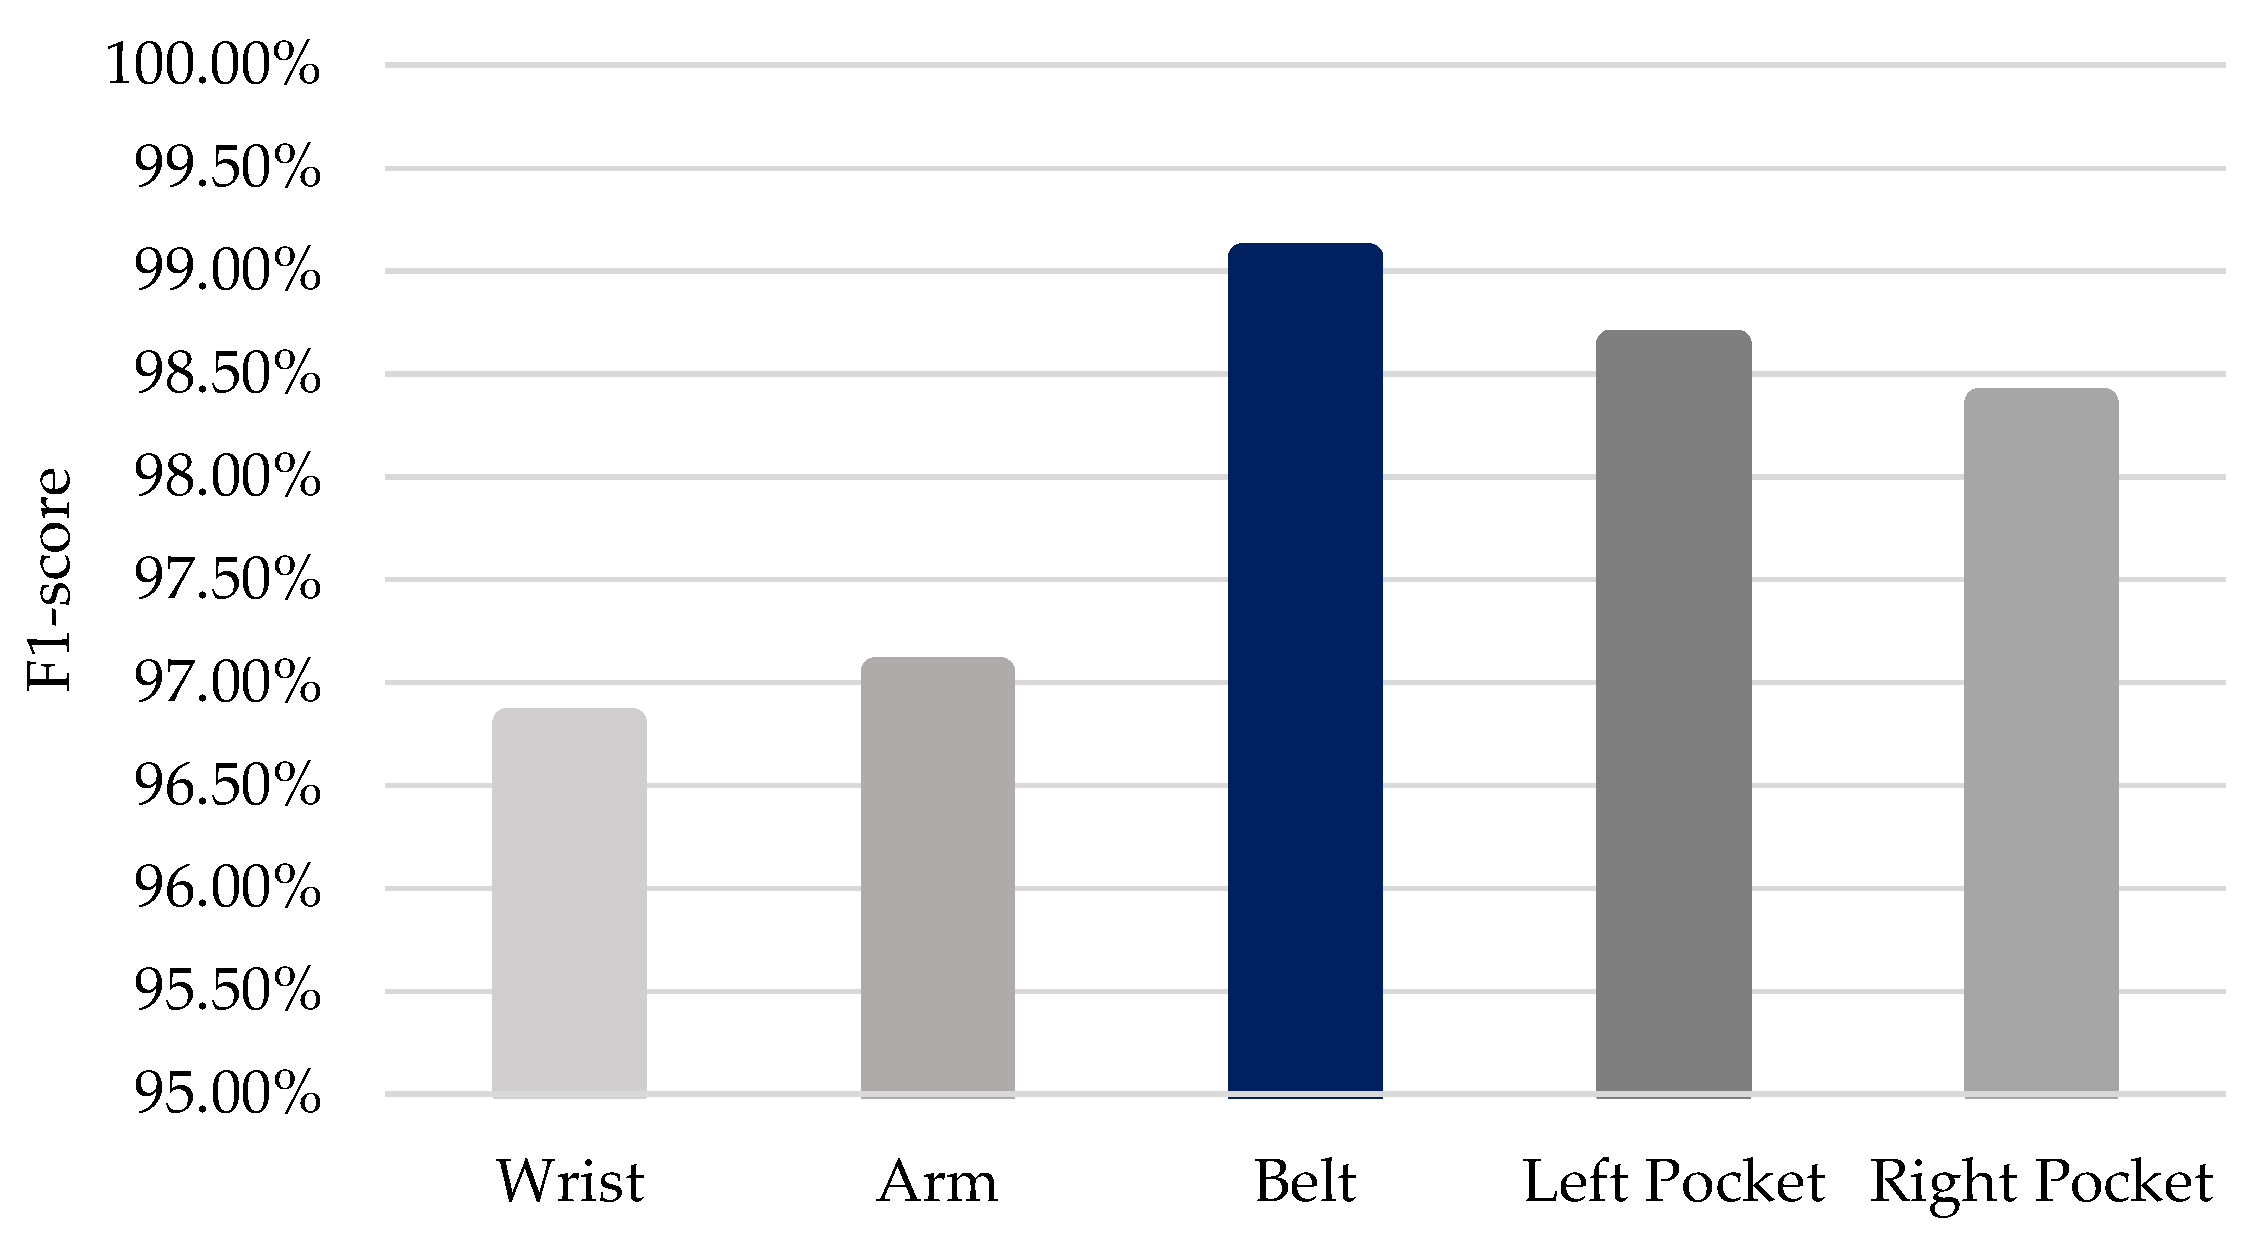
5.1. Effects of Smartphone Sensor Placement

In order to better understand how sensor placement affects the performance of identification models, we analyzed the results from Table 1, Table 2, Table 3, Table 4 and Table 5 and calculated the average F1-scores for the five sensor placements (wrist, arm, belt, left pocket, and right pocket). The findings, shown in Figure 4, suggest that belt placement is the most effective for smartphone-based user identification.

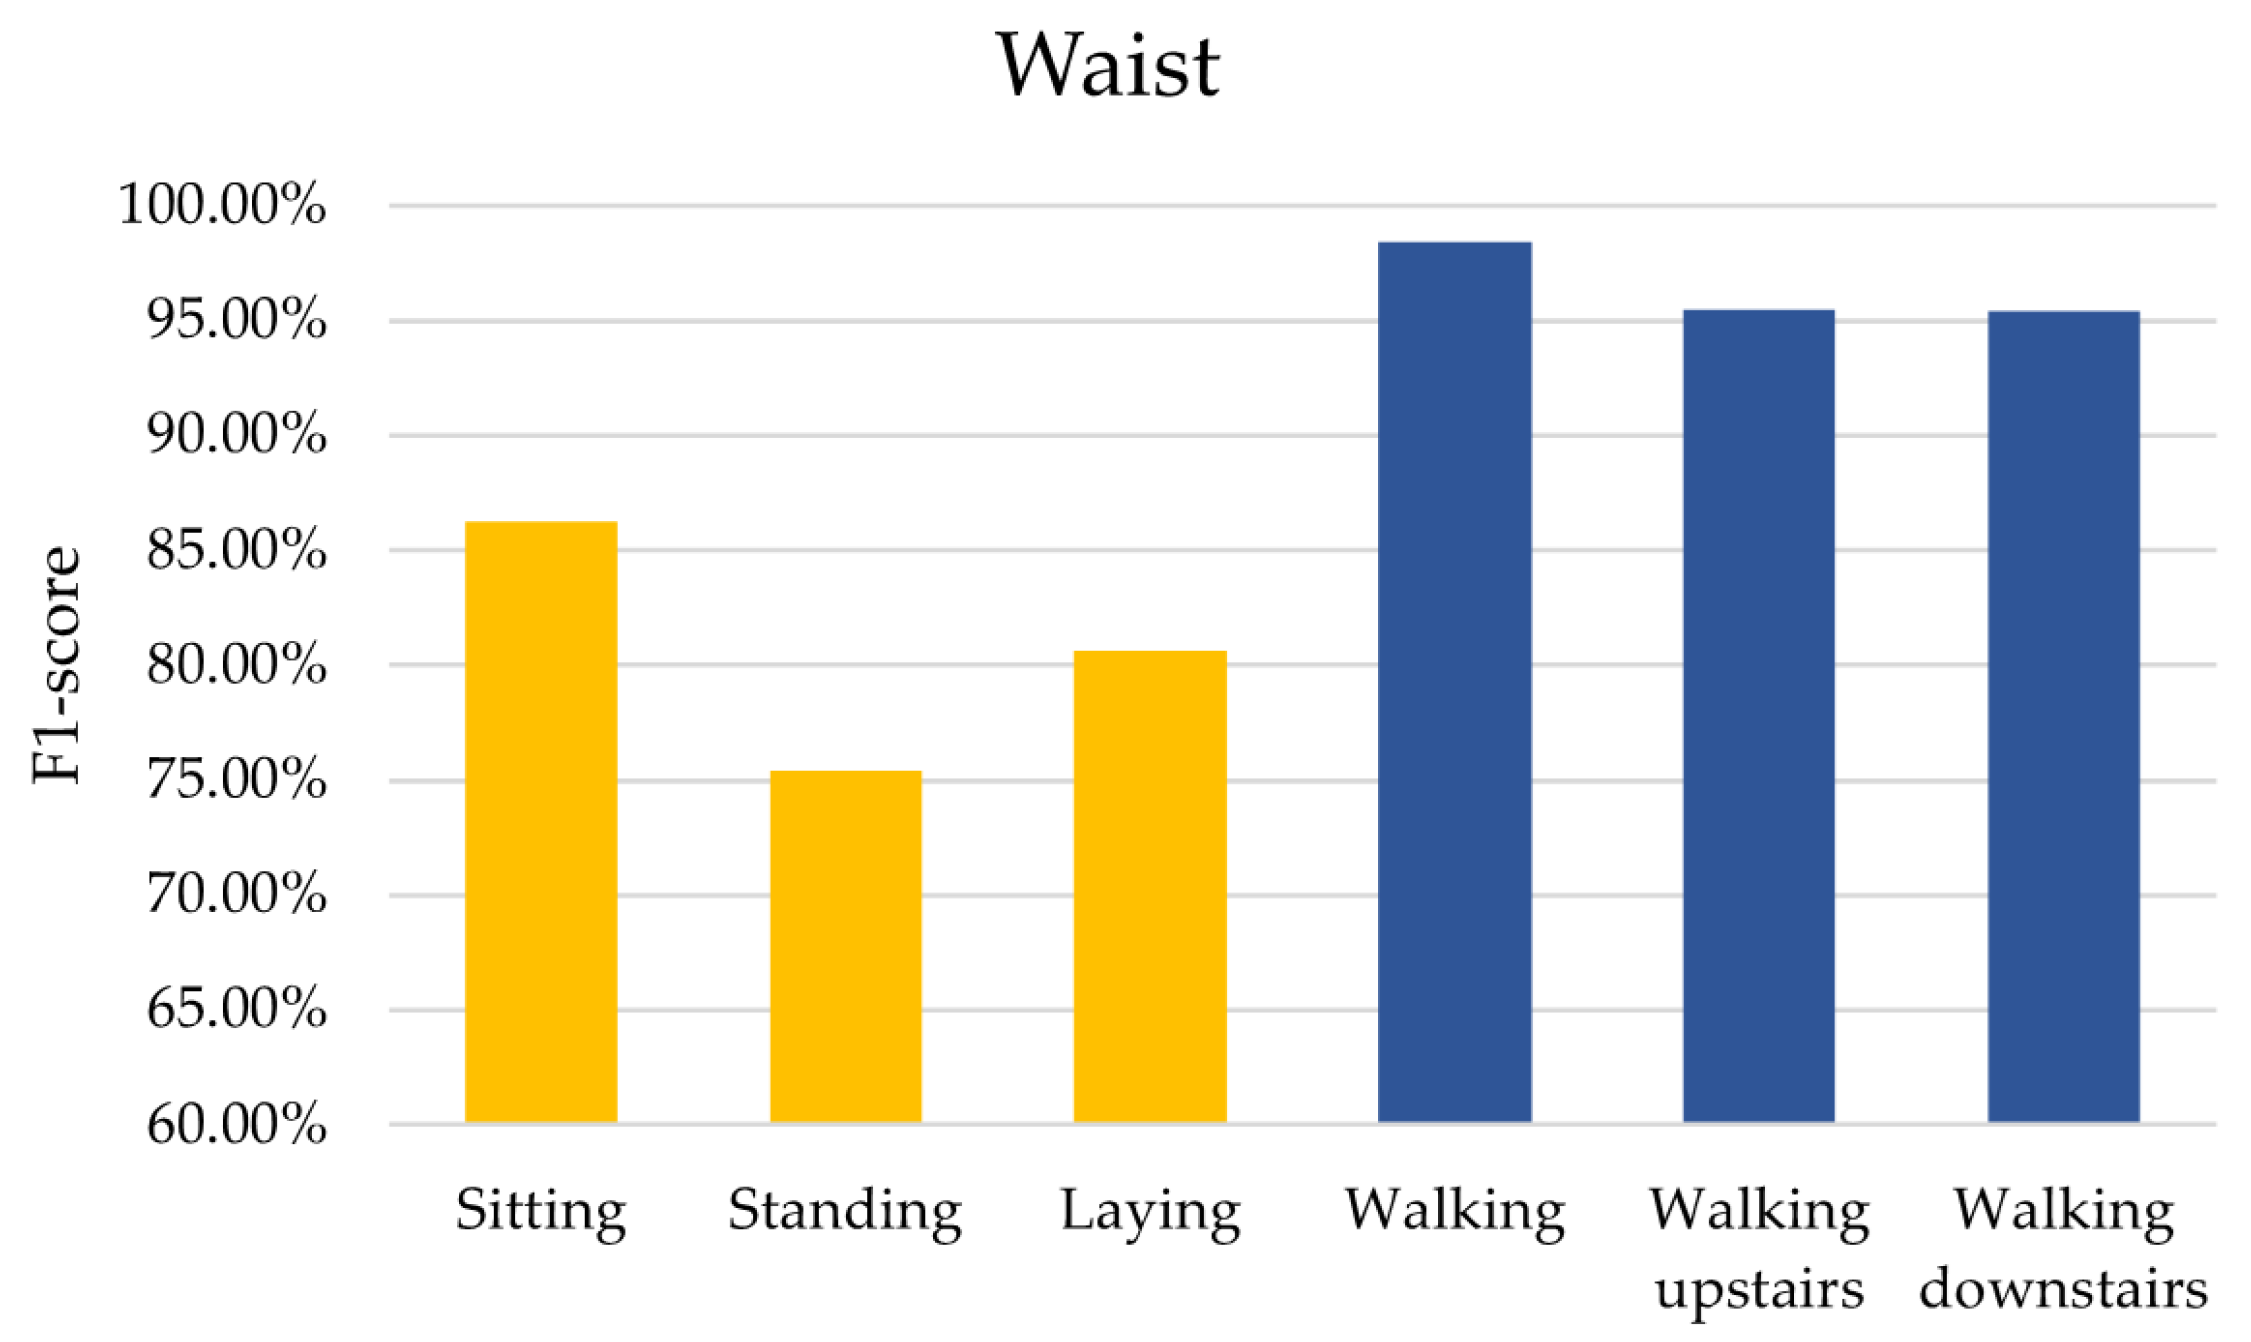
5.2. Effects of Different Activity Types

We examined how different types of sensor inputs affect user identification efficiency across various activities using the experimental data. We used the pervasive dataset to evaluate the impact of activity categories since it contained two different types of activities: static and dynamic. The results of F1-scores presented in Table 1, Table 2, Table 3, Table 4 and Table 5 demonstrate that the proposed DeepResNeXt model consistently achieved higher average F1-scores when trained with mobile sensing data of dynamic activities for all sensor placements. This is illustrated in Figure 5.
We looked at how different types of activities impacted our model’s ability to recognize them using the UCI-HAR dataset. Unlike the other dataset, this one only had accelerometer and gyroscope data, not magnetometer data. After reviewing the data in Table 6, we saw that the model’s capacity to identify users varied depending on the activity. Figure 6 shows these comparison results. Sitting down generated the lowest F1-score, around 60%. Sitting likely produces minimal motion signals. The F1-scores for standing and lying down were roughly 65–70% higher. The similar stationary poses during these activities may have caused some confusion. Dynamic activities like walking, climbing stairs up and down, had much higher F1-scores in the 80–95% range. The motion patterns captured during these activities improved the reliability of identifying the user.
The data in Figure 6 shows that biometric identification works better for dynamic activities with repetitive motions compared to static poses. This contrasts with the findings depicted in Figure 5. That figure relates to stationary activities and uses a comprehensive dataset with accelerometer, gyroscope, and magnetometer data. Later in Section 5.3, we take a closer look at how different sensor types impact the results.

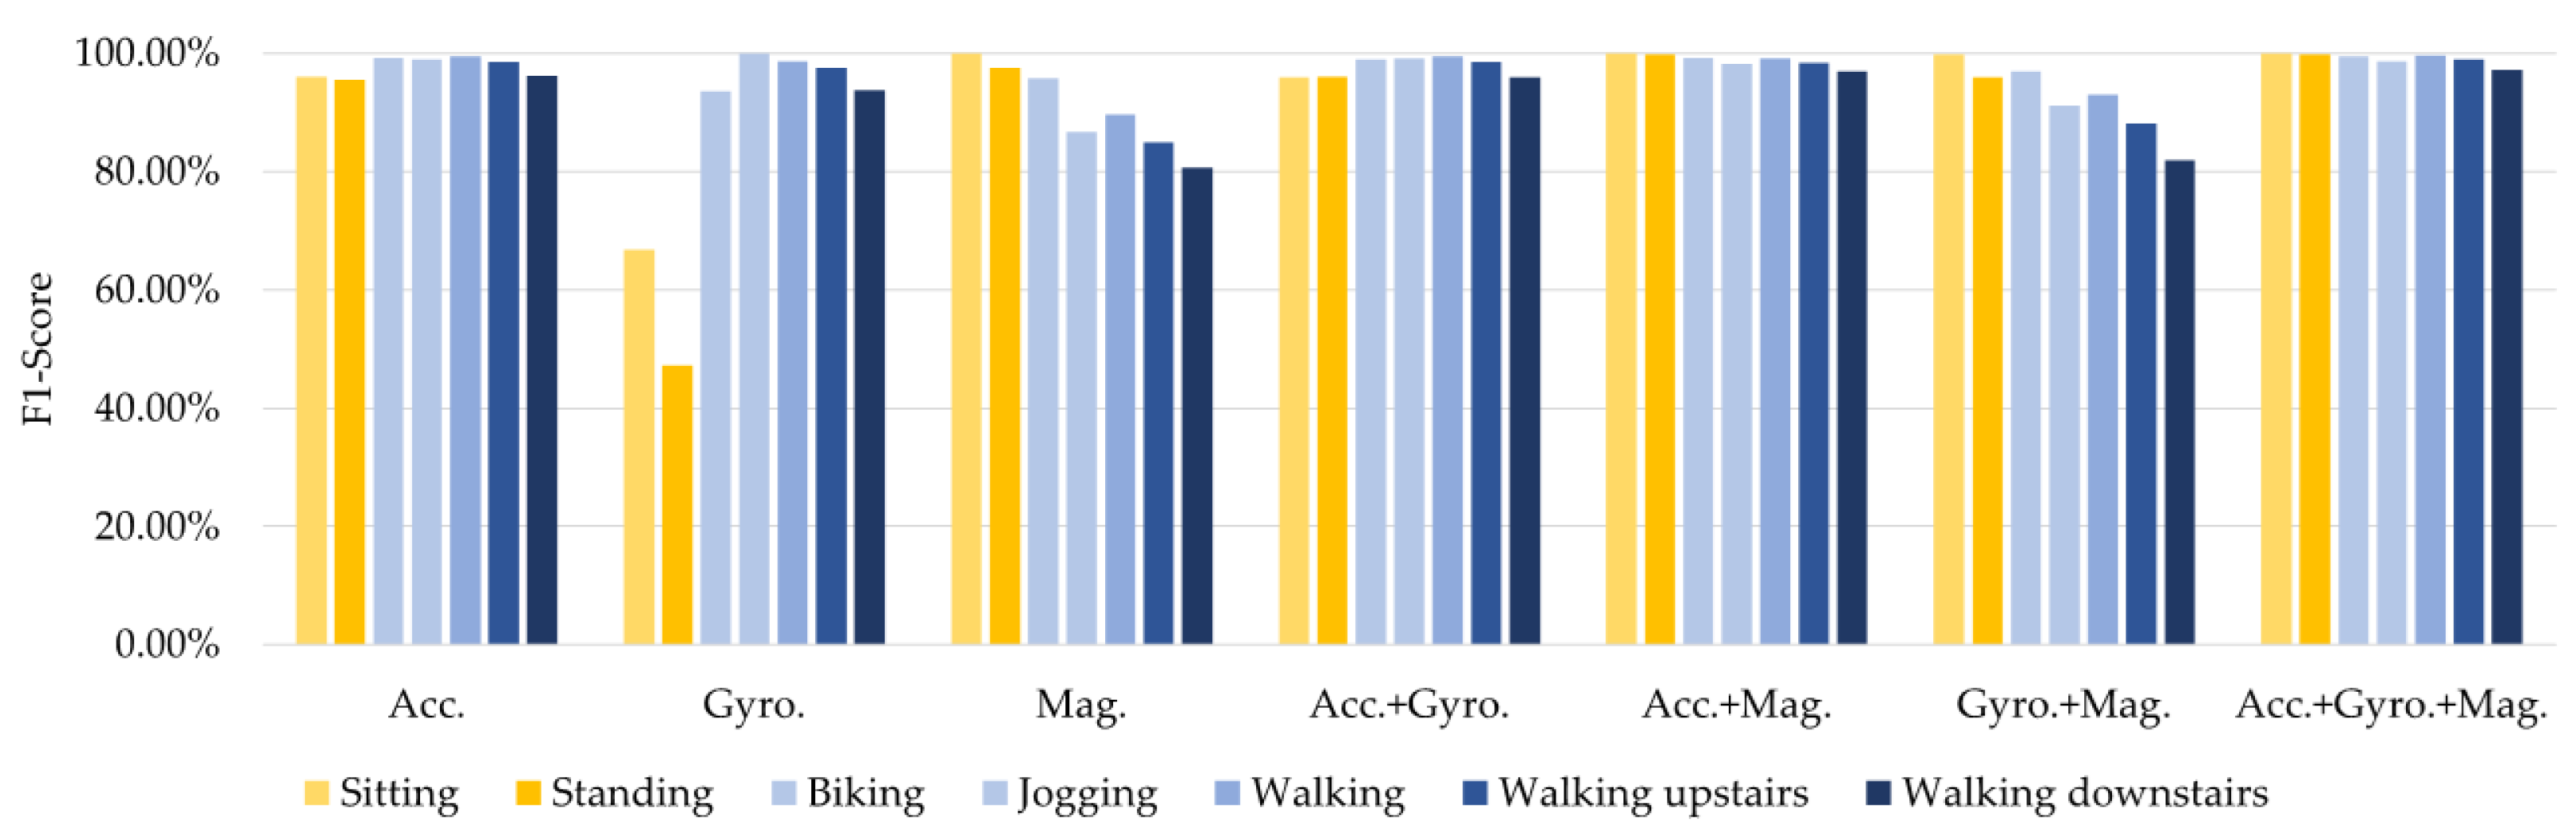
5.3. Effects of Sensor Types

We conducted more experiments to analyze the effects of using different sensor types on identifying users. Multiple combinations of sensor data were leveraged to train and test the DeepResNeXt model. We started by examining the impact of various sensor categories using a comprehensive dataset with an accelerometer, gyroscope, and magnetometer included. The results from analyzing how the different individual and combined sensors influenced the outcomes were summarized in Table 7.
For most activities, accelerometer data alone provided over 95% accurate identification. This signals that large-scale body motions are already highly user-specific. Gyroscope data gave great precision for dynamic actions like walking and biking but significantly declined for non-moving activities such as resting. Orientation changes are more informative during movement versus stationary poses. Unlike motions needing significant body movement, magnetometer data accuracy for standing and sitting neared 100%. It better captured the user in a fixed pose. The accuracy combining accelerometer and gyroscope data was comparable to accelerometer-only, so adding more orientation information improved a little when macro motion data already existed. Adding a magnetometer to the accelerometer notably increased walking and standing accuracy over using the accelerometer alone. Magnetometers provided extra pose-linked information. Over the broadest variety of activities, fusing all three sensor types achieved maximum total accuracy. Each modality offers distinct identification details about users’ characteristic motion patterns and biomechanics.
We performed additional experiments with the UCI-HAR dataset to analyze further how different sensor categories impacted the results. This dataset incorporated accelerometer and gyroscope data. We summarized the findings of testing different combinations of those sensor inputs in Table 8.
The data in Table 8 shows that even using an accelerometer provided 91–95% accuracy for walking activities. When strolling, gyroscope data on its own also delivered a decent performance. This indicates that unique user signatures exist in the overall body motions and rotational patterns during these actions. Gyroscope accuracy for sitting, standing, and lying was considerably lower at under 27%. Without dynamic movements, meaningful orientation changes cannot be captured. Combining accelerometer and gyroscope data remarkably improved accuracy over individual sensors for all activities, reaching 95–98%. Blending the data allowed the extraction of complementary distinguishing characteristics of the users.
Figure 7 and Figure 8 compare the results for stationary activities like sitting, standing, and lying between Table 7 (using magnetometers) and Table 8 (with no magnetometer data). When we supplemented the accelerometer and gyroscope data with magnetometer readings (Table 7), the accuracy for sitting and standing increased substantially by 96–100%. This highlights how magnetometers, which measure directional shifts in magnetic fields created by a user’s presence, provide informative pose-linked details that other sensor types miss.

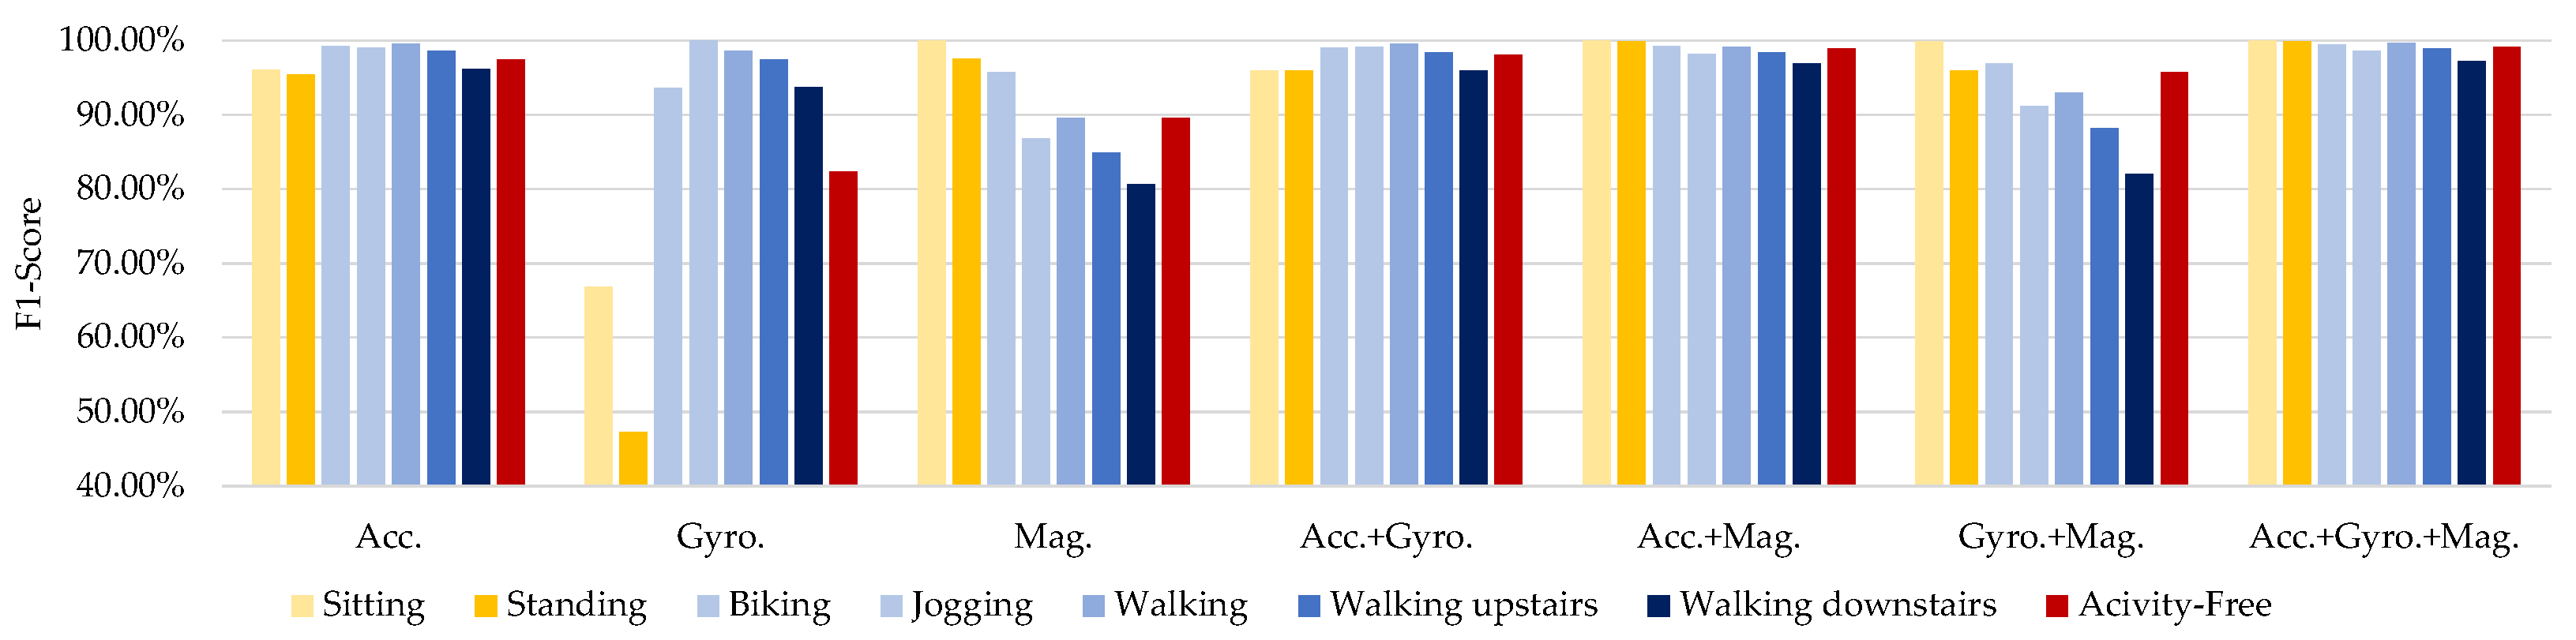
5.4. Activity-Free User Identification

Performing specific activities is not necessary for verifying a user’s identity with activity-free user identification, an approach to biometric user authentication [13]. This method does not mandate or presume that users must carry out particular motions or tasks so it can recognize them. For example, individuals do not need to execute certain gestures or movements deliberately. Thus, people can go about their routines and interactions with mobile devices without altering their conduct or limiting their actions.
In this study, we analyzed the performance of the proposed DeepResNeXt system for recognizing users without requiring specific activities, using sensor data from a comprehensive dataset. This dataset contained measurements from belt-worn sensors across various motion categories. Our comparison shows the proposed technique’s effectiveness for activity-free identification across different activity types, as illustrated in the results of Figure 9.
The results in Figure 9 demonstrate over 90% accuracy in identifying users based solely on accelerometer data without presuming any particular activities are performed. This confirms that overall body motions provide a robust biometric signal for recognition. Activity-free identification performs worst with only a gyroscope, yielding under 60% accuracy since rotational data lacks adequacy without dynamic actions. A magnetometer alone exhibits suboptimal effectiveness at approximately 65% accuracy for arbitrary motions lacking specific posture conditioning that would cause predictive magnetic distortion. However, by integrating accelerometer, gyroscope, and magnetometer streams, activity-free identification accuracy improves to 98%—on par with recognition rates for conditioned activities. Combining these three sensors enhances the distinctiveness of biometric signatures extractable from regular motions. Activity conditioning marginally boosts most single-sensor cases by 2–3% above the activity-free scenario, minus the gyroscope, where performance differences are negligible.
We further analyzed the proposed DeepResNeXt system’s effectiveness for activity-free user identification using the UCI-HAR dataset, which contains labeled sensor measurements across various motion types. Our analysis mainly focused on evaluating performance without presuming any specific activities. Figure 10 illustrates the comparative outcomes of this activity-agnostic evaluation scenario based on this standardized dataset.
As depicted in Figure 10, accelerometer-only accuracy for activity-free identification reaches just under 60%. While some unique characteristics persist without assuming specific motions, overall performance diminishes considerably. A gyroscope alone does even worse at a dismal 20% accuracy for the unrestricted scenario, as rotational signals lack adequacy without dynamic actions. However, combining accelerometer and gyroscope data significantly enhances activity-agnostic recognition to 80% accuracy. Likely, each sensor captures complementary distinguishing traits that are usable together. However, this multimodal fusion still lags conditioned activity identification by 15–20%. Presuming particular motions increases the recognition utility of sensor streams individually.

6. Conclusions and Future Work

Smartphones have become integral to daily life. Holding sensitive photographs, communications, and banking details, securing access is crucial to prevent unauthorized use. Meeting this need, we introduced DeepUserIden, a framework identifying users via mobile sensor analytics. Our novel DeepResNeXt model identifies distinct activity signatures without requiring user input. Experimenting on the public pervasive benchmark, we demonstrated DeepUserIden’s effectiveness in accurately verifying individuals across various sensors. Our results advance state-of-the-art F1-scores for identification through smartphone sensing.
Moving forward, we intend expanding DeepUserIden to detect more complex behaviors by incorporating additional sensors like virtual inputs. Our research also enables future access control selectively granting users permissions based on behavioral traits.

Author Contributions

Conceptualization, S.M. and A.J.; methodology, S.M.; software, A.J.; validation, A.J.; formal analysis, S.M.; investigation, S.M.; resources, A.J.; data curation, A.J.; writing—original draft preparation, S.M.; writing—review and editing, A.J.; visualization, S.M.; supervision, A.J.; project administration, A.J.; funding acquisition, S.M. and A.J. All authors have read and agreed to the published version of the manuscript.

Funding

This research was funded by Thailand Science Research and Innovation Fund; University of Phayao (Grant No. FF67-UoE-Sakorn); National Science, Research and Innovation Fund (NSRF); and King Mongkut’s University of Technology North Bangkok with Contract no. KMUTNB-FF-67-B-09.

Institutional Review Board Statement

Not applicable.

Informed Consent Statement

Not applicable.

Data Availability Statement

All data were presented in the main text.

Conflicts of Interest

The authors declare no conflicts of interest.

Abbreviations

The following abbreviations are used in this manuscript:
Acc.Accelerometer
ACCAccuracy(%)
BiGRUBidirectional gated recurrent unit
BiLSTMBidirectional long short-term memory
BiRNNBidirectional recurrent neural network
BNBatch normalization
CNNConvolutional neural network
ConvConvolutional layer
Conv1DOne-dimensional convolutional layer
DLDeep learning
F1F1-score(%)
GAPGlobal average pooling
Gyro.Gyroscope
GRUGated recurrent unit
HARHuman activity recognition
LSTMLong short-term memory
Mag.Magnetometer
MLMachine learning
MKMulti-kernel
MPMax-pooling
ReLURectified linear unit layer
RNNRecurrent neural network
UCIThe university of California Irvine

References

  1. Wong, S.K.; Yiu, S.M. Location spoofing attack detection with pre-installed sensors in mobile devices. J. Wirel. Mob. Netw. Ubiquitous Comput. Dependable Appl. 2020, 11, 16–30. [Google Scholar] [CrossRef]
  2. Frik, A.; Kim, J.; Sanchez, J.R.; Ma, J. Users’ Expectations About and Use of Smartphone Privacy and Security Settings. In Proceedings of the 2022 CHI Conference on Human Factors in Computing Systems, New York, NY, USA, 29 April 2022. CHI ’22. [Google Scholar] [CrossRef]
  3. Nowaczewski, S.; Mazurczyk, W. Securing Future Internet and 5G using Customer Edge Switching using DNSCrypt and DNSSEC. J. Wirel. Mob. Netw. Ubiquitous Comput. Dependable Appl. 2020, 11, 87–106. [Google Scholar] [CrossRef]
  4. Liu, S.; Shao, W.; Li, T.; Xu, W.; Song, L. Recent advances in biometrics-based user authentication for wearable devices: A contemporary survey. Digit. Signal Process. 2022, 125, 103120. [Google Scholar] [CrossRef]
  5. Wang, Y.; Zhang, X.; Hu, H. Continuous User Authentication on Multiple Smart Devices. Information 2023, 14, 274. [Google Scholar] [CrossRef]
  6. Ehatisham-ul Haq, M.; Azam, M.A.; Loo, J.; Shuang, K.; Islam, S.; Naeem, U.; Amin, Y. Authentication of Smartphone Users Based on Activity Recognition and Mobile Sensing. Sensors 2017, 17, 2043. [Google Scholar] [CrossRef] [PubMed]
  7. Drosou, A.; Ioannidis, D.; Moustakas, K.; Tzovaras, D. Spatiotemporal analysis of human activities for biometric authentication. Comput. Vis. Image Underst. 2012, 116, 411–421. [Google Scholar] [CrossRef]
  8. Mahfouz, A.; Mahmoud, T.M.; Eldin, A.S. A survey on behavioral biometric authentication on smartphones. J. Inf. Secur. Appl. 2017, 37, 28–37. [Google Scholar] [CrossRef]
  9. Mekruksavanich, S.; Jitpattanakul, A. Deep Learning Approaches for Continuous Authentication Based on Activity Patterns Using Mobile Sensing. Sensors 2021, 21, 7519. [Google Scholar] [CrossRef] [PubMed]
  10. Benegui, C.; Ionescu, R.T. Convolutional Neural Networks for User Identification Based on Motion Sensors Represented as Images. IEEE Access 2020, 8, 61255–61266. [Google Scholar] [CrossRef]
  11. Neverova, N.; Wolf, C.; Lacey, G.; Fridman, L.; Chandra, D.; Barbello, B.; Taylor, G. Learning Human Identity From Motion Patterns. IEEE Access 2016, 4, 1810–1820. [Google Scholar] [CrossRef]
  12. ul Haq, M.E.; Malik, M.N.; Azam, M.A.; Naeem, U.; Khalid, A.; Ghazanfar, M.A. Identifying Users with Wearable Sensors based on Activity Patterns. Procedia Comput. Sci. 2020, 177, 8–15. [Google Scholar] [CrossRef]
  13. Sanchez Guinea, A.; Heinrich, S.; Mühlhäuser, M. Activity-Free User Identification Using Wearables Based on Vision Techniques. Sensors 2022, 22, 7368. [Google Scholar] [CrossRef] [PubMed]
  14. Mekruksavanich, S.; Jitpattanakul, A. Biometric User Identification Based on Human Activity Recognition Using Wearable Sensors: An Experiment Using Deep Learning Models. Electronics 2021, 10, 308. [Google Scholar] [CrossRef]
  15. Ahmad, M.; Raza, R.A.; Mazzara, M.; Distefano, S.; Bashir, A.K.; Khan, A.; Sarfraz, M.S.; Aftab, M.U. Multi Sensor-Based Implicit User Identification. Comput. Mater. Contin. 2021, 68, 1673–1692. [Google Scholar] [CrossRef]
  16. Lv, M.; Xu, W.; Chen, T. A hybrid deep convolutional and recurrent neural network for complex activity recognition using multimodal sensors. Neurocomputing 2019, 362, 33–40. [Google Scholar] [CrossRef]
  17. Zhang, M. Gait Activity Authentication Using LSTM Neural Networks with Smartphone Sensors. In Proceedings of the 2019 15th International Conference on Mobile Ad-Hoc and Sensor Networks (MSN), Shenzhen, China, 11–13 December 2019; pp. 456–461. [Google Scholar] [CrossRef]
  18. Shoaib, M.; Bosch, S.; Incel, O.D.; Scholten, H.; Havinga, P.J.M. Fusion of Smartphone Motion Sensors for Physical Activity Recognition. Sensors 2014, 14, 10146–10176. [Google Scholar] [CrossRef] [PubMed]
  19. Mostayed, A.; Kim, S.; Mazumder, M.M.G.; Park, S.J. Foot Step Based Person Identification Using Histogram Similarity and Wavelet Decomposition. In Proceedings of the 2008 International Conference on Information Security and Assurance (ISA 2008), Busan, Republic of Korea, 24–26 April 2008; pp. 307–311. [Google Scholar] [CrossRef]
  20. Anguita, D.; Ghio, A.; Oneto, L.; Parra, X.; Reyes-Ortiz, J.L. A Public Domain Dataset for Human Activity Recognition using Smartphones. In Proceedings of the European Symposium on Artificial Neural Networks, Bruges, Belgium, 24–26 April 2013; pp. 437–442. [Google Scholar]
  21. Weiss, G.M.; Yoneda, K.; Hayajneh, T. Smartphone and Smartwatch-Based Biometrics Using Activities of Daily Living. IEEE Access 2019, 7, 133190–133202. [Google Scholar] [CrossRef]
  22. Ismail Fawaz, H.; Lucas, B.; Forestier, G.; Pelletier, C.; Schmidt, D.F.; Weber, J.; Webb, G.I.; Idoumghar, L.; Muller, P.A.; Petitjean, F. InceptionTime: Finding AlexNet for Time Series Classification. Data Min. Knowl. Discov. 2020, 34, 1936–1962. [Google Scholar] [CrossRef]
  23. Xie, S.; Girshick, R.; Dollár, P.; Tu, Z.; He, K. Aggregated Residual Transformations for Deep Neural Networks. In Proceedings of the 2017 IEEE Conference on Computer Vision and Pattern Recognition (CVPR), Honolulu, HI, USA, 21–26 July 2017; pp. 5987–5995. [Google Scholar] [CrossRef]
  24. Kingma, D.P.; Ba, J. Adam: A Method for Stochastic Optimization. arXiv 2014, arXiv:1412.6980. [Google Scholar]
Figure 1. The biometric user identification framework—DeepUserIden—explored in this research study.
Information 15 00047 g001
Figure 2. Some sensor data of walking activities from the pervasive dataset.
Information 15 00047 g002
Figure 3. The architecture of the DeepResNeXt model.
Information 15 00047 g003
Figure 4. Comparison of the model performance trained and tested at different placements of smartphone for user identification.
Information 15 00047 g004
Figure 5. Comparison results of different activity types.
Information 15 00047 g005
Figure 6. Comparison results of different activity types using accelerometer and gyroscope data from the UCI-HAR dataset.
Information 15 00047 g006
Figure 7. Comparison results of the DeepResNeXt using various sensor combinations (accelerometer, gyroscope, and magnetometer) on belt-position data from the pervasive dataset.
Information 15 00047 g007
Figure 8. Comparison results of the DeepResNeXt using various sensor combinations (only accelerometer, and gyroscope) on belt-position data from the pervasive dataset.
Information 15 00047 g008
Figure 9. Comparison results of the DeepResNeXt using different types of activities and activity-free identification using belt-position data from the pervasive dataset.
Information 15 00047 g009
Figure 10. Comparison results of the DeepResNeXt using different types of activities and activity-free identification using waist-position data from the UCI-HAR dataset.
Information 15 00047 g010
Table 1. Experimental studied results of DL models using accelerometer and gyroscope sensors data from the wrist location.
SensorModelIdentification Performance
Biking Jogging Sitting Standing Walking Walking
Upstairs
Walking
Downstairs
ACC F1 ACC F1 ACC F1 ACC F1 ACC F1 ACC F1 ACC F1
WristCNN90.1490.0193.2993.3098.4598.4695.9795.9591.8391.8369.1568.8346.0645.91
LSTM93.8493.8796.9996.9899.3099.3095.2895.2197.3297.3290.5690.4965.7765.32
BiLSTM94.3894.3396.8596.8199.3099.3094.8694.8697.4697.4684.0883.7860.4259.66
GRU97.4097.3897.6797.6699.3099.3097.5097.4798.5998.5893.9493.8580.8580.81
BiGRU96.3096.2898.0898.0899.0199.0397.6497.6398.4598.4490.1489.9876.0675.75
DeepResNeXt97.1297.6698.0898.0999.7299.7297.6797.9299.0299.0196.7696.7787.6188.43
Table 2. Experimental studied results of DL models using accelerometer and gyroscope sensors data from the arm location.
SensorModelIdentification Performance
Biking Jogging Sitting Standing Walking Walking
Upstairs
Walking
Downstairs
ACC F1 ACC F1 ACC F1 ACC F1 ACC F1 ACC F1 ACC F1
ArmCNN82.3382.2091.5191.4398.3198.3096.3996.3886.0685.9974.2374.1058.5958.20
LSTM93.0192.9496.3096.2697.0497.0298.0698.0094.5194.5188.5988.4882.6882.57
BiLSTM92.4792.3796.8596.8297.7597.6996.8196.8194.5194.5584.7984.7877.3277.21
GRU96.9996.9498.3698.0998.5998.5898.0697.9197.8997.8895.6395.5988.0387.84
BiGRU96.7196.6498.0898.0897.7597.7097.3697.3996.6296.6694.7994.7885.0785.08
DeepResNeXt97.1298.1998.8198.8698.5998.5898.9298.0498.0398.03797.9397.0289.1590.59
Table 3. Experimental studied results of DL models using accelerometer and gyroscope sensors data from the belt location.
SensorModelIdentification Performance
Biking Jogging Sitting Standing Walking Walking
Upstairs
Walking
Downstairs
ACC F1 ACC F1 ACC F1 ACC F1 ACC F1 ACC F1 ACC F1
BeltCNN95.4895.4192.8892.8599.7299.7298.8998.8798.8798.8793.8093.8088.1788.09
LSTM98.2298.2396.9997.00100.00100.0099.7299.7198.4598.4196.3496.2990.1490.03
BiLSTM97.8197.7697.1297.14100.00100.0099.3199.3099.0199.0094.5194.4587.7587.58
GRU98.3698.3598.4998.49100.00100.0099.8699.7299.0199.0097.7597.7395.4995.46
BiGRU98.7798.7597.8197.80100.00100.0099.7299.7299.1599.1395.3595.2990.8590.78
DeepResNeXt98.9098.9198.2298.64100.00100.0099.1799.8699.7299.7298.8799.0197.3297.30
Table 4. Experimental studied results of DL models using accelerometer and gyroscope sensors data from the left pocket location.
SensorModelIdentification Performance
Biking Jogging Sitting Standing Walking Walking
Upstairs
Walking
Downstairs
ACC F1 ACC F1 ACC F1 ACC F1 ACC F1 ACC F1 ACC F1
LeftCNN86.7186.6291.6491.55100.00100.0098.0698.0689.0188.9065.7765.8565.7765.46
pocketLSTM94.3894.4194.7994.78100.00100.0098.8998.8897.4697.4392.1192.0992.3992.22
BiLSTM94.1194.1098.0898.08100.00100.0098.7598.74598.4598.4386.9086.7688.1788.10
GRU97.2697.2598.7798.78100.00100.0099.8699.8699.7299.7197.3297.2994.5194.44
BiGRU96.1696.1598.4998.49100.00100.0098.7598.7599.4499.4394.3794.3592.6892.67
DeepResNeXt97.4097.4099.1899.18100.00100.0099.1799.3099.7299.7299.3099.2995.6395.60
Table 5. Experimental studied results of DL models using accelerometer and gyroscope sensors data from the right pocket location.
SensorModelIdentification Performance
Biking Jogging Sitting Standing Walking Walking
Upstairs
Walking
Downstairs
ACC F1 ACC F1 ACC F1 ACC F1 ACC F1 ACC F1 ACC F1
RightCNN91.2391.1390.4190.38100.00100.0098.1998.2080.8580.7968.5968.6456.0655.68
pocketLSTM96.4496.4198.0898.12100.00100.0099.3199.1897.1897.1891.2791.2089.0188.87
BiLSTM96.5896.5798.9098.89100.00100.0099.1799.1597.6197.5989.4489.3278.8778.61
GRU97.8197.8098.2298.23100.00100.0099.5899.5899.3098.0496.6296.5392.5492.43
BiGRU97.8197.2398.9098.10100.00100.0099.1799.1698.7398.7495.9295.9089.3089.32
DeepResNeXt97.8397.8198.9398.91100.00100.0099.2799.2999.3299.3097.8999.0194.2394.18
Table 6. Experimental studied results of the DeepResNeXt model using different sensor data from the UCI-HAR dataset.
Sensor TypeIdentification Performance
Walking Walking
Upstairs
Walking
Downstairs
Sitting Standing Laying
ACC F1 ACC F1 ACC F1 ACC F1 ACC F1 ACC F1
Accelerometer94.8394.5591.8491.4987.4186.8277.9976.5374.8773.3882.8782.22
Gyroscope94.0293.8284.0083.4970.3469.6523.4120.1719.9418.0426.7523.26
Accelerometer+Gyroscope98.4398.4395.6095.5095.6795.4087.3886.2577.0275.3981.8980.64
Table 7. Experimental results of the DeepResNeXt using various sensor combinations (e.g., accelerometer, gyroscope, magnetometer) on belt-position data from the pervasive dataset.
Sensor TypeIdentification Performance
Biking Jogging Sitting Standing Walking Walking
Upstairs
Walking
Downstairs
ACC F1 ACC F1 ACC F1 ACC F1 ACC F1 ACC F1 ACC F1
Accelerometer99.3199.3199.0399.0296.1196.1095.6995.5199.5899.5898.6198.5996.2996.23
Gyroscope93.6193.60100.00100.0068.0666.8149.8647.2798.6198.6297.5097.5193.8693.78
Magnetometer95.8395.8087.0886.78100.00100.0097.6497.5889.8689.5985.1484.9681.1480.70
Accelerometer+Gyroscope99.0399.0399.1799.1795.9795.9896.1196.0299.5899.5998.4798.4996.0095.95
Accelerometer+Magnetometer99.3199.3198.1998.19100.00100.0099.8699.8699.1799.1698.4798.3997.0096.95
Gyroscope+Magnetometer96.9496.9191.1191.1599.8699.8696.1195.9593.0693.0488.3388.2183.0082.00
Accelerometer+Gyroscope+Magnetometer99.5099.5198.2298.64100.00100.0099.1799.8699.7299.7298.8799.0197.3297.30
Table 8. Experimental results of the DeepResNeXt using various sensor combinations (e.g., accelerometer and gyroscope) on waist-position data from the UCI-HAR dataset.
Sensor TypeIdentification Performance
Walking Walking
Upstairs
Walking
Downstairs
Sitting Standing Laying
ACC F1 ACC F1 ACC F1 ACC F1 ACC F1 ACC F1
Accelerometer94.8394.5591.8491.4987.4186.8277.9976.5374.8773.3882.8782.22
Gyroscope94.0293.8284.0083.4970.3469.6523.4120.1719.9418.0426.7523.26
Accelerometer+Gyroscope98.4398.4395.6095.5095.6795.4087.3886.2577.0275.3981.8980.64
Disclaimer/Publisher’s Note: The statements, opinions and data contained in all publications are solely those of the individual author(s) and contributor(s) and not of MDPI and/or the editor(s). MDPI and/or the editor(s) disclaim responsibility for any injury to people or property resulting from any ideas, methods, instructions or products referred to in the content.

